Embed Size (px)
Citation preview
DEGRADATION STUDIES OF MULTILAYER COATINGS EXHIBITING ANGULAR DEPENDENT TRANSMITTANCE
By
Musembi Robinson Juma
A THESIS SUBMITTED IN PARTIAL FULFILMENT OF THE REQUIREMENT FOR THE MASTER OF SCIENCE DEGREE OF THE
UNIVERSITY OF NAIROBI
/UNIVERSITY OF NAIROBI 2002
DECLARATION
This Thesis is my own work and has not been examined or submitted for examination inany other University
Sig
Date.
JL-iMusembi, Robinson Juma Reg.No. L/56/7066/98
This thesis has been submitted for examination with our approval as supervisors
1 Supervisor.^Tl^^^T....................Dr. Julius M. Mwabora Department of Physics University of Nairobi P.O. Box 30197 Nairobi Kenya
2
Date
SupervisorDr. Godfrey W. Mbise Department of Physics University of Dar es Salaam P.O. Box 35063 Dar es Salaam Tanzania
11

DEDICATION
To my Parents
ACKNOWLEGDMENT
My special thanks go to Dr. Julius M. Mwabora and Dr. Godfrey W. Mbise whom I
owe a lot for introducing me into thin film optics and vacuum technology. Many
thanks go to them jointly for encouraging me to take this project. I have benefited a lot
from the numerous discussions I have held with them, from time to time, and for
instilling in me a firm inspiration in applied optics, a subject I have come to love and
enjoy.
I also wish to thank jointly again Dr. Mwabora and Dr. Mbise, who were my
supervisors for their excellent guidance, unrivalled kindness and their broad
knowledge and experience especially in thin films. Their cooperation during the entire
period of this work made everything run smoothly.
I highly appreciate the coordination and swift action of Prof. Lennart Hasselgren, Prof.
Rogath T. Kivaisi and Dr. Godfrey Mbise who went into great length to make sure the
optical spectrophotometer that could have stalled this work was back into its proper
working condition just in time.
The six month period of research fellowship at Solar Energy Lab., Physics
Department, University of Dar es Salaam, was sponsored by International Programs in
Physical Sciences (IPPS), through the Condensed Matter Research Group, University
of Nairobi and the Solar Energy Research Group, University of Dar es Salaam.
Special thanks to our Condensed Matter Research Group leader Prof. B O Aduda,
whom 1 have benefited from his knowledge and experience in materials science, which
came into handy in the course of doing this work. His kindness and readiness to help,
plus his skilful leadership afe highly acknowledged.
The skilful technical assistance of Boniface Muthoka and Josephine Ochola of the
Condensed Matter Research Group, University of Nairobi; Khalfani Mtelela of So^ar ,
IV

Energy Group, D. Lameck of central science workshop, and M. Suya of Zoology
Department, at the University of Dar es Salaam. Their efforts in technical assistance
are acknowledged.
I would also wish to express my deep gratitude to all other people who helped me in
one way or another during the course of this work
I also wish to express my gratitude to Mr. Mghendi Mwamburi, Physics Department,
Moi University, Kenya, for helping and discussing MathCAD programming. The
programme was very useful in the final analysis of this work. Many thanks again to
Mr. Mghendi Mwamburi for providing me with ISO 9845 AM 1.5 and ISO 10526
illuminant (Eye) data files.
/
V

ABSTRACT
Multilayer coatings exhibiting angular dependent transmittance were prepared by
evaporation method. Different multilayer combinations have been studied, which
included MgF2/Ag/MgF2, MgF2/Al/MgF2, T i02/Ag/Ti02 and T i02/Al/Ti02. Among
these combinations, MgF2/Ag/MgF2 multilayer has been found to display the best
optical properties, that is, high transmittance in the visible region and low
transmittance in the near infrared region and substantial angular dependency (i.e.
tendency of optical transmittance and reflectance to depend on variation of angle of
incidence beam).
MgF2/Ag based multilayer coating was adopted for degradation study due to their
superior optical properties. Transmittance and reflectance were measured before and
after the samples were exposed to degradation environment. The environment could
be extreme temperature, inflated humidity, saline solution, organic solvents or aquatic
condition for the case of accelerated degradation study. For non-accelerated
degradation studies, the samples were left to age naturally in the normal atmosphere
for predetermined duration.
The samples’ spectral properties were found to insignificantly degrade after they were
subjected to various degradation environments. The highest change in transmittance
and reflectance was registered for samples soaked in saline solution while no change
was noted for samples kept in room environment (i.e. normal atmosphere). The
changes observed can be attributed to changes in crystallographic structure (amount of
defects and dislocations), packing density and surface roughness of the multilayer
films. It is concluded that the optical properties of MgF2/Ag/MgF2 multilayer coatings
are virtually unaffected by most of the adverse weather conditions considered in this
study.
VI
TABLE OF CONTENTS
DECLARATION................................................................................................. ii
DEDICATION.................................................................................................... iii
ACKNOWLEDGEMENT................................................................................. iv
ABSTRACT........................................................................................................ vi
TABLE OF CONTENTS................................................................................... vii
LIST OF SYMBOLS.......................................................................................... x
LIST OF FIGURES............................................................................................. xiii
LIST OF TABLES.............................................................................................. xix
CHAPTER ONE: INTRODUCTION
1.1. Introduction...................................................................................... 1
1.2. Statement of the Problem.............................................................. 2
1.3. Significance of the Study.............................................................. 3
1.4. Main Objectives of This W ork................................................... 4
CHAPTER TWO: LITERATURE REVIEW
2.1. Ambient Radiation......................................................................... 6
2.2. Coatings with Angularly Dependent Transmittance................... 9
2.3. Degradation Studies...................................................................... 11
2.4. Survey of Window Coatings for Different Climatic Regions.. 12
2.5. Protection for Film....................................................................... 14
vii

CHAPTER THREE: THEORY FOR MULTILAYER COATINGS
EXHIBITING ANGULAR DEPENDENT
TRANSMITTANCE
3.1. Introduction................................................................................... 19
3.2. Maxwell’s Equations.................................................................. 19
3.3. Boundary Conditions.................................................................. 21
3.4. Fresnel’s Equations for Angle Dependent Coatings................. 22
3 .5 . The Characteristic Matrix of a Homogeneous Media.............. 26
3.6. Quantitative Performance Parameters....................................... 27
CHAPTER FOUR: EXPERIMENTAL TECHNIQUES
4.1. Introduction................................................................................... 29
4.2. Cleaning the Substrate................................................................ 29
4.3. Deposition of the Films................................................................ 30
4.4. Optical Characterization............................................................. 32
4.5. Ageing Treatment......................................................................... 33
4.5.1. Ele voted Temperatures.................................................................. 34
4.5.2. Low Temperatures.......................................................................... 34
4.5.3. Humid Environment...................................................................... 34
4.5.4. Saline Solution................................................................................ 35
4.5.5. Organic Solvents............................................................................ 36
4.5.6. Outdoor Environment.................................................................... 36
4.5.7. Aquatic Condition.......................................................................... 36
/
viii
CHAPTER FIVE: RESULTS AND DISCUSSION
5 1. Introduction..................................................................................... 37
5 2. Degradation Studies...................................................................... 38
5.2.1. Ele vetted Temperatures................................................................. 38
5.2.2. Low Temperatures......................................................................... 45
5.2.3. Humid Environment.................................................................... 52
5.2.4. Saline Solution............................................................................... 55
5.2.5. Organic Solvents........................................................................... 60
5.2.6. Outdoor Environment.................................................................. 65
5.2.7. Aquatic Condition......................................................................... 68
5.3. MgF2/Ag/MgF2 Coatings............................................................. 70
5.4. T i02 Based Coatings.................................................................... 72
CHAPTER SIX: CONCLUSION AND SUGGESTIONS FOR FURTHER
STUDIES
6.1. Conclusion...................................................................................... 77
6.2. Suggestions for Further Studies.................................................... 78
REFERENCES.................................................................................................... 80
APPENDIX: A: TABULATED OPTICAL PROPERTIES OF
MgF2/ Ag/ MgF2 MULTILAYER COATINGS 86B: PROGRAM MOONRAKER 7 90
IX
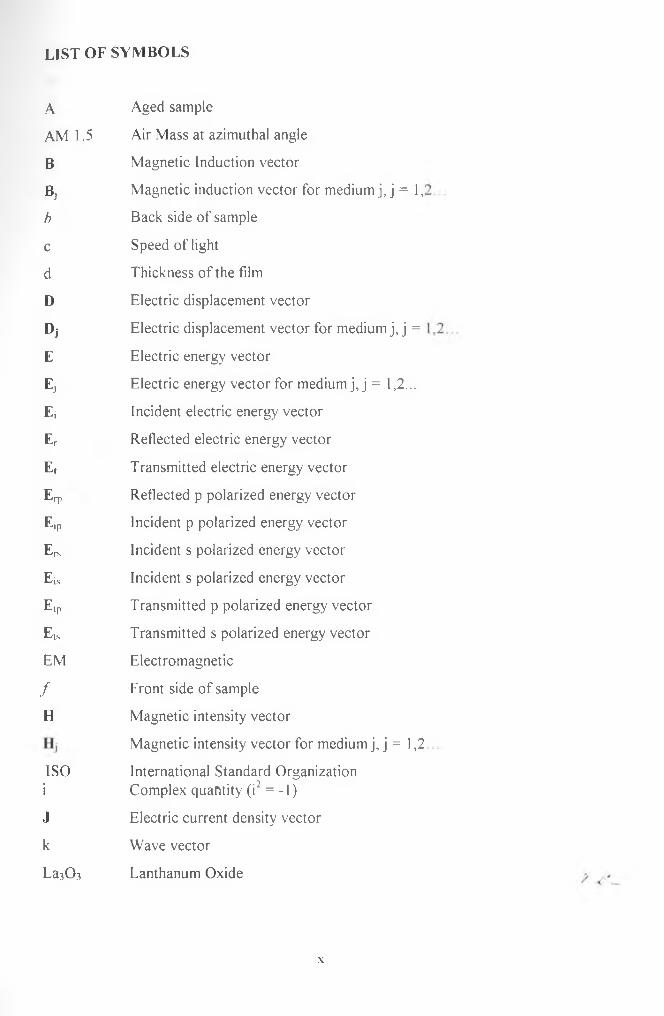
LIST OF SYMBOLS
A Aged sample
AM 1.5 Air Mass at azimuthal angle
B Magnetic Induction vector
Bj Magnetic induction vector for medium j, j = 1,1
b Back side of sample
c Speed of light
d Thickness of the film
D Electric displacement vector
Dj Electric displacement vector for medium j, j =
E Electric energy vector
Ej Electric energy vector for medium j, j = 1,2...
Ei Incident electric energy vector
Er Reflected electric energy vector
E, Transmitted electric energy vector
Erp Reflected p polarized energy vector
Ejp Incident p polarized energy vector
Ers Incident s polarized energy vector
Eis Incident s polarized energy vector
Etp Transmitted p polarized energy vector
Ets Transmitted s polarized energy vector
EM Electromagnetic
/ Front side of sample
H Magnetic intensity vector
Magnetic intensity vector for medium j, j = 1,2
ISOi
International Standard Organization Complex quantity (i2 = -1)
J Electric current density vector
k Wave vector
La.i03 Lanthanum Oxide
x
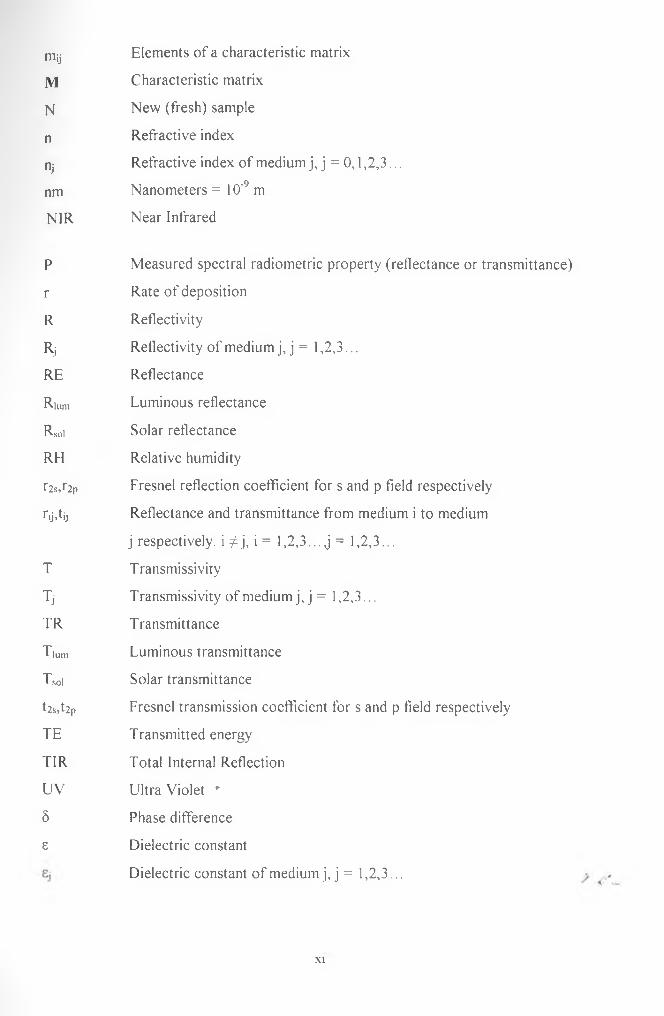
mij Elements of a characteristic matrix
M Characteristic matrix
N New (fresh) sample
n Refractive index
n j Refractive index of medium j, j = 0,1,2,3...
nm Nanometers = 10'9 m
N1R Near Infrared
P Measured spectral radiometric property (reflectance or transmittance)
r Rate of deposition
R Reflectivity
Rj Reflectivity of medium j, j = 1,2,3...
RE Reflectance
Rlum Luminous reflectance
Rsol Solar reflectance
RH Relative humidity
Us, Up Fresnel reflection coefficient for s and p field respectively
E jT ij Reflectance and transmittance from medium i to medium
j respectively, i ^ j , i = 1,2,3... j = 1,2,3...
T Transmissivity
Tj Transmissivity of medium j, j = 1,2,3...
TR Transmittance
T lum Luminous transmittance
Tso| Solar transmittance
t2s,t2p Fresnel transmission coefficient for s and p field respectively
TE Transmitted energy
TIR Total Internal Reflection
UV Ultra Violet '
8 Phase difference
8 Dielectric constant
Dielectric constant of medium j, j = 1,2,3...
XI

e Emmittance
X Wavelength
1̂ Magnetic permeability
Angle in radians
0 , Oblique incidence angle
0 2 Normal incidence angle
0i Angle of incidence
0r Angle of reflection
0t Angle of transmission
p Charge density
o Electrical conductivity
n Normal unit vector
co Angular frequency
d d dV V = i — + j — + k —dx dy dz
<I> Weighting function for the strength of source (sunlight or thermal)
A Angstrom = 10'10 m
pm Micrometer = 1 O'6 m
^ *
xii

LIST OF FIGURESPage
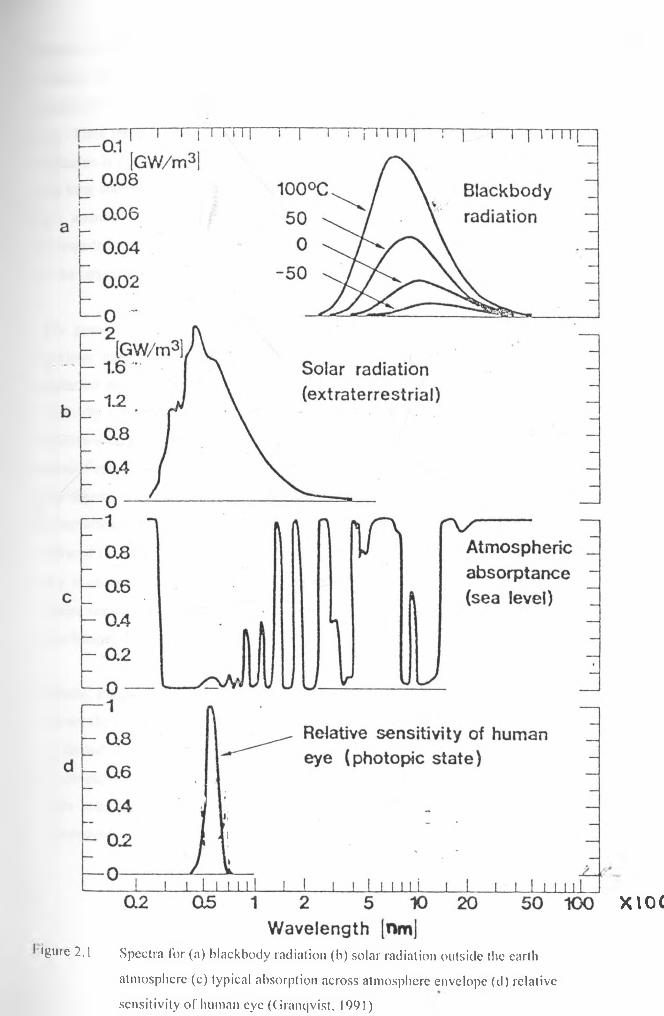
Figure 2.1. Spectra for (a) blackbody radiation (b) solar radiation
outside the earth atmosphere (c) typical absorption across
atmosphere envelope (d) relative sensitivity of human eye
(Granqvist, 1991) 7
Figure 2.2. Effects of the rate of deposition on the reflectance of SiO
coated aluminium (Heavens, 1965) 15
Figure 2.3a. Spectral transmittance of Ag and ZnS/Ag/ZnS coatings,
deposited on cleaned glass substrate. Fresh sample a and c,
aged sample b and d. The insert curves are expanded to
show the visible region (Mbise, et. a /., 1990) 17
Figure 2.3b. Spectral transmittance of Ag and ZnS/Ag/ZnS coatings,
deposited on uncleaned glass substrates. Fresh sample a and c,
aged sample b and d. The insert curves are expanded to show
the visible region (Mbise, et. al., 1990) 17
Figure 3.1. Light path passing form a less dense medium into a denser
medium; the incident, reflected and transmitted rays
and angles are indicated 21
Figure 3 .2. The path of light ray passing from air across the film into the
air or another medium of refractive index less than that of
the film r 24
Figure 5.2.1a. Spectral transmittance and reflectance of MgF2/Ag/MgF2
multilayer for fresh sample and a sample laid in an oven
maintained at 50 ±1°C for indicated duration 39
Figure 5.2. laa. The variation with time of wavelength integrated luminous
transmittance for sample annealed at 50 °C. Fresh sample A
and C, aged sample B and D. (NB. A and B denotes oblique
incidence; C and D denotes normal incidence) 40
Figure 5.2.1b. Spectral transmittance and reflectance of MgF2/Ag/MgF2
for fresh sample and a sample laid in an oven maintained at
100 ± 1 °C for indicated duration. 41
Figure 5.2. lbb. The variation with time of wavelength integrated luminous
transmittance for sample annealed at 100 °C. Fresh sample A
and C, aged sample B and D. (NB. A and B denotes oblique
incidence; C and D denotes normal incidence) 42
Figure 5.2.1c. Spectral transmittance and reflectance of MgF2/Ag/MgF2
multilayer for fresh sample and a sample laid in an oven
maintained at 200 ±1°C for indicated duration 43
Figure 5.2. lcc. The variation with time of wavelength integrated luminous
transmittance for sample annealed at 200 °C. Fresh sample A
and C, aged sample B and D. (NB. A and B denotes oblique
incidence; C and D denotes normal incidence) 44
Figure 5.2.2a. Spectral transmittance and reflectance of MgF2/Ag/MgF2
multilayer for fresh sample and a sample laid in freezer
maintained at -10 ±1°C for indicated duration 46
XIV
Figure 5.2.2aa. The variation with time of wavelength integrated luminous
transmittance for sample laid in freezer maintained at 10 °C. Fresh
sample A and C, aged sample B and D. (NB. A and B denotes
oblique incidence; C and D denotes normal incidence) 47
Figure 5.2.2b. Spectral transmittance and reflectance of MgF2/Ag/MgF2
multilayer for fresh sample and a sample laid
in freezer maintained at -18 ±1°C for indicated duration 48
Figure 5.2.2bb. The variation with time of wavelength integrated luminous
transmittance for sample laid in freezer maintained at -18 °C.
Fresh sample A and C, aged sample B and D. (NB. A and
B denotes oblique incidence; C and D denotes normal incidence) 49
Figure 5.2.2c. Spectral transmittance and reflectance of MgF2/Ag/MgF2
multilayer for fresh sample and a sample covered in ice
(frost) at -20 ±1°C for indicated duration 50
Figure 5.2.3a.Spectral transmittance and reflectance of MgF2/Ag/MgF2
multilayer for fresh sample and a sample laid in humidity
chamber maintained at 86 ±1% relative humidity for indicated
duration 53
Figure 5.2.3b. The variation with time of wavelength integrated luminous
transmittance for sample laid in chamber maintained at 86%
relative humidity. Fresh sample A and C, aged sample B and
D. (NB. A and B denotes oblique incidence; C and D
denotes normal incidence) 54
> *
xv

Figure 5.2.4a. Spectral transmittance and reflectance of MgF2/Ag/MgF2
multilayer for fresh sample and a sample soaked in salt (NaCl)
solution of concentration 20 gm/lOOml water for indicated
duration 56
Figure 5.2.4b. Spectral transmittance and reflectance of MgF2/Ag/MgF2
multilayer for fresh sample and a sample soaked in salt (NaCl)
solution of concentration 20 gm/100ml water for indicated
duration 57
Figure 5.2.4c. Spectral transmittance and reflectance of MgF2/Ag/MgF2
multilayer for fresh sample and a sample soaked in salt (NaCl)
solution of concentration 20 gm/100ml water for indicated
duration 58
Figure 5.2.4d. The variation with time of wavelength integrated luminous
transmittance for sample soaked in saline solution. Fresh sample A
and C, aged sample B and D. (NB. A and B denotes oblique
incidence; C and D denotes normal incidence) 59
Figure 5.2.5a. Spectral transmittance and reflectance of MgF2/Ag/MgF2
multilayer for a fresh sample and a sample soaked in
acetone of purity 99.8% for indicated duration 61
Figure 5.2.5aa. The variation with time of wavelength integrated luminous
transmittance for sample soaked in acetone. Fresh sample A
and C, aged sample B and D. (NB. A and B denotes obliquer
incidence; C and D denotes normal incidence) 62
XVI
Figure 5.2.5b. Spectral transmittance and reflectance of MgF2/Ag/MgF2
multilayer for fresh sample and a sample soaked in
ethanol of purity 99.8% for indicated duration 63
Figure 5.2.5bb. The variation with time of wavelength integrated luminous
transmittance for sample soaked in ethanol. Fresh sample A
and C, aged sample B and D. (NB. A and B denotes oblique
incidence; C and D denotes normal incidence) 64
Figure 5.2.6a. Spectral transmittance and reflectance of MgF2/Ag/MgF2
multilayer for a fresh sample and a sample exposed
into normal outside atmosphere environment, temperature
range 20 - 34 ±1°C; humidity range 60 - 70±1% RH for
duration indicated 66
Figure 5.2.6b. The variation with time of wavelength integrated luminous
transmittance for sample exposed into outdoor environment.
Fresh sample A and C, aged sample B and D. (NB. A and B
denotes oblique incidence; C and D denotes normal incidence) 67
Figure 5.2.7a. Spectral transmittance and reflectance of MgF2/Ag/MgF2
multilayer for a fresh sample and a sample soaked in
water in room environment for indicated duration 69
Figure 5.2.7b. The variation with time of wavelength integrated luminous
transmittance for sample soaked in distilled water. Fresh sample A
and C, aged sample B and D. (NB. A and B denotes oblique
incidence; C and D denotes normal incidence) 70
XVII
Figure 5.3.1. Spectral transmittance (TR) and reflectance (RE) for
MgF2/Al/MgF2 coating 71
Figure 5.4.1. Spectral transmittance (TR) and reflectance (RE) for
T i02/Ag/Ti02 coating 73
Figure 5.4.2. Spectral transmittance (TR) and reflectance (RE) for
T i02/Al/Ti02 coating 74
Figure 5.4.3 Spectral normal transmittance (TR) and near normal
reflectance (RE) (Granqvist, 1991) 76
Figure 5.4.4 Measured optical transmittance (TR) and reflectance (RE) of
a 180-A T i02/ 180- A Ag/ 180- A T i02 film on Corning 7059
Glass (John and Bachner, 1976) 76
r
xviii

LIST OF TABLES
Table 2.1. Stability of selective coatings in air (Kivaisi, 1976) 18
Table 4.1. Material used in this work, their purity and the type of hearth used 31
Table 4.2. Concentration of graded solution used to maintain the
atmosphere at constant humidity at 29 ±1 °C 35
Table 5.3.1. Material type used in this work with respective crystal structure
and density (Besancon, 1986; Pulker, 1999) 72
Table 5.4.1. Properties of Ti02 at different substrate temperature (Pulker, 1999). 74
Table A1. Changes in optical properties for samples heated at 50 °C for
duration shown 86
Table A2. Changes in optical properties for samples heated at 100 °C for
duration shown 86
Table A3. Changes in optical properties for samples heated at 200 °C for
duration shown 86
Table A4. Changes in optical properties for samples laid in freezer maintained
at -10 °C for duration shown 87
Table A5. Changes in optical properties for samples laid in freezer maintained
at -18 °C for duration shown 87
Table A6. Changes in optical properties for samples covered in ice (frost)
at -20 °C for duration shown 87 >
XIX

Table A7. Changes in optical properties for samples laid in chamber maintained
at 86% relative humidity for duration shown 88
Table A8. Changes in optical properties for samples soaked in saline solution
of concentration 20gm/ 100ml, for duration shown 88
Table A9. Changes in optical properties for samples soaked in acetone
of purity 99.8% for duration shown 88
Table A 10. Changes in optical properties for samples soaked in ethanol
of purity 99.8% for duration shown 89
Table A11. Changes in optical properties for samples exposed into outdoor
environment for duration shown 89
Table A 12. Changes in optical properties for samples soaked in distilled
water for duration shown 89
XX

tfl CHAPTER ONEffl
INTRODUCTION
1,1 Introduction
Multilayer coatings are obtained by deposition of multiple successions of thin plane
parallel films on the same surface of the substrate. These coatings, which may be
produced by evaporation and/or sputtering techniques, are widely used in mirrors,
dichroic beam splitters, antireflection coatings, narrow and broadband interference
filters, etc. Each of these applications often requires careful control of thickness and
refractive indices for each layer in the stack (Coleman, 1978; Behrndt, 1964; Randlett
et. a l 1966; Mbise and Kivaisi, 1993).
Most of the applications of multilayer optical coatings have been confined to normal
incidence, but there are few designs for oblique incidence (Mbise and Kivaisi, 1993;
Mbise, 1998). Coatings whose transmittance of incidence radiation falling at oft-
normal angles is higher than transmittance of normally incidence radiation are said to
exhibit angular dependent transmittance. Coatings with angular dependent
transmittance find applications in energy efficient windows (an energy efficient
window is a device capable of providing good lighting during the day and good
thermal comfort both during the day and night at minimum demand of paid energy),
particularly in automobile industry and architectural sectors. Each of these
applications requires maximization of the angular performance. Angular performance
is defined as the difference between the ofT-normal and normal incidence luminous
transmittance, where it is expected that Tn0nnai < T0tr-,10rmai.
The subject of dielectrics and metallic films has been extensively treated in the
scientific literature. The materials that have been found suitable for combining high
transmittance in the visible (VIS) range with low transmittance in the near infrared
(NIR) range include; the noble metals i.e. Ag, Cu and Au (Johnson and Christy, 1972,,.
1
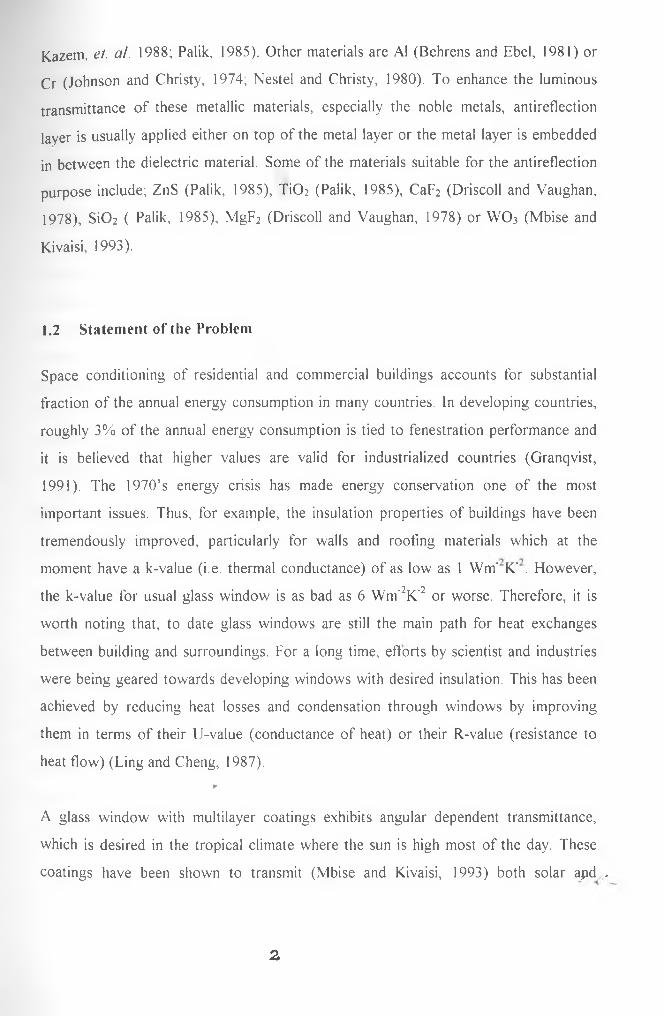
Kazem, el. al. 1988; Palik, 1985). Other materials are A1 (Behrens and Ebel, 1981) or
Cr (Johnson and Christy, 1974; Nestel and Christy, 1980). To enhance the luminous
transmittance of these metallic materials, especially the noble metals, antireflection
layer is usually applied either on top of the metal layer or the metal layer is embedded
in between the dielectric material. Some of the materials suitable for the antireflection
purpose include; ZnS (Palik, 1985), Ti02 (Palik, 1985), CaF2 (Driscoll and Vaughan,
1978), Si02 ( Palik, 1985), MgF2 (Driscoll and Vaughan, 1978) or WO3 (Mbise and
Kivaisi, 1993).
1.2 Statement of the Problem
Space conditioning of residential and commercial buildings accounts for substantial
fraction of the annual energy consumption in many countries. In developing countries,
roughly 3% of the annual energy consumption is tied to fenestration performance and
it is believed that higher values are valid for industrialized countries (Granqvist,
1991). The 1970’s energy crisis has made energy conservation one of the most
important issues. Thus, for example, the insulation properties of buildings have been
tremendously improved, particularly for walls and roofing materials which at the
moment have a k-value (i.e. thermal conductance) of as low as 1 Wm' K‘ . However,
the k-value for usual glass window is as bad as 6 Wm"2K'2 or worse. Therefore, it is
worth noting that, to date glass windows are still the main path for heat exchanges
between building and surroundings. For a long time, efforts by scientist and industries
were being geared towards developing windows with desired insulation. This has been
achieved by reducing heat losses and condensation through windows by improving
them in terms of their U-value (conductance of heat) or their R-value (resistance to
heat flow) (Ling and Cheng, 1987).•»
A glass window with multilayer coatings exhibits angular dependent transmittance,
which is desired in the tropical climate where the sun is high most of the day. These
coatings have been shown to transmit (Mbise and Kivaisi, 1993) both solar apd «,
2
luminous transmittance as high as 64% at oblique angle of incidence and as low as
48% at normal incidence.
Thus windows with angular dependent transmittance are suitable for louvers in the
architecture and inclined windscreens in the motor vehicles. It should be noted that
such fixtures are to be placed on the outside where they are exposed to different
weather conditions varying from cold, rainy, humid, hot, permafrost, etc, whose
intensity are sometimes drastic depending on time, location and season. These climatic
chamtes are likely to degrade the radiative properties of multilayer coated glass
windows. Needless to mention, the optical characteristics of these window coatings
are expected to last for at least few decades, and are usually kept outdoors. It is for
these reasons that there is need to perform degradation studies of these window
coatings. To our knowledge, no degradation study of multilayer coatings exhibiting
angular dependent transmittance has been reported, albeit its potentiality for
application has been reported in literature (Mbise and Kivaisi, 1993; Granqvist, 1991;
Rubin, et. a/., 1999).
1.3 Significance of the Study
The properties of multilayer coatings exhibiting angular dependent transmittance are
suitable for energy efficiency of windows. Durability of the material combination used
in their fabrication is vital especially if they are to be kept outdoors, with possibility
for harsh environments. The results of this work will provide at least preliminary
information on the tolerance of these windows to various environmental conditions.
The outcomes of the study will also act as an impetus and motivation to other workers
already working in the field of window technology, and eventually bring this essentialr
device into the market. This work consolidates various degradation test methods and
may act as a good reference to future related studies.
3
1.4 Main Objectives of This Work
The major aim of the present work is to investigate the degradation of optical
(transmittance and reflectance) properties of multilayer coatings exhibiting angular
dependent transmittance. Particularly, the study aims at investigating the tolerance of
such window coatings with respect to: extreme temperatures, humidity, organic
solvents, saline solution, aquatic condition and normal atmospheric condition.
Specific objectives of this study are: -
1. To fabricate D/M/D multilayer coatings (D = dielectric; M = metal) on glass
substrate. The fabricated coatings are hereinafter referred to as samples.
2. To perform accelerated degradation of the samples by subjecting them to
different conditions as explained below:
(i) Anneal samples in air at temperatures between 50 and 200 °C
for varying duration of time.
(ii) Keep the samples in freezing environment (temperatures
lower than -10 °C) for varying duration of time.
(iii) Keep the samples exposed to high loads of relative humidity
(> 80% RH) for varying duration of time.
(iv) Keep the samples soaked in organic solvent for varying
duration of time.
(v) Keep the samples soaked in saline solution for varying
duration of time.
(vi) Keep the samples soaked in aquatic condition for varying
duration of time.
3. To employ spectrophometry in obtaining the optical properties of freshly
deposited samples and degraded samples for different angles of light incidence
in the 300 - 2500 nm wavelength range.
4

To assess the energy efficiency inherent in the optical data and thereby evaluate
the tolerance of samples to the conditions stated in objective 2

GQ CHAPTER TWO G3
LITERATURE REVIEW
2.1. Ambient Radiation
As defined earlier, an energy efficient window is a device capable of providing good lighting
during the day and good thermal comfort both during the day and night at minimum demand
of paid energy. Energy efficiency of a glass window can be achieved by applying thin surface
coatings tailored so as to modify the radiative properties of the glass. The coating is supposed
to control radiative inflows and heat losses due to radiation, conduction and convection
(Granqvist, 1991;Mbise, 1995).
The key to energy efficient window lies in the clear understanding of the radiative properties
of our natural surroundings. These properties are illustrated in Fig. 2.1.
As a preamble to the discussion, the properties of the radiation are conveniently expounded by
starting with the ideal blackbody spectra, whose emitted spectrum is also known as the
Planck's spectra, is uniquely defined if the absolute temperature is known. Figure 2.1(a)
depicts the Planck's spectra for three temperatures and with a common logarithmic
wavelength scale on the abscissa. The ordinate scale depicts power per unit area and per unit
wavelength increment (hence the units GWm'’). The spectra are bell shaped and confined to
the 2.0 x 10³ < X < 105 nm range, where X denotes the wavelength. The peaks in the spectra
are characteristically displaced towards long wavelength as the temperature decreases, which
is the manifestation of Wien's displacement law. At room environment, the peak lies at about
105 nm. The thermal radiation from a real body is obtained by multiplying the Planck's spectra
by a numerical factor, the emittance, e , whose value lies in the range 0 < e < 1. In general,
the emittance is wavelength dependent (Granqvist, 1991; Mbise, 1995; Meinel and Meinel,
1979).
6
•gine 2 .1 Spectra for (a) blackbody radiation (b) solar radiation outside the earth
atmosphere (c) typical absorption across atmosphere envelope (d) relative
sensitivity of human eye (Granqvist. 1991)
x i o c
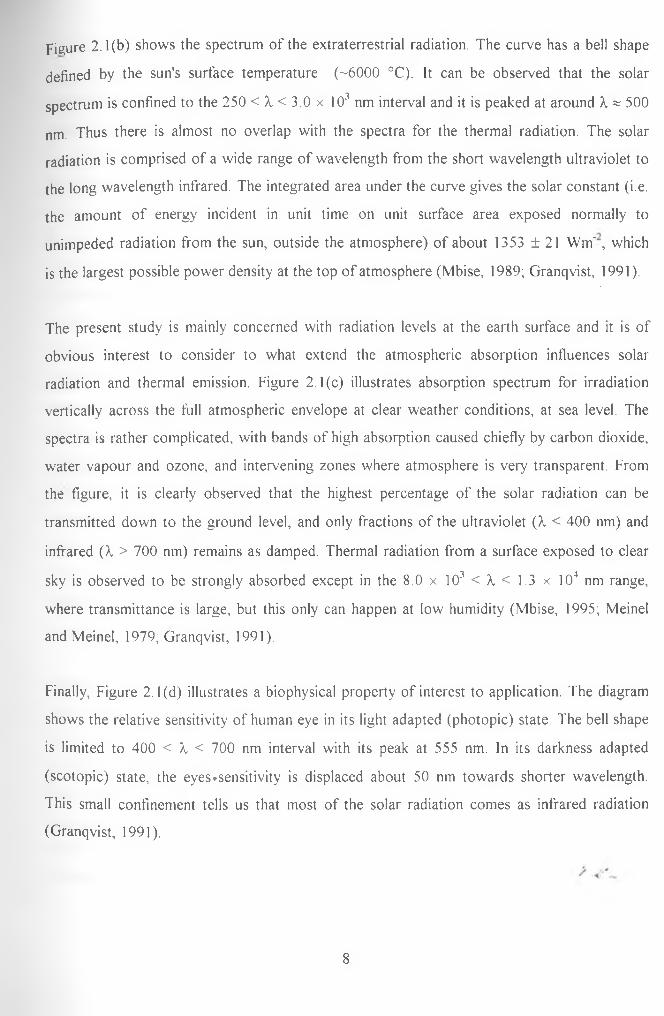
Figure 2.1(b) shows the spectrum of the extraterrestrial radiation. The curve has a bell shape
defined by the sun's surface temperature (-6000 °C). It can be observed that the solar
spectrum is confined to the 250 < ) , < 3 .0x 103 nm interval and it is peaked at around X « 500
nm. Thus there is almost no overlap with the spectra for the thermal radiation. The solar
radiation is comprised of a wide range of wavelength from the short wavelength ultraviolet to
the long wavelength infrared. The integrated area under the curve gives the solar constant (i.e.
the amount of energy incident in unit time on unit surface area exposed normally to
unimpeded radiation from the sun, outside the atmosphere) of about 1353 ±21 Wm' , which
is the largest possible power density at the top of atmosphere (Mbise, 1989; Granqvist, 1991).
The present study is mainly concerned with radiation levels at the earth surface and it is of
obvious interest to consider to what extend the atmospheric absorption influences solar
radiation and thermal emission. Figure 2.1(c) illustrates absorption spectrum for irradiation
vertically across the full atmospheric envelope at clear weather conditions, at sea level. The
spectra is rather complicated, with bands of high absorption caused chiefly by carbon dioxide,
water vapour and ozone, and intervening zones where atmosphere is very transparent. From
the figure, it is clearly observed that the highest percentage of the solar radiation can be
transmitted down to the ground level, and only fractions of the ultraviolet (X < 400 nm) and
infrared (^ > 700 nm) remains as damped. Thermal radiation from a surface exposed to clear
sky is observed to be strongly absorbed except in the 8.0 x 10³ < X < 1.3 x 10⁴ nm range,
where transmittance is large, but this only can happen at low humidity (Mbise, 1995; Meinel
and Meinel, 1979; Granqvist, 1991).
Finally, Figure 2.1(d) illustrates a biophysical property of interest to application. The diagram
shows the relative sensitivity of human eye in its light adapted (photopic) state. The bell shape
is limited to 400 < X < 700 nm interval with its peak at 555 nm. In its darkness adapted
(scotopic) state, the eyes-sensitivity is displaced about 50 nm towards shorter wavelength.
This small confinement tells us that most of the solar radiation comes as infrared radiation
(Granqvist, 1991).
8
2.2 Coatings With Angularly Dependent Transmittance
Angular dependent window coatings can be designed from a variety o f approaches, among
which we mention polymer films, Total Internal Reflection (TIR) systems and multilayer
films (Mbise, 1995). The work being reported in this thesis deals with the degradation studies
of the latter films.
In the first example, the film, usually photopolymerized components having different
refractive indices and reactivities, is coated on a flat substrate and then exposed to ultraviolet
(UV) light to polymerize. The polymer film can be tailored to scatter incident light so that the
overall throughput has an angular performance o f -70% by increasing the light incident angle
from 0° to -25°. This kind of angular dependent window coating has been commercialized,
under trademark " ANGLE 21, and is used for architecture in Japan (Mbise, 1995). On the
other hand, TIR system has high transmittance for normal incidence light and dramatically
blocks all obliquely incident light. From the earlier works, little research efforts have been
devoted to this type of angular dependent window coating.
Multilayer coatings are obtained by deposition of multiple successions of thin plane parallel
films on the same substrate. These coatings are widely used in mirrors, dichroic beam
splitters, antireflection coatings, narrow and broadband interference filters, etc. Each of these
applications requires careful control of thickness and refractive indices for each layer in the
stack (Coleman, 1978; Behrndt, 1964; Randlett el. al., 1966; Mbise and Kivaisi, 1993).
Although the history of multilayer films stretches far back to the work of Fraunhofer (Hilger,
1986), many topics have remained un-researched in this subject. To date, for example, most
of the work in this field have been confined to normal incident. There are of-course a few
designs for oblique incidence (Mbise el. al. 1989a-c; Kivaisi, 1982; Smith, 1989; Granqvist,r1989; Karlsson and Roos, 2000; Karlsson et. al. 2001). Few studies have been reported on
experimental and theoretical work as well as for commercial devices. Turbadar (1964a,b) and
Catalan (1961) have both reported theoretical models for angular dependent coatings.
Turbadar reported a theoretical model for the all dielectric double layer (Turbadar, F964*a) and
9

triple layer (Turbadar, 1964b) coatings optimized for oblique incidence. Turbadar's model,
however, were designed to work with either p or s polarized light and cannot be used with
unpolarized light. These models were designed with thickness other than quarter wavelength
to provide a broad region of low reflectance in the visible spectrum for either state of
polarization. In order to achieve high transmittance for obliquely incidence light, Turbadar's
model used completely different film thickness for different polarization. On the other hand
Catalan (1961) reported a dielectric bilayer for p - polarized light only. Catalan's theoretical
model included calculated curves giving the spectral reflectance for normal and oblique
incidence and quantitative results showing the influence of the glass substrate and the effect
of film thickness mismatching.
Few workers have reported theoretical models corroborated with experimental work. Cox et.
al. (1954), Cox et. al. (1962), Mbise (1995) and Mbise and Kivaisi (1993) are some of the
workers who have reported such studies. In reports by Cox et. al. (1954,1962), they reported
an all dielectric double layer (Cox et. al., 1954) and triple layer (Cox et. al., 1962) coatings
optimized for un-polarized light. In both cases, the models were optimized for glass substrates
of different refractive indices for various thickness combinations. The experimental work to
test these models was done using a vacuum evaporation method whereby the substrate was
heated to temperatures ranging between 150 - 300 °C in order to form scratch and abrasion
resistance films. Mbise and Kivaisi (1993) in their work reported a dielectric/metal/dielectric
and random dielectric/metal coatings design types. Mbise and Kivaisi's (1993) model was
optimized to work for un-polarized light incident at oblique angle, in order to have high
transmittance in the visible region with low near infrared transmittance. Thickness for
different metals and dielectric combination were optimized by use of computer simulation
program. The coatings were prepared in a conventional diffusion pumped coating system by
evaporation method.
Currently a lot of interest and research efforts are in optical devices that have low
transmittance at normal incidence than is in oblique incidence light. Mbise et. al. (1989a-c);
Kivaisi (1982); Smith (1989); Granqvist (1989); Karlsson and Roos (2000) and Karlsson et.
al. (2001) have done studies on angular dependent coatings, whereas, Tremblay et. z//^1987)
10
studied an angular reflector device. The angular dependent coatings (Mbise et. at. 1989a-c;
Kivaisi, 1982; Smith, 1989; Granqvist, 1989; Karlsson and Roos, 2000; Karlsson el. a/. 2001)
have better indoor-outdoor contact and they open up new possibilities for energy efficient
glazing and architectural design.
2.3 Degradation Studies
The term degradation can be defined as gradual loss of the original characteristics or ageing
with time due to exposure of material to various conditions. Degradation study involves a
careful study of possible factors that might cause ageing of the material in question.
Films are sometimes used at elevated temperatures or at very low temperatures, or they may
be exposed to drastic changes in temperatures. These variations in temperature more often
than not usually cause changes in the films structure, such as surface and volume
imperfections, which include: surface roughness, rough internal boundaries or density
fluctuations. Some of these changes are either reversible or irreversible. Good examples of
reversible effect are the temperature dependency of the refractive index, and the electrical
conductivity of the dielectric and metal films (Pulker, 1999; Heavens, 1965). On the other
hand, irreversible effects include increase in void fraction, amount of defects and dislocations
and electrical conductivity of the film after annealing (Pulker, 1999).
The use of thin film is not limited to the above stated environmental conditions, sometimes
thin films have been exposed to chemically reactive environment and it is of great importance
for films to be resistant to such environment. The atmospheric pollutants such as SO2 and H2S
usually do damage the optical properties of most coating materials by forming weak acids,
which react with metallic, and non-metallic materials (Heavens, 1965; Pulker, 1999). Thefeffect of humidity and saline water can be substantial in tropical climate or coastal regions.
Humid environment usually damages hygroscopic film materials, while most materials
normally react with saline solution, even when at very small concentration. Films should also
be tolerant to liquid cleaning agents, to acids and also to fungus. The chemical compatibility
11
between the substrate and the film is also very important. The choice of substrate should be
chemically compatible with the coating material, e.g. the glass constituent, PbO and the
coating material such as La20i may react and form optically absorbing metallic lead. A proper
choice of substrate coating material should be put into consideration in order to avoid
chemical degradation (Pulker, 1999; Heavens, 1965).
2.4 Survey of Window Coatings for Different Climatic Regions
Currently, there are several different types of energy efficient window coatings. These can be
categorized broadly into two main classes, namely, STATIC window coatings and
DYNAMIC window coatings. The former coatings have STATIC properties in the sense that
their optical performance remains the same irrespective of external conditions while the latter
changes with changes of the ambient.
The STATIC window coatings can conveniently be subdivided into coatings for solar control
and coatings for providing low thermal emmittance or energy windows.
In warm climate, it is frequently the case that solar energy that finds its way inside the
building through the window is absorbed into the room and it eventually causes overheating.
It is apparently energy effective to have solar control window that blocks the infrared part of
the spectrum (700 < X < 3000 nm) without excessive lowering of the luminous transmittance
(400 < X < 700 nm) (Mbise, 1989; Granqvist, 1991; Granqvist, 1984).
The solar control window utilizes coatings that function as heat diminishing devices and it is
for this reason that these windows are also called transparent infrared reflector. Such window
possesses a coating which transmits well in the luminous region of the solar radiation (400 <
^ < 700 nm) and reflects the infrared radiation (Valkonen and Karlsson, 1985; John and
Bachner, 1976), therefore the near infrared which carries large percentage of the total solar
energy is restricted from passing through the window, while the visible radiation is
transmitted. Whence, a good illumination combined with a low, comfortable, temperature
12
may be attained with decreased need for space conditioning which is costly in terms of paid
energy. Materials reported to be suitable for fabricating these types of window as indicated by
Granqvist (1984) are anti-reflected films of noble metals (Cu, Au and Ag). Dielectrics with
high refractive indices (examples ln20 3, Bi20 3, T i02, S n02, ZnS and ZnO) are useful for
creating the desired anti-reflection (Granqvist, 1991; Granqvist, 1984; Valkonen and Ribbing,
1984; Mbise, et. al. 1997).
In a cold climate, it is frequently the case that the window causes an undesired loss of energy,
and hence space conditioning demands heating. It is thus energy effective to find ways and
means of decreasing the heat losses. One of the ways of doing this is to diminish heat loss
through convection. This can be done through use of multiple glazed windows incorporating
one or more slabs essentially still gas. Diminishing the thermal radiation can further lower the
heat transfer. Low thermal emmittance can easily be achieved through suitable window
coating (Granqvist, 1991; Granqvist, 1984; Mbise, 1989; Valkonen and Ribbing, 1984).
Energy window is the name given to those windows that display a low thermal emmittance.
These types of windows are preferably for cold climates since they reflect the thermal
radiation 3000 < X < lOOOOnm and they usually have a high solar transmittance 300 < X <
3000 nm (Granqvist, 1991). A good example of energy window is transparent infrared
reflector. Two different types of coatings can be used to provide a low thermal emmittance:
an extremely thin metal film embedded between high refractive index dielectric layers with
thickness chosen so as to maximize solar transmittance (Tso)), and certain heavily doped oxide
semiconductor layers. Examples include Sn02 doped by F or Sb, ln20 3 doped by Sn, and ZnO
doped by Al (Granqvist, 1991; Granqvist, 1984; Mbise, 1989; Ling and Cheng, 1987;
Valkonen and Ribbing, 1984; Mbise, et. al. 1997). The possible causes of degradation in these
climates are: extreme cold weather, permafrost, rainy, etc.
The above two types of coatings are of great value for energy efficient windows. However,
they suffer one major drawback in that their properties are static. In a temperate climate, these
types of windows are not suitable. Such climate requires window coatings which can adjust
according to variable demands on heating and lighting during the day or season.
13
A dynamic window coating popularly known as smart window is suitable for temperate
climate. The "classes" of smart windows include: Photochromic (cf. those whose optical
properties are dependent on irradiation); thermochromic (cf those whose properties are
dependent on temperature); and electrochromic (cf. those whose properties change in
response to strength and direction of an applied electric field). (Granqvist, 1984; Granqvist,
1991; Granqvist, 1995; Mbise, 1989).
This work is devoted to particular design of static energy efficient window, that is multilayer
coatings exhibiting angular dependent transmittance. Such coatings, which we discuss in the
next section, fall under solar control window category and therefore are suitable for tropical
climates.
2.5 Protection for Film
In many of the striking developments in multilayer technologies, little attention is often paid
to film properties other than those needed to fulfill the optical requirements. A feature of
considerable practical importance, if coatings were to be used outside the conducive
environment of the laboratory, is the resistance of such coatings to degradation by the harsh
elements of ordinary atmosphere.
The anti-reflectance coating, apart from their use to enhance transmittance in multilayer
optical system, they are also used as protective overlayer (Ling and Cheng, 1987). Certain
optical glasses have a poor resistance to atmospheric degradation. The aluminium films used
in reflecting telescope are found to deteriorate with time unless some protection is applied
(Heavens, 1965). The rate of deterioration is particularly high in coastal neighborhoods where
salt-laden atmospheres are common.r
In one of the stability studies reported (Heavens, 1965) for the protection of aluminium
mirrors, the A1 - SiO multilayer was subjected to (i) extended heating in air to 400 °C and (ii)
boiling in 5% salt solution for one hour. It was found that, after subjecting the samples to
14
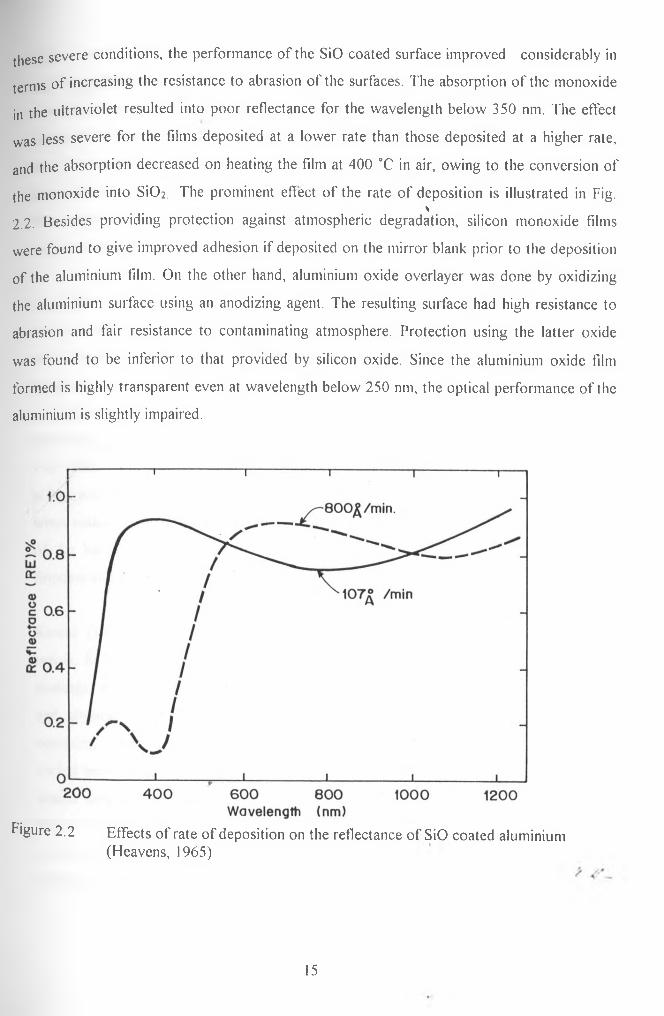
these severe conditions, the performance of the SiO coated surface improved considerably in
terms of increasing the resistance to abrasion of the surfaces. The absorption of the monoxide
in the ultraviolet resulted into poor reflectance for the wavelength below 350 nm. The effect
was less severe for the films deposited at a lower rate than those deposited at a higher rate,
and the absorption decreased on heating the film at 400 °C in air, owing to the conversion of
the monoxide into S i02. The prominent effect of the rate of deposition is illustrated in Fig.V
2.2. Besides providing protection against atmospheric degradation, silicon monoxide films
were found to give improved adhesion if deposited on the mirror blank prior to the deposition
of the aluminium film. On the other hand, aluminium oxide overlayer was done by oxidizing
the aluminium surface using an anodizing agent. The resulting surface had high resistance to
abrasion and fair resistance to contaminating atmosphere. Protection using the latter oxide
was found to be inferior to that provided by silicon oxide. Since the aluminium oxide film
formed is highly transparent even at wavelength below 250 nm, the optical performance of the
aluminium is slightly impaired.
Figure 2.2 Effects o f rate of deposition on the reflectance of SiO coated aluminium(Heavens, 1965)
15
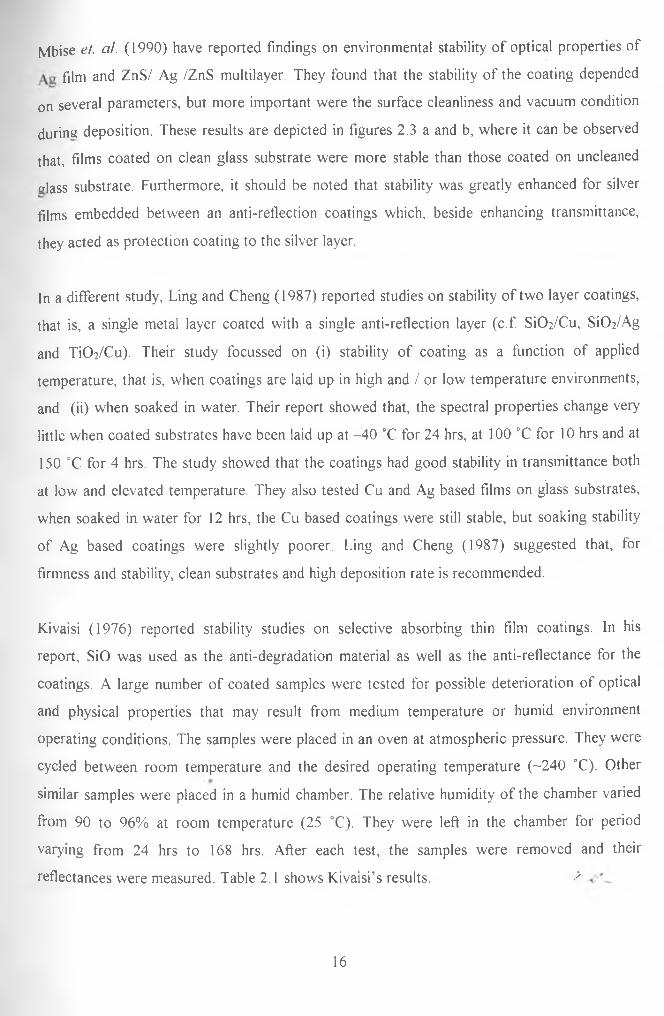
Mbise el. al. (1990) have reported findings on environmental stability of optical properties of
film and ZnS/ Ag /ZnS multilayer. They found that the stability of the coating depended
on several parameters, but more important were the surface cleanliness and vacuum condition
during deposition. These results are depicted in figures 2.3 a and b, where it can be observed
that, films coated on clean glass substrate were more stable than those coated on uncleaned
alass substrate. Furthermore, it should be noted that stability was greatly enhanced for silver
films embedded between an anti-reflection coatings which, beside enhancing transmittance,
they acted as protection coating to the silver layer.
In a different study, Ling and Cheng (1987) reported studies on stability of two layer coatings,
that is, a single metal layer coated with a single anti-reflection layer (c.f. SiC^/Cu, SiCVAg
and TiCVCu). Their study focussed on (i) stability of coating as a function of applied
temperature, that is, when coatings are laid up in high and / or low temperature environments,
and (ii) when soaked in water. Their report showed that, the spectral properties change very
little when coated substrates have been laid up at -40 °C for 24 hrs, at 100 °C for 10 hrs and at
150 °C for 4 hrs. The study showed that the coatings had good stability in transmittance both
at low and elevated temperature. They also tested Cu and Ag based films on glass substrates,
when soaked in water for 12 hrs, the Cu based coatings were still stable, but soaking stability
of Ag based coatings were slightly poorer. Ling and Cheng (1987) suggested that, for
firmness and stability, clean substrates and high deposition rate is recommended.
Kivaisi (1976) reported stability studies on selective absorbing thin film coatings. In his
report, SiO was used as the anti-degradation material as well as the anti-reflectance for the
coatings. A large number of coated samples were tested for possible deterioration of optical
and physical properties that may result from medium temperature or humid environment
operating conditions. The samples were placed in an oven at atmospheric pressure. They were
cycled between room temperature and the desired operating temperature (-240 °C). Other
similar samples were placed in a humid chamber. The relative humidity of the chamber varied
from 90 to 96% at room temperature (25 °C). They were left in the chamber for period
varying from 24 hrs to 168 hrs. After each test, the samples were removed and their
reflectances were measured. Table 2.1 shows Kivaisi’s results. Z
16

Figure 2.3a Spectral transmittance ol Ag and ZnS/Ag/ZnS coatings, deposited on uncleaned
substrates. I resh sample a and c, aged sample b and d. The insert curves arc
expanded to show the visible region (Mbisc, et. a!. 1990)
WAVELENGTH (nm)l̂ u,e 2.3b Spectral transmittance of" Ag and ZnS/Ag/ZnS coatings, deposited on cleaned
substrates. Fresh sample a and c, aged sample b and d. The insert curves are
expanded to show the visible region (Mbise, el. a/. 1990)17

Table 2.1 Stability of selective coatings in air (Kivaisi, 1976)
Test Multilayer design
Reflectance
of untreated
sample %
Reflectance of
treated sample
%
Al-Ge-SiO 79 76
Ni-Ge-SiO 85 85
Heating in air Cr-Ge-SiO 90 93
(240° C) Al-PbS-SiO 79 69
Ni-PbS-SiO 92 88
Cr-PbS-SiO 94 94
Al-Ge-SiO 79 77
Ni-Ge-SiO 85 84
Humidity Cr-Ge-SiO 90 90
(90 - 95% RH) Al-PbS-SiO 79 70
Ni-PbS-SiO 92 88
Cr-PbS-SiO 94 94
These results revealed that under the given condition, there was very small change in
reflectivity of the multilayer coatings; this means that SiO is a good anti-degradation material.
Since the optical properties of thin films changes after long/short duration of exposure to
inclement conditions, for this reason, this work is devoted to degradation study of multiplayer
coatings exhibiting angular dependent transmittance. This type of coating is suitable as static
energy efficient window coating. As a window coating it will be exposed to harsh conditions
whose changes are sometime drastic, thus the obligation for the study.
< ...
18

ffl CHAPTER THREE tU
THEORY f o r m u l t il a y e r c o a t in g s e x h ib it in g a n g u l a r
DEPENDENT TRANSMITTANCE
3.1 Introduction
In this chapter, we describe the theory behind the multilayer coatings exhibiting
angular dependent transmittance. Much of it is standard material but for sake of
completeness of this work it is worth being included. First we describe the Maxwell's
equations for the homogeneous media and then associated Fresnel's equations and the
subsequent solutions for unpolarized light are evaluated. The characteristic matrix and
the general formula for calculating the quantitative performance parameters are
derived towards the end of the chapter.
3.2 Maxwell’s Equations
In principle, the determination of the amplitudes and intensities of beam of light
reflected or transmitted by a thin film(s) on glass is straightforward. The incidence of
an electromagnetic (EM) wave upon the interface between two homogeneous media of
different optical properties (e.g. glass substrate and air) is followed by the splitting of
the EM wave into two waves, namely, the transmitted wave which proceeds into the
second medium and the reflected wave which propagates back into the first medium.
The two vectors, namely the ̂electric vector, E, measured in electrostatic units and the
magnetic induction vector, B, measured in electromagnetic units, are used in
representing an electromagnetic field. To describe the effect of EM field on material
objects, it is necessary to introduce another set of vectors, namely, the electric current ̂
density J(= oE), the electric displacement D(= gE) and the magnetic vector H [=
19

(l/|i)B]. Here a, e and p. are conductivity, dielectric constant, and magnetic
permeability, respectively (Heavens, 1965; Born and Wolf, 1975).
For an isotropic medium, the laws of electromagnetism are represented by the
Maxwell's equations. These equations (Heavens, 1965; Born and Wolf, 1975) are: -
V I) = e V E = p 3.1a
V B = //V-H = 0 3.1b
IT dHVxE = l i---di
3.1c
VxH = fjE + E ——a
3 .Id
where p is the charge density.
If we consider a medium in which there is no space charge, the above equations lead
to Maxwell's (2nd order differential) equations representing the propagation of
electromagnetic disturbances in the medium
d2E dE 2 su —— + l io — = V E
8 -i a3.2a
d H OH, 2 +/'o- = V H
d t 3.2b
The above equations are valid for regions of space throughout which the physical
properties of the medium characterized by e and // are continuous (Heavens, 1965).
> 4-‘.
20
3.3 Boundary Conditions
Since in multilayer coatings the physical or/ and optical properties of the coating
materials are different and change abruptly across one or more surfaces, all the vectors
thus mentioned above are expected to be discontinuous.
We need to consider boundary conditions that apply across these abrupt changes in
optical or/ and physical properties that apply to multilayer coatings.
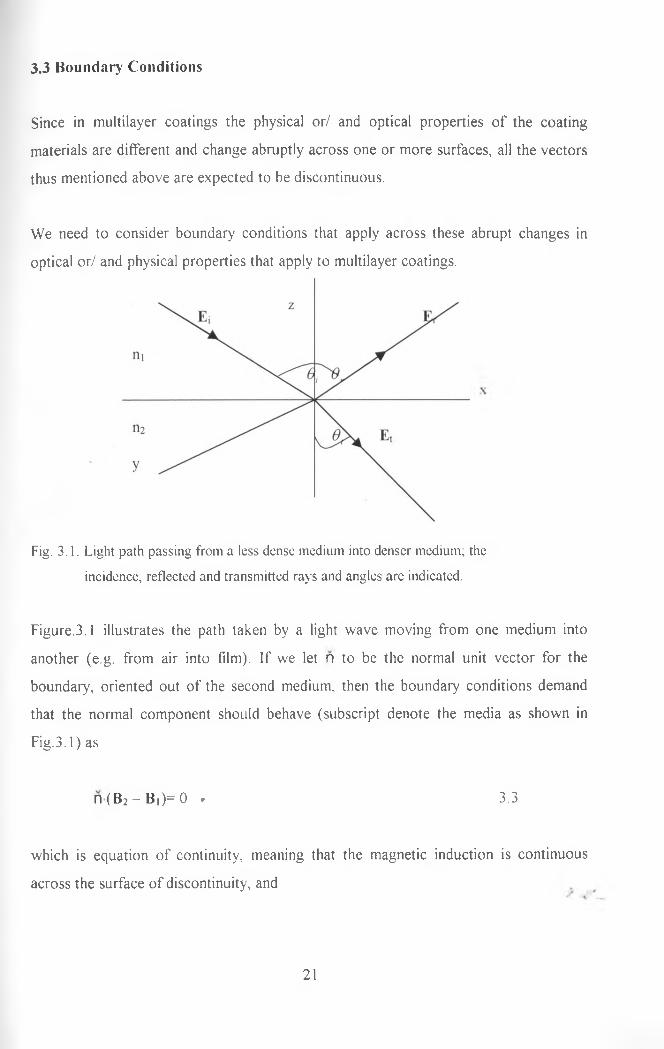
Fig. 3.1. Light path passing from a less dense medium into denser medium; the
incidence, reflected and transmitted rays and angles are indicated.
Figure.3.1 illustrates the path taken by a light wave moving from one medium into
another (e.g. from air into film). If we let n to be the normal unit vector for the
boundary, oriented out of the second medium, then the boundary conditions demand
that the normal component should behave (subscript denote the media as shown in
Fig.3.1) as
n ( B 2- B , ) = 0 r 3.3
which is equation of continuity, meaning that the magnetic induction is continuous
across the surface of discontinuity, and
21

n-(D2 - Di) — p 3.4
That is, the presence of a layer of surface charge density, on the surface of
discontinuity, leads to an abrupt change in the normal component of the electric
displacement by the amount equal to p .
The tangential components of the electric vector should behave as
nx(E2- E , ) = 0 3.5
which is also another continuity equation, implying that the tangential component of
the electric vector should be continuous across the surface while
nx( H2- H , ) = J 3.6
Equation 3.6 implies that, the presence of a surface with current density J (considered
to be a vector quantity), the tangential component of the magnetic vector should
change abruptly; its discontinuity is given by J x n (Heavens, 1965; Born and Wolf,
1975).
3.4 Fresnel’s Equations for Angle Dependent Coatings
Applying the boundary conditions deduced in the previous section, we obtain
equations that may be solved to give the amplitudes of the transmitted and reflected
vectors in terms of those of the incident vectors. Denoting incident and transmittedrwaves by the subscripts / and /, respectively, we obtain
2 2
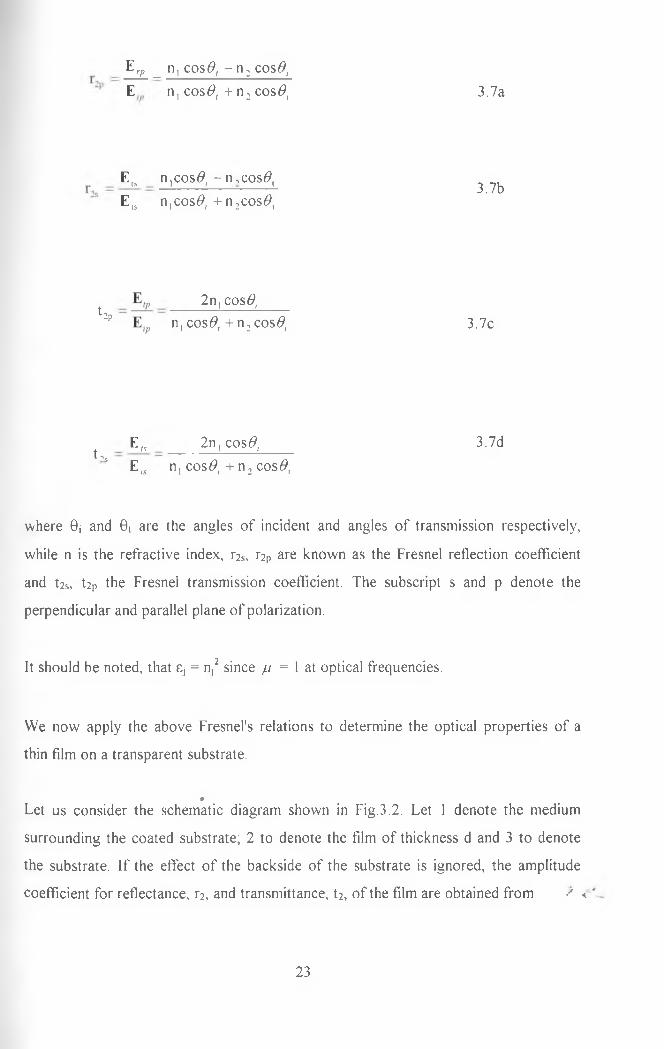
Er/) ^ n, cos#, - n 2 cos#, E n, cos#, + n : cos#, 3.7a
E rs _ n,cos#( - n ,cos#t E 1S n,cos#, + n :cos#t
3.7b
l 2p2n, cos#,
n, cos#, + n ; cos#, 3.7c
E,s 2n,cos#, 3.7dt ->s
E,_t n, cos#, + n 2 cos#,
where 9; and 9t are the angles of incident and angles of transmission respectively,
while n is the refractive index, r2S, r2P are known as the Fresnel reflection coefficient
and t2s, t2P the Fresnel transmission coefficient. The subscript s and p denote the
perpendicular and parallel plane of polarization.
It should be noted, that Sj = n,2 since // = 1 at optical frequencies.
We now apply the above Fresnel's relations to determine the optical properties of a
thin film on a transparent substrate.
rLet us consider the schematic diagram shown in Fig.3.2. Let 1 denote the medium
surrounding the coated substrate; 2 to denote the film of thickness d and 3 to denote
the substrate. If the effect of the backside of the substrate is ignored, the amplitude
coefficient for reflectance, r2, and transmittance, t2, of the film are obtained from •' <
23

incident
Fig.3.2. The path of light ray passing from air, across the film into the air or another
medium of refractive index less than that of the film.
r!2 + r23g2,<?2l + r12r23e2̂
and
_ 112 T t 23£,< :
1 + r i2r23 :̂">:
3.8
3. 9
where S 2 represents the change in phase of the beam on traversing the film and is
2 Jigiven by S 2 = — n ;dcos/9t and the superscript / signify light incident from the
front-side.
The relations shown above are applicable for unpolarized light. Those for s and pr
polarized light as well as for light incident onto the substrate from the backside take
the form shown above by equation (3.8) and (3.9) (Granqvist, 1991; Heavens, 1965;
Mbise, 1989).
24
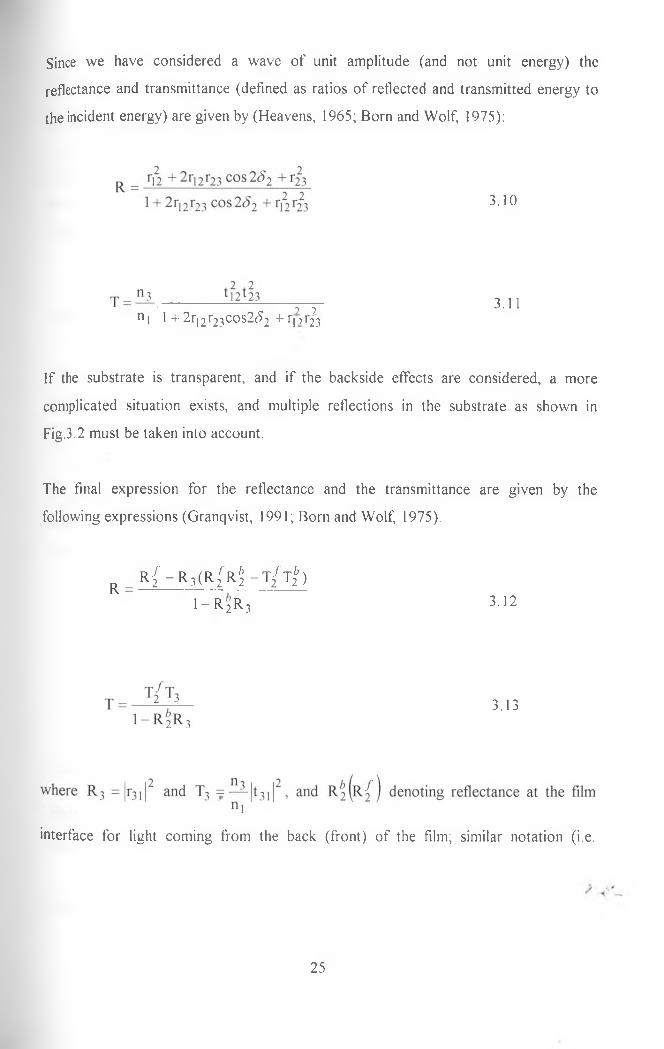
Since we have considered a wave of unit amplitude (and not unit energy) the
reflectance and transmittance (defined as ratios of reflected and transmitted energy to
the incident energy) are given by (Heavens, 1965; Born and Wolf, 1975):
3.10
3.11* 0 Jn j 1 + 2 r j2r23COs2<52 + ^->^3
If the substrate is transparent, and if the backside effects are considered, a more
complicated situation exists, and multiple reflections in the substrate as shown in
Fig.3.2 must be taken into account.
The final expression for the reflectance and the transmittance are given by the
following expressions (Granqvist, 1991; Born and Wolf, 1975).
interface for light coming from the back (front) of the film; similar notation (i.e.
R =r { - r 3(r { r ̂ - t / t | )
1 - R 2 R 3 3.12
3.13
25

and. To ) is used for transmittance. The subscript, 1,2 and 3 signify the medium
in which the wave is traversing (Palik, 1985; Granqvist, 1991).
The treatment above can easily be generalized to multiple layer films (Heavens, 1965:
Born and Wolf, 1975). Among the various techniques used for multilayer (Heaven,
1965), the characteristic matrix technique is discussed in the next section.
3.5 The Characteristic Matrix of a Homogeneous Media
A stratified medium is a medium whose characteristics are constant throughout each
plane perpendicular to a fixed direction. If the z-axis of a Cartesian reference system is
taken along this special direction, then e - s(z) and // = ju(z)
For a homogeneous film s and n = ^[e are constant. If 0 denotes the angle which the
normal to the wave makes with the z -axis, through a simple algebraic manipulation,
the characteristic matrix for s-polarized wave is given by (Born and Wolf, 1975).
( i }cos(knzcos^) - (—)sin(knzcos$)
av-/orsin(knzcos#) cos(knzcos^) >
where k = — = — with co and c denoting frequency of the radiation and speed of c A
rlight respectively, and a - J ec o s6 . For a p-polarized wave, all the equations and the
same characteristic matrix holds, with a replaced by p - ^/(l/ff)cos0.
After evaluating all the elements m„ for z = z\ of the characteristic matrix
2 6

of a given stratified medium, the expression for the reflection andM =' mu mn '
y jn 21 w 22 J
transmission coefficient of the film are given by (Born and Wolf, 1975; Granqvist
1991)
where 1 and / denote the first and the last medium respectively (Born and Wolf, 1975).
In terms of r and t the reflectivity and transmissivity are given by (Born and Wolf,
1975; Granqvist, 1991)
3.6 Quantitave Performance Parameters
Having calculated the reflectivity and transmissivity of a multilayer, it is also desirable
to specify suitable performance parameters which indicate how far off a window
coating is from certain design goals. The various types of average propertiesf*
commonly used as figures of merit for the glazing system can be calculated using the
general equation (Rubin, et. cil., 1998).
(nin +mn a, )a] - (m2l +m22a,)
h i + m\2a l)a \ + 0»21 + m22« /) 3.15
3.16
R = Irl2 and T = — |t|2 . 3.17
27

3.18£ p w <d, w <u
£ o , ( i ) d A
Where P is the measured spectral radiometric property such as reflectance or
transmittance; q denotes the type of average taken (cf. solar or luminous); O is the
weighing function for the strength of source (sunlight or thermal radiation) under
appropriate condition at each wavelength, X. In this work data for AM 1.5 irradiance,
ISO 9845 were used for solar, whereas CIE D65 illuminant ISO/CIE 10526 data were
used for luminous performance evaluation, and finally, a,b is the practical wavelength
limit (cf. a = 300 nm, b = 2500 nm for solar; a = 380 nm; b = 780 nm for luminous)
The above formula in equation 3.18 is utilized using a computer programme to obtain
the integrated luminous (transmittance and reflectance) and solar* (transmittance and
reflectance) as detailed in appendix B page 91.
in tegrated luminous/ solar: this is the calculated area under the curve and normalized
using standard data that is ISO 9845 and ISO/CIE 10526.
2 8
fflICHAPTER FOUR£Q
EXPERIMENTAL TECHNIQUES
4.1 Introduction
In this chapter, we describe the experimental techniques that were followed in:
fabricating, thickness measurement, characterization of angular dependency and
studying optical (transmittance and reflectance) degradation of multilayer coatings.
4.2 Cleaning the Substrate
The substrates were 1 mm thick ordinary microscope glass slides of dimensions 76 cm
x 26 cm which could withstand high temperature (~ 500 °C).
The following are the cleaning steps that were followed in this work.
1. The substrates were soaked in a warm soap solution for 5 to 10 minutes.
2. The substrates were degreased using a soapy soft cotton wool by gently drag
wiping the surface to avoid any possible scratch marks.
3. When satisfied that the substrates were properly degreased, they were then
rinsed using distilled water.
4. The substrates were hang in a rack and immersed into distilled water in a
beaker. The beaker was then hang in ultrasonic bath (Model Decon FS 300).
The ultrasonic cleaning was done for 20 minutes.
29

5. Step 4 above was repeated, but with distilled water replaced by 99.8% pure
ethanol.
6. After ultrasonic cleaning, the rack and substrates were transferred and
suspended over a boiling ethanol in another beaker and rinsed. Thus the
ethanol vapour would pass over the substrates surfaces to finely rinse them.
7. The substrates still standing on the rack, were either transferred into a
dessicator for storage or were mounted onto the substrate holder in the
deposition chamber.
4.3 Deposition of the Films
The samples were fabricated by resistive evaporation using Edward’s high vacuum
coating system (Model E306A). The system is equipped with Edwards E04 diffusion
pump and a modern high performance direct drive E2M8 rotary pump. The system is
also equipped with Pirani-Penning gauge combination that was used to monitor
pressure inside the chamber.
The system has special features that are meant to ensure vacuum chamber
contamination is kept to negligible proportion. These features include: -
1. Liquid nitrogen trap, which is located between the diffusion pump and the high
vacuum valve. This trap is meant to capture migrating oil vapour and also
provides considerable pumping speed for condensable vapours.
2. Fluoro-elastomer chamber seals and low outgassing construction materials,
such as stainless steel, make a major contribution to contamination freerconditions.
3. Vacuum brazing and non-decay welding techniques have been used for
construction of the pumping stalk.> T ''-
30
The base of the coating system is fitted with a circular plate that can hold up to four
hearths. Therefore, it is possible for four different materials to be evaporated one at a
time, thus making it possible to coat different layer combination without breaking the
vacuum.
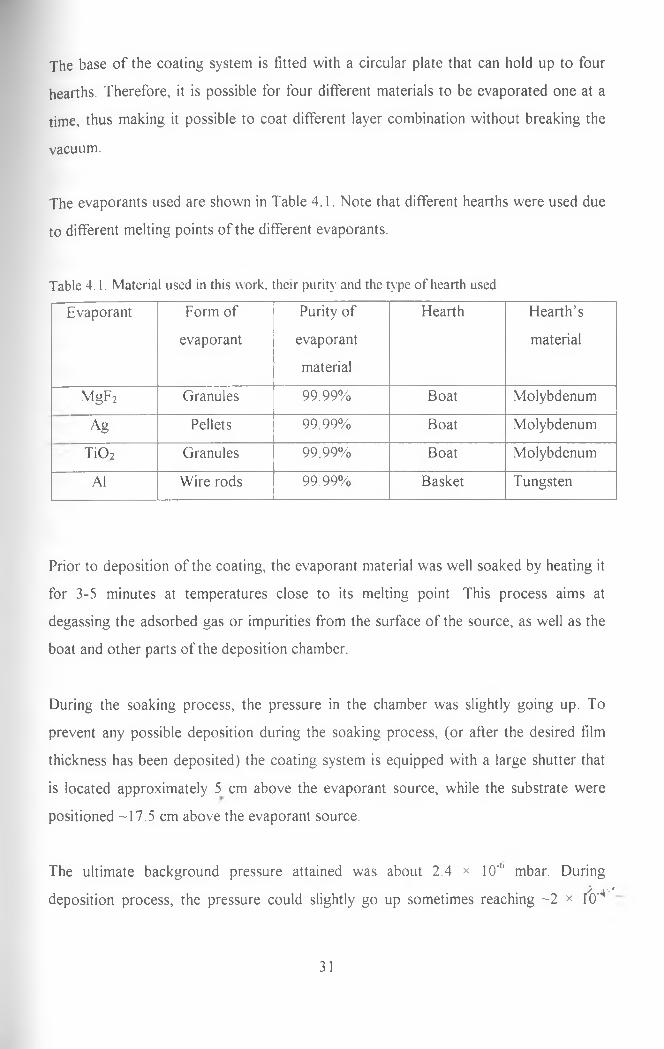
The evaporants used are shown in Table 4.1. Note that different hearths were used due
to different melting points of the different evaporants.
Table 4.1. Material used in this work, their purity and the type of hearth used
Evaporant Form of
evaporant
Purity of
evaporant
material
Hearth Hearth’s
material
MgF2 Granules 99.99% Boat Molybdenum
Ag Pellets 99,99% Boat Molybdenum
T i02 Granules 99.99% Boat Molybdenum
AJ Wire rods 99.99% Basket Tungsten
Prior to deposition of the coating, the evaporant material was well soaked by heating it
for 3-5 minutes at temperatures close to its melting point. This process aims at
degassing the adsorbed gas or impurities from the surface of the source, as well as the
boat and other parts of the deposition chamber.
During the soaking process, the pressure in the chamber was slightly going up. To
prevent any possible deposition during the soaking process, (or after the desired film
thickness has been deposited) the coating system is equipped with a large shutter that
is located approximately 5 cm above the evaporant source, while the substrate were
positioned -17.5 cm above the evaporant source.
The ultimate background pressure attained was about 2.4 * 10‘(’ mbar. Duringy A*.*
deposition process, the pressure could slightly go up sometimes reaching -2 x TO'4
31
mbar. The rate of deposition was kept in the range of 4.5 < r < 6 A/s and 25 < r < 30
A/s for metals (Ag, Al), for the dielectric (MgF2), respectively. It should however be
noted that the rate of deposition of T i0 2 was slightly lower in the range of 6 < r < 10
A/s. The rate of deposition as well as the thickness of the film was controlled by a
quartz crystal monitor attached to the system.
4.4 Optical Characterization
The optical properties of the samples were studied by using the Perkin Elmer Lambda
9 spectrophotometer. This is a double beam instrument covering the ultraviolet, visible
and near infrared spectral regions.
The instrument is quite accurate and has good resolution provided that initialization
procedures, including background correction, are performed prior to actual
measurement’s are taken.
Each sample was carefully cut into two equal pieces using a sharp diamond
glasscutter, and assuming the coating is isotropic, one piece was kept as reference and
the other piece was subjected to ageing treatment. Different post treatments were
performed for different samples, as detailed in section 4.5.
The spectrophotometry analysis was done before and after treatment of the samples. A
large amount of data for transmittance and reflectance were obtained and plotted on
the same axes for each sample. The transmittance data were obtained for normal
incident beam and for light incident at an oblique angle of 50° onto the sample.
Reflectance data were obtained for near normal (i.e. 15°) incident beam and for lightrincident at an oblique angle of 50°. Spectrophotometry was done in the 300 nm to
2500 nm wavelength range. The data collected was later analyzed using a computer
program given in page 90.
32
This section summarizes the various ageing treatment methods employed in this study.
The approach was performed either in (i) accelerated test - whereby the factors
leading to degradation were elevated to extreme (ii) non-accelerated test - whereby
factors leading to degradation were let to take their natural course.
4.5 Ageing Treatment
4.5.1 E levated Tem peratures
The effect of extreme high temperature was investigated by heating the samples in air
in an oven at fixed temperatures. The temperature inside the oven was monitored
using an in-built digital thermometer with an accuracy of ±1 °C. The thermometer was
calibrated prior to actual measurements.
1. A number of samples were heated for periods ranging from 12 hrs to 120 hrs
in an oven maintained at 50 °C.
2. A number of samples were heated for periods ranging from 12 hrs to 120 hrs
in an oven maintained at 100 °C.
3. A number of samples were heated for periods ranging from 12 hrs to 120 hrs
in an oven maintained at 200 °C.
Two pieces were kept as references for each of 1, 2 and 3 above.
33

The effect o f low temperature was studied by laying the samples inside the freezer
compartment of the convectional refrigerator. The temperature inside the freezer was
monitored by using an analog in-built thermometer with an accuracy of about ±1 °C.
The thermometer was calibrated prior to taking actual measurements. Before any
samples were exposed to low temperature environment, the freezer was first let to
stabilize at the set temperature.
1. A number of samples were laid in a freezer maintained at -10 °C for periods
ranging from 1 week to 12 weeks
2. A number of samples were laid in a freezer maintained at -18 °C for periods
ranging from 1 week to 12 weeks
3. A number of samples were covered in frost (ice) at -20 °C for 12 weeks
Two pieces were kept as references for each of 1,2 and 3 above.
4.5.2 L ow Tem peratures
4.5.3 H u m id E nvironm ent
The samples were kept in compartment of controlled humidity. The following
ingenious method was devised to simulate and maintain the humidity at derived
percentages. Given masses of sodium hydroxide (NaOH) or calcium chloride (CaCl)
when mixed with given volume of water, can give constant humidity if the
temperature of the ambient does not fluctuate much (Rugumamu, 2001). The derived
percentages are shown in Table 4.2.
34
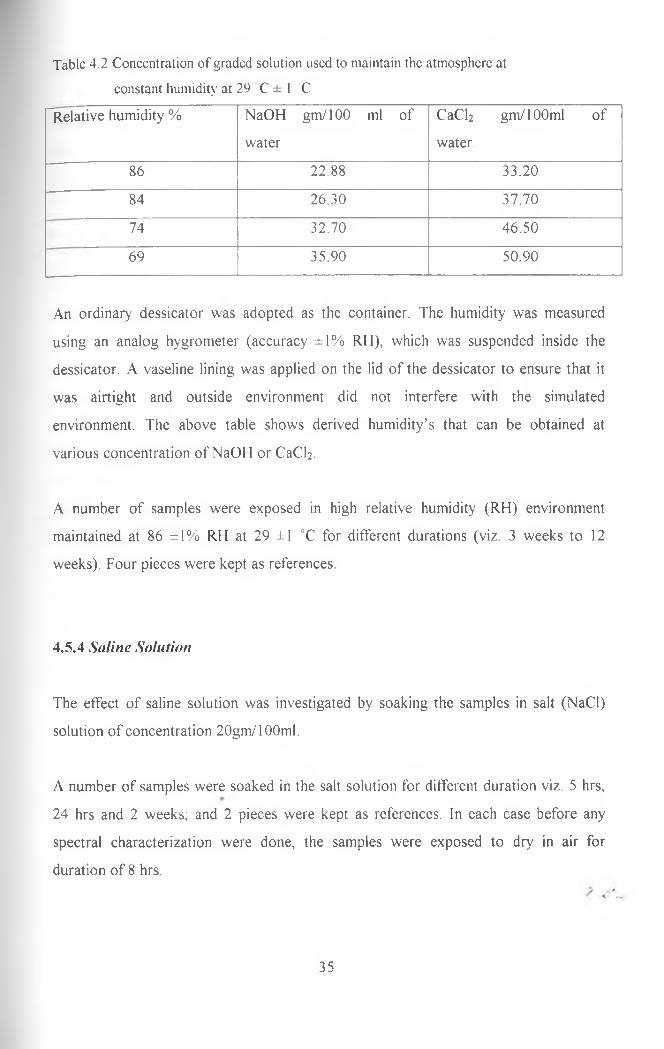
Table 4.2 Concentration of graded solution used to maintain the atmosphere at
constant humidity at 29 C ± 1 C
^Relative humidity % NaOH gm/100 ml of
water
CaCh gm/ 100ml of
water.
86 22.88 33.20
84 26.30 37.70
74 32.70 46.50
69 35.90 50.90
An ordinary dessicator was adopted as the container. The humidity was measured
using an analog hygrometer (accuracy ±1% RH), which was suspended inside the
dessicator. A vaseline lining was applied on the lid of the dessicator to ensure that it
was airtight and outside environment did not interfere with the simulated
environment. The above table shows derived humidity’s that can be obtained at
various concentration of NaOH or CaCh.
A number of samples were exposed in high relative humidity (RH) environment
maintained at 86 ±1% RH at 29 ±1 °C for different durations (viz. 3 weeks to 12
weeks). Four pieces were kept as references.
4.5.4 S aline Solution
The effect of saline solution was investigated by soaking the samples in salt (NaCl)
solution of concentration 20gm/ 100ml.
A number of samples were soaked in the salt solution for different duration viz. 5 hrs,
24 hrs and 2 weeks; and 2 pieces were kept as references. In each case before any
spectral characterization were done, the samples were exposed to dry in air for
duration of 8 hrs.
35
The effect of organic solvents on multiplayer films was investigated by using acetone
and absolute ethanol. The two solvents were both of purity 99.8%. The study is as
detailed below.
A number of samples were soaked in acetone and others in absolute ethanol for
duration ranging between 12 hrs to 96 hrs respectively. In each case, the samples
were exposed in air to dry for duration of 8 hrs before any optical characterizations
were done.
4.5.5 O rganic Solvents
4.5.6 O utdoor E nvironm ent
The effect of atmospheric conditions was studied by exposing the samples in outdoor
environment. The samples were strategically placed on rooftop where they could not
be blown away by wind. A number of samples were exposed for different durations
ranging from 2 weeks to 12 weeks. 4 pieces were kept as references. In between the
durations o f exposure (i.e. 2 weeks, 4 weeks and 12 weeks) the samples were taken to
the laboratory and spectral analysis done and then returned back. Atmospheric
humidity ranged around 60 ± 1% RH to 70 ± \% RH, while the temperature ranged
between 20 - 34 °C.
4.5.7 A quatic Condition
The effect of water on the coated samples was investigated by keeping a number of
samples submerged in distilled water for 48 hrs to 3 weeks. All samples kept in waterrfor duration longer than 48 hrs were being cycled between aquatic condition and dry
environment for 8 hrs; 2 pieces were kept as references.
36
CQ CHAPTER FIVE HJ
RESULTS AND DISCUSSION
5.1 Introduction
This chapter summarizes the findings of this work. The quantified graphical
presentations of the results have been discussed, citing possible factors thought to have
attributed to degradation.
The study findings are presented for different degradation tests done on different
samples, for given range of time. Initially layer combination that gives the best optical
characteristics was determined. The desired optical characteristics are: the samples
should transmit substantially in the luminous region, that is 400 nm to 700 nm
wavelength; the samples should be able to block most of the near infrared region; and
finally, the samples should posses substantial angular performance (defined in page 1).
The layer combinations that were studied with their respective thickness combination
starting from the topmost layer included: MgF2/Ag/MgF2 (240/12/340 nm);
MgF2/Al/MgF2 (220/12/340 nm); T i02/Ag/Ti02 (240/12/340 nm) and T i02/Al/Ti02
(340/12/220 nm). The layer thicknesses had theoretically been optimized by the
authors predecessor (Mbise, 1995).
The MgF2/Ag/MgF2 coating out performed the other layer combination (based on the
above criteria) and therefore was chosen to be used for degradation studies. The
findings for MgF2/Ag/MgF2 multilayer are discussed in section 5.2. The
MgF2/Al/MgF2 and TiC>2 based multilayer coatings are discussed in sections 5.3 and.r
5.4, respectively.
> v '.
37

5.2 Degradation Studies
Below is detailed description of the results obtained from various degradation tests on
MgF2/Ag/MgF2 based multilayer coatings. The wavelength integrated solar optical
properties have been obtained from the graphical spectral data obtained empirically.
5.2.1 E levated Tem peratures
The physical appearance of the samples annealed at the temperatures and durations
specified in section 4.5.1 (page 33) remained pale blue in colour for the whole
duration they were exposed. The spectral data for samples annealed at 50 °C, 100 °C
and 200 °C, are given in figures 5.2.1a, 5.2.1b and 5.2.1c, respectively.
The wavelength integrated luminous transmittance data are given in figures 5.2.1aa,bb
and cc, for samples annealed at 50 °C, 100 °C and 200 °C, respectively. These graphs
have been extrapolated from the tabulated data given in table Al, A2 and A3 of
appendix A, respectively, and they show changes in luminous transmittance with time
the samples were exposed in elevated temperatures. The angular performance of
respective samples can be found by finding the difference in luminous transmittance
between A and C for fresh/reference sample, and between B and D for aged sample. In
graphs 5.2.1aa,bb and cc, A and B denotes the oblique incidence transmittance while
C and D the normal incidence transmittance.
> v '.
38

u<0
Fig:5.2.1a Spectral transmittance and reflectance of MgFz /Ag/MgFz multilayer for fresh sample and a sample laid in an oven maintained at 5 0 ° ± 1°C for indicated duration.
Ref
lect
ance
(R
E)
%

Lum
inou
s Tr
ansm
ittan
ce (
%)
Time (Hours)
Fig. 5.2. laa. The variation with time of wavelength integrated luminous transmittance for
samples annealed at 50 C. Fresh sample A and C: aged sample B and D.
(NB. A and B denotes oblique incidence; C and D denotes normal
incidence)
40
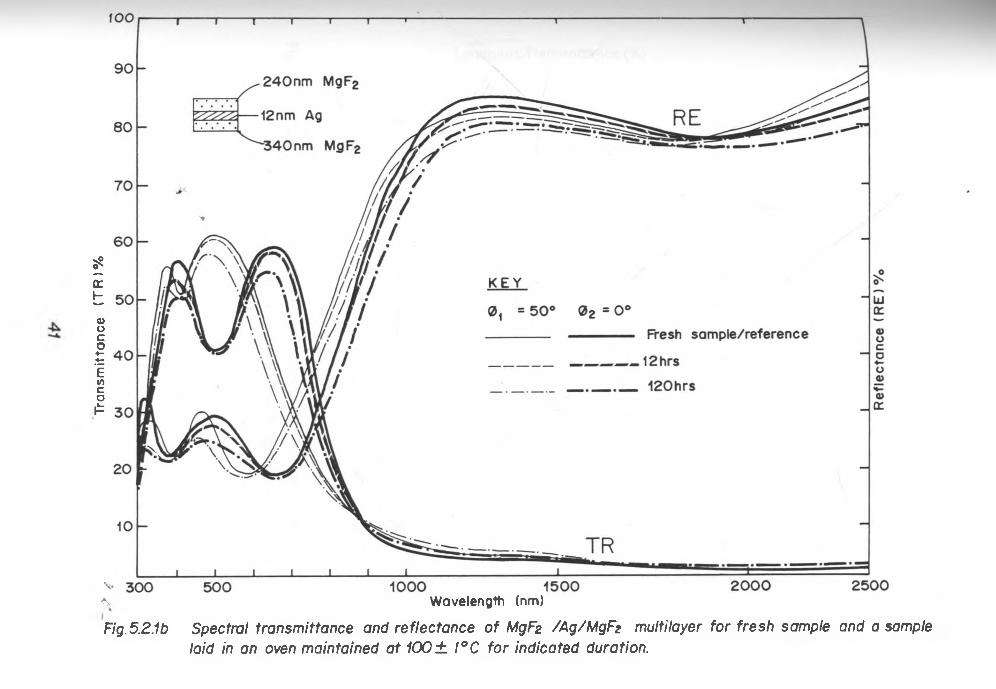
Tran
smitt
ance
(T
R)%
^ Wavelength (nm)
Fig.5.2.1b Spectral transmittance and reflectance of MgFz /Ag/MgFz multilayer for fresh sample and a sample laid in an oven maintained at 100 ± 1°C for indicated duration.

Lum
inou
s Tr
ansm
ittan
ce (
%)
Time (Hours)
Fig. 5.2. lbb. The variation with time of wavelength integrated luminous transmittance for
samples annealed at 100 °C. Fresh sample A and C; aged sample B and D.
(NB. A and B denotes oblique incidence; C and D denotes normal
incidence)
/
42

04
300 500 2000 25001000 1500Wavelength (nm)
Fig.i2.1c Spectral transmittance and reflectance of MgFz /Ag/MgFz multilayer for fresh sample and sample i ' laid in an oven maintained at 200±1°C for indicated duration.
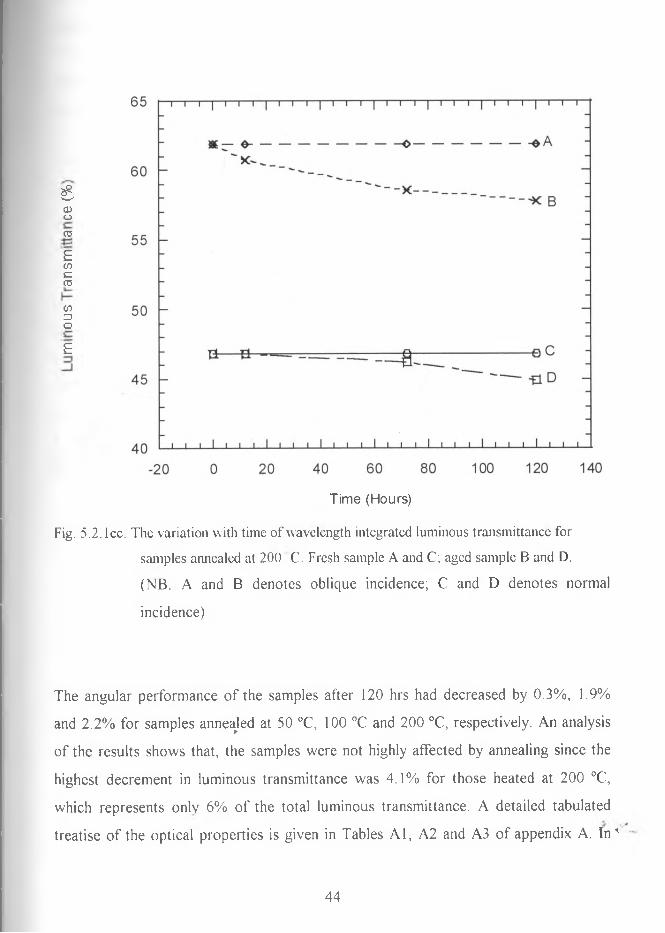
£O'oCB
ECrtC03
CO=>oE
Time (Hours)
Fig. 5.2. lcc. The variation with time of wavelength integrated luminous transmittance for
samples annealed at 200 C. Fresh sample A and C; aged sample B and D.
(NB. A and B denotes oblique incidence; C and D denotes normal
incidence)
The angular performance of the samples after 120 hrs had decreased by 0.3%, 1.9%
and 2.2% for samples anneajed at 50 °C, 100 °C and 200 °C, respectively. An analysis
of the results shows that, the samples were not highly affected by annealing since the
highest decrement in luminous transmittance was 4.1% for those heated at 200 °C,
which represents only 6% of the total luminous transmittance. A detailed tabulated
treatise of the optical properties is given in Tables A l, A2 and A3 of appendix A. In^
44
all the samples studied at elevated temperatures, luminous reflectance registered the
highest decrement ranging from 3.8% for samples annealed at 50 °C (for 120 hrs) to
7.3% for those annealed at 200 °C (for 96 hrs). The changes observed in samples
annealed at temperatures stated, can be regarded as insignificant since they represent a
small percentage of the total transmittance/ reflectance under consideration.
The changes observed in spectral properties after the samples were annealed at
different temperatures are thought to be because of expansion when the samples were
heated and contraction as they cool down to their original state. These changes lead to
stresses of considerable magnitude in the films. The main cause of this is the mismatch
of the expansion coefficient between the substrate and the multilayer film and even
between one layer and another. These stresses eventually affect the packing density,
crystallographic structure, rough internal boundaries and other micro-structural
properties o f the samples (Besancon, 1986; Rubin, el. a/. 1998; Mbise and Kivaisi,
1993). According to Hoffman (1976), the optical (transmittance and reflectance)
changes observed can be reduced even further by depositing the film onto a hot
substrate (since this process determines the size of grains of the film) and by post
deposition annealing.
5.2.2 L ow Tem peratures
The spectral data obtained on low temperature tests are given in figures 5.2.2a,b and c,
for sample exposed in freezing environment at -10 °C; -18 °C and -20 °C, respectively.
Detailed tabulated spectral data is given in Tables A4, A5 and A6 of appendix A.
Figures 5.2.2aa,bb and cc gives the variation of luminous transmittance with time as
discussed under section 4.5.2.
45

Fig.5.2.2a Spectral transmittance and reflectance ofMgF2 /Ag/MgF2 multilayer for fresh sample and sample laid in freezer maintained at ~10± 1°C for indicated duration.
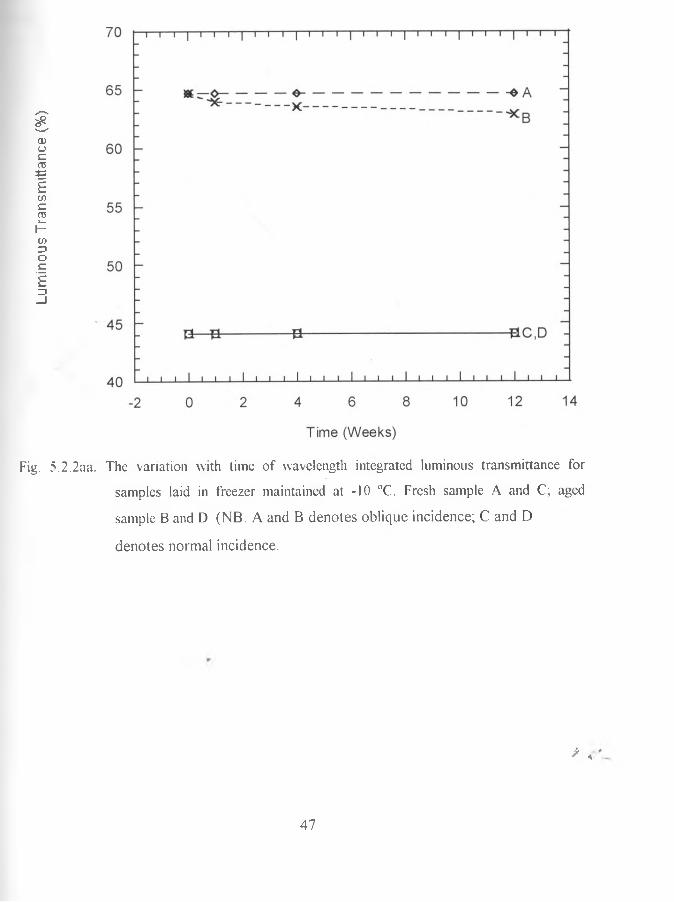
Lum
inou
s Tr
ansm
ittan
ce (
%)
Fig. 5.2.2aa. The variation with time of wavelength integrated luminous transmittance for
samples laid in freezer maintained at -10 °C. Fresh sample A and C; aged
sample B and D. (NB. A and B denotes oblique incidence; C and D
denotes normal incidence.
* «
47
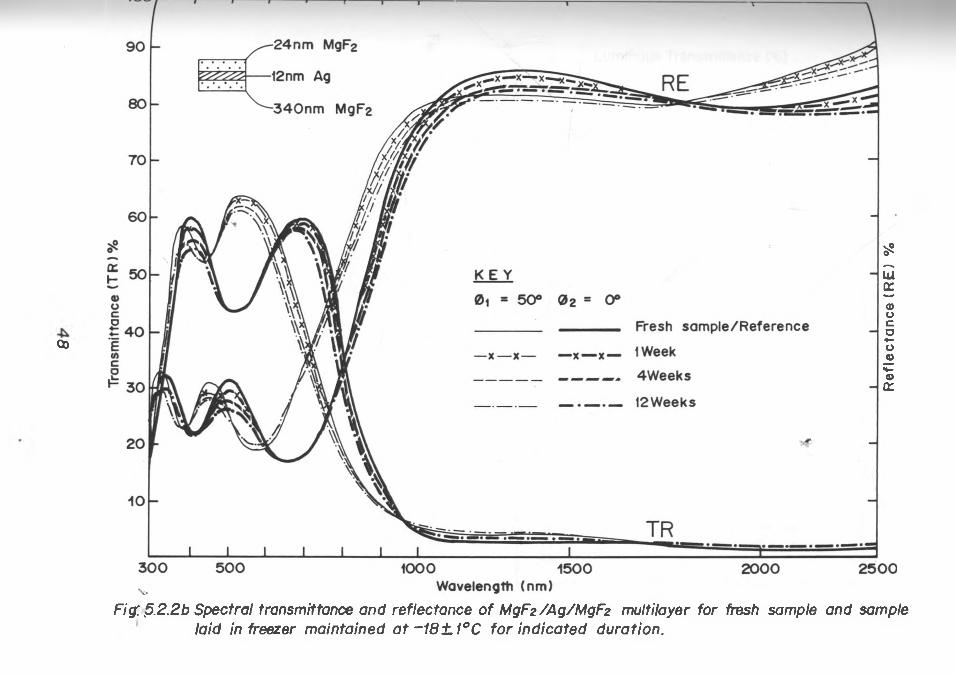
00
Fig: $.2.2b Spectral transmittance and reflectance o f MgF2/Ag/M gF2 multilayer for fresh sample and samplelaid in freezer maintained a t-1 8 ± 1 °C fo r indicated duration.
Ref
lect
ance
(R
E)
%
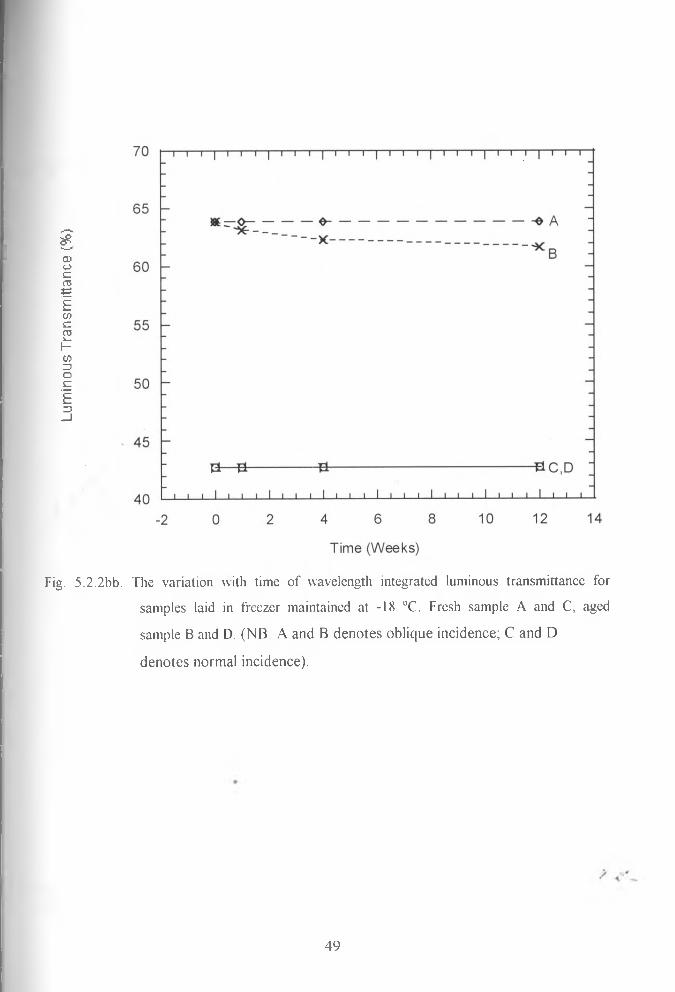
Lum
inou
s Tr
ansm
ittan
ce (
%)
Fig. 5.2.2bb. The variation with time of wavelength integrated luminous transmittance for
samples laid in freezer maintained at -18 °C. Fresh sample A and C, aged
sample B and D. (NB. A and B denotes oblique incidence; C and D
denotes normal incidence).
49

Fig. 5.2.2c Spectral transmittance and reflectance o f MgFz /Ag/M gFzm uttHayer fo r fresh sample and a samplecovered in Ice (fro s t) a t - 2 0 ± 1°C fo r indicated duration.

The changes observed in luminous transmittance after 12 weeks for samples kept in
freezing environment for equal duration, at different temperatures that is -10 °C (Fig.
5.2.2a;aa) and -18 °C (Fig. 5.2.2b;bb) recorded a decrement of 1.8% and 2.2%,
respectively, for oblique incidence transmittance. The luminous transmittance at
normal incidence remained constant for the entire period the samples were exposed, as
shown in figures 5.2.2aa and 5.2.2bb.
Figures 5.2.2aa and 5.2.2bb, further shows that, the rate of decrement in luminous
transmittance was higher for samples exposed at -18 °C to those exposed at -10 °C.
The difference between the fresh sample (shown by reference line A) and aged sample
(shown by line B) demonstrates this difference, in both figures.
The samples covered in ice after 12 weeks, the luminous transmittance at oblique
incidence had decreased by 3.5%. In these samples, luminous reflectance registered
the highest decrement of 7.8% for normal incidence after 12 weeks of exposure, while
luminous transmittance decreased by 0.1% for the same angle of incidence in the same
duration, as detailed in Table A6 of appendix A.
The changes observed in these samples are thought to be due to contraction of the
coating material when exposed to low temperatures. When the sample is removed to
room environment, it will tend to relax, these changes may lead to stress changes as
already explained under section 5.2.1, though of lower magnitude considering the
duration of exposure. These changes can in one way or another cause lattice defects
and defects in internal boundaries, meaning this will affect crystallographic structure
of the multilayer and whence eventually affect the optical transmittance and
reflectance of the sample (Besancon, 1986; Hoffman, 1976). The samples kept
covered in frost suffer the same effect and also micro abrasions (surface roughness) by
frost particles contribute to the changes in optical properties. Also the samples covered
in frost showed reduced reflectance a factor that was thought to be due to absorption
and scattering of the incident beam by the coating material. We did not perform total
51
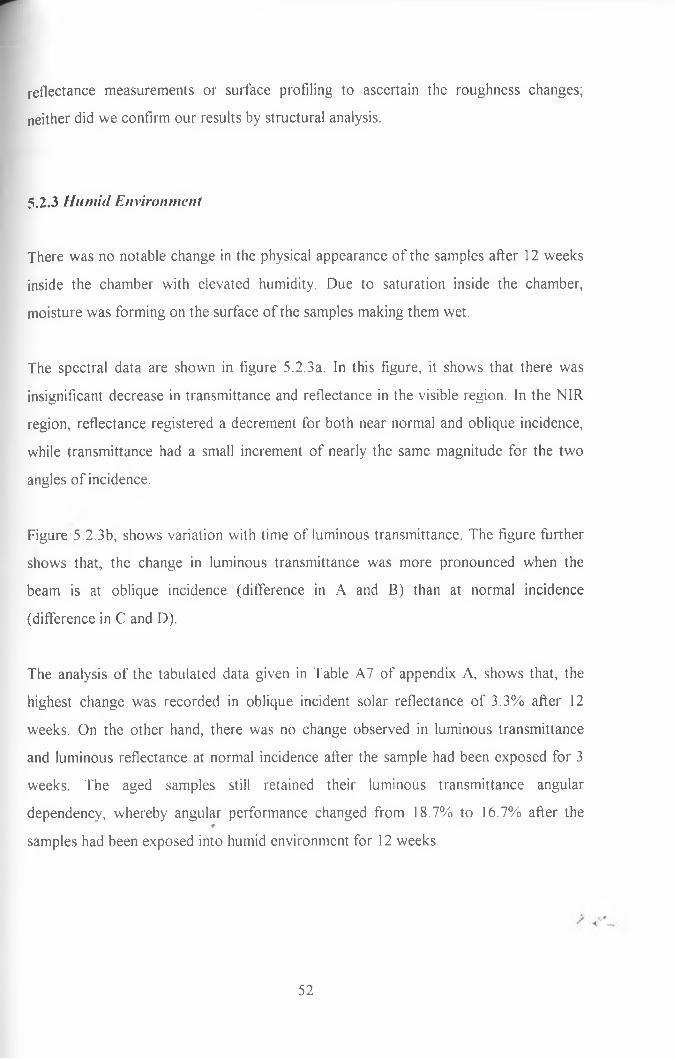
reflectance measurements or surface profiling to ascertain the roughness changes;
neither did we confirm our results by structural analysis.
5.2.3 H um id Environment
There was no notable change in the physical appearance of the samples after 12 weeks
inside the chamber with elevated humidity. Due to saturation inside the chamber,
moisture was forming on the surface of the samples making them wet.
The spectral data are shown in figure 5.2.3a. In this figure, it shows that there was
insignificant decrease in transmittance and reflectance in the visible region. In the N1R
region, reflectance registered a decrement for both near normal and oblique incidence,
while transmittance had a small increment of nearly the same magnitude for the two
angles of incidence.
Figure 5.2.3b, shows variation with time of luminous transmittance. The figure further
shows that, the change in luminous transmittance was more pronounced when the
beam is at oblique incidence (difference in A and B) than at normal incidence
(difference in C and D).
The analysis of the tabulated data given in Table A7 of appendix A, shows that, the
highest change was recorded in oblique incident solar reflectance of 3.3% after 12
weeks. On the other hand, there was no change observed in luminous transmittance
and luminous reflectance at normal incidence after the sample had been exposed for 3
weeks. The aged samples still retained their luminous transmittance angular
dependency, whereby angular performance changed from 18.7% to 16.7% after ther
samples had been exposed into humid environment for 12 weeks.
52

Tran
smitt
ance
(T
R)%
AFig. 5.2.3a Spectral transmittance and reflectance o f MgF2 /A g /M g F2 multilayer for fresh sample and samplelaid in humidity chamber maintained a t 86±1% relative humidity fo r indicated duration.
Re
fle
cta
nc
e (
RE
) %
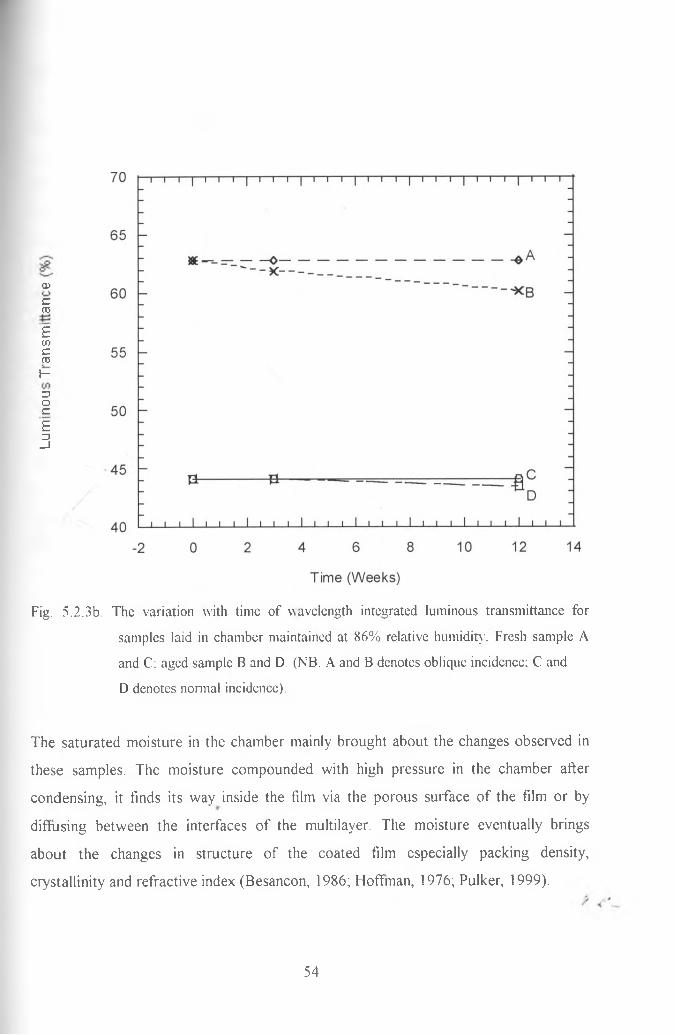
c03
<x>
ECOc03
HZ1ocEn_ l
Fig. 5.2.3b. The variation with time of wavelength integrated luminous transmittance for
samples laid in chamber maintained at 86% relative humidity. Fresh sample A
and C; aged sample B and D. (NB. A and B denotes oblique incidence; C and
D denotes normal incidence).
The saturated moisture in the chamber mainly brought about the changes observed in
these samples. The moisture compounded with high pressure in the chamber after
condensing, it finds its way inside the film via the porous surface of the film or by
diffusing between the interfaces of the multilayer. The moisture eventually brings
about the changes in structure of the coated film especially packing density,
crystallinity and refractive index (Besancon, 1986; Hoffman, 1976; Pulker, 1999).
54
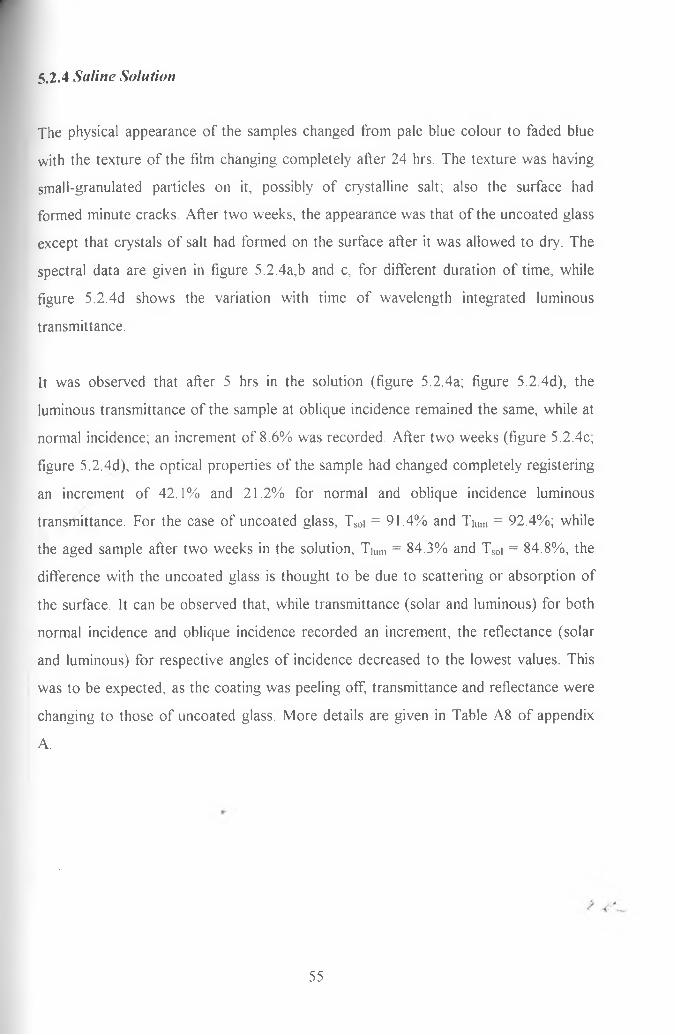
5.2.4 Salin e Solution
The physical appearance of the samples changed from pale blue colour to faded blue
with the texture of the film changing completely after 24 hrs. The texture was having
small-granulated particles on it, possibly of crystalline salt; also the surface had
formed minute cracks. After two weeks, the appearance was that of the uncoated glass
except that crystals of salt had formed on the surface after it was allowed to dry. The
spectral data are given in figure 5.2.4a,b and c, for different duration of time, while
figure 5.2.4d shows the variation with time of wavelength integrated luminous
transmittance.
It was observed that after 5 hrs in the solution (figure 5.2.4a; figure 5.2.4d), the
luminous transmittance of the sample at oblique incidence remained the same, while at
normal incidence; an increment of 8.6% was recorded. After two weeks (figure 5.2.4c;
figure 5.2.4d), the optical properties of the sample had changed completely registering
an increment of 42.1% and 21.2% for normal and oblique incidence luminous
transmittance. For the case of uncoated glass, Tsoi = 91.4% and Tium = 92.4%; while
the aged sample after two weeks in the solution, Tium = 84.3% and Tsoi = 84.8%, the
difference with the uncoated glass is thought to be due to scattering or absorption of
the surface. It can be observed that, while transmittance (solar and luminous) for both
normal incidence and oblique incidence recorded an increment, the reflectance (solar
and luminous) for respective angles of incidence decreased to the lowest values. This
was to be expected, as the coating was peeling off, transmittance and reflectance were
changing to those of uncoated glass. More details are given in Table A8 of appendix
A.
55
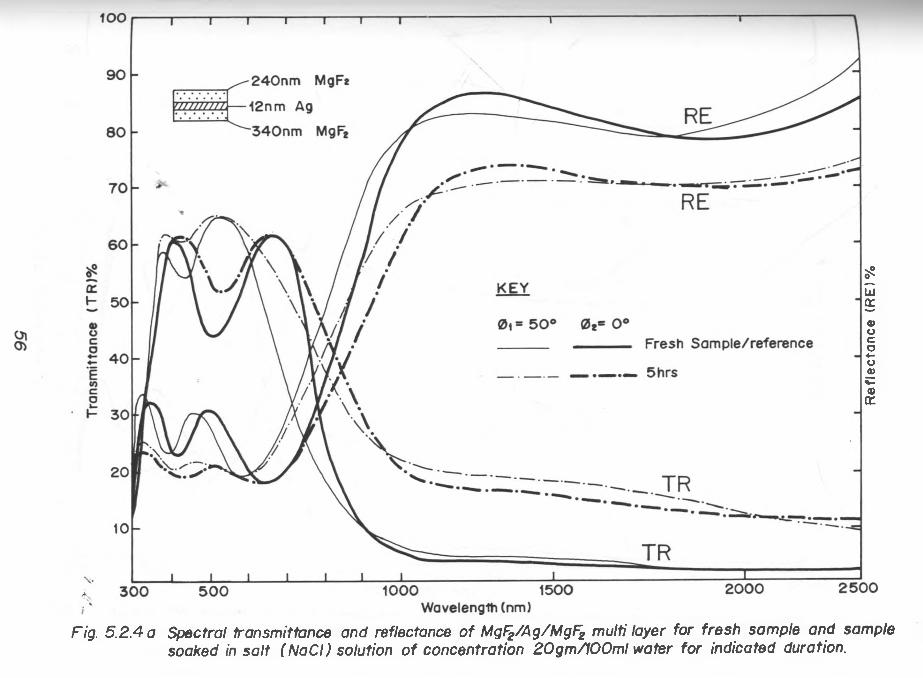
Fig. 5.2.4 a Spectral transmittance and reflectance o f MgF^/Ag/MgF2 multi layer fo r fresh sample and samplesoaked in sa lt (NaCI) solution o f concentration 2 0 gm/100ml water fo r indicated duration.
Ref
lect
ance
(R
E)%

Fig. 5.'2.4b Spectral transmittance and reflectance o f MgFz/Ag/MgFz m ultilayer fo r fresh sample andsample soaked in salt (NaCI) solution o f concentration 20 gm /1 00 m l water fo r ind icatedduration.
Ref
lect
ance
(R
E)%
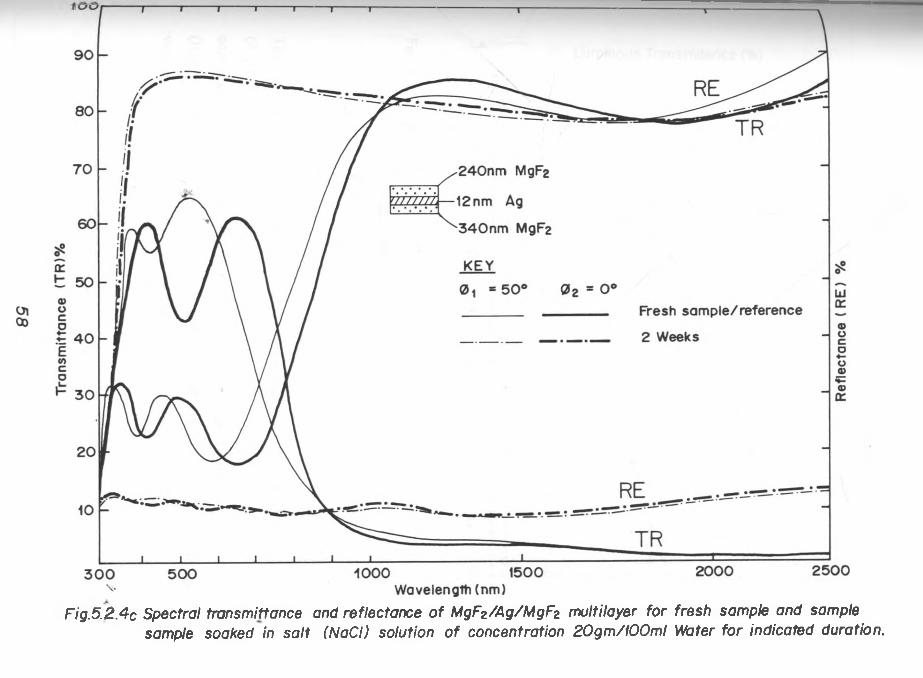
Fig.5.£.4c Spectral transmittance and reflectance o f MgFz/Ag/MgFz multilayer for fresh sample and samplesample soaked in salt (NaCI) solution o f concentration 20gm/100ml Water fo r indicated duration.
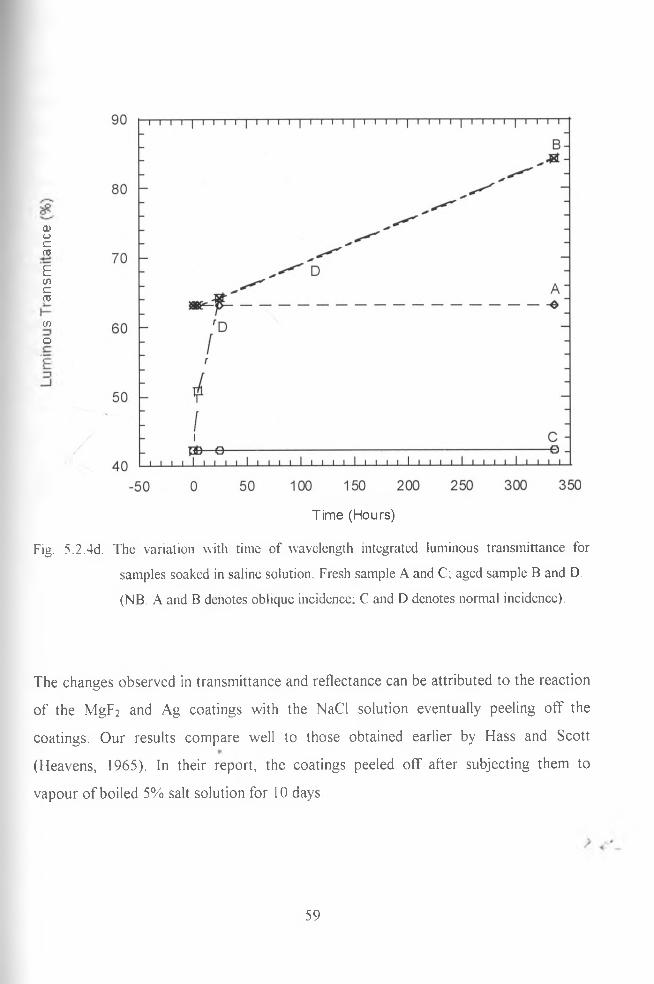
<X>0 £Z ■T?£01 c05
CO
o
Time (Hours)
Fig. 5.2.4d. The variation with time of wavelength integrated luminous transmittance for
samples soaked in saline solution. Fresh sample A and C; aged sample B and D.
(NB. A and B denotes oblique incidence; C and D denotes normal incidence).
The changes observed in transmittance and reflectance can be attributed to the reaction
of the MgF2 and Ag coatings with the NaCl solution eventually peeling off the
coatings. Our results compare well to those obtained earlier by Hass and Scott
(Heavens, 1965). In their report, the coatings peeled off after subjecting them to
vapour of boiled 5% salt solution for 10 days.
59

5.2.5 O rganic Solvents
The physical appearance of the sample remained unchanged for those soaked in
acetone, while those that were soaked in ethanol, the colour changed from pale blue
colour to light blue with yellowish colouration. The effect of acetone on the optical
properties seemed less severe as it can be observed in figure 5.2.5a; than those
samples soaked in ethanol, as shown in figure 5.2.5b.
In figures 5.2.5aa, and bb, shows the variation with time of luminous transmittance for
samples soaked in acetone and ethanol, respectively. The samples soaked in either of
the solvents retained their angular dependency with good angular performance. Those
samples that were soaked in ethanol (figure 5.2.5bb), their angular performance
decreased from 17.8% to 14.8% while those soaked in acetone (figure 5.2.5aa) it
decreased from 23.0% to 20.3%. The values for solar transmittance and reflectance
remained reasonably high for fresh and aged samples from either of the solvents as
shown in Table A9 and A10 of appendix A. The luminous reflectance registered the
highest decrement of 6.7% for normal incidence beam for samples soaked in ethanol,
while those that were soaked in acetone it was 4.4% after 96 hrs in either of the
solvents.
The above changes are thought to be as a result of photonic interband absorption thus
leading to the loss in transmittance (Mark and Scalora, 1998). The reflectance is
thought to have been affected by the surface scattering, though our work did not touch
the area o f investigating total reflectance measurements and surface profiling which
could have established whether the loss was due to scattering. At the time of
presenting these results, no documented work similar to this was available to the
author for possible comparison, although Pulker (1999) has suggested use of organic
solvents for degradation study.
60

Fig. 5.2.5a Spectral transmittance and reflectance o f MgFz /Ag/M gF2 multilayer for fresh sample and asample soaked in acetone o f pu rity 99 .8% for indicated duration.
Ref
lect
ance
(R
E)%

Lum
inou
s Tr
ansm
ittan
ce (
%)
Time (Hours)
Fig. 5.2.5aa. The variation with time of wavelength integrated luminous transmittance for
samples soaked in acetone. Fresh sample A and C; aged sample B and D.
(NB. A and B denotes oblique incidence; C and D denotes normal incidence).
62
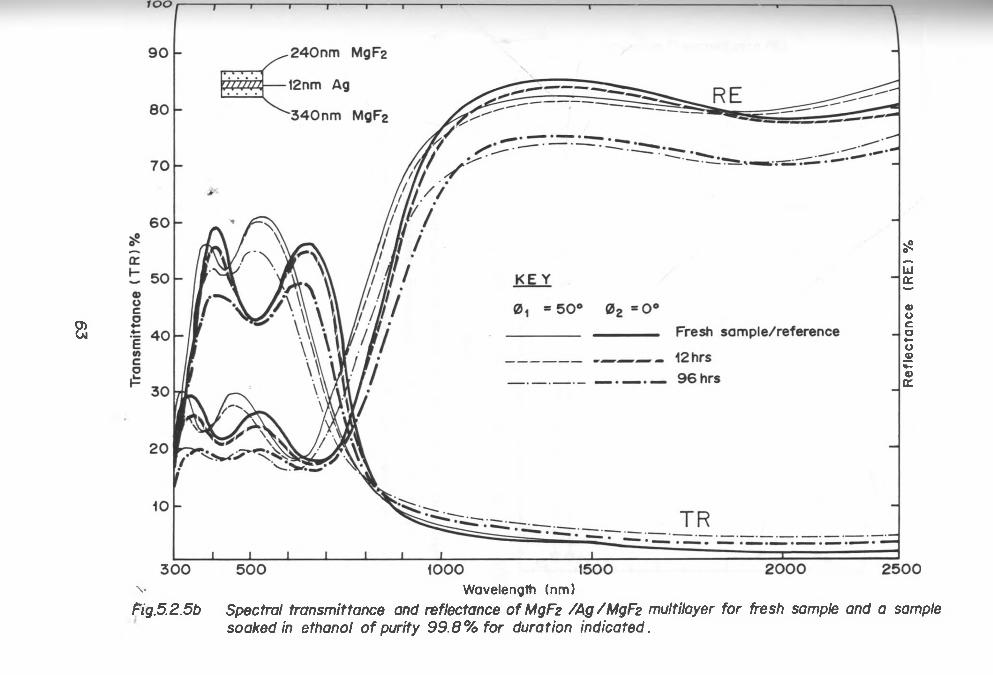
a
v Wavelength (nm)Fig.5.2.5b Spectral transmittance and reflectance of MgFz /Ag/MgFz multilayer for fresh sample and a sample
soaked in ethanol of purity 99.8% for duration indicated.
Ref
lect
ance
(R
E)
%
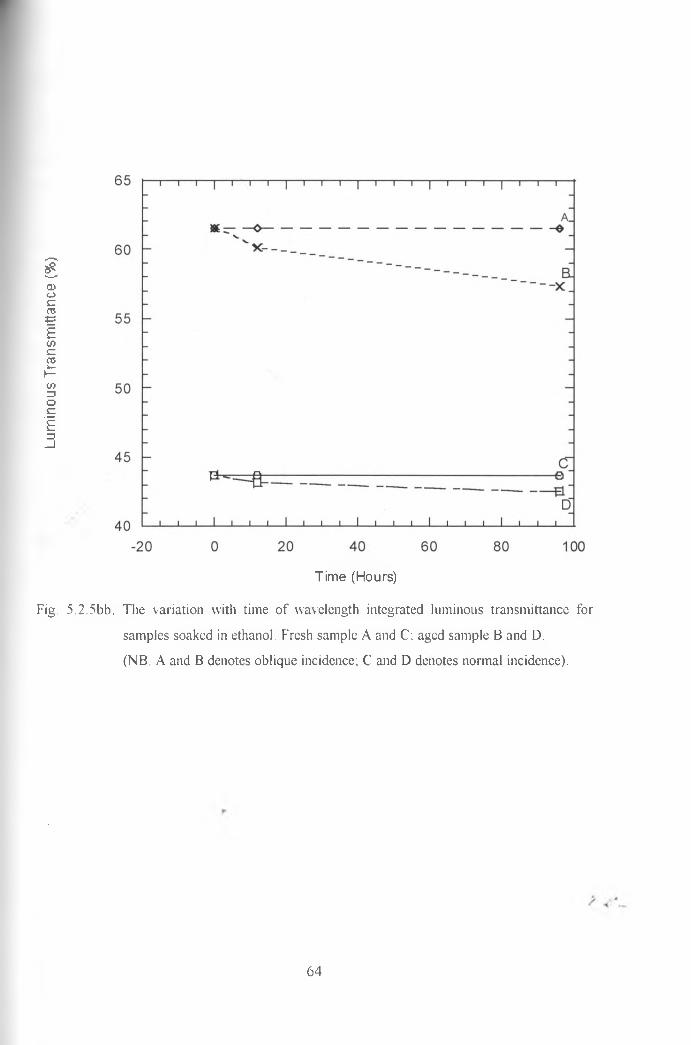
Lum
inou
s Tr
ansm
ittan
ce (
%)
Time (Hours)
Fig. 5.2.5bb. The variation with time of wavelength integrated luminous transmittance for
samples soaked in ethanol. Fresh sample A and C; aged sample B and D.
(NB A and B denotes oblique incidence; C and D denotes normal incidence).
64

5.2.6 O utdoor E nvironm ent
The spectral results obtained for samples exposed into the outdoor environment are as
shown in figure 5.2.6a. Figure 5.2.6b, shows the quantitative variation with time of
luminous transmittance of the samples.
In figure 5.2.6b, it can be observed that the rate of change in luminous transmittance
was highest in the first four weeks the samples were exposed, especially when we
consider the oblique incidence transmittance (i.e. difference in A and B). At normal
incidence transmittance, observable change was between the 4th week to 12th week
(difference in C and D).
The analysis of the results show that, transmittance (luminous and solar) and
reflectance (luminous and solar) registered a decrement ranging between 0.2% - 8.3%,
except for the luminous transmittance at normal incidence, which remained constant
as detailed in table A ll of appendix A. After the sample had been exposed for
duration of 12 weeks, the oblique incidence luminous transmittance of the sample had
decreased by 3.7% while the luminous reflectance of the sample at normal incidence
decreased by 8.3% in the same duration. At oblique angle, solar reflectance remained
more than 50%, with the samples still maintaining a 60% luminous transmittance.
The changes in transmittance and reflectance of the samples are thought to be due to
the effect of the weather conditions. Degradation due to air pollutants such as sulphur
dioxide (sulphur dioxide forms weak acids which leads to reaction with the surface
coating), which exists in small parts per billion, can play a substantial role, especially
because of the existence of industries (Brunold, et. al., 2000). Moreover, the water
vapour in the coastal regions contains small percentages of NaCl whose effect werer
discussed under section 5.2.4.
65
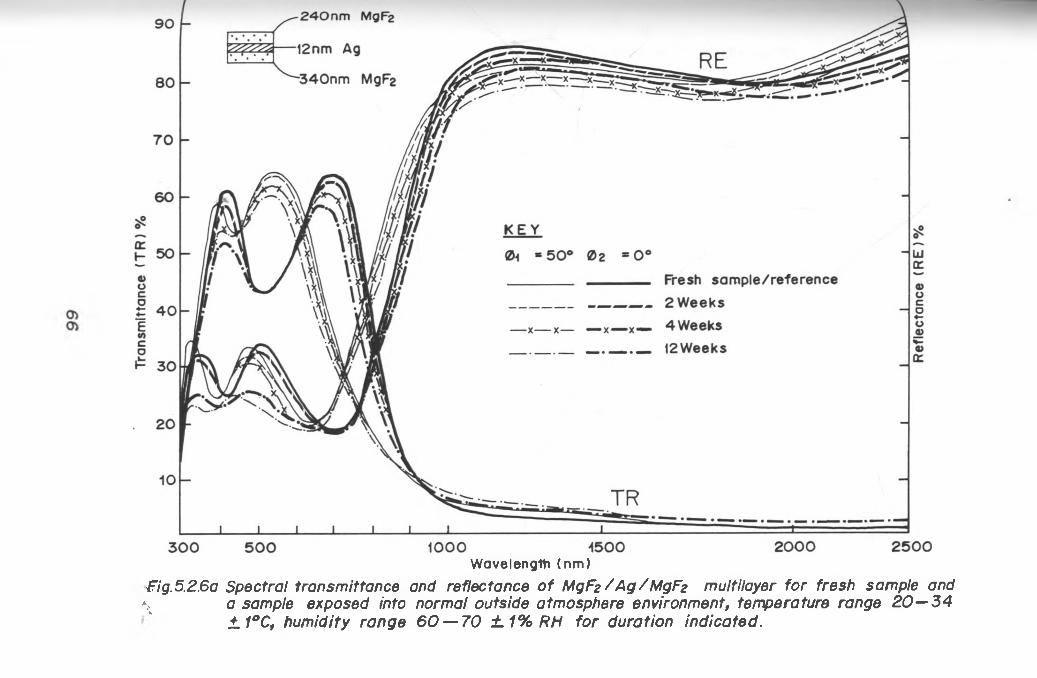
Wavelength (nm)
Fig.5.2.6a Spectral transmittance and reflectance o f MgFz/Ag/MgFz multilayer for fresh sample and \ a sample exposed into normal outside atmosphere environment, temperature range 2 0 —34
L1°C, humidity range 60 — 70 ± 1 % RH fo r duration indicated.
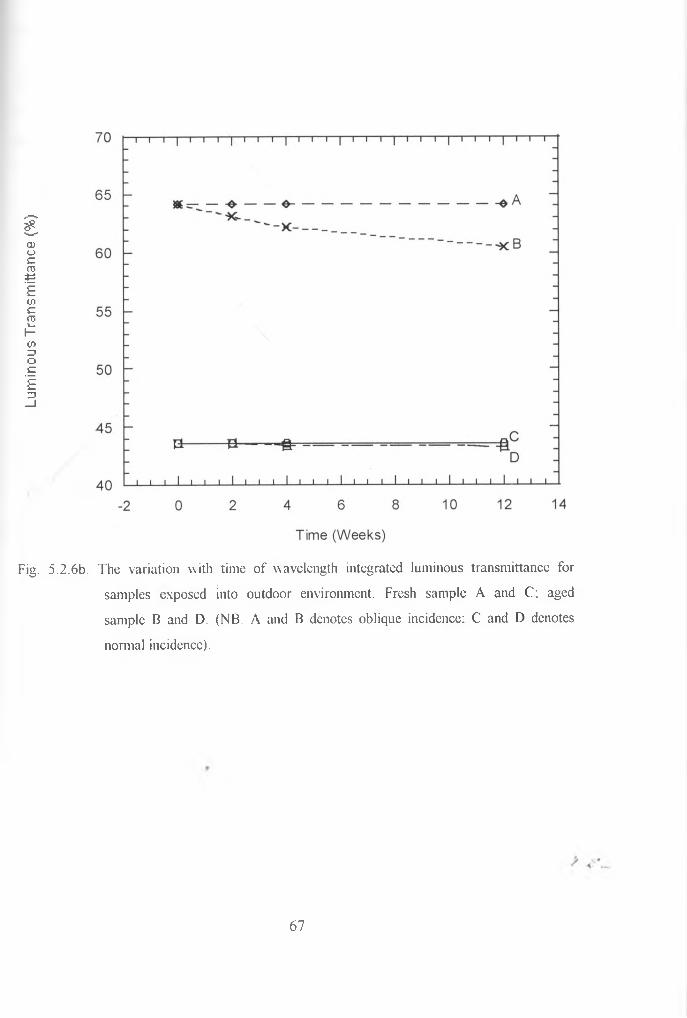
Lum
inou
s Tr
ansm
ittan
ce (
%)
Fig. 5.2.6b. The variation with time of wavelength integrated luminous transmittance for
samples exposed into outdoor environment. Fresh sample A and C; aged
sample B and D. (NB. A and B denotes oblique incidence: C and D denotes
normal incidence).
67
5.2.7 A quatic Condition
The spectral results obtained after exposing the sample into aquatic environment for
three weeks are as shown in figure 5.2.8a. Both transmittance and reflectance
decreased in the visible region while in the NIR region, reflectance showed decrement,
but transmittance had a small increment.
In the visible region, the oblique incidence luminous reflectance remained constant for
fresh and aged sample; also for the same angle of incidence, a decrease of 1.6% was
observed for luminous transmittance (figure 5.2.8b) after the sample had been soaked
for 504 hrs (3 weeks). The reflectance in the visible region, at oblique incidence
remained constant also for fresh and aged samples, respectively, while a 4.7% change
was noted in the normal incidence reflectance. The other factors, i.e. Tsoi and Rsoi
registered -1.5% decrease as detailed in Table A12 of appendix A.
The changes observed in transmittance and reflectance are thought to be due to the
changes in surface roughness and porosity of the coating after being exposed into
aquatic environment. The increase in surface roughness leads to scattering, which
brings about the optical changes. Our results were not confirmed by total reflectance
measurement to conclusively say the scattering of the sample is the main cause of the
difference. From the results obtained, we can say that water does not easily penetrate
the magnesium fluoride coating, because, if it could have soaked in the material,
swelling of the layers could have resulted with changes of great magnitude, since
thickness will be completely altered; void fraction will also have been adversely
affected and the entire crystal structure.
68
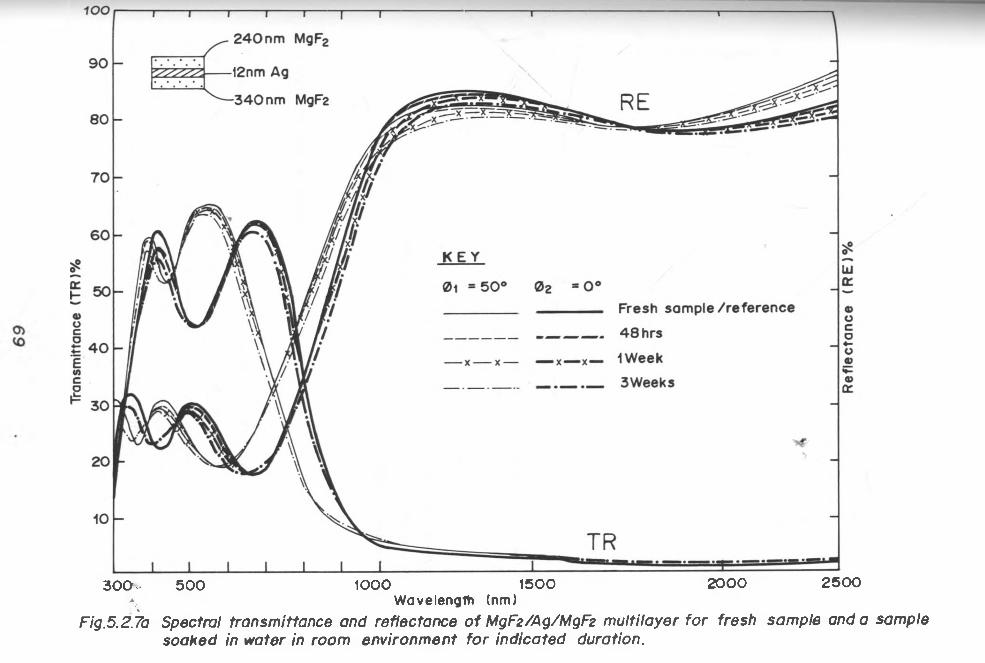
300- 500 1000 1500 2000 2500-V Wavelength (nm)%
Fig.5.2.7a Spectral transmittance and reflectance of MgFz/Ag/MgFz multilayer fo r fresh sample and a sample soaked in water in room environment for indicated duration.
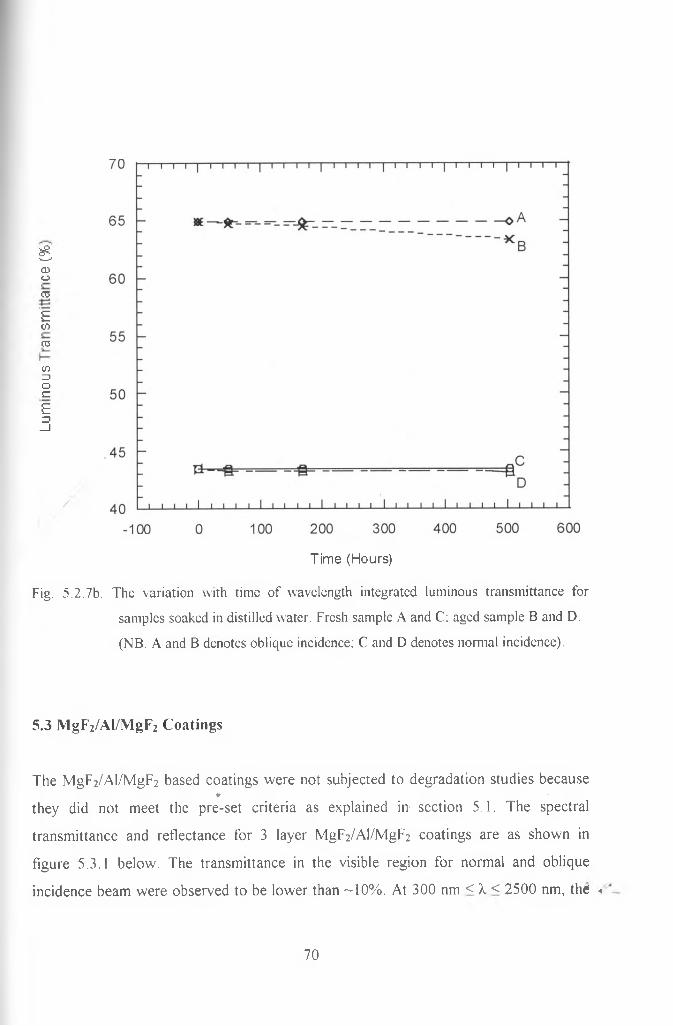
£CDo03
£CO
03
CO=1oc£n_ l
/
Time (Hours)
Fig. 5.2.7b. The variation with time of wavelength integrated luminous transmittance for
samples soaked in distilled water. Fresh sample A and C; aged sample B and D.
(NB. A and B denotes oblique incidence; C and D denotes normal incidence).
5.3 MgF2/Al/MgF2 Coatings
The MgF2/Al/MgF2 based coatings were not subjected to degradation studies becauser
they did not meet the pre-set criteria as explained in section 5.1. The spectral
transmittance and reflectance for 3 layer MgF2/Al/MgF2 coatings are as shown in
figure 5.3.1 below. The transmittance in the visible region for normal and oblique
incidence beam were observed to be lower than ~10%. At 300 nm < X < 2500 nm, thes «.
70
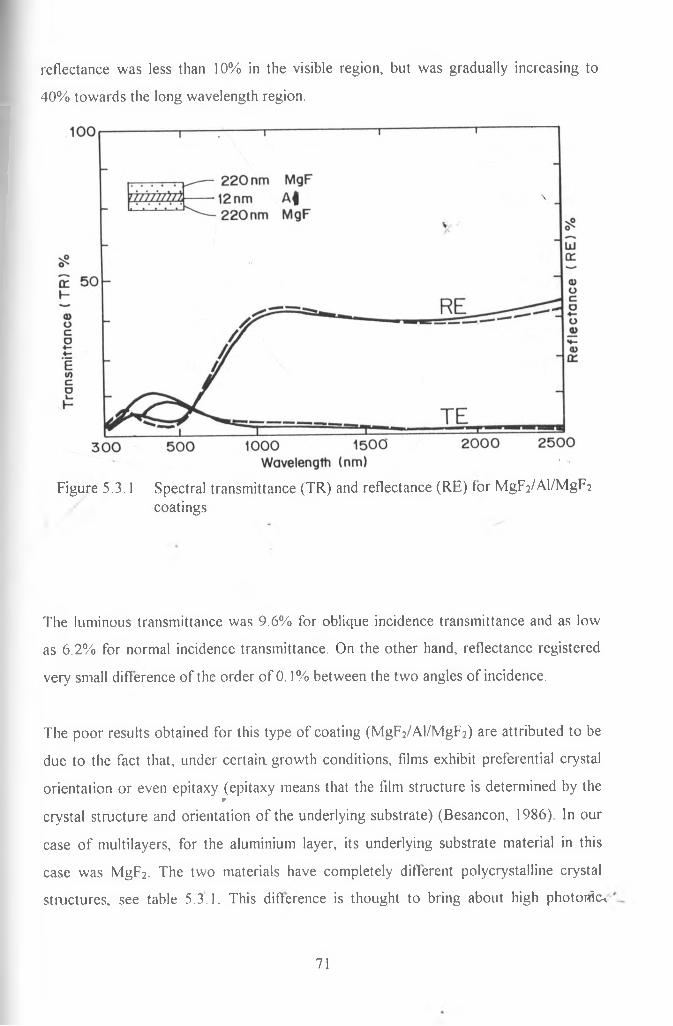
reflectance was less than 10% in the visible region, but was gradually increasing to
40% towards the long wavelength region.
Figure 5.3.1 Spectral transmittance (TR) and reflectance (RE) for Mgp2/Al/MgF2 coatings
The luminous transmittance was 9.6% for oblique incidence transmittance and as low
as 6.2% for normal incidence transmittance. On the other hand, reflectance registered
very small difference of the order of 0.1% between the two angles of incidence.
The poor results obtained for this type of coating (MgF2/Al/MgF2) are attributed to be
due to the fact that, under certain growth conditions, films exhibit preferential crystal
orientation or even epitaxy (epitaxy means that the film structure is determined by ther
crystal structure and orientation of the underlying substrate) (Besancon, 1986). In our
case of multilayers, for the aluminium layer, its underlying substrate material in this
case was MgF2. The two materials have completely different polycrystalline crystal
structures, see table 5.3.1. This difference is thought to bring about high photonic*
71

interband absorption especially in aluminium metal (Mark and Scalora, 1998). The
other losses can be attributed to scattering of the surface material.
Table 5.3.1. Material type used in this work with respective crystal structure and density
(Besancon, 1986; Pulker, 1999).
Material Crystal structure Density g/cnr
A1 cub 2.70
Ag fee 10.49
MgF2 tetr 2 .9 -3 .2
T i0 2 (iv) Rutile tetr 4.23
Anatase tetr 3.90
Brookite rho 4.13
Where: cub - cubic; fee - face centrered cubic; tetr - tetragonal; rho - rhombic.
5.4 TiC>2 Based Coatings
The TiC>2 based coatings can suitably be deposited by reactive evaporation, whereby
reactive gas is introduced inside the chamber during deposition of Ti followed by
annealing at high temperature.
The physical appearance of the TiC>2 based coatings was darkish; when the samples
were annealed (in air) in an oven maintained at 400 °C, the colour changed to milkish
with some black color still visible. The spectral transmittance and reflectance for the
Ti02/Ag/Ti02 and Ti02/Al/Ti02 samples are as shown in figures 5.4.1 and 5.4.2,
respectively.
The Ti02/Ag/Ti02 samples were observed to transmit luminous transmittance of
approximately 52% and 50% at oblique and normal incidence transmittance,
respectively. There was small but noticeable difference in transmittance and' /■'.
72

reflectance between the normal incidence and oblique incidence as illustrated in figure
5.4.1. The TiCVAl/TiCh coatings were transmitting as little as ~18% in the luminous
region, while in the N1R region, the transmittance was decreasing gradually towards
the long wavelength region. The Ti02/Al/Ti02 coating registered small, but defined
difference in transmittance and reflectance for oblique and normal incidence of
approximately 0.5% - 1%.
The results predicted by theory (Granqvist, 1991) for TiCVAg/TiC^ are as shown in
figure 5.4.3. Because of the stoichometry of TiC>2, the shapes predicted by theory are
difficult to obtain and furthermore, theory considers ideal case whereas empirically
other factors may influence the end results (Besancon, 1986), e g. rate of deposition,
condition of the deposition chamber and even the substrate temperature whether pre
and in process annealing (insitu) or post annealing (exsitu), in both cases, TiC>2 is
known to change when deposited at different substrate temperature Ts, see Table, 5.4.1
below.
Figure 5.4.1 Spectral transmittance (TR) and reflectance (RE) for T i02/Ag/Ti02 coatings
73

Figure 5.4.2 Spectral transmittance (TR) and reflectance (RE) for T1O2/AI/T1O2 coatings
/
Tabic 5.4.1. Properties of TiCT at different substrate temperature (Pulkcr, 1999)
Substrate temperature, Ts Observations
Ts < 280 °C Diffuse electron diffraction pattern i.e. amorphous
T i02 films
Ts > 3 10 °C Sharp diffraction pattern, polycrystalline T i0 2 films
contain rutile and anatase
Ts = 380 to 470 °C
e
Sharp diffraction fringes, polycrystalline T i0 2 films
consisting purely of rutile.
From Table 5.3.1, we notice that, tetragonal crystal structure combined with cubic
crystal structure give marked low transmittance (less than 50%) as it is observed Arv'.„
74
figure 5.3.1 and 5.4.2, respectively. According to Mark and Scalora, (1998) the losses
in incidence energy, can be ascribed to photonic interband absorption as the incidence
photon makes transition between the two completely different polycrystalline
materials a feature which is not observed between tetragonal and face centrered cubic
crystals.
By the time this work was compiled, the author had only come across one report done
by John and Bachner (1976) for multilayer of Ti02/Ag/Ti02 (figure, 5.4.4). This is an
experimental study for non-angular dependent coating. The method used in preparing
the films was rf-sputtering at a substrate temperature of 600 °C. Current study did not
investigate whether sputtering produces better samples than evaporation.
75

Tran
smitt
ance
/ref
lect
ance
(%
) 32
Tr
ansm
lttan
ce/r
efle
ctan
ce (
%!
re 5.4.3 Spectral normal transmittance ( I K) and near normal reflectance (RF)
lor I i02/AI/Ti02 coatings (Granqvist, 1991)
Wavelength (nm)
Figure 5.4.4 Measured optical transmittance ( I K) and reflectance (RF) of a I I it h
film on Corning 7059 glass (John and Baclmer, 1976)76

CQ CHAPTER SIX CQ
CONCLUSION AND SUGGESTIONS FOR FURTHER STUDIES
6.1 Conclusion
The study of multilayer coatings exhibiting angular dependent transmittance has been
investigated. Among the layer combinations studied, MgF2/Ag/MgF2 based coatings
have been found to display the best angular dependent transmittance.
The coatings displaying angular dependent transmittance have been subjected to
degradation studies. Some factors have been identified as the possible causes of
degradation of optical properties. The factors can be classified as (i) natural factors,
which include: - temperature (high and low), humidity, aquatic (damp) environment
and saline environment (ii) man made factors, which include cleaning agents. The
process of degradation study was divided into accelerated test and non-accelerated
study. In accelerated studies, the samples were subjected to extreme conditions, while
in non-accelerated studies; the samples were exposed to natural conditions.
It has been established that multilayer coatings of MgF2/Ag/MgF2 are severely
affected by high concentration of NaCl, and are reasonably resistant to concentrated
organic solvents. From the results, it can be deduced that, multilayer coatings are
insignificantly affected by such factors such as: temperature (high or low), elevated
humidity, aquatic conditions or when exposed to natural environment.
From the various studies conducted, it is propably that the main cause of degradation
in coating materials can be attributed to (i) change in packing density (void fraction)
which mainly affects: the refractive index, stress, geometrical and optical thickness
and homogeneity of the film (ii) change in crystallinity (amount of defects a,nd,
dislocation) of the film (iii) change in surface in surface morphology leading to
77
increased scattering (iv) the effect of atmospheric pollutants such as sulphur dioxide
and also the presence of NaCl in the moisture, (v) Chemical compatibility with
organic solvents is also a factor. These factors lead to changes in optical properties of
the multilayer film.
We can also conclude that, the MgF2/Ag/MgF2 multilayer coatings exhibiting angular
dependent transmittance can be used for energy efficient window coating because they
have the following characteristics (i) stability against weather condition (ii) high
transmittance in the luminous region (iii) angular dependency (iv) infrared filter, thus
satisfying the objective of energy efficiency in window.
6.2 Suggestions for Further Studies
The following studies should be conducted as continuation of this work.
1. Structural characterization of the samples by use of: Surface profiler, Atomic
Force Microscopy, Transmission Electron Microscopy (TEM), Scanning Electron
Microscopy (SEM), X-Ray Diffraction (XRD) etc. The suggested studies ageing
process, i.e. the changes that occur in packing density, crystallographic structure
(amount of defects and dislocation), roughness in internal boundaries, surface
roughness, grain size and shape will be better understood, thereby explain the ageing
process.
2. Try to develop a model for predicting the ageing of coatings. This can be done
by considering: (i) pre-set environment in which the coatings stay (ii) the structural
change leading to observed change in optical spectra. Parameterization of the the
changes can then be modeled. The advantage of such a model is that, service life will
be easily predicted without waiting for the long duration common when conducting
long term degradation studies.
78

3. Study transmissive properties of MgF2/Al/MgF2 and Ti02/Al/Ti02 coatings’
photonic band gaps. Other dielectric materials with different polycrystalline structure
should also be included in the multilayer combinations so that a detailed study is
obtained. Such a study will assist in understanding the reason why materials of cubic
and tetragonal polycrystalline structure have low transmittance when coated together
as multilayer, and try to suggest alternatives to overcome this problem.
79
REFERENCES
Born, M. and E. Wolf (1975). Principals o f Optics. Pergamon Press, Oxford.
Behrens, H. and G. Ebel (1981). Optical Properties o f Metals^ Physics Data, vol. 2.
Academic Press, New York.
Behrndt, K.H. (1964). Thin Film, American society for metals, Metals park, Ohio.
Besancon, R.IV1. (1986) Ed. The Encyclopedia o f Physics, Van Nostrand Reinhold
Company, New York.
Brunold, S., U. Frei, B. Karlsson, K. Moller and M. Kohl (2000) Accelerated Life
Testing of Solar Absorber Coatings, Solar Energy’, 68, 313,
Catalan, L.A. (1961). Some Computed Optical Properties of Antireflection Coating,
Journal o f Optical Society o f America, 52 (4), 437./
Coleman, R.V. (1978). Method o f Experimental Physics. Solid State Physics, Vol. II,
p 620 -665, Academic Press, New York.
Cox, J.T., G. Hass and R.F. Rowntree (1954). Two Layer Antireflection Coatings for
Glass in the Near Infrared, Journal o f Optical Society o f America, IV. (4), 445.
Cox, J.T., G. Hass and A. Thelen (1962). Triple Layer Antireflection Coatings on Glass
For the Visible and Near Infrared, Journal o f Optical Society o f America, 3 (9),
965.
rDriscoll, W .G. and W. Vaughan (1978). Handbook o f Optics, McGraw Hill, New
York.
80

Granqvist, C.G., (1984). Compendium Notes for Solar Energy Materials, Pergamon,
Oxford.
Granqvist, C.G. (1989). Spectrally Selective Surfaces for Heating and Cooling
Applications, Tutorial texts in Optical Engineering, Vol. TTJ, SP1E, Bellingham.
Granqvist, C.G. (1991). In Energy Efficient Windows: Present and Forthcoming
Technology, edited by C.G. Granqvist, Material Science for Solar Energy
Conversion System. Pergamon, Oxford.
Granqvist, C.G. (1995). Handbook o f Inorganic Electrochromic Materials,
Elsevier, Amsterdam.
Heavens, O.S. (1965). Optical Properties o f Thin Solid Films, Dover publications, Inc.,
New York.
Hilger, A. (1986). Thin Film Optical FiltersL 2"d ed., Bristol, Bristol.
Hoffman, R.W. (1976) Stresses In Thin Film: Relevance of Grain Boundaries and
Impurities, Thin Films, 34, 180.
John, C.C. and F.J. Bachner (1976). Transparent Heat Mirrors for Solar Energy
Applications, Applied Optics, 15(4), 1012.
Johnson, P.B. and R.W. Christy (1972). Optical Constants of Noble Metals*
Physics Review, B 6, 4370.
rJohnson, P.B. and R.W. Christy (1974). Optical Constants of Transition
Metals: Ti, V, Cr, Mn, Fe, Co, Ni and Pd, Physics Review, B 9, 5056.
>
81
Karlsson, J. and A. Roos (2000) Modelling the Angular Behaviour of the Total
Solar Energy Transmittance of Windows. Solar Energy, 69 (4) 321.
Karlsson, J., M. Rubin and A. Roos (2001) Evaluation of Predictive models for
The Angle Dependent Total Solar Energy Transmittance of Glazing materials
Solar Energy, 71 (1) 23.
Kazem, M.J., J.A. Woollan and A. Belkind (1988). Variable Angle of Incidence
Spectroscopic Ellipsometric Characterization. Journal o f Applied Physics,
64 (7), 3407.
Rivaisi, R.T. (1976). Selective Absorbing Coalings for Photo-Thermal Solar Energy>
Conversion and Some Useful Factors in the Design o f Flat Solar Collectors,
M.Sc. Thesis, University of Dar es Salaam, Dar es Salaam, Tanzania.
Kivaisi, R.T. (1982). Optical Properties of Obliquely Evaporated Aluminium,
Thin Solid Films, 97, 153.
Ling, S.D. and W. Cheng (1987). Design and Test of Coatings Deposited on Window
Glass for Energy Efficiency, Optik, 78 (3), 87
Mark, J. B. and M. Scalora (1998). Transmissive Properties of Ag/MgF2 Photonic
Band gaps, Applied Physics Letters, 72 (14) 1575.
Mbise, G.W. (1989). Angular Selective Window Coatings: Some Theoretical and
Experimental Studies. M.Sc. Thesis, University of Dar es Salaam,
Dar es Salaam, Tanzania.
Mbise, G.W. (1995). Optical and Structural Properties o f Obliquely Evaporated Thin
Films, Ph D. Thesis, University of Dar es Salaam, Dar es Salaam, Tanzania.
82
Mbise, G.W. (1998). Spectral and Angular Selective Surfaces. Proc. Fifth College
On Thin Film Technology, Vol. 5.7 ( Dar es Salaam, Tanzania).
Mbise, G.W. and R.T. Kivaisi (1993). Angular Dependent Transmittance
in Multilayer Coating,. Solar Energy M aterials an d Solar cells, 30, 1.
Mbise, G.W., D. Le Bellae., G.A. Niklasson and C.G. Granqvist (1997).
Angular Selective Window Coatings: Theory and Experiment. Journal
Physics, D: A pplied Physics, 30, 2103.
Mbise, G.W., G.B. Smith, G.A. Niklasson and C.G. Granqvist (1989a)
Angular Selective Optical Properties of Cr Films Made by Oblique Angle
Evaporation. A pplied Physics Letter, 54, 987.
Mbise, G.W., G.B. Smith, G.A. Niklasson and C.G. Granqvist (1989b).
Optical Materials Technology for Energy Efficiency and Solar Conversion,
VIII. Proc. SPIE (San Diego, California), 1149, 179
Mbise, G.W., G.B. Smith, and C.G. Granqvist (1989c). High Resolution Studies of
Columnar Growth in Obliquely Deposited Metal Films. Thin Solid Films, 174,
L123.
Mbise, G.W., T. Otiti and R.T. Kivaisi (1990). Angular and Selective Coatings with
Induced Transmission. Proc. lsl World Renewable Energy Congress, Reading,
UK.
Meinel, A.B. and M.P. Meinel (1979). A pplied Solar Energy, An Introduction. Addisonr
Wesley, Massachusetts.
Mwamburi, M (2001). Program Moonraker 7, Private Communication.
83

Nestel Jr, J.E. and R.W. Christy (1980). Optical Conductivity of bcc Transition
Metals: V, Nb, Ta, Cr, Mo, W. Physics Review, B 21, 3173.
Palik, E.D. (1985). Ed., Handbook o f Optical Constants for Solid Part l ,
Academics Press, New York.
Pulker, H.K. (1999). Coating on Glass, Elservier, Amsterdam.
Randlett, M., E. Stroberg and K.L. Chopra (1966). Mechanical System of Multiple
Film Deposition, Review o f Scientific Instruments, 37, 1378.
Rubin, M., R. Powles and K. von Rottkay (1999). Models for the Angle Dependent
Optical Properties of Coated Glazing Materials, Solar Energy 66, (4) 267.
Rubin, M., R. Powles and K. von Rottkay (1998). Window Optics, Solar Energy1
62, (8) 149.
Ruguinamu, H. (2001) Humidity Simulation Using CaCl or NaOH, Private
Communication
Smith, G.B. (1989). Theory of Angular Selective Transmittance in Obliquely
Columnar Thin Film Containing Metal and Void, Applied Optics, 29, 3685.
Turbadar, T. (1964a). Equi - Reflectance Contours of Double Layer A nti-
Reflectance Coatings, Optical Acta., 11, 159.
Turbadar, T. (1964b). Equi - Reflectance Contours of Triple Layer Anti -
Reflectance Coatings, Optical A eta., 11, 195.
Tremblay, C., F. Rhealt, R. Boulay and R. Tremblay (1987) Angular Dependent
Total Internal Reflector, Applied Optics, 26, 570. / y '
84
Valkonen, E. and C.G. Ribbing (1984). Optical Selectivity of Thin Silver Films
Prepared By rf Assisted dc Magnetron Sputtering, Material Letters, 3, 29.
Valkonen, E. and B. Karlsson (1985). Optimization of Metal Based Multilayer for
Transparent Heat Mirrors, Proc. ICPT, Stockholm, Sweden.
85

A P P E N D I X A : T A B U L A T E D O P T I C A L P R O P E R T I E S O FM g F 2/ A g / M g F 2 M U L T I L A Y E R C O A T I N G S
N.B. N = New (Fresh) sample, A = Aged sample. 0 = 0° (normal incidence)0 = 50° (oblique incidence)
Table Al. Changes in optical properties for samples heated at 50 °C for duration shown.
T lu m R-lum T Sol C o l
Time(hrs)
N A N A N A N A
oOIIQ
12h 44.3 43.7 25.6 23.5 31.6 30.0 51.3 50.172h 44.3 43.4 25.6 23.5 31.6 29.6 51.3 49.7120h 44.3 43.1 25.6 21.8 31.6 29.4 51.3 49.5
0 =
50°
12h 63.4 62.6 20.0 20.0 28.3 26.8 55.6 54.872h 63.4 62.1 20.0 20.0 28.3 26.6 55.6 54.3120h 63.4 61.9 20.0 20.1 28.3 26.5 55.6 54.0
Table A2. Changes in optical properties for samples heated at 100 °C for duration shown.
T lu m R-lum T so i C o l
Time(hrs)
N A N A N A N A
0 = 0° 12h 41.6 41.6 28.3 26.7 30.1 28.2 50.4 49.0120h 41.6 40.8 28.3 23.1 30.1 27.8 50.4 48.1
0 =50°
12h 60.8 59.4 20.1 20.1 27.8 26.1 54.4 52.8120h 60.8 58.1 20.1 19.2 27.8 25.7 54.4 51.8
Table A3. Changes in optical properties for samples heated at 200 °C for duration shown.
T lum R lu m T so i C o l
Time(hrs)
N A N A N A N A
0 = 0 °
12 46.8 46.8 29.4 26.2 30.9 29.0 51.1 49.036 46.8 46.2 29.4 24.7 30.9 28.7 51.1 48.696 46.8 ' 44.9 29.4 22.1 30.9 28.4 51.1 48.3
^
II 12 61.9 60.7 19.7 19.7 27.8 25.6 55.2 52.436 61.9 58.6 19.7 19.7 27.8 25.4 55.2 52.296 61.9 57.8 19.7 19.1 27.8 23.1 55.2 51.9
/ <■'...
86

Table A4. Changes in optical properties for samples laid in freezer maintained at -10 °C forduration shown.
T him R lu m T so i Elsol
Time(weeks)
N A N A N A N A
0 = 0°1 wk 44.1 44.1 34.8 33.6 31.6 30.9 50.6 48.94 wk 44.1 44.1 34.8 33.0 31.6 30.7 50.6 48.512 wk 44.1 4 4 . 1 34.8 30.8 31.6 30.5 50.6 48.2
0 =
50°1 wk 64.7 63.9 20.2 20.2 28.1 27.5 55.4 54.84 wk 64.7 63.5 20.2 20.2 28.1 27.1 55.4 54.512 wk 64.7 62.9 20.2 20.2 28.1 26.9 55.4 54.3
Table A5. Changes in optical properties for samples laid in freezer maintained at -18 °C for duration shown.
T him R lu m T so i *-sol
Time(weeks)
N A N A N A N A
0 = 0°1 wk 42.7 42.7 27.2 26.8 31.4 30.8 50.3 48.94 wk 42.7 42.7 27.2 26.1 31.4 30.1 50.3 48.612 wk 42.7 42.7 27.2 25.4 31.4 29.8 50.3 48.5
cn Q
^
II 1 wk 63.8 63.1 1 9 . 8 20.1 28.0 26.6 55.3 54.3
4 wk 63.8 62.3 1 9 . 8 20.1 28.0 26.3 55.3 53.912 wk 63.8 61.6 19.8 20.1 28.0 26.2 55.3 53.6
Table A6. Changes in optical properties for samples covered in ice (frost) at -20 °C for duration shown.
T him R lu m T soi ^-sol
Time(hrs)
N A N A N A N A
0 = 0 ° 12 wk 43.5 43.4 27.4 19.6 31.5 27.9 51.5 47.9
" b
12 wk 64.6 61.1 19.6 18.2 28.4 27.0 56.1 52.8
<■ ...
87

Table A7. Changes in optical properties for samples laid in chamber maintained at 86% relativehumidity for duration shown
T iu m R |u m T so i Tsoi
Time(weeks)
N A N A N A N A
ooIIQ
3 wks 44.1 44.1 26.3 25.2 33.4 32.1 51.4 49.612 wks 44.1 43.5 26.3 24.1 33.4 30.9 51.4 48.2
0 =
50°3 wks 62.8 61.9 22.1 22.1 31.1 29.6 54.9 53.212 wks 62.8 60.2 22.1 20.9 31.1 28.3 54.9 51.6
Table A8. Changes in optical properties for samples soaked in saline solution of concentration 20gm/100ml. for duration shown.
T lum R lu m T so i Iso l
Time(hrs)
N A N A N A N A
Q ii o
5 hrs 42.2 50.8 27.5 19.4 32.6 39.2 51.8 45.224 hrs 42.2 64.3 27.5 16.5 32.6 51.4 51.6 16.72 wks 42.2 84.3 27.5 11.6 32.6 84.8 51.8 8.2
0 =
50°5 hrs 63.1 63.1 21.8 19.4 28.7 39.4 55.7 44.8
24 hrs 63.1 64.3 21.8 16.8 28.7 84.8 55.7 8.22 wks 63.1 84.3 21.8 11.6 28.7 84.8 55.7 8.2
Table A9. Changes in optical properties for samples soaked in acetone of purity 99.8% for duration shown
T lum R lu m T so i T;oi
Time(hrs)
N A N A N A N A
Q ii o o 12 hrs 42.8 42.8 24.3 22.5 34.7 32.5 53.8 51.596 hrs 42.8 42.1 24.3 19.9 34.7 31.5 53.8 49.6
0 =
50°12 hrs 65.8 64.9 18.2 18.2 31.4 29.3 57.2 55.196 hrs 65.8 62.4 18.2 17.8 31.4 28.1 57.2 53.4
88

Tabic A 10. Changes in optical properties for samples soaked in ethanol of purity 99.8% forduration shown
T ium R lu m T soi ^-sol
Time(hrs)
N A N A N A N A
ooIIQ
12 hrs 43.7 43.1 26.7 23.2 32.5 31.8 52.6 50.496 hrs 43.7 42.5 26.7 20.0 32.5 28.7 52.6 48.7
0 =
50°12 hrs 61.5 60.1 24.6 20.6 29.8 29.3 55.9 53.396 hrs 61.5 57.3 24.6 19.3 29.8 26.3 55.9 51.7
Table Al l . Changes in optical properties for samples exposed into outdoor environment for duration shown
T lum R lum T soi ^■sol
Time(hrs)
N A N A N A N A
0 = 0°2 wks 43.6 43.6 32.8 29.7 31.8 30.1 51.4 49.84 wks 43.6 43.4 32.8 29.7 31.8 29.5 51.4 49.212 wks 43.6 43.2 32.8 24.5 31.8 29.2 51.4 48.8
0 =
50°2 wks 64.2 63.1 28.3 27.9 29.4 28.3 56.3 54.34 wks 64.2 62.2 28.3 24.5 29.4 27.3 56.3 53.212 wks 64.2 60.5 28.3 20.9 29.4 26.7 56.3 52.9
Table A 12. Changes in optical properties for samples soaked in distilled water for duration shown
T lum R lum T soi ^sol
Time(hrs)
N A N A N A N A
ooIIQ
48 hrs 43.5 43.2 28.3 26.4 31.6 30.4 51.7 51.51 wk 43.5 43.2 28.3 25.1 31.6 30.1 51.7 50.9
3 wks 43.5 43.1 28.3 23.6 31.6 29.9 51.7 50.10 =
50°48 hrs 64.9 64.7 19.8 19.8 28.3 27.3 56.4 56.11 wk 64.9 „ 64.5 19.8 19.8 28.3 27.1 56.4 56.4
3 wks 64.9 63.3 1 9 . 8 19.8 28.3 26.7 56.4 54.6
89
APPENDIX B: PROGRAM MOONRAKER 7 (Mwamburi, M., 2001)
This program was initially written by Mr. Mghendi Mwamburi, at Physics Department, Moi University Kenya. The program was edited by Musembi,R.J.
The program is written in MathCAD and it uses the formula given in section 3.6 page 28. The computation is done using the trapezoidal rule by: first getting the area under the curve for figures obtained empirically given in section 5.2.The value obtained is then normalized using the standard data for sunlight or thermal radiation i.e. ISO 9845 data for A.M 1.5 irradiance and ISO 10526 data for luminous performance. The practical wavelength limits used are given in section 3.6, page 28.
The software used for computation was MathCAD 6+
?
90
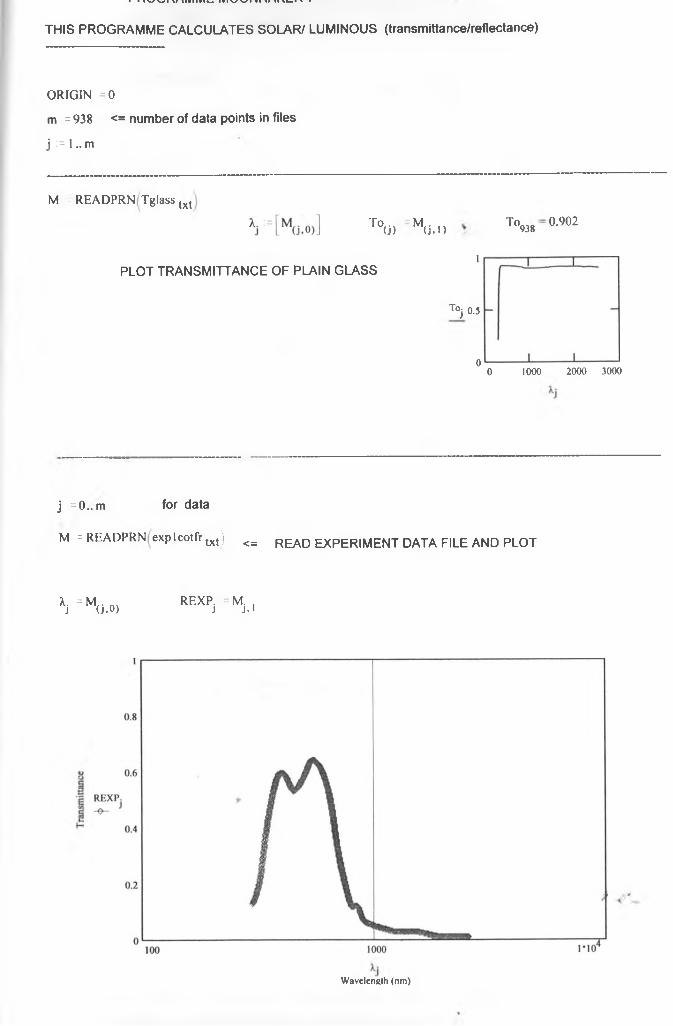
i i w v j r v n i v i m t . i v i w m \ n r M _ i \ #
THIS PROGRAMME CALCULATES SOLAR/ LUMINOUS (transmittance/reflectance)
ORIGIN =0m = 938 <= number of data points in files
j := l.. m
M READPRN Tglass txtT ° ( j ) M ( j . U
To,9380.902
1PLOT TRANSMITTANCE OF PLAIN GLASS
Toj 0.5
00 1000 2000 3000
j =0.. m for data
M = READPRN exp I cotfrtxt) <= READ EXPERIMENT DATA FILE AND PLOT
y = Mu.o» REXpj =Mj.i
Wavelength (nm)

CALCULATION OF SOLAR (TRANSMITTANCE/ REFLECTANCE)
AM1.5 Irradiance DATA ORIGIN =0j 1 0.. mM READPRN (am 15 txt)
X. = Sam.REXP.J J J
Eye sensitivity DATA
Y =Mu.o, Sam,i ) = —1100\ = 300
j = 0..mM = READPRN eyadata2 txt
Xj ‘ M ( j ,0 )
eyemax - 0.9983\ = 300
E. REXP.Eye. J J J J
Eye(j)"Mu.i»eyemax
Calculation of intergrated solar (transmittance/ reflectance)
j r 1 ..m
TsolarTsolar = 0.278
CALCULATION OF LUMINOUS (TRANSMITTANCE/ REFLECTANCE ) Calculation of intergrated luminous (transmittance/ reflectance)
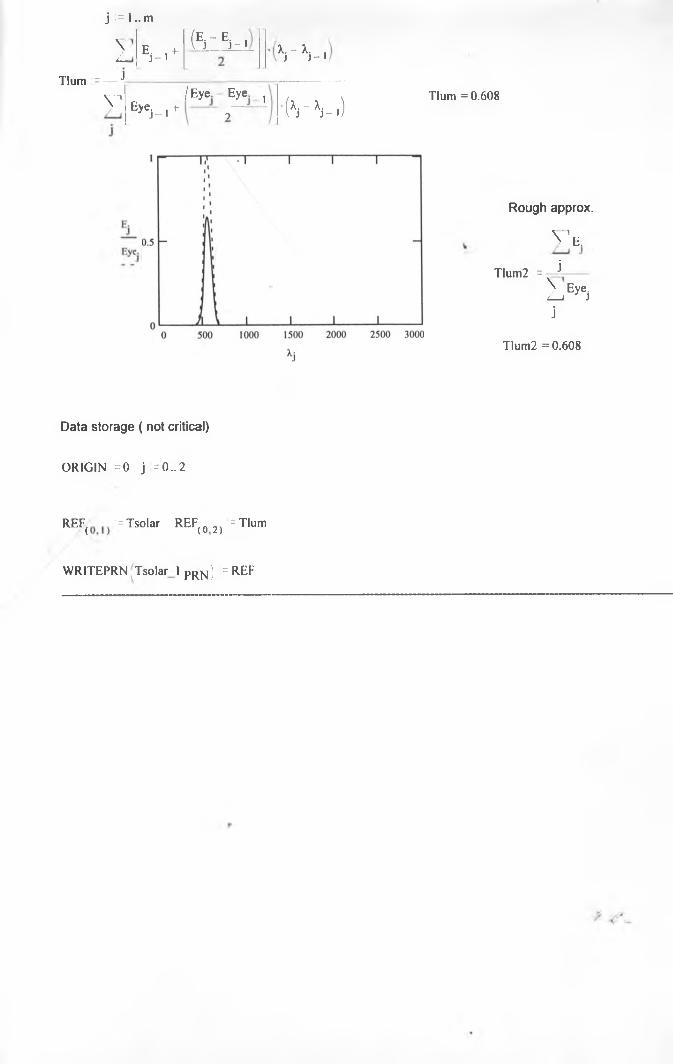
j := 1.. m
yz_
Tlum =— J
V
EJ - .^(E .-E . .\ J J - i X.-X. .
J j - 1
/Eye Eye ,E» V i* , ------- ■(»i - V . )
Tlum = 0.608
Rough approx.
V E.
Tlum2 =—i —
^LiEyejj
Tlum2 = 0.608
Data storage ( not critical)
ORIGIN =0 j = 0..2
REF( : = Tsolar REF(Q 2) = Tlum
WRITEPRN i Tsolar l pRN) = REF