Embed Size (px)
Citation preview
Degradation Patterns in Water and Oxygen of an InvertedPolymer Solar Cell
Kion Norrman, Morten V. Madsen, Suren A. Gevorgyan, and Frederik C. Krebs*
Risø National Laboratory for Sustainable Energy, Technical UniVersity of Denmark,FrederiksborgVej 399, DK-4000 Roskilde, Denmark
Received July 16, 2010; E-mail: [email protected]
Abstract: The spatial distribution of reaction products in multilayer polymer solar cells induced by waterand oxygen atmospheres was mapped and used to elucidate the degradation patterns and failuremechanisms in an inverted polymer solar cell. The active material comprised a bulk heterojunction formedby poly(3-hexylthiophene) (P3HT) and [6,6]-phenyl-C61-butyric acid methyl ester (PCBM) sandwichedbetween a layer of zinc oxide and a layer of poly(3,4-ethylenedioxythiophene) poly(styrenesulfonate)(PEDOT:PSS) that acted as, respectively, electron and hole transporting layers between the active materialand the two electrodes indium-tin-oxide (ITO) and printed silver. X-ray photoelectron spectroscopy (XPS)and time-of-flight secondary ion mass spectrometry (TOF-SIMS) in conjunction with isotopic labeling usingH2
18O and 18O2 enabled detailed information on where and to what extent uptake took place. A comparisonwas made between the use of a humid (oxygen-free) atmosphere and a dry oxygen atmosphere duringtesting of devices that were kept in the dark and devices that were subjected to illumination under simulatedsunlight. It was found that the reactions taking place at the interface between the active layer and thePEDOT:PSS were the major cause of device failure in the case of these inverted devices, which arecompatible with full roll-to-roll (R2R) coating and industrial manufacture. The PEDOT:PSS was found tophase separate, with the PEDOT-rich phase being responsible for most of the interface degradation inoxygen atmospheres. In water atmospheres, little chemically induced degradation was observed, whereasa large partially reversible dependence of the open circuit voltage on the relative humidity was observed.In addition, temporal aspects are discussed in regard to degradation mechanisms. Finally, analytical aspectsin regard to storing devices are discussed.
Introduction
Polymer solar cells convey several advantages such asflexibility, they are lightweight, environmental friendliness, alow thermal budget, low cost, and very fast modes of productionby printing techniques.1-10 From a production point of view, itis desirable to manufacture polymer solar cells entirely usingprinting techniques, that is, from solution without any vacuumsteps involved.11,12 The limiting factor is the lack of anacceptable substitute for indium-tin-oxide (ITO) as a transpar-
ent electrode, which is typically deposited by sputtering (i.e.,in a vacuum). The current performance of the technology islimited (as compared to silicon-based solar cells) by mainly twofactors: (i) the efficiency, which is on the order of 5% (althougha few reports of efficiencies approaching higher values in the6-8% range have appeared recently),13,14 and (ii) the lifetime,which is on the order of years under outdoor conditions15,16 withgood stability being recorded for both air stable devices andencapsulated devices.17,18 As a consequence, efficiency and stabilityhave become important research areas within polymer solar cells.1
Additional research areas include morphology,2,4 processing,6
manufacturing,11,12 and demonstration of the technology.The most studied polymer solar cell employs morphologically
stable bulk heterojunctions of regioregular P3HT (Figure 1) asthe donor material and the fullerene material PCBM (Figure 1)as the acceptor material. P3HT:PCBM based devices are
(1) Jørgensen, M.; Norrman, K.; Krebs, F. C. Sol. Energy Mater. Sol.Cells 2008, 92, 686–714.
(2) Thompson, B. C.; Frechet, J. M. J. Angew. Chem., Int. Ed. 2008, 47,58–77.
(3) Gunes, S.; Sariciftci, N. S. Inorg. Chim. Acta 2008, 361, 581–588.(4) Hoppe, H.; Sariciftci, N. S. AdV. Polym. Sci. 2008, 214, 1–86.(5) Saunders, B. R.; Turner, M. L. AdV. Colloid Interface Sci. 2008, 138,
1–23.(6) Krebs, F. C. Sol. Energy Mater. Sol. Cells 2009, 93, 394–412.(7) Ameri, T.; Dennler, G.; Lungenschmied, C.; Brabec, C. J. Energy
EnViron. Sci. 2009, 2, 347–363.(8) Kippelen, B.; Bredas, J. L. Energy EnViron. Sci. 2009, 2, 251–261.(9) Peet, J.; Heeger, A. J.; Bazan, G. Acc. Chem. Res. 2009, 42, 1700–
1708.(10) Gonzalez-Valls, I.; Lira-Cantu, M. Energy EnViron. Sci. 2009, 2, 19–
34.(11) Krebs, F. C.; Gevorgyan, S. A.; Alstrup, J. J. Mater. Chem. 2009, 19,
5442–5451.(12) Krebs, F. C.; Norrman, K. ACS Appl. Mater. Interfaces 2010, 2, 877–
887.
(13) Park, S. H.; Roy, A.; Beaupre, S.; Cho, S.; Coates, N.; Moon, J. S.;Moses, D.; Leclerc, M.; Lee, K.; Heeger, A. J. Nat. Photonics 2009,3, 297–303.
(14) Chen, H. Y.; Hou, J.; Zhang, S.; Liang, Y.; Yang, G.; Yang, Y.; Yu,L.; Wu, Y.; Li, G. Nat. Photonics 2009, 3, 649–653.
(15) Katz, E. A.; Gevorgyan, S.; Orynbayev, M. S.; Krebs, F. C. Eur. Phys.J. Appl. Phys. 2006, 36, 307–311.
(16) Hauch, J. A.; Schilinsky, P.; Choulis, S. A.; Childers, R.; Biele, M.;Brabec, C. J. Sol. Energy Mater. Sol. Cells 2008, 92, 727–731.
(17) Krebs, F. C. Sol. Energy Mater. Sol. Cells 2008, 92, 715–726.(18) Zimmermann, B.; Wurfel, U.; Niggemann, M. Sol. Energy Mater. Sol.
Cells 2009, 93, 491–496.
Published on Web 11/05/2010
10.1021/ja106299g 2010 American Chemical Society J. AM. CHEM. SOC. 2010, 132, 16883–16892 9 16883
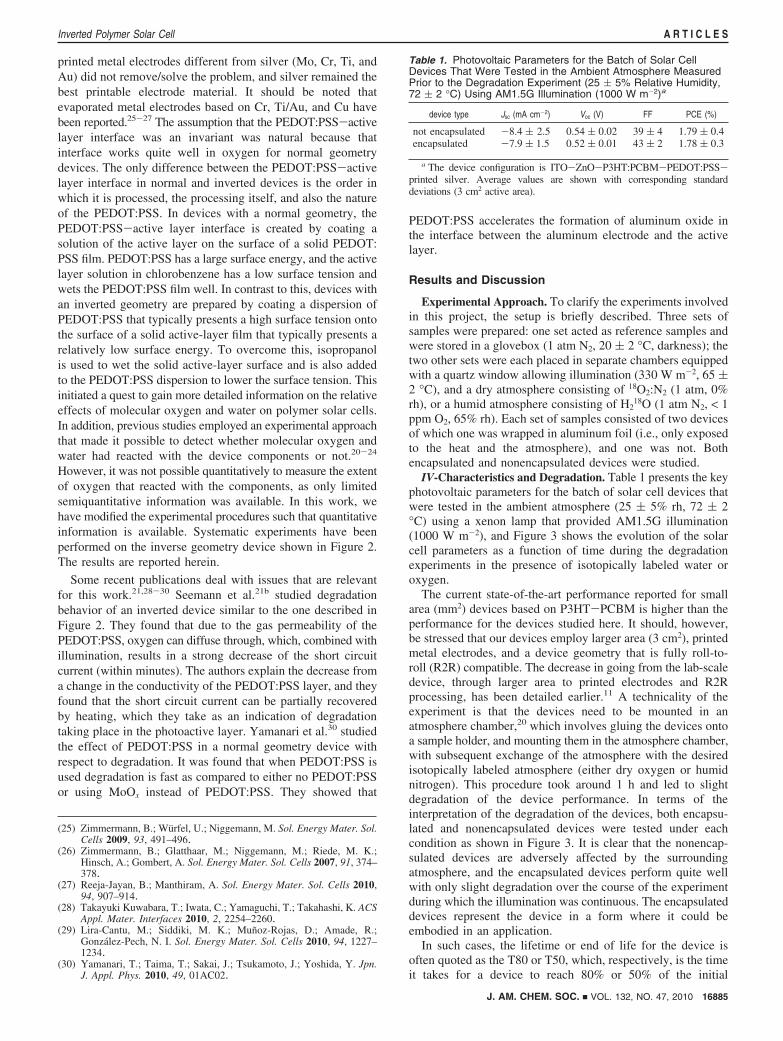
typically prepared by simple solution processing of the activelayers followed by evaporation of metallic back electrodes,which produces a device with a so-called “normal” geometrywhere electrons flow from the transparent electrode to the backelectrode (Figure 2). A normal geometry is convenient whenpreparing devices on a lab scale but undesirable for a large-scale production due to the vacuum processing steps. As a result,so-called “inverse” or “inverted” device geometries whereelectrons flow from the back electrode to the transparentelectrode (Figure 2) were developed that allow for the use of asolution processed back electrode.11,19 With inverse geometrydevices, vacuum processing can thus be avoided (except forthe ITO electrode). Preliminary demonstrations of large-scalemanufacturing of inverse geometry devices show feasibility andconfirm the advantages of an inverse geometry. However, morework is needed to further optimize the inverse geometry devicessuch that the large-scale vision for the polymer solar technologycan be realized.
This work focuses on device lifetime. To optimize the devicelifetime, one needs to understand how the device degradesduring operation. The limited lifetime is a result of severalprocesses that are in play simultaneously. Materials degrade andas a consequence so do in many instances their physical,electrical, and mechanical properties. Photovoltaic devices thatrely on the delicate interplay between the electronic structureof the material, and the energy levels in external electrodesconnecting the functional material in the device to the outsideworld, are highly sensitive to even small degrees of degradation.For an electronic device based on organic materials that relyon both bulk and interface phenomena, it is clear that degrada-tion becomes highly critical for device function and thus must
be removed or at least minimized to improve stability. Degrada-tion comprises a complex range of mechanisms of whichpresumably not all have been identified. Known degradationmechanisms involve: diffusion of molecular oxygen and waterinto the device, degradation of interfaces, degradation of theactive material, interlayer and electrode diffusion, electrodereaction with the organic materials, morphological changes, andmacroscopic changes such as delamination, formation ofparticles, bubbles, and cracks. Some of these degradationmechanisms are interrelated and take place at the same time,some during operation of the solar cell, and some during storage.Some degradation mechanisms are fast, and others are slow. Itis thus a challenging task to identify degradations mechanisms,and even more difficult to quantify to what extent eachmechanism contributes to the overall deterioration of the solarcell performance. It has been known for a long time thatdiffusion of molecular oxygen and water into the device leadsto some of the most significant degradation mechanisms fororganic solar cells. In this work, we seek a more detailedunderstanding of this phenomenon.
Earlier work from this laboratory has shown that, for normalgeometry devices using aluminum as a back electrode, bothmolecular oxygen and water will diffuse through the aluminumelectrode.11,20-24 Molecular oxygen will preferentially diffusethrough microscopic pinholes in the electrode, and water willpreferentially diffuse in between the aluminum grains in theelectrode. Both molecular oxygen and water will then diffusethrough all the layers in the device all the way to the ITOinterface. All organic layers will react with molecular oxygenand water in varying degree causing oxidation and thusdegradation. At the ITO interface, oxygen from the ITO willbe exchanged with the incoming oxygen (i.e., in the form ofmolecular oxygen and water). These processes are in varyingdegree affected by light and/or heat. Degradation takes placeeven during storing but to a lesser degree; that is, the deviceswill not have an infinite shelf lifetime.
Switching from lab-scale (i.e., normal geometry) to large-scale manufacturing made it relevant to perform the samelifetime experiments on an inverted geometry device. Theinverted geometry device shown in Figure 2 was lifetime testedthoroughly with an interesting result.11 Whereas the normalgeometry device (Figure 2) was shown to have a relatively longlifetime in an O2:N2 (1 atm) atmosphere and a relatively shortlifetime in a saturated H2O atmosphere, the inverted geometrydevice showed the opposite behavior, that is, short lifetime inO2:N2 (1 atm) and a long lifetime in saturated H2O.11 Theobservation of a relatively good stability in separate water andoxygen atmospheres gave hope that devices stable in thepresence of both water and oxygen could be made, and initiallythe search for the instability in oxygen for the inverted deviceswas sought at the metal PEDOT:PSS interface. The use of many
(19) Waldauf, C.; Morana, M.; Denk, P.; Schilinsky, P.; Coakley, K.;Choulis, S. A.; Brabec, C. J. Appl. Phys. Lett. 2006, 89, 233517.
(20) Gevorgyan, S. A.; Jørgensen, M.; Krebs, F. C. Sol. Energy Mater.Sol. Cells 2008, 92, 736–745.
(21) (a) Norrman, K.; Krebs, F. C. Sol. Energy Mater. Sol. Cells 2006, 90,213–227. (b) Seemann, A.; Egelhaaf, H.-J.; Brabec, C. J.; Hauch, J. A.Org. Electron. 2009, 10, 1424–1428. (c) Manceau, M.; Rivaton, A.;Gardette, J. L.; Guillerez, S.; Lemaitre, N. Polym. Degrad. Stab. 2009,94, 898–907.
(22) (a) Norrman, K.; Gevorgyan, S. A.; Krebs, F. C. ACS Appl. Mater.Interfaces 2009, 1, 102–112. (b) Hauch, J. A.; Schilinsky, P.; Choulis,S. A.; Rajoelson, S.; Brabec, C. J. Appl. Phys. Lett. 2008, 93, 103306.
(23) Norrman, K.; Larsen, N. B.; Krebs, F. C. Sol. Energy Mater. Sol. Cells2006, 90, 2793–2814.
(24) Norrman, K.; Alstrup, J.; Krebs, F. C. Surf. Interface Anal. 2006, 38,1302–1310.
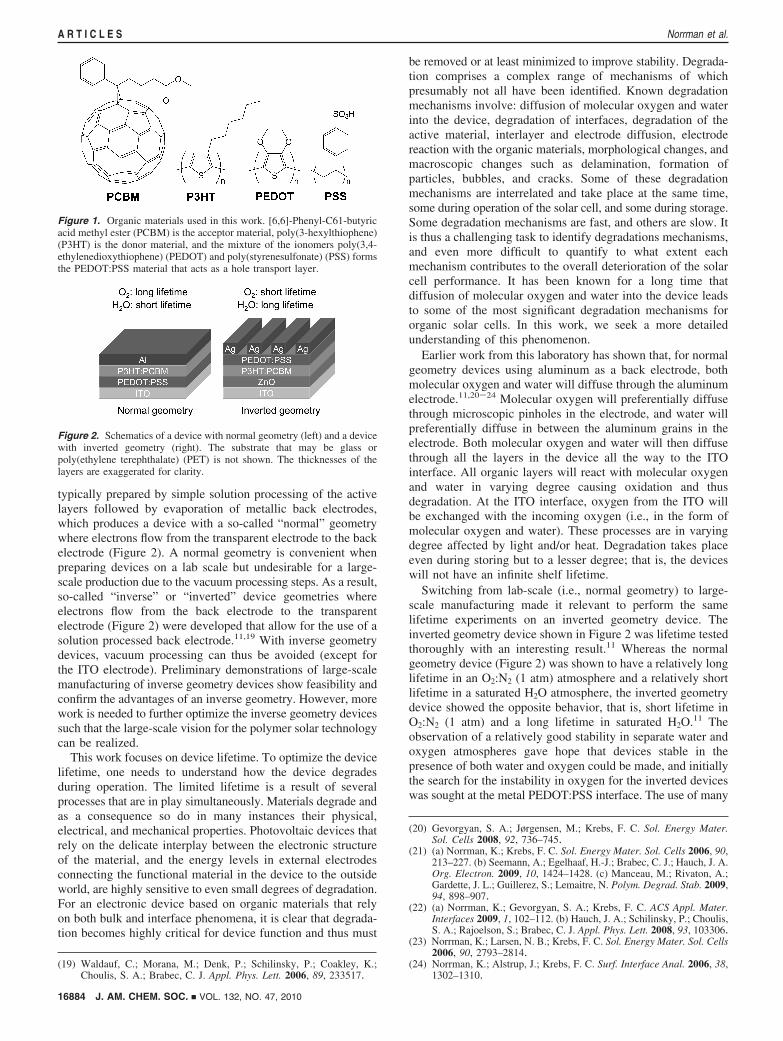
Figure 1. Organic materials used in this work. [6,6]-Phenyl-C61-butyricacid methyl ester (PCBM) is the acceptor material, poly(3-hexylthiophene)(P3HT) is the donor material, and the mixture of the ionomers poly(3,4-ethylenedioxythiophene) (PEDOT) and poly(styrenesulfonate) (PSS) formsthe PEDOT:PSS material that acts as a hole transport layer.
Figure 2. Schematics of a device with normal geometry (left) and a devicewith inverted geometry (right). The substrate that may be glass orpoly(ethylene terephthalate) (PET) is not shown. The thicknesses of thelayers are exaggerated for clarity.
16884 J. AM. CHEM. SOC. 9 VOL. 132, NO. 47, 2010
A R T I C L E S Norrman et al.
printed metal electrodes different from silver (Mo, Cr, Ti, andAu) did not remove/solve the problem, and silver remained thebest printable electrode material. It should be noted thatevaporated metal electrodes based on Cr, Ti/Au, and Cu havebeen reported.25-27 The assumption that the PEDOT:PSS-activelayer interface was an invariant was natural because thatinterface works quite well in oxygen for normal geometrydevices. The only difference between the PEDOT:PSS-activelayer interface in normal and inverted devices is the order inwhich it is processed, the processing itself, and also the natureof the PEDOT:PSS. In devices with a normal geometry, thePEDOT:PSS-active layer interface is created by coating asolution of the active layer on the surface of a solid PEDOT:PSS film. PEDOT:PSS has a large surface energy, and the activelayer solution in chlorobenzene has a low surface tension andwets the PEDOT:PSS film well. In contrast to this, devices withan inverted geometry are prepared by coating a dispersion ofPEDOT:PSS that typically presents a high surface tension ontothe surface of a solid active-layer film that typically presents arelatively low surface energy. To overcome this, isopropanolis used to wet the solid active-layer surface and is also addedto the PEDOT:PSS dispersion to lower the surface tension. Thisinitiated a quest to gain more detailed information on the relativeeffects of molecular oxygen and water on polymer solar cells.In addition, previous studies employed an experimental approachthat made it possible to detect whether molecular oxygen andwater had reacted with the device components or not.20-24
However, it was not possible quantitatively to measure the extentof oxygen that reacted with the components, as only limitedsemiquantitative information was available. In this work, wehave modified the experimental procedures such that quantitativeinformation is available. Systematic experiments have beenperformed on the inverse geometry device shown in Figure 2.The results are reported herein.
Some recent publications deal with issues that are relevantfor this work.21,28-30 Seemann et al.21b studied degradationbehavior of an inverted device similar to the one described inFigure 2. They found that due to the gas permeability of thePEDOT:PSS, oxygen can diffuse through, which, combined withillumination, results in a strong decrease of the short circuitcurrent (within minutes). The authors explain the decrease froma change in the conductivity of the PEDOT:PSS layer, and theyfound that the short circuit current can be partially recoveredby heating, which they take as an indication of degradationtaking place in the photoactive layer. Yamanari et al.30 studiedthe effect of PEDOT:PSS in a normal geometry device withrespect to degradation. It was found that when PEDOT:PSS isused degradation is fast as compared to either no PEDOT:PSSor using MoOx instead of PEDOT:PSS. They showed that
PEDOT:PSS accelerates the formation of aluminum oxide inthe interface between the aluminum electrode and the activelayer.
Results and Discussion
Experimental Approach. To clarify the experiments involvedin this project, the setup is briefly described. Three sets ofsamples were prepared: one set acted as reference samples andwere stored in a glovebox (1 atm N2, 20 ( 2 °C, darkness); thetwo other sets were each placed in separate chambers equippedwith a quartz window allowing illumination (330 W m-2, 65 (2 °C), and a dry atmosphere consisting of 18O2:N2 (1 atm, 0%rh), or a humid atmosphere consisting of H2
18O (1 atm N2, < 1ppm O2, 65% rh). Each set of samples consisted of two devicesof which one was wrapped in aluminum foil (i.e., only exposedto the heat and the atmosphere), and one was not. Bothencapsulated and nonencapsulated devices were studied.
IV-Characteristics and Degradation. Table 1 presents the keyphotovoltaic parameters for the batch of solar cell devices thatwere tested in the ambient atmosphere (25 ( 5% rh, 72 ( 2°C) using a xenon lamp that provided AM1.5G illumination(1000 W m-2), and Figure 3 shows the evolution of the solarcell parameters as a function of time during the degradationexperiments in the presence of isotopically labeled water oroxygen.
The current state-of-the-art performance reported for smallarea (mm2) devices based on P3HT-PCBM is higher than theperformance for the devices studied here. It should, however,be stressed that our devices employ larger area (3 cm2), printedmetal electrodes, and a device geometry that is fully roll-to-roll (R2R) compatible. The decrease in going from the lab-scaledevice, through larger area to printed electrodes and R2Rprocessing, has been detailed earlier.11 A technicality of theexperiment is that the devices need to be mounted in anatmosphere chamber,20 which involves gluing the devices ontoa sample holder, and mounting them in the atmosphere chamber,with subsequent exchange of the atmosphere with the desiredisotopically labeled atmosphere (either dry oxygen or humidnitrogen). This procedure took around 1 h and led to slightdegradation of the device performance. In terms of theinterpretation of the degradation of the devices, both encapsu-lated and nonencapsulated devices were tested under eachcondition as shown in Figure 3. It is clear that the nonencap-sulated devices are adversely affected by the surroundingatmosphere, and the encapsulated devices perform quite wellwith only slight degradation over the course of the experimentduring which the illumination was continuous. The encapsulateddevices represent the device in a form where it could beembodied in an application.
In such cases, the lifetime or end of life for the device isoften quoted as the T80 or T50, which, respectively, is the timeit takes for a device to reach 80% or 50% of the initial
(25) Zimmermann, B.; Wurfel, U.; Niggemann, M. Sol. Energy Mater. Sol.Cells 2009, 93, 491–496.
(26) Zimmermann, B.; Glatthaar, M.; Niggemann, M.; Riede, M. K.;Hinsch, A.; Gombert, A. Sol. Energy Mater. Sol. Cells 2007, 91, 374–378.
(27) Reeja-Jayan, B.; Manthiram, A. Sol. Energy Mater. Sol. Cells 2010,94, 907–914.
(28) Takayuki Kuwabara, T.; Iwata, C.; Yamaguchi, T.; Takahashi, K. ACSAppl. Mater. Interfaces 2010, 2, 2254–2260.
(29) Lira-Cantu, M.; Siddiki, M. K.; Munoz-Rojas, D.; Amade, R.;Gonzalez-Pech, N. I. Sol. Energy Mater. Sol. Cells 2010, 94, 1227–1234.
(30) Yamanari, T.; Taima, T.; Sakai, J.; Tsukamoto, J.; Yoshida, Y. Jpn.J. Appl. Phys. 2010, 49, 01AC02.
Table 1. Photovoltaic Parameters for the Batch of Solar CellDevices That Were Tested in the Ambient Atmosphere MeasuredPrior to the Degradation Experiment (25 ( 5% Relative Humidity,72 ( 2 °C) Using AM1.5G Illumination (1000 W m-2)a
device type Jsc (mA cm-2) Voc (V) FF PCE (%)
not encapsulated -8.4 ( 2.5 0.54 ( 0.02 39 ( 4 1.79 ( 0.4encapsulated -7.9 ( 1.5 0.52 ( 0.01 43 ( 2 1.78 ( 0.3
a The device configuration is ITO-ZnO-P3HT:PCBM-PEDOT:PSS-printed silver. Average values are shown with corresponding standarddeviations (3 cm2 active area).
J. AM. CHEM. SOC. 9 VOL. 132, NO. 47, 2010 16885
Inverted Polymer Solar Cell A R T I C L E S
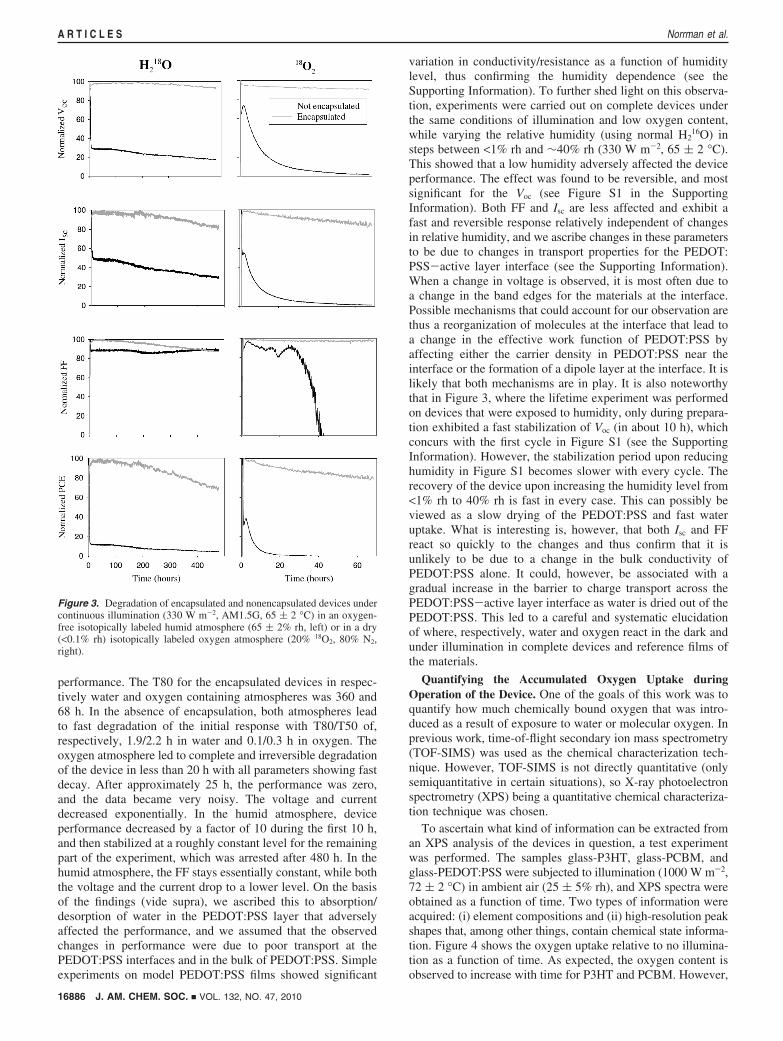
performance. The T80 for the encapsulated devices in respec-tively water and oxygen containing atmospheres was 360 and68 h. In the absence of encapsulation, both atmospheres leadto fast degradation of the initial response with T80/T50 of,respectively, 1.9/2.2 h in water and 0.1/0.3 h in oxygen. Theoxygen atmosphere led to complete and irreversible degradationof the device in less than 20 h with all parameters showing fastdecay. After approximately 25 h, the performance was zero,and the data became very noisy. The voltage and currentdecreased exponentially. In the humid atmosphere, deviceperformance decreased by a factor of 10 during the first 10 h,and then stabilized at a roughly constant level for the remainingpart of the experiment, which was arrested after 480 h. In thehumid atmosphere, the FF stays essentially constant, while boththe voltage and the current drop to a lower level. On the basisof the findings (vide supra), we ascribed this to absorption/desorption of water in the PEDOT:PSS layer that adverselyaffected the performance, and we assumed that the observedchanges in performance were due to poor transport at thePEDOT:PSS interfaces and in the bulk of PEDOT:PSS. Simpleexperiments on model PEDOT:PSS films showed significant
variation in conductivity/resistance as a function of humiditylevel, thus confirming the humidity dependence (see theSupporting Information). To further shed light on this observa-tion, experiments were carried out on complete devices underthe same conditions of illumination and low oxygen content,while varying the relative humidity (using normal H2
16O) insteps between <1% rh and ∼40% rh (330 W m-2, 65 ( 2 °C).This showed that a low humidity adversely affected the deviceperformance. The effect was found to be reversible, and mostsignificant for the Voc (see Figure S1 in the SupportingInformation). Both FF and Isc are less affected and exhibit afast and reversible response relatively independent of changesin relative humidity, and we ascribe changes in these parametersto be due to changes in transport properties for the PEDOT:PSS-active layer interface (see the Supporting Information).When a change in voltage is observed, it is most often due toa change in the band edges for the materials at the interface.Possible mechanisms that could account for our observation arethus a reorganization of molecules at the interface that lead toa change in the effective work function of PEDOT:PSS byaffecting either the carrier density in PEDOT:PSS near theinterface or the formation of a dipole layer at the interface. It islikely that both mechanisms are in play. It is also noteworthythat in Figure 3, where the lifetime experiment was performedon devices that were exposed to humidity, only during prepara-tion exhibited a fast stabilization of Voc (in about 10 h), whichconcurs with the first cycle in Figure S1 (see the SupportingInformation). However, the stabilization period upon reducinghumidity in Figure S1 becomes slower with every cycle. Therecovery of the device upon increasing the humidity level from<1% rh to 40% rh is fast in every case. This can possibly beviewed as a slow drying of the PEDOT:PSS and fast wateruptake. What is interesting is, however, that both Isc and FFreact so quickly to the changes and thus confirm that it isunlikely to be due to a change in the bulk conductivity ofPEDOT:PSS alone. It could, however, be associated with agradual increase in the barrier to charge transport across thePEDOT:PSS-active layer interface as water is dried out of thePEDOT:PSS. This led to a careful and systematic elucidationof where, respectively, water and oxygen react in the dark andunder illumination in complete devices and reference films ofthe materials.
Quantifying the Accumulated Oxygen Uptake duringOperation of the Device. One of the goals of this work was toquantify how much chemically bound oxygen that was intro-duced as a result of exposure to water or molecular oxygen. Inprevious work, time-of-flight secondary ion mass spectrometry(TOF-SIMS) was used as the chemical characterization tech-nique. However, TOF-SIMS is not directly quantitative (onlysemiquantitative in certain situations), so X-ray photoelectronspectrometry (XPS) being a quantitative chemical characteriza-tion technique was chosen.
To ascertain what kind of information can be extracted froman XPS analysis of the devices in question, a test experimentwas performed. The samples glass-P3HT, glass-PCBM, andglass-PEDOT:PSS were subjected to illumination (1000 W m-2,72 ( 2 °C) in ambient air (25 ( 5% rh), and XPS spectra wereobtained as a function of time. Two types of information wereacquired: (i) element compositions and (ii) high-resolution peakshapes that, among other things, contain chemical state informa-tion. Figure 4 shows the oxygen uptake relative to no illumina-tion as a function of time. As expected, the oxygen content isobserved to increase with time for P3HT and PCBM. However,
Figure 3. Degradation of encapsulated and nonencapsulated devices undercontinuous illumination (330 W m-2, AM1.5G, 65 ( 2 °C) in an oxygen-free isotopically labeled humid atmosphere (65 ( 2% rh, left) or in a dry(<0.1% rh) isotopically labeled oxygen atmosphere (20% 18O2, 80% N2,right).
16886 J. AM. CHEM. SOC. 9 VOL. 132, NO. 47, 2010
A R T I C L E S Norrman et al.
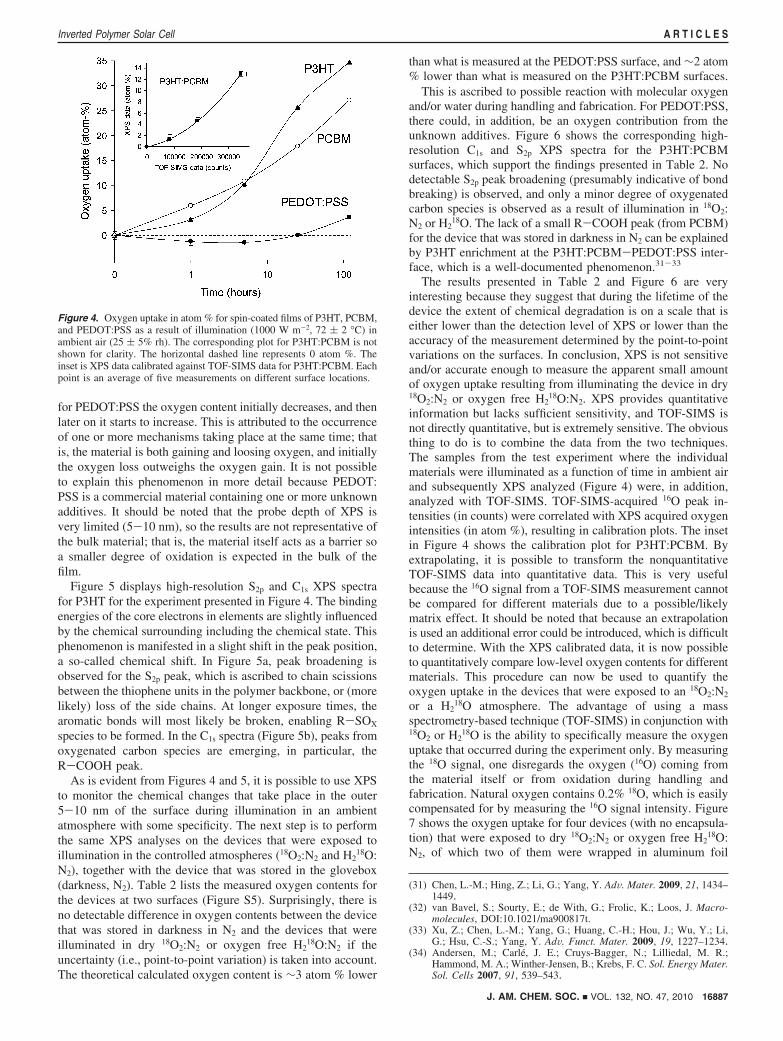
for PEDOT:PSS the oxygen content initially decreases, and thenlater on it starts to increase. This is attributed to the occurrenceof one or more mechanisms taking place at the same time; thatis, the material is both gaining and loosing oxygen, and initiallythe oxygen loss outweighs the oxygen gain. It is not possibleto explain this phenomenon in more detail because PEDOT:PSS is a commercial material containing one or more unknownadditives. It should be noted that the probe depth of XPS isvery limited (5-10 nm), so the results are not representative ofthe bulk material; that is, the material itself acts as a barrier soa smaller degree of oxidation is expected in the bulk of thefilm.
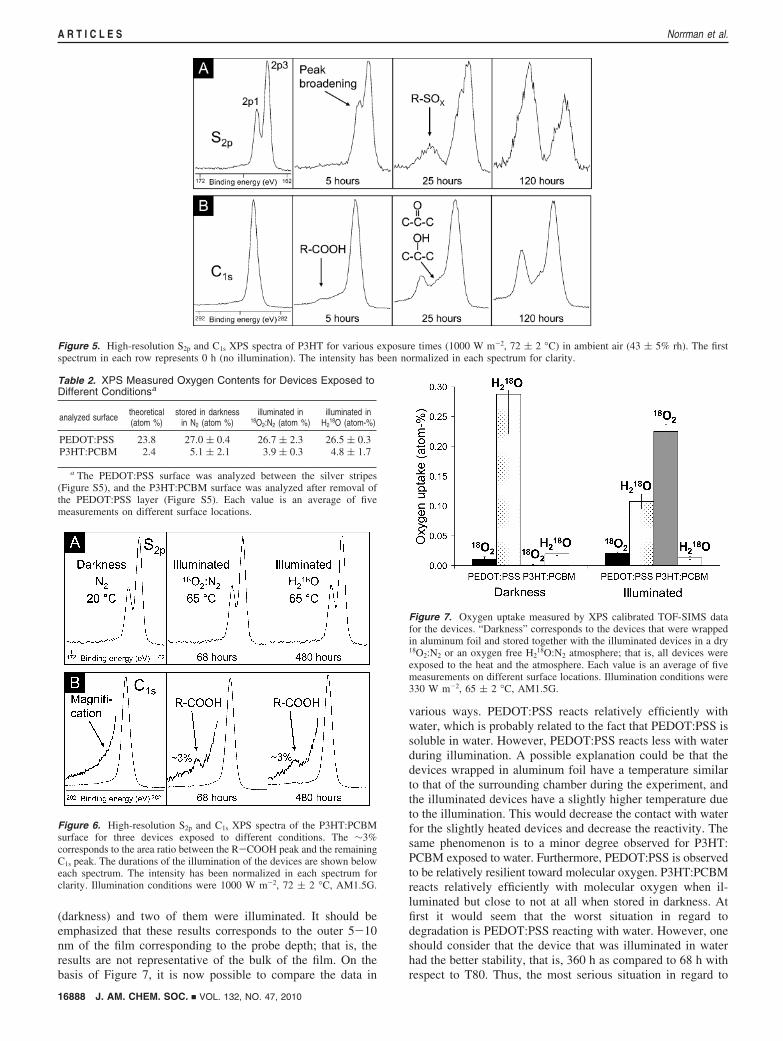
Figure 5 displays high-resolution S2p and C1s XPS spectrafor P3HT for the experiment presented in Figure 4. The bindingenergies of the core electrons in elements are slightly influencedby the chemical surrounding including the chemical state. Thisphenomenon is manifested in a slight shift in the peak position,a so-called chemical shift. In Figure 5a, peak broadening isobserved for the S2p peak, which is ascribed to chain scissionsbetween the thiophene units in the polymer backbone, or (morelikely) loss of the side chains. At longer exposure times, thearomatic bonds will most likely be broken, enabling R-SOX
species to be formed. In the C1s spectra (Figure 5b), peaks fromoxygenated carbon species are emerging, in particular, theR-COOH peak.
As is evident from Figures 4 and 5, it is possible to use XPSto monitor the chemical changes that take place in the outer5-10 nm of the surface during illumination in an ambientatmosphere with some specificity. The next step is to performthe same XPS analyses on the devices that were exposed toillumination in the controlled atmospheres (18O2:N2 and H2
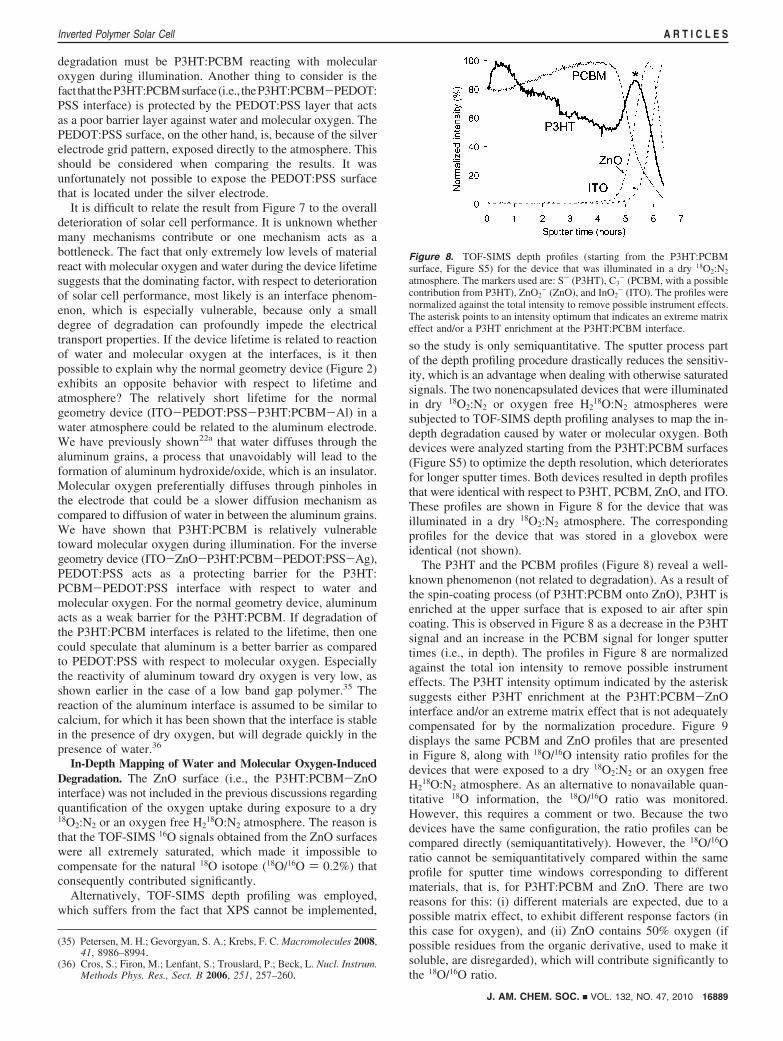
18O:N2), together with the device that was stored in the glovebox(darkness, N2). Table 2 lists the measured oxygen contents forthe devices at two surfaces (Figure S5). Surprisingly, there isno detectable difference in oxygen contents between the devicethat was stored in darkness in N2 and the devices that wereilluminated in dry 18O2:N2 or oxygen free H2
18O:N2 if theuncertainty (i.e., point-to-point variation) is taken into account.The theoretical calculated oxygen content is ∼3 atom % lower
than what is measured at the PEDOT:PSS surface, and ∼2 atom% lower than what is measured on the P3HT:PCBM surfaces.
This is ascribed to possible reaction with molecular oxygenand/or water during handling and fabrication. For PEDOT:PSS,there could, in addition, be an oxygen contribution from theunknown additives. Figure 6 shows the corresponding high-resolution C1s and S2p XPS spectra for the P3HT:PCBMsurfaces, which support the findings presented in Table 2. Nodetectable S2p peak broadening (presumably indicative of bondbreaking) is observed, and only a minor degree of oxygenatedcarbon species is observed as a result of illumination in 18O2:N2 or H2
18O. The lack of a small R-COOH peak (from PCBM)for the device that was stored in darkness in N2 can be explainedby P3HT enrichment at the P3HT:PCBM-PEDOT:PSS inter-face, which is a well-documented phenomenon.31-33
The results presented in Table 2 and Figure 6 are veryinteresting because they suggest that during the lifetime of thedevice the extent of chemical degradation is on a scale that iseither lower than the detection level of XPS or lower than theaccuracy of the measurement determined by the point-to-pointvariations on the surfaces. In conclusion, XPS is not sensitiveand/or accurate enough to measure the apparent small amountof oxygen uptake resulting from illuminating the device in dry18O2:N2 or oxygen free H2
18O:N2. XPS provides quantitativeinformation but lacks sufficient sensitivity, and TOF-SIMS isnot directly quantitative, but is extremely sensitive. The obviousthing to do is to combine the data from the two techniques.The samples from the test experiment where the individualmaterials were illuminated as a function of time in ambient airand subsequently XPS analyzed (Figure 4) were, in addition,analyzed with TOF-SIMS. TOF-SIMS-acquired 16O peak in-tensities (in counts) were correlated with XPS acquired oxygenintensities (in atom %), resulting in calibration plots. The insetin Figure 4 shows the calibration plot for P3HT:PCBM. Byextrapolating, it is possible to transform the nonquantitativeTOF-SIMS data into quantitative data. This is very usefulbecause the 16O signal from a TOF-SIMS measurement cannotbe compared for different materials due to a possible/likelymatrix effect. It should be noted that because an extrapolationis used an additional error could be introduced, which is difficultto determine. With the XPS calibrated data, it is now possibleto quantitatively compare low-level oxygen contents for differentmaterials. This procedure can now be used to quantify theoxygen uptake in the devices that were exposed to an 18O2:N2
or a H218O atmosphere. The advantage of using a mass
spectrometry-based technique (TOF-SIMS) in conjunction with18O2 or H2
18O is the ability to specifically measure the oxygenuptake that occurred during the experiment only. By measuringthe 18O signal, one disregards the oxygen (16O) coming fromthe material itself or from oxidation during handling andfabrication. Natural oxygen contains 0.2% 18O, which is easilycompensated for by measuring the 16O signal intensity. Figure7 shows the oxygen uptake for four devices (with no encapsula-tion) that were exposed to dry 18O2:N2 or oxygen free H2
18O:N2, of which two of them were wrapped in aluminum foil
(31) Chen, L.-M.; Hing, Z.; Li, G.; Yang, Y. AdV. Mater. 2009, 21, 1434–1449.
(32) van Bavel, S.; Sourty, E.; de With, G.; Frolic, K.; Loos, J. Macro-molecules, DOI:10.1021/ma900817t.
(33) Xu, Z.; Chen, L.-M.; Yang, G.; Huang, C.-H.; Hou, J.; Wu, Y.; Li,G.; Hsu, C.-S.; Yang, Y. AdV. Funct. Mater. 2009, 19, 1227–1234.
(34) Andersen, M.; Carle, J. E.; Cruys-Bagger, N.; Lilliedal, M. R.;Hammond, M. A.; Winther-Jensen, B.; Krebs, F. C. Sol. Energy Mater.Sol. Cells 2007, 91, 539–543.
Figure 4. Oxygen uptake in atom % for spin-coated films of P3HT, PCBM,and PEDOT:PSS as a result of illumination (1000 W m-2, 72 ( 2 °C) inambient air (25 ( 5% rh). The corresponding plot for P3HT:PCBM is notshown for clarity. The horizontal dashed line represents 0 atom %. Theinset is XPS data calibrated against TOF-SIMS data for P3HT:PCBM. Eachpoint is an average of five measurements on different surface locations.
J. AM. CHEM. SOC. 9 VOL. 132, NO. 47, 2010 16887
Inverted Polymer Solar Cell A R T I C L E S
(darkness) and two of them were illuminated. It should beemphasized that these results corresponds to the outer 5-10nm of the film corresponding to the probe depth; that is, theresults are not representative of the bulk of the film. On thebasis of Figure 7, it is now possible to compare the data in
various ways. PEDOT:PSS reacts relatively efficiently withwater, which is probably related to the fact that PEDOT:PSS issoluble in water. However, PEDOT:PSS reacts less with waterduring illumination. A possible explanation could be that thedevices wrapped in aluminum foil have a temperature similarto that of the surrounding chamber during the experiment, andthe illuminated devices have a slightly higher temperature dueto the illumination. This would decrease the contact with waterfor the slightly heated devices and decrease the reactivity. Thesame phenomenon is to a minor degree observed for P3HT:PCBM exposed to water. Furthermore, PEDOT:PSS is observedto be relatively resilient toward molecular oxygen. P3HT:PCBMreacts relatively efficiently with molecular oxygen when il-luminated but close to not at all when stored in darkness. Atfirst it would seem that the worst situation in regard todegradation is PEDOT:PSS reacting with water. However, oneshould consider that the device that was illuminated in waterhad the better stability, that is, 360 h as compared to 68 h withrespect to T80. Thus, the most serious situation in regard to
Figure 5. High-resolution S2p and C1s XPS spectra of P3HT for various exposure times (1000 W m-2, 72 ( 2 °C) in ambient air (43 ( 5% rh). The firstspectrum in each row represents 0 h (no illumination). The intensity has been normalized in each spectrum for clarity.
Table 2. XPS Measured Oxygen Contents for Devices Exposed toDifferent Conditionsa
analyzed surface theoretical(atom %)
stored in darknessin N2 (atom %)
illuminated in18O2:N2 (atom %)
illuminated inH2
18O (atom-%)
PEDOT:PSS 23.8 27.0 ( 0.4 26.7 ( 2.3 26.5 ( 0.3P3HT:PCBM 2.4 5.1 ( 2.1 3.9 ( 0.3 4.8 ( 1.7
a The PEDOT:PSS surface was analyzed between the silver stripes(Figure S5), and the P3HT:PCBM surface was analyzed after removal ofthe PEDOT:PSS layer (Figure S5). Each value is an average of fivemeasurements on different surface locations.
Figure 6. High-resolution S2p and C1s XPS spectra of the P3HT:PCBMsurface for three devices exposed to different conditions. The ∼3%corresponds to the area ratio between the R-COOH peak and the remainingC1s peak. The durations of the illumination of the devices are shown beloweach spectrum. The intensity has been normalized in each spectrum forclarity. Illumination conditions were 1000 W m-2, 72 ( 2 °C, AM1.5G.
Figure 7. Oxygen uptake measured by XPS calibrated TOF-SIMS datafor the devices. “Darkness” corresponds to the devices that were wrappedin aluminum foil and stored together with the illuminated devices in a dry18O2:N2 or an oxygen free H2
18O:N2 atmosphere; that is, all devices wereexposed to the heat and the atmosphere. Each value is an average of fivemeasurements on different surface locations. Illumination conditions were330 W m-2, 65 ( 2 °C, AM1.5G.
16888 J. AM. CHEM. SOC. 9 VOL. 132, NO. 47, 2010
A R T I C L E S Norrman et al.
degradation must be P3HT:PCBM reacting with molecularoxygen during illumination. Another thing to consider is thefact that theP3HT:PCBMsurface(i.e., theP3HT:PCBM-PEDOT:PSS interface) is protected by the PEDOT:PSS layer that actsas a poor barrier layer against water and molecular oxygen. ThePEDOT:PSS surface, on the other hand, is, because of the silverelectrode grid pattern, exposed directly to the atmosphere. Thisshould be considered when comparing the results. It wasunfortunately not possible to expose the PEDOT:PSS surfacethat is located under the silver electrode.
It is difficult to relate the result from Figure 7 to the overalldeterioration of solar cell performance. It is unknown whethermany mechanisms contribute or one mechanism acts as abottleneck. The fact that only extremely low levels of materialreact with molecular oxygen and water during the device lifetimesuggests that the dominating factor, with respect to deteriorationof solar cell performance, most likely is an interface phenom-enon, which is especially vulnerable, because only a smalldegree of degradation can profoundly impede the electricaltransport properties. If the device lifetime is related to reactionof water and molecular oxygen at the interfaces, is it thenpossible to explain why the normal geometry device (Figure 2)exhibits an opposite behavior with respect to lifetime andatmosphere? The relatively short lifetime for the normalgeometry device (ITO-PEDOT:PSS-P3HT:PCBM-Al) in awater atmosphere could be related to the aluminum electrode.We have previously shown22a that water diffuses through thealuminum grains, a process that unavoidably will lead to theformation of aluminum hydroxide/oxide, which is an insulator.Molecular oxygen preferentially diffuses through pinholes inthe electrode that could be a slower diffusion mechanism ascompared to diffusion of water in between the aluminum grains.We have shown that P3HT:PCBM is relatively vulnerabletoward molecular oxygen during illumination. For the inversegeometry device (ITO-ZnO-P3HT:PCBM-PEDOT:PSS-Ag),PEDOT:PSS acts as a protecting barrier for the P3HT:PCBM-PEDOT:PSS interface with respect to water andmolecular oxygen. For the normal geometry device, aluminumacts as a weak barrier for the P3HT:PCBM. If degradation ofthe P3HT:PCBM interfaces is related to the lifetime, then onecould speculate that aluminum is a better barrier as comparedto PEDOT:PSS with respect to molecular oxygen. Especiallythe reactivity of aluminum toward dry oxygen is very low, asshown earlier in the case of a low band gap polymer.35 Thereaction of the aluminum interface is assumed to be similar tocalcium, for which it has been shown that the interface is stablein the presence of dry oxygen, but will degrade quickly in thepresence of water.36
In-Depth Mapping of Water and Molecular Oxygen-InducedDegradation. The ZnO surface (i.e., the P3HT:PCBM-ZnOinterface) was not included in the previous discussions regardingquantification of the oxygen uptake during exposure to a dry18O2:N2 or an oxygen free H2
18O:N2 atmosphere. The reason isthat the TOF-SIMS 16O signals obtained from the ZnO surfaceswere all extremely saturated, which made it impossible tocompensate for the natural 18O isotope (18O/16O ) 0.2%) thatconsequently contributed significantly.
Alternatively, TOF-SIMS depth profiling was employed,which suffers from the fact that XPS cannot be implemented,
so the study is only semiquantitative. The sputter process partof the depth profiling procedure drastically reduces the sensitiv-ity, which is an advantage when dealing with otherwise saturatedsignals. The two nonencapsulated devices that were illuminatedin dry 18O2:N2 or oxygen free H2
18O:N2 atmospheres weresubjected to TOF-SIMS depth profiling analyses to map the in-depth degradation caused by water or molecular oxygen. Bothdevices were analyzed starting from the P3HT:PCBM surfaces(Figure S5) to optimize the depth resolution, which deterioratesfor longer sputter times. Both devices resulted in depth profilesthat were identical with respect to P3HT, PCBM, ZnO, and ITO.These profiles are shown in Figure 8 for the device that wasilluminated in a dry 18O2:N2 atmosphere. The correspondingprofiles for the device that was stored in a glovebox wereidentical (not shown).
The P3HT and the PCBM profiles (Figure 8) reveal a well-known phenomenon (not related to degradation). As a result ofthe spin-coating process (of P3HT:PCBM onto ZnO), P3HT isenriched at the upper surface that is exposed to air after spincoating. This is observed in Figure 8 as a decrease in the P3HTsignal and an increase in the PCBM signal for longer sputtertimes (i.e., in depth). The profiles in Figure 8 are normalizedagainst the total ion intensity to remove possible instrumenteffects. The P3HT intensity optimum indicated by the asterisksuggests either P3HT enrichment at the P3HT:PCBM-ZnOinterface and/or an extreme matrix effect that is not adequatelycompensated for by the normalization procedure. Figure 9displays the same PCBM and ZnO profiles that are presentedin Figure 8, along with 18O/16O intensity ratio profiles for thedevices that were exposed to a dry 18O2:N2 or an oxygen freeH2
18O:N2 atmosphere. As an alternative to nonavailable quan-titative 18O information, the 18O/16O ratio was monitored.However, this requires a comment or two. Because the twodevices have the same configuration, the ratio profiles can becompared directly (semiquantitatively). However, the 18O/16Oratio cannot be semiquantitatively compared within the sameprofile for sputter time windows corresponding to differentmaterials, that is, for P3HT:PCBM and ZnO. There are tworeasons for this: (i) different materials are expected, due to apossible matrix effect, to exhibit different response factors (inthis case for oxygen), and (ii) ZnO contains 50% oxygen (ifpossible residues from the organic derivative, used to make itsoluble, are disregarded), which will contribute significantly tothe 18O/16O ratio.
(35) Petersen, M. H.; Gevorgyan, S. A.; Krebs, F. C. Macromolecules 2008,41, 8986–8994.
(36) Cros, S.; Firon, M.; Lenfant, S.; Trouslard, P.; Beck, L. Nucl. Instrum.Methods Phys. Res., Sect. B 2006, 251, 257–260.
Figure 8. TOF-SIMS depth profiles (starting from the P3HT:PCBMsurface, Figure S5) for the device that was illuminated in a dry 18O2:N2
atmosphere. The markers used are: S- (P3HT), C3- (PCBM, with a possible
contribution from P3HT), ZnO2- (ZnO), and InO2
- (ITO). The profiles werenormalized against the total intensity to remove possible instrument effects.The asterisk points to an intensity optimum that indicates an extreme matrixeffect and/or a P3HT enrichment at the P3HT:PCBM interface.
J. AM. CHEM. SOC. 9 VOL. 132, NO. 47, 2010 16889
Inverted Polymer Solar Cell A R T I C L E S
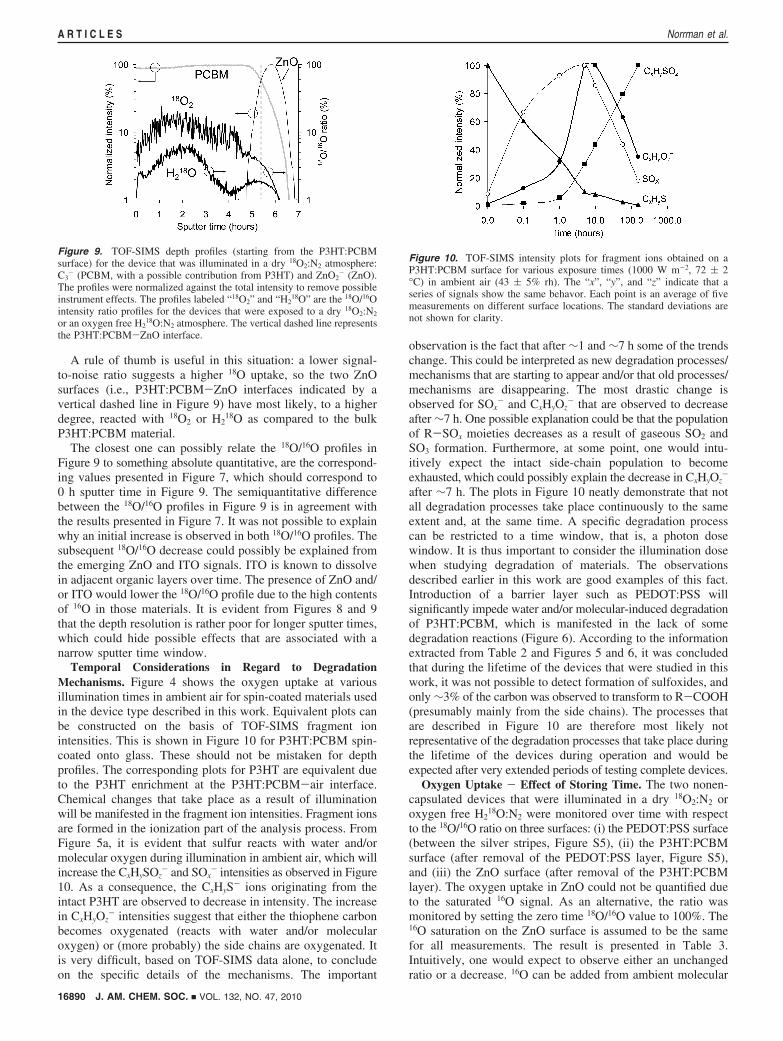
A rule of thumb is useful in this situation: a lower signal-to-noise ratio suggests a higher 18O uptake, so the two ZnOsurfaces (i.e., P3HT:PCBM-ZnO interfaces indicated by avertical dashed line in Figure 9) have most likely, to a higherdegree, reacted with 18O2 or H2
18O as compared to the bulkP3HT:PCBM material.
The closest one can possibly relate the 18O/16O profiles inFigure 9 to something absolute quantitative, are the correspond-ing values presented in Figure 7, which should correspond to0 h sputter time in Figure 9. The semiquantitative differencebetween the 18O/16O profiles in Figure 9 is in agreement withthe results presented in Figure 7. It was not possible to explainwhy an initial increase is observed in both 18O/16O profiles. Thesubsequent 18O/16O decrease could possibly be explained fromthe emerging ZnO and ITO signals. ITO is known to dissolvein adjacent organic layers over time. The presence of ZnO and/or ITO would lower the 18O/16O profile due to the high contentsof 16O in those materials. It is evident from Figures 8 and 9that the depth resolution is rather poor for longer sputter times,which could hide possible effects that are associated with anarrow sputter time window.
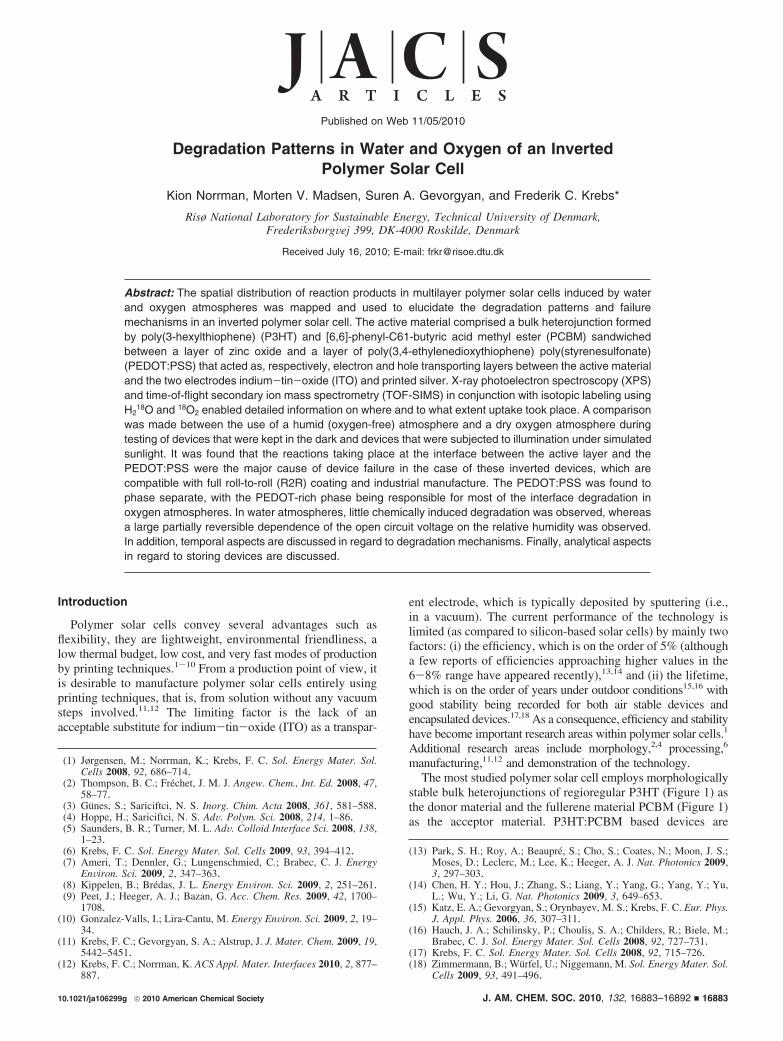
Temporal Considerations in Regard to DegradationMechanisms. Figure 4 shows the oxygen uptake at variousillumination times in ambient air for spin-coated materials usedin the device type described in this work. Equivalent plots canbe constructed on the basis of TOF-SIMS fragment ionintensities. This is shown in Figure 10 for P3HT:PCBM spin-coated onto glass. These should not be mistaken for depthprofiles. The corresponding plots for P3HT are equivalent dueto the P3HT enrichment at the P3HT:PCBM-air interface.Chemical changes that take place as a result of illuminationwill be manifested in the fragment ion intensities. Fragment ionsare formed in the ionization part of the analysis process. FromFigure 5a, it is evident that sulfur reacts with water and/ormolecular oxygen during illumination in ambient air, which willincrease the CxHySOz
- and SOx- intensities as observed in Figure
10. As a consequence, the CxHyS- ions originating from theintact P3HT are observed to decrease in intensity. The increasein CxHyOz
- intensities suggest that either the thiophene carbonbecomes oxygenated (reacts with water and/or molecularoxygen) or (more probably) the side chains are oxygenated. Itis very difficult, based on TOF-SIMS data alone, to concludeon the specific details of the mechanisms. The important
observation is the fact that after ∼1 and ∼7 h some of the trendschange. This could be interpreted as new degradation processes/mechanisms that are starting to appear and/or that old processes/mechanisms are disappearing. The most drastic change isobserved for SOx
- and CxHyOz- that are observed to decrease
after ∼7 h. One possible explanation could be that the populationof R-SOx moieties decreases as a result of gaseous SO2 andSO3 formation. Furthermore, at some point, one would intu-itively expect the intact side-chain population to becomeexhausted, which could possibly explain the decrease in CxHyOz
-
after ∼7 h. The plots in Figure 10 neatly demonstrate that notall degradation processes take place continuously to the sameextent and, at the same time. A specific degradation processcan be restricted to a time window, that is, a photon dosewindow. It is thus important to consider the illumination dosewhen studying degradation of materials. The observationsdescribed earlier in this work are good examples of this fact.Introduction of a barrier layer such as PEDOT:PSS willsignificantly impede water and/or molecular-induced degradationof P3HT:PCBM, which is manifested in the lack of somedegradation reactions (Figure 6). According to the informationextracted from Table 2 and Figures 5 and 6, it was concludedthat during the lifetime of the devices that were studied in thiswork, it was not possible to detect formation of sulfoxides, andonly ∼3% of the carbon was observed to transform to R-COOH(presumably mainly from the side chains). The processes thatare described in Figure 10 are therefore most likely notrepresentative of the degradation processes that take place duringthe lifetime of the devices during operation and would beexpected after very extended periods of testing complete devices.
Oxygen Uptake - Effect of Storing Time. The two nonen-capsulated devices that were illuminated in a dry 18O2:N2 oroxygen free H2
18O:N2 were monitored over time with respectto the 18O/16O ratio on three surfaces: (i) the PEDOT:PSS surface(between the silver stripes, Figure S5), (ii) the P3HT:PCBMsurface (after removal of the PEDOT:PSS layer, Figure S5),and (iii) the ZnO surface (after removal of the P3HT:PCBMlayer). The oxygen uptake in ZnO could not be quantified dueto the saturated 16O signal. As an alternative, the ratio wasmonitored by setting the zero time 18O/16O value to 100%. The16O saturation on the ZnO surface is assumed to be the samefor all measurements. The result is presented in Table 3.Intuitively, one would expect to observe either an unchangedratio or a decrease. 16O can be added from ambient molecular
Figure 9. TOF-SIMS depth profiles (starting from the P3HT:PCBMsurface) for the device that was illuminated in a dry 18O2:N2 atmosphere:C3
- (PCBM, with a possible contribution from P3HT) and ZnO2- (ZnO).
The profiles were normalized against the total intensity to remove possibleinstrument effects. The profiles labeled “18O2” and “H2
18O” are the 18O/16Ointensity ratio profiles for the devices that were exposed to a dry 18O2:N2
or an oxygen free H218O:N2 atmosphere. The vertical dashed line represents
the P3HT:PCBM-ZnO interface.
Figure 10. TOF-SIMS intensity plots for fragment ions obtained on aP3HT:PCBM surface for various exposure times (1000 W m-2, 72 ( 2°C) in ambient air (43 ( 5% rh). The “x”, “y”, and “z” indicate that aseries of signals show the same behavor. Each point is an average of fivemeasurements on different surface locations. The standard deviations arenot shown for clarity.
16890 J. AM. CHEM. SOC. 9 VOL. 132, NO. 47, 2010
A R T I C L E S Norrman et al.
oxygen and/or water. Reacted 18O could be removed if it camefrom a reversible process, or if it reacts further with ambientmolecular oxygen and/or water forming volatile compounds(e.g., CO18O). The only situation one would not expect is anincrease in the 18O/16O ratio because 18O cannot be specificallyadded from the ambient. However, this is exactly what isobserved for the PEDOT:PSS surface illuminated in the H2
18Oatmosphere.
One possible explanation could be that an oxygen-containingcompound present in PEDOT:PSS that did not react with H2
18Owas slowly removed from the analyzed surface. Excess PSS isknown to segregate and is thus a candidate, assuming it did notreact with H2
18O. It could also be one or more of the additivesin PEDOT:PSS. The corresponding increase in the standarddeviation suggests that the 18O reaction products become moreheterogeneously distributed on the surface over time. The otherPEDOT:PSS surface (18O2:N2) exhibits the opposite behavior;that is, the 18O/16O ratio decreases over time.
In light of the strange behavior for the corresponding PEDOT:PSS surface from the H2
18O atmosphere, it is difficult toelaborate further, especially because PEDOT:PSS containsunknown additives. This led us to further study the PEDOT:PSS using two-dimensional imaging as shown in Figure 11.Figure 11 also shows the result of an experiment where twopartial devices (ITO-ZnO-P3HT:PCBM-PEDOT:PSS) wereilluminated without encapsulation for three weeks in a dry 18O2:N2 or an oxygen free H2
18O:N2 atmosphere (Figure 11a-d) orin a H2
18O atmosphere (Figure 11e-h). The TOF-SIMS imagesof the PEDOT:PSS surfaces reveal that the layers have phaseseparated into a PEDOT-rich and a PSS-rich phase. Each phasewas identified from area-specific TOF-SIMS mass spectra (notshown). Figure 11b shows that 18O2 reacted almost exclusivelywith PEDOT, and Figure 11c reveals that it is at least the sulfurin PEDOT that significantly reacted with 18O2. Figure 11a showsthe in-plane distribution of 16O that originates primarily fromthe -SO3H group in PSS. According to the mass spectrum (notshown), the -SO3H group did not exchange oxygen with 18O2.Figure 11e-h shows the corresponding images for the partialdevice that was exposed to a H2
18O atmosphere. The phaseseparation is not as clear, but still visible. H2
18O appears to reactto a much lesser extent and not mainly with one phase. Theoxygen incorporation can be semiquantitatively compared fromthe 18O/16O ratios. Because PEDOT and PSS contain differentamount/types of 16O (natural oxygen), the entire surfaces arecompared. The H2
18O exposed surface has an 18O/16O ratio of2% (as compared to the “natural” ratio of 0.2%), and the 18O2
exposed surface has an 18O/16O ratio of 15%. Any differenceobserved (other than oxygen incorporation) in the mass spectral
data between the two surfaces must be related to chemicalchanges induced/caused by the atmosphere. One such differencewas observed (not shown). One of the unknown additives inPEDOT:PSS is a fluorinated carbon species (most possibly adetergent material), which according to the mass spectral data(not shown) seem to be surface enriched for the H2
18O exposedsurface. The F/16O ratios demonstrate this very well. The 18O2
exposed surface has an F/16O ratio of 8%, and the H218O exposed
surface has an F/16O ratio of 157%. Because the identity of thefluorinated carbon species is unknown, it is difficult to give firmconclusions, but the gradual surface enrichment in the presenceof water concurs with the idea, and we ascribe the surfaceenrichment to be due to migration of fluorinated nonionicdetergents to the surface in humid atmospheres, whereas theydo not diffuse in dry atmospheres (or to a much lesser extent).In summary, the phase separation is more pronounced when adry 18O2:N2 atmosphere is used as compared to an oxygen freeH2
18O:N2 atmosphere. Because phase separation is observed forboth atmospheres, it is likely a heat-induced phenomenonpossibly affected to some extent by the atmosphere. H2
18O iscausing surface enrichment of an unknown fluorinated carbonspecies. 18O2 reacts mainly with PEDOT, and at least with thesulfur functionality. H2
18O reacts nonspecifically and to a muchlesser extent as compared to 18O2. As a consequence of the phaseseparation, PEDOT becomes less shielded by PSS and thus moresusceptible toward 18O2-induced degradation. Furthermore, thein-plane degradation pattern in the sublayers is identical to thePEDOT pattern (not shown), which suggests that oxygen ismainly diffusing trough the PEDOT phase. This phenomenoncould explain why the inverted devices (ITO-ZnO-P3HT:PCBM-PEDOT:PSS-Ag) have a short lifetime in an O2:N2
atmosphere, and a relatively long lifetime in a H2O atmosphere;that is, the phase separation deteriorates the barrier propertieswith respect to O2 and favors transport of oxygen through thePEDOT phase with faster and selective oxidation at thatinterface. Incidentally, the PEDOT phase is also the phase thatconducts the electrical current, thus implying that transport ismore quickly impeded. From an OPV stability point of view,this phase separation is clearly undesirable, and countermeasuresshould be implemented possibly via a modified version ofPEDOT:PSS that is more resilient toward phase separation oralternatively an alternative to PEDOT:PSS.
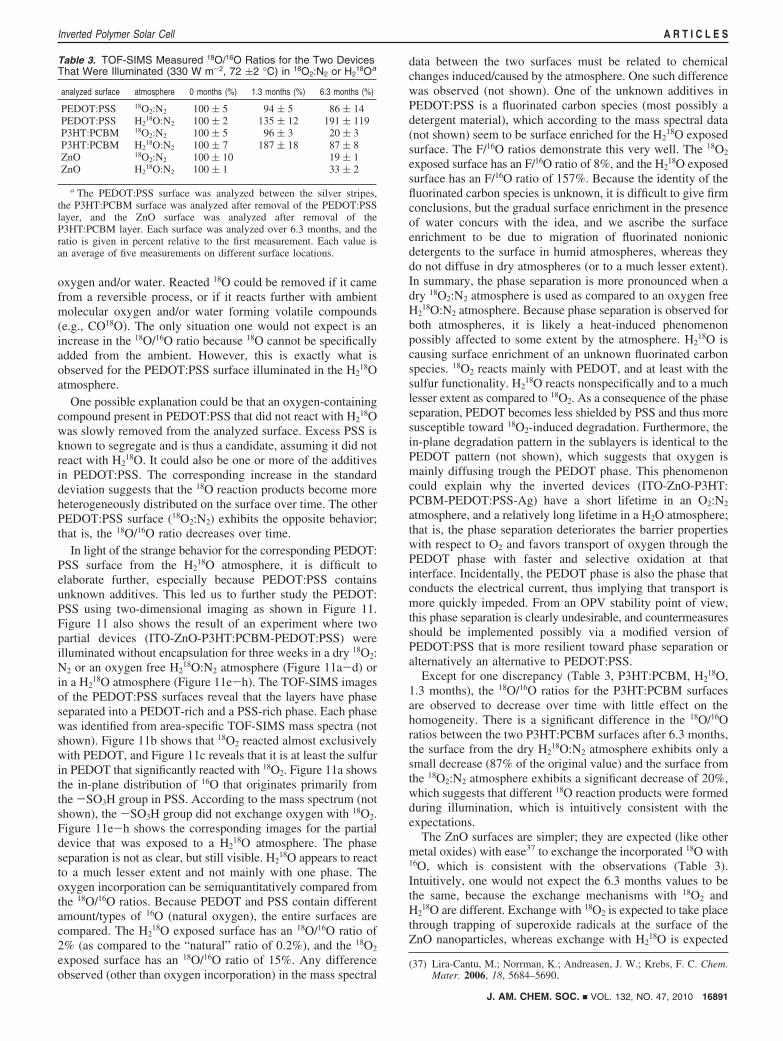
Except for one discrepancy (Table 3, P3HT:PCBM, H218O,
1.3 months), the 18O/16O ratios for the P3HT:PCBM surfacesare observed to decrease over time with little effect on thehomogeneity. There is a significant difference in the 18O/16Oratios between the two P3HT:PCBM surfaces after 6.3 months,the surface from the dry H2
18O:N2 atmosphere exhibits only asmall decrease (87% of the original value) and the surface fromthe 18O2:N2 atmosphere exhibits a significant decrease of 20%,which suggests that different 18O reaction products were formedduring illumination, which is intuitively consistent with theexpectations.
The ZnO surfaces are simpler; they are expected (like othermetal oxides) with ease37 to exchange the incorporated 18O with16O, which is consistent with the observations (Table 3).Intuitively, one would not expect the 6.3 months values to bethe same, because the exchange mechanisms with 18O2 andH2
18O are different. Exchange with 18O2 is expected to take placethrough trapping of superoxide radicals at the surface of theZnO nanoparticles, whereas exchange with H2
18O is expected
(37) Lira-Cantu, M.; Norrman, K.; Andreasen, J. W.; Krebs, F. C. Chem.Mater. 2006, 18, 5684–5690.
Table 3. TOF-SIMS Measured 18O/16O Ratios for the Two DevicesThat Were Illuminated (330 W m-2, 72 (2 °C) in 18O2:N2 or H2
18Oa
analyzed surface atmosphere 0 months (%) 1.3 months (%) 6.3 months (%)
PEDOT:PSS 18O2:N2 100 ( 5 94 ( 5 86 ( 14PEDOT:PSS H2
18O:N2 100 ( 2 135 ( 12 191 ( 119P3HT:PCBM 18O2:N2 100 ( 5 96 ( 3 20 ( 3P3HT:PCBM H2
18O:N2 100 ( 7 187 ( 18 87 ( 8ZnO 18O2:N2 100 ( 10 19 ( 1ZnO H2
18O:N2 100 ( 1 33 ( 2
a The PEDOT:PSS surface was analyzed between the silver stripes,the P3HT:PCBM surface was analyzed after removal of the PEDOT:PSSlayer, and the ZnO surface was analyzed after removal of theP3HT:PCBM layer. Each surface was analyzed over 6.3 months, and theratio is given in percent relative to the first measurement. Each value isan average of five measurements on different surface locations.
J. AM. CHEM. SOC. 9 VOL. 132, NO. 47, 2010 16891
Inverted Polymer Solar Cell A R T I C L E S

to take place through exchange of hydroxide on the surface ofthe ZnO nanoparticles.
The findings in Table 3 demonstrate that time is an importantfactor after illumination in an isotopically labeled atmosphere;one should not store the samples for too long. To illustrate theimportance, the two devices in question were stored in darknessin a vacuum for 90% of the 6.3 months and in ambient air indarkness for the remaining time, which was sufficient to affectthe 18O contents significantly for some of the surfaces/materials.
Conclusions
Water- and oxygen-induced degradation of an invertedpolymer solar cell (ITO-ZnO-P3HT:PCBM-PEDOT:PSS-Ag)was studied using XPS and TOF-SIMS in conjunction with theisotopically labeled atmospheres H2
18O and 18O2:N2 that pro-vided detailed information on where and to what extentdegradation had occurred in the devices. For direct exposure toillumination in ambient air, it was found that P3HT, PCBM,P3HT:PCBM, and PEDOT:PSS all experience oxygen uptakeover time, more specifically, the formation of R-SOx andR-COOH species along with various other oxygenated carbonspecies. However, PEDOT:PSS both gains and looses oxygen;initially oxygen loss outweighs the oxygen gain that laterbecomes the dominant process. It was found that during thelifetime of the devices the extent of oxygen uptake is less thanthe uncertainty of the XPS measurement. TOF-SIMS data werethus calibrated against XPS data that enabled a low-level ofoxygen to be measured. For both devices, it was found thatduring the lifetime of the devices no detectable R-SOx speciesare formed in P3HT:PCBM and PEDOT:PSS, and only a fewpercent of the carbons had been oxygenated in P3HT:PCBM,which presumably constitute some of the side chains. The lowestoxygen uptake (0.001 atom %) during the lifetime was foundfor P3HT:PCBM for the device that was kept in darkness, andthe highest oxygen uptake (0.3 atom %) was found for PEDOT:PSS for the device that was kept in darkness. For 18O2:N2, theoxygen uptake increases for both PEDOT:PCBM and PEDOT:PSS when illuminated as compared to storing under equivalentconditions but in darkness. For oxygen free H2
18O:N2, thebehavior is opposite, as illumination decreases the oxygenuptake, which is ascribed to a temperature effect. TOF-SIMSdepth profiling revealed that H2
18O and 18O2 both had reacted
throughout the P3HT:PCBM layer and had accumulated at theP3HT:PCBM-ZnO interface. The reactivity of 18O2 towardP3HT:PCBM was approximately twice the H2
18O reactivityunder the conditions in question. The complex nature ofdegradation processes was demonstrated by monitoring thetemporal development of degradation for P3HT:PCBM. Not alldegradation processes take place continuously to the sameextent, and at the same time, a specific degradation process canbe restricted to a time window, that is, a photon dose window.It was shown that during storing of the devices in darkness afterall the measurements were done, the materials change over time.PEDOT:PSS was found to phase separate, and the PEDOT andthe PSS phases showed different reactivity toward oxygen withselective oxidation of the PEDOT phase and subsequentoxidation throughout the device layers beneath the PEDOTphase. We thus demonstrated that for the inverted devices themajor failure mechanism is related to the PEDOT:PSS phaseseparation and the PEDOT:PSS-active layer interface. Wetentatively ascribe this to the necessary presence of surface activematerials in the PEDOT:PSS formulation, which leads todynamic electrical behavior as a function of the atmosphericconditions. The possible implications of this are that PEDOT:PSS should be sought replaced in the context of polymer solarcells or reformulated to remove the dynamic dependence of theperformance on the relative humidity.
Acknowledgment. This work was supported by the DanishStrategic Research Council (DSF 2104-05-0052 and 2104-07-0022),EUDP (j. nr. 64009-0050), and PV-ERA-NET (project acronymPOLYSTAR).
Supporting Information Available: Experimental details.Variation in Voc, Isc, and FF with step changes in humidity.Electric resistance and relative humidity versus time for aPEDOT:PSS film. Electric resistance versus relative humidityfor a PEDOT:PSS film. TOF-SIMS ion image showing the in-plane distribution of ITO in the P3HT:PCBM layer close tothe ZnO interface. This material is available free of charge viathe Internet at http://pubs.acs.org.
JA106299G
Figure 11. TOF-SIMS ion images (500 × 500 µm2) of PEDOT:PSS surfaces from partial devices with the composition ITO-ZnO-P3HT:PCBM-PEDOT:PSS (no Ag electrode). The devices were illuminated (AM1.5, 330 W m-2, 65 ( 2 °C) without encapsulation for 3 weeks in a dry 18O2:N2 (1 atm) atmosphere(A-D) or in an oxygen free H2
18O:N2 (65 ( 2% rh) atmosphere (E-H). Black corresponds to 0% signal, gray to some signal, and white to 100% signal.
16892 J. AM. CHEM. SOC. 9 VOL. 132, NO. 47, 2010
A R T I C L E S Norrman et al.