Embed Size (px)
Citation preview
Research Collection
Doctoral Thesis
Elimination of pharmaceuticals during oxidative treatmentof drinking water and wastewater: application of ozone andchlorine dioxide
Author(s): Huber, Marc Martin
Publication Date: 2004
Permanent Link: https://doi.org/10.3929/ethz-a-004907888
Rights / License: In Copyright - Non-Commercial Use Permitted
This page was generated automatically upon download from the ETH Zurich Research Collection. For moreinformation please consult the Terms of use.
ETH Library
Diss. ETH No. 15768
Elimination of Pharmaceuticals during Oxidative Treatment of Drinking Water and Wastewater: Application of Ozone
and Chlorine Dioxide
A dissertation submitted to the SWISS FEDERAL INSTITUTE OF TECHNOLOGY ZURICH
for the degree of DOCTOR OF SCIENCES
presented by MARC MARTIN HUBER Dipl. Umwelt-Natw. ETH
born 31.10.1974 citizen of Oberwil-Lieli (AG)
accepted on the recommendation of Prof. Dr. Walter Giger, examiner
Prof. Dr. René P. Schwarzenbach, co-examiner PD Dr. Urs von Gunten, co-examiner
PD Dr. Thomas A. Ternes, co-examiner
Zurich 2004

Dank An erster Stelle möchte ich Urs von Gunten für die ausgezeichnete Betreuung
meiner Diss danken. Er gab mir die Möglichkeit selbständig und
eigenverantwortlich zu arbeiten, hatte jedoch stets viel Zeit für Diskussionen,
sobald seine Unterstützung benötigt wurde. Besonders wertvoll war für mich,
dass er jeweils in den kritischen Momenten, wenn es darum ging Lösungen für
Probleme zu finden oder das weitere Vorgehen zu beschliessen, meine Arbeit
immer wieder mit den entscheidenden Ideen in die richtige Richtung lenkte.
Walter Giger und René Schwarzenbach danke ich für ihr Interesse an meiner
Arbeit und ihre Bereitschaft das Referat bzw. das Korreferat zu übernehmen.
Ein grosses Dankeschön geht an meinen externen Korreferenten Thomas
Ternes. Dank ihm hatte ich die Möglichkeit vier Monate am ESWE-Institut in
Wiesbaden zu forschen und dabei LC-MS/MS- und GC-MS-Erfahrungen zu
sammeln. Es war für meine Diss auch eine grosse Bereicherung im POSEIDON-
Projekt mitzuarbeiten, das von ihm in einer hervorragenden Art und Weise
koordiniert wurde.
Ich möchte auch den übrigen Kollegen von POSEIDON danken für die
erfolgreiche Zusammenarbeit und die schöne Zeit, die wir jeweils an den
Meetings verbringen durften. Speziell bedanke ich mich bei Derek McDowell,
Anke Göbel und Adriano Joss mit denen ich eine besonders enge und produktive
Zusammenarbeit pflegen konnte.
Mein Dank geht auch an alle anderen, die zu meiner Diss in irgendeiner
Weise beigetragen haben. Namentlich erwähnen möchte ich Barbara
Rutishauser, Nadine Bramaz, Daniel Sutter und Mischa Zschokke ohne deren
Hilfe ich die YES Experimente kaum hätte erfolgreich durchführen können.
Gun-Young Park und René Schönenberger danke ich für die Experimente bzw.
die LC-MS/MS Analysen, die sie für mich gemacht haben.
Ich werde die Arbeit in der Trinkwasserchemie-Gruppe als wundervolle Zeit
in Erinnerung behalten. Geschätzt habe ich vor allem die sehr freundliche und
internationale Atmosphäre sowie die grosse Bereitschaft zur gegenseitigen
Unterstützung. In Bezug auf W+T werden mir besonders die gemeinsamen
Ausflüge in Erinnerung bleiben. In diesem Zusammenhang möchte ich Olivier
Leupin für das Organisieren der unvergesslichen Ski- und Klettertouren in den
Schweizer Alpen danken.
Schliesslich möchte ich auch meinen Eltern und Schwestern für ihre
Unterstützung danken. Sie haben unter anderem bestens dafür gesorgt, dass ich
mich jeweils von der wissenschaftlichen Arbeit erholen konnte, sei es am
Wochenende im ländlichen Oberwil, während Aufenthalten in Paris oder
während den Ferien auf fernen Inseln.
Table of Contents
Summary v
Zusammenfassung viii
1 General Introduction 1
1.1 Pharmaceuticals in the Aquatic Environment 2
1.2 Drinking-Water Treatment 6
1.3 Ozonation 8 1.3.1 Drinking Water 8 1.3.2 Municipal Wastewater 10 1.3.3 Ozone Chemistry 11 1.4 Treatment with Chlorine Dioxide 16 1.4.1 Chlorine Dioxide Chemistry 16 1.5 Kinetic Concepts 18 1.5.1 Determination of Rate Constants under Pseudo-first-order Conditions 20 1.5.2 Competition Kinetics, Method 1 22 1.5.3 Competition Kinetics, Method 2 24 1.5.4 Predicting the Extent of Oxidation of Micropollutants 25 1.6 Objectives 27
1.7 Outline 28
1.8 References 30
2 Oxidation of Pharmaceuticals during Ozonation and Advanced Oxidation Processes 35
2.1 Introduction 37
2.2 Materials and Methods 38 2.2.1 Standards and Reagents 38 2.2.2 Natural Water Systems 40 2.2.3 Analytical Methods 40 2.2.4 Determination of Rate Constants for the Reaction of Pharmaceuticals with Ozone 41 2.2.5 Determination of Rate Constants for the Reaction of Pharmaceuticals with Hydroxyl Radicals 45 2.2.6 Ozonation of Natural Waters 46 2.3 Results and Discussion 47 2.3.1 Rate Constants for the Reaction of Selected Pharmaceuticals with Ozone 47 2.3.2 Expected Reactivity of other Pharmaceuticals 42 2.3.3 Rate Constants for the Reaction of Pharmaceuticals with Hydroxyl Radicals 43
ii Table of Contents
2.3.4 Product Formation 55 2.3.5 Oxidation of Fast-Reacting Pharmaceuticals in Natural Waters and Bromate Formation 56 2.3.6 Oxidation of Slow-Reacting Pharmaceuticals during Ozonation of Natural Waters 58 2.4 References 65
3 Oxidation of Pharmaceuticals during Water Treatment with Chlorine Dioxide 69
3.1 Introduction 71 3.1.1 Pharmaceuticals in the Environment 71 3.1.2 Application of Chlorine Dioxide for Water Treatment 72 3.1.3 Chemical Aspects of Chlorine Dioxide 72 3.1.4 Objectives of the Present Study 73 3.2 Experimental Methods 73 3.2.1 Chemicals 73 3.2.2 Analytical Methods 74 3.2.3 Determination of Rate Constants 75 3.2.4 Oxidation in Drinking Water 78 3.2.5 Oxidation in Lake Water 78 3.2.6 Oxidation in Groundwater 79 3.3 Results and Discussion 80 3.3.1 Oxidation in Drinking Water 83 3.3.2 Oxidation in Lake Water 83 3.3.3 Oxidation in Groundwater 86 3.3.4 Oxidation Products 90 3.3.5 Comparison of Chlorine Dioxide with Ozone and Chlorine 90 3.4 Conclusions 93
3.5 References 94
4 Removal of Estrogenic Activity and Formation of Oxidation Products during Ozonation of 17α-Ethinylestradiol 97
4.1 Introduction 99
4.2 Experimental Section 101 4.2.1 Standards and Reagents 101 4.2.2 Determination of EE2 101 4.2.3. Determination of Ozone, Hydroperoxides, and Formic Acid 102 4.2.4 LC-MS/MS Analysis 103 4.2.5 GC/MS Analysis 103 4.2.6 Recombinant Yeast Screen (YES) 104 4.2.7 Ozonation Experiments for YES 105 4.2.8 Kinetics of Reappearance of EE2 after Ozonation 107 4.2.9 Investigation of Product Formation 107 4.3 Results and Discussions 108
Table of Contents iii
4.3.1 Reduction of Estrogenicity with Substoichiometric Ozone Doses 108 4.3.2 Reduction of Estrogenicity as a Function of Ozone Exposure 111 4.3.3 Reappearance of EE2 113 4.3.4 Identification of Oxidation Products 115 4.3.5 Ozonation of the Model Compound THN 116 4.3.6 Ozonation of the Model Compound ECH 119 4.3.7 Quantification of Product Formation 121 4.3.8 Oxidation Products of EE2 122 4.3.9 Oxidation Products of 17β-Estradiol (E2) and Estrone (E1) 125 4.3.10 Relationship between the Structures and the Estrogenicity of Oxidation Products 126 4.4 References 128
5 Elimination of Pharmaceuticals during Ozonation of Wastewater Effluents: A Pilot Study 131
5.1 Introduction 133
5.2 Experimental Section 135 5.2.1 Ozonation Pilot Plant 135 5.2.2 Feed Wastewater 136 5.2.3 Spiking of Analytes 137 5.2.4 Sampling and Chemical Analysis 140 5.2.5 Calculation of Relative Residuals 141 5.3 Results and Discussions 142 5.3.1 Influence of the Water Matrix 145 5.3.2 Estimation of the Ozone Absorption Rate of Sludge Particles 148 5.3.3 Oxidation Patterns 153 5.3.4 Prediction of Parent Compound Oxidation 156 5.3.5 Oxidation by Ozone versus Oxidation by Hydroxyl Radicals 158 5.3.6 Practical Implications 159 5.4 References 161
6 General Discussion and Conclusions 165
Curriculum Vitae 173

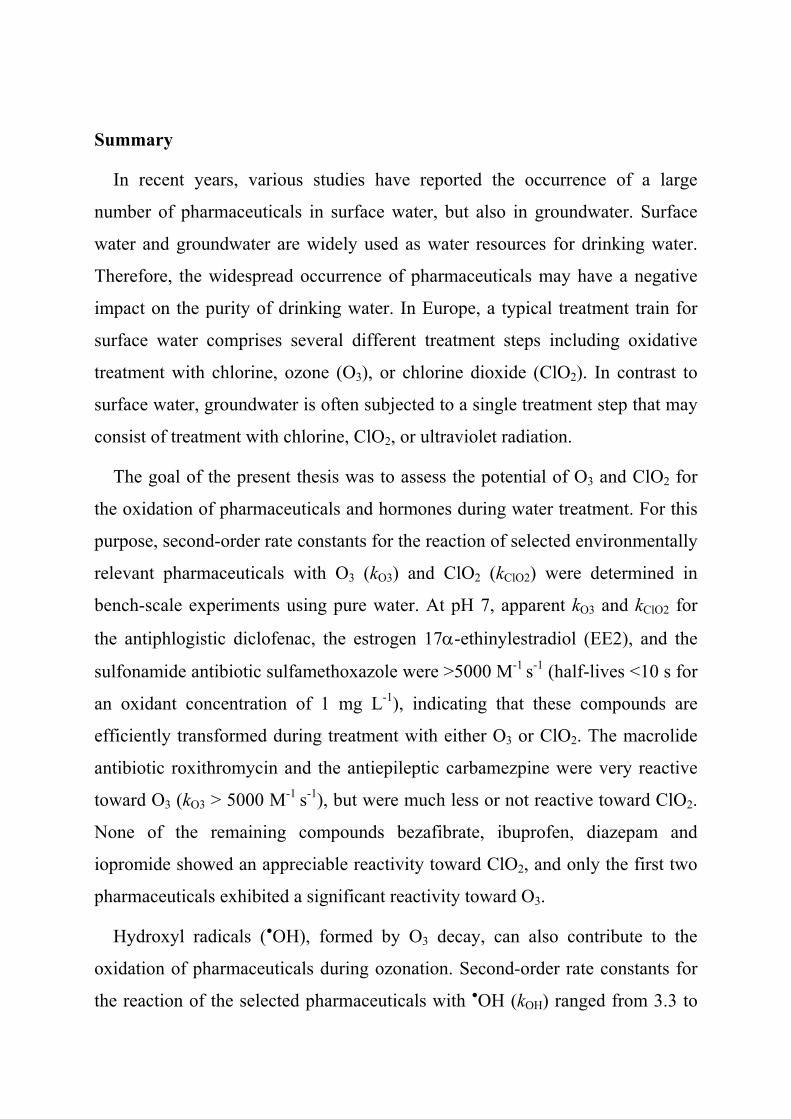
Summary
In recent years, various studies have reported the occurrence of a large
number of pharmaceuticals in surface water, but also in groundwater. Surface
water and groundwater are widely used as water resources for drinking water.
Therefore, the widespread occurrence of pharmaceuticals may have a negative
impact on the purity of drinking water. In Europe, a typical treatment train for
surface water comprises several different treatment steps including oxidative
treatment with chlorine, ozone (O3), or chlorine dioxide (ClO2). In contrast to
surface water, groundwater is often subjected to a single treatment step that may
consist of treatment with chlorine, ClO2, or ultraviolet radiation.
The goal of the present thesis was to assess the potential of O3 and ClO2 for
the oxidation of pharmaceuticals and hormones during water treatment. For this
purpose, second-order rate constants for the reaction of selected environmentally
relevant pharmaceuticals with O3 (kO3) and ClO2 (kClO2) were determined in
bench-scale experiments using pure water. At pH 7, apparent kO3 and kClO2 for
the antiphlogistic diclofenac, the estrogen 17α-ethinylestradiol (EE2), and the
sulfonamide antibiotic sulfamethoxazole were >5000 M-1 s-1 (half-lives <10 s for
an oxidant concentration of 1 mg L-1), indicating that these compounds are
efficiently transformed during treatment with either O3 or ClO2. The macrolide
antibiotic roxithromycin and the antiepileptic carbamezpine were very reactive
toward O3 (kO3 > 5000 M-1 s-1), but were much less or not reactive toward ClO2.
None of the remaining compounds bezafibrate, ibuprofen, diazepam and
iopromide showed an appreciable reactivity toward ClO2, and only the first two
pharmaceuticals exhibited a significant reactivity toward O3.
Hydroxyl radicals ( OH), formed by O3 decay, can also contribute to the
oxidation of pharmaceuticals during ozonation. Second-order rate constants for
the reaction of the selected pharmaceuticals with OH (kOH) ranged from 3.3 to
vi
9.8 × 10⁹ M-1 s-1. Due to the relatively high OH rate constants, O3 refractive
pharmaceuticals will also be oxidized to a significant extent during ozonation. It
was shown that a faster oxidation of such compounds can be achieved by
applying advanced oxidation processes (AOPs) like the O3/H2O2 process.
Experiments performed using natural waters demonstrated that kO3, kOH, and
kClO2, which were determined in pure aqueous solution, could be applied to
predict the behavior of pharmaceuticals spiked to natural waters. For ClO2, this
could also be shown for concentrations in the ng/L-range.
Oxidative treatment results in the transformation of pharmaceuticals, but does
not lead to full mineralization. Taking EE2 as an example, it was tested whether
its oxidation products formed during ozonation still exhibit the pharmacological
effect (estrogenic activity) of the parent compound. For this purpose, a
recombinant yeast estrogen screen was used. The results showed that the
estrogenic activity of EE2-containing solutions is reduced by a factor of 200 to
500 by ozonation. These findings demonstrate that the modifications in the
structure of EE2 caused by oxidation were significant enough to substantially
reduce the activity of the oxidation products. The identification of oxidation
products of EE2 with the help of LC-MS/MS and model compounds proved that
ozonation destroys the phenolic moiety of EE2, which is essential for the
binding of EE2 to the estrogen receptor.
To reduce the release of pharmaceuticals and hormones in the aquatic
environment, ozonation could be applied to wastewater effluents. Pilot-scale
experiments performed in a municipal wastewater treatment plant demonstrated
that relatively low O3 doses (≥2 mg L-1) are required to oxidize fast-reacting
pharmaceuticals such as macrolide and sulfonamide antibiotics, diclofenac,
naproxen, 17α-ethinylestradiol and natural estrogens. It could also be shown
vii
that suspended solids have only a minor effect on the oxidation of the
investigated compounds.
In light of the high reactivity of many pharmaceuticals to O3 and OH and the
successful application of ozonation in pilot-scale, it can be concluded that
ozonation is a promising tool for the control of pharmaceuticals in water
treatment. In contrast, ClO2 is only effective in removing specific, however
important, classes of compounds like macrolide and sulfonamide antibiotics and
estrogens.
viii
Zusammenfassung
In den letzten Jahren haben diverse Studien gezeigt, dass
Spurenkonzentrationen zahlreicher Arzneimittel in Oberflächenwässern und
teilweise auch im Grundwasser nachweisbar sind. Oberflächenwasser und
Grundwasser sind die wichtigsten Ressourcen für die Trinkwassergewinnung.
Das weit verbreitete Auftreten von Arzneimittelrückständen stellt deshalb eine
Gefahr für die Reinheit des Trinkwassers dar. In Europa wird
Oberflächenwasser normalerweise mehrstufig aufbereitet, wobei typischerweise
entweder Chlor, Ozon (O3) oder Chlordioxid (ClO2) als Oxidations- und
Desinfektionsmittel eingesetzt werden. Im Gegensatz dazu wird Grundwasser
häufig nur einer Desinfektion mit Chlor, ClO2 oder Ultraviolett-Bestrahlung
unterzogen.
Das Ziel der vorliegenden Doktorarbeit war es, das Potential von O3 und ClO2
für die Oxidation von Arzneimitteln während der Wasseraufbereitung
abzuschätzen. Zu diesem Zweck wurden in Laborexperimenten mit
Reinstwasser Geschwindigkeitskonstanten 2. Ordnung für die Reaktion von O3
(kO3) und ClO2 (kClO2) mit ausgewählten umweltrelevanten Arzneimitteln
bestimmt. Für das Schmerzmittel Diclofenac, das Östrogen 17α-Ethinylestradiol
(EE2) und das Sulfonamidantibiotikum Sulfamethoxazol waren die scheinbaren
kO3 und kClO2 > 5000 M-1 s-1 bei pH 7 (dies entspricht Halbwertszeiten <10 s für
eine Oxidationsmittelkonzentration von 1 mg L-1). Dieser Wert zeigt, dass die
genannten Substanzen sowohl bei der Anwendung von O3 als auch ClO2
effizient oxidiert werden. Das Makrolidantibiotikum Roxithromycin und das
Antiepileptikum Carbamazepin reagierten sehr schnell mit O3 (kO3 > 5000 M-1
s-1) aber nur relativ langsam respektive gar nicht mit ClO2. Von den übrigen
Verbindungen Bezafibrat, Ibuprofen, Diazepam und Iopromid reagierte keine
ix
messbar mit ClO2 und nur die ersten zwei zeigten eine signifikante Reaktivität
gegenüber O3.
Hydroxylradikale (•OH), die als Folge des Ozonzerfalls entstehen, können
während der Ozonung ebenfalls zur Oxidation von Mikroverunreinigungen
beitragen. Die Bestimmung der Geschwindigkeitskonstanten 2. Ordnung für die
Reaktion ausgewählter Arzneimittel mit •OH (kOH) ergab Werte zwischen 3.3
und 9.8 × 10⁹ M-1 s-1. Aufgrund dieser relativ hohen Geschwindigkeits-
konstanten können während der Ozonung auch Arzneimittel, die nicht direkt mit
O3 reagieren, zu einem guten Teil oxidiert werden. Es wurde auch gezeigt, dass
durch die Anwendung von weitergehenden Oxidationsprozessen (AOPs, z.B.
O3/Wasserstoffperoxid) die Oxidation solcher Substanzen beschleunigt werden
kann.
Experimente in natürlichem Wasser habe gezeigt, dass kO3, kOH und kClO2,
welche in reinen Lösungen bestimmt wurden, angewendet werden können, um
die Oxidation von Arzneimitteln in natürlichem Wasser vorherzusagen.
Zusätzlich konnte für ClO2 gezeigt werden, dass dies auch für realistische
Konzentrationen im ng/L-Bereich gilt.
Oxidative Aufbereitung führt zu einer Transformation von Arzneimitteln aber
nicht zur vollständigen Mineralisation. Am Beispiel von EE2 wurde getestet, in
welchem Ausmass die pharmakologische (östrogene) Aktivität der
Ausgangsverbindung von den während der Ozonung gebildeten
Oxidationsprodukten behalten wird. Zu diesem Zweck wurde eine Hefe-
Östrogen-Test (YES) verwendet. Die Resultate zeigten, dass die östrogene
Aktivität von EE2-Lösungen durch die Behandlung mit O3 um einen Faktor 200
bis 500 vermindert wurde. Diese Ergebnisse demonstrieren, dass die durch die
Oxidation verursachten Veränderungen in der Struktur von EE2 bedeutend
genug sind, um die Aktivität der Substanz beträchtlich zu vermindern. Die
x
Identifikation von Oxidationsprodukten mittels LC-MS/MS und
Modellverbindungen bewies, dass die Ozonung zur Zerstörung der
Phenolgruppe von EE2 führt, welche sehr wichtig für das Binden von EE2 an
den Östrogenrezeptor ist.
Mit der Anwendung von O3 in der Abwasserreinigung sollte es möglich sein,
den Eintrag von Arzneimitteln und Hormonen in die aquatische Umwelt zu
vermindern. Pilotexperimente, die in einer kommunalen Abwasserreinigungs-
anlage durchgeführt wurden, bestätigten, dass relativ kleine O3 Dosen (≥2 mg
L-1) ausreichen, um die schnell reagierenden Arzneimittel zu über 90% zu
oxidieren. Zusätzlich zeigten die Experimente, dass suspendierte Stoffe keinen
grossen Effekt auf die Oxidation dieser Stoffe haben.
In Anbetracht der hohen Reaktivität vieler Arzneimittel gegenüber O3 und •OH sowie der erfolgreichen Anwendung von O3 im Pilotmassstab, kann die
Schlussfolgerung gezogen werden, dass die Ozonung sehr geeignet ist für die
Verminderung der Arzneimittelkonzentration in der Trinkwasseraufbereitung
oder Abwasserreinigung. Im Gegensatz dazu ist ClO2 nur effektiv für die
Oxidation spezifischer, jedoch besonders wichtiger Arzneimittelklassen, wie der
Makrolid- und Sulfonamidantibiotika sowie der Östrogene.

1
General Introduction
2 Chapter 1
1.1 Pharmaceuticals in the Aquatic Environment
Various studies have recently shown that a large number of pharmaceuticals
are ubiquitously present in surface waters that are influenced by wastewater
effluents (1-3). Human or veterinary use is the major source for these
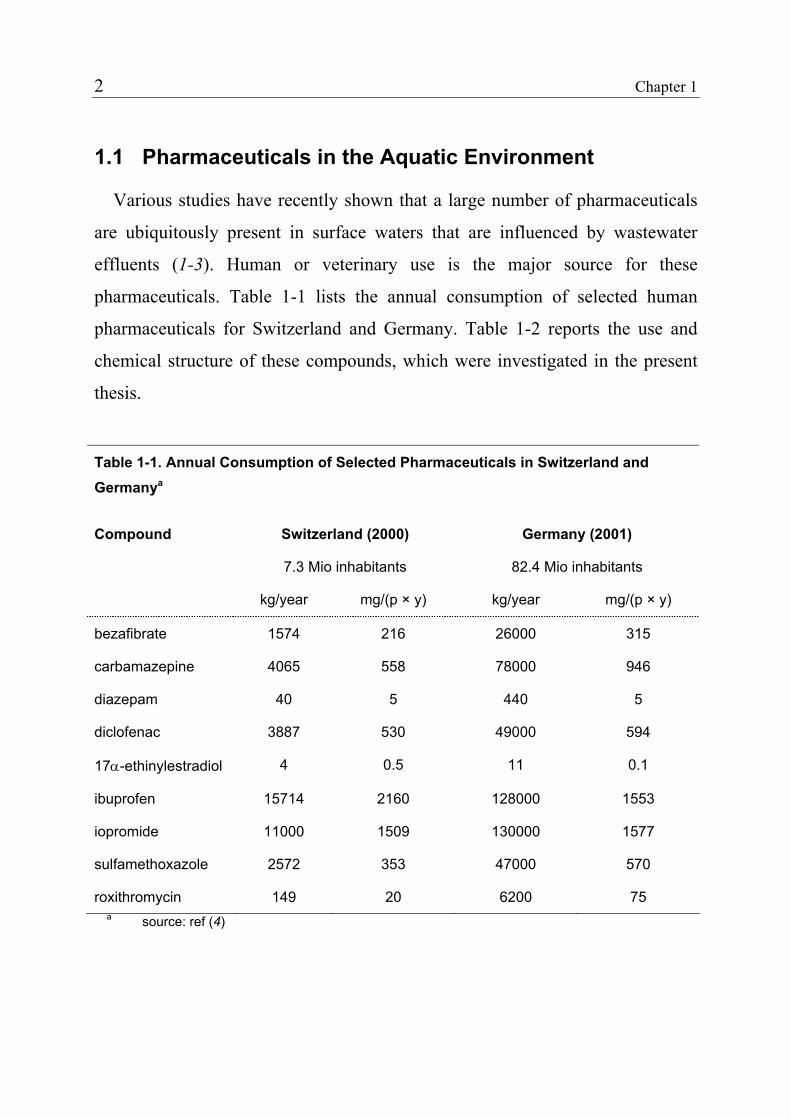
pharmaceuticals. Table 1-1 lists the annual consumption of selected human
pharmaceuticals for Switzerland and Germany. Table 1-2 reports the use and
chemical structure of these compounds, which were investigated in the present
thesis.
Table 1-1. Annual Consumption of Selected Pharmaceuticals in Switzerland and Germanya
Compound Switzerland (2000)
7.3 Mio inhabitants
Germany (2001)
82.4 Mio inhabitants
kg/year mg/(p × y) kg/year mg/(p × y)
bezafibrate 1574 216 26000 315
carbamazepine 4065 558 78000 946
diazepam 40 5 440 5
diclofenac 3887 530 49000 594
17α-ethinylestradiol 4 0.5 11 0.1
ibuprofen 15714 2160 128000 1553
iopromide 11000 1509 130000 1577
sulfamethoxazole 2572 353 47000 570
roxithromycin 149 20 6200 75 a source: ref (4)
General Introduction 3
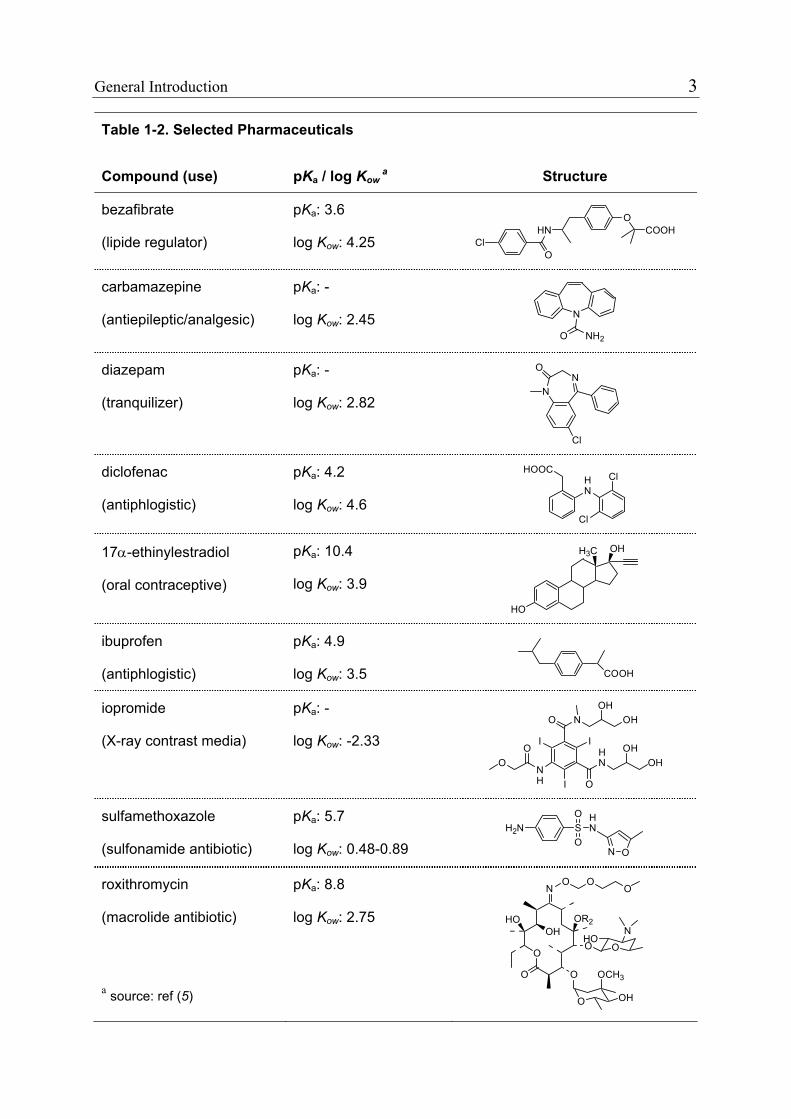
Table 1-2. Selected Pharmaceuticals
Compound (use) pKa / log Kow a Structure
bezafibrate
(lipide regulator)
pKa: 3.6
log Kow: 4.25 HN
O
OCOOH
Cl
carbamazepine
(antiepileptic/analgesic)
pKa: -
log Kow: 2.45 N
NH2O
diazepam
(tranquilizer)
pKa: -
log Kow: 2.82 N
NO
Cl
diclofenac
(antiphlogistic)
pKa: 4.2
log Kow: 4.6
HN
HOOCCl
Cl
17α-ethinylestradiol
(oral contraceptive)
pKa: 10.4
log Kow: 3.9
H3C
HO
OH
ibuprofen
(antiphlogistic)
pKa: 4.9
log Kow: 3.5 COOH
iopromide
(X-ray contrast media)
pKa: -
log Kow: -2.33 HN O
NH
O
N OH
II
I
O
O
OH
OHO
H
sulfamethoxazole
(sulfonamide antibiotic)
pKa: 5.7
log Kow: 0.48-0.89 SO
OH2N
HN
N O
roxithromycin
(macrolide antibiotic)
a source: ref (5)
pKa: 8.8
log Kow: 2.75
O
N
OH
O
O
OR2
O
O
OCH3
OH
HO
O OO
OHO
N
4 Chapter 1
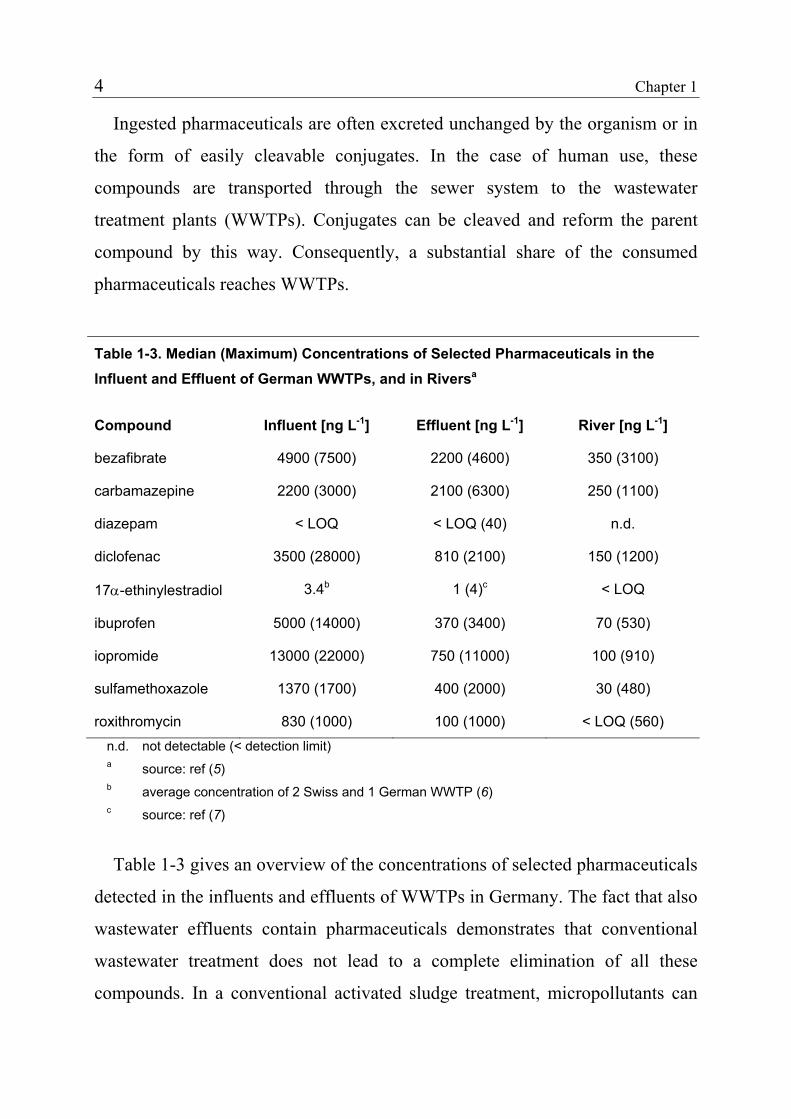
Ingested pharmaceuticals are often excreted unchanged by the organism or in
the form of easily cleavable conjugates. In the case of human use, these
compounds are transported through the sewer system to the wastewater
treatment plants (WWTPs). Conjugates can be cleaved and reform the parent
compound by this way. Consequently, a substantial share of the consumed
pharmaceuticals reaches WWTPs.
Table 1-3. Median (Maximum) Concentrations of Selected Pharmaceuticals in the Influent and Effluent of German WWTPs, and in Riversa
Compound Influent [ng L-1] Effluent [ng L-1] River [ng L-1]
bezafibrate 4900 (7500) 2200 (4600) 350 (3100)
carbamazepine 2200 (3000) 2100 (6300) 250 (1100)
diazepam < LOQ < LOQ (40) n.d.
diclofenac 3500 (28000) 810 (2100) 150 (1200)
17α-ethinylestradiol 3.4b 1 (4)c < LOQ
ibuprofen 5000 (14000) 370 (3400) 70 (530)
iopromide 13000 (22000) 750 (11000) 100 (910)
sulfamethoxazole 1370 (1700) 400 (2000) 30 (480)
roxithromycin 830 (1000) 100 (1000) < LOQ (560) n.d. not detectable (< detection limit) a source: ref (5) b average concentration of 2 Swiss and 1 German WWTP (6) c source: ref (7)
Table 1-3 gives an overview of the concentrations of selected pharmaceuticals
detected in the influents and effluents of WWTPs in Germany. The fact that also
wastewater effluents contain pharmaceuticals demonstrates that conventional
wastewater treatment does not lead to a complete elimination of all these
compounds. In a conventional activated sludge treatment, micropollutants can
General Introduction 5
be removed through biological degradation, sorption onto sludge or stripping
into the air during aeration processes. For pharmaceuticals, the latter process
does usually not lead to a significant removal because the relatively polar
pharmaceuticals generally exhibit a very low volatility (5). Similarly, sorption
onto sludge results for most pharmaceuticals only in a minor removal, because
the sorption coefficients (Kd) of these compounds are typically relatively low (Kd
< 500 L kg-1 (5)). In contrast, a significant elimination through biodegradation
could be observed for many of the investigated pharmaceuticals for sludge ages
>4 d (8,9). Generally, the degradation increased with increasing sludge age.
However, even at higher sludge ages most of the compounds were not
completely degraded and some pharmaceuticals (e.g., carbamazepine) were not
degraded at all.
The concentration of pharmaceuticals in surface water is typically
significantly lower than in effluents (see Table 1-3). The fact that
pharmaceutical concentrations in streams and rivers are positively correlated
with the fraction of the discharge that consists of treated wastewater (1)
demonstrates that dilution is an important factor governing surface water
concentrations. Because many pharmaceuticals are degraded to some extent in
WWTPs, it can be assumed that biodegradation takes also place in the aquatic
environment. Consequently, the observed pharmaceutical concentration in
surface waters can be described as steady-state concentration, which is a
function of the continuous input of pharmaceuticals, dilution and
biodegradation.
The occurrence of pharmaceuticals in groundwater has also been reported
(10,11). Due to dilution and degradation during bank filtration or soil passage,
fewer compounds and lower concentrations of pharmaceuticals are found in
groundwater than in surface water (12). First of all, groundwater influenced by
contaminated surface water or groundwater recharged with treated wastewater is
6 Chapter 1
affected. A further reason for the presence of pharmaceuticals in groundwater
could also be the land application of sludge or manure contaminated with human
and veterinary pharmaceuticals, respectively.
1.2 Drinking-Water Treatment
Surface water and groundwater are the principle water resources used for
drinking water production. Therefore, the occurrence of pharmaceuticals in
these resources could have a negative impact on the purity of drinking water.
Whether the presence of pharmaceuticals in drinking water at levels found in
surface water (< 1 µg/L ) can produce adverse health effects is unclear up to
date. However, based on precautionary principles, the concentration of these
compounds in drinking water should be as low as possible to minimize the risk
of unpredictable long-term effects.
Pharmaceutical concentrations in finished drinking water will depend on raw
water quality and the applied treatment processes. The primary objectives of
surface water treatment are:
• removal of particles
• elimination of undesired dissolved organic compounds (e.g.,
micropollutants and compounds causing color, taste, or odor problems)
• disinfection
Usually a combination of different treatment processes has to be applied to
reach the different objectives. Table 1-4 shows, which processes are commonly
applied to achieve the respective objectives.
Typically, a treatment train for surface water starts with a particle removal
process followed by an oxidation and primary disinfection process. The next
treatment step can consist of activated carbon filtration, either operated as a
General Introduction 7
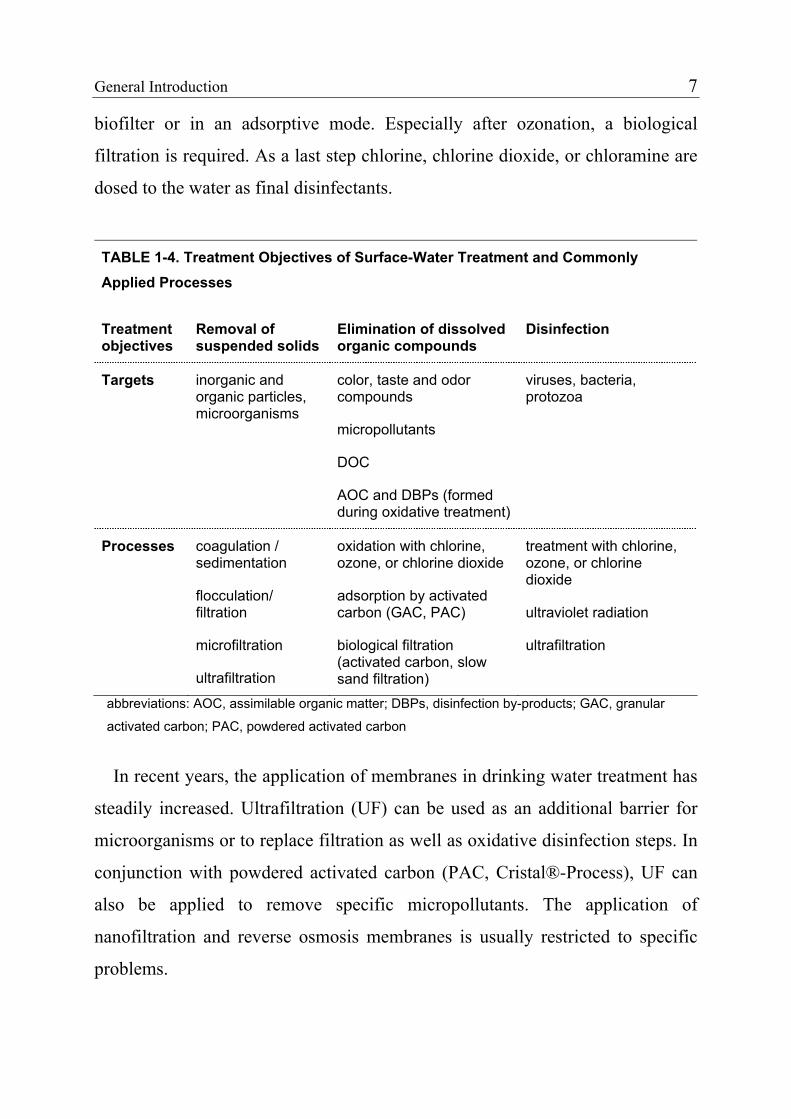
biofilter or in an adsorptive mode. Especially after ozonation, a biological
filtration is required. As a last step chlorine, chlorine dioxide, or chloramine are
dosed to the water as final disinfectants.
TABLE 1-4. Treatment Objectives of Surface-Water Treatment and Commonly Applied Processes
Treatment objectives
Removal of suspended solids
Elimination of dissolved organic compounds
Disinfection
Targets inorganic and organic particles, microorganisms
color, taste and odor compounds
micropollutants
DOC
AOC and DBPs (formed during oxidative treatment)
viruses, bacteria, protozoa
Processes coagulation / sedimentation
flocculation/ filtration
microfiltration
ultrafiltration
oxidation with chlorine, ozone, or chlorine dioxide
adsorption by activated carbon (GAC, PAC)
biological filtration (activated carbon, slow sand filtration)
treatment with chlorine, ozone, or chlorine dioxide
ultraviolet radiation
ultrafiltration
abbreviations: AOC, assimilable organic matter; DBPs, disinfection by-products; GAC, granular
activated carbon; PAC, powdered activated carbon
In recent years, the application of membranes in drinking water treatment has
steadily increased. Ultrafiltration (UF) can be used as an additional barrier for
microorganisms or to replace filtration as well as oxidative disinfection steps. In
conjunction with powdered activated carbon (PAC, Cristal®-Process), UF can
also be applied to remove specific micropollutants. The application of
nanofiltration and reverse osmosis membranes is usually restricted to specific
problems.
8 Chapter 1
In contrast to surface water, groundwater requires less treatment, because it
generally exhibits a lower turbidity and a better hygienic quality. Therefore,
treatment is often limited to a single step that usually consists of disinfection by
chlorine, chlorine dioxide or ultraviolet radiation (13,14). In Switzerland, it is
also common practice to distribute groundwater without any treatment (15).
Bank filtrate, a groundwater in close contact with surface water, may require
more extensive treatment than higher quality groundwater.
A major objective of the European Union project POSEIDON was to assess
the conventional and advanced treatment processes mentioned above with
respect to their potential for removing pharmaceuticals. The main focus of the
project was on processes already applied to remove dissolved organic
compounds like oxidation processes (ozone, chlorine dioxide) and adsorption to
activated carbon (GAC filtration, UF/PAC). Among the oxidation processes,
chlorination was not studied because this process was already investigated by
other research groups. Biological filtration was not investigated either, except
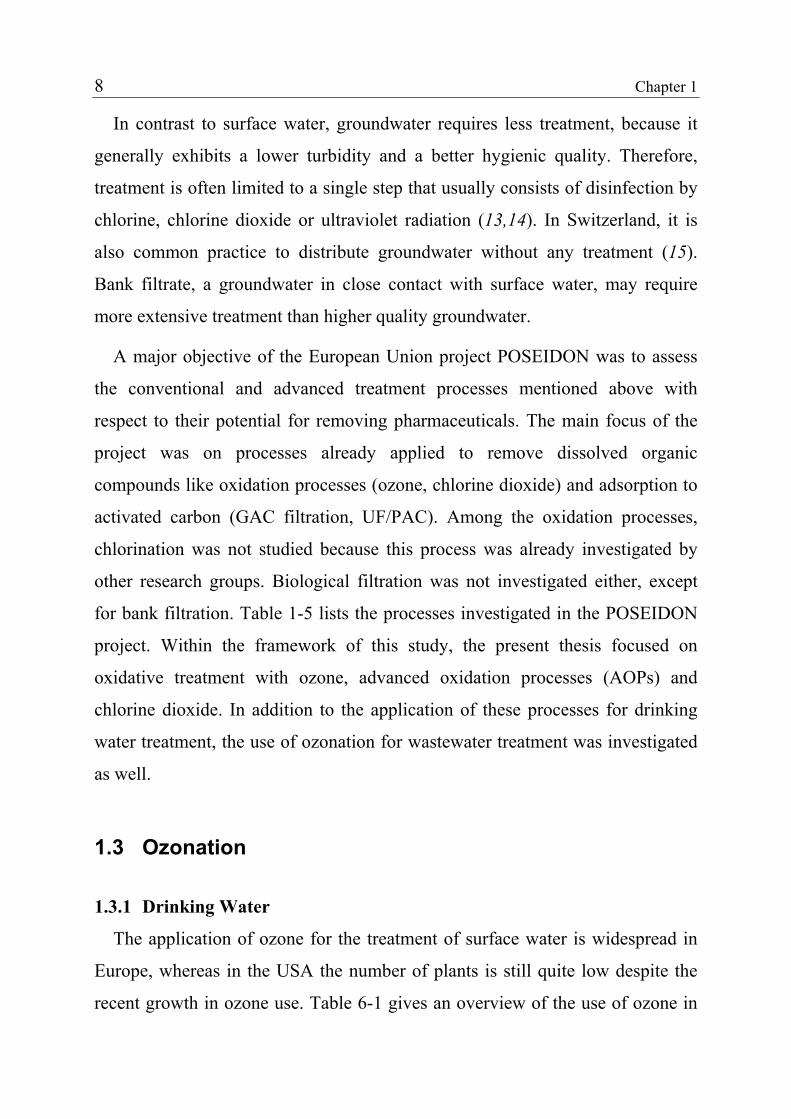
for bank filtration. Table 1-5 lists the processes investigated in the POSEIDON
project. Within the framework of this study, the present thesis focused on
oxidative treatment with ozone, advanced oxidation processes (AOPs) and
chlorine dioxide. In addition to the application of these processes for drinking
water treatment, the use of ozonation for wastewater treatment was investigated
as well.
1.3 Ozonation
1.3.1 Drinking Water
The application of ozone for the treatment of surface water is widespread in
Europe, whereas in the USA the number of plants is still quite low despite the
recent growth in ozone use. Table 6-1 gives an overview of the use of ozone in
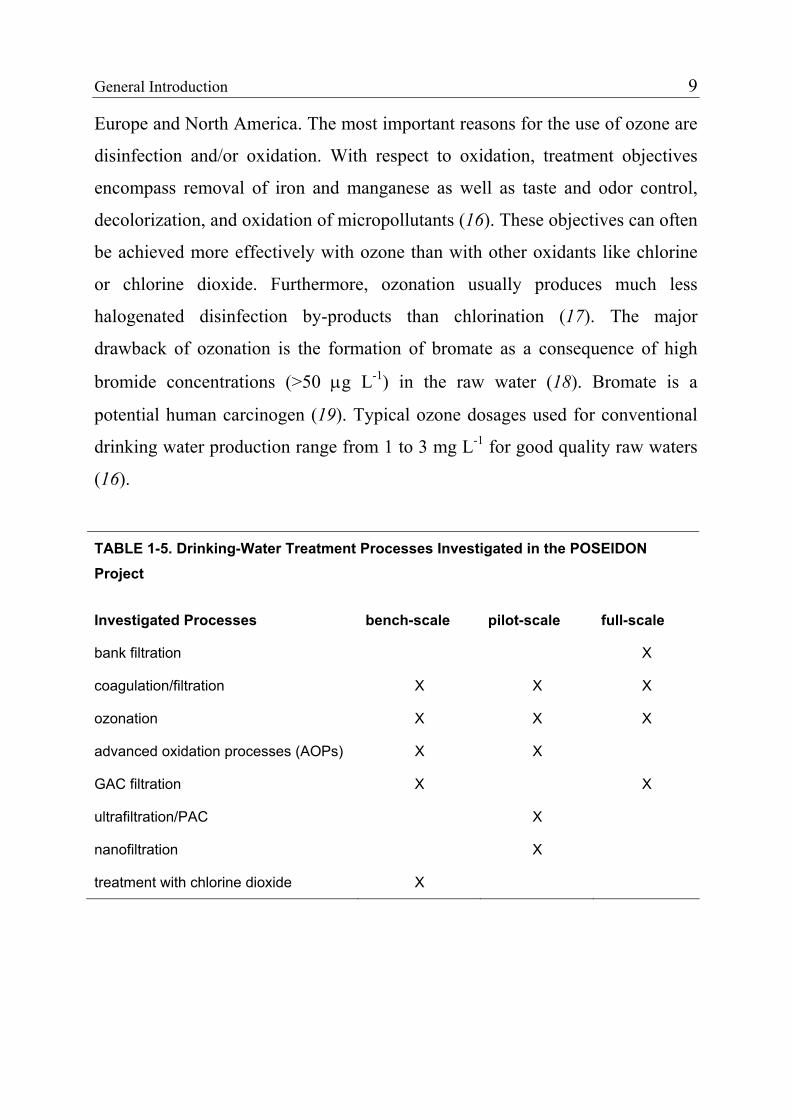
General Introduction 9
Europe and North America. The most important reasons for the use of ozone are
disinfection and/or oxidation. With respect to oxidation, treatment objectives
encompass removal of iron and manganese as well as taste and odor control,
decolorization, and oxidation of micropollutants (16). These objectives can often
be achieved more effectively with ozone than with other oxidants like chlorine
or chlorine dioxide. Furthermore, ozonation usually produces much less
halogenated disinfection by-products than chlorination (17). The major
drawback of ozonation is the formation of bromate as a consequence of high
bromide concentrations (>50 µg L-1) in the raw water (18). Bromate is a
potential human carcinogen (19). Typical ozone dosages used for conventional
drinking water production range from 1 to 3 mg L-1 for good quality raw waters
(16).
TABLE 1-5. Drinking-Water Treatment Processes Investigated in the POSEIDON Project
Investigated Processes bench-scale pilot-scale full-scale
bank filtration X
coagulation/filtration X X X
ozonation X X X
advanced oxidation processes (AOPs) X X
GAC filtration X X
ultrafiltration/PAC X
nanofiltration X
treatment with chlorine dioxide X
10 Chapter 1
TABLE 1-6. Estimated Number of Drinking-Water Plants Using Ozone in Europe and North America for 1997
Country Number of Plants Reference
France 700 (20)
Germany 400 (21)
USA 200 (22)
Switzerland 100 (20)
Canada 70 (23)
United Kingdom 50 (24)
BENELUX 20 (25)
1.3.2 Municipal Wastewater
Only a limited number of WWTPs in the world uses ozonation for treatment.
Most of these plants are located in the Japan, Korea, the USA and Germany
(26). Ozone doses applied in wastewater treatment typically range from 2-15 mg
L-1. The primary objective of wastewater ozonation is disinfection. In various
states of the USA, WWTPs are required to disinfect the treated wastewater
before releasing it to receiving waters (27). In Europe, wastewater discharged
into bathing waters has occasionally to be disinfected to meet the guideline
values of the EU bathing water quality directive (28). Disinfection is usually
also mandatory, if wastewater is used for agriculture or other reuse purposes.
However, disinfection is normally performed applying chlorination, treatment
with chlorine dioxide or ultraviolet radiation rather than ozonation. With the
growing importance of water reuse, ozonation might become a more interesting
option because ozone is not only a disinfectant but also a powerful oxidant,
which can oxidize various classes of micropollutants. Furthermore, in the
context of water reuse, it may also be important to avoid the formation of
General Introduction 11
halogenated disinfection by-products, which are formed to a significantly larger
extent during chlorination.
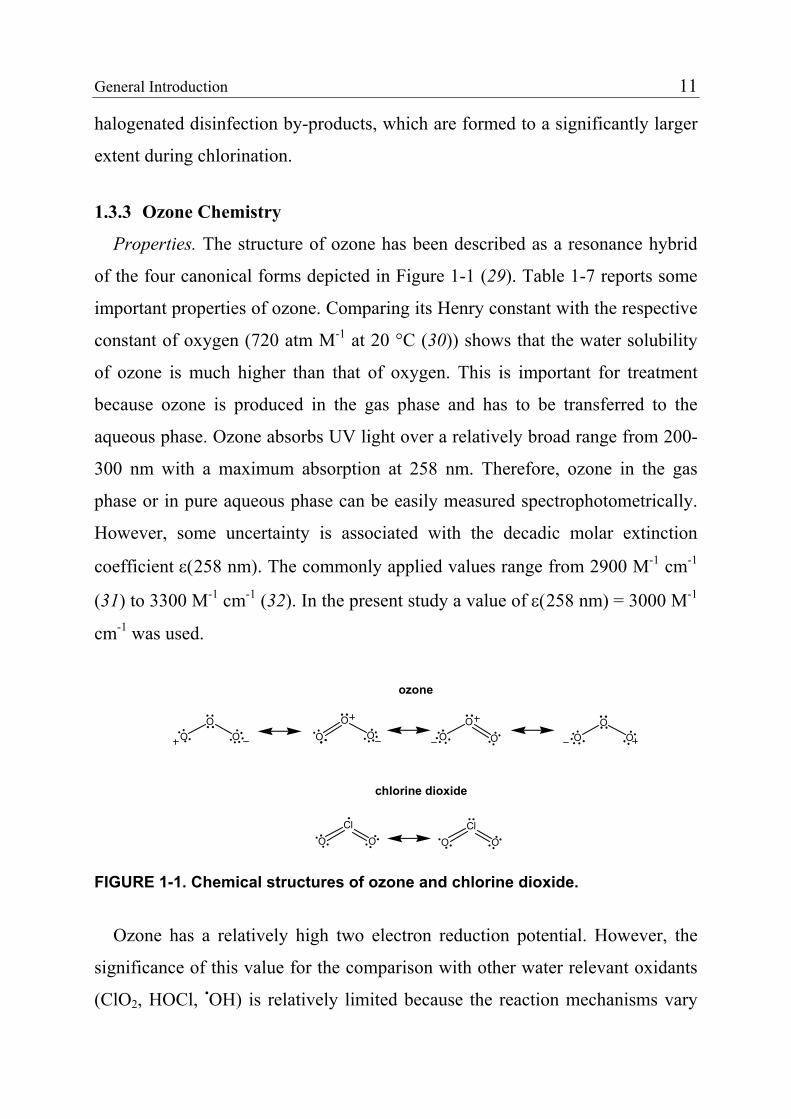
1.3.3 Ozone Chemistry
Properties. The structure of ozone has been described as a resonance hybrid
of the four canonical forms depicted in Figure 1-1 (29). Table 1-7 reports some
important properties of ozone. Comparing its Henry constant with the respective
constant of oxygen (720 atm M-1 at 20 °C (30)) shows that the water solubility
of ozone is much higher than that of oxygen. This is important for treatment
because ozone is produced in the gas phase and has to be transferred to the
aqueous phase. Ozone absorbs UV light over a relatively broad range from 200-
300 nm with a maximum absorption at 258 nm. Therefore, ozone in the gas
phase or in pure aqueous phase can be easily measured spectrophotometrically.
However, some uncertainty is associated with the decadic molar extinction
coefficient ε(258 nm). The commonly applied values range from 2900 M-1 cm-1
(31) to 3300 M-1 cm-1 (32). In the present study a value of ε(258 nm) = 3000 M-1
cm-1 was used.
OO
O OO
OOO
O OO
O
ozone
chlorine dioxide
OCl
O OCl
O
FIGURE 1-1. Chemical structures of ozone and chlorine dioxide.
Ozone has a relatively high two electron reduction potential. However, the
significance of this value for the comparison with other water relevant oxidants
(ClO2, HOCl, •OH) is relatively limited because the reaction mechanisms vary
12 Chapter 1
strongly among the different oxidants. Furthermore, the kinetics of electron
transfer reactions is usually governed by the one electron reduction potentials
(33).
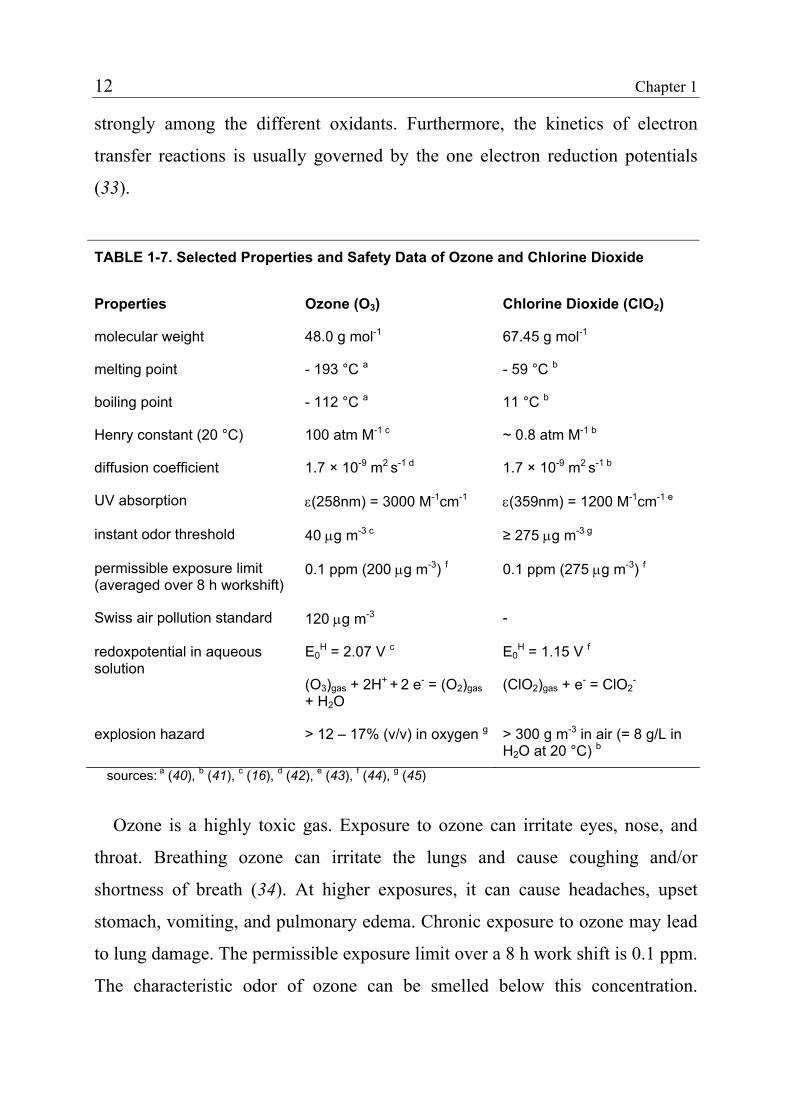
TABLE 1-7. Selected Properties and Safety Data of Ozone and Chlorine Dioxide
Properties Ozone (O3) Chlorine Dioxide (ClO2)
molecular weight 48.0 g mol-1 67.45 g mol-1
melting point - 193 °C a - 59 °C b
boiling point - 112 °C a 11 °C b
Henry constant (20 °C) 100 atm M-1 c ~ 0.8 atm M-1 b
diffusion coefficient 1.7 × 10⁻⁹ m2 s-1 d 1.7 × 10⁻⁹ m2 s-1 b
UV absorption ε(258nm) = 3000 M-1cm-1 ε(359nm) = 1200 M-1cm-1 e
instant odor threshold 40 µg m-3 c ≥ 275 µg m-3 g
permissible exposure limit (averaged over 8 h workshift)
0.1 ppm (200 µg m-3) f 0.1 ppm (275 µg m-3) f
Swiss air pollution standard 120 µg m-3 -
redoxpotential in aqueous solution
E0H = 2.07 V c
(O3)gas + 2H+ + 2 e- = (O2)gas + H2O
E0H = 1.15 V f
(ClO2)gas + e- = ClO2-
explosion hazard > 12 – 17% (v/v) in oxygen g > 300 g m-3 in air (= 8 g/L in H2O at 20 °C) b
sources: a (40), b (41), c (16), d (42), e (43), f (44), g (45)
Ozone is a highly toxic gas. Exposure to ozone can irritate eyes, nose, and
throat. Breathing ozone can irritate the lungs and cause coughing and/or
shortness of breath (34). At higher exposures, it can cause headaches, upset
stomach, vomiting, and pulmonary edema. Chronic exposure to ozone may lead
to lung damage. The permissible exposure limit over a 8 h work shift is 0.1 ppm.
The characteristic odor of ozone can be smelled below this concentration.
General Introduction 13
However, the ability to smell ozone may decrease after adaptation. The Swiss air
pollution standard is 120 µg m-3. This value should not be exceeded for more
than 1 h per year. For gaseous ozone-oxygen mixtures, lower explosion limits
ranging from 12-17% (v/v) are reported. This implies that ozone cannot be
compacted and stored. Surprisingly, the explosive properties of ozone do in
practice not affect the production of ozone-oxygen mixtures up to an ozone
content of 25%.
Kinetics. Ozone reacts with a large number of inorganic and organic
compounds (16,35-39). The fact that rate constants for the reaction with ozone
range over several orders of magnitude demonstrates that ozone is a very
selective oxidant. With respect to inorganic compounds, the reaction of ozone
with iodide, sulfide, and sulfite approaches nearly diffusion controlled rates. The
protonated species of the latter two compounds are also reactive toward ozone,
but the rate constants are several orders of magnitude lower. Nitrite, cyanide,
deprotonated hydrogen peroxide, and bromide are further inorganic nucleophiles
that are reactive toward ozone. Furthermore, ozone oxidizes Mn(II) and Fe(II).
With respect to organic compounds, ozone is particularly reactive toward
phenols, amines, compounds exhibiting C=C double bonds, and activated
aromatic compounds (e.g., polyaromatic compounds and benzene rings
substituted with an alkoxy group or several aliphatic moieties).
With many inorganic compounds ozone reacts by an apparent oxygen transfer
mechanism. Reactions with organic compounds usually proceed through ozone
addition followed by fast rearrangement, which can result in the release of
oxygen. Ozone reacts rarely by electron transfer reactions. Exceptions are the
reactions of ozone with amines and phenols (46,47). Also, the reaction of ozone
with chlorite seems to proceed by a one electron transfer mechanism, as
indicated by the formation of chlorine dioxide (39).
14 Chapter 1
Product Formation. Oxidation products formed during ozonation of organic
compounds in aqueous solutions are relatively well known for the reaction of
ozone with double bonds and phenols. For most other functional groups
relatively little information is available. Reaction of ozone with double bonds
proceeds through the well-established Crigee mechanism, which results in a
cleavage of the double bond under the formation of ketones, aldehydes and/or
carboxylic acids (29,48). Ozonation of phenols results first in the formation of
benzoquinones, hydroquinones and muconic acid derivatives (47). Further
oxidation leads to cleavage of the cyclic products and finally yields various
acids and aldehydes (e.g., formic acid, glyoxylic acid, glyoxal) (49). The
reaction of ozone with tertiary amines seems to yield aminoxides (probably only
a transient product) or secondary amines and the corresponding aldehydes (46).
Ozone Decay and Hydroxyl Radicals. The stability of ozone in aqueous
solution strongly depends on water quality parameters, mainly DOC, alkalinity,
pH, and temperature. Various reactions of ozone with the water matrix (e.g.,
with hydroxide ions) lead to the formation of hydrogen peroxide. Deprotonated
hydrogen peroxide reacts quickly with ozone, producing superoxide. The
subsequent quick reaction of superoxide with ozone triggers a reaction sequence
that ultimately yields hydroxyl radicals. Hydroxyl radicals react extremely fast
with different components of the water matrix. As a result, also organic peroxyl
radicals are formed that decay by releasing superoxide, which reacts with ozone
to hydroxyl radicals. This radical-type chain reaction cycle is described in detail
in ref (16).
The hydroxyl radical is a powerful but non-selective oxidant. It reacts at
nearly diffusion controlled rates with various inorganic and organic components
of the water matrix (50). Therefore, hydroxyl radicals can also contribute to the
oxidation of micropollutants. However, their efficiency is most often limited by
the scavenging effect of the water matrix. In ozone-based advanced oxidation
General Introduction 15
processes (AOPs), the formation of hydroxyl radicals during an ozonation
process is accelerated by increasing the pH of the water, by dosing hydrogen
peroxide, or by the application of UV radiation. This can ensure a faster
oxidation of compounds that do not exhibit an appreciable reactivity with ozone
directly. However, it has to be emphasized that the application of AOPs does not
increase the overall oxidation capacity of an ozonation process (51). The use of
an AOP only allows one to exploit the full oxidation capacity of a system within
shorter time frames than in conventional ozonation processes.
A comprehensive overview of products formed by hydroxyl radical reactions
in aqueous solutions is given by von Sonntag and Schuchmann (52). Hydroxyl
radicals react with saturated organic compounds principally by H-abstraction. In
the presence of oxygen, this reaction leads to the formation of peroxyl radicals,
which decay either through release of superoxide or bimolecular termination. In
both cases, the main products are ketones, aldehydes, and alcohols. With
unsaturated compounds the reaction can proceed through H-abstraction or
hydroxyl addition. In case of benzene, hydroxyl addition can lead to ring
cleavage or the formation of phenol.
If results from lab-scale studies on ozonation should be applied to water
treatment under realistic conditions, it is indispensable to distinguish between
oxidation by ozone and by hydroxyl radicals. In lab-scale experiments, ozone
reactions can be distinguished from hydroxyl radical reactions using a scavenger
compound, which quenches hydroxyl radicals without promoting the chain
reaction described above. Examples for scavengers are tert-butyl alcohol,
acetone, or the inorganic ions bicarbonate and carbonate (53).
16 Chapter 1
1.4 Treatment with Chlorine Dioxide
In Europe, chlorine dioxide is widely used for the disinfection of relatively
high quality water, such as groundwater or treated surface water. Dosing of
chlorine dioxide to the finished water will protect the drinking-water distribution
system from microbiological recontamination and fouling. In this case, ClO2
residuals are often kept < 0.05 – 0.1 mg L-1 (54). In the USA, ClO2 is rather used
for the preoxidation of surface waters. Common ClO2 dosages range from 1 to
1.4 mg L-1 (54,55). Furthermore, ClO2 is used for the disinfection of wastewater.
Compared to disinfection with chlorine, chlorine dioxide has several
advantages: it is more effective than chlorine for the inactivation of protozoa, its
biocidal properties are not influenced by pH, and it does not react with
ammonia. Furthermore, chlorinated and brominated disinfection by-products are
not formed under proper generation condition (56). Compared to ozone, chlorine
dioxide is more stable in water and provides residuals, which are required for the
protection of distribution systems. However, ozone is more effective for the
inactivation of microorganisms. Used for preoxidation, chlorine dioxide can
control taste and odor and oxidize iron and manganese. However, the
application of ClO2 is limited by the formation of chlorite, which is considered a
blood poison. The USEPA standard of 1 mg L-1 for chlorite limits chlorine
dioxide dosages to approximately 1.4 mg L-1. In Switzerland, chlorine dioxide
can only be used for preoxidation in combination with other oxidants (e.g.,
chlorine) due to a more stringent chlorite standard of 0.2 mg L-1.
1.4.1 Chlorine Dioxide Chemistry
Chlorine dioxide is a stable free radical (for structure see Figure 1-1).
Selected properties of chlorine dioxide are listed in Table 1-7. Its water
solubility is considerably higher than that of ozone. Therefore, highly
concentrated solutions of chlorine dioxide could be produced. However,
General Introduction 17
chlorine dioxide is explosive in the gas phase at concentrations >300 g m-3. Such
concentrations build up in the headspace of aqueous solutions with chlorine
dioxide concentrations >8 g/L at 20 °C. In the gas phase or in pure aqueous
solution, chlorine dioxide can be determined spectrophotometrically due to its
UV absorbance with a maximum at 359 nm.
Chlorine dioxide is a highly toxic gas. The permissible exposure limit for a
8-hour workshift is 0.1 ppm. Exposure can irritate the eyes, nose and throat.
Breathing chlorine dioxide can irritate the lungs causing coughing and/or
shortness of breath. Higher exposure can cause pulmonary edema (34).
Chlorine dioxide reacts fast with the nucleophilic inorganic compounds
nitrite, iodide, sulfide, sulfite and hydrogen peroxide anion, but also with Fe(II)
and Mn(II) (43). Because chlorine dioxide does not oxidize chloride and
bromide, halogenated disinfection by-products typically formed in the presence
of hypochlorous or hypobromous acids are not produced during treatment with
chlorine dioxide. Additionally, chlorine dioxide is also unreactive toward
hypochlorous acid so that treatment with a mixture of chlorine dioxide and
chlorine is a viable process for disinfection and oxidation. With respect to
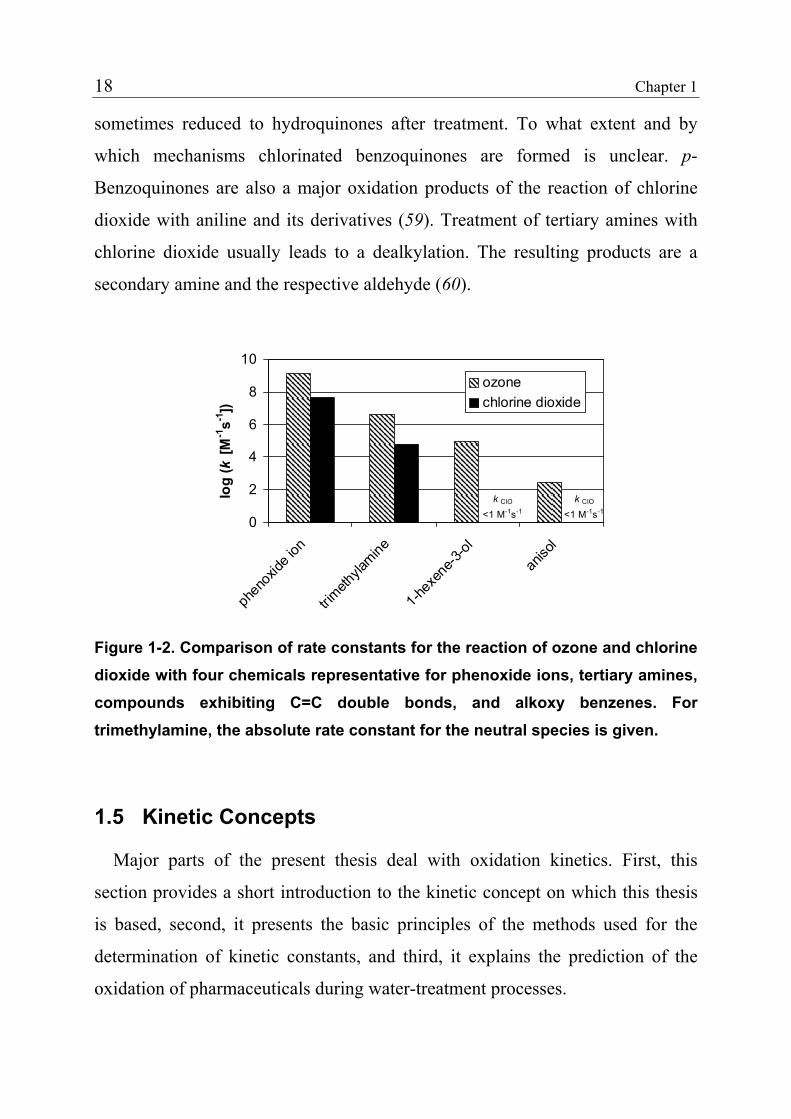
organic compounds, chlorine dioxide exhibits a high reactivity toward
phenoxide ions, neutral tertiary amines and certain polyaromatic compounds
(43,57). Figure 1-2 compares the rate constants for the reaction of ozone and
chlorine dioxide with four organic chemicals representative for the respective
compound classes.
Most of the inorganic and organic reactions of chlorine dioxide result in its
reduction to chlorite through one-electron transfer. The relatively few studies
that have been performed on organic oxidation products formed during
treatment with chlorine dioxide have been summarized by Rav-Acha (58).
Phenolic compounds are normally oxidized to benzoquinones, which are
18 Chapter 1
sometimes reduced to hydroquinones after treatment. To what extent and by
which mechanisms chlorinated benzoquinones are formed is unclear. p-
Benzoquinones are also a major oxidation products of the reaction of chlorine
dioxide with aniline and its derivatives (59). Treatment of tertiary amines with
chlorine dioxide usually leads to a dealkylation. The resulting products are a
secondary amine and the respective aldehyde (60).
0
2
4
6
8
10
phen
oxide
ion
trimeth
ylamine
1-hex
ene-3
-ol
aniso
l
log
(k [M
-1s-1
])
ozonechlorine dioxide
k ClO
<1 M-1s-1
k ClO
<1 M-1s-1
Figure 1-2. Comparison of rate constants for the reaction of ozone and chlorine dioxide with four chemicals representative for phenoxide ions, tertiary amines, compounds exhibiting C=C double bonds, and alkoxy benzenes. For trimethylamine, the absolute rate constant for the neutral species is given.
1.5 Kinetic Concepts
Major parts of the present thesis deal with oxidation kinetics. First, this
section provides a short introduction to the kinetic concept on which this thesis
is based, second, it presents the basic principles of the methods used for the
determination of kinetic constants, and third, it explains the prediction of the
oxidation of pharmaceuticals during water-treatment processes.
General Introduction 19
The oxidation of pharmaceuticals (P) during treatment with an oxidant (Ox)
can be described by the following reaction:
(1) productsOxP Oxk⎯→⎯+η
where kOx is the second-order rate constant and η is the stoichiometric factor
that determines the moles of Ox consumed per mole of converted P. If the
reaction rate is first order with respect to the oxidant and target compound
concentrations, the loss of P and Ox per time is given by the following rate laws:
[ ] [ ] [ ]OxPkdtPd
Ox ⋅⋅=− (2)
[ ] [ ] [ ]OxPkdtOxd
Ox ⋅⋅=−η1 (3)
If P is an acid that reacts according to
PH P- + H+ (4)
eq 2 can be modified to include the specific rate constants for the reaction of
the oxidant with the acid (kOx,PH) and the respective anion (kOx,P-) of the target
compound P:
[ ] [ ] [ ]OxPkkdtPd
totPOxPHOxtot ⋅⋅−+⋅=− − ))1(( ,, αα (5)
The degree of dissociation (α) can be calculated with the help of the
dissociation constant (K) and the pH:
[ ]++=
HK1
1α (6)
Equations for basic compounds can be developed accordingly.
For pH-dependent reactions, the overall reactivity of a compound at a certain
pH can be expressed by the apparent second-order rate constant (kapp) that is
defined as:
20 Chapter 1
−− ⋅+
−+⋅+
=⋅−+⋅=
−
−
−
− POx
pH
pKPHOx
pH
pKPOxPHOxapp kkkkk ,,,, )
10101
11(
10101
1)1( αα (7)
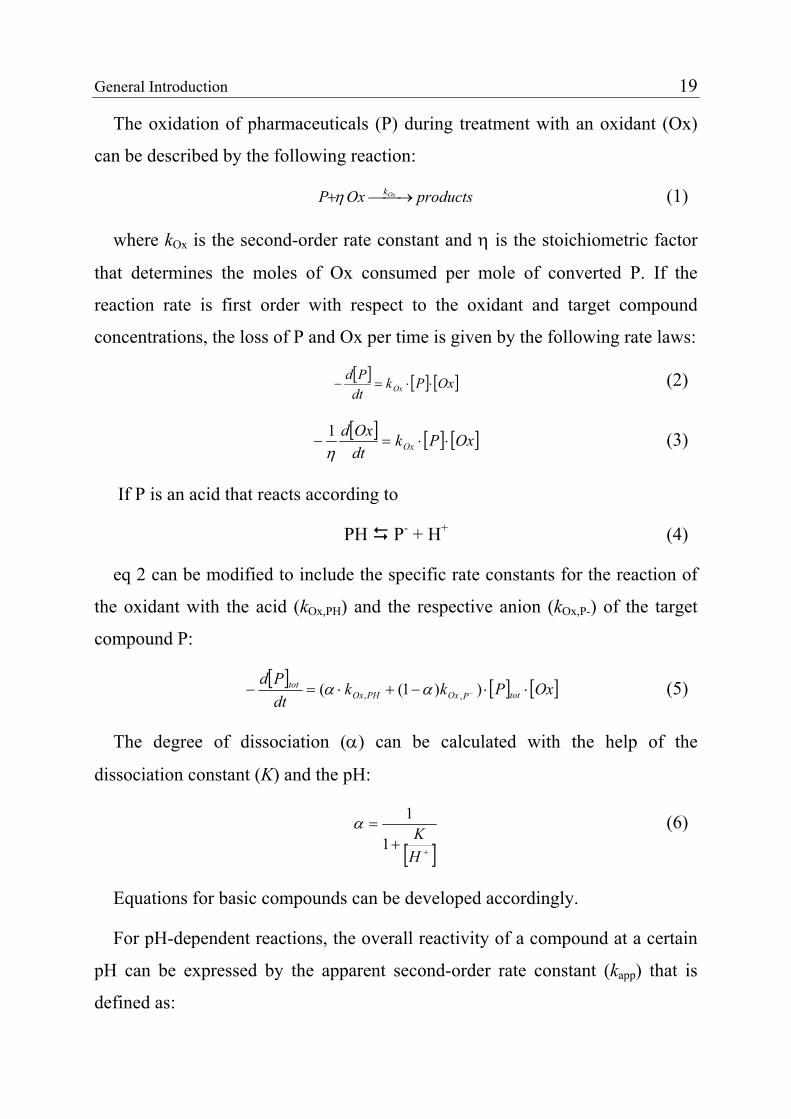
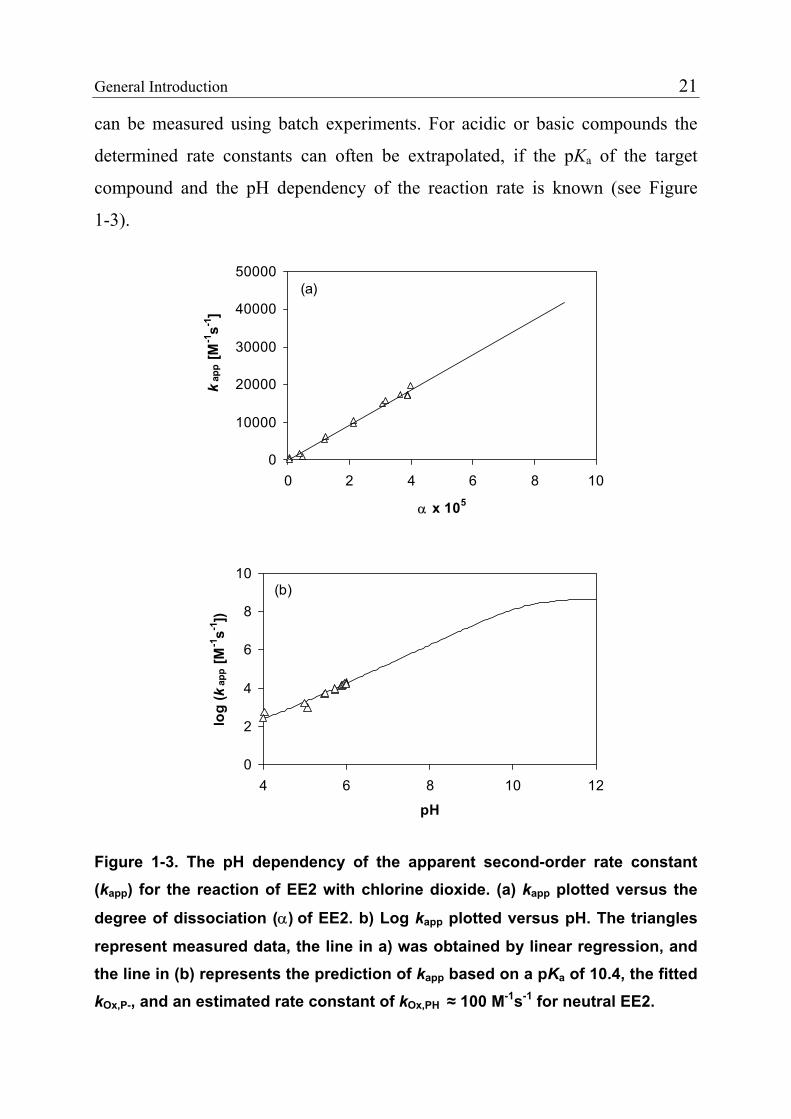
To determine kOx,P- from measured values of kapp, kapp is plotted versus α. The
slope of the resulting straight line yields kOx,P- (for an example see Figure 1-3
(a)). To predict the pH dependency of a reaction over a larger pH range, kapp can
be calculated based on kOx,PH and kOx,P-. To illustrate this pH dependency, the
logarithm of kapp can be plotted versus pH (for an example see Figure 1-3 (b)).
1.5.1 Determination of Rate Constants under Pseudo-first-order
Conditions
For the determination of accurate and precise second-order rate constants,
pseudo-first- order conditions with either P or Ox in excess are most appropriate
because they allow a direct measurement of the rate constants. For [Ox]0 >> [P]0
it follows that [Ox]t ≈ const ≈ [Ox]0. Using this simplification, the solution of eq
2 yields
[ ][ ] tkPP
obs ⋅−=⎟⎟⎠
⎞⎜⎜⎝
⎛
0
ln with [ ]0Oxkk Oxobs ⋅= (8)
where kobs is the pseudo-first-order rate constant. Applying above specified
conditions, the decrease of P as a function of time can be determined
experimentally. To evaluate the results, the left side of eq 8 has to be plotted
versus t. The slope of the resulting straight line represents kobs, which can be
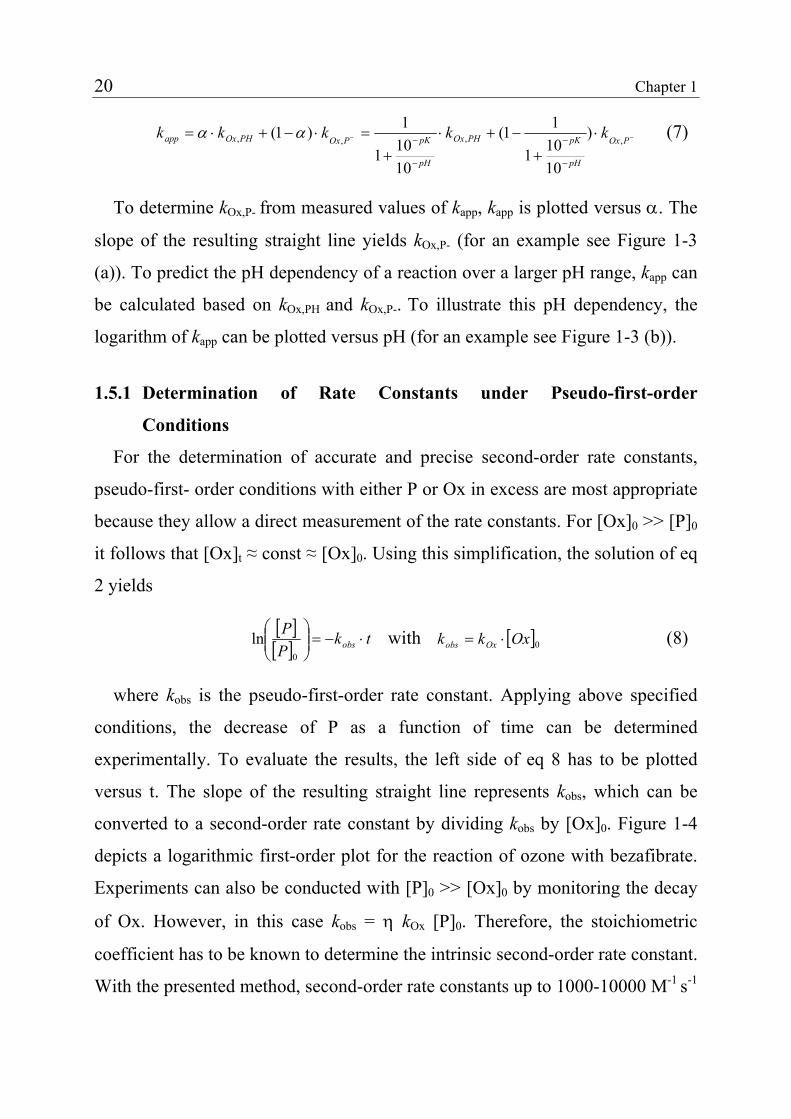
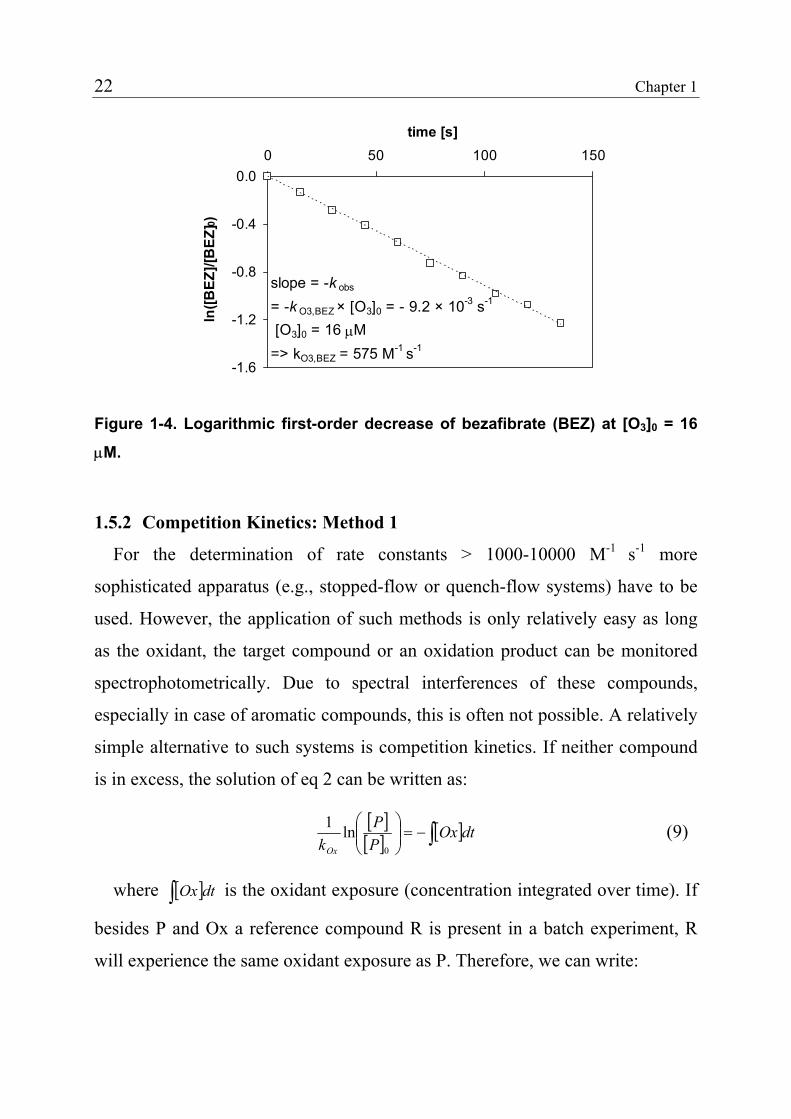
converted to a second-order rate constant by dividing kobs by [Ox]0. Figure 1-4
depicts a logarithmic first-order plot for the reaction of ozone with bezafibrate.
Experiments can also be conducted with [P]0 >> [Ox]0 by monitoring the decay
of Ox. However, in this case kobs = η kOx [P]0. Therefore, the stoichiometric
coefficient has to be known to determine the intrinsic second-order rate constant.
With the presented method, second-order rate constants up to 1000-10000 M-1 s-1
General Introduction 21
can be measured using batch experiments. For acidic or basic compounds the
determined rate constants can often be extrapolated, if the pKa of the target
compound and the pH dependency of the reaction rate is known (see Figure
1-3).
0
10000
20000
30000
40000
50000
0 2 4 6 8 1
α x 105
kap
p [M
-1s-1
]
(a)
0
0
2
4
6
8
10
4 6 8 10
pH
log
(kap
p [M
-1s-1
])
(b)
12
Figure 1-3. The pH dependency of the apparent second-order rate constant (kapp) for the reaction of EE2 with chlorine dioxide. (a) kapp plotted versus the
degree of dissociation (α) of EE2. b) Log kapp plotted versus pH. The triangles
represent measured data, the line in a) was obtained by linear regression, and the line in (b) represents the prediction of kapp based on a pKa of 10.4, the fitted kOx,P-, and an estimated rate constant of kOx,PH ≈ 100 M-1s-1 for neutral EE2.
22 Chapter 1
-1.6
-1.2
-0.8
-0.4
0.00 50 100 150
time [s]
ln([B
EZ]/[
BEZ
] 0)
slope = -k obs
= -k O3,BEZ × [O3]0 = - 9.2 × 10⁻³ s-1
[O3]0 = 16 µM => kO3,BEZ = 575 M-1 s-1
Figure 1-4. Logarithmic first-order decrease of bezafibrate (BEZ) at [O3]0 = 16
µM.
1.5.2 Competition Kinetics: Method 1
For the determination of rate constants > 1000-10000 M-1 s-1 more
sophisticated apparatus (e.g., stopped-flow or quench-flow systems) have to be
used. However, the application of such methods is only relatively easy as long
as the oxidant, the target compound or an oxidation product can be monitored
spectrophotometrically. Due to spectral interferences of these compounds,
especially in case of aromatic compounds, this is often not possible. A relatively
simple alternative to such systems is competition kinetics. If neither compound
is in excess, the solution of eq 2 can be written as:
[ ][ ] [ ]∫−=⎟⎟
⎠
⎞⎜⎜⎝
⎛dtOx
PP
kOx 0
ln1 (9)
where is the oxidant exposure (concentration integrated over time). If
besides P and Ox a reference compound R is present in a batch experiment, R
will experience the same oxidant exposure as P. Therefore, we can write:
[ ]∫ dtOx
General Introduction 23
[ ][ ]
[ ][ ]
[ ][ ]
[ ][ ] ⎟⎟
⎠
⎞⎜⎜⎝
⎛=⎟⎟
⎠
⎞⎜⎜⎝
⎛⎯→⎯⎟⎟
⎠
⎞⎜⎜⎝
⎛=⎟⎟
⎠
⎞⎜⎜⎝
⎛
0,00,0
lnlnln1ln1RR
kk
PP
RR
kPP
k ROx
Ox
ROxOx
(10)
where kOx,R is the second-order rate constant for the reaction of R with the
oxidant. To obtain varying oxidant exposures and, consequently, varying extents
of parent compound oxidation, the oxidant dose or the reaction time can be
varied. For a series of such experiments, a plot of [ ][ ] ⎟⎟
⎠
⎞⎜⎜⎝
⎛
0
lnPP versus [ ]
[ ] ⎟⎟⎠
⎞⎜⎜⎝
⎛
0
lnRR yields
a straight line with the slope ROx
Ox
kk
,
. If kOx,R is known, kOx can be easily calculated.
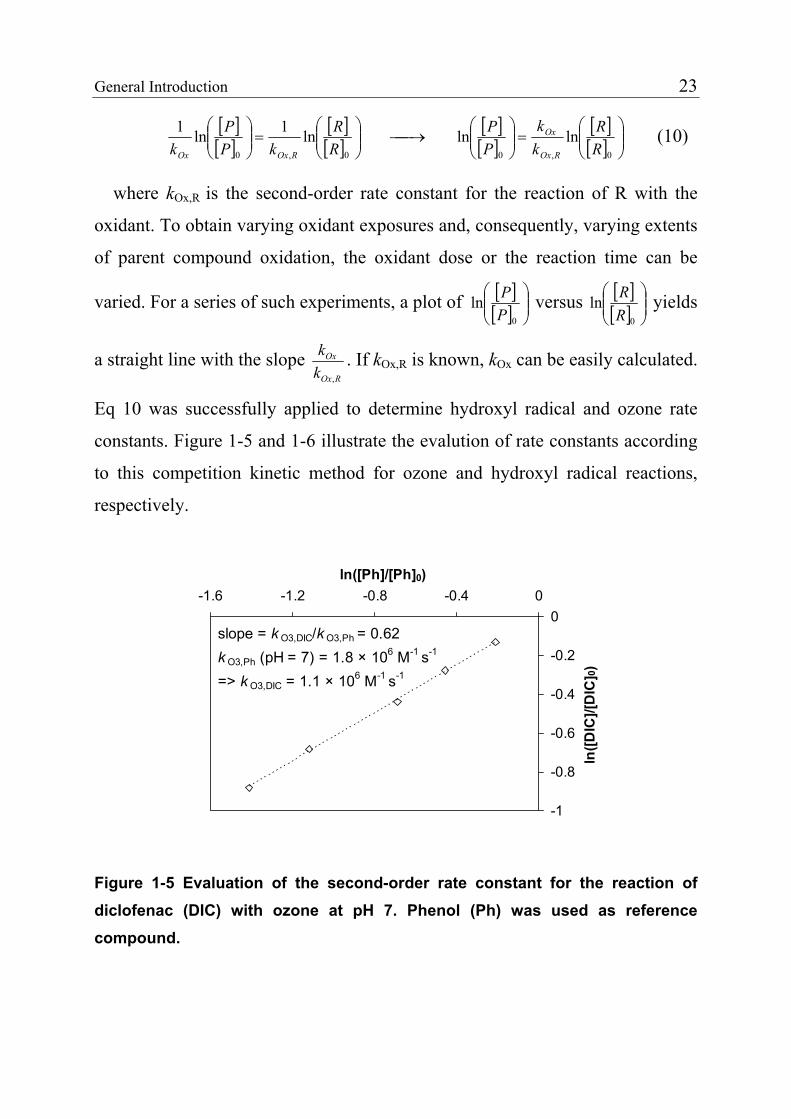
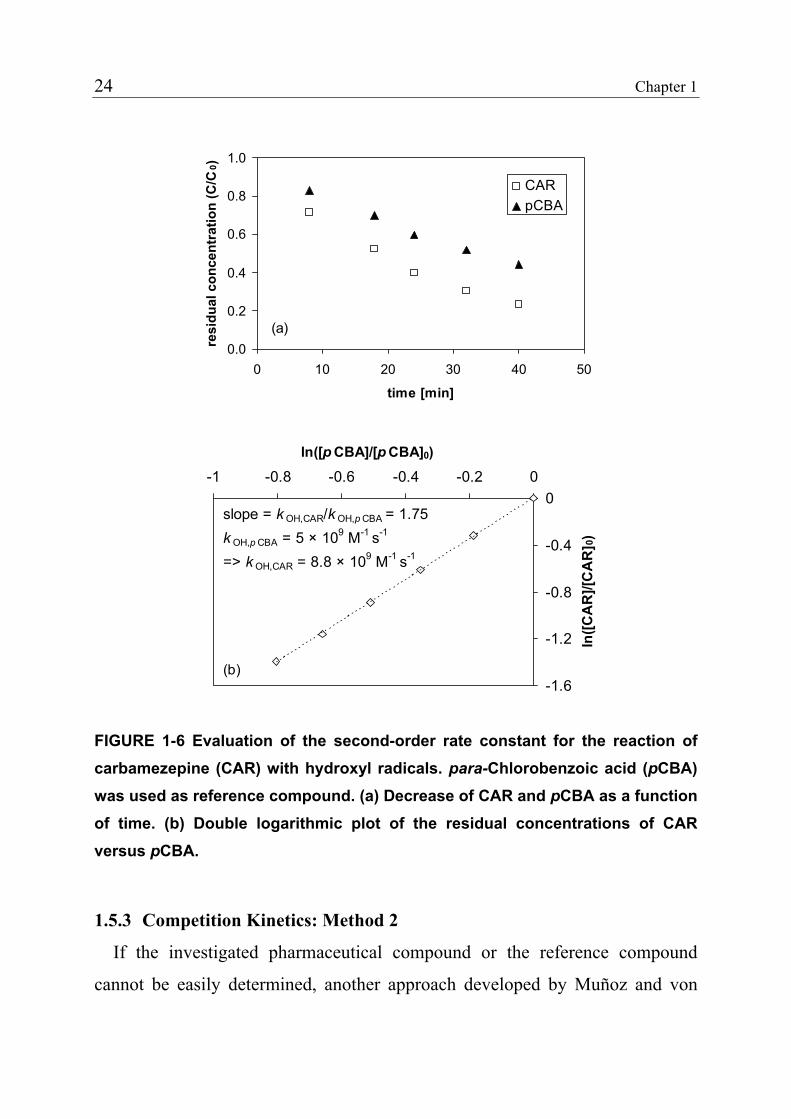
Eq 10 was successfully applied to determine hydroxyl radical and ozone rate
constants. Figure 1-5 and 1-6 illustrate the evalution of rate constants according
to this competition kinetic method for ozone and hydroxyl radical reactions,
respectively.
-1
-0.8
-0.6
-0.4
-0.2
0-1.6 -1.2 -0.8 -0.4 0
ln([Ph]/[Ph]0)ln
([DIC
]/[D
IC] 0)
slope = k O3,DIC/k O3,Ph = 0.62k O3,Ph (pH = 7) = 1.8 × 10⁶ M-1 s-1
=> k O3,DIC = 1.1 × 10⁶ M-1 s-1
Figure 1-5 Evaluation of the second-order rate constant for the reaction of diclofenac (DIC) with ozone at pH 7. Phenol (Ph) was used as reference compound.
24 Chapter 1
0.0
0.2
0.4
0.6
0.8
1.0
0 10 20 30 40 50
time [min]
resi
dual
con
cent
ratio
n (C
/C0)
CARpCBA
(a)
-1.6
-1.2
-0.8
-0.4
0-1 -0.8 -0.6 -0.4 -0.2 0
ln([p CBA]/[p CBA]0)
ln([C
AR
]/[C
AR
] 0)
slope = k OH,CAR/k OH,p CBA = 1.75k OH,p CBA = 5 × 10⁹ M-1 s-1
=> k OH,CAR = 8.8 × 10⁹ M-1 s-1
(b)
FIGURE 1-6 Evaluation of the second-order rate constant for the reaction of carbamezepine (CAR) with hydroxyl radicals. para-Chlorobenzoic acid (pCBA) was used as reference compound. (a) Decrease of CAR and pCBA as a function of time. (b) Double logarithmic plot of the residual concentrations of CAR versus pCBA.
1.5.3 Competition Kinetics: Method 2
If the investigated pharmaceutical compound or the reference compound
cannot be easily determined, another approach developed by Muñoz and von
General Introduction 25
Sonntag (61) can be used under the condition that either P or R produces a stable
oxidation product that can be measured. In the following, we assume that R
produces a measurable oxidation product (OR). For a given initial ozone dose
under the condition [Ox]0 << [R]0 and [P]0, the ratio of the OR yields of a batch
system with R in the presence of P ([OR]R+P ) and in its absence ([OR]R) will be
[ ][ ]
[ ][ ] [ ]PkRk
RkOR
OR
OxPROxR
ROxR
R
PR
⋅+⋅
⋅⋅=+
ηηη
,
, (11)
where ηR and ηP are the stoichiometric coefficients for the reaction of the
oxidant with R and P, respectively. Rearranging eq 11 yields
[ ][ ]
[ ] [ ][ ]
[ ][ ]RkPk
RkPkRk
OROR
ROxR
OxP
ROxR
OxPROxR
RP
R
⋅⋅⋅⋅
+=⋅⋅
⋅⋅+⋅⋅=
+ ,,
, 1ηη
ηηη (12)
For the determination of a rate constant, experiments with varying [P]/[R]
ratios and at least one experiment without P have to be conducted. Plotting the
left side of eq 12 versus [P]/[R] ratio will yield a straight line with the slope
ROxR
OxP
kk
,⋅⋅
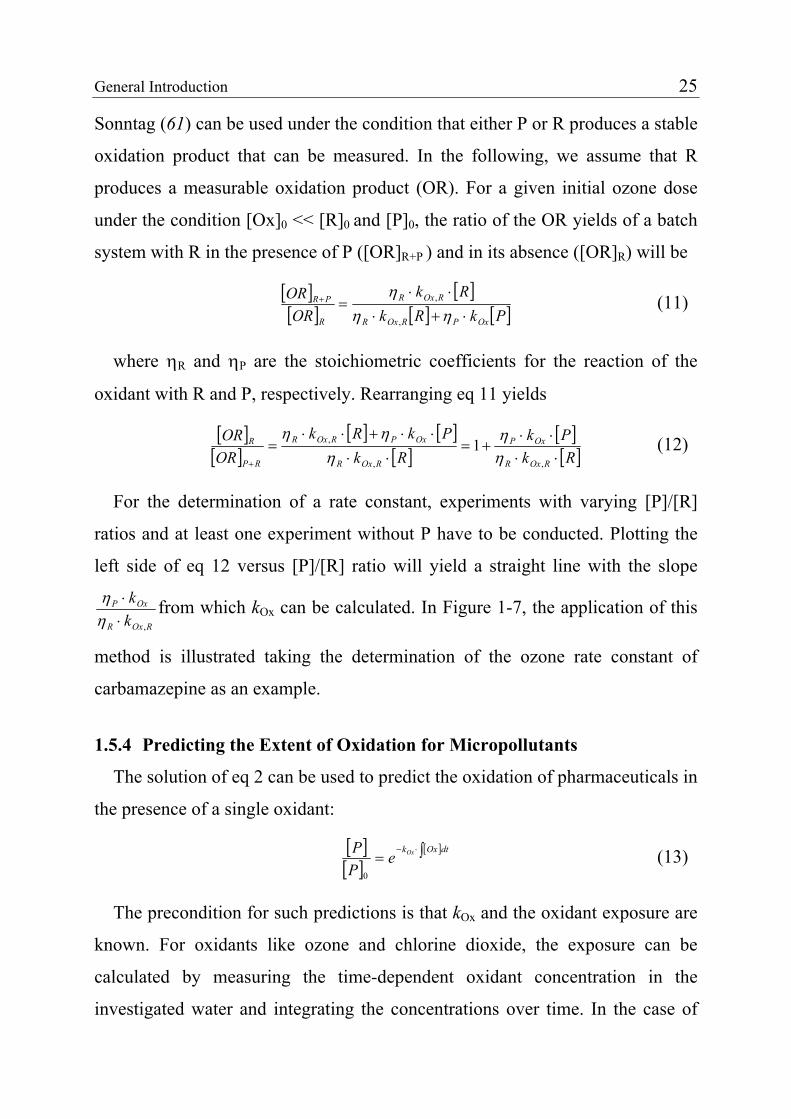
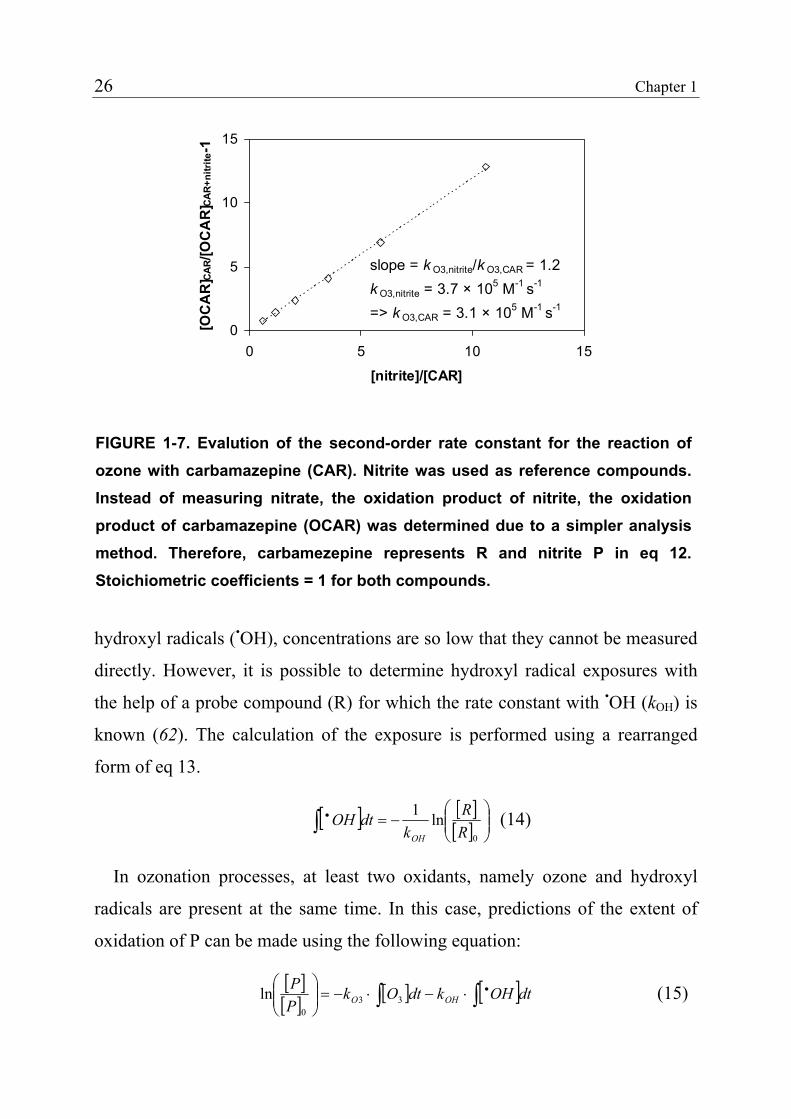
ηη from which kOx can be calculated. In Figure 1-7, the application of this
method is illustrated taking the determination of the ozone rate constant of
carbamazepine as an example.
1.5.4 Predicting the Extent of Oxidation for Micropollutants
The solution of eq 2 can be used to predict the oxidation of pharmaceuticals in
the presence of a single oxidant:
[ ][ ]
[ ]∫=⋅− dtOxkOxe
PP
0
(13)
The precondition for such predictions is that kOx and the oxidant exposure are
known. For oxidants like ozone and chlorine dioxide, the exposure can be
calculated by measuring the time-dependent oxidant concentration in the
investigated water and integrating the concentrations over time. In the case of
26 Chapter 1
hydroxyl radicals (•OH), concentrations are so low that they cannot be measured
directly. However, it is possible to determine hydroxyl radical exposures with
the help of a probe compound (R) for which the rate constant with •OH (kOH) is
known (62). The calculation of the exposure is performed using a rearranged
form of eq 13.
[ ] [ ][ ] ⎟⎟
⎠
⎞⎜⎜⎝
⎛−=∫ •
0
ln1RR
kdtOH
OH
(14)
In ozonation processes, at least two oxidants, namely ozone and hydroxyl
radicals are present at the same time. In this case, predictions of the extent of
oxidation of P can be made using the following equation:
[ ][ ] [ ] [ ]∫∫ •⋅−⋅−=⎟⎟
⎠
⎞⎜⎜⎝
⎛dtOHkdtOk
PP
OHO 330
ln (15)
0
5
10
15
0 5 10
[nitrite]/[CAR]
[OC
AR
] CAR/
[OC
AR
] CAR+
nitr
ite-1
slope = k O3,nitrite/k O3,CAR = 1.2k O3,nitrite = 3.7 × 10⁵ M-1 s-1
=> k O3,CAR = 3.1 × 10⁵ M-1 s-1
15
FIGURE 1-7. Evalution of the second-order rate constant for the reaction of ozone with carbamazepine (CAR). Nitrite was used as reference compounds. Instead of measuring nitrate, the oxidation product of nitrite, the oxidation product of carbamazepine (OCAR) was determined due to a simpler analysismethod. Therefore, carbamezepine represents R and nitrite P in eq 12. Stoichiometric coefficients = 1 for both compounds.
General Introduction 27
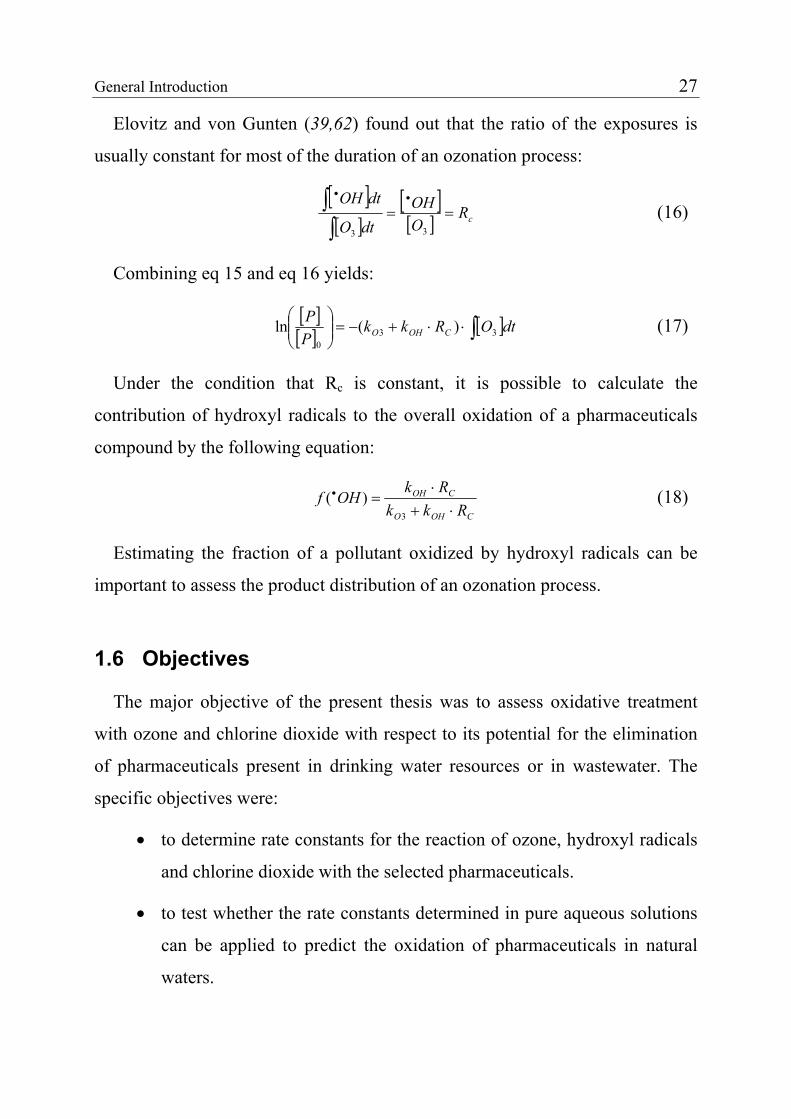
Elovitz and von Gunten (39,62) found out that the ratio of the exposures is
usually constant for most of the duration of an ozonation process:
[ ][ ]
[ ][ ] cROOH
dtO
dtOH==
••
∫∫
33
(16)
Combining eq 15 and eq 16 yields:
[ ][ ] [ ]∫⋅⋅+−=⎟⎟
⎠
⎞⎜⎜⎝
⎛dtORkk
PP
COHO 330
)(ln (17)
Under the condition that Rc is constant, it is possible to calculate the
contribution of hydroxyl radicals to the overall oxidation of a pharmaceuticals
compound by the following equation:
COHO
COH
RkkRk
OHf⋅+
⋅=•
3
)( (18)
Estimating the fraction of a pollutant oxidized by hydroxyl radicals can be
important to assess the product distribution of an ozonation process.
1.6 Objectives
The major objective of the present thesis was to assess oxidative treatment
with ozone and chlorine dioxide with respect to its potential for the elimination
of pharmaceuticals present in drinking water resources or in wastewater. The
specific objectives were:
• to determine rate constants for the reaction of ozone, hydroxyl radicals
and chlorine dioxide with the selected pharmaceuticals.
• to test whether the rate constants determined in pure aqueous solutions
can be applied to predict the oxidation of pharmaceuticals in natural
waters.
28 Chapter 1
• to identify oxidation products of a relevant compound during
ozonation.
• to test these oxidation products for remaining pharmacological effects.
• to conduct pilot-experiments in wastewater to investigate the behavior
of pharmaceuticals under realistic treatment conditions and to identify
the crucial parameters governing the efficiency of the oxidation
process.
1.7 Outline
The results are presented in the following way (in brackets the corresponding
publication):
Chapter 2 reports the second-order rate constants determined for the reaction
of ozone and hydroxyl radicals with the selected pharmaceuticals. Further,
experiments are presented that compare the predicted and measured oxidation of
selected pharmaceuticals in natural waters. (Huber, M. M.; Canonica, S.; Park,
G-Y.; von Gunten, U.: Oxidation of Pharmaceuticals during Ozonation and
Advanced Oxidation Processes, Environ. Sci. Technol. 2003, 37, 1016-1024.)
In Chapter 3, determined and estimated second-order rate constants for the
reaction of chlorine dioxide with various pharmaceuticals are presented. The
determined rate constants were verified under realistic treatment conditions by
simulating preoxidation of lake water or disinfection of groundwater.
Furthermore, a comparison of apparent rate constants for the reaction of ozone,
chlorine dioxide and chlorine with selected pharmaceuticals is shown. (Huber,
M. M.; Korhonen, S.; Ternes, T. A.; von Gunten, U.: Oxidation of
Pharmaceuticals during Water Treatment with Chlorine Dioxide, Water Res.
2004, submitted.)
General Introduction 29
Chapter 4 illustrates the effect of ozonation on pharmacological effects of
pharmaceuticals. 17α-Ethinylestradiol was selected for this purpose because of
its high biological activity and its ecotoxicological relevance. It is also shown,
which oxidation products are formed during ozonation of this synthetic
hormone. (Huber, M. M.; Ternes, T. A.; von Gunten, U.: Removal of Estrogenic
Activity and Formation of Oxidation Products during Ozonation of 17α-
Ethinylestradiol, Environ. Sci. Technol. 2003, 38, 5177-5186.)
Chapter 5 presents the pilot-scale application of wastewater ozonation. This
chapter focuses on the effect of ozone dosage and suspended solids on the
oxidation process and the predictability of pharmaceutical oxidation in
wastewater. (Huber, M. M.; Göbel, A.; Joss, A.; et al.: Oxidation of
Pharmaceuticals during Ozonation of Municipal Wastewater Effluents: A Pilot
Study, Environ. Sci. Technol. 2004, submitted.)
In Chapter 6, the results of the present thesis are summarized and put into
relation with the results for other treatment processes that were investigated in
the POSEIDON project.
30 Chapter 1
1.8 References
(1) Ternes, T. A.: Occurrence of drugs in German sewage treatment plants and rivers, Water Res. 1998, 32, 3245-3260.
(2) Heberer, T.: Occurrence, fate, and removal of pharmaceutical residues in the aquatic environment: a review of recent research data, Toxicol. Lett. 2002, 131, 5-17.
(3) Kolpin, D. W.; Furlong, E. T.; Meyer, M. T.; Thurman, E. M.; Zaugg, S. D.; Barber, L. B.; Buxton, H. T.: Pharmaceuticals, hormones, and other organic wastewater contaminants in U.S. streams, 1999-2000: a national reconnaissance, Environ. Sci. Technol. 2002, 36, 1202-1211.
(4) Alder, A.; McArdell, C. S.: Consumption and occurrence, In Human pharmaceuticals, hormones and fragrances: a challenge for urban water management; Ternes, T. A., Joss, A., Eds.; in preparation, 2005.
(5) Anonymous Poseidon Report: http://www.eu-poseidon.com, 2004.
(6) Joss, A.; Andersen, H.; Ternes, T. A.; Richle, P. R.; Siegrist, H.: Removal of estrogens in municipal wastewater treatment under aerobic and anaerobic conditions: consequences for plant optimization, Environ. Sci. Technol. 2004, 38, 3047-3055.
(7) Ternes, T. A.; Stumpf, M.; Mueller, J.; Haberer, K.; Wilken, R.-D.; Servos, M.: Behavior and occurrence of estrogens in municipal sewage treatment plants-I. Investigation in Germany, Canada and Brazil, Sci. Total Environ. 1999, 225, 81-90.
(8) Göbel, A.; McArdell, C. S.; Joss, A.; Siegrist, H. R.; Giger, W.: Behavior of sulfonamide and macrolide antimicrobials in wastewater treatment II. Evaluation of different treatment technologies, Environ. Sci. Technol. 2004, in preparation.
(9) Joss, A.; Ternes, T. A.; Alder, A.; Göbel, A.; McArdell, C.; Elvira, K.; Siegrist, H. R.: Removal of pharmaceuticals and fragrances in biological wastewater treatment, Environ. Sci. Technol. 2004, in preparation.
(10) Ternes, T. A.; Hirsch, R.: Occurrence and behaviour of X-ray contrast media in sewage facilities and the aquatic environment, Environ. Sci. Technol. 2000, 34, 2741-2748.
(11) Sacher, F.; Lange, T. F.; Brauch, H.-J.; Blankenhorn, I.: Pharmaceuticals in groundwaters: Analytical methods and results of monitoring program in Baden- Württemberg, Germany, J. Chromatogr. A 2001, 938, 199-210.
(12) Ternes, T. A.: Pharmaceuticals and metabolites as contaminants of the aquatic environment, In Pharmaceuticals and personal care products in the environment: scientific regulatory issue, ACS-Symposium Series; Daughton, C. G., Jones-Lepp, T. L., Eds., 2001.
(13) Roberson, J. A.: An inventory of ICR systems, treatment plants, and source water supplies, In Information collection rule data analysis; McGuire, M. J., McLain, J. L.,
General Introduction 31
Obolensky, A., Eds.; Awwa Research Foundation and American Water Works Association, 2002; pp 67-80.
(14) Logsdon, G.; Hess, A.; Horsley, M.: Guide to selection of water treatment processes, In Water quality and treatment: A Handbook of community water supplies; Letterman, R. D., Ed.; McGraw-Hill, Inc.: New York, 1999; pp 3.1-3.26.
(15) Gujer, W. Siedlungswasserwirtschaft; Springer: Berlin, 1999.
(16) Hoigné, J.: Chemistry of aqueous ozone and transformation of pollutants by ozonation and advanced oxidation processes., In The handbook of environmental chemistry Vol. 5 Part. C Quality and treatment of drinking water II; Hubrec, J., Ed.; Springer: Berlin, 1998.
17) Singer, P. C.; Reckhow, D. A.: Chemical oxidation, In Water quality and treatment: a handbook of community water supplies; AWWA, Letterman, R. D., Eds.; McGraw- Hill, Inc.: New York, 1999.
(18) von Gunten, U.: Ozonation of drinking water: Part II. Disinfection and by product formation in presence of bromide, iodide and chlorine, Water Res. 2003, 37, 1469- 1487.
(19) USEPA Toxicological review of bromate. EPA/635/R-01/002, USEPA, 2001.
(20) Langlais, B.; Reckhow, D. A.; Brink, B. R. Ozone in water treatment: application and engineering; Lewis Publishers: Chelsea, 1991.
(21) Böhme, A.: Ozone technology of German industrial enterprises, Ozone Sci. Eng. 1999, 21, 163-176.
(22) Rice, R. G.: Ozone in the United States of America - state-of-the-art, Ozone Sci. Eng. 1999, 21, 99-118.
(23) Laroque, R. L.: Ozone application in Canada - a state of the art review, Ozone Sci. Eng. 1999, 21, 119-125.
(24) Lowndes, R.: State of the art for ozone UK experience, Ozone Sci. Eng. 1999, 21, 201- 205.
(25) Kruithof, J. C.; Masschelein, W. J.: State-of-the-art of the application of ozonation in BENELUX drinking water treatment, Ozone Sci. Eng. 1999, 21, 139-152.
(26) Paraskeva, P.; Graham, N.: Ozonation of municipal wastewater effluents, Water Environ. Res. 2002, 74, 569-581.
(27) Stover, E. L.; Haas, C. N.; Rakness, K. C.; Scheible, O. K. Design manual: municipal wastewater disinfection. EPA/625/1-86/O21, USEPA, 1986.
(28) Bathing water quality directive 76/160/EEC (1976), JO L 31, 5.2.1976.
(29) Bailey, P. S. Ozonation in organic chemistry. Vol 1. Olefinic Compounds; Academic Press: New York, 1978.
32 Chapter 1
(30) Lide, D. R., Ed. Handbook of chemistry and physics; 82 ed.; CRC Press: Boca Raton, 2001/02.
(31) Kilpatrick, M. L.; Herrick, C. C.; Kilpatrick, M.: The decomposition of ozone in aqueous solution, J. Am. Chem. Soc. 1956, 78, 1784-1789.
(32) Hart, E. J.; Sehested, K.; Holcman, J.: Molar absorptivities of ultraviolet and visible bands of ozone in aqueous solutions, Anal. Chem. 1983, 55, 46-49.
(33) Schwarzenbach, R. P.; Gschwend, P. M.; Imboden, D. M. Environmental organic chemistry; Second edition ed.; Wiley-Interscience: Hobocken, NJ, 2003.
(34) Anonymous New Jersey department of health and senior services: hazardous substance fact sheet, 1998. http://www.state.nj.us/health/eoh/rtkweb/rtkhsfs.htm
(35) Hoigné, J.; Bader, H.: Rate constants of reactions of ozone with organic and inorganic compounds in water - I Non-dissociating organic compounds, Water Res. 1983, 17, 173-183.
(36) Hoigné, J.; Bader, H.: Rate constants of reactions of ozone with organic and inorganic compounds in water - II Dissociating organic compounds, WaterRes. 1983, 17, 185- 194.
(37) Hoigné, J.; Bader, H.: Rate constants of reactions of ozone with organic and inorganic compounds in water - III Inorganic compounds and radicals, Water Res. 1985, 19, 993-1004.
(38) Liu, Q.; Schurter, L. M.; Muller, C. E.; Aloisio, S.; Francisco, J. S.; Margerum, D. W.: Kinetics and mechanisms of aqueous ozone reactions with bromide, sulfite, hydrogen sulfite, iodide, and nitrite ions, Inorg. Chem. 2001, 40, 4436-4442.
(39) von Gunten, U.: Ozonation of drinking water: Part I. Oxidation kinetics and product formation, Water Res. 2003, 37, 1443-1467.
(40) Gottschalk, C.; Libra, J. A.; Saupe, A. Ozonation of water and waste water: A practical guide to understanding ozone and its application; Wiley-VCH: Weinheim, 2000.
(41) Masschelein, W. J.: Le dioxyde de chlore pour la maîtrise de la qualité des eaux, Tribune de l'eau 2001, 54, 1-124.
(42) Beltrán, F. J. Ozone reaction kinetics for water and wastewater systems; Lewis Publishers: Boca Raton, 2004.
(43) Hoigné, J.; Bader, H.: Kinetics of reactions of chlorine dioxide (OClO) in water - I. Rate constants for inorganic and organic compounds, Water Res. 1994, 28, 45-55.
(44) OSHA: Occupational safety and health standards: TABLE Z-1 limits for air contaminants. 1910.1000 Table Z-1. http://www.osha.gov.
(45) Koike, K.; Inoue, G.; Fukuda, T.: Explosion hazard of gaseous ozone, J. Chem. Eng. Jpn. 1999, 32, 295-299.
General Introduction 33
(46) Muñoz, F.; von Sonntag, C.: The reactions of ozone with tertiary amines including the complexing agents nitrilotriacetic acid (NTA) and ethylenediaminetetraacetic acid (EDTA) in aqueous solution, J. Chem. Soc., Perkin Trans. 2 2000, 2029-2033.
(47) Mvula, E.; von Sonntag, C.: Ozonolysis of phenols in aqueous solution, Org. Biomol. hem. 2003, 1, 1749-1756.
(48) Dowideit, P.; von Sonntag, C.: Reaction of ozone with ethene and its methyl- and chlorine-substituted derivatives in aqueous solution, Environ. Sci. Technol. 1998, 32, 112-1119.
(49) Yamamoto, Y.; Niki, E.; Shiokawa, H.; Kamiya, Y.: Ozonation of organic compounds. 2. Ozonation of phenol in water, J. Org. Chem. 1979, 44, 2137-2142.
(50) Buxton, G. V.; Greenstock, C. L.; Helman, W. P.; Ross, W. P.: Critical review of rate constants for reactions of hydrated electrons, hydrogen atoms and hydroxyl radicals in aqueous solution, J. Phys. Chem. Ref. Data 1988, 17, 513-886.
(51) Acero, J. L.; von Gunten, U.: Characterization of oxidation processes: ozonation and the AOP O3/H2O2, J. Am. Water Works Ass. 2001, 93, 90-100.
(52) von Sonntag, C.; Schuchmann, H.-P.: Peroxyl radicals in aqueous solutions, In Peroxyl radicals; Alfassi, Z. B., Ed.; John Wiley & Sons Ltd, 1997, 173-234.
(53) Staehelin, J.; Hoigné, J.: Decomposition of ozone in water in the presence of organic solutes acting as promoters and inhibitors of radical chain reactions, Environ. Sci. Technol. 1985, 19, 1206-1213.
(54) Gates, D. The chlorine dioxide handbook; American Water Works Association: Denver, 1998.
(55) Chen, J.; Regli, S.: Disinfection practices and pathogen inactivation in ICR surface water plants, In Information collection rule analysis data; McGuire, M. J., McLain, J. L., Obolensky, A., Eds.; Awwa Research Foundation and American Water Works Association, 2002; pp 371-394.
(56) USEPA: Alternative disinfectants and oxidants guidance manual, EPA 815-R-99-014, 1999.
(57) Rav-Acha, C.; Blits, R.: The different reaction mechanisms by which chlorine and chlorine dioxide react with polycyclic aromatic hydrocarbons (PAH) in water, Water Res. 1985, 19, 1273-1281.
(58) Rav-Acha, C.: The reaction of chlorine dioxide with aquatic organic materials and their health effects, Water Res. 1984, 18, 1329-1341.
(59) Ben Amor, H.; de Laat, J.; Doré, M.: Mode d'action du bioxyde de chlore sur quelques composés organique azotes en milieu aqueux dilue, Environ. Technol. Lett. 1985, 6, 489-504.
(60) Rosenblatt, D. H.; Hull, L. A.; De Luca, D. C.; Davis, G. T.; Weglein, R. C.; Williams, H. K. R.: Oxidations of amines. II. Substituent effects in chlorine dioxide oxidations, J. Am. Chem. Soc. 1967, 98, 1158-1163.
34 Chapter 1
(61) Muñoz, F.; von Sonntag, C.: Determination of fast ozone reactions in aqueous solution by competition kinetics, J. Chem. Soc., Perkin Trans. 2 2000, 661-664.
(62) Elovitz, M. S.; von Gunten, U.: Hydroxyl radical/ozone ratios during ozonation processes. I. The Rct Concept, Ozone Sci. Eng. 1999, 21, 239-260.
2
Oxidation of Pharmaceuticals during Ozonation and Advanced Oxidation Processes
Huber, M. M.; Canonica, S.; Park, G.-Y.; von Gunten, U. Environ. Sci. Technol. 2003, 37, 1016-1024.
36 Chapter 2
Abstract
This study investigates the oxidation of pharmaceuticals during conventional
ozonation and advanced oxidation processes (AOPs) applied in drinking water
treatment. In a first step, second-order rate constants for the reactions of selected
pharmaceuticals with ozone (kO3) and hydroxyl radicals (kOH) were determined
in bench-scale experiments (in brackets apparent kO3 at pH = 7 and T = 20 °C):
bezafibrate (590 ± 50 M-1 s-1), carbamazepine (~3 × 10⁵ M-1 s-1), diazepam (0.75
± 0.15 M-1 s-1), diclofenac (~1 × 10⁶ M-1 s-1), 17α-ethinylestradiol (~3 × 10⁶ M-1
s-1), ibuprofen (9.6 ± 1 M-1 s-1), iopromide (<0.8 M-1 s-1), sulfamethoxazole (~2.5
× 106 M-1 s-1), and roxithromycin (~7 × 10⁴ M-1 s-1). For five of the
pharmaceuticals the apparent kO3 at pH 7 was >5 × 10⁴ M-1 s-1, indicating that
these compounds are completely transformed during ozonation processes.
Values for kOH ranged from 3.3 to 9.8 × 10⁹ M-1 s-1. Compared to other important
micropollutants such as MTBE and atrazine, the selected pharmaceuticals
reacted about two to three times faster with hydroxyl radicals. In the second part
of the study, oxidation kinetics of the selected pharmaceuticals was investigated
in ozonation experiments performed in different natural waters. It could be
shown that the second-order rate constants determined in pure aqueous solution
could be applied to predict the behavior of pharmaceuticals dissolved in natural
waters. Overall it can be concluded that ozonation and AOPs are promising
processes for an efficient removal of pharmaceuticals in drinking waters.
Oxidation of Pharmaceuticals during Ozonation and AOPs 37
2.1 Introduction
In recent years, there has been growing concern about the occurrence of
pharmaceuticals in the aquatic environment. Comprehensive review articles on
the environmental relevance of pharmaceuticals have recently been published by
Halling-Sørensen et al. (1), and Daughton and Ternes (2). Moreover, several
studies have reported the occurrence of a great variety of pharmaceuticals in
surface waters (3-5).
Surface water is widely used as water resource for drinking water. Therefore,
the widespread occurrence of pharmaceuticals in surface waters may pose a
problem to water utilities. Only a few pharmaceuticals have been detected in
drinking waters so far (6,7). Concentrations were typically in the lower
nanogram/L-range. Up to now, there has been no proof that very low
concentrations of pharmaceuticals have any adverse health effects. Nevertheless,
based on precautionary principles, drinking water should be free from these
compounds to minimize the risk of unpredictable long-term effects. Hence, it is
important to assess water treatment processes with regard to their potential for
removing pharmaceuticals. Only limited information is available concerning this
question. In a recent study, the removal of some selected pharmaceuticals during
drinking water treatment was investigated in lab, pilot and full-scale
experiments (8). It was demonstrated that among different treatment steps only
ozonation and filtration with granular activated carbon were effective in
removing pharmaceuticals. The potential of ozonation and advanced oxidation
processes (AOPs) for removing pharmaceuticals was confirmed in another study
(9). However, both studies were performed using natural water samples,
yielding case-specific information on the removal efficiency. To assess the
removal efficiency of ozonation and AOPs in different natural waters, it is
indispensable to determine the rate constants for the reaction of pharmaceuticals
38 Chapter 2
with the oxidants, i.e., ozone (O3) and hydroxyl radicals (•OH). In addition,
information about oxidant concentrations is required.
The aim of the research presented here was to assess the potential of
ozonation and AOPs for the oxidation of pharmaceuticals. A list of nine
pharmaceuticals was selected based on consumption and environmental
relevance (see Table 2-1). A major task of this study was to establish a database
with second-order rate constants for the reactions of the selected
pharmaceuticals with O3 and •OH. The determination of the rate constants was
carried out in bench-scale systems in pure aqueous solution. To predict the
oxidation of micropollutants during ozonation processes, Elovitz and von
Gunten (10) developed the Rct-concept, which allows the prediction of the time-
dependent transformation of a compound based on rate constants and oxidant
behavior. The Rct-concept was successfully applied to predict the oxidation of
atrazine (11) and MTBE (12) and the formation of their oxidation products
during ozonation and AOPs. In the present study, this concept was applied to the
selected pharmaceuticals in order to show the effect of the water matrix on the
oxidation efficiency. To apply the Rct-concept, experiments were performed
with surface and ground waters under realistic treatment conditions.
2.2 Materials and Methods
2.2.1 Standards and Reagents
Bezafibrate, carbamazepine, diclofenac, ibuprofen, sulfamethoxazole and
roxithromycin were obtained from Sigma-Aldrich with a purity higher than 99%
(roxithromycin > 91%). Iopromide and 17α-ethinylestradiol were provided by
Schering/Berlin, Germany. Diazepam was offered by Roche AG/Basel,
Switzerland. Stock solutions of these pharmaceuticals were prepared with Milli-
Q water (Millipore). All chemicals used for solutions (buffer, eluents, etc.) were
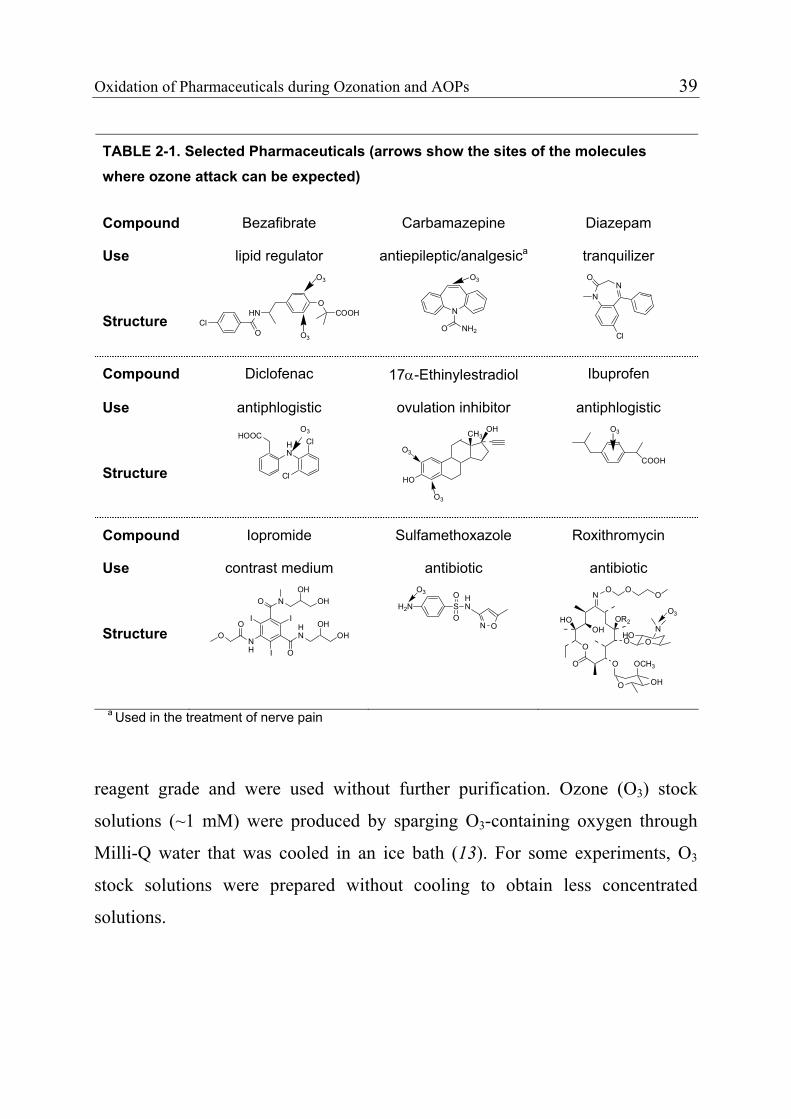
Oxidation of Pharmaceuticals during Ozonation and AOPs 39
reagent grade and were used without further purification. Ozone (O3) stock
solutions (~1 mM) were produced by sparging O3-containing oxygen through
Milli-Q water that was cooled in an ice bath (13). For some experiments, O3
stock solutions were prepared without cooling to obtain less concentrated
solutions.
TABLE 2-1. Selected Pharmaceuticals (arrows show the sites of the molecules where ozone attack can be expected)
Compound Bezafibrate Carbamazepine Diazepam
Use lipid regulator antiepileptic/analgesica tranquilizer
Structure O3
HN
O
OCOOH
Cl
O3
N
NH2O
O3
NN
O
Cl
Compound Diclofenac 17α-Ethinylestradiol Ibuprofen
Use antiphlogistic ovulation inhibitor antiphlogistic
Structure
O3
HN
HOOCCl
Cl O3
CH3
HO
OH
O3
COOH
O3
Compound Iopromide Sulfamethoxazole Roxithromycin
Use contrast medium antibiotic antibiotic
Structure HN O
NH
O
N OH
II
I
O
O
OH
OHO
H
SO
OH2N
HN
N O
O3
O
N
OH
O
O
OR2
O
O
OCH3
OHO
N
OH
HO
O OO
O3
a Used in the treatment of nerve pain
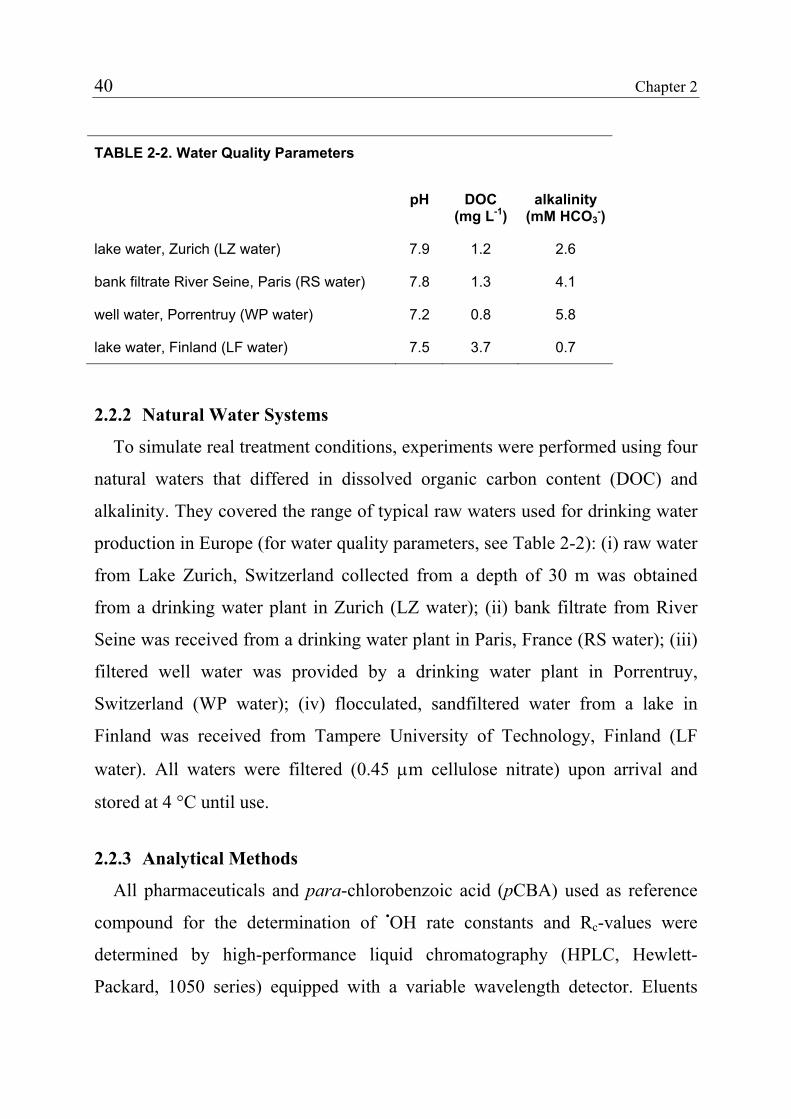
40 Chapter 2
TABLE 2-2. Water Quality Parameters
pH DOC (mg L-1)
alkalinity (mM HCO3
-)
lake water, Zurich (LZ water) 7.9 1.2 2.6
bank filtrate River Seine, Paris (RS water) 7.8 1.3 4.1
well water, Porrentruy (WP water) 7.2 0.8 5.8
lake water, Finland (LF water) 7.5 3.7 0.7
2.2.2 Natural Water Systems
To simulate real treatment conditions, experiments were performed using four
natural waters that differed in dissolved organic carbon content (DOC) and
alkalinity. They covered the range of typical raw waters used for drinking water
production in Europe (for water quality parameters, see Table 2-2): (i) raw water
from Lake Zurich, Switzerland collected from a depth of 30 m was obtained
from a drinking water plant in Zurich (LZ water); (ii) bank filtrate from River
Seine was received from a drinking water plant in Paris, France (RS water); (iii)
filtered well water was provided by a drinking water plant in Porrentruy,
Switzerland (WP water); (iv) flocculated, sandfiltered water from a lake in
Finland was received from Tampere University of Technology, Finland (LF
water). All waters were filtered (0.45 µm cellulose nitrate) upon arrival and
stored at 4 °C until use.
2.2.3 Analytical Methods
All pharmaceuticals and para-chlorobenzoic acid (pCBA) used as reference
compound for the determination of •OH rate constants and Rc-values were
determined by high-performance liquid chromatography (HPLC, Hewlett-
Packard, 1050 series) equipped with a variable wavelength detector. Eluents
Oxidation of Pharmaceuticals during Ozonation and AOPs 41
consisted of 10 mM phosphoric acid and methanol or acetonitrile. Depending on
compounds and experiments, isocratic or gradient elutions were used with
varying eluent ratios (column: Nucleosil 100, 5 µm C18, Machery-Nagel). The
sample volumes injected varied from 25 to 250 µL depending on concentrations
analyzed. Quantification limits of about 0.05-0.1 µM (10-40 µg L-1) were
achieved. The 95% confidence intervals for a single measurement were typically
± 3-10% and the recoveries in natural waters ranged from 95% to 100%.
Dissolved O3 was determined with the indigo method (13) or
spectrophotometrically by measuring the absorbance at 258 nm (ε = 3000 M-1
cm-1).
2.2.4 Determination of Rate Constants for the Reaction of Pharmaceuticals
with Ozone
All experiments were performed in Milli-Q water using tert-butyl alcohol (10-
50 mM) as •OH scavenger. The solutions were adjusted to the desired pH with
phosphate buffer (5 or 50 mM). If not stated otherwise, experiments were
carried out at 20 °C. The second-order rate constants were determined under
conditions where either O3 or the target compound was in excess.
Ozone in Excess. Experiments with bezafibrate, diazepam and ibuprofen were
conducted with O3 in excess at pH 6. As a reaction vessel, 500 ml glass bottles
with a dispenser system mounted onto the screwtop were used (14). For
bezafibrate, the kinetic runs were started by adding 10 mL of the O3 stock
solution to the solution containing bezafibrate (1 µM), yielding a final O3
concentration of 20 µM (1mg L-1). After 20 s, the first sample (5 mL) was
withdrawn with a dispenser system. Subsequently, sampling was performed in
15 s time intervals. The O3 residual was quenched immediately by adding 0.1
mL of a fresh sodium sulfite solution (24 mM). After 2.5 min the last sample
was directly transferred into a UV-cell without adding sulfite and O3 was
42 Chapter 2
determined spectrophotometrically. Preliminary experiments performed under
the same conditions showed that O3 decrease is < 5% during the sampling period
of 2.5 min. Therefore, it was assumed that the O3 concentration remained
constant during the experiments. The samples were immediately analyzed by
HPLC. To determine the activation energy for the reaction of O3 with
bezafibrate, the same experiments were carried out at 5, 10, and 15 °C.
For diazepam and ibuprofen, the procedure for bezafibrate had to be adapted
to higher O3 concentrations (0.2 and 0.1 mM, respectively) and longer sample
intervals (10 and 5 min, respectively) making it necessary to measure the O3
decay. In this case, the data were evaluated by plotting pharmaceutical
concentrations versus O3 exposure, i.e., O3 concentration integrated over time.
The slope of the resulting straight line represented the rate constant.
Pharmaceuticals in Excess. Second-order rate constants for iopromide and
roxithromycin as well as the activation energy for ibuprofen were determined
under conditions where the pharmaceutical compounds were in excess. In this
case, the O3 decrease was monitored instead of the disappearance of the target
compound. Due to the absorption of iopromide and ibuprofen in the range of
258 nm, O3 could not be quantified by measuring the direct UV absorption at
258 nm. Therefore, the indigo method was applied for these experiments (15).
To determine the activation energy of ibuprofen, experiments were carried out at
5-25 °C. Since roxithromycin exhibits no UV absorption at 258 nm, the O3
concentration could be determined by measuring its UV absorption. Kinetic runs
were performed in spectrophometric cells of 35 mL volume with Suprasil®
quartz window and 10 cm optical pathlength. The cell was mounted in a
temperature-stabilized metal block inside the spectrophotometer (Kontron
Instruments, Uvikon 940). The O3 decay was monitored directly in the
spectrophotometer with a sampling interval of 1.2 s. Due to the pH-dependent
rate constant, pH values ranging from 4.5 to 3.3 were selected. The resulting O3
Oxidation of Pharmaceuticals during Ozonation and AOPs 43
half-lives ranged from 0.2 to 5 min. The experimental setup did not allow the
measurement of shorter half-lives, which would occur at higher pH values
Competition Kinetics. The methods described above are limited to rate
constants that are lower than about 1000 M-1 s-1. Only pH-dependent rate
constants can be extrapolated to higher values. In this study, competition
kinetics was used to determine high rate constants. For 17α-ethinylestradiol,
phenol (kO3,phenolate = 1.4 × 10⁹ M-1 s-1, pKa = 9.9 (16)) was selected as a reference
compound because a similar reaction mechanism and a similar rate constant
were expected. The experiments were carried out in 25 mL serum vials at pH 6
with solutions containing equal concentrations of 17α-ethinylestradiol and
reference compound (4 µM). Different understoichiometric concentration levels
of O3 ranging from 1.5 to 7.5 µM were added with a glass syringe to a series of
serum vials. During O3 injection the solutions were vigorously stirred.
Remaining concentrations of target and reference compound in the serum vials
were then analyzed by HPLC. The data were evaluated based on eq 1, where
kO3(R) and kO3(M) are the rate constants for the reference (R) and target
compound (M), respectively. The different O3 doses are represented by n.
[ ]( )[ ]
[ ]( )[ ] (R)
(M)0R
R(n)ln0M
M(n)lnO3
O3
kk
⎟⎟⎠
⎞⎜⎜⎝
⎛=⎟⎟
⎠
⎞⎜⎜⎝
⎛ (1)
The apparent rate constant kO3(M) could be determined from a plot of
ln([M(n)]/[M(0)] versus ln([R(n)]/[R(0)] with kO3(M)/kO3(R) as the slope of the
straight line. To confirm the results, the same experiments were also performed
with the pairs 17α-ethinylestradiol/4-chlorophenol and phenol/4-chlorophenol.
The second-order rate constant for the dissociated 17α-ethinylestradiol was
calculated from the measured apparent rate constant based on the assumption
that the reactivity of the neutral 17α-ethinylestradiol can be neglected at pH 6.
44 Chapter 2
A very similar experimental setup was used to determine the rate constants for
diclofenac and sulfamethoxazole. Phenol was chosen as the reference
compound. In contrast to the method mentioned above, the ratio of the target
compound to the reference compound was varied from 1:3 to 3:1 and
experiments were carried out at pH 7. Preliminary experiments showed that at
this pH the apparent rate constants of phenol was similar to the rate constants of
the target compound. Phenol reacts about 10 times faster at pH 7 than at pH 6.
To check whether competition kinetics can be applied under these conditions,
additional experiments were conducted at pH 6.7 for diclofenac and pH 7.3 for
sulfamethoxazole. At pH 6.7 phenol reacts slightly more slowly with O3 than
diclofenac, whereas at pH 7 phenol reacts slightly faster. Correspondingly, the
reactivity of phenol at pH 7.3 is higher than the one of sulfamthoxazole and
lower at pH 7. The variation of pH resulted in only small changes for the
calculated rate constants showing that the results are consistent. Competition
kinetics between diclofenac and sulfamethoxazole directly could not be
performed due to secondary reactions between a product of sulfamethoxazole
and diclofenac.
A method developed by Muñoz and von Sonntag (17) was adapted to
determine the rate constant of carbamezepine. A constant O3 dose (10 µM) was
added to solutions containing 80 µM carbamazepine and varying concentrations
of the reference compound nitrite (3.7 × 10⁵ M-1 s-1 (18)) or buten-3-ol (7.9 × 10⁴
M-1 s-1 (19)), respectively. The product formed through the reaction of O3 with
carbamazepine was monitored (the structure of this product is not known, its
UV spectra is similar to that of carbamazepine). The rate constant was then
derived by comparing product formation in the presence and in the absence of
the reference compound. The experiments were carried out at pH 7 in 25 mL
serum vials. Ozone was added with a glass syringe while the reaction solution
was vigorously stirred.
Oxidation of Pharmaceuticals during Ozonation and AOPs 45
2.2.5 Determination of Rate Constants for the Reaction of Pharmaceuticals
with Hydroxyl Radicals
Competition kinetics was used to determine the second-order rate constants
for the reaction with hydroxyl radicals (•OH). The reference compound was
pCBA exhibiting a rate constant of kOH = 5×10⁹ M-1 s-1 (20). All experiments
were carried out with Milli-Q water at 25 °C and the pH was kept constant at 7
using 5 mM phosphate buffer. For most experiments, •OH was generated by
photolysis of H2O2 at 313 nm. These experiments were performed in quartz
tubes using a merry-go-round photoreactor (DEMA model 125, Hans Mangels
GmbH, Bornheim-Roisdorf, Germany) equipped with a medium-pressure
mercury lamp (Hanau model TQ718) driven at a power of 500 W. A UVW-55
glass band-pass filter (supplied by DEMA) was used to eliminate radiation of
wavelengths shorter than 308 nm in order to minimize direct photolysis of the
pharmaceuticals. Further details about the irradiation equipment are given
elsewhere (21,22). For compounds undergoing direct photolysis, •OH was
generated with γ-radiolysis. The experiments were performed in a 60Co γ-
radiation source with lead shielding (type GAMMACELL, Atomic Energy of
Canada; dose rate for water = 2.1 kGyh-1 ± 20% in the center of source with lead
shielding). Solutions were saturated with a 4:1 mixture of N2O and O2 (23). N2O
is necessary to convert solvated electrons into •OH. The rate of •OH formation
was about 0.1 µM s-1. Initial pharmaceutical and reference compound
concentrations were 1 µM in UV/H2O2 experiments and 10 or 50 µM in γ-
radiolysis experiments. In both experiments, samples were repeatedly irradiated
for constant time intervals. Between irradiation periods, samples were
withdrawn for HPLC analysis. The data were evaluated based on eq 2, where
kOH(R) and kOH(M) are the rate constants for the reference (R) and target
compound (M), respectively. The irradiation time is represented by t.
46 Chapter 2
[ ]( )[ ]
[ ]( )[ ] )(
)(0)(ln
0)(ln
RkMk
RtR
MtM
OH
OH⎟⎟⎠
⎞⎜⎜⎝
⎛=⎟⎟
⎠
⎞⎜⎜⎝
⎛ (2)
For iopromide, •OH was also generated by the O3/H2O2 system. Instead of
repeated sampling, different O3 doses were added to solutions with varying
ratios of iopromide and pCBA (from 1:3 to 3:1).
2.2.6 Ozonation of Natural Waters
Two different experimental setups were used to investigate the oxidation of
pharmaceuticals during the ozonation of natural waters. Pharmaceuticals with
rate constants kO3 > 103 M-1 s-1 were investigated with the setup for fast-reacting
compounds, pharmaceuticals with rate constants <100 M-1 s-1 with the setup for
slow-reacting compounds. Bezafibrate was tested with both setups.
Fast reacting compounds. RS or LF water (Table 2-1) was buffered to pH 8
by adding 10 mM borate buffer and adjusting the pH with HCl. The water was
then spiked with one pharmaceutical compound (0.5 µM) and transferred into
five 25 mL serum vials. In a next step, O3 doses of 0.1, 0.2, 0.5, 1, and 2 mg L-1
were injected into the vials while the water was vigorously stirred for a few
seconds. As soon as O3 was completely consumed (up to 10 h for RS water),
residual pharmaceutical concentrations were measured with HPLC. All
experiments were performed at 10 °C. To determine bromate formation under
the applied conditions, one experiment was carried out without adding a
pharmaceutical compound. Instead, 50 µg L-1 bromide was added to LF water to
achieve a bromide level of 60 µg L-1. RS water already contained about 60 µg
L-1 bromide and no spiking was necessary. Bromate was determined according
to a method developed by Salhi and von Gunten (24).
Slow reacting compounds. Natural water samples were buffered to pH 8 by
adding 10 mM borate buffer and adjusting the pH with HCl. The water was then
spiked with one pharmaceutical compound (0.5 µM) and the probe compound
Oxidation of Pharmaceuticals during Ozonation and AOPs 47
pCBA (0.25 µM), which does not react with O3 directly. The spiked
concentrations were low enough to avoid significant changes in O3 half-lives or •OH scavenging-capacities of the investigated waters. The experiments were
carried out at 10 °C in order to mimic realistic treatment conditions. Amber
bottles (500 mL) equipped with a dispenser system (14) served as reaction
vessels. The experiments were started by adding 2 mg L-1 O3 and, subsequently,
samples were withdrawn in regular time intervals. The reaction was stopped
with indigo for residual O3 measurements. For pharmaceutical and pCBA
analysis, O3 was quenched with sodium sulfite. For analysis methods with
gradient elution, samples had to be adjusted to acidic pH by adding HCl before
analysis.
2.3 Results and Discussion
2.3.1 Rate Constants for the Reaction of Selected Pharmaceuticals with
Ozone
Second-order rate constants for the reaction of pharmaceuticals with ozone
(O3) have been determined to assess the oxidation of these compounds during
conventional ozonation or ozone-based AOPs. Table 2-3 and Figure 2-1
summarize the results. Measurements were performed at least three times and
the errors given are 95% confidence intervals. For competition kinetics, errors
are larger and more difficult to estimate, partly due to the errors induced by the
use of reference compounds. We expect rate constants measured with this
method to vary up to a factor of two. Methods monitoring the O3 decay (indigo,
UV) yield a rate constant which differs from the second-order rate constant by
the stoichiometric factor η, which defines the number of O3 molecules
consumed per molecule of target compound under the experimental conditions.
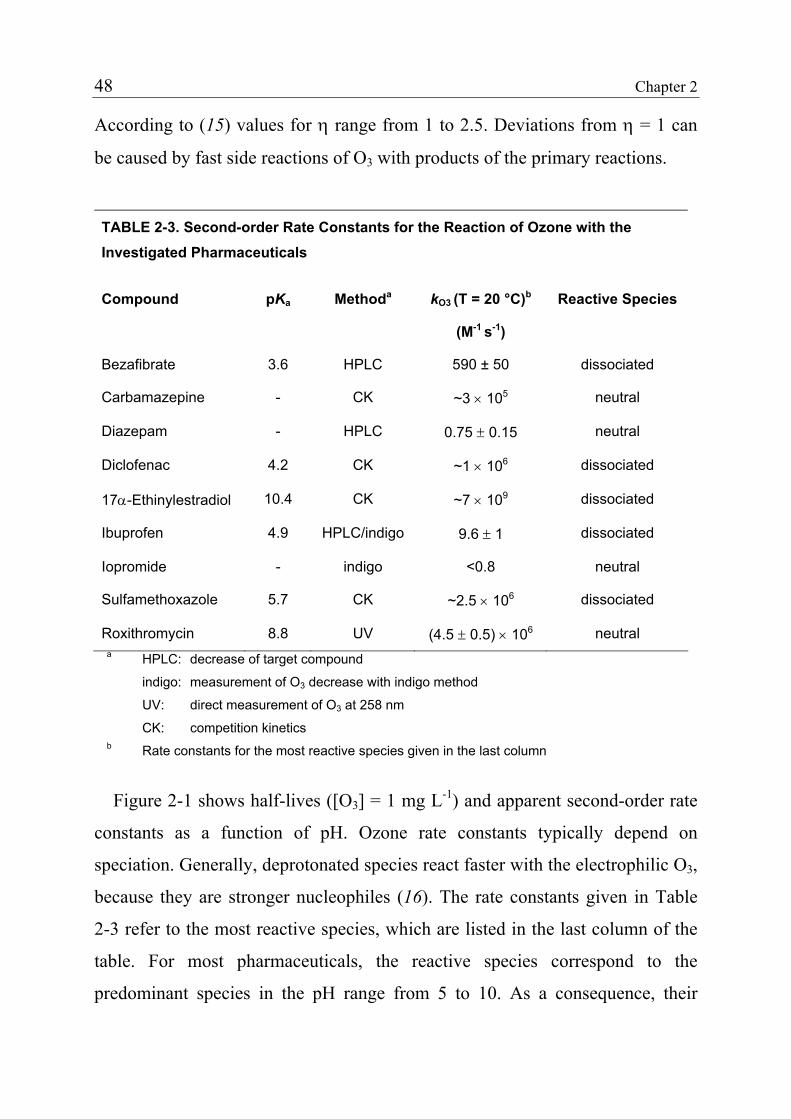
48 Chapter 2
According to (15) values for η range from 1 to 2.5. Deviations from η = 1 can
be caused by fast side reactions of O3 with products of the primary reactions.
TABLE 2-3. Second-order Rate Constants for the Reaction of Ozone with the Investigated Pharmaceuticals
Compound pKa Methoda kO3 (T = 20 °C)b
(M-1 s-1)
Reactive Species
Bezafibrate 3.6 HPLC 590 ± 50 dissociated
Carbamazepine - CK ~3 × 10⁵ neutral
Diazepam - HPLC 0.75 ± 0.15 neutral
Diclofenac 4.2 CK ~1 × 10⁶ dissociated
17α-Ethinylestradiol 10.4 CK ~7 × 10⁹ dissociated
Ibuprofen 4.9 HPLC/indigo 9.6 ± 1 dissociated
Iopromide - indigo <0.8 neutral
Sulfamethoxazole 5.7 CK ~2.5 × 10⁶ dissociated
Roxithromycin 8.8 UV (4.5 ± 0.5) × 106 neutral a HPLC: decrease of target compound
indigo: measurement of O3 decrease with indigo method
UV: direct measurement of O3 at 258 nm
CK: competition kinetics b Rate constants for the most reactive species given in the last column
Figure 2-1 shows half-lives ([O3] = 1 mg L-1) and apparent second-order rate
constants as a function of pH. Ozone rate constants typically depend on
speciation. Generally, deprotonated species react faster with the electrophilic O3,
because they are stronger nucleophiles (16). The rate constants given in Table
2-3 refer to the most reactive species, which are listed in the last column of the
table. For most pharmaceuticals, the reactive species correspond to the
predominant species in the pH range from 5 to 10. As a consequence, their
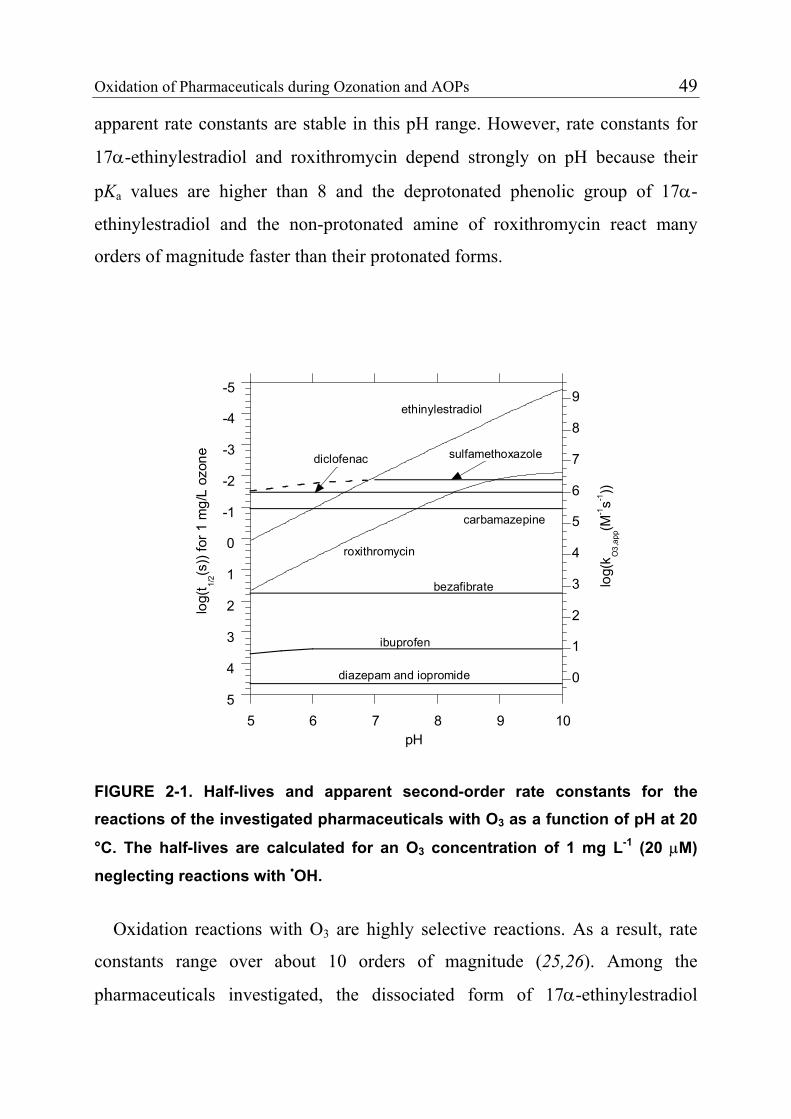
Oxidation of Pharmaceuticals during Ozonation and AOPs 49
apparent rate constants are stable in this pH range. However, rate constants for
17α-ethinylestradiol and roxithromycin depend strongly on pH because their
pKa values are higher than 8 and the deprotonated phenolic group of 17α-
ethinylestradiol and the non-protonated amine of roxithromycin react many
orders of magnitude faster than their protonated forms.
-5
-4
-3
-2
-1
0
1
2
3
4
50
1
2
3
4
5
6
7
8
9
5 6 7 8 9 10
log(
t 1/2(s
)) fo
r 1 m
g/L
ozon
e
log(
k O3,
app(M
-1s-1
))
pH
diazepam and iopromide
ibuprofen
bezafibrate
diclofenac
ethinylestradiol
roxithromycin
carbamazepine
sulfamethoxazole
FIGURE 2-1. Half-lives and apparent second-order rate constants for the reactions of the investigated pharmaceuticals with O3 as a function of pH at 20
°C. The half-lives are calculated for an O3 concentration of 1 mg L-1 (20 µM)
neglecting reactions with •OH.
Oxidation reactions with O3 are highly selective reactions. As a result, rate
constants range over about 10 orders of magnitude (25,26). Among the
pharmaceuticals investigated, the dissociated form of 17α-ethinylestradiol
50 Chapter 2
exhibited the highest rate constant reacting at nearly diffusion-controlled rate.
Experiments with 17β-estradiol instead of 17α-ethinylestradiol yielded the same
rate constant (data not shown) and a similar product, demonstrating that the
reaction takes place at the phenolic group and not at the ethinyl group. This
implied that the rate constant for 17α-ethinylestradiol is pH dependent.
Knowing the pKa (10.4), the rate constant for the dissociated form could be
extrapolated. This rate constant is in accordance with rate constants for other
phenolic compounds.
For diclofenac and sulfamethoxazole the rate constants are 1 × 10⁶ and 2.5 ×
106 M-1 s-1, respectively. These compounds react more slowly than dissociated
17α-ethinylestradiol, however, apparent rate constants at pH 7 are in the same
order of magnitude. The main reaction sites are the aromatic amino groups (see
Table 2-1). Since protonated amino groups do not react with O3 (16), the
reactivity of amines is strongly related to their pKa values. Compared to other
amines diclofenac and sulfamethoxazole react particularly fast because the pKa
values of the amino groups are < 3. This means that at pH > 5, the non-
protonated amine (reactive species) is the predominant species. By contrast, the
amine group in roxithromycin has a pKa of 8.8 and at pH < 8 the non-reactive
protonated amine is predominant, leading to a diminished reactivity. The rate
constant for sulfamethoxazole might be weakly pH dependent at pH < 7 due to
the protonation of the dissociated sulfonamide group (pKa = 5.7). The high
reactivity of carbamezepine can be assigned to the reaction of O3 at the double
bond which connects the two phenyl moieties (see Table 2-1). The rate constant
is slightly higher than for other olefins, but in very good agreement with the rate
constants for styrene (3 × 10⁵ M-1 s-1 (15)).
For water treatment conditions (pH 7-8, [O3] = 1 mg L-1) half-lives for 17α-
ethinylestradiol, carbamazepine, roxithromycin, diclofenac and
Oxidation of Pharmaceuticals during Ozonation and AOPs 51
sulfamethoxazole are <0.5 s. This indicates clearly that, for these
pharmaceuticals, the parent compound is completely transformed during
ozonation processes and ozone-based AOPs. The remaining pharmaceuticals
have considerably lower rate constants. The intermediate reactivity of
bezafibrate is caused by the R-oxy substituent (-O-C(CH3)2COOH) on one of the
aromatic rings. R-oxy substituents have a similar activating effect on aromatic
rings as hydroxy substituents (15). However, R-oxy substituents cannot be
deprotonated and consequently the overall rate constant at pH > 4 is much
lower. Nevertheless, this compound will also be largely transformed by most
ozonation processes. Ibuprofen reacts with a rate constant of 9.6 M-1 s-1. The low
rate constants can be explained by the absence of reactive groups and an
aromatic ring that is only slightly activated, similar to toluene (15). Due to the
low rate constant, direct reactions with O3 will play a minor role during
ozonation processes and the oxidation of this compound will mainly be caused
by •OH originating from O3 decay. The reaction of O3 with iopromide is very
slow which only allows an estimate of an upper limit. Iopromide exhibits three
nitrogen atoms as amides. In contrast to amines, amides have a very low
reactivity to O3. The rate constant for the reaction of diazepam with O3 is also
very low. Therefore, during ozonation processes direct O3 reactions are in both
cases less important than oxidation by •OH.
For two pharmaceuticals with intermediate to low O3 rate constants,
activation energies were determined to calculate their rate constants at
temperatures below 20 °C. Ibuprofen exhibited an activation energy of 57 ± 8 kJ
mol-1 and bezafibrate one of 39 ± 6 kJ mol-1. Typically, activation energies for
reactions with O3 range from 35 to 50 kJ mol-1 (15).
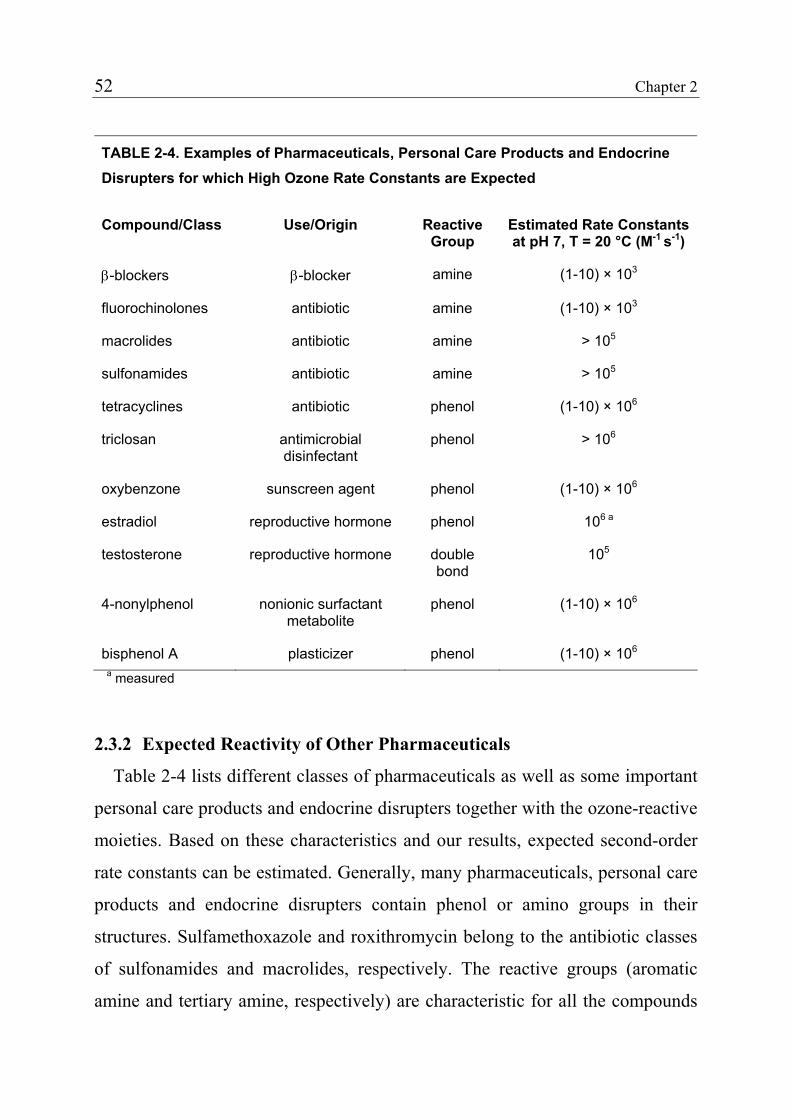
52 Chapter 2
TABLE 2-4. Examples of Pharmaceuticals, Personal Care Products and Endocrine Disrupters for which High Ozone Rate Constants are Expected
Compound/Class Use/Origin Reactive Group
Estimated Rate Constants at pH 7, T = 20 °C (M-1 s-1)
β-blockers β-blocker amine (1-10) × 103
fluorochinolones antibiotic amine (1-10) × 103
macrolides antibiotic amine > 105
sulfonamides antibiotic amine > 105
tetracyclines antibiotic phenol (1-10) × 106
triclosan antimicrobial disinfectant
phenol > 106
oxybenzone sunscreen agent phenol (1-10) × 106
estradiol reproductive hormone phenol 106 a
testosterone reproductive hormone double bond
105
4-nonylphenol nonionic surfactant metabolite
phenol (1-10) × 106
bisphenol A plasticizer phenol (1-10) × 106
a measured
2.3.2 Expected Reactivity of Other Pharmaceuticals
Table 2-4 lists different classes of pharmaceuticals as well as some important
personal care products and endocrine disrupters together with the ozone-reactive
moieties. Based on these characteristics and our results, expected second-order
rate constants can be estimated. Generally, many pharmaceuticals, personal care
products and endocrine disrupters contain phenol or amino groups in their
structures. Sulfamethoxazole and roxithromycin belong to the antibiotic classes
of sulfonamides and macrolides, respectively. The reactive groups (aromatic
amine and tertiary amine, respectively) are characteristic for all the compounds
Oxidation of Pharmaceuticals during Ozonation and AOPs 53
in these two groups. Therefore, rate constants for all sulfonamides and
macrolides will be very similar to the rate constants for sulfamethoxazole and
roxithromycin, respectively. The endocrine disrupter 17α-ethinylestradiol is a
synthetic steroid hormone. Many steroid hormones have a phenolic group (e.g.,
17α-estradiol, 17β-estradiol, estrone, and equilin) and, therefore, will exhibit
about the same reactivity as 17α-ethinylestradiol. For 17β-estradiol, this was
confirmed by measurements. Other steroid hormones lack the phenolic group,
but have a double bond (progesterone, testosterone). These compounds will
react about one order of magnitude slower than phenolic steroid hormones.
2.3.3 Rate Constants for the Reaction of Pharmaceuticals with Hydroxyl
Radicals
Besides the direct reaction with O3, also reactions with hydroxyl radicals
(•OH) contribute to the oxidation of micropollutants during ozonation (26).
Moreover, •OH is the main oxidant in AOPs. Therefore, the rate constants for
the reaction of 8 selected pharmaceuticals with •OH were determined. Results
are summarized in Table 2-5.
Most rate constants were measured with the UV/H2O2 method. Some
pharmaceuticals, however, were photolyzed by UV-radiation. Direct photolysis
accounted for 75%, 13% and 7% of the observed rate constant for diclofenac,
iopromide and sulfamethoxazole, respectively. Since direct photolysis followed
first-order kinetics, as did the oxidation by •OH, the rate constant for
sulfamethoxazole was corrected for the percentage mentioned above. Rate
constants for diclofenac and iopromide were determined using γ-radiolysis.
The rate constants for the reactions of pharmaceuticals with •OH range from 3
to 10 × 109 M-1 s-1. For half of the investigated compounds, rate constants lie
between 7 and 9 × 10⁹ M-1 s-1 demonstrating the relatively non-selective nature
of •OH reactions in aqueous solution. The X-ray contrast medium iopromide has
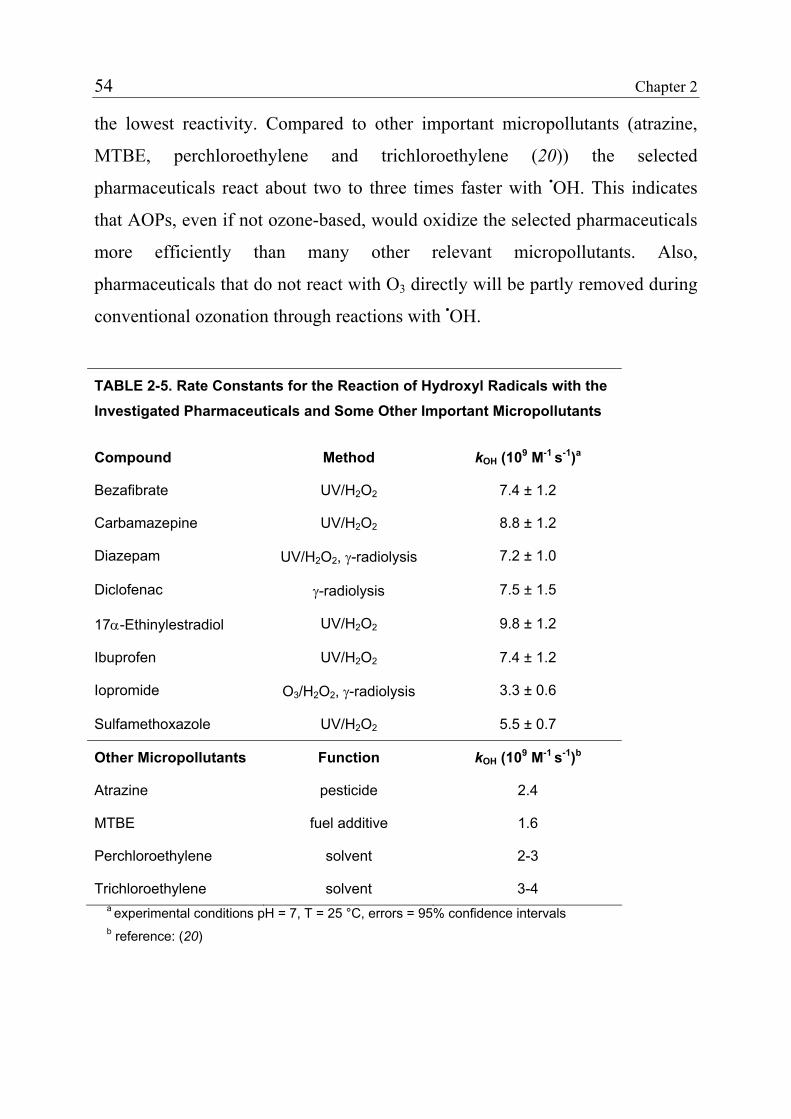
54 Chapter 2
the lowest reactivity. Compared to other important micropollutants (atrazine,
MTBE, perchloroethylene and trichloroethylene (20)) the selected
pharmaceuticals react about two to three times faster with •OH. This indicates
that AOPs, even if not ozone-based, would oxidize the selected pharmaceuticals
more efficiently than many other relevant micropollutants. Also,
pharmaceuticals that do not react with O3 directly will be partly removed during
conventional ozonation through reactions with •OH.
TABLE 2-5. Rate Constants for the Reaction of Hydroxyl Radicals with the Investigated Pharmaceuticals and Some Other Important Micropollutants
Compound Method kOH (109 M-1 s-1)a
Bezafibrate UV/H2O2 7.4 ± 1.2
Carbamazepine UV/H2O2 8.8 ± 1.2
Diazepam UV/H2O2, γ-radiolysis 7.2 ± 1.0
Diclofenac γ-radiolysis 7.5 ± 1.5
17α-Ethinylestradiol UV/H2O2 9.8 ± 1.2
Ibuprofen UV/H2O2 7.4 ± 1.2
Iopromide O3/H2O2, γ-radiolysis 3.3 ± 0.6
Sulfamethoxazole UV/H2O2 5.5 ± 0.7
Other Micropollutants Function kOH (109 M-1 s-1)b
Atrazine pesticide 2.4
MTBE fuel additive 1.6
Perchloroethylene solvent 2-3
Trichloroethylene solvent 3-4 a experimental conditions pH = 7, T = 25 °C, errors = 95% confidence intervals b reference: (20)
Oxidation of Pharmaceuticals during Ozonation and AOPs 55
2.3.4 Product Formation
The reactions with O3 and •OH during an ozonation process will not result in
the complete mineralization of pharmaceuticals. However, since
pharmaceuticals generally react with specific receptors in the target organisms,
transformation of the parent molecules by the above oxidants may be sufficient
to reduce the intended pharmaceutical effects. In ongoing research the
degradation pathways of the selected pharmaceuticals are investigated. From the
literature, the transformation pathways for certain functional groups are known.
An overview is given in (26). Reactions of O3 with phenolic compounds results
in the cleavage of the aromatic ring (27). Ozone attack at double bonds leads to
bond cleavage and formation of carbonyl compounds (19,28). Hydroxylamines
and amine oxides are formed in O3 reactions with secondary (29) and tertiary
amines (30), respectively. Hydroxylamines undergo further reactions with O3.
For the pharmaceuticals investigated, a major part of the reactions with •OH will
take place at benzene rings, resulting in the formation of phenolic compounds or
ring cleavage. In ozone-based processes phenolic compounds will quickly react
with O3. Based on this information, it can be concluded that modifications
caused by ozonation or AOPs should be sufficient to eliminate the intended
pharmaceutical effects of most of the investigated compounds. However, it
cannot be ruled out that for some compounds modifications may not be
important or even lead to the formation of toxic by-products. For instance, the
formation of hydroxylamines could be problematic from a toxicological point of
view as in the case of sulfonamides, the hydroxylamine of these compounds is
associated with hypersensitivity reactions to this class of antibiotics (31).
56 Chapter 2
2.3.5 Oxidation of Fast-Reacting Pharmaceuticals in Natural Waters and
Bromate Formation
Experiments have been performed in different natural waters to confirm the
determined rate constants and to apply them to real treatment conditions. For
pharmaceuticals with O3 rate constants >100 M-1s-1, batch experiments were
carried out with RS and LF waters, which exhibit high alkalinity and low DOC,
and low alkalinity and high DOC, respectively. Ozone half-lives ([O3]0 = 2 mg
L-1, pH = 8, T = 10 °C) were 75 min for RS and 4 min for LF water. Figure 2-2
shows the transformation of the selected pharmaceuticals in these two waters as
a function of different O3 doses. In RS water, an O3 dose of 0.2 mg L-1 was
sufficient to achieve a transformation >97% with the exception of bezafibrate.
LF water has a higher O3 demand and an O3 dose of 0.5 mg L-1 was necessary
for the same transformation. The O3 rate constant of bezafibrate is at least 100
times lower than the rate constants of the other compounds and bezafibrate can
obviously not compete with the initial O3 demand of these waters. The generally
low transformation for the O3 dose of 0.1 mg L-1 in LF and RS water may partly
be caused by the fact that the O3 concentration exceeds the pharmaceutical
concentration only by a factor of 4. At more realistic pharmaceutical
concentrations a better transformation can be expected. Results for O3 doses of
>0.2 mg L-1 can be directly extrapolated to pharmaceutical concentrations in the
ng/L-range. Overall the results demonstrate that relatively low O3 doses are
sufficient to achieve a complete transformation of pharmaceuticals exhibiting
rate constants of >105 M-1s-1.
Besides the transformation of pharmaceuticals, the formation of bromate, the
major by-product of concern during ozonation processes, was measured as well.
The concentration of the bromate precursor bromide was 60 µg L-1 in RS
(natural level) and LF water (fortified). This represents a medium bromide
concentration. In RS water the highest O3 dose led to a bromate concentration of
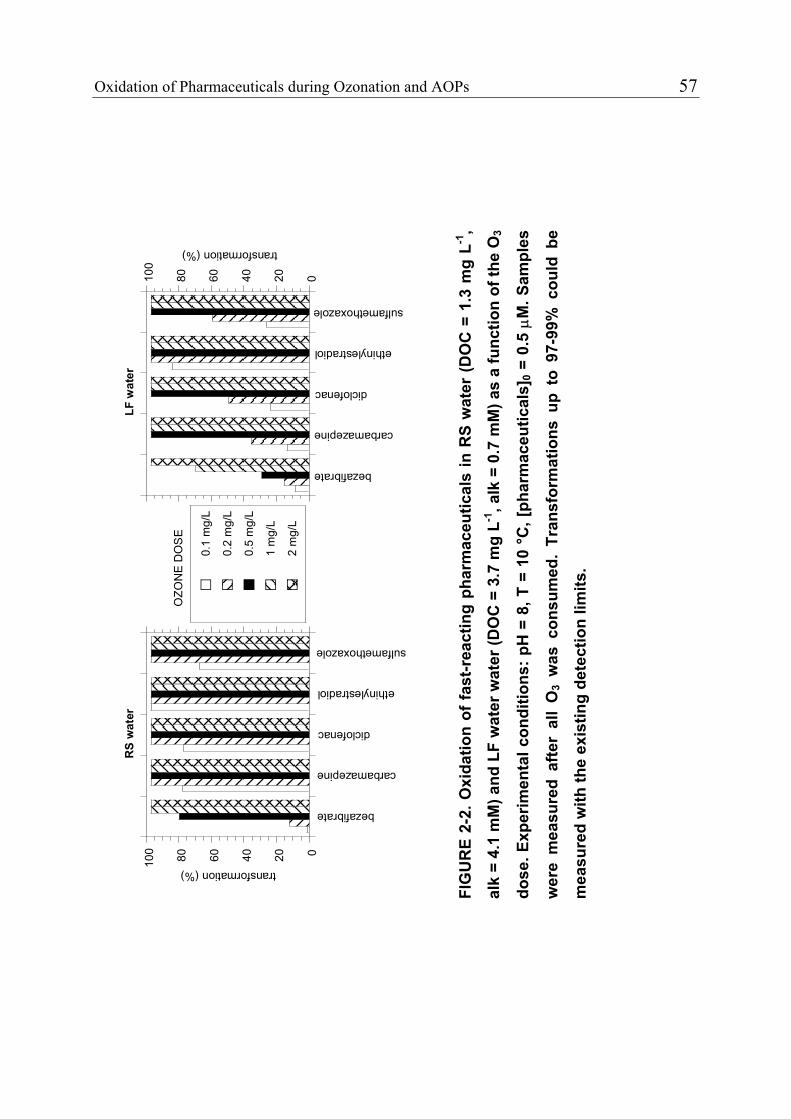
Oxidation of Pharmaceuticals during Ozonation and AOPs 57
bezafibrate
carbamazepine
diclofenac
ethinylestradiol
sulfamethoxazole
RS
wat
er
0.1
mg/
L
0.2
mg/
L
0.5
mg/
L
1 m
g/L
2 m
g/L
020406080100
transformation (%)
OZO
NE
DO
SE
bezafibrate
carbamazepine
diclofenac
ethinylestradiol
sulfamethoxazole
LF w
ater
020406080100
transformation (%)
FIG
UR
E 2-
2. O
xida
tion
of fa
st-r
eact
ing
phar
mac
eutic
als
in R
S w
ater
(DO
C =
1.3
mg
L-1,
alk
= 4.
1 m
M) a
nd L
F w
ater
wat
er (D
OC
= 3
.7 m
g L-1
, alk
= 0
.7 m
M) a
s a
func
tion
of th
e O
3
dose
. Exp
erim
enta
l con
ditio
ns: p
H =
8, T
= 1
0 °C
, [ph
arm
aceu
tical
s]0 =
0.5
µM
. Sam
ples
wer
e m
easu
red
afte
r al
l O
3 w
as c
onsu
med
. Tr
ansf
orm
atio
ns u
p to
97-
99%
cou
ld b
e
mea
sure
d w
ith th
e ex
istin
g de
tect
ion
limits
.
58 Chapter 2
12 µg L-1, which is slightly higher than the drinking water standard of 10 µg L-1
set by the EU and the US. Since samples were only measured after all O3 was
consumed, the high O3 stability in RS water led to a large O3 exposure and, as a
consequence, to a high bromate formation. For lower O3 doses, bromate
formation was <2 µg L-1. In LF water bromate formation was <2 µg L-1 for all
O3 doses. Generally, the results show that bromate formation is not a problem
for O3 doses that are necessary to oxidize fast-reacting pharmaceuticals.
2.3.6 Oxidation of Slow-Reacting Pharmaceuticals during Ozonation of
Natural Waters
Compared to fast reacting pharmaceuticals, which are completely transformed
for typical O3 doses applied in drinking water treatment, it is more difficult to
predict the oxidation of pharmaceuticals exhibiting lower O3 rate constants. In
this case, reactions with O3 and •OH have to be considered and it is essential to
know their concentrations during the ozonation process, respectively their
exposures (i.e., concentration integrated over the reaction time). The Rct-concept
(10,26) is an experimental approach to calibrate ozonation processes and ozone-
based AOPs with respect to O3 and •OH exposure. This calibration is done by
determining the ratio of the •OH exposure to the O3 exposure in the investigated
water (Rct-value). After an initial phase, the Rct-value remains constant for the
rest of the ozonation process and therefore, also represents the ratio of •OH
concentration to O3 concentration (Rc-value). The •OH exposure is obtained by
measuring the degradation of a probe compound (pCBA) that does not react
with O3. Simultaneously, the O3 decrease is followed in order to determine the
O3 exposure. With eq 3 it is then possible to predict the oxidation of a
micropollutant (M) as a function of O3 exposure (∫[O3]dt), Rc ([•OH]/[O3]), kOH
and kO3:
Oxidation of Pharmaceuticals during Ozonation and AOPs 59
[ ][ ] [ ]( ) )(ln
330
OcOH kRkdtOMM
+−=⎟⎟⎠
⎞⎜⎜⎝
⎛∫ (3)
where kOH and kO3 are the second-order rate constants for the reactions of a
micropollutant (M) with •OH and O3, respectively.
Experiments with four natural waters were performed to apply the rate
constants determined to real treatment conditions. The corresponding water
quality parameters are given in Table 2-2. The selected waters differed in DOC
and alkalinity, two parameters controlling O3 stability as well as •OH formation
and scavenging in natural waters. Based on the concept presented above, Rc-
values were determined for the natural waters and the oxidation of the selected
pharmaceuticals was predicted using eq 3. Ozone rate constants were adjusted to
the experimental conditions using the measured activation energies for
bezafibrate (39 kJ mol-1) and ibuprofen (57 kJ mol-1) and an average activation
energy of 40 kJ mol-1 (15) for diazepam and iopromide. In the same
experiments, the oxidation of the pharmaceuticals was measured to verify the
predictions. Table 2-6 summarizes the results.
The measured oxidation of bezafibrate was >95% in all ozonation
experiments. This is mainly due to the relatively high second-order rate constant
for its reaction with O3. The measured oxidation of diazepam, iopromide and
ibuprofen ranged from 24% (diazepam and iopromide in WP water) to 77%
(ibuprofen in LF water). The oxidation of these compounds is largely controlled
by reactions with •OH. The oxidation efficiencies increased with increasing
DOC and decreased with increasing alkalinity, respectively. An increased DOC
leads to an enhanced rate of O3 transformation into •OH, whereas alkalinity
stabilizes O3. The effect of DOC and alkalinity was less pronounced for
ibuprofen due to a higher O3 rate constant. In WP and RS water with a high O3
stability, the higher O3 rate constant resulted in a better oxidation of ibuprofen
compared to diazepam, while in LZ and LF water, where O3 reaction are less
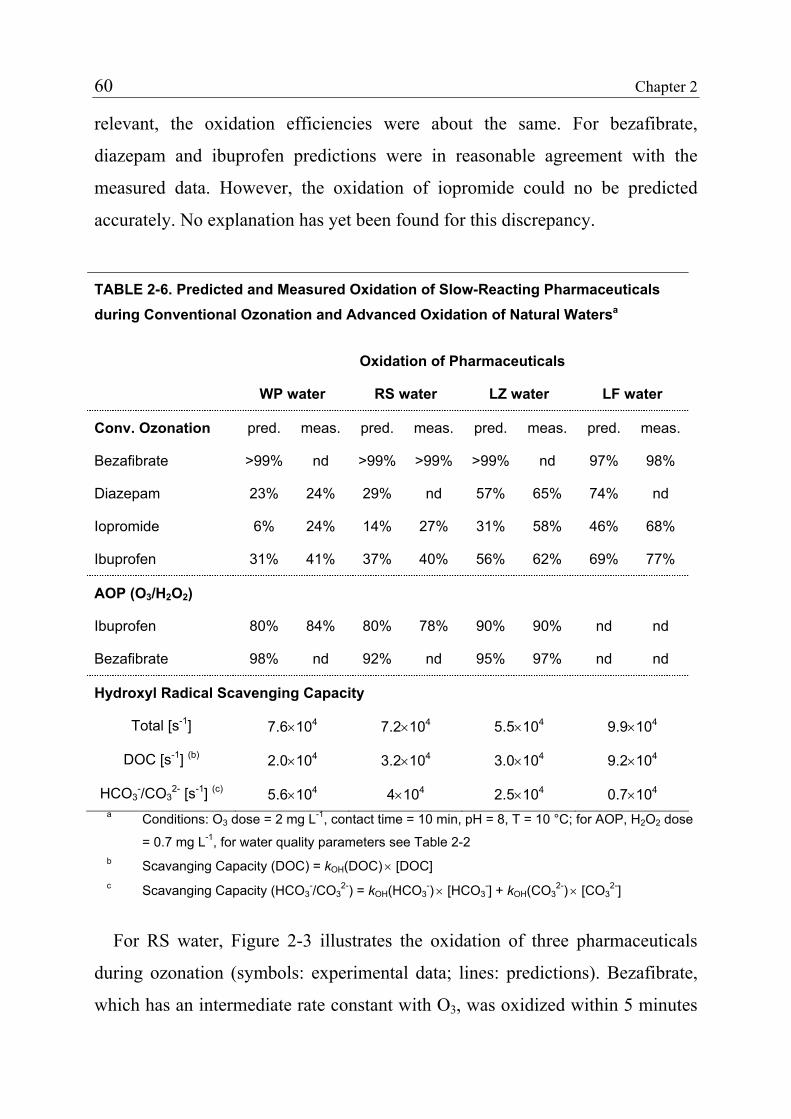
60 Chapter 2
relevant, the oxidation efficiencies were about the same. For bezafibrate,
diazepam and ibuprofen predictions were in reasonable agreement with the
measured data. However, the oxidation of iopromide could no be predicted
accurately. No explanation has yet been found for this discrepancy.
TABLE 2-6. Predicted and Measured Oxidation of Slow-Reacting Pharmaceuticals during Conventional Ozonation and Advanced Oxidation of Natural Watersa
Oxidation of Pharmaceuticals
WP water RS water LZ water LF water
Conv. Ozonation pred. meas. pred. meas. pred. meas. pred. meas.
Bezafibrate >99% nd >99% >99% >99% nd 97% 98%
Diazepam 23% 24% 29% nd 57% 65% 74% nd
Iopromide 6% 24% 14% 27% 31% 58% 46% 68%
Ibuprofen 31% 41% 37% 40% 56% 62% 69% 77%
AOP (O3/H2O2)
Ibuprofen 80% 84% 80% 78% 90% 90% nd nd
Bezafibrate 98% nd 92% nd 95% 97% nd nd
Hydroxyl Radical Scavenging Capacity
Total [s-1] 7.6×10⁴ 7.2×10⁴ 5.5×10⁴ 9.9×10⁴
DOC [s-1] (b) 2.0×10⁴ 3.2×10⁴ 3.0×10⁴ 9.2×10⁴
HCO3-/CO3
2- [s-1] (c) 5.6×10⁴ 4×10⁴ 2.5×10⁴ 0.7×10⁴
a Conditions: O3 dose = 2 mg L-1, contact time = 10 min, pH = 8, T = 10 °C; for AOP, H2O2 dose
= 0.7 mg L-1, for water quality parameters see Table 2-2 b Scavanging Capacity (DOC) = kOH(DOC) × [DOC] c Scavanging Capacity (HCO3
-/CO32-) = kOH(HCO3
-) × [HCO3-] + kOH(CO3
2-) × [CO32-]
For RS water, Figure 2-3 illustrates the oxidation of three pharmaceuticals
during ozonation (symbols: experimental data; lines: predictions). Bezafibrate,
which has an intermediate rate constant with O3, was oxidized within 5 minutes
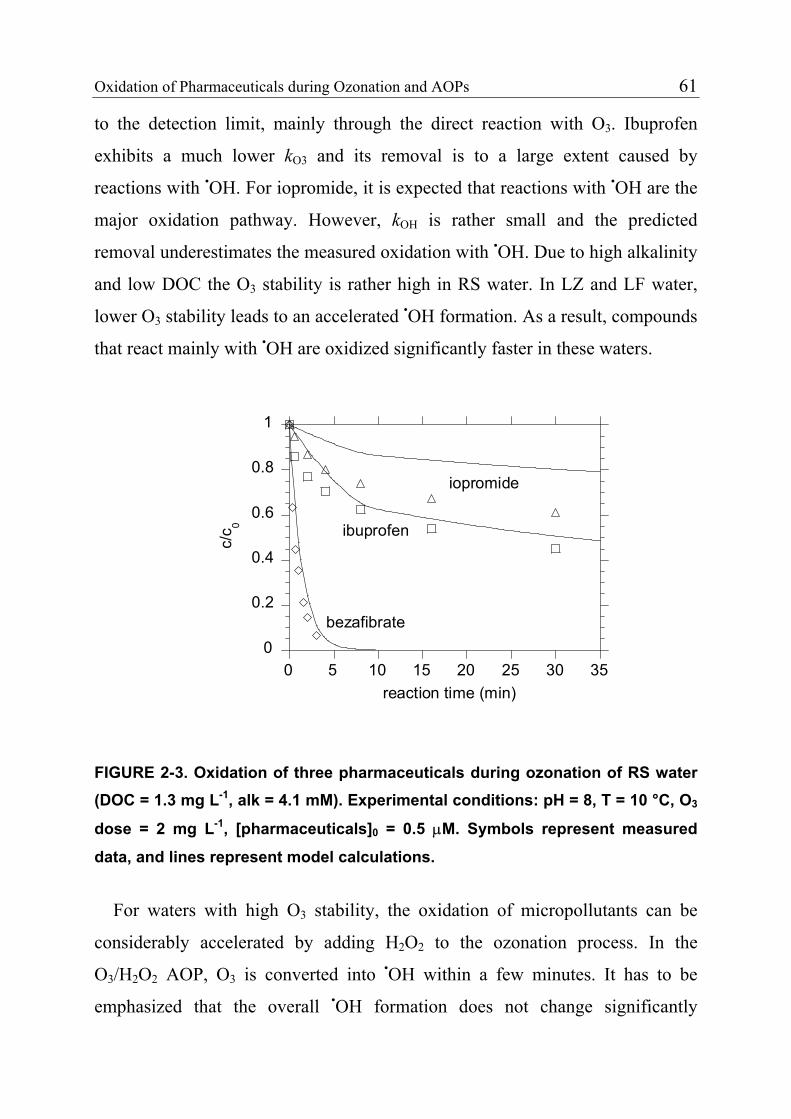
Oxidation of Pharmaceuticals during Ozonation and AOPs 61
to the detection limit, mainly through the direct reaction with O3. Ibuprofen
exhibits a much lower kO3 and its removal is to a large extent caused by
reactions with •OH. For iopromide, it is expected that reactions with •OH are the
major oxidation pathway. However, kOH is rather small and the predicted
removal underestimates the measured oxidation with •OH. Due to high alkalinity
and low DOC the O3 stability is rather high in RS water. In LZ and LF water,
lower O3 stability leads to an accelerated •OH formation. As a result, compounds
that react mainly with •OH are oxidized significantly faster in these waters.
0
0.2
0.4
0.6
0.8
1
0 5 10 15 20 25 30 35
c/c 0
reaction time (min)
iopromide
ibuprofen
bezafibrate
FIGURE 2-3. Oxidation of three pharmaceuticals during ozonation of RS water (DOC = 1.3 mg L-1, alk = 4.1 mM). Experimental conditions: pH = 8, T = 10 °C, O3
dose = 2 mg L-1, [pharmaceuticals]0 = 0.5 µM. Symbols represent measured
data, and lines represent model calculations.
For waters with high O3 stability, the oxidation of micropollutants can be
considerably accelerated by adding H2O2 to the ozonation process. In the
O3/H2O2 AOP, O3 is converted into •OH within a few minutes. It has to be
emphasized that the overall •OH formation does not change significantly
62 Chapter 2
compared to conventional ozonation in which the ozonation process is not
stopped before all O3 is consumed. Table 2-6 presents data for the predicted and
measured oxidation in the O3/H2O2 AOP. Oxidation of bezafibrate is slightly
lower in this AOP than during conventional ozonation (10 min contact time).
This is due to a reduced O3 exposure, which cannot be fully compensated by •OH reactions. However, the oxidation of ibuprofen could be considerably
increased. The efficiency of an AOP strongly depends on the •OH scavenging
capacity of the selected natural water. Therefore, the highest oxidation was
achieved in LZ water, which has the lowest scavenging capacity.
Transformation in WP water was similar to the one in RS water. This can be
explained by the comparable •OH scavenging capacity. In LF water, it would not
be possible to increase the oxidation efficiency of the ozonation process by
adding H2O2, because the O3 half-life is already quite short and the scavenging
capacity of the water rather high.
Figure 2-4 compares the ibuprofen oxidation in conventional ozonation and in
the O3/H2O2 AOP. The oxidation of ibuprofen could be increased from 40% to
over 80% for a hypothetical contact time of 10 min. These results can also be
applied to diazepam, which has a similar kOH and barely reacts with O3. Other
important micropollutants such as atrazine and MTBE showed a substantially
lower transformation in the O3/H2O2 AOP under similar conditions. In River
Seine water, atrazine oxidation was about 50% (11). MTBE oxidation in
different natural waters ranged from 30% to 50% (12).
For the investigation of oxidation products formed during the ozonation of
pharmaceuticals, it will be important to know the fraction of a pharmaceutical
compound reacting with O3 and •OH, respectively. Figure 2-5 shows which
fraction of the slow-reacting pharmaceuticals reacts with either of the two
oxidants as a function of the Rc-value (Rc= ([•OH]/[O3]), see eq 3). For LZ, RS
and WP water, conventional ozonation yielded Rc-values ranging from 10-10 to 5
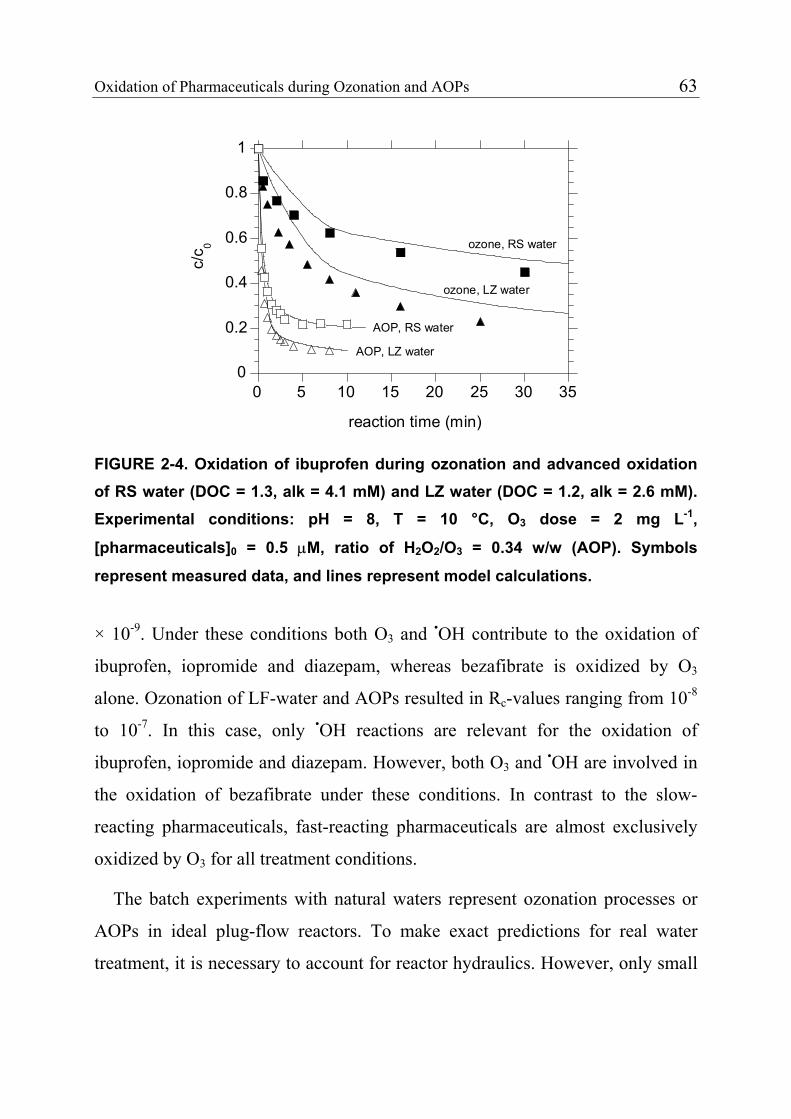
Oxidation of Pharmaceuticals during Ozonation and AOPs 63
× 10-9. Under these conditions both O3 and •OH contribute to the oxidation of
ibuprofen, iopromide and diazepam, whereas bezafibrate is oxidized by O3
alone. Ozonation of LF-water and AOPs resulted in Rc-values ranging from 10-8
to 10-7. In this case, only •OH reactions are relevant for the oxidation of
ibuprofen, iopromide and diazepam. However, both O3 and •OH are involved in
the oxidation of bezafibrate under these conditions. In contrast to the slow-
reacting pharmaceuticals, fast-reacting pharmaceuticals are almost exclusively
oxidized by O3 for all treatment conditions.
0
0.2
0.4
0.6
0.8
1
0 5 10 15 20 25 30 35
c/c 0
reaction time (min)
AOP, LZ water
AOP, RS water
ozone, LZ water
ozone, RS water
FIGURE 2-4. Oxidation of ibuprofen during ozonation and advanced oxidation of RS water (DOC = 1.3, alk = 4.1 mM) and LZ water (DOC = 1.2, alk = 2.6 mM). Experimental conditions: pH = 8, T = 10 °C, O3 dose = 2 mg L-1,
[pharmaceuticals]0 = 0.5 µM, ratio of H2O2/O3 = 0.34 w/w (AOP). Symbols
represent measured data, and lines represent model calculations.
The batch experiments with natural waters represent ozonation processes or
AOPs in ideal plug-flow reactors. To make exact predictions for real water
treatment, it is necessary to account for reactor hydraulics. However, only small
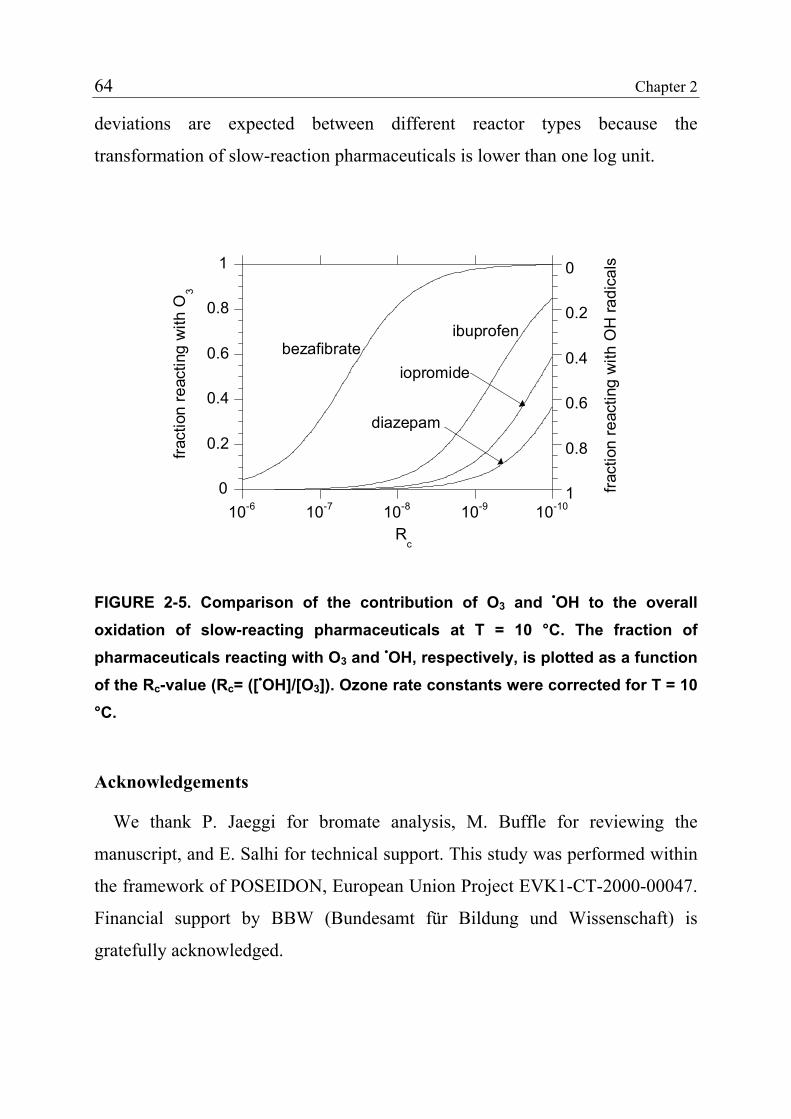
64 Chapter 2
deviations are expected between different reactor types because the
transformation of slow-reaction pharmaceuticals is lower than one log unit.
0
0.2
0.4
0.6
0.8
1
10-1010-910-810-710-6
0
0.2
0.4
0.6
0.8
1
fract
ion
reac
ting
with
O3
Rc
bezafibrateibuprofen
iopromide
diazepam
fract
ion
reac
ting
with
OH
radi
cals
FIGURE 2-5. Comparison of the contribution of O3 and •OH to the overall oxidation of slow-reacting pharmaceuticals at T = 10 °C. The fraction of pharmaceuticals reacting with O3 and •OH, respectively, is plotted as a function of the Rc-value (Rc= ([•OH]/[O3]). Ozone rate constants were corrected for T = 10 °C.
Acknowledgements
We thank P. Jaeggi for bromate analysis, M. Buffle for reviewing the
manuscript, and E. Salhi for technical support. This study was performed within
the framework of POSEIDON, European Union Project EVK1-CT-2000-00047.
Financial support by BBW (Bundesamt für Bildung und Wissenschaft) is
gratefully acknowledged.
Oxidation of Pharmaceuticals during Ozonation and AOPs 65
2.4 References
(1) Halling-Sørensen, B.; Nors Nielsen, S.; Lanzky, P. F.; Ingerslev, F.; Holten Lützhøft, H. C.; Jørgensen, S. E.: Occurrence, fate and effects of pharmaceutical substances in the environment - a review, Chemosphere 1998, 36, 357-393.
(2) Daughton, C. G.; Ternes, T. A.: Pharmaceuticals and personal care products in the environment: agents of subtle change, Environ. Health Perspect. 1999, 107, 907-938.
(3) Ternes, T. A.: Occurrence of drugs in German sewage treatment plants and rivers, Water Res. 1998, 32, 3245-3260.
(4) Kolpin, D. W.; Furlong, E. T.; Meyer, M. T.; Thurman, E. M.; Zaugg, S. D.; Barber, L. B.; Buxton, H. T.: Pharmaceuticals, hormones, and other organic wastewater contaminants in U.S. streams, 1999-2000: a national reconnaissance, Environ. Sci. Technol. 2002, 36, 1202-1211.
(5) Heberer, T.: Occurrence, fate, and removal of pharmaceutical residues in the aquatic environment: a review of recent research data, Toxicol. Lett. 2002, 131, 5-17.
(6) Heberer, T.; Stan, H.-J.: Vorkommen von polaren organischen Kontaminanten im Berliner Trinkwasser, Vom Wasser 1996, 86, 19-31.
(7) Ternes, T. A.: Pharmaceuticals and metabolites as contaminants of the aquatic environment, In Pharmaceuticals and personal care products in the environment: scientific regulatory issue, ACS-Symposium Series; Daughton, C. G., Jones-Lepp, T. L., Eds., 2001.
(8) Ternes, T. A.; Meisenheimer, M.; McDowell, D.; Sacher, F.; Brauch, H.-J.; Haist- Gulde, B.; Preuss, G.; Wilme, U.; Zulei-Seibert, N.: Removal of pharmaceuticals during drinking water treatment, Environ. Sci. Technol. 2002, 36, 3855-3863.
(9) Zwiener, C.; Frimmel, F. H.: Oxidative treatment of pharmaceuticals in water, Water Res. 2000, 34, 1881-1885.
(10) Elovitz, M. S.; Von Gunten, U.: Hydroxyl radical/ozone ratios during ozonation processes. I. The Rct Concept, Ozone Sci. Eng. 1999, 21, 239-260.
(11) Acero, J. L.; Stemmler, K.; Von Gunten, U.: Degradation kinetics of atrazine and its degradation products with ozone and OH radicals: A predictive tool for drinking water treatment, Environ. Sci. Technol. 2000, 34, 591-597.
(12) Acero, J. L.; Haderlein, S.; Schmidt, T. C.; Suter, M. J.-F.; Von Gunten, U.: MTBE oxidation by conventional ozonation and the combination ozone/hydrogen peroxide: efficiency of the processes and bromate formation, Environ. Sci. Technol. 2001, 35, 4252-4259.
(13) Bader, H.; Hoigné, J.: Determination of ozone in water by the Indigo method, Water Res. 1981, 15, 449-456.
66 Chapter 2
(14) Hoigné, J.; Bader, H.: Characterization of water quality criteria for ozonation processes. Part II: lifetime of added ozone, Ozone Sci. Eng. 1994, 16, 121-134.
(15) Hoigné, J.; Bader, H.: Rate constants of reactions of ozone with organic and inorganic compounds in water - I Non-dissociating organic compounds, Water Res. 1983, 17, 173-183.
(16) Hoigné, J.; Bader, H.: Rate constants of reactions of ozone with organic and inorganic compounds in water - II Dissociating organic compounds, Water Res. 1983, 17, 185- 194.
(17) Muñoz, F.; von Sonntag, C.: Determination of fast ozone reactions in aqueous solution by competition kinetics, J. Chem. Soc., Perkin Trans. 2 2000, 661-664.
(18) Hoigné, J.; Bader, H.: Rate constants of reactions of ozone with organic and inorganic compounds in water - III Inorganic compounds and radicals, Water Res. 1985, 19, 993-1004.
(19) Dowideit, P.; von Sonntag, C.: Reaction of ozone with ethene and its methyl- and chlorine-substituted derivatives in aqueous solution, Environ. Sci. Technol. 1998, 32, 1112-1119.
(20) Buxton, G. V.; Greenstock, C. L.; Helman, W. P.; Ross, W. P.: Critical review of rate constants for reactions of hydrated electrons, hydrogen atoms and hydroxyl radicals in aqueous solution, J. Phys. Chem. Ref. Data 1988, 17, 513-886.
(21) Wegelin, M.; Canonica, S.; Mechsner, K.; Fleischmann, T.; Pescaro, F.; Metzler, A.: Solar water disinfection: scope of the process and analysis of radiation experiments, J. SRT - Aqua 1994, 43, 154-169.
(22) Canonica, S.; Jans, U.; Stemmler, K.; Hoigné, J.: Transformation kinetics of phenols in water - photosensitization by dissolved natural organic material and aromatic ketones, Environ. Sci. Technol. 1995, 29, 1822-1831.
(23) von Sonntag, C.; Schuchmann, H.-P.: Peroxyl radicals in aqueous solutions, In Peroxyl radicals; Alfassi, Z. B., Ed.; John Wiley & Sons Ltd, 1997, 173-234.
(24) Salhi, E.; Von Gunten, U.: Simultaneous determination of bromide, bromate and nitrite in low µgl-1 levels by ion chromatography without sample pretreatment, Water Res. 1999, 33, 3239-3244.
(25) Hoigné, J.: Chemistry of aqueous ozone and transformation of pollutants by ozonation and advanced oxidation processes., In The handbook of environmental chemistry Vol. 5 Part. C Quality and treatment of drinking water II; Hubrec, J., Ed.; Springer: Berlin, 1998.
(26) von Gunten, U.: Ozonation of drinking water: Part I. Oxidation kinetics and product formation, Water Res. 2002, 37, 1443-1467.
(27) Yamamoto, Y.; Niki, E.; Shiokawa, H.; Kamiya, Y.: Ozonation of organic compounds. 2. Ozonation of phenol in water, J. Org. Chem. 1979, 44, 2137-2142.
Oxidation of Pharmaceuticals during Ozonation and AOPs 67
(28) Bailey, P. S. Ozonation in organic chemistry. Vol 1. Olefinic Compounds; Academic Press: New York, 1978.
(29) Mark, G.; Hildenbrand, K.; von Sonntag, C., in preparation.
(30) Muñoz, F.; von Sonntag, C.: The reactions of ozone with tertiary amines including the complexing agents nitrilotriacetic acid (NTA) and ethylenediaminetetraacetic acid (EDTA) in aqueous solution, J. Chem. Soc., Perkin Trans. 2 2000, 2029-2033.
(31) Sisson, M. E.; Rieder, M. J.; Bird, I. A.; Almaw, W. Y.: Suppression of pokeweed mitogen-driven human IgM and IgG responses by the hydroxylamine of sulfamethoxazole, Int. J. Immunopharmac. 1997, 19, 299-304.

3
Oxidation of Pharmaceuticals during Water Treatment with Chlorine Dioxide
Huber, M. M.; Korhonen S.; Ternes, T. A.; von Gunten, U. Water Res.
2004, submitted.
70 Chapter 3
Abstract
The potential of chlorine dioxide (ClO2) for the oxidation of pharmaceuticals
during water treatment was assessed by determining second-order rate constants
for the reaction with selected environmentally relevant pharmaceuticals. Out of
9 pharmaceuticals only the 4 following compounds showed an appreciable
reactivity with ClO2 (in brackets apparent second-order rate constants at pH 7
and T = 20 °C): the sulfonamide antibiotic sulfamethoxazole (6700 ± 700 M-1
s-1), the macrolide antibiotic roxithromycin (220 ± 40 M-1 s-1), the estrogen 17α-
ethinylestradiol (~2 × 10⁵ M-1 s-1), and the antiphlogistic diclofenac (10500 ±
1000 M-1 s-1). Experiments performed using natural water showed that further
sulfonamides and macrolides, the natural hormones estrone and 17β-estradiol as
well as 3 pyrazole derivatives (phenazone, propylphenazone, and
dimethylaminophenazone) also react fast with ClO2. However, a significant
share of the studied compounds was ClO2 refractive. Experiments with lake
water and groundwater that were partly performed at microgram/L to
nanogram/L levels proved that the rate constants determined in pure water could
be applied to predict oxidation of pharmaceuticals in natural waters. Compared
to ozone, ClO2 reacted more slowly and with fewer compounds. However, it
reacted faster with the investigated compounds than chlorine. Overall, the results
indicate that ClO2 will only be effective to oxidize certain compound classes like
the investigated classes of sulfonamide and macrolide antibiotics and estrogens.
Oxidation of Pharmaceuticals during Treatment with Chlorine Dioxide 71
3.1 Introduction
3.1.1 Pharmaceuticals in the Environment
The widespread occurrence of a large number of pharmaceuticals in the
aquatic environment (1,2) may threaten the purity of drinking water. Because
surface water is the most affected, pharmaceuticals may first pose a problem to
water utilities that use surface water as a water resource for drinking water
production. However, studies on different treatment processes including
ozonation (3,4), activated carbon (4,5), and nanofiltration / reverse osmosis
membranes (5) have lately demonstrated that these processes can efficiently
remove a relatively large number of pharmaceuticals. In Europe, typical
treatment trains for surface water include at least one of the above mentioned
processes. Therefore, these findings suggest that at least in Europe only few
pharmaceuticals will be present in treated surface water. The relatively few
cases, where pharmaceuticals were detected in finished water up to now, provide
further support for this conclusion (4,6-8). However, pharmaceuticals were not
only detected in surface waters, but also in groundwaters (9-11). Sources for
groundwater contamination can be land application of sludge or manure
contaminated with human or veterinary pharmaceuticals, river bank filtration of
contaminated surface water into groundwater, and artificial groundwater
recharge with contaminated water (12). Groundwater does usually not require
multiple treatment steps, because of its good chemical and biological quality.
Often, it is only subjected to a disinfection step (e.g., treatment with chlorine,
UV, or chlorine dioxide) or is not treated at all. Consequently, there is a risk that
pharmaceuticals could be present in drinking water derived from groundwater.
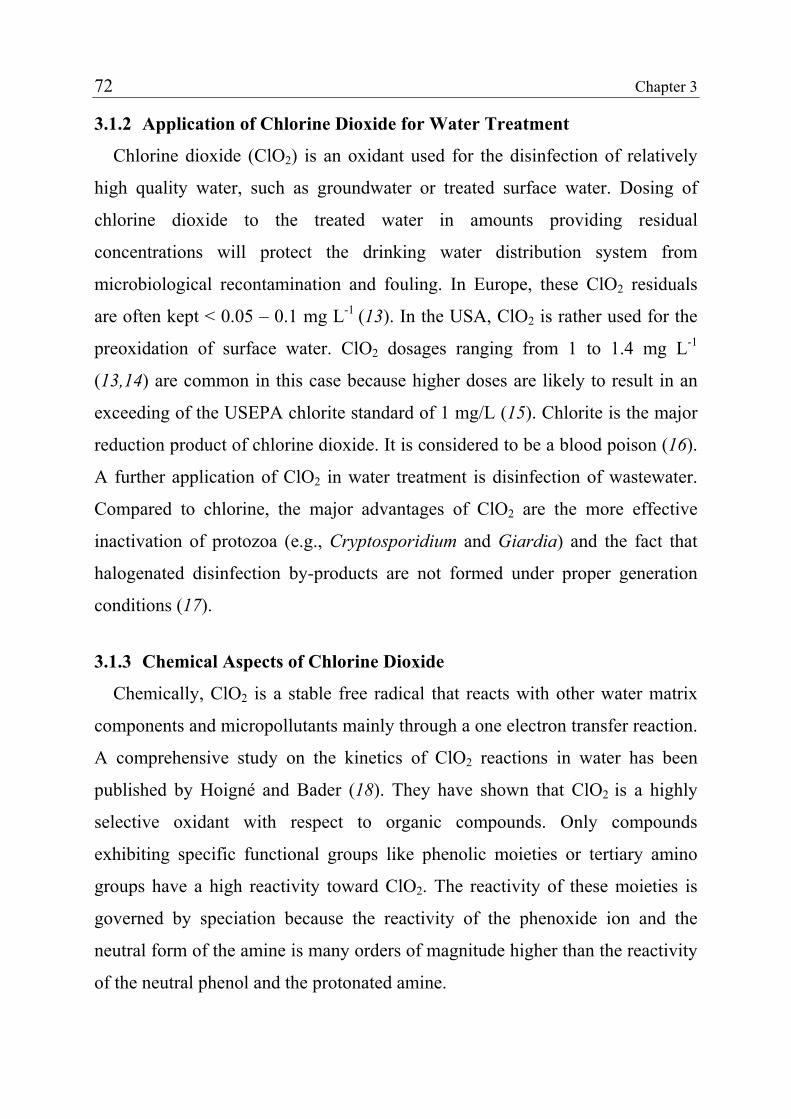
72 Chapter 3
3.1.2 Application of Chlorine Dioxide for Water Treatment
Chlorine dioxide (ClO2) is an oxidant used for the disinfection of relatively
high quality water, such as groundwater or treated surface water. Dosing of
chlorine dioxide to the treated water in amounts providing residual
concentrations will protect the drinking water distribution system from
microbiological recontamination and fouling. In Europe, these ClO2 residuals
are often kept < 0.05 – 0.1 mg L-1 (13). In the USA, ClO2 is rather used for the
preoxidation of surface water. ClO2 dosages ranging from 1 to 1.4 mg L-1
(13,14) are common in this case because higher doses are likely to result in an
exceeding of the USEPA chlorite standard of 1 mg/L (15). Chlorite is the major
reduction product of chlorine dioxide. It is considered to be a blood poison (16).
A further application of ClO2 in water treatment is disinfection of wastewater.
Compared to chlorine, the major advantages of ClO2 are the more effective
inactivation of protozoa (e.g., Cryptosporidium and Giardia) and the fact that
halogenated disinfection by-products are not formed under proper generation
conditions (17).
3.1.3 Chemical Aspects of Chlorine Dioxide
Chemically, ClO2 is a stable free radical that reacts with other water matrix
components and micropollutants mainly through a one electron transfer reaction.
A comprehensive study on the kinetics of ClO2 reactions in water has been
published by Hoigné and Bader (18). They have shown that ClO2 is a highly
selective oxidant with respect to organic compounds. Only compounds
exhibiting specific functional groups like phenolic moieties or tertiary amino
groups have a high reactivity toward ClO2. The reactivity of these moieties is
governed by speciation because the reactivity of the phenoxide ion and the
neutral form of the amine is many orders of magnitude higher than the reactivity
of the neutral phenol and the protonated amine.
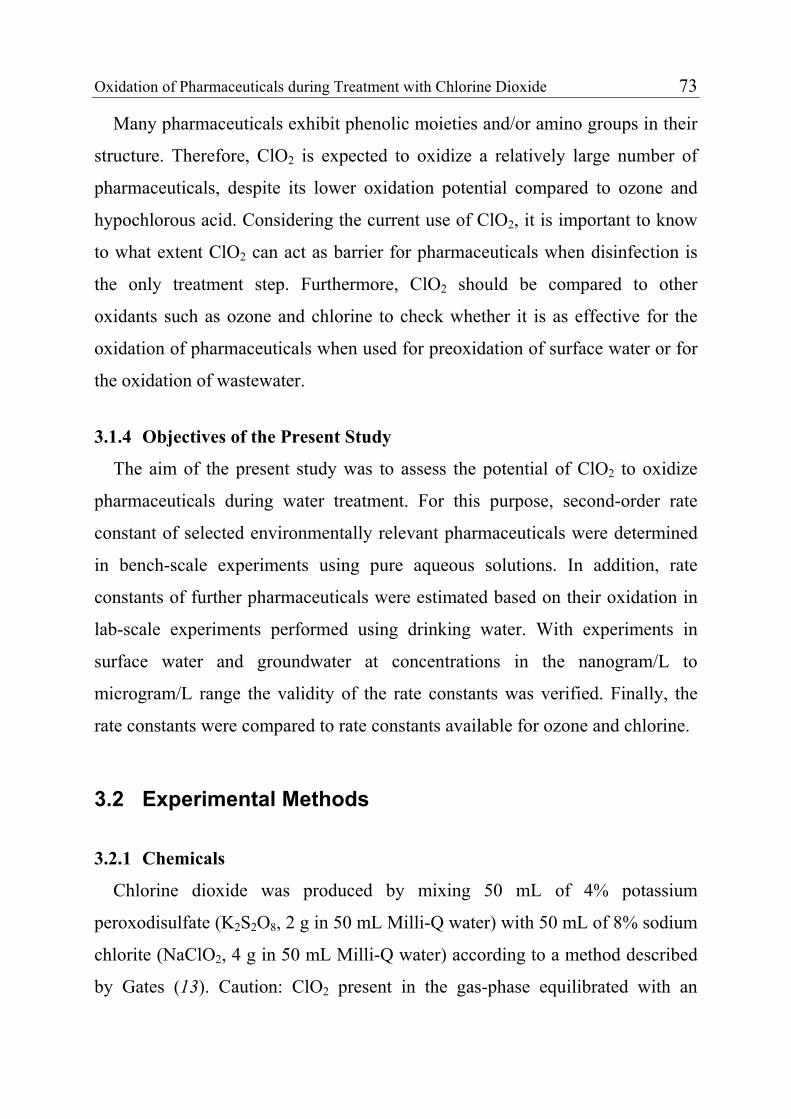
Oxidation of Pharmaceuticals during Treatment with Chlorine Dioxide 73
Many pharmaceuticals exhibit phenolic moieties and/or amino groups in their
structure. Therefore, ClO2 is expected to oxidize a relatively large number of
pharmaceuticals, despite its lower oxidation potential compared to ozone and
hypochlorous acid. Considering the current use of ClO2, it is important to know
to what extent ClO2 can act as barrier for pharmaceuticals when disinfection is
the only treatment step. Furthermore, ClO2 should be compared to other
oxidants such as ozone and chlorine to check whether it is as effective for the
oxidation of pharmaceuticals when used for preoxidation of surface water or for
the oxidation of wastewater.
3.1.4 Objectives of the Present Study
The aim of the present study was to assess the potential of ClO2 to oxidize
pharmaceuticals during water treatment. For this purpose, second-order rate
constant of selected environmentally relevant pharmaceuticals were determined
in bench-scale experiments using pure aqueous solutions. In addition, rate
constants of further pharmaceuticals were estimated based on their oxidation in
lab-scale experiments performed using drinking water. With experiments in
surface water and groundwater at concentrations in the nanogram/L to
microgram/L range the validity of the rate constants was verified. Finally, the
rate constants were compared to rate constants available for ozone and chlorine.
3.2 Experimental Methods
3.2.1 Chemicals
Chlorine dioxide was produced by mixing 50 mL of 4% potassium
peroxodisulfate (K2S2O8, 2 g in 50 mL Milli-Q water) with 50 mL of 8% sodium
chlorite (NaClO2, 4 g in 50 mL Milli-Q water) according to a method described
by Gates (13). Caution: ClO2 present in the gas-phase equilibrated with an
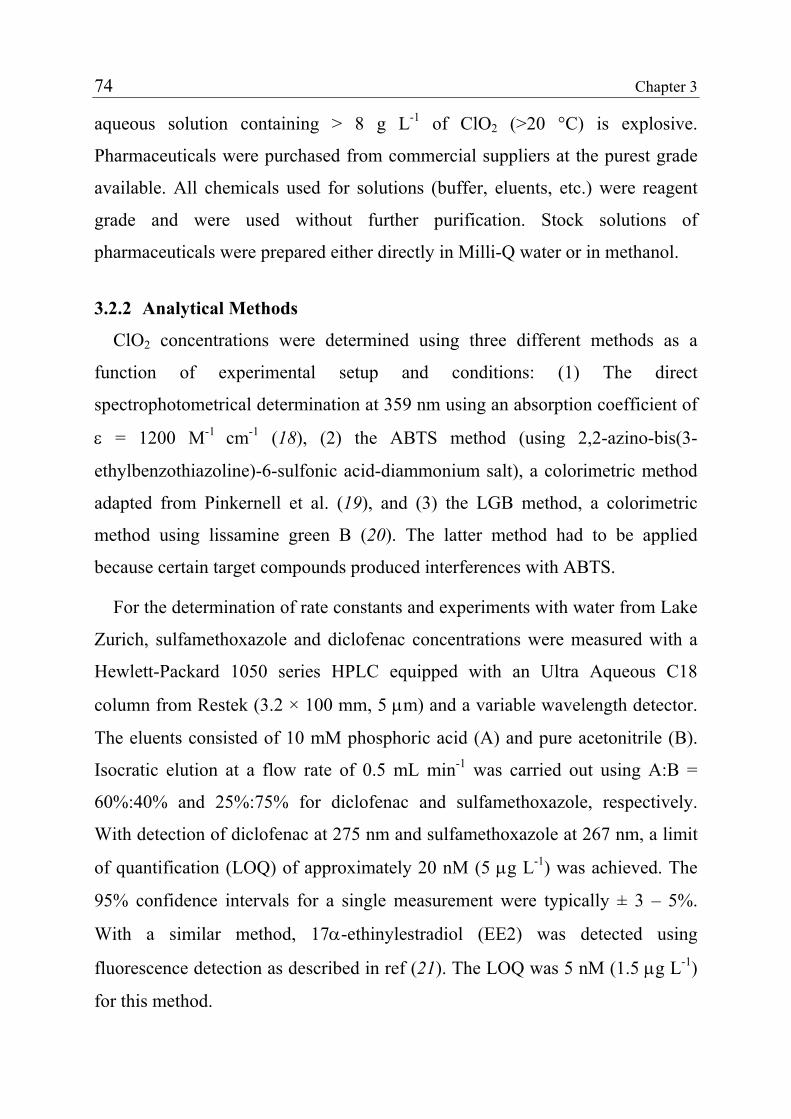
74 Chapter 3
aqueous solution containing > 8 g L-1 of ClO2 (>20 °C) is explosive.
Pharmaceuticals were purchased from commercial suppliers at the purest grade
available. All chemicals used for solutions (buffer, eluents, etc.) were reagent
grade and were used without further purification. Stock solutions of
pharmaceuticals were prepared either directly in Milli-Q water or in methanol.
3.2.2 Analytical Methods
ClO2 concentrations were determined using three different methods as a
function of experimental setup and conditions: (1) The direct
spectrophotometrical determination at 359 nm using an absorption coefficient of
ε = 1200 M-1 cm-1 (18), (2) the ABTS method (using 2,2-azino-bis(3-
ethylbenzothiazoline)-6-sulfonic acid-diammonium salt), a colorimetric method
adapted from Pinkernell et al. (19), and (3) the LGB method, a colorimetric
method using lissamine green B (20). The latter method had to be applied
because certain target compounds produced interferences with ABTS.
For the determination of rate constants and experiments with water from Lake
Zurich, sulfamethoxazole and diclofenac concentrations were measured with a
Hewlett-Packard 1050 series HPLC equipped with an Ultra Aqueous C18
column from Restek (3.2 × 100 mm, 5 µm) and a variable wavelength detector.
The eluents consisted of 10 mM phosphoric acid (A) and pure acetonitrile (B).
Isocratic elution at a flow rate of 0.5 mL min-1 was carried out using A:B =
60%:40% and 25%:75% for diclofenac and sulfamethoxazole, respectively.
With detection of diclofenac at 275 nm and sulfamethoxazole at 267 nm, a limit
of quantification (LOQ) of approximately 20 nM (5 µg L-1) was achieved. The
95% confidence intervals for a single measurement were typically ± 3 – 5%.
With a similar method, 17α-ethinylestradiol (EE2) was detected using
fluorescence detection as described in ref (21). The LOQ was 5 nM (1.5 µg L-1)
for this method.
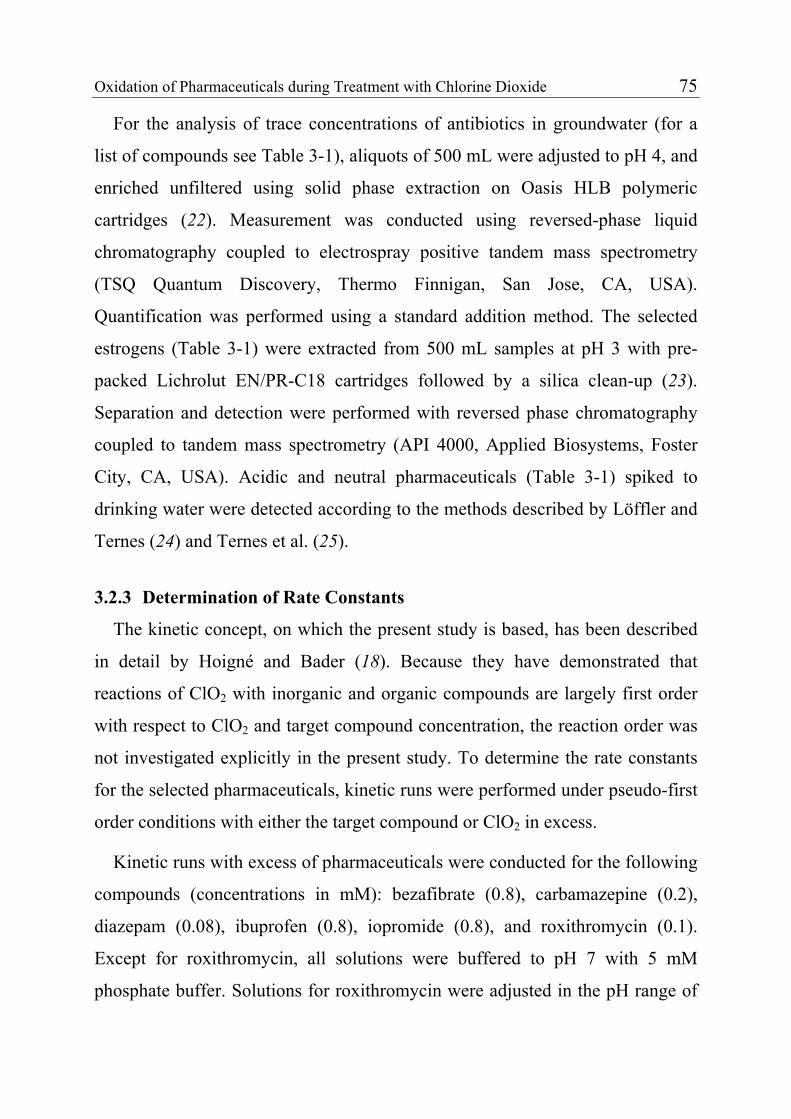
Oxidation of Pharmaceuticals during Treatment with Chlorine Dioxide 75
For the analysis of trace concentrations of antibiotics in groundwater (for a
list of compounds see Table 3-1), aliquots of 500 mL were adjusted to pH 4, and
enriched unfiltered using solid phase extraction on Oasis HLB polymeric
cartridges (22). Measurement was conducted using reversed-phase liquid
chromatography coupled to electrospray positive tandem mass spectrometry
(TSQ Quantum Discovery, Thermo Finnigan, San Jose, CA, USA).
Quantification was performed using a standard addition method. The selected
estrogens (Table 3-1) were extracted from 500 mL samples at pH 3 with pre-
packed Lichrolut EN/PR-C18 cartridges followed by a silica clean-up (23).
Separation and detection were performed with reversed phase chromatography
coupled to tandem mass spectrometry (API 4000, Applied Biosystems, Foster
City, CA, USA). Acidic and neutral pharmaceuticals (Table 3-1) spiked to
drinking water were detected according to the methods described by Löffler and
Ternes (24) and Ternes et al. (25).
3.2.3 Determination of Rate Constants
The kinetic concept, on which the present study is based, has been described
in detail by Hoigné and Bader (18). Because they have demonstrated that
reactions of ClO2 with inorganic and organic compounds are largely first order
with respect to ClO2 and target compound concentration, the reaction order was
not investigated explicitly in the present study. To determine the rate constants
for the selected pharmaceuticals, kinetic runs were performed under pseudo-first
order conditions with either the target compound or ClO2 in excess.
Kinetic runs with excess of pharmaceuticals were conducted for the following
compounds (concentrations in mM): bezafibrate (0.8), carbamazepine (0.2),
diazepam (0.08), ibuprofen (0.8), iopromide (0.8), and roxithromycin (0.1).
Except for roxithromycin, all solutions were buffered to pH 7 with 5 mM
phosphate buffer. Solutions for roxithromycin were adjusted in the pH range of
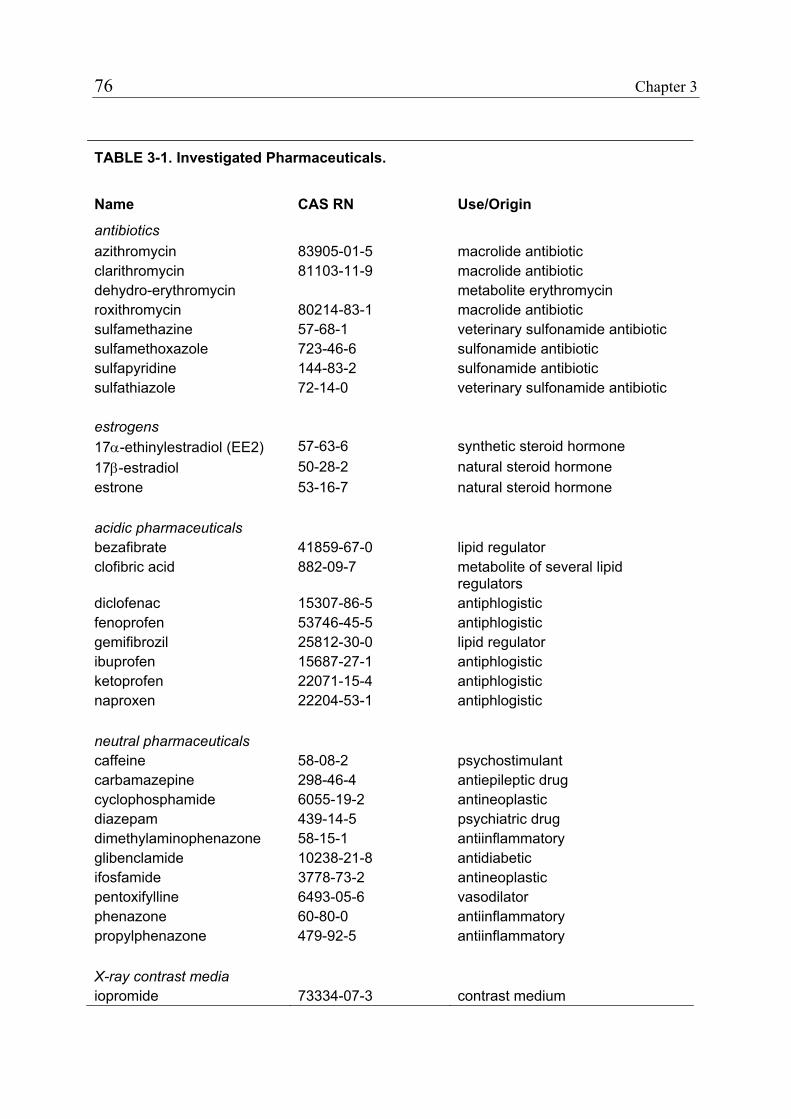
76 Chapter 3
TABLE 3-1. Investigated Pharmaceuticals.
Name CAS RN Use/Origin
antibiotics azithromycin 83905-01-5 macrolide antibiotic clarithromycin 81103-11-9 macrolide antibiotic dehydro-erythromycin metabolite erythromycin roxithromycin 80214-83-1 macrolide antibiotic sulfamethazine 57-68-1 veterinary sulfonamide antibiotic sulfamethoxazole 723-46-6 sulfonamide antibiotic sulfapyridine 144-83-2 sulfonamide antibiotic sulfathiazole 72-14-0 veterinary sulfonamide antibiotic estrogens
17α-ethinylestradiol (EE2) 57-63-6 synthetic steroid hormone 17β-estradiol 50-28-2 natural steroid hormone estrone 53-16-7 natural steroid hormone acidic pharmaceuticals
bezafibrate 41859-67-0 lipid regulator clofibric acid 882-09-7 metabolite of several lipid
regulators diclofenac 15307-86-5 antiphlogistic fenoprofen 53746-45-5 antiphlogistic gemifibrozil 25812-30-0 lipid regulator ibuprofen 15687-27-1 antiphlogistic ketoprofen 22071-15-4 antiphlogistic naproxen 22204-53-1 antiphlogistic neutral pharmaceuticals
caffeine 58-08-2 psychostimulant carbamazepine 298-46-4 antiepileptic drug cyclophosphamide 6055-19-2 antineoplastic diazepam 439-14-5 psychiatric drug dimethylaminophenazone 58-15-1 antiinflammatory glibenclamide 10238-21-8 antidiabetic ifosfamide 3778-73-2 antineoplastic pentoxifylline 6493-05-6 vasodilator phenazone 60-80-0 antiinflammatory propylphenazone 479-92-5 antiinflammatory X-ray contrast media
iopromide 73334-07-3 contrast medium
Oxidation of Pharmaceuticals during Treatment with Chlorine Dioxide 77
6.2 to 7.1 to investigate the pH dependency of its reactivity. The kinetic runs
were started by the addition of ClO2 doses (8 to 80 µM) that were at least 10
times lower than the target compound concentrations. The experiments were
performed in spectrophotometric cells of 35-mL volume with Suprasil quartz
window and 10-cm optical path length. The cell was mounted in a temperature-
stabilized metal block (20 °C) inside the spectrophotometer (Kontron
Instruments, Uvikon 940). ClO2 decrease was monitored directly in the
spectrophotometer. All runs were conducted in triplicates. For slow-reacting or
nonreactive compounds, the decay was monitored during 1 hour. For
roxithromycin, half-lives of ClO2 ranged only from 20 s to 2 min under the
investigated conditions. Consequently, monitoring time did not exceed 4 min.
Rate constants for diclofenac, sulfamethoxazole, and EE2 were determined by
monitoring their decrease in the presence of an at least 10 fold excess of ClO2.
Initial concentrations for diclofenac, sulfamethoxazole, and EE2 were 0.2, 0.15,
and 0.1 µM, respectively. Duplicate experiments were performed at pH 5, 6, 7,
8, 9, and 10 for diclofenac and sulfamethoxazole. Due to its increased reactivity
at higher pH, the 6 experiments performed with EE2 were conducted in
duplicate between pH 4 and 6. As a reaction vessel, 500-mL amber glass bottles
with a dispenser system mounted onto the screwtop were used. Kinetic runs
were started by the addition of the target compound. After 10 seconds, the first
sample (5 mL) was withdrawn with the dispenser system. Subsequently, 5
further samples were withdrawn in suitable time intervals ranging from 10 s to 2
min depending on the apparent oxidation rate of the target compounds.
Simultaneously, 2 to 5 samples were collected for ClO2 analysis. For target
compound analysis, ClO2 residuals were immediately quenched by mixing the
sample with 0.1 mL sodium thiosulfate (25 mM, for diclofenac and
sulfamethoxazole) or ascorbic acid (25 mM, for EE2). Pseudo first-order rate
constant were obtained by plotting the natural logarithm of the target compound
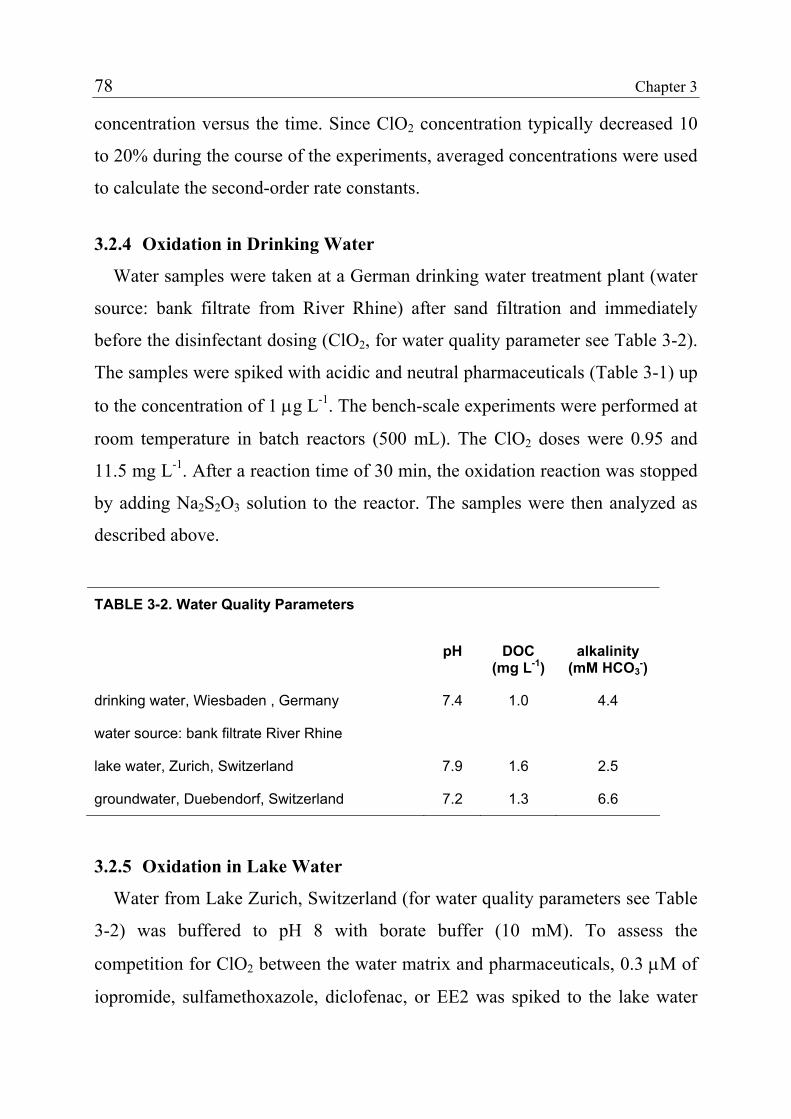
78 Chapter 3
concentration versus the time. Since ClO2 concentration typically decreased 10
to 20% during the course of the experiments, averaged concentrations were used
to calculate the second-order rate constants.
3.2.4 Oxidation in Drinking Water
Water samples were taken at a German drinking water treatment plant (water
source: bank filtrate from River Rhine) after sand filtration and immediately
before the disinfectant dosing (ClO2, for water quality parameter see Table 3-2).
The samples were spiked with acidic and neutral pharmaceuticals (Table 3-1) up
to the concentration of 1 µg L-1. The bench-scale experiments were performed at
room temperature in batch reactors (500 mL). The ClO2 doses were 0.95 and
11.5 mg L-1. After a reaction time of 30 min, the oxidation reaction was stopped
by adding Na2S2O3 solution to the reactor. The samples were then analyzed as
described above.
TABLE 3-2. Water Quality Parameters
pH DOC (mg L-1)
alkalinity (mM HCO3
-)
drinking water, Wiesbaden , Germany
water source: bank filtrate River Rhine
7.4 1.0 4.4
lake water, Zurich, Switzerland 7.9 1.6 2.5
groundwater, Duebendorf, Switzerland 7.2 1.3 6.6
3.2.5 Oxidation in Lake Water
Water from Lake Zurich, Switzerland (for water quality parameters see Table
3-2) was buffered to pH 8 with borate buffer (10 mM). To assess the
competition for ClO2 between the water matrix and pharmaceuticals, 0.3 µM of
iopromide, sulfamethoxazole, diclofenac, or EE2 was spiked to the lake water
Oxidation of Pharmaceuticals during Treatment with Chlorine Dioxide 79
that was subsequently treated with ClO2 doses of 0.1, 0.2 0.5, and 1 mg L-1.
After 10 minutes, the reaction was quenched with sodium thiosulfate (for
sulfamethoxazole and diclofenac) or ascorbic acid (for iopromide and EE2).
Experiments were performed in duplicate and for every experiment only one
compound was spiked to the Lake Zurich water. Sample analysis was carried out
within a few hours using the HPLC methods described above.
Experiments investigating the oxidation kinetics of sulfamethoxazole and
diclofenac in lake water were conducted under the same conditions except that
these experiments were only carried out for one ClO2 dose of 0.5 mg L-1. As a
reaction vessel, 500-mL amber glass bottles with a dispenser system mounted
onto the screwtop were used. Kinetic runs were started by the addition of ClO2.
After 10, 20, 30, 50, and 70 s, samples (5 mL) were withdrawn with the
dispenser system and immediately mixed with the sodium thiosulfate.
Simultaneously, ClO2 concentrations were measured with the LGB method.
3.2.6 Oxidation in Groundwater
In the first series of experiments, groundwater from Duebendorf, Switzerland
(for water quality parameters see Table 3-2) was spiked with 1 µg L-1 of
sulfapyridine, sulfathiazole, sulfamethazine, and sulfamethoxazole and 100 ng
L-1 of azithromycin, clarithromycin, dehydro-erythromycin, and roxithromycin.
Aliquots of 4 L of the spiked water were distributed into 3 amber bottles. A
ClO2 dose of 0.1 mg L-1 was added to each bottle. From each bottle, a few
samples were taken to follow the ClO2 concentration with the ABTS method.
The reaction was then stopped by the addition of sodium thiosulfate after 5 min
for the first bottle, after 30 min for the second bottle, and after 180 min for the
third bottle. In the second series of experiments, the same groundwater was
spiked with 1 µg L-1 of the estrogens EE2, 17β-estradiol, and estrone. The
estrogens were treated with ClO2 doses identical to those in the first series and
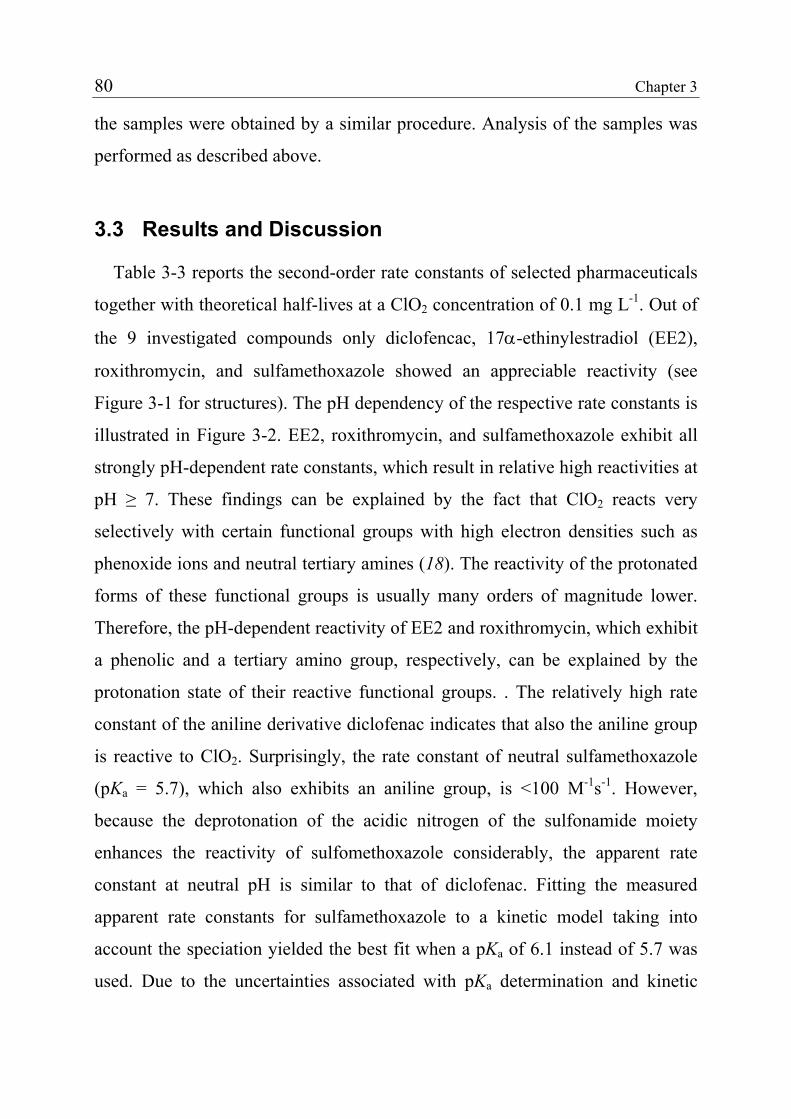
80 Chapter 3
the samples were obtained by a similar procedure. Analysis of the samples was
performed as described above.
3.3 Results and Discussion
Table 3-3 reports the second-order rate constants of selected pharmaceuticals
together with theoretical half-lives at a ClO2 concentration of 0.1 mg L-1. Out of
the 9 investigated compounds only diclofencac, 17α-ethinylestradiol (EE2),
roxithromycin, and sulfamethoxazole showed an appreciable reactivity (see
Figure 3-1 for structures). The pH dependency of the respective rate constants is
illustrated in Figure 3-2. EE2, roxithromycin, and sulfamethoxazole exhibit all
strongly pH-dependent rate constants, which result in relative high reactivities at
pH ≥ 7. These findings can be explained by the fact that ClO2 reacts very
selectively with certain functional groups with high electron densities such as
phenoxide ions and neutral tertiary amines (18). The reactivity of the protonated
forms of these functional groups is usually many orders of magnitude lower.
Therefore, the pH-dependent reactivity of EE2 and roxithromycin, which exhibit
a phenolic and a tertiary amino group, respectively, can be explained by the
protonation state of their reactive functional groups. . The relatively high rate
constant of the aniline derivative diclofenac indicates that also the aniline group
is reactive to ClO2. Surprisingly, the rate constant of neutral sulfamethoxazole
(pKa = 5.7), which also exhibits an aniline group, is <100 M-1s-1. However,
because the deprotonation of the acidic nitrogen of the sulfonamide moiety
enhances the reactivity of sulfomethoxazole considerably, the apparent rate
constant at neutral pH is similar to that of diclofenac. Fitting the measured
apparent rate constants for sulfamethoxazole to a kinetic model taking into
account the speciation yielded the best fit when a pKa of 6.1 instead of 5.7 was
used. Due to the uncertainties associated with pKa determination and kinetic
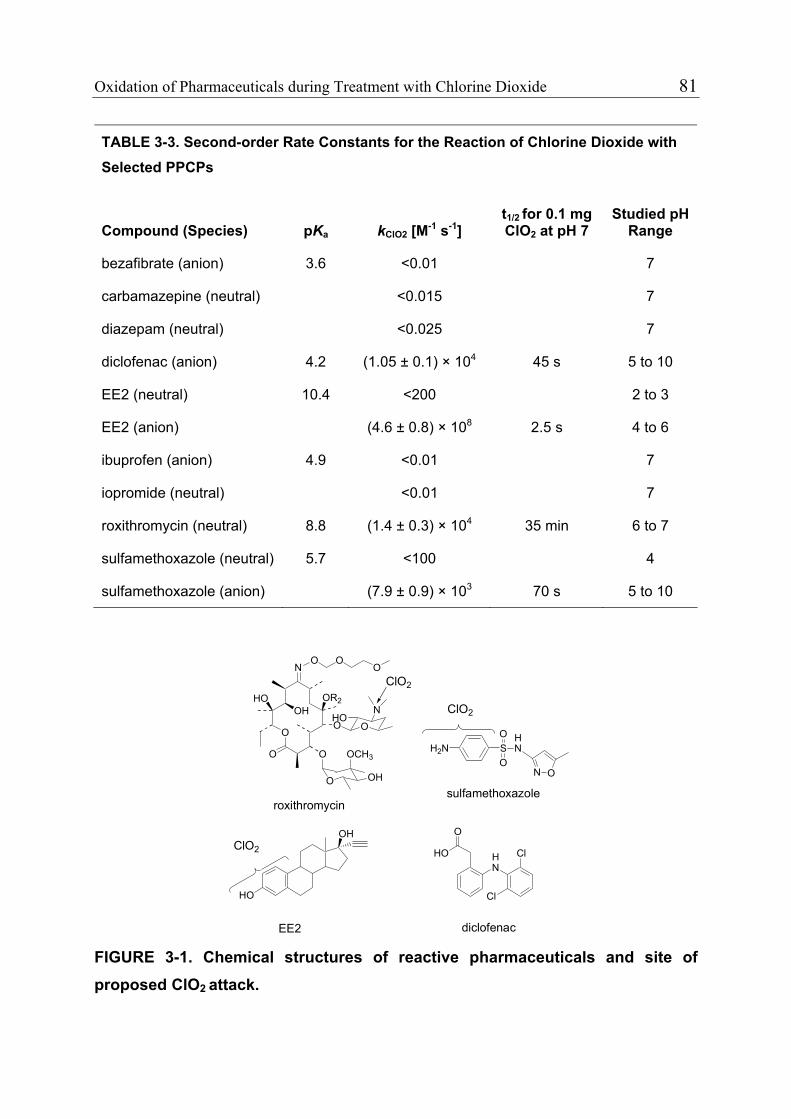
Oxidation of Pharmaceuticals during Treatment with Chlorine Dioxide 81
TABLE 3-3. Second-order Rate Constants for the Reaction of Chlorine Dioxide with Selected PPCPs
Compound (Species) pKa kClO2 [M-1 s-1] t1/2 for 0.1 mg ClO2 at pH 7
Studied pH Range
bezafibrate (anion) 3.6 <0.01 7
carbamazepine (neutral) <0.015 7
diazepam (neutral) <0.025 7
diclofenac (anion) 4.2 (1.05 ± 0.1) × 104 45 s 5 to 10
EE2 (neutral) 10.4 <200 2 to 3
EE2 (anion) (4.6 ± 0.8) × 108 2.5 s 4 to 6
ibuprofen (anion) 4.9 <0.01 7
iopromide (neutral) <0.01 7
roxithromycin (neutral) 8.8 (1.4 ± 0.3) × 104 35 min 6 to 7
sulfamethoxazole (neutral) 5.7 <100 4
sulfamethoxazole (anion) (7.9 ± 0.9) × 103 70 s 5 to 10
N
OHO
OH
HO
O OO
O
N
OH
O
O
OR2
O
O
OCH3
ClO2
ClO2
O
OH2N
HN
N O
S
HN
Cl
Cl
O
HO
OH
HO
ClO2
roxithromycin
EE2
sulfamethoxazole
diclofenac
FIGURE 3-1. Chemical structures of reactive pharmaceuticals and site of proposed ClO2 attack.
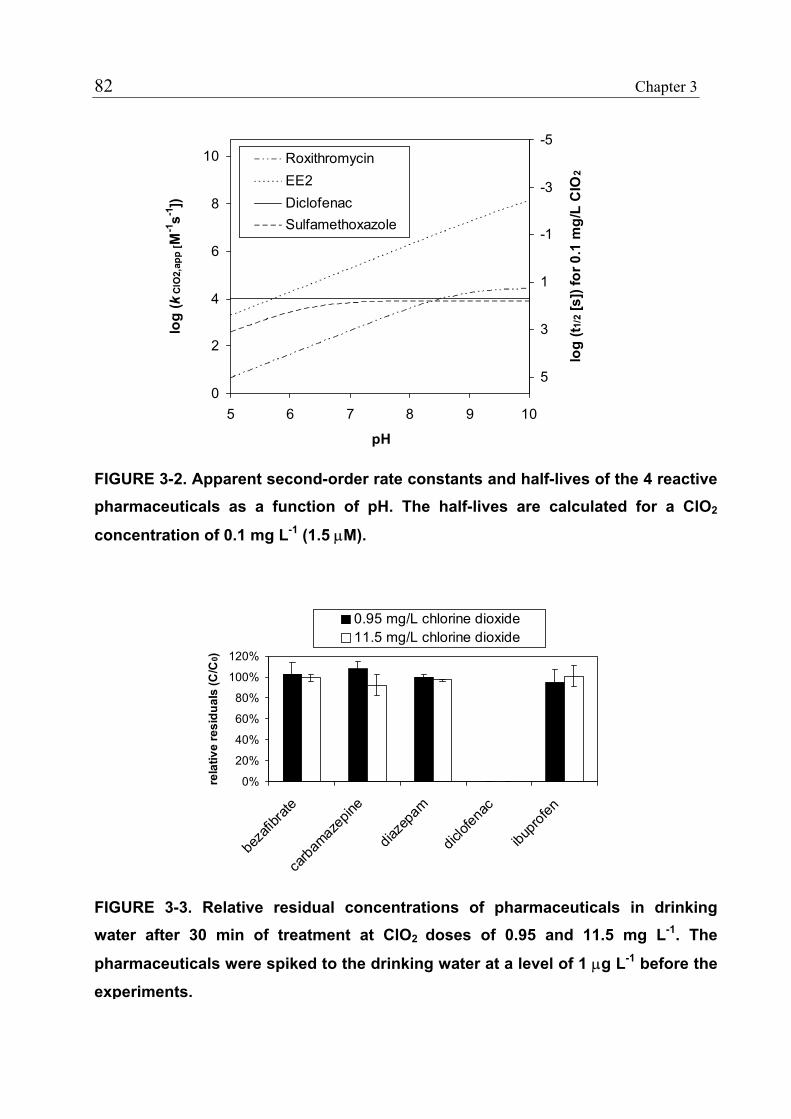
82 Chapter 3
0
2
4
6
8
10
5 6 7 8 9 10
pH
log
(kC
lO2,
app
[M-1
s-1])
-5
-3
-1
1
3
5
log
(t 1/2
[s])
for 0
.1 m
g/L
ClO
2
RoxithromycinEE2DiclofenacSulfamethoxazole
FIGURE 3-2. Apparent second-order rate constants and half-lives of the 4 reactive pharmaceuticals as a function of pH. The half-lives are calculated for a ClO2
concentration of 0.1 mg L-1 (1.5 µM).
0%
20%
40%
60%
80%
100%
120%
beza
fibrat
e
carba
mazep
ine
diaze
pam
diclof
enac
ibupro
fen
rela
tive
resi
dual
s (C
/C0)
0.95 mg/L chlorine dioxide11.5 mg/L chlorine dioxide
FIGURE 3-3. Relative residual concentrations of pharmaceuticals in drinking water after 30 min of treatment at ClO2 doses of 0.95 and 11.5 mg L-1. The
pharmaceuticals were spiked to the drinking water at a level of 1 µg L-1 before the
experiments.
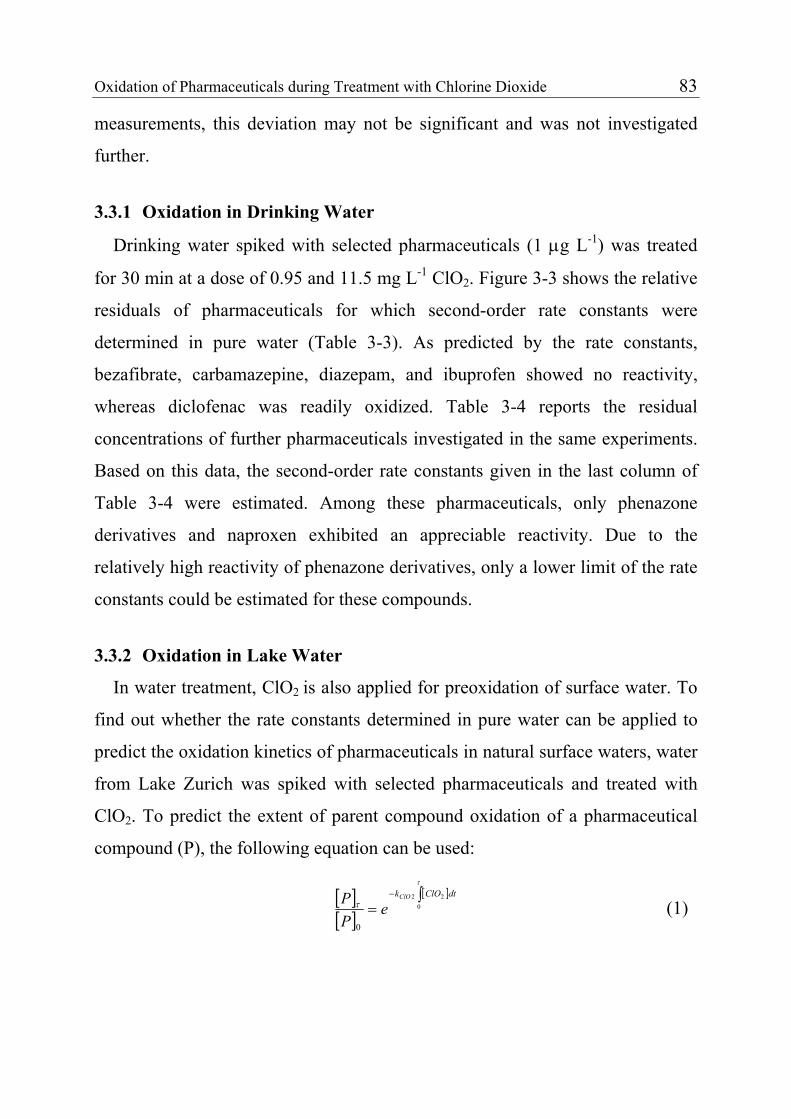
Oxidation of Pharmaceuticals during Treatment with Chlorine Dioxide 83
measurements, this deviation may not be significant and was not investigated
further.
3.3.1 Oxidation in Drinking Water
Drinking water spiked with selected pharmaceuticals (1 µg L-1) was treated
for 30 min at a dose of 0.95 and 11.5 mg L-1 ClO2. Figure 3-3 shows the relative
residuals of pharmaceuticals for which second-order rate constants were
determined in pure water (Table 3-3). As predicted by the rate constants,
bezafibrate, carbamazepine, diazepam, and ibuprofen showed no reactivity,
whereas diclofenac was readily oxidized. Table 3-4 reports the residual
concentrations of further pharmaceuticals investigated in the same experiments.
Based on this data, the second-order rate constants given in the last column of
Table 3-4 were estimated. Among these pharmaceuticals, only phenazone
derivatives and naproxen exhibited an appreciable reactivity. Due to the
relatively high reactivity of phenazone derivatives, only a lower limit of the rate
constants could be estimated for these compounds.
3.3.2 Oxidation in Lake Water
In water treatment, ClO2 is also applied for preoxidation of surface water. To
find out whether the rate constants determined in pure water can be applied to
predict the oxidation kinetics of pharmaceuticals in natural surface waters, water
from Lake Zurich was spiked with selected pharmaceuticals and treated with
ClO2. To predict the extent of parent compound oxidation of a pharmaceutical
compound (P), the following equation can be used:
[ ][ ]
[ ]∫=
−τ
τ 022
0
dtClOkClO
ePP (1)
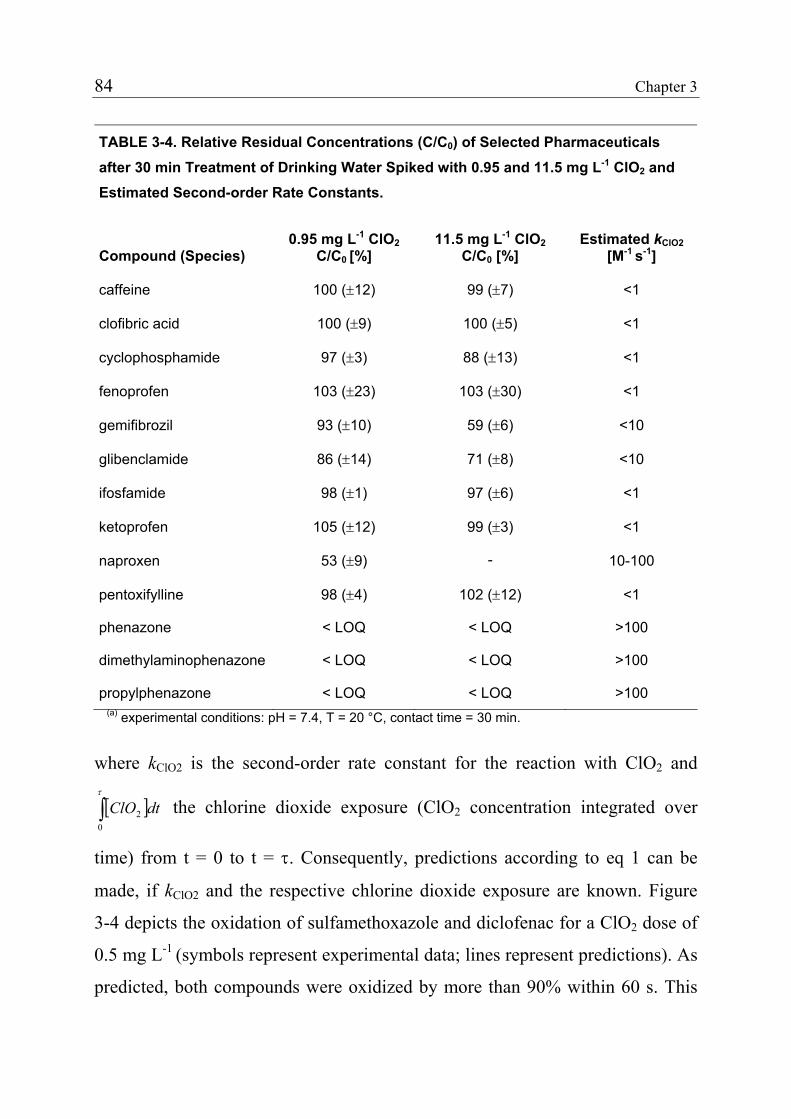
84 Chapter 3
where kClO2 is the second-order rate constant for the reaction with ClO2 and
the chlorine dioxide exposure (ClO[ ]∫τ
02 dtClO 2 concentration integrated over
time) from t = 0 to t = τ. Consequently, predictions according to eq 1 can be
made, if kClO2 and the respective chlorine dioxide exposure are known. Figure
3-4 depicts the oxidation of sulfamethoxazole and diclofenac for a ClO2 dose of
0.5 mg L-1 (symbols represent experimental data; lines represent predictions). As
predicted, both compounds were oxidized by more than 90% within 60 s. This
TABLE 3-4. Relative Residual Concentrations (C/C0) of Selected Pharmaceuticals after 30 min Treatment of Drinking Water Spiked with 0.95 and 11.5 mg L-1 ClO2 and Estimated Second-order Rate Constants.
Compound (Species) 0.95 mg L-1 ClO2
C/C0 [%] 11.5 mg L-1 ClO2
C/C0 [%] Estimated kClO2
[M-1 s-1]
caffeine 100 (±12) 99 (±7) <1
clofibric acid 100 (±9) 100 (±5) <1
cyclophosphamide 97 (±3) 88 (±13) <1
fenoprofen 103 (±23) 103 (±30) <1
gemifibrozil 93 (±10) 59 (±6) <10
glibenclamide 86 (±14) 71 (±8) <10
ifosfamide 98 (±1) 97 (±6) <1
ketoprofen 105 (±12) 99 (±3) <1
naproxen 53 (±9) - 10-100
pentoxifylline 98 (±4) 102 (±12) <1
phenazone < LOQ < LOQ >100
dimethylaminophenazone < LOQ < LOQ >100
propylphenazone < LOQ < LOQ >100 (a) experimental conditions: pH = 7.4, T = 20 °C, contact time = 30 min.
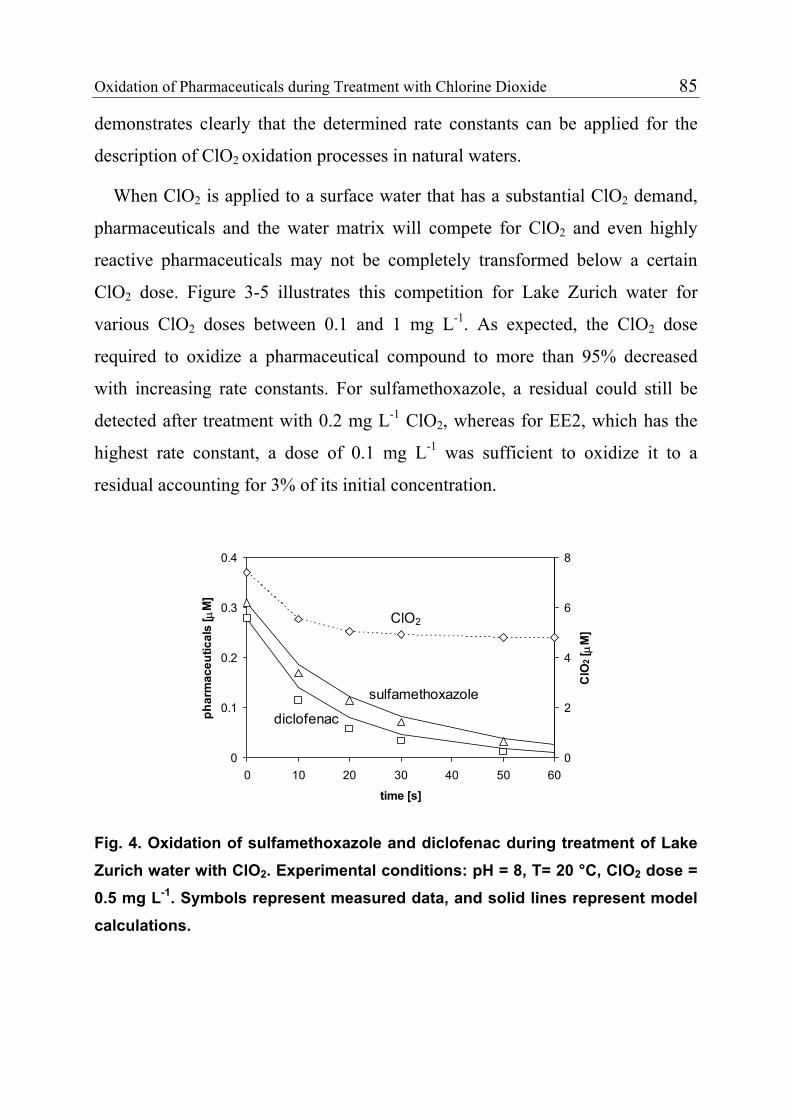
Oxidation of Pharmaceuticals during Treatment with Chlorine Dioxide 85
demonstrates clearly that the determined rate constants can be applied for the
description of ClO2 oxidation processes in natural waters.
When ClO2 is applied to a surface water that has a substantial ClO2 demand,
pharmaceuticals and the water matrix will compete for ClO2 and even highly
reactive pharmaceuticals may not be completely transformed below a certain
ClO2 dose. Figure 3-5 illustrates this competition for Lake Zurich water for
various ClO2 doses between 0.1 and 1 mg L-1. As expected, the ClO2 dose
required to oxidize a pharmaceutical compound to more than 95% decreased
with increasing rate constants. For sulfamethoxazole, a residual could still be
detected after treatment with 0.2 mg L-1 ClO2, whereas for EE2, which has the
highest rate constant, a dose of 0.1 mg L-1 was sufficient to oxidize it to a
residual accounting for 3% of its initial concentration.
0
0.1
0.2
0.3
0.4
0 10 20 30 40 50 60
time [s]
phar
mac
eutic
als
[ µM
]
0
2
4
6
8
ClO
2 [µ
M]
ClO2
sulfamethoxazole
diclofenac
Fig. 4. Oxidation of sulfamethoxazole and diclofenac during treatment of Lake Zurich water with ClO2. Experimental conditions: pH = 8, T= 20 °C, ClO2 dose = 0.5 mg L-1. Symbols represent measured data, and solid lines represent model calculations.
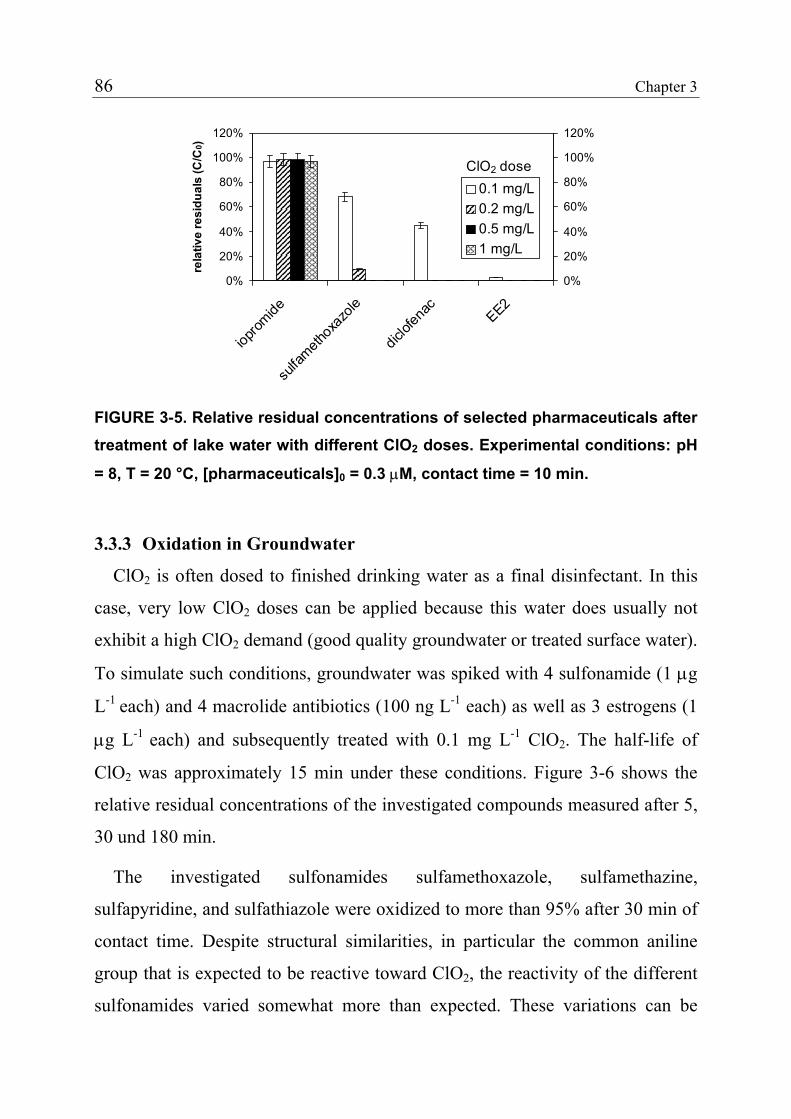
86 Chapter 3
0%
20%
40%
60%
80%
100%
120%
ioprom
ide
sulfa
methox
azole
diclof
enac EE2
rela
tive
resi
dual
s (C
/C0)
0%
20%
40%
60%
80%
100%
120%
0.1 mg/L0.2 mg/L0.5 mg/L1 mg/L
ClO2 dose
FIGURE 3-5. Relative residual concentrations of selected pharmaceuticals after treatment of lake water with different ClO2 doses. Experimental conditions: pH
= 8, T = 20 °C, [pharmaceuticals]0 = 0.3 µM, contact time = 10 min.
3.3.3 Oxidation in Groundwater
ClO2 is often dosed to finished drinking water as a final disinfectant. In this
case, very low ClO2 doses can be applied because this water does usually not
exhibit a high ClO2 demand (good quality groundwater or treated surface water).
To simulate such conditions, groundwater was spiked with 4 sulfonamide (1 µg
L-1 each) and 4 macrolide antibiotics (100 ng L-1 each) as well as 3 estrogens (1
µg L-1 each) and subsequently treated with 0.1 mg L-1 ClO2. The half-life of
ClO2 was approximately 15 min under these conditions. Figure 3-6 shows the
relative residual concentrations of the investigated compounds measured after 5,
30 und 180 min.
The investigated sulfonamides sulfamethoxazole, sulfamethazine,
sulfapyridine, and sulfathiazole were oxidized to more than 95% after 30 min of
contact time. Despite structural similarities, in particular the common aniline
group that is expected to be reactive toward ClO2, the reactivity of the different
sulfonamides varied somewhat more than expected. These variations can be
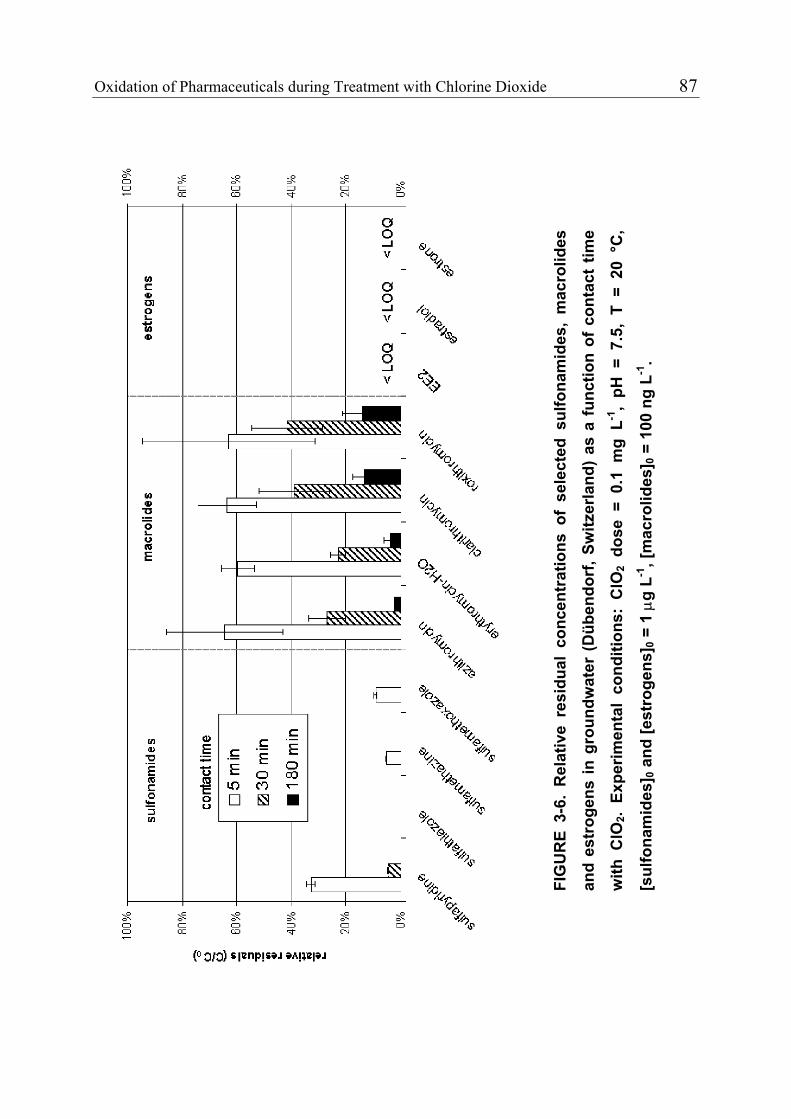
Oxidation of Pharmaceuticals during Treatment with Chlorine Dioxide 87
FIG
UR
E 3-
6. R
elat
ive
resi
dual
con
cent
ratio
ns o
f se
lect
ed s
ulfo
nam
ides
, m
acro
lides
and
estr
ogen
s in
gro
undw
ater
(D
üben
dorf
, Sw
itzer
land
) as
a f
unct
ion
of c
onta
ct t
ime
with
ClO
2. Ex
perim
enta
l co
nditi
ons:
ClO
2 do
se =
0.1
mg
L-1,
pH =
7.5
, T
= 20
°C
,
[sul
fona
mid
es] 0
and
[est
roge
ns] 0
= 1
µg
L-1, [
mac
rolid
es] 0
= 1
00 n
g L-1
.
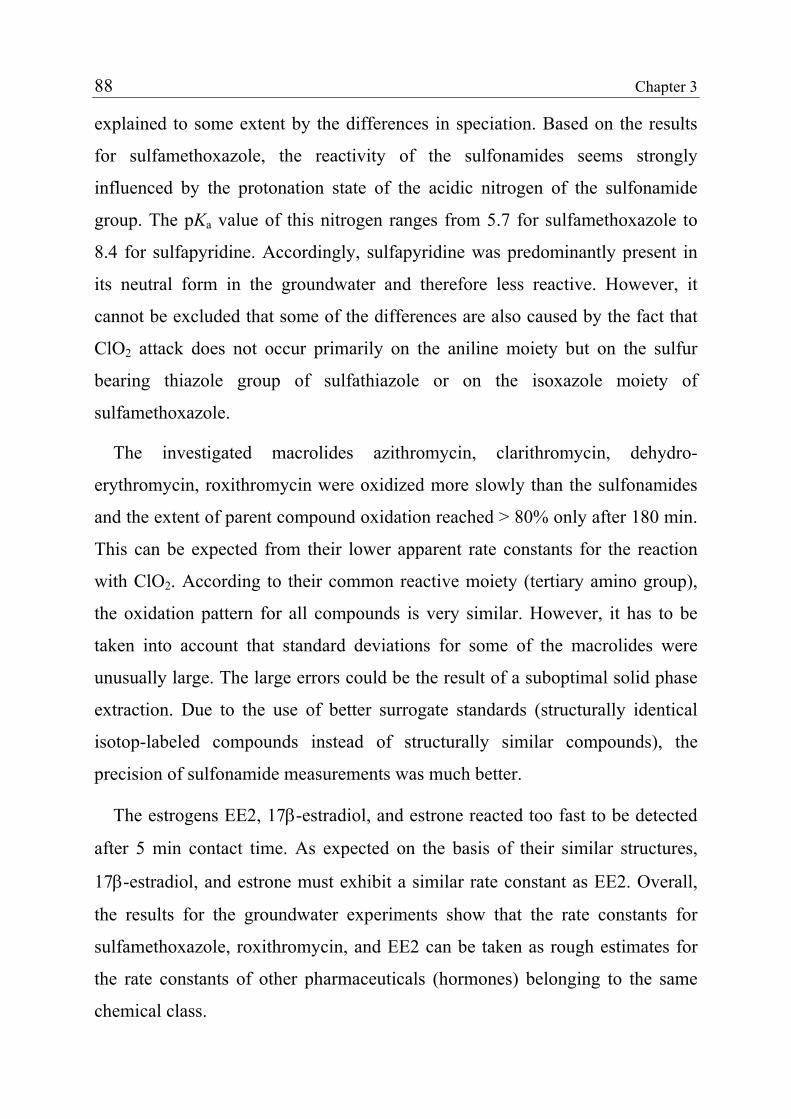
88 Chapter 3
explained to some extent by the differences in speciation. Based on the results
for sulfamethoxazole, the reactivity of the sulfonamides seems strongly
influenced by the protonation state of the acidic nitrogen of the sulfonamide
group. The pKa value of this nitrogen ranges from 5.7 for sulfamethoxazole to
8.4 for sulfapyridine. Accordingly, sulfapyridine was predominantly present in
its neutral form in the groundwater and therefore less reactive. However, it
cannot be excluded that some of the differences are also caused by the fact that
ClO2 attack does not occur primarily on the aniline moiety but on the sulfur
bearing thiazole group of sulfathiazole or on the isoxazole moiety of
sulfamethoxazole.
The investigated macrolides azithromycin, clarithromycin, dehydro-
erythromycin, roxithromycin were oxidized more slowly than the sulfonamides
and the extent of parent compound oxidation reached > 80% only after 180 min.
This can be expected from their lower apparent rate constants for the reaction
with ClO2. According to their common reactive moiety (tertiary amino group),
the oxidation pattern for all compounds is very similar. However, it has to be
taken into account that standard deviations for some of the macrolides were
unusually large. The large errors could be the result of a suboptimal solid phase
extraction. Due to the use of better surrogate standards (structurally identical
isotop-labeled compounds instead of structurally similar compounds), the
precision of sulfonamide measurements was much better.
The estrogens EE2, 17β-estradiol, and estrone reacted too fast to be detected
after 5 min contact time. As expected on the basis of their similar structures,
17β-estradiol, and estrone must exhibit a similar rate constant as EE2. Overall,
the results for the groundwater experiments show that the rate constants for
sulfamethoxazole, roxithromycin, and EE2 can be taken as rough estimates for
the rate constants of other pharmaceuticals (hormones) belonging to the same
chemical class.
Oxidation of Pharmaceuticals during Treatment with Chlorine Dioxide 89
In Figure 3-7, the relative residuals predicted on the basis of the ClO2
exposure (eq 1) and the measured residuals of roxithromycin and
sulfamethoxazole are plotted as a function of time. To give an estimate for the
uncertainty associated with the used model, the minimal and maximal residuals,
predicted on the basis of minimal and maximal values for the rate constant of
roxithromycin and the chlorine dioxide concentrations, are also indicated
(dashed lines). Unfortunately, the measurements for roxithromycin were not
very precise. Nevertheless, it can be concluded that predictions and measured
data agreed reasonably well for both compounds. This demonstrated that the rate
constants determined in pure water at high concentrations of target compounds
can be applied to natural waters containing realistic concentrations of
pharmaceuticals.
0%
20%
40%
60%
80%
100%
0 30 60 90 120 150 180time [min]
rela
tive
resi
dual
s (C
/C0)
0%
20%
40%
60%
80%
100%
roxithromycin
sulfamethoxazole
FIGURE 3-7. Relative residual concentrations of roxithromycin for treatment of groundwater with a 0.1 mg L-1 ClO2 dose. Experimental conditions: pH = 7.5, T =
20 °C, [roxithromycin]0 = 100 ng L-1 (0.3 µM), [sulfamethoxazole]0 = 1 µg L-1 (0.3
µM). Symbols represent measured data, solid lines represent model
calculations, and dashed lines indicate the estimated uncertainty of the model calculations.
90 Chapter 3
3.3.4 Oxidation Products
Oxidative treatment should not only lead to the disappearance of parent
compounds, but also destroy pharmacological or biological effects of
pharmaceuticals. Because full mineralization is generally not achievable with
oxidant doses commonly used in water treatment, oxidative treatment can only
deactivate pharmaceuticals by selectively oxidizing functional groups that are
crucial for their effects. To date, little is known about the oxidation products
resulting from the reaction of ClO2 with pharmaceuticals. However, the work of
Rosenblatt et al. (26) provides strong evidence that for tertiary amines ClO2
attack leads to the cleavage of one of the N-C bonds. In the case of the
macrolide antibiotics, this reaction will result in the loss of a methyl group or the
loss of the whole amino group. Li et al. (27) have shown that the antibiotic
activity of demethylated roxithromycin is much lower than that of the parent
compound.
For ozone, it could be shown that most probably small modifications of the
phenolic moiety of EE2 (caused by substoichiometric ozone doses) already
resulted in a significant decrease of its estrogenicity (21). It is expected that
oxidation of EE2 by ClO2 yields similar quinone type products as the initial
oxidation by ozone (28). Therefore, treatment with ClO2 could decrease the
estrogenic activity of EE2, even though the phenolic moiety will probably not be
cleaved to the same extent as under typical treatment conditions for ozonation.
On the basis of these considerations, it can be assumed that treatment with ClO2
does not only result in the disappearance of macrolides and estrogens, but also
potentially reduces their pharmacological effects.
3.3.5 Comparison of Chlorine Dioxide with Ozone and Chlorine
It is of great interest to compare the rate constants determined for ClO2 with
rate constants for other oxidants such as chlorine and ozone used in water
Oxidation of Pharmaceuticals during Treatment with Chlorine Dioxide 91
treatment. Recent publications on ozonation (3) and chlorination (29,30) of
pharmaceuticals as well as some experiments with chlorine performed within the
framework of this study provided a set of rate constants which can be compared
to that of chlorine dioxide. In Figure 3-8, the rate constants of these compounds
are presented as apparent rate constant at pH 7. Furthermore, theoretical half-
lives are given for an oxidant concentration of 1 mg L-1. Reactions with ozone
are clearly fastest and result in the shortest half-lives. Additionally, ozone reacts
with the largest number of compounds. The apparent rate constants for the
reaction with ClO2 are roughly 2 orders of magnitude lower than ozone rate
constants, but higher (to varying extents) than chlorine rate constants. However,
the latter observation can not be generalized, because functional groups like
aliphatic primary and secondary amines are known to react significantly faster
with chlorine than chlorine dioxide (18,31,32). For the limited number of
pharmaceuticals presented here, it was shown that ClO2 and chlorine react with
the same compounds. Both oxidants react first of all with electron rich
functional groups like amines and phenols. Ozone reacts with the same
functional groups, however additionally with C=C double bonds and activated
benzene rings. With respect to ozone, it has also to be taken into account that
hydroxyl radicals, which are formed due to ozone decay, can lead to a
substantial oxidation of ozone refractive pharmaceuticals (3).
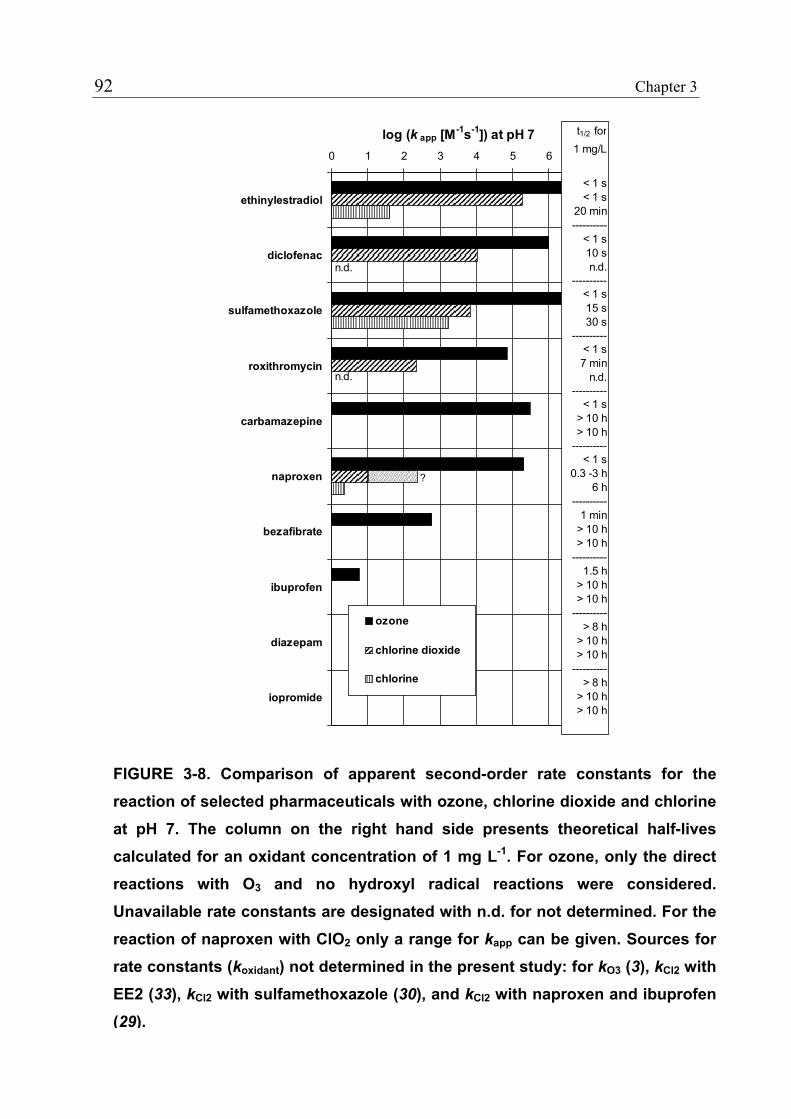
92 Chapter 3
0 1 2 3 4 5 6 7
ethinylestradiol
diclofenac
sulfamethoxazole
roxithromycin
carbamazepine
naproxen
bezafibrate
ibuprofen
diazepam
iopromide
log (k app [M-1s-1]) at pH 7
ozone
chlorine dioxide
chlorine
t1/2 for1 mg/L
< 1 s< 1 s
20 min ----------
< 1 s10 sn.d.
----------< 1 s15 s30 s
----------< 1 s7 min
n.d.----------
< 1 s> 10 h> 10 h
----------< 1 s
0.3 -3 h 6 h
----------1 min
> 10 h> 10 h
---------- 1.5 h
> 10 h> 10 h
----------> 8 h
> 10 h> 10 h
----------> 8 h
> 10 h> 10 h
n.d.
n.d.
?
FIGURE 3-8. Comparison of apparent second-order rate constants for the reaction of selected pharmaceuticals with ozone, chlorine dioxide and chlorine at pH 7. The column on the right hand side presents theoretical half-lives calculated for an oxidant concentration of 1 mg L-1. For ozone, only the direct reactions with O3 and no hydroxyl radical reactions were considered. Unavailable rate constants are designated with n.d. for not determined. For the reaction of naproxen with ClO2 only a range for kapp can be given. Sources for rate constants (koxidant) not determined in the present study: for kO3 (3), kCl2 with EE2 (33), kCl2 with sulfamethoxazole (30), and kCl2 with naproxen and ibuprofen (29).
Oxidation of Pharmaceuticals during Treatment with Chlorine Dioxide 93
3.4 Conclusions
Macrolide and sulfonamide antibiotics as well as estrogens and phenazones
are readily oxidized by ClO2. However, many of the investigated compounds did
not react at an appreciable rate with ClO2. Therefore, it can be concluded that
ClO2 applied in water treatment does only partly act as barrier for
pharmaceuticals, even though it is relatively effective in oxidizing antibiotics
and estrogens, two compound classes that merit special concern due to their high
biological activity. Ozone, which exhibits higher rate constants and reacts with a
larger number of pharmaceuticals, seems to be considerably more efficient for
pharmaceutical control than ClO2. However, ClO2 appears slightly more
powerful for the oxidation of pharmaceuticals than chlorine. For a more
comprehensive comparison of these oxidants, additional knowledge about the
formation of oxidation product and their pharmacological or biological effects
would be necessary.
Acknowledgment
We thank Anke Göbel, Nadine Herrmann and Matthias Bonerz for their
assistance with respect to sample analysis. We also thank Peter Hahl from
ESWE Waterwork Schierstein, for providing water samples. This study was
performed within the framework of POSEIDON, European Union project
EVK1-CT-2000-00047. Financial support by BBW (Bundesamt für Bildung und
Wissenschaft) is gratefully acknowledged.
94 Chapter 3
3.5 References
(1) Ternes, T. A.: Occurrence of drugs in German sewage treatment plants and rivers, Water Res. 1998, 32, 3245-3260.
(2) Kolpin, D. W.; Furlong, E. T.; Meyer, M. T.; Thurman, E. M.; Zaugg, S. D.; Barber, L. B.; Buxton, H. T.: Pharmaceuticals, hormones, and other organic wastewater contaminants in U.S. streams, 1999-2000: a national reconnaissance, Environ. Sci. Technol. 2002, 36, 1202-1211.
(3) Huber, M. M.; Canonica, S.; Park, G.-Y.; von Gunten, U.: Oxidation of pharmaceuticals during ozonation and advanced oxidation processes, Environ. Sci. Technol. 2003, 37, 1016-1024.
(4) Ternes, T. A.; Meisenheimer, M.; McDowell, D.; Sacher, F.; Brauch, H.-J.; Haist- Gulde, B.; Preuss, G.; Wilme, U.; Zullei-Seibert, N.: Removal of pharmaceuticals during drinking water treatment, Environ. Sci. Technol. 2002, 36, 3855-3863.
(5) Anonymous Poseidon Report, www.eu-poseidon.com, 2004.
(6) Reddersen, K.; Heberer, T.; Dünnbier, U.: Identification and significance of phenazone drugs and their metabolites in ground- and drinking water, Chemosphere 2002, 49.
(7) Stackelberg, P. E.; Furlong, E. T.; Meyer, M. T.; Zaugg, S. D.; Henderson, A. K.; Reissman, D. B.: Persistence of pharmaceutical compounds and other organic wastewater contaminants in a conventional drinking-water-treatment plant, Sci. Total Environ. 2004, 329, 99-113.
(8) Webb, S.; Ternes, T. A.; Gibert, M.; Olejniczak, K.: Indirect human exposure to pharmaceuticals via drinking water, Toxicol. Lett. 2003, 142, 157-167.
(9) Sacher, F.; Lange, T. F.; Brauch, H.-J.; Blankenhorn, I.: Pharmaceuticals in groundwaters: Analytical methods and results of monitoring program in Baden- Württemberg, Germany, J. Chromatogr. A 2001, 938, 199-210.
(10) Hirsch, R.; Ternes, T. A.; Haberer, K.; Kratz, K.-L.: Occurrence of antibiotics in the aquatic environment, Sci. Total Environ. 1999, 225, 109-118.
(11) Ternes, T. A.; Hirsch, R.: Occurrence and behaviour of X-ray contrast media in sewage facilities and the aquatic environment, Environ. Sci. Technol. 2000, 34, 2741-2748.
(12) Ternes, T. A.: Pharmaceuticals and metabolites as contaminants of the aquatic environment, In Pharmaceuticals and personal care products in the environment: scientific regulatory issue, ACS-Symposium Series; Daughton, C. G., Jones-Lepp, T. L., Eds., 2001.
(13) Gates, D. The chlorine dioxide handbook; American Water Works Association: Denver, 1998.
Oxidation of Pharmaceuticals during Treatment with Chlorine Dioxide 95
(14) Chen, J.; Regli, S.: Disinfection practices and pathogen inactivation in ICR surface water plants, In Information collection rule analysis data; McGuire, M. J., McLain, J. L., Obolensky, A., Eds.; Awwa Research Foundation and American Water Works Association, 2002; pp 371-394.
(15) USEPA: Stage 1 disinfectants and disinfection byproduct rule, - 1998, 63, FR 69390- 69476.
(16) Condie, L. W.: Toxicological problems associated with chlorine dioxide, J. Am. Water Works Ass. 1986, June, 73-78.
(17) USEPA Alternative disinfectants and oxidants guidance manual, EPA 815-R-99-014, 1999.
(18) Hoigné, J.; Bader, H.: Kinetics of reactions of chlorine dioxide (OClO) in water - I. Rate constants for inorganic and organic compounds, Water Res. 1994, 28, 45-55.
(19) Pinkernell, U.; Nowack, B.; Gallard, H.; von Gunten, U.: Methods for the photometric determination of reactive bromine and chlorine species with ABTS, Water Res. 2000, 34, 4343-4350.
(20) Chiswell, B.; O'Halloran, K. R.: Use of lissamine green B as a spectrophotometric reagent for the determination of low residuals of chlorine dioxide, Analyst 1991, 116, 657-661.
(21) Huber, M. M.; Ternes, T. A.; von Gunten, U.: Removal of estrogenic activity and formation of oxidation products during ozonation of 17α-ethinylestradiol, Environ. Sci. Technol. 2004, web release date: August 21.
(22) Göbel, A.; McArdell, C. S.; Suter, M. J.-F.; Giger, W.: Trace determination of macrolide and sulfonamide antimicrobials, a human sulfonamide metabolite, and trimethoprim in wastewater using liquid chromatography coupled to electrospray tandem mass spectrometry, Anal. Chem. 2004, accepted.
(23) Schönenberger, R.; Suter, M. J.-F. Standard operating procedure for the determination of steroid hormones using LC-MS/MS, EAWAG, Dübendorf, Switzerland, 2003.
(24) Löffler, D.; Ternes, T. A.: Analysis of acidic pharmaceuticals, antibiotics and ivermectin in river sediments using LC-tandem MS, J. Chromatogr. A 2003, 1021, 133-144.
(25) Ternes, T. A.; Hirsch, R.; Müller, J.; Haberer, K.: Method for the determination of neutral drugs as well as betablockers and sympathomimetics in aqueous matrices using GC/MS and LC/MS/MS., Fresenius J. Anal. Chem. 1998, 362, 329-340.
(26) Rosenblatt, D. H.; Hull, L. A.; De Luca, D. C.; Davis, G. T.; Weglein, R. C.; Williams, H. K. R.: Oxidations of amines. II. Substituent effects in chlorine dioxide oxidations, J. Am. Chem. Soc. 1967, 98, 1158-1163.
(27) Li, X.-Q.; Zhong, D.-F.; Huang, H.-H.; Wu, S.-D.: Demethylation metabolism of roxithromycin in humans and rats, Acta Pharmacol. Sin. 2001, 22, 469-474.
96 Chapter 3
(28) Rav-Acha, C.: The reaction of chlorine dioxide with aquatic organic materials and their health effects, Water Res. 1984, 18, 1329-1341.
(29) Pinkston, K. E.; Sedlak, D. L.: Transformation of aromatic ether- and amine- containing pharmaceuticals during chlorine disinfection, Environ. Sci. Technol. 2004, 38, 4019-4025.
(30) Dodd, M. C.; Huang, C.-H.: Transformation of the antibacterial agent sulfamethoxazole in reactions with chlorine: kinetics, mechanisms, and pathways, Environ. Sci. Technol. 2004, in press.
(31) Pattison, D. I.; Davis, M. J.: Absolute rate constants for the reaction of hypochlorous acid with protein side chains and peptide bonds, Chem. Res. Toxicol. 2001, 14, 1453- 1464.
(32) Abia, L.; Armesto, X. L.; Canle L., M.; Garcia, M. V.; Santaballa, J. A.: Oxidation of aliphatic amines by aqueous chlorine, Tetrahedron 1998, 54, 521-530.
(33) Deborde, M.; Rabouan, S.; Gallard, H.; Leguber, B.: Aqueous chlorination kinetics of some endocrine disruptors, Environ. Sci. Technol. 2004, web release date: September 22.
4
Removal of Estrogenic Activity and Formation of Oxidation Products during Ozonation of 17α-Ethinyl-estradiol
Huber, M. M.; Ternes, T. A.; von Gunten, U. Environ. Sci. Technol. 2004,
38, 5177-5186.
98 Chapter 4
Abstract
This study investigated the oxidation of the oral contraceptive 17α-
ethinylestradiol (EE2) during ozonation. First, the effect of ozone (O3) on the
estrogenic activity of aqueous solutions of EE2 was studied using a yeast
estrogen screen (YES). It could be shown that O3 doses typically applied for the
disinfection of drinking waters were sufficient to reduce estrogenicity by a
factor of more than 200. However, it proved impossible to completely remove
estrogenic activity due to the slow reappearance of 0.1-0.2% of the initial EE2
concentration after ozonation. Second, oxidation products formed during
ozonation of EE2 were identified with LC-MS/MS and GC/MS and the help of
the model compounds 5,6,7,8-tetrahydro-2-naphthol (THN) and 1-ethinyl-1-
cyclohexanol (ECH), which represent the reactive phenolic moiety and the
ethinyl group of EE2. Additionally, oxidation products of the natural steroid
hormones 17β-estradiol (E2) and estrone (E1) were identified. The chemical
structures of the oxidation products were significantly altered as compared to the
parent compounds, explaining the diminished estrogenic activity after ozonation.
Overall, the results demonstrate that ozonation is a promising tool for the control
of EE2, E2, and E1 in drinking water and wastewater.
Removal of Estrogenicity and Product Formation during Ozonation of Ethinylestradiol 99
4.1 Introduction
In recent years, several studies have reported the occurrence of a large number
of pharmaceuticals in the aquatic environment (1-3). The presence of
pharmaceutical compounds in water resources makes it necessary to assess
water-treatment processes with respect to their removal efficiency for such
compounds. Several studies have recently shown that ozonation is a very
promising technology for the oxidation of pharmaceuticals during water
treatment (Chapter 2, (4-6)). The results of these studies are based on the
disappearance of the parent compounds. At O3 doses typically used in water
treatment, full mineralization of pharmaceuticals is not achievable, and
consequently ozonation results in the formation of oxidation products.
Depending on the functional group that is attacked by O3 and its location in the
molecule, changes in the molecular structure might be significant enough to
destroy the pharmacological effects of the parent compound. However, it cannot
be excluded that in some cases oxidation products still produce the original
pharmacological effects. To confirm that ozonation is suitable for the removal of
pharmaceuticals, it should be at least shown that there is high evidence that
pharmacological effects are significantly reduced. So far, the formation of
ozonation products has been investigated for very few pharmaceutical
compounds (7,8), and the decrease in pharmacological effects never has been
checked in a comprehensive manner.
In the present study, the oral contraceptive 17α-ethinylestradiol (EE2) was
selected on the basis of its LOEC (lowest observed effect concentration) of 0.1
ng L-1 for vitellogenin induction in rainbow trout (9). In effluents of sewage
treatment plants (STPs), its concentration typically ranges from < 0.5 ng L-1 to
10 ng L-1 (10). In vivo tests showed that EE2 is approximately 11-27 times more
potent than the female sex hormone 17β-estradiol (E2) (11). On the basis of in
100 Chapter 4
vivo estrogenic potency, EE2 might be the most important endocrine disruptor
in STP effluents together with the octyl- and nonylphenols (12).
The estrogenic activity can be considered the primary pharmacological effect
of EE2. With the yeast estrogen screen (YES) described by Routledge and
Sumpter (13), a robust and easy to handle test was available to quantify the
effect of ozonation on the estrogenic activity of pure aqueous solutions of EE2.
In detail, the effects of substoichiometric O3 doses, resulting in a partial
transformation of EE2, as well as the effects of higher O3 doses typical for
drinking water treatment have been investigated in bench-scale experiments. In
the second part of this study, a number of oxidation products formed during the
ozonation of EE2, E2, and E1 were identified.
During ozonation, micropollutants such as EE2 can be oxidized either by
ozone (O3) directly or by hydroxyl radicals (•OH), which are formed as a
consequence of O3 decay. The two oxidants vary strongly in their reactivity. O3
attacks selectively certain functional groups whereas •OH is a nonselective
oxidant that reacts very fast with a large number of moieties. Consequently,
most •OH are scavenged by the water matrix in natural waters. EE2 reacts fast
with O3 and •OH (Chapter 2). However, due to the higher selectivity of O3,
oxidation by O3 is normally the predominant process. Therefore, the present
study focused on direct O3 reactions and reactions with •OH were suppressed by
the use of scavenger compounds such as tert-butyl alcohol (TBA). The
performance of ozonation processes with respect to the oxidation of
micropollutants can be assessed with O3 and •OH exposure (i.e., concentration
of oxidant integrated over the reaction time) (14). When •OH is scavenged, the
oxidation of micropollutants is only a function of O3 exposure. This parameter is
also used to assess the disinfection efficiency of ozonation processes. Therefore,
O3 exposure allows us to compare the removal of estrogenic activity to the
inactivation of microorganisms.
Removal of Estrogenicity and Product Formation during Ozonation of Ethinylestradiol 101
4.2 Experimental Section
4.2.1 Standards and Reagents
Estrone (E1), 17β-estradiol (E2), 1-ethinyl-1-cyclohexanol (ECH), 5,6,7,8-
tetrahydro-2-naphthol (THN), adipic acid, cyclohexanone, 2-methyl-3-butyn-2-
ol, α-hydroxyisobutyric acid, and the methylester of 1-hydroxycyclohexane-1-
carboxylic acid were purchased from Sigma-Aldrich (see Figure 4-1 for
chemical structures). The chemicals were of the highest purity available. 17α-
Ethinylestradiol (EE2) was provided by Schering/Berlin, Germany. Depending
on the experiments, stock solutions of EE2 and the model compounds ECH and
THN were prepared either in Milli-Q purified water (Millipore), in tert-butyl
alcohol (TBA), or in acetone. Stock solutions of E1 and E2 were prepared in
TBA or in acetone. All chemicals used for solutions (buffer, eluents, etc.) were
reagent grade and were used without further purification. O3 was produced with
a Fischer 500 and a Fischer 502 ozone generator by using pure oxygen as feed
gas. O3 stock solutions (~1 mM) were produced by sparging O3-containing
oxygen through Milli-Q water that was cooled in an ice bath (15).
4.2.2 Determination of EE2
EE2 was determined with a Hewlett-Packard 1050 series HPLC system
equipped with a Nucleosil-100 C18 column (4 × 125 mm, 5 µm) and a
fluorescence detector (HP 1064A). The mobile phase consisted of 50% 10 mM
phosphoric acid and 50% acetonitrile at a flow rate of 0.6 mL/min. An excitation
wavelength of 229 nm and emission wavelength of 309 nm were used for
fluorescence detection. Under the experimental conditions, the quantification
limit of EE2 was 5 nM (1.5 µg L-1) for an injection volume of 100 µL. The error
of a single measurement was approximately ±5%. Enrichment by freeze-drying
lowered the quantification limit to 0.2 nM (60 ng L-1). The EE2 recovery for
freeze-dried samples was 70-90%.
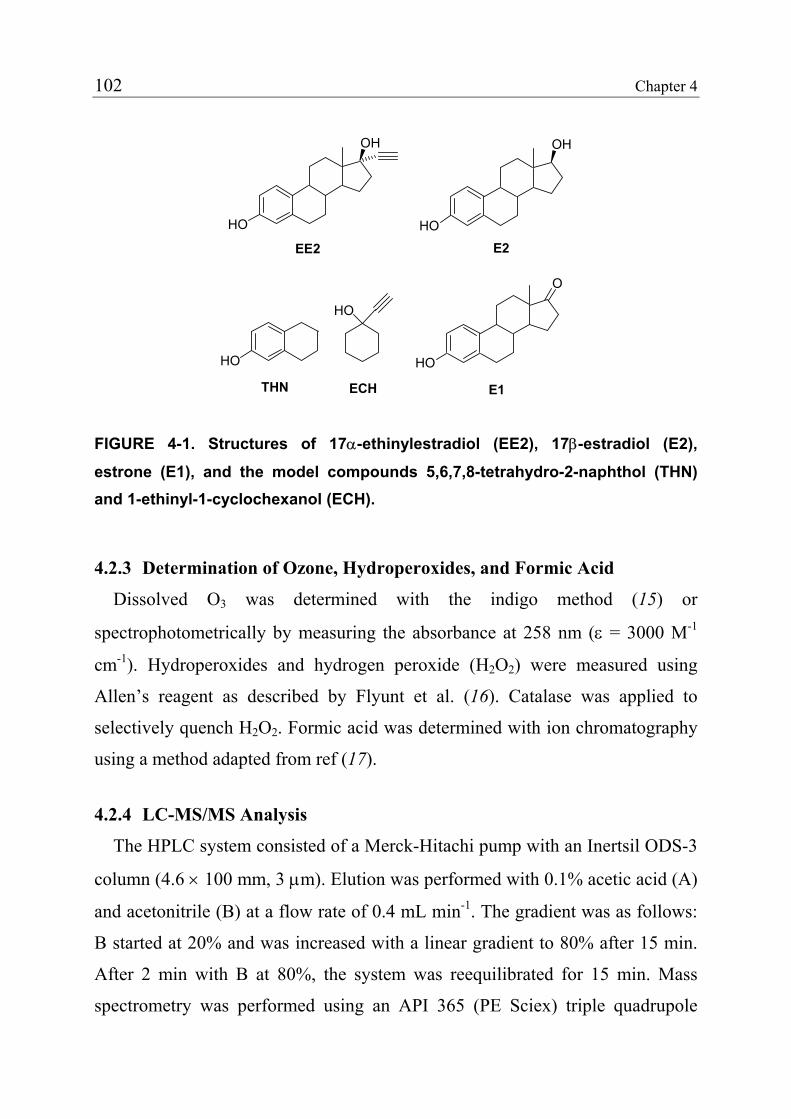
102 Chapter 4
OH
HO
HO
HO
HO
HO
O
OH
EE2 E2
E1ECHTHN
FIGURE 4-1. Structures of 17α-ethinylestradiol (EE2), 17β-estradiol (E2),
estrone (E1), and the model compounds 5,6,7,8-tetrahydro-2-naphthol (THN) and 1-ethinyl-1-cyclochexanol (ECH).
4.2.3 Determination of Ozone, Hydroperoxides, and Formic Acid
Dissolved O3 was determined with the indigo method (15) or
spectrophotometrically by measuring the absorbance at 258 nm (ε = 3000 M-1
cm-1). Hydroperoxides and hydrogen peroxide (H2O2) were measured using
Allen’s reagent as described by Flyunt et al. (16). Catalase was applied to
selectively quench H2O2. Formic acid was determined with ion chromatography
using a method adapted from ref (17).
4.2.4 LC-MS/MS Analysis
The HPLC system consisted of a Merck-Hitachi pump with an Inertsil ODS-3
column (4.6 × 100 mm, 3 µm). Elution was performed with 0.1% acetic acid (A)
and acetonitrile (B) at a flow rate of 0.4 mL min-1. The gradient was as follows:
B started at 20% and was increased with a linear gradient to 80% after 15 min.
After 2 min with B at 80%, the system was reequilibrated for 15 min. Mass
spectrometry was performed using an API 365 (PE Sciex) triple quadrupole
Removal of Estrogenicity and Product Formation during Ozonation of Ethinylestradiol 103
mass spectrometer with turbo-electrospray ionization (ESI). Nitrogen was used
as curtain gas, and synthetic air was used as nebulizer gas. Curtain and nebulizer
gas flows were both operated with a flow rate of 1.0 L min-1. The ESI interface
was heated to 400 °C. The HPLC flux was split 1:10 to diminish the flow rate in
the ESI.
Full scans as well as precursor and product ion scans were conducted to
determine the quasi-molecular ions and the structure of major oxidation
products. Before analysis, aliquots of the ozonated solutions (100-250 mL) were
freeze-dried. The residual components were resuspended in approximately 2 mL
of a water/acetonitrile (20/80, v/v) mixture and filtered with a 0.2 µm filter. The
samples were analyzed in the positive as well as the negative mode. Adipic acid,
cyclohexanone, 1,2-cyclohexanedione, and α-hydroxyisobutyric acid were
quantified using the MRM (multiple reaction monitoring) mode after optimizing
the LC-MS/MS for each compound. For quantification, aqueous solutions were
analyzed directly without any concentration steps.
4.2.5 GC/MS Analysis
After freeze-drying 100-250 mL aliquots of ozonated model-compound
solutions, the residual components were resuspended in approximately 2 mL of
acetone and filtered with a 0.2 µm filter to remove insoluble components.
Aliquots of 0.2 mL were derivatized by adding 0.2 mL of a
diazomethane/diethyl ether solution at -20 °C. The samples were incubated for 1
h at -20 °C before diazomethane was quenched with 2-3 drops of acetic
acid/acetone solution (1:10, v/v). Subsequently, the volume of the samples was
reduced to 200 µL by a gentle nitrogen stream. Diazomethane is highly toxic
and carcinogenic. All work has to be conducted in a fume hood and skin contact
has to be strongly avoided.
104 Chapter 4
Separation and detection were accomplished with a Varian GC 3400 coupled
to a Varian Saturn 4D mass spectrometer. The gas chromatograph was equipped
with a PTV injector and a Restek XTI-5 column (30 m × 0.25 mm × 0.25 µm).
GC injection parameters: 5 µL, splitless; 50 °C; 100 °C min-1 to 300 °C, 300 °C
isothermal 10 min. Oven temperatures: 50 °C isothermal for 2 min, 2.8 °C min-1
to 120 °C, 15.4 °C min-1 to 290 °C, and 290 °C isothermal for 10 min.
4.2.6 Recombinant Yeast Estrogen Screen (YES)
The YES was conducted as described by Routledge and Sumpter (13).
Briefly, the recombinant yeast strain used in the screen expresses the human
estrogen receptor (hER), which can interact with estrogenic compounds. Upon
binding an active compound, the hER triggers the expression of the reporter
gene lac-Z, which promotes the production of the enzyme β-galactosidase. The
enzyme metabolizes the yellow dye chlorophenol red-β-D-galactopyranoside
(CPRG) into a red product that can be measured spectrophotometrically.
Depending on the expected EE2 concentrations, aqueous samples were
freeze-dried and resuspended in ethanol or directly diluted in ethanol to obtain
appropriate concentrations for the YES. Based on these solutions, series of 6 or
12 dilutions (1:1) were prepared in ethanol. Of each dilution, 20 µL was added
to a 96-well microtiter plate. Besides the samples, each plate contained a
standard curve with E2 in ethanol (final concentration dissolved in assay
medium: 2 × 10⁻⁸ to 1 × 10-11 M) and a row of blanks. After ethanol was
evaporated to dryness, the yeast cells were added together with the assay
medium. The color development was measured after incubating the microtiter
plate for 72 h at 30 °C.
To evaluate the data, the sigmoidal concentration-response curve of the E2
standard was fitted to a symmetric logistic function (eq 1) using the software
Prism (GraphPad, San Diego, CA).
Removal of Estrogenicity and Product Formation during Ozonation of Ethinylestradiol 105
mcECabaresponse ⋅−+
−+= )log50(log101
(1)
a is the baseline response (bottom), b is the maximum response (top), c is the
concentration, m is the Hill slope, and EC50 is the concentration provoking the
half-maximal response.
With the values received for b (top) and a (bottom), the response of the
standard and the samples was expressed as the percent of maximum response
evoked by E2. To determine the EC50 and the Hill slope m of the E2 standard
curve, the concentration-response curve was fitted again to eq 1 with the
response expressed in percent whereby a and b were held constant at 0% and
100%, respectively. To calculate the EC50 values for the samples, the response
in percent was fitted to eq 1 whereby a (0%), b (100%), and m were held
constant. The concentration c in eq 1 was replaced by the concentration factor.
The estrogenic activity of a sample expressed in 17β-estradiol equivalents
(EEQs) was then calculated as the ratio of the EC50 for E2 to the EC50 for the
sample.
4.2.7 Ozonation Experiments for YES
If not stated otherwise, the reaction solutions consisted of Milli-Q purified
water spiked with 1 or 10 µM EE2 and were buffered to pH 8 with 5 mM
phosphate buffer. Furthermore, the solutions contained 5 mM TBA as an •OH
scavenger.
Substoichiometric O3 Doses. Experiments with substoichiometric O3 doses
were carried out as follows: To a series of identical reaction solutions (20 mL)
with 10 µM EE2, O3 doses ranging from 5 to 24 µM were added under vigorous
stirring. Immediately after the addition of O3, 10 mL of the solution was
removed from the reaction vessel and stored for 2-3 days at room temperature.
Of the 10 mL, 0.5 mL was taken for HPLC analysis and 9.5 mL was freeze-
106 Chapter 4
dried. After freeze-drying, the residual components were redissolved with the
help of sonication in 0.95 mL of ethanol. Insoluble phosphate salts were allowed
to settle before the liquid phase was removed and stored at -20 °C until the YES
was conducted. Samples with EE2 > 0.5 µM were diluted directly with ethanol
without freeze-drying.
Reduction of Estrogenicity as a Function of O3 Exposure. To quantify the
reduction in estrogenicity as a function of O3 exposure, a reaction solution (500
mL) spiked with 1 µM EE2 was thermostated at 10 °C. After adding 20 µM (1
mg L-1) O3, a series of 10 mL samples was taken over the course of the reaction.
Thiosulfate was used to quench O3 in the samples. The corresponding O3
exposures of the samples were calculated on the basis of an O3 decay curve,
which was determined in a preliminary experiment under conditions identical to
those described in ref (18). In an experiment with a slightly different setup, 20
µM (1 mg L-1) O3 was added to a series of 250 mL solutions. Samples of 100 mL
were taken after the desired time intervals and immediately quenched with
thiosulfate. These experiments allowed for the quantification of EE2
concentration < 1 nM with HPLC due to a higher enrichment during freeze-
drying. After quenching O3, samples of both experiments were stored for 3 days
at room temperature before they were freeze-dried. With the help of sonication,
the residual components were redissolved in 1 and 2 mL of ethanol,
respectively.
4.2.8 Kinetics of Reappearance of EE2 after Ozonation
The reappearance kinetics of EE2 was investigated at two different O3
concentrations (50 and 100 µM), which were added to two reaction solutions
spiked with 10 µM EE2. After 5 min, 2 mL of the solutions was withdrawn and
transferred into an amber HPLC vial where O3 was immediately quenched with
thiosulfate. Each of the samples was repeatedly analyzed over the next 165 h.
Removal of Estrogenicity and Product Formation during Ozonation of Ethinylestradiol 107
To investigate the pH dependence of the EE2 reappearance, reaction solutions
were buffered to pH 5, 6, 7, 8, and 9. The experiments were performed as
described for the reappearance kinetics except that samples were only analyzed
after 3 days.
4.2.9 Investigation of Product Formation
The oxygen stream containing 2% O3 was continuously bubbled through a
1-L amber glass bottle, which contained the reaction solution. The solution was
stirred with a magnetic stir bar at 80 rpm. Reaction solutions of the model
compounds THN (0.2 mM) and ECH (5 mM) as well as of 2-methyl-3-butyn-2-
ol (5 mM) were prepared by dissolving the pure chemicals in acetone or TBA
and spiking them to Milli-Q water. The reaction solutions containing the model
compounds were ozonated during 5-40 min. The experiments that produced the
highest yield with respect to the quantified oxidation product were repeated at
pH 7 (5 mM phosphate buffer) with the corresponding ozonation time. Reaction
solutions containing the estrogens consisted of EE2 (0.02 mM), E2 (0.005 mM),
or E1 (0.005 mM) dissolved in Milli-Q water and either acetone or TBA as •OH
scavenger. Due to the low solubility of the estrogens in aqueous solutions, only
low starting concentrations could be selected. In a first step, estrogen solutions
were ozonated for 0.5 min (E1, E2) to 2 min (EE2). To increase the product
yield, the ozonated solution was spiked again with the corresponding estrogen
and subjected to ozonation for an identical time interval. Overall, this procedure
was repeated 10 times. The fact that oxidation products were more polar than the
parent compound prevented the precipitation of oxidation products.
4.3 Results and Discussion
The second-order rate constant (kO3) for the reaction of 17α-ethinylestradiol
(EE2) with ozone (O3) is extremely high (at pH 7, kO3 = 3 × 10⁶ M-1 s-1 (Chapter
108 Chapter 4
2)), resulting in a half-life of approximately 10 ms for an O3 concentration of 1
mg L-1. O3 attack must take place on the phenolic moiety of EE2, because
phenols are well known to react fast with ozone at neutral or basic pH (19). In
this pH range, the reaction of O3 with the phenolate anion of EE2 is the
predominant reaction whereas the reaction with neutral EE2 is negligible.
Consequently, the reaction of EE2 (pKa = 10.4) with O3 is strongly pH-
dependent (the apparent kO3 at pH 8 is 10 times higher than at pH 7). The second
reactive group of EE2, the ethinyl group, has a considerably lower reactivity
toward O3. Its kO3 is estimated to be close to the kO3 of ECH, which was
determined in this study to be 200 M-1 s-1 at 20 °C. The corresponding half-life is
approximately 3 min for an O3 concentration of 1 mg L-1. On the basis of these
kinetic considerations, it is clear that EE2 disappears very fast during ozonation
processes. However, if ozonation is applied to treat an EE2-containing water, the
removal of estrogenic activity has to be assessed in addition to the disappearance
of EE2. To test whether ozonation reduces estrogenic activity, aqueous solutions
of EE2 were treated with O3 and subsequently tested for estrogenic activity
using a yeast estrogen screen (YES).
4.3.1 Reduction of Estrogenicity with Substoichiometric Ozone Doses
The high kO3 for the oxidation of EE2 refers to the first transformation step.
On the basis of a study on the ozonation of phenol (20), it can be assumed that
some of the important subsequent oxidation steps of EE2 proceed as fast as the
first transformation step. This sequence of fast transformation steps will lead to a
modification and partly to a cleavage of the phenol ring in EE2. To test whether
this results in a substantial removal of estrogenicity, experiments were
performed with sub-stoichiometric O3 doses. Under these conditions, only the
fast initial transformation steps take place.
Figure 4-2a illustrates the correlation between decrease in estrogenicity and
the concentration of EE2 as a function of O3 dosages. The estrogenicity
Removal of Estrogenicity and Product Formation during Ozonation of Ethinylestradiol 109
expressed in 17β-estradiol equivalents (EEQs) and EE2 concentrations were
normalized to the values of the solution without O3 ([EE2]0 = 10 µM).
Approximately 1.8 mol of O3 was consumed per mole of EE2. The
stoichiometry is higher than 1 because oxidation products of the first oxidation
step obviously underwent further reactions with O3. Adding 19 µM O3 reduced
the estrogenicity of the solution to 1.5%. The reduction in estrogenicity was
proportional to the decrease in EE2. This indicates that the estrogenicity of the
intermediates of the first transformation step is much lower than that of EE2. In
Figure 4-2b, the estrogenicity expressed in EEQ is plotted versus the EE2
concentration. The fact that the data forms a straight line with a slope of
approximately 1 demonstrates that the parent compound EE2 is responsible for
the observed estrogenicity. Even at the two lowest EE2 concentrations,
accounting for 0.12% and 0.28% of the initial EE2 concentration, no significant
deviation from the straight line occurs. This means that the sum of the estrogenic
activity of the intermediates is at least 200 times lower than the estrogenicity of
the original EE2 solution.
These findings were confirmed with an estrogen receptor competitive-binding
assay adapted from Blair et al. (21). In this assay, the estrogen receptor can
directly interact with the investigated compounds. Because no living organism is
used, biological processes associated with test organisms do not influence the
response of the assay. After ozonation, EE2-containing solutions
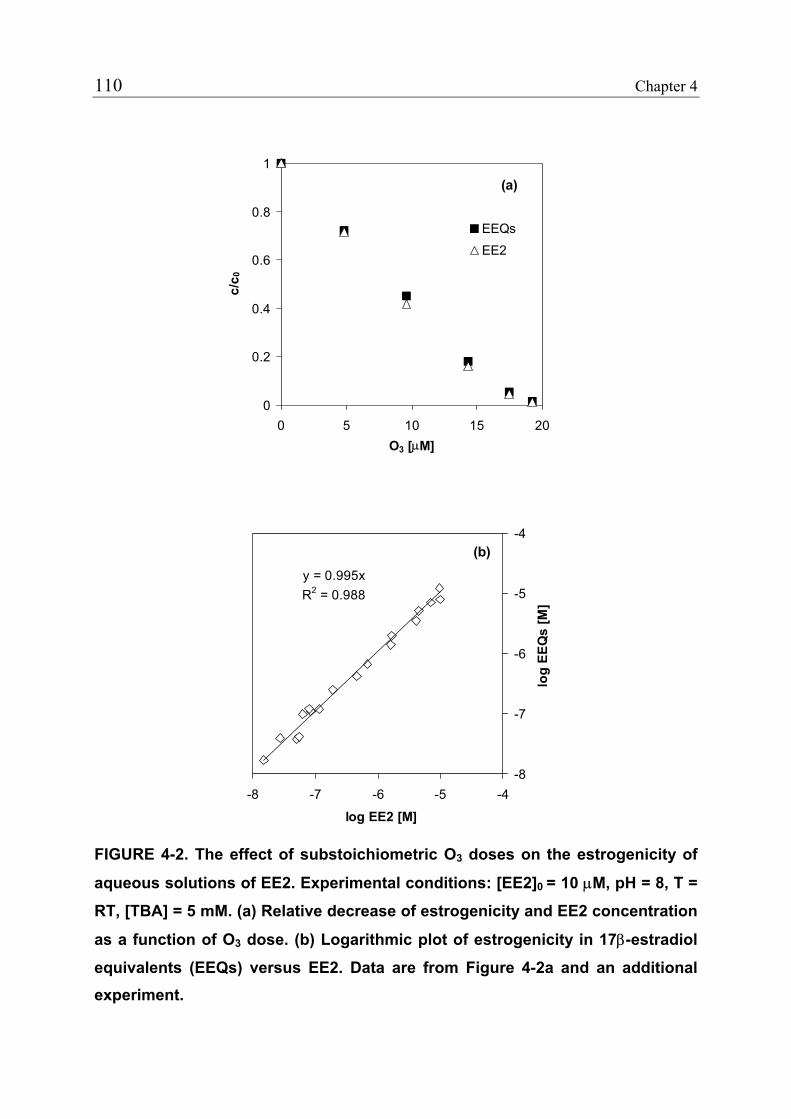
110 Chapter 4
0
0.2
0.4
0.6
0.8
1
0 5 10 15 20O3 [µM]
c/c 0
EEQs
EE2
(a)
y = 0.995xR2 = 0.988
-8
-7
-6
-5
-4
-8 -7 -6 -5 -4
log EE2 [M]
log
EEQ
s [M
](b)
FIGURE 4-2. The effect of substoichiometric O3 doses on the estrogenicity of
aqueous solutions of EE2. Experimental conditions: [EE2]0 = 10 µM, pH = 8, T =
RT, [TBA] = 5 mM. (a) Relative decrease of estrogenicity and EE2 concentration
as a function of O3 dose. (b) Logarithmic plot of estrogenicity in 17β-estradiol
equivalents (EEQs) versus EE2. Data are from Figure 4-2a and an additional experiment.
Removal of Estrogenicity and Product Formation during Ozonation of Ethinylestradiol 111
did not displace radiolabeled E2 from the rat estrogen receptor, whereas
untreated solutions displaced it completely. This means that the oxidation
products of EE2 do not bind efficiently to the estrogen receptor. The YES
experiments described above were designed to yield a reduction of estrogenicity
by a factor of 1000-10000. However, the observed reduction was lower due to a
slow reappearance of EE2 after oxidation. The reappearance of EE2 will be
discussed later. To achieve concentrations lower than 0.1 µM with nearly
stoichiometric O3 doses, the reaction solutions had to be spiked with a second O3
dose after storing the solutions for 3 days at room temperature. The second O3
dose was kept as low as possible to avoid significant changes in the product
distribution of the fast initial transformation steps.
4.3.2 Reduction of Estrogenicity as a Function of Ozone Exposure
In drinking-water treatment, O3 exposures are much higher than in the
experiments with substoichiometric O3 doses, in which O3 was immediately
consumed. To test whether higher O3 exposures result in further removal of
estrogenicity, aqueous solutions of EE2 at 10 °C and pH 8 were subjected to O3
exposures ranging from 0.5 to 20 mg L-1 min. Figure 4-3 shows the decrease of
the EE2 concentration together with the EEQ reduction. As expected, the results
showed a drop of the estrogenicity by a factor of 200-500 for the lowest
measured O3 exposure, confirming the results of the experiments with
substoichiometric O3 doses. However, at higher O3 exposures, the further
decrease of estrogenicity was very slow. To reduce estrogenicity by a factor of
1000, an O3 exposure of approximately 10 mg L-1 min was necessary.
The O3 exposures reported above can be related to O3 exposures applied for
disinfection, which is often the primary objective of ozonation. O3 exposures
required to achieve certain levels of inactivation for specific microorganisms
were calculated on the basis of inactivation rate constants and activation
energies compiled by von Gunten (22). At an O3 exposure of 0.5 mg L-1 min and
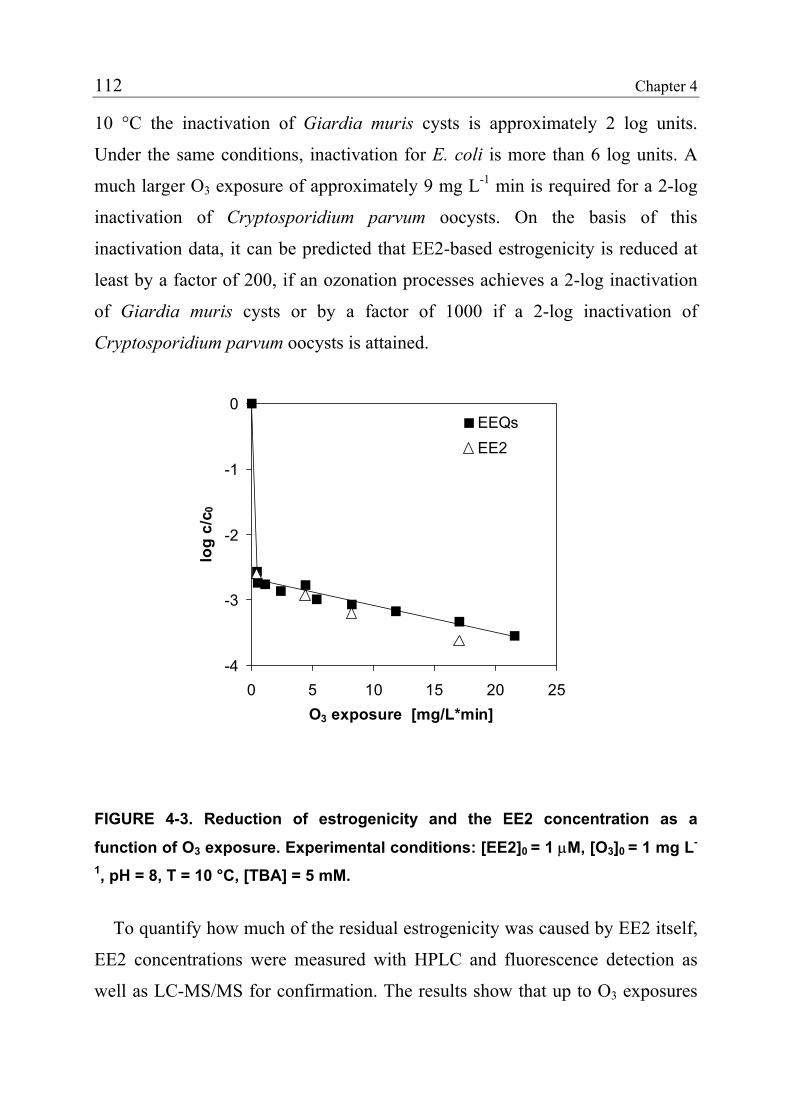
112 Chapter 4
10 °C the inactivation of Giardia muris cysts is approximately 2 log units.
Under the same conditions, inactivation for E. coli is more than 6 log units. A
much larger O3 exposure of approximately 9 mg L-1 min is required for a 2-log
inactivation of Cryptosporidium parvum oocysts. On the basis of this
inactivation data, it can be predicted that EE2-based estrogenicity is reduced at
least by a factor of 200, if an ozonation processes achieves a 2-log inactivation
of Giardia muris cysts or by a factor of 1000 if a 2-log inactivation of
Cryptosporidium parvum oocysts is attained.
-4
-3
-2
-1
0
0 5 10 15 20 25O3 exposure [mg/L*min]
log
c/c 0
EEQsEE2
FIGURE 4-3. Reduction of estrogenicity and the EE2 concentration as a
function of O3 exposure. Experimental conditions: [EE2]0 = 1 µM, [O3]0 = 1 mg L-
1, pH = 8, T = 10 °C, [TBA] = 5 mM.
To quantify how much of the residual estrogenicity was caused by EE2 itself,
EE2 concentrations were measured with HPLC and fluorescence detection as
well as LC-MS/MS for confirmation. The results show that up to O3 exposures
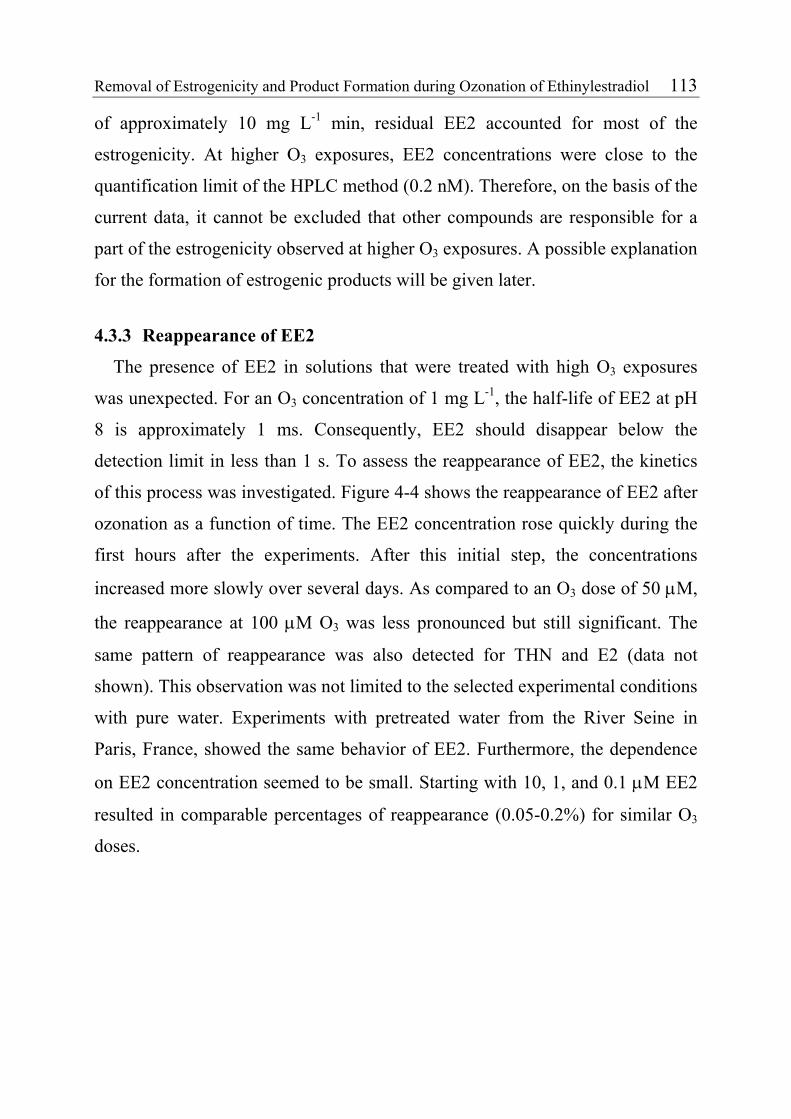
Removal of Estrogenicity and Product Formation during Ozonation of Ethinylestradiol 113
of approximately 10 mg L-1 min, residual EE2 accounted for most of the
estrogenicity. At higher O3 exposures, EE2 concentrations were close to the
quantification limit of the HPLC method (0.2 nM). Therefore, on the basis of the
current data, it cannot be excluded that other compounds are responsible for a
part of the estrogenicity observed at higher O3 exposures. A possible explanation
for the formation of estrogenic products will be given later.
4.3.3 Reappearance of EE2
The presence of EE2 in solutions that were treated with high O3 exposures
was unexpected. For an O3 concentration of 1 mg L-1, the half-life of EE2 at pH
8 is approximately 1 ms. Consequently, EE2 should disappear below the
detection limit in less than 1 s. To assess the reappearance of EE2, the kinetics
of this process was investigated. Figure 4-4 shows the reappearance of EE2 after
ozonation as a function of time. The EE2 concentration rose quickly during the
first hours after the experiments. After this initial step, the concentrations
increased more slowly over several days. As compared to an O3 dose of 50 µM,
the reappearance at 100 µM O3 was less pronounced but still significant. The
same pattern of reappearance was also detected for THN and E2 (data not
shown). This observation was not limited to the selected experimental conditions
with pure water. Experiments with pretreated water from the River Seine in
Paris, France, showed the same behavior of EE2. Furthermore, the dependence
on EE2 concentration seemed to be small. Starting with 10, 1, and 0.1 µM EE2
resulted in comparable percentages of reappearance (0.05-0.2%) for similar O3
doses.
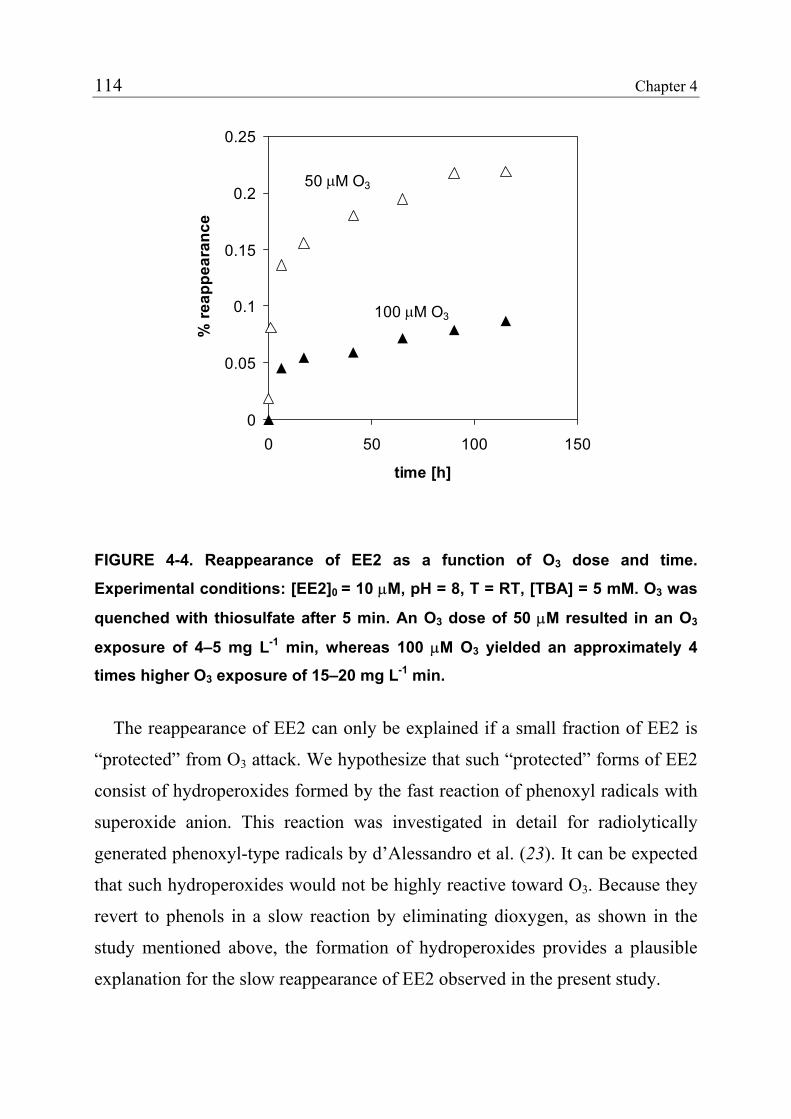
114 Chapter 4
0
0.05
0.1
0.15
0.2
0.25
0 50 100
time [h]
% re
appe
aran
ce50 µM O3
100 µM O3
150
FIGURE 4-4. Reappearance of EE2 as a function of O3 dose and time.
Experimental conditions: [EE2]0 = 10 µM, pH = 8, T = RT, [TBA] = 5 mM. O3 was
quenched with thiosulfate after 5 min. An O3 dose of 50 µM resulted in an O3
exposure of 4–5 mg L-1 min, whereas 100 µM O3 yielded an approximately 4
times higher O3 exposure of 15–20 mg L-1 min.
The reappearance of EE2 can only be explained if a small fraction of EE2 is
“protected” from O3 attack. We hypothesize that such “protected” forms of EE2
consist of hydroperoxides formed by the fast reaction of phenoxyl radicals with
superoxide anion. This reaction was investigated in detail for radiolytically
generated phenoxyl-type radicals by d’Alessandro et al. (23). It can be expected
that such hydroperoxides would not be highly reactive toward O3. Because they
revert to phenols in a slow reaction by eliminating dioxygen, as shown in the
study mentioned above, the formation of hydroperoxides provides a plausible
explanation for the slow reappearance of EE2 observed in the present study.
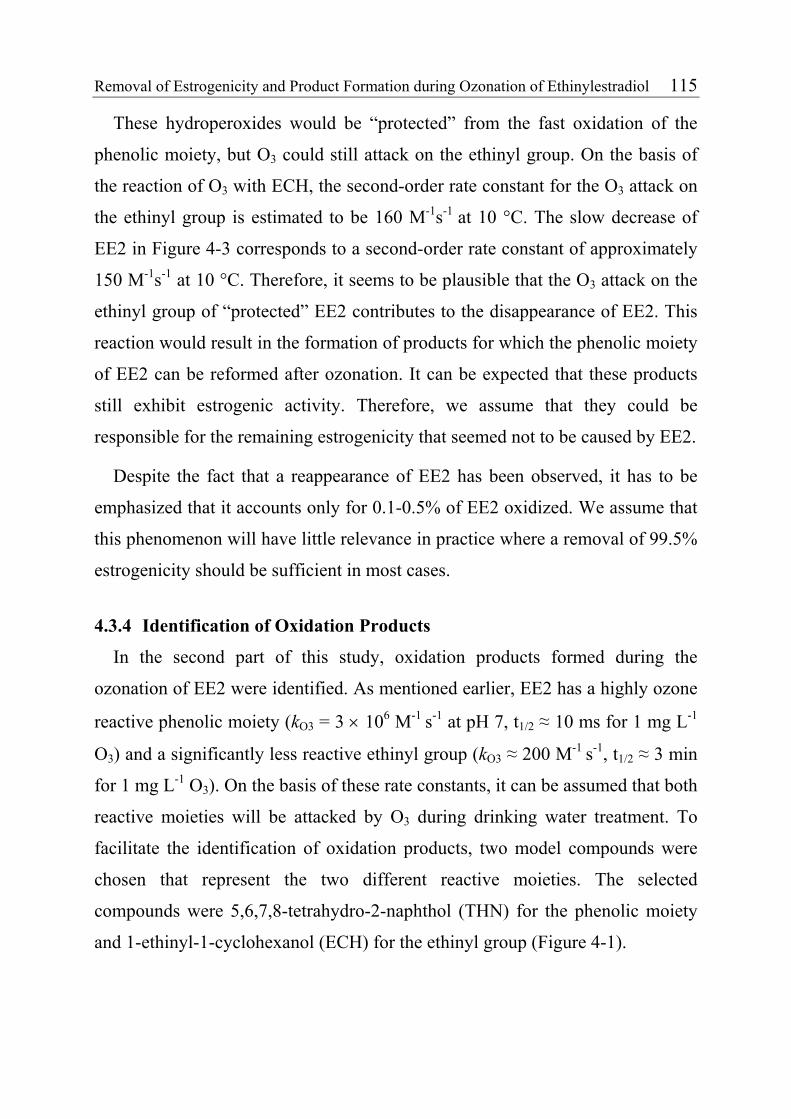
Removal of Estrogenicity and Product Formation during Ozonation of Ethinylestradiol 115
These hydroperoxides would be “protected” from the fast oxidation of the
phenolic moiety, but O3 could still attack on the ethinyl group. On the basis of
the reaction of O3 with ECH, the second-order rate constant for the O3 attack on
the ethinyl group is estimated to be 160 M-1s-1 at 10 °C. The slow decrease of
EE2 in Figure 4-3 corresponds to a second-order rate constant of approximately
150 M-1s-1 at 10 °C. Therefore, it seems to be plausible that the O3 attack on the
ethinyl group of “protected” EE2 contributes to the disappearance of EE2. This
reaction would result in the formation of products for which the phenolic moiety
of EE2 can be reformed after ozonation. It can be expected that these products
still exhibit estrogenic activity. Therefore, we assume that they could be
responsible for the remaining estrogenicity that seemed not to be caused by EE2.
Despite the fact that a reappearance of EE2 has been observed, it has to be
emphasized that it accounts only for 0.1-0.5% of EE2 oxidized. We assume that
this phenomenon will have little relevance in practice where a removal of 99.5%
estrogenicity should be sufficient in most cases.
4.3.4 Identification of Oxidation Products
In the second part of this study, oxidation products formed during the
ozonation of EE2 were identified. As mentioned earlier, EE2 has a highly ozone
reactive phenolic moiety (kO3 = 3 × 10⁶ M-1 s-1 at pH 7, t1/2 ≈ 10 ms for 1 mg L-1
O3) and a significantly less reactive ethinyl group (kO3 ≈ 200 M-1 s-1, t1/2 ≈ 3 min
for 1 mg L-1 O3). On the basis of these rate constants, it can be assumed that both
reactive moieties will be attacked by O3 during drinking water treatment. To
facilitate the identification of oxidation products, two model compounds were
chosen that represent the two different reactive moieties. The selected
compounds were 5,6,7,8-tetrahydro-2-naphthol (THN) for the phenolic moiety
and 1-ethinyl-1-cyclohexanol (ECH) for the ethinyl group (Figure 4-1).
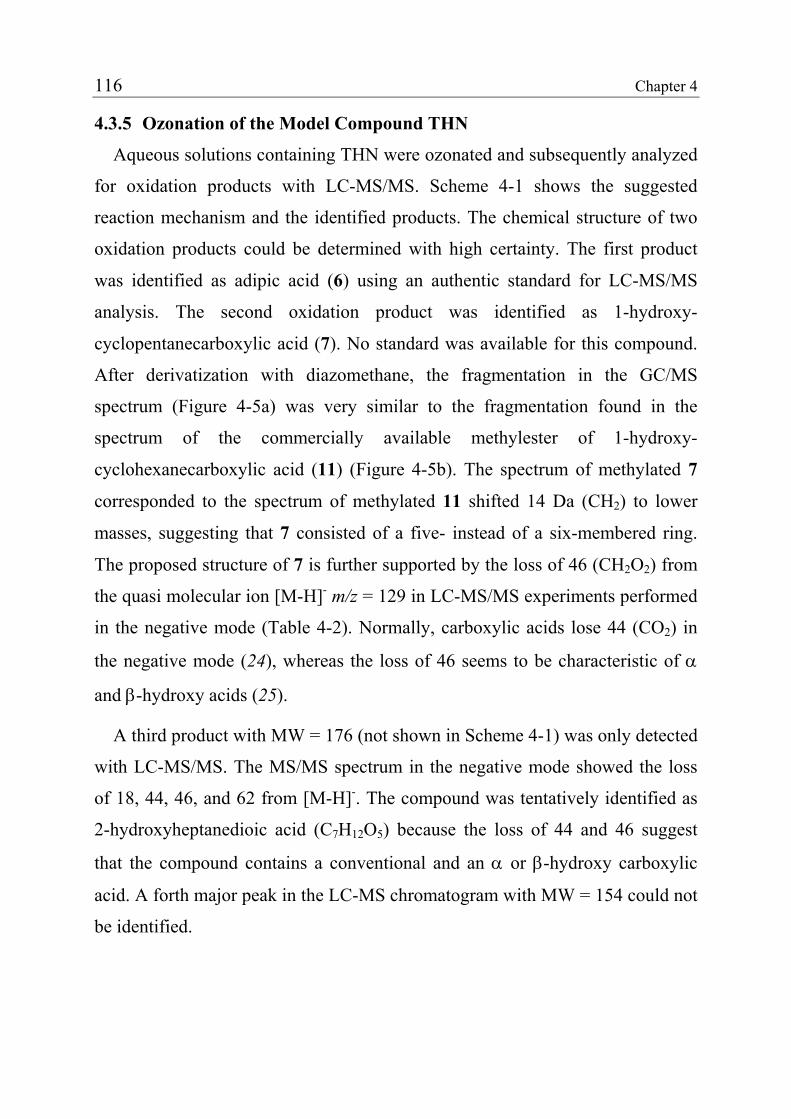
116 Chapter 4
4.3.5 Ozonation of the Model Compound THN
Aqueous solutions containing THN were ozonated and subsequently analyzed
for oxidation products with LC-MS/MS. Scheme 4-1 shows the suggested
reaction mechanism and the identified products. The chemical structure of two
oxidation products could be determined with high certainty. The first product
was identified as adipic acid (6) using an authentic standard for LC-MS/MS
analysis. The second oxidation product was identified as 1-hydroxy-
cyclopentanecarboxylic acid (7). No standard was available for this compound.
After derivatization with diazomethane, the fragmentation in the GC/MS
spectrum (Figure 4-5a) was very similar to the fragmentation found in the
spectrum of the commercially available methylester of 1-hydroxy-
cyclohexanecarboxylic acid (11) (Figure 4-5b). The spectrum of methylated 7
corresponded to the spectrum of methylated 11 shifted 14 Da (CH2) to lower
masses, suggesting that 7 consisted of a five- instead of a six-membered ring.
The proposed structure of 7 is further supported by the loss of 46 (CH2O2) from
the quasi molecular ion [M-H]- m/z = 129 in LC-MS/MS experiments performed
in the negative mode (Table 4-2). Normally, carboxylic acids lose 44 (CO2) in
the negative mode (24), whereas the loss of 46 seems to be characteristic of α
and β-hydroxy acids (25).
A third product with MW = 176 (not shown in Scheme 4-1) was only detected
with LC-MS/MS. The MS/MS spectrum in the negative mode showed the loss
of 18, 44, 46, and 62 from [M-H]-. The compound was tentatively identified as
2-hydroxyheptanedioic acid (C7H12O5) because the loss of 44 and 46 suggest
that the compound contains a conventional and an α or β-hydroxy carboxylic
acid. A forth major peak in the LC-MS chromatogram with MW = 154 could not
be identified.
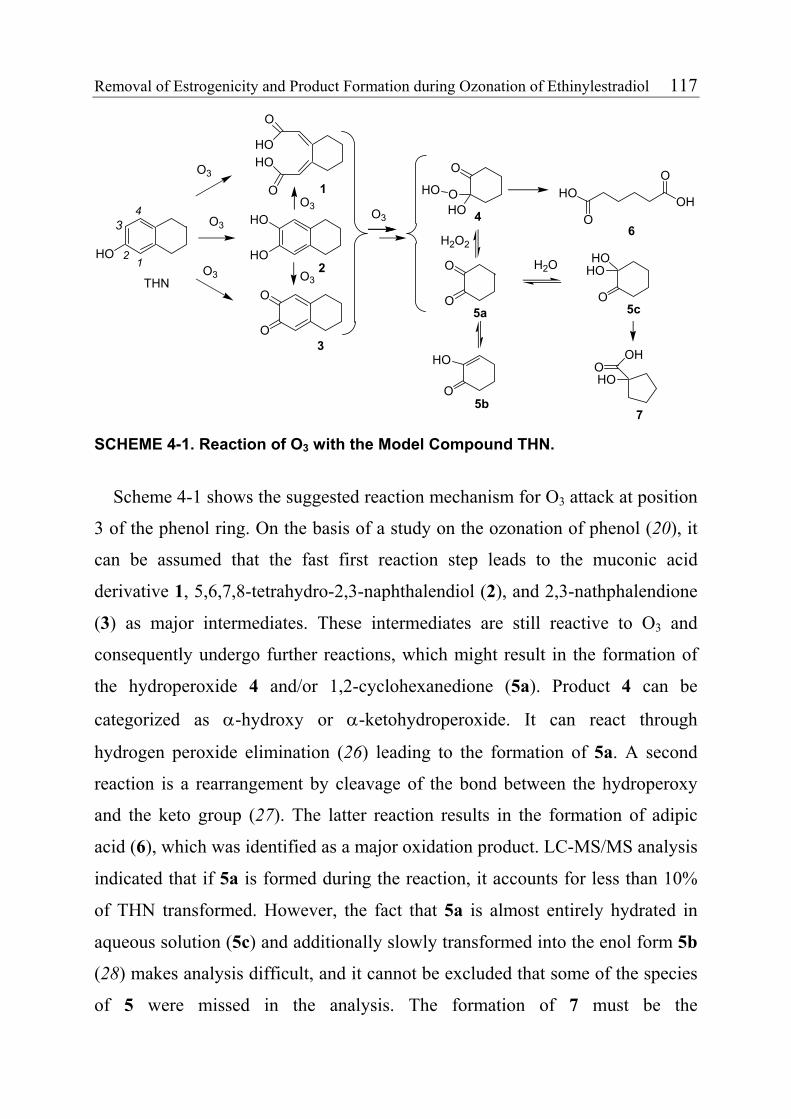
Removal of Estrogenicity and Product Formation during Ozonation of Ethinylestradiol 117
HO
O3
O3
O3
HO
HO
O
HO
O
HO
O3
O
OTHN
O3 O3
O
OHO
HO
O
HO
O
O
H2O2
H2O
O
HOHO
HO
O
O
OH
HOO
OH
1
2
3
5a
4
7
6
12
34
5b
5c
SCHEME 4-1. Reaction of O3 with the Model Compound THN.
Scheme 4-1 shows the suggested reaction mechanism for O3 attack at position
3 of the phenol ring. On the basis of a study on the ozonation of phenol (20), it
can be assumed that the fast first reaction step leads to the muconic acid
derivative 1, 5,6,7,8-tetrahydro-2,3-naphthalendiol (2), and 2,3-nathphalendione
(3) as major intermediates. These intermediates are still reactive to O3 and
consequently undergo further reactions, which might result in the formation of
the hydroperoxide 4 and/or 1,2-cyclohexanedione (5a). Product 4 can be
categorized as α-hydroxy or α-ketohydroperoxide. It can react through
hydrogen peroxide elimination (26) leading to the formation of 5a. A second
reaction is a rearrangement by cleavage of the bond between the hydroperoxy
and the keto group (27). The latter reaction results in the formation of adipic
acid (6), which was identified as a major oxidation product. LC-MS/MS analysis
indicated that if 5a is formed during the reaction, it accounts for less than 10%
of THN transformed. However, the fact that 5a is almost entirely hydrated in
aqueous solution (5c) and additionally slowly transformed into the enol form 5b
(28) makes analysis difficult, and it cannot be excluded that some of the species
of 5 were missed in the analysis. The formation of 7 must be the
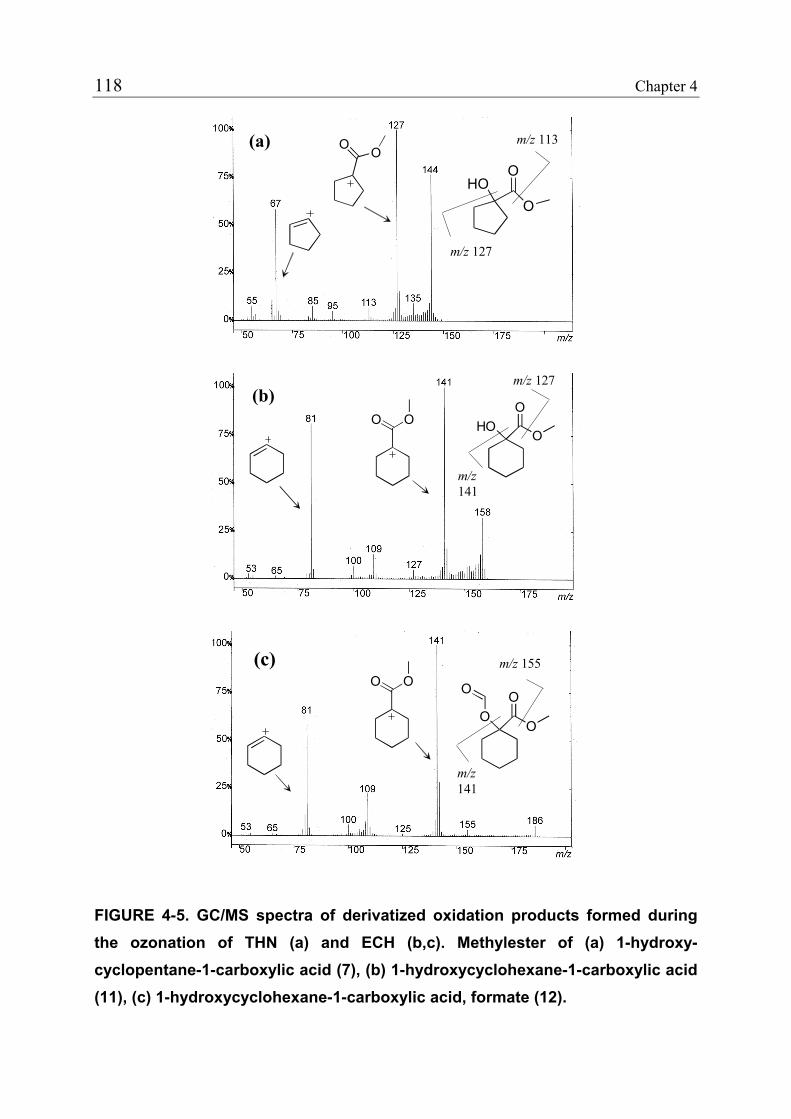
118 Chapter 4
HOO
O
(a) O Om/z 113
m/z 127
HOO
OO O
m/z 127
m/z 141
(b)
(c)
OO
O
O
m/z 155
m/z 141
O O
FIGURE 4-5. GC/MS spectra of derivatized oxidation products formed during the ozonation of THN (a) and ECH (b,c). Methylester of (a) 1-hydroxy-cyclopentane-1-carboxylic acid (7), (b) 1-hydroxycyclohexane-1-carboxylic acid (11), (c) 1-hydroxycyclohexane-1-carboxylic acid, formate (12).
Removal of Estrogenicity and Product Formation during Ozonation of Ethinylestradiol 119
product of a benzilic acid rearrangement (29) of 5a via 5c. Ring contractions of
six-membered cyclic diketones to α-hydroxy acids have been reported by
several studies dealing with steroid synthesis (e.g., ref (30)). Usually, these
experiments were performed under alkaline conditions in solvent/water
mixtures. In aqueous solution, a study on the enolization of 5a (31) explained its
slow irreversible disappearance and the formation of an acidic compound by the
formation of 7 as well. On the basis of these considerations, we assume that 5
was at least partly transformed into 7 in a relatively slow reaction after
ozonation.
Scheme 4-1 refers to the initial O3 attack at position 3 of the phenol ring. O3
can also attack at position 1. The corresponding first step intermediates will be
formed. Further oxidation by O3 might proceed in a different way and yield
different products due to the different positions of the double bonds. However, it
is possible that products 6 and 7 were partly formed by this way as well.
4.3.6 Ozonation of the Model Compound ECH
The ethinyl group represents the reactive moiety of the second model
compound 1-ethinyl-1-cyclohexanol (ECH). Even if acetylenes react
considerably more slowly with O3 than olefins, it can be assumed that O3 attack
on the ethinyl group proceeds analogous to the well- established Crigee
mechanism for double bonds (32). According to this mechanism, O3 attack on
the ethinyl group of ECH results in the formation of the primary ozonide 8,
which quickly decomposes into the hydroxyhydroperoxides 9a and/or 9b
(Scheme 4-2). The fact that less than 2 min after the completion of the reaction
no hydroperoxides except hydrogen peroxide could be determined demonstrates
that 9a and 9b are only short-lived intermediates. The H2O2 yield was 65%
relative to the added O3 concentration. This indicates that the keto aldehyde 10
is the major product of this reaction (in aqueous solution 10 may be hydrated).
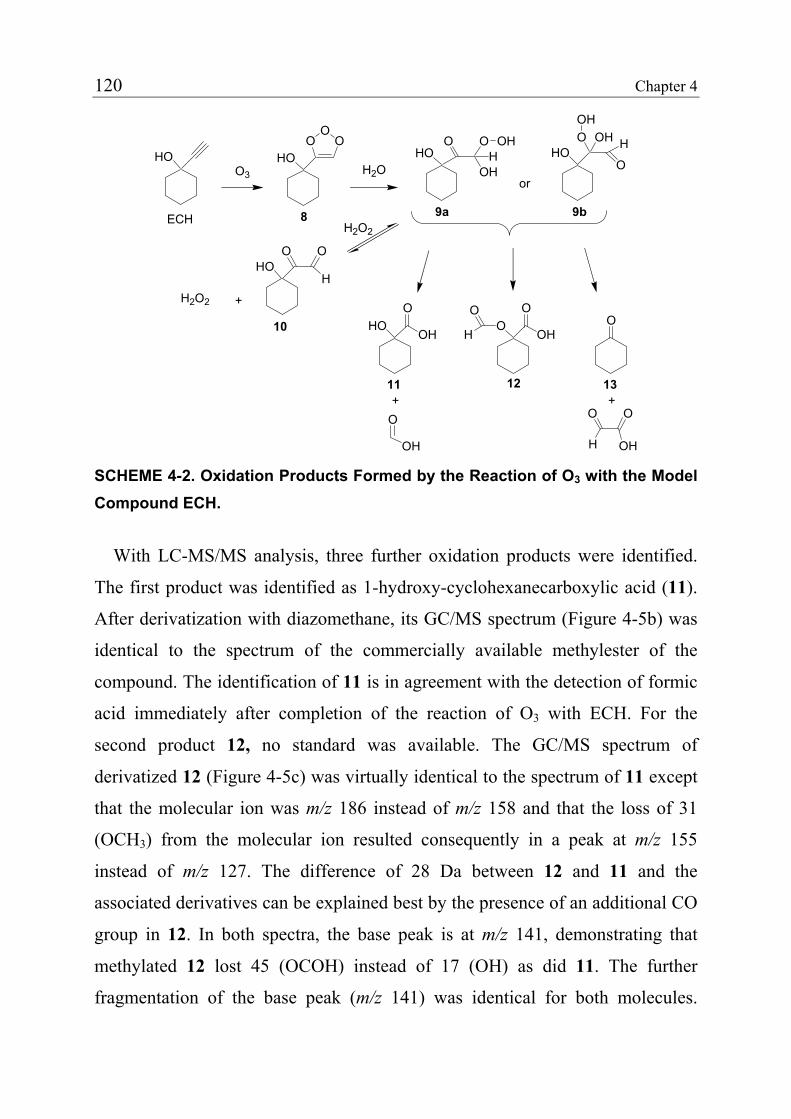
120 Chapter 4
HOOOH
OH
O
HHO
O O OH
OHH
H2OHO
OO
O
O3
HOO O
HH2O2
OO
OH
O
HO
O
OH
O
H
HO
HOO
OH
O
OH
or
+
+
+
H2O2ECH 8 9a 9b
10
11 12 13
SCHEME 4-2. Oxidation Products Formed by the Reaction of O3 with the Model Compound ECH.
With LC-MS/MS analysis, three further oxidation products were identified.
The first product was identified as 1-hydroxy-cyclohexanecarboxylic acid (11).
After derivatization with diazomethane, its GC/MS spectrum (Figure 4-5b) was
identical to the spectrum of the commercially available methylester of the
compound. The identification of 11 is in agreement with the detection of formic
acid immediately after completion of the reaction of O3 with ECH. For the
second product 12, no standard was available. The GC/MS spectrum of
derivatized 12 (Figure 4-5c) was virtually identical to the spectrum of 11 except
that the molecular ion was m/z 186 instead of m/z 158 and that the loss of 31
(OCH3) from the molecular ion resulted consequently in a peak at m/z 155
instead of m/z 127. The difference of 28 Da between 12 and 11 and the
associated derivatives can be explained best by the presence of an additional CO
group in 12. In both spectra, the base peak is at m/z 141, demonstrating that
methylated 12 lost 45 (OCOH) instead of 17 (OH) as did 11. The further
fragmentation of the base peak (m/z 141) was identical for both molecules.
Removal of Estrogenicity and Product Formation during Ozonation of Ethinylestradiol 121
Obviously, the CO group has to be attached to the tertiary alcohol group.
Additionally, it could be shown with LC/MS that 12 hydrolyzes at pH 12 to 11.
The third oxidation product was identified as cyclohexanone (13) using an
authentic standard for LC-MS/MS analysis. Due to analytical problems, the
formation of glyoxylic acid, which should be produced in an equivalent amount,
could not be confirmed.
Product 10 was not detected with LC-MS/MS analysis. Because H2O2 was not
destroyed in the samples and the formation of 10 from the
hydroxyhydroperoxides 9a and/or 9b is a reversible process, 10 was slowly
converted into 11, 12, and 13 during sample storage. The half-life time for 10 is
estimated to be < 40 h for 1 mM H2O2 at pH 7 (kobserved = 5-7 M-1 s-1 at pH 10 and
20 °C). At pH 12 the base-catalyzed reaction of 10 with H2O2 yielded less than
30% formic acid, indicating that 12 and not 11 or 13 is the major product
(glyoxylic acid quickly decomposes to formic acid under these conditions). The
slow conversion of a very similar keto aldehyde into the corresponding formate
by Baeyer-Villiger-type oxidation in aqueous solution has already been reported
in (33). In the absence of H2O2, 10 seems to be fairly stable. A degradation
product of hydrocortisone with a moiety analogous to 10 exhibited a half-life
>40 d at pH 8 for base-catalyzed degradation (34). Therefore, 10 might be a
more important product than 12 under realistic treatment conditions where H2O2
concentrations are significantly lower.
4.3.7 Quantification of Product Formation
The formation of adipic acid (6) could be quantified with LC-MS/MS,
because an authentic standard was available. Product 6 accounted for up to 24%
of THN transformed during ozonation. The second THN product 7 could not be
quantified.
122 Chapter 4
Based on measurements of H2O2 and formic acid, ozonation of ECH yielded
65% 10 and 20% 11. Cyclohexanone (13) accounted for 15%. This compound
was quantified with LC-MS/MS, and the result might have been influenced by
the storage time. Ozonation of the similar ethinyl compound 2-methyl-3-butyn-
2-ol yielded 25% α-hydroxyisobutyric acid at pH 7. This reaction is equivalent
to the formation of 11 from ECH, and the 25% yield agrees with the yield
determined for 11. The mass balance for ECH seems complete whereas for THN
the identified products probably do not account for more than 50% of THN
transformed.
4.3.8 Oxidation Products of EE2
Table 4-1 lists the oxidation products of EE2 which were derived from the
oxidation products of the model compounds detected with LC-MS/MS. Five out
of six possible oxidation products of EE2 could also be detected with LC-
MS/MS. Product 18 (Table 4-1) could not be unambiguously assigned to a peak
of the LC/MS chromatogram due to interferences with fragment ions from other
products. Table 4-2 reports the major mass fragments of the MS/MS spectra
recorded in the negative mode. The suggested structures of the oxidation
products are supported by the loss of characteristic masses depending on the
functional groups present in the molecules. Molecule 14 (Table 4-1) primarily
lost 44 Da (CO2) as did the model-compound product adipic acid (6). In the
negative mode, the loss of CO2 is typical for carboxylic acids (24). In contrast,
the α-hydroxy acid 17 lost 46 Da (CH2O2) instead of 44 Da. The same behavior
was observed for the model-compound products 7 and 11. As mentioned earlier,
the loss of 46 Da seems to be characteristic for α or β-hydroxy acids (25).
Product 15, which has two conventional carboxyl groups and one α-hydroxy
acid group, lost 46 Da but not 44 Da. However, the loss of 62 Da (CO2+H2O)
indicated the presence of the two conventional carboxyl groups, because the
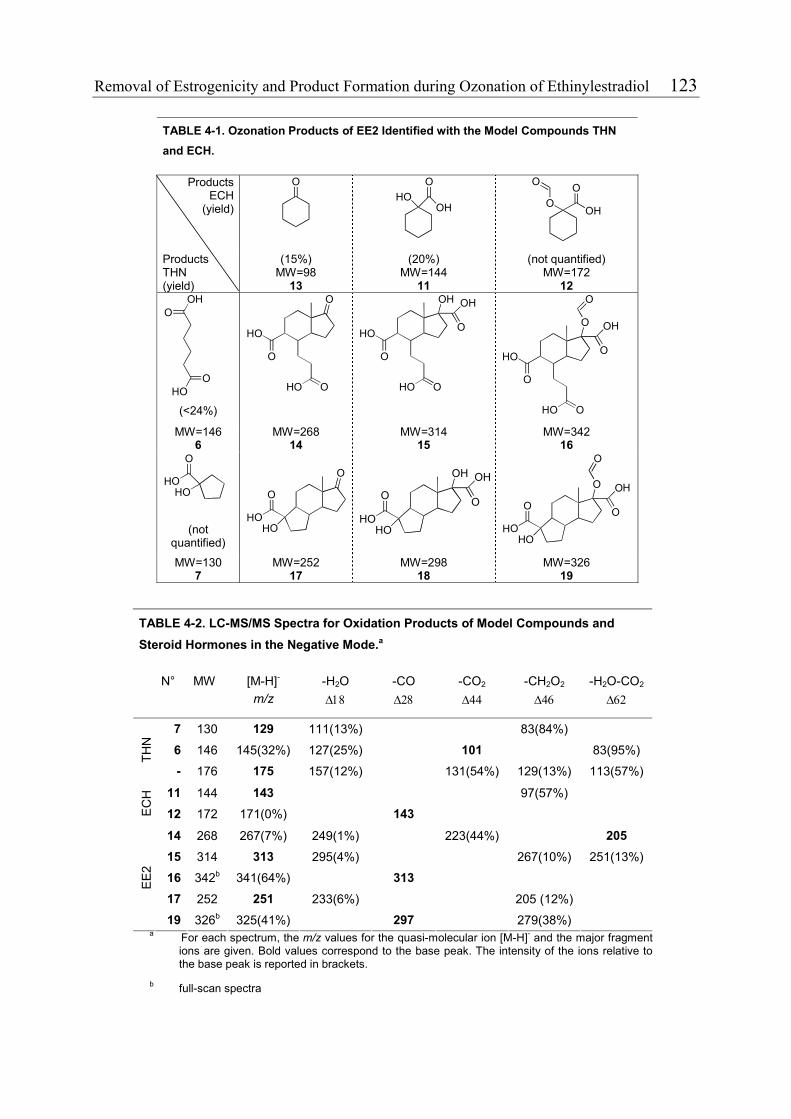
Removal of Estrogenicity and Product Formation during Ozonation of Ethinylestradiol 123
TABLE 4-1. Ozonation Products of EE2 Identified with the Model Compounds THN and ECH.
ProductsECH
(yield)
O
HOO
OH
O
O O
OH
Products THN (yield)
(15%) MW=98
13
(20%) MW=144
11
(not quantified) MW=172
12
OOH
OHO
(<24%)
O
HO
O
HO O
OH
HO
O
HO O
O
OH
O
HO
O
HO O
O
OH
O
MW=146
6 MW=268
14 MW=314
15 MW=342
16
HO
O
HO
(not
quantified)
O
HOHO
O
OH
O
HOHO
O
OH
O
O
HOHO
O
OH
O
MW=130 7
MW=252 17
MW=298 18
MW=326 19
TABLE 4-2. LC-MS/MS Spectra for Oxidation Products of Model Compounds and Steroid Hormones in the Negative Mode.a
N° MW [M-H]- m/z
-H2O ∆18
-CO ∆28
-CO2 ∆44
-CH2O2 ∆46
-H2O-CO2 ∆62
7 130 129 111(13%) 83(84%)
6 146 145(32%) 127(25%) 101 83(95%) THN
- 176 175 157(12%) 131(54%) 129(13%) 113(57%)
11 144 143 97(57%)
ECH
12 172 171(0%) 143
14 268 267(7%) 249(1%) 223(44%) 205 15 314 313 295(4%) 267(10%) 251(13%)
16 342b 341(64%) 313
17 252 251 233(6%) 205 (12%)
EE2
19 326b 325(41%) 297 279(38%) a For each spectrum, the m/z values for the quasi-molecular ion [M-H]- and the major fragment
ions are given. Bold values correspond to the base peak. The intensity of the ions relative to the base peak is reported in brackets.
b full-scan spectra
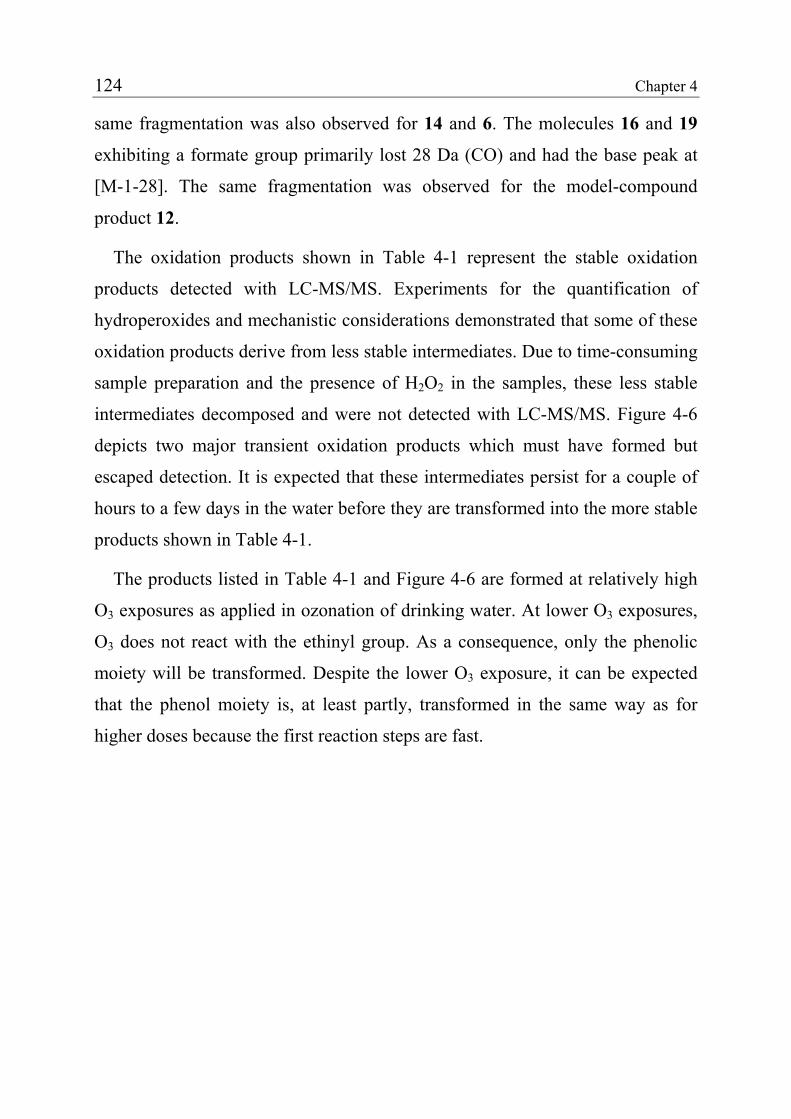
124 Chapter 4
same fragmentation was also observed for 14 and 6. The molecules 16 and 19
exhibiting a formate group primarily lost 28 Da (CO) and had the base peak at
[M-1-28]. The same fragmentation was observed for the model-compound
product 12.
The oxidation products shown in Table 4-1 represent the stable oxidation
products detected with LC-MS/MS. Experiments for the quantification of
hydroperoxides and mechanistic considerations demonstrated that some of these
oxidation products derive from less stable intermediates. Due to time-consuming
sample preparation and the presence of H2O2 in the samples, these less stable
intermediates decomposed and were not detected with LC-MS/MS. Figure 4-6
depicts two major transient oxidation products which must have formed but
escaped detection. It is expected that these intermediates persist for a couple of
hours to a few days in the water before they are transformed into the more stable
products shown in Table 4-1.
The products listed in Table 4-1 and Figure 4-6 are formed at relatively high
O3 exposures as applied in ozonation of drinking water. At lower O3 exposures,
O3 does not react with the ethinyl group. As a consequence, only the phenolic
moiety will be transformed. Despite the lower O3 exposure, it can be expected
that the phenol moiety is, at least partly, transformed in the same way as for
higher doses because the first reaction steps are fast.
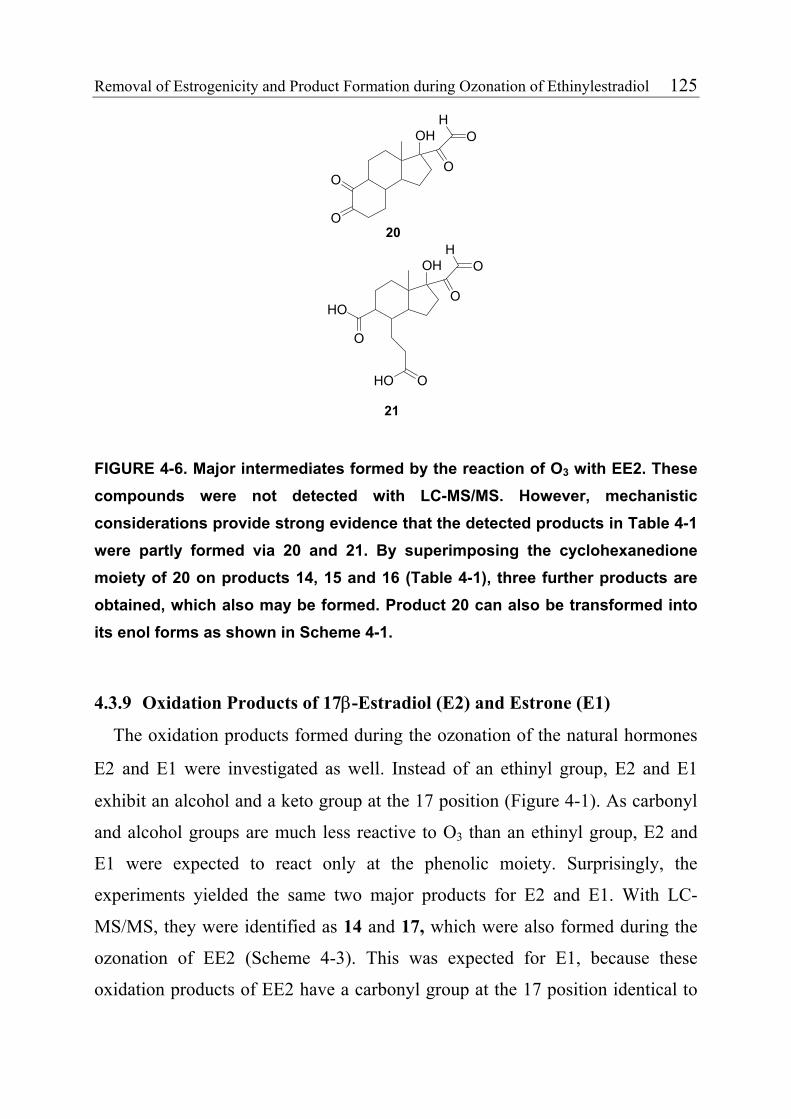
Removal of Estrogenicity and Product Formation during Ozonation of Ethinylestradiol 125
O
O
OH
O
OH
OH
O
OH
O
HO
OHO
20
21
FIGURE 4-6. Major intermediates formed by the reaction of O3 with EE2. These compounds were not detected with LC-MS/MS. However, mechanistic considerations provide strong evidence that the detected products in Table 4-1 were partly formed via 20 and 21. By superimposing the cyclohexanedione moiety of 20 on products 14, 15 and 16 (Table 4-1), three further products are obtained, which also may be formed. Product 20 can also be transformed into its enol forms as shown in Scheme 4-1.
4.3.9 Oxidation Products of 17β-Estradiol (E2) and Estrone (E1)
The oxidation products formed during the ozonation of the natural hormones
Ε2 and E1 were investigated as well. Instead of an ethinyl group, E2 and E1
exhibit an alcohol and a keto group at the 17 position (Figure 4-1). As carbonyl
and alcohol groups are much less reactive to O3 than an ethinyl group, E2 and
E1 were expected to react only at the phenolic moiety. Surprisingly, the
experiments yielded the same two major products for E2 and E1. With LC-
MS/MS, they were identified as 14 and 17, which were also formed during the
ozonation of EE2 (Scheme 4-3). This was expected for E1, because these
oxidation products of EE2 have a carbonyl group at the 17 position identical to
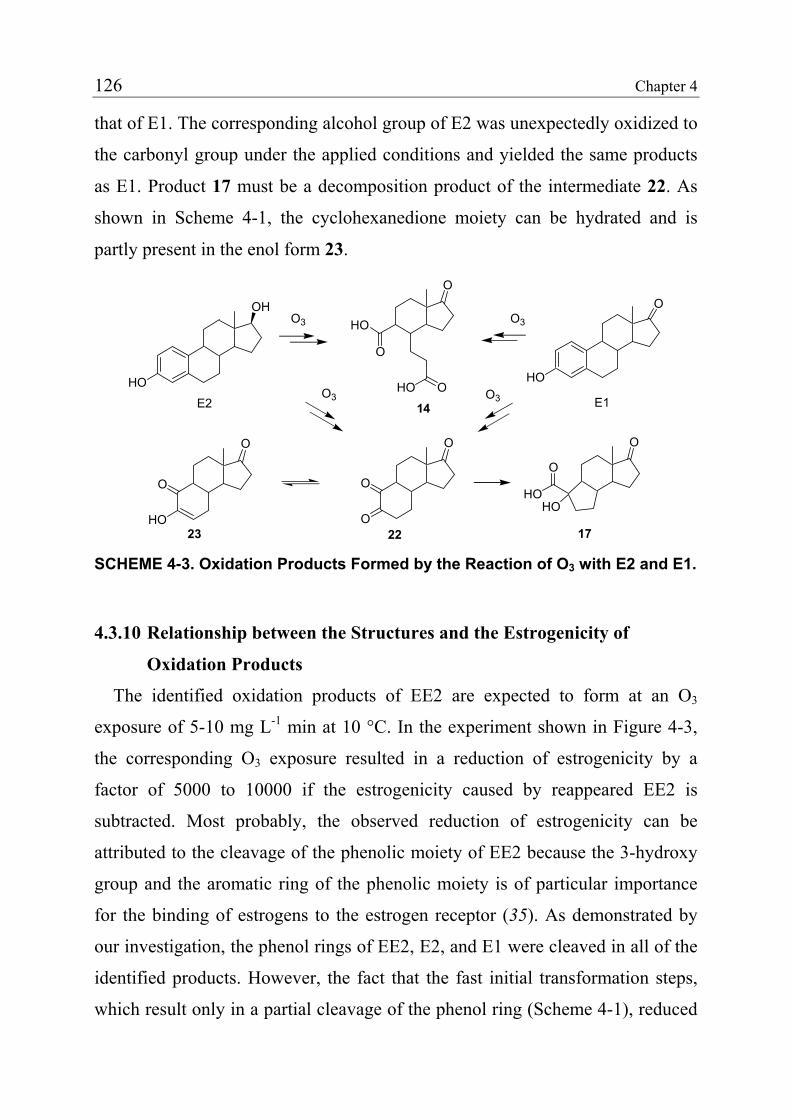
126 Chapter 4
that of E1. The corresponding alcohol group of E2 was unexpectedly oxidized to
the carbonyl group under the applied conditions and yielded the same products
as E1. Product 17 must be a decomposition product of the intermediate 22. As
shown in Scheme 4-1, the cyclohexanedione moiety can be hydrated and is
partly present in the enol form 23.
HO
OHO3
O
HO
O
HO O
O
O
HO
O3
O
O
O
HO
O
O
HOHO
O
E2 14
17
E1O3 O3
23 22
SCHEME 4-3. Oxidation Products Formed by the Reaction of O3 with E2 and E1.
4.3.10 Relationship between the Structures and the Estrogenicity of
Oxidation Products
The identified oxidation products of EE2 are expected to form at an O3
exposure of 5-10 mg L-1 min at 10 °C. In the experiment shown in Figure 4-3,
the corresponding O3 exposure resulted in a reduction of estrogenicity by a
factor of 5000 to 10000 if the estrogenicity caused by reappeared EE2 is
subtracted. Most probably, the observed reduction of estrogenicity can be
attributed to the cleavage of the phenolic moiety of EE2 because the 3-hydroxy
group and the aromatic ring of the phenolic moiety is of particular importance
for the binding of estrogens to the estrogen receptor (35). As demonstrated by
our investigation, the phenol rings of EE2, E2, and E1 were cleaved in all of the
identified products. However, the fact that the fast initial transformation steps,
which result only in a partial cleavage of the phenol ring (Scheme 4-1), reduced
Removal of Estrogenicity and Product Formation during Ozonation of Ethinylestradiol 127
the estrogenicity by a factor of 200-500 indicates that only small modifications
of the phenol ring may be required to reduce the estrogenicity of EE2
substantially. Overall, the present study provides direct evidence that the
selective oxidation of the phenolic moiety efficiently reduces the estrogenicity
of EE2-containing solutions.
For the first time, the oxidation of a pharmaceutical compound during
ozonation has been investigated in a comprehensive manner, including oxidation
kinetics, product formation, and the pharmacological effects of the oxidation
products. The results demonstrate that O3 doses applied for the disinfection of
drinking water can efficiently remove EE2, E2, and E1 and the estrogenicity
associated with their presence in the water. Due to the selective oxidation of
estrogens by O3, ozonation is also a promising tool for the control of
estrogenicity in effluents of sewage treatment plants. This has already been
confirmed by ozonation experiments with a pilot plant, which was operated with
real wastewater (36). When the disinfection of wastewater is a legal
requirement, ozonation, therefore, may be a viable alternative to other
disinfection processes.
Acknowledgments
We thank the following persons for their assistance: Werner Angst, Matthias
Bonerz, Nadine Bramaz, Derek McDowell, Beate Escher, Nadine Hermann,
Barbara Rutishauser, Lisa Sahli, René Schoenenberger, Marc Suter, Daniel
Sutter, and Mischa Zschokke. We also thank the ESWE Institute, Wiesbaden,
Germany, where a significant part of this work was performed. This study was
performed within the framework of POSEIDON, European Union project
EVK1-CT-2000-00047. Financial support by BBW (Bundesamt für Bildung und
Wissenschaft) is gratefully acknowledged.
128 Chapter 4
4.4 References
(1) Ternes, T. A.: Occurrence of drugs in German sewage treatment plants and rivers, Water Res. 1998, 32, 3245-3260.
(2) Kolpin, D. W.; Furlong, E. T.; Meyer, M. T.; Thurman, E. M.; Zaugg, S. D.; Barber, L. B.; Buxton, H. T.: Pharmaceuticals, hormones, and other organic wastewater contaminants in U.S. streams, 1999-2000: a national reconnaissance, Environ. Sci. Technol. 2002, 36, 1202-1211.
(3) Heberer, T.: Occurrence, fate, and removal of pharmaceutical residues in the aquatic environment: a review of recent research data, Toxicol. Lett. 2002, 131, 5-17.
(4) Ternes, T. A.; Meisenheimer, M.; McDowell, D.; Sacher, F.; Brauch, H.-J.; Haist- Gulde, B.; Preuss, G.; Wilme, U.; Zullei-Seibert, N.: Removal of pharmaceuticals during drinking water treatment, Environ. Sci. Technol. 2002, 36, 3855-3863.
(5) Huber, M. M.; Canonica, S.; Park, G.-Y.; von Gunten, U.: Oxidation of pharmaceuticals during ozonation and advanced oxidation processes, Environ. Sci. Technol. 2003, 37, 1016-1024.
(6) Ternes, T. A.; Stüber, J.; Herrmann, N.; McDowell, D.; Ried, A.; Kampmann, M.; Teiser, B.: Ozonation: a tool for removal of pharmaceuticals, contrast media and musk fragrances from wastewater?, Water Res. 2003, 37, 1976-1982.
(7) Andreozzi, R.; Caprio, V.; Marotta, R.; Vogna, D.: Paracetamol oxidation from aqueous solutions by means of ozonation and H2O2/UV system, Water Res. 2003, 37, 993-1004.
(8) McDowell, D.; Huber, M. M.; Wagner, M.; von Gunten, U.; Ternes, T. A.: Ozonation of carbamazepine in drinking water: identification and kinetic study of major oxidation products, Environ. Sci. Technol. 2004, in preparation.
(9) Purdom, C. E.; Haridman, P. A.; Bye, V. J.; Eno, N.; Tyler, C. R.; Sumpter, J. P.: Estrogenic effects of effluents from sewage treatment works, Chem. Ecol. 1994, 8, 275.
(10) Ternes, T. A.; Stumpf, M.; Mueller, J.; Haberer, K.; Wilken, R.-D.; Servos, M.: Behaviour and occurrence of estrogens in municipal sewage plants - 1. Investigations in Germany, Canada and Brazil, Sci. Total Environ. 1999, 225, 81-90.
(11) Thorpe, K. L.; Cummings, R. I.; Huchtinson, T. H.; Scholze, M.; Brighty, G.; Sumpter, J. P.; Tyler, C. R.: Relative potencies and combination effects of steroidal estrogens in fish, Environ. Sci. Technol. 2003, 37, 1142-1149.
(12) Johnson, A. C.; Sumpter, J. P.: Removal of endocrine-disrupting chemicals in activated sludge treatment works, Environ. Sci. Technol. 2001, 35, 4697-4703.
(13) Routledge, E. J.; Sumpter, J. P.: Estrogenic activity of surfactants and some of their degradation products assessed using a recombinant yeast screen, Environ. Toxicol. Chem. 1996, 15, 241-248.
Removal of Estrogenicity and Product Formation during Ozonation of Ethinylestradiol 129
(14) Elovitz, M. S.; von Gunten, U.: Hydroxyl radical/ozone ratios during ozonation processes. I. The Rct Concept, Ozone Sci. Eng. 1999, 21, 239-260.
(15) Bader, H.; Hoigné, J.: Determination of ozone in water by the Indigo method, Water Res. 1981, 15, 449-456.
(16) Flyunt, R.; Leitzke, A.; von Sonntag, C.: Characterisation and quantitative determination of (hydro)peroxides formed in the radiolysis of dioxygen-containing systems and upon ozonolysis, Radiat. Phys. Chem. 2003, 67, 469-473.
(17) Kuo, C.-Y.: Improved application of ion chromatographic determination of carboxylic acids in ozonated drinking water, J. Chromatogr. A 1998, 804, 265-272.
(18) Hoigné, J.; Bader, H.: Characterization of water quality criteria for ozonation processes. Part II: lifetime of added ozone, Ozone Sci. Eng. 1994, 16, 121-134.
(19) Hoigné, J.; Bader, H.: Rate constants of reactions of ozone with organic and inorganic compounds in water - II Dissociating organic compounds, Water Res. 1983, 17.
(20) Mvula, E.; von Sonntag, C.: Ozonolysis of phenols in aqueous solution, Org. Biomol. Chem. 2003, 1, 1749-1756.
(21) Blair, R. M.; Fang, H.; Branham, W. S.; Hass, B. A.; Dial, S. L.; Moland, C. L.; Tong, W.; Shi, L.; Perkins, R.; Sheehan, D. M.: The estrogen receptor relative binding affinities of 188 natural and xenochemicals: structural diversity of ligands, Toxicol. Sci. 2000, 54, 138-153.
(22) von Gunten, U.: Ozonation of drinking water: Part II. Disinfection and by-product formation in presence of bromide, iodide and chlorine, Water Res. 2003, 37, 1469- 1487.
(23) d'Alessandro, N.; Bianchi, G.; Fang, X.; Jin, F.; Schuchmann, H.-P.; von Sonntag, C.: Reaction of superoxide with phenoxyl-type radicals, J. Chem. Soc., Perkin Trans. 2 2000, 1862-1867.
(24) Frauendorf, H.; Herzschuh, R.: Application of high-performance liquid chromatography/electrospray mass spectrometry for identification of carboxylic acids containing several carboxyl groups from aqueous solutions, Eur. Mass Spectrom. 1998, 4, 269-278.
(25) Kerwin, J. L.; Torvik, J. J.: Identification of monohydroxy fatty acids by electrospray mass spectrometry and tandem mass spectrometry, Anal. Biochem. 1996, 237, 56-64.
(26) Zvilichovsky, G.; Zvilichovsky, B.: Ozonolysis, In The Chemistry of Hydroxyl, Ether and Peroxide Groups; Patai, S., Ed.; John Wiley & Sons Ltd.: Chichester, 1993; Vol. 2, pp 687-784.
(27) Plesnicar, B.: Polar reaction mechanisms involving peroxides in solution, In The chemistry of peroxides; Patai, S., Ed.; John Wilex and Sons Ltd: Chichester, 1983; pp 521-584.
(28) Bakule, R.; Long, F. A.: Keto-enol transformation of 1,2-cyclohexanedione. I. Hydration and keto-enol equilibria J. Am. Chem. Soc. 1963, 85, 2309-2312.
130 Chapter 4
(29) Selman, S.; Estham, J.: Benzilic acid and related rearrangements, Q. Rev. Chem. Soc. 1960, 14, 221-235.
(30) Wendler, N. L.; Taub, D.; Graber, R. P.: Group transfer and ring contraction phenomena in the D-homosteroid series, Tetrahedron 1959, 7, 173-184.
(31) Schwarzenbach, G.; Wittwer, C.: Ueber das Keto-Enol-Gleichgewicht bei cyclischen Diketonen, Helv. Chim. Acta 1947, 30, 663-669.
(32) Dowideit, P.; von Sonntag, C.: Reaction of ozone with ethene and its methyl- and chlorine-substituted derivatives in aqueous solution, Environ. Sci. Technol. 1998, 32, 1112-1119.
(33) Conrow, R. E.; Dillow, G. W.; Bian, L.; Xue, L.; Papadopoulou, O.; Baker, J. K.; Scott, B. S.: Corticosteroid decomposition via a mixed anhydride, J. Org. Chem. 2002, 67, 6835-6836.
(34) Bundgaard, H.; Hansen, J.: Studies on the stability of corticosteroids, Arch. Pharm. Chemi 1980, 87, 995-1013.
(35) Anstead, G. M.; Carlson, K. E.; Katzenellenbogen, J. A.: The estradiol pharmacophore: Ligand structure-estrogen receptor binding affinity relationships and a model for the receptor binding site, Steroids 1997, 62, 268-303.
(36) Ternes, T. A.; Bonerz, M.; Herrmann, N.; Ried, A.; Teiser, B. Envirpharma - European conference on human and veterinary pharmaceuticals in the environment. Lyon, France, 2003. http://www.envirpharma.org
5
Oxidation of Pharmaceuticals during Ozonation of Wastewater Effluents: A Pilot Study
Huber, M. M.; Göbel, A.; Joss, A.; et al. Environ. Sci. Technol. 2004,
submitted.
132 Chapter 5
Abstract
To reduce the release of pharmaceuticals and endocrine disruptors into the
aquatic environment or to remove them from wastewater intended for direct or
indirect reuse, the application of advanced wastewater treatment may be
required. In the present study, municipal wastewater effluents were treated with
ozone (O3) in a pilot-scale plant consisting of 2 bubble columns. The
investigated effluents, which varied in suspended solids concentrations,
comprised an effluent of conventional activated sludge treatment (CAS), the
same effluent dosed with 15 mgTSS L-1 (CAS+SS), and the effluent of a
membrane bioreactor pilot plant (MBR). Selected classes of pharmaceuticals
were spiked to the wastewater at levels ranging from 0.5–5 µg L-1. Samples
taken at the inlet and the outlet of the pilot plant were analyzed with LC-
electrospray tandem MS. Macrolide and sulfonamide antibiotics, estrogens, and
the acidic pharmaceuticals diclofenac, naproxen and indomethacin were
oxidized by more than 90-99% for O3 doses ≥2 mg L-1 in all effluents. X-ray
contrast media and a few acidic pharmaceuticals were only partly oxidized, but
no significant differences were observed among the three effluents. These results
show that many pharmaceuticals present in wastewater can be efficiently
oxidized with O3 and that suspended solids have only a minor influence on the
oxidation efficiency of nonsorbing micropollutants.
Oxidation of Pharmaceuticals during Ozonation of Municipal Wastewater Effluents 133
5.1 Introduction
In recent years, various studies have reported the occurrence of a large
number of pharmaceuticals in the aquatic environment (1-3). Even though the
detected concentration levels are typically in the nanogram/L to microgram/L
range, it cannot be excluded that molecules designed to be biologically active
affect sensitive aquatic organisms even at such low concentrations. Furthermore,
the large number of pharmaceuticals and other micropollutants that are
particularly present in surface waters could produce additive effects. Immediate
effects caused by pharmaceuticals may be subtle and difficult to detect, but
nevertheless could lead to important long-term consequences in aquatic
ecosystems (4).
Among the various classes of pharmaceuticals, three merit special concern:
antibiotics, pharmaceuticals acting as endocrine disruptors, and antineoplastics.
Primarily used for chemotherapy, antineoplastics are highly toxic agents which
have a high potential to affect aquatic organisms. The release of antibiotics in
the environment could promote the dissemination of antibiotic resistance,
especially in human pathogens. Endocrine disruptors in general are thought to be
responsible for feminizing and masculinizing effects observed in various
animals that live in ecosystems affected by anthropogenic pollution (5). A
prominent endocrine disrupting pharmaceutical is 17α-ethinylestradiol (EE2).
Laboratory studies have already shown that environmentally relevant
concentrations of EE2 and natural estrogens elicit estrogenic responses in fish
(6-8). Among the estrogens and estrogenic chemicals associated with the
induction of feminizing effects in fish exposed to effluents of wastewater
treatment plants (WWTPs), EE2 is likely to be of considerable importance due
to its high in vivo potency, its persistence in the environment, and its capacity to
bioaccumulate (9).
134 Chapter 5
Municipal wastewater is the major source of pharmaceuticals in the aquatic
environment (4). In developed countries, wastewater is usually treated in
WWTPs before it is discharged into receiving waters. Since it is highly
unrealistic to reduce the consumption of pharmaceuticals, the improvement of
wastewater treatment is one of the few options to diminish the release of these
compounds into the aquatic environment. Conventional activated sludge
treatment was shown to degrade pharmaceuticals to varying extents that ranged
from complete to very poor degradation (10,11). Applying longer sludge
retention times resulted generally in improved degradation, but most of the
investigated compounds could not be completely degraded. Therefore, advanced
treatment technologies have to be implemented to achieve further removal of
pharmaceuticals.
Ozonation has been shown to have a high potential for the oxidation of
pharmaceuticals in drinking water (12,13) and wastewater (14). In wastewater,
O3 doses ranging from 5 to 15 mg L-1 led to a complete disappearance of most of
the pharmaceuticals except for iodinated X-ray contrast media. For O3 doses
typically applied in water treatment, ozonation only results in partial oxidation
of pharmaceuticals and therefore could yield biologically still active oxidation
products. However, recent studies on EE2 (15) and carbamazepine (16) have
shown that partial oxidation was sufficient to significantly reduce
pharmacological activity and toxicity, respectively.
In the present study, pilot experiments were conducted to get a better
understanding of the oxidation of pharmaceuticals during ozonation of
wastewater effluent. The pilot experiments were carried out using a wastewater
with a DOC concentration representative for good quality secondary or tertiary
effluent. DOC was substantially lower compared to the wastewater investigated
in ref (14). The selected pharmaceutical classes (macrolide and sulfonamide
antibiotics, iodinated X-ray contrast media, estrogens, and 3 acidic
Oxidation of Pharmaceuticals during Ozonation of Municipal Wastewater Effluents 135
pharmaceuticals) were spiked to the wastewater to be able to determine 95-99%
removal. The major aims of the experiments were (i) to determine a minimal O3
dose required for the oxidation of pharmaceuticals exhibiting a high reactivity
toward O3, (ii) to investigate the influence of suspended solids on the oxidation
of pharmaceuticals in MBR, CAS, and CAS+SS effluents, and (iii) to assess the
feasibility of the prediction of elimination by means of suitable probe
compounds.
5.2 Experimental Section
5.2.1 Ozonation Pilot Plant
The pilot plant consisted of two columns operated in series with an active
reactor volume of 140 liter each and a filling level of 4.8 m (0.193 m nominal
inner diameter, 5.2 m total height; Figure 5-1). The first column is operated in
the downstream mode, while the second upstream. Tracer experiments with a
salt spike showed a slightly better plug flow behavior in the second column as
compared to the first (the salinity profile at the outflow of column 1 and column
2 could best be simulated modeling the reactor volume as a series of 3
respectively 4 fully mixed compartments with comparable total volume). With a
flow rate of 2 ± 0.1 m3 h-1, the total hydraulic retention time amounts to 4.2 ± 0.2
min in each column. O3 was continuously supplied by an ozone generator
(Ozomatic SWO 200) fed with oxygen and bubbled into column 1 at a gas flow
rate of 200 ± 10 L h-1. No O3 was applied to column 2. Ozone concentrations in
the feed and off gas were measured with a UV ozone monitor (BMT 936 Vent,
0.1-50 g m-3). By adjusting the power input of the ozone generator, the desired
O3 concentrations were obtained. The respective concentrations yielded
transferred O3 doses ranging from 0.5-5 mg L-1wastewater. Transfer efficiencies
were >98%.
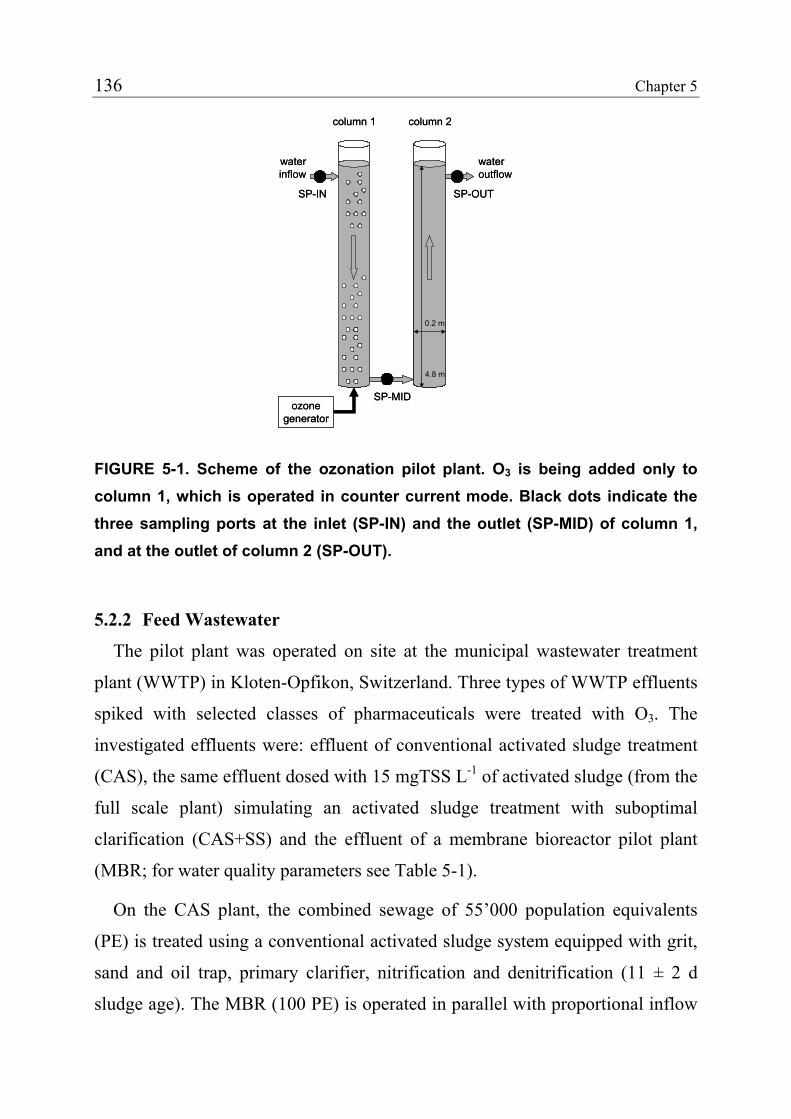
136 Chapter 5
waterinflow
wateroutflow
column 1 column 2
ozonegenerator
SP-MID
SP-OUTSP-IN
0.2 m
4.8 m
waterinflow
wateroutflow
column 1 column 2
ozonegenerator
SP-MID
SP-OUTSP-IN
0.2 m
4.8 m
FIGURE 5-1. Scheme of the ozonation pilot plant. O3 is being added only to column 1, which is operated in counter current mode. Black dots indicate the three sampling ports at the inlet (SP-IN) and the outlet (SP-MID) of column 1, and at the outlet of column 2 (SP-OUT).
5.2.2 Feed Wastewater
The pilot plant was operated on site at the municipal wastewater treatment
plant (WWTP) in Kloten-Opfikon, Switzerland. Three types of WWTP effluents
spiked with selected classes of pharmaceuticals were treated with O3. The
investigated effluents were: effluent of conventional activated sludge treatment
(CAS), the same effluent dosed with 15 mgTSS L-1 of activated sludge (from the
full scale plant) simulating an activated sludge treatment with suboptimal
clarification (CAS+SS) and the effluent of a membrane bioreactor pilot plant
(MBR; for water quality parameters see Table 5-1).
On the CAS plant, the combined sewage of 55’000 population equivalents
(PE) is treated using a conventional activated sludge system equipped with grit,
sand and oil trap, primary clarifier, nitrification and denitrification (11 ± 2 d
sludge age). The MBR (100 PE) is operated in parallel with proportional inflow
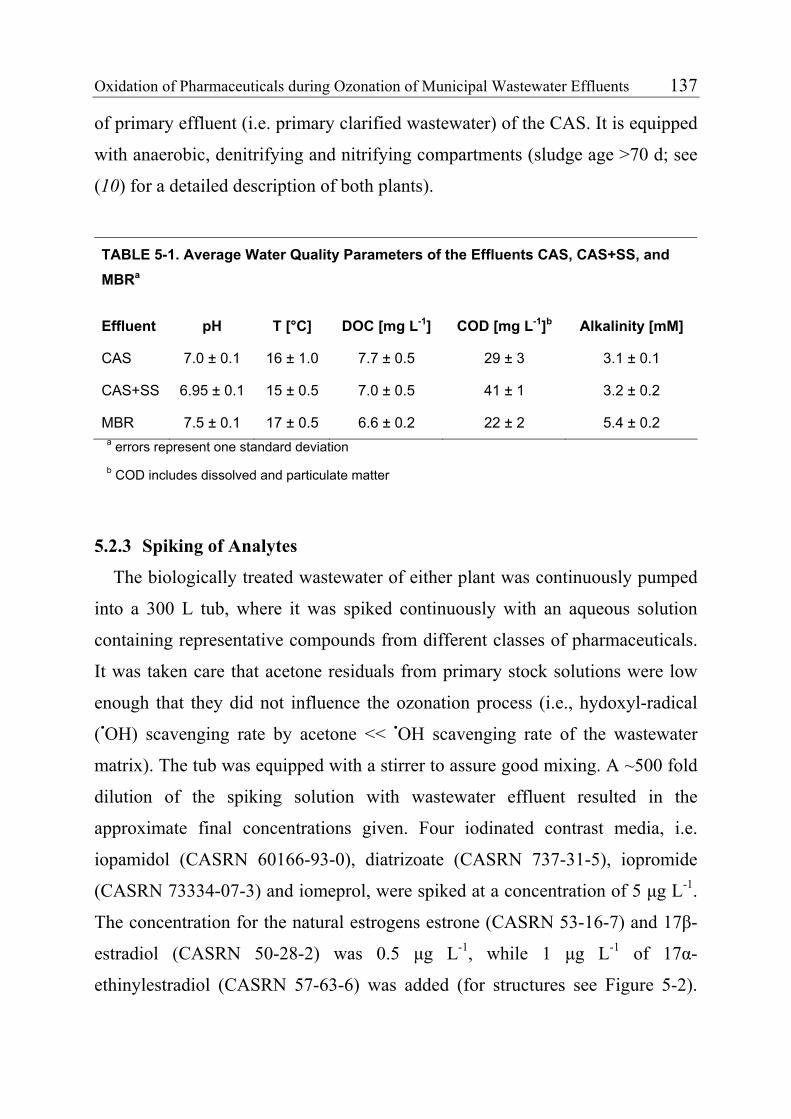
Oxidation of Pharmaceuticals during Ozonation of Municipal Wastewater Effluents 137
of primary effluent (i.e. primary clarified wastewater) of the CAS. It is equipped
with anaerobic, denitrifying and nitrifying compartments (sludge age >70 d; see
(10) for a detailed description of both plants).
TABLE 5-1. Average Water Quality Parameters of the Effluents CAS, CAS+SS, and MBRa
Effluent pH T [°C] DOC [mg L-1] COD [mg L-1]b Alkalinity [mM]
CAS 7.0 ± 0.1 16 ± 1.0 7.7 ± 0.5 29 ± 3 3.1 ± 0.1
CAS+SS 6.95 ± 0.1 15 ± 0.5 7.0 ± 0.5 41 ± 1 3.2 ± 0.2
MBR 7.5 ± 0.1 17 ± 0.5 6.6 ± 0.2 22 ± 2 5.4 ± 0.2 a errors represent one standard deviation b COD includes dissolved and particulate matter
5.2.3 Spiking of Analytes
The biologically treated wastewater of either plant was continuously pumped
into a 300 L tub, where it was spiked continuously with an aqueous solution
containing representative compounds from different classes of pharmaceuticals.
It was taken care that acetone residuals from primary stock solutions were low
enough that they did not influence the ozonation process (i.e., hydoxyl-radical
(•OH) scavenging rate by acetone << •OH scavenging rate of the wastewater
matrix). The tub was equipped with a stirrer to assure good mixing. A ~500 fold
dilution of the spiking solution with wastewater effluent resulted in the
approximate final concentrations given. Four iodinated contrast media, i.e.
iopamidol (CASRN 60166-93-0), diatrizoate (CASRN 737-31-5), iopromide
(CASRN 73334-07-3) and iomeprol, were spiked at a concentration of 5 µg L-1.
The concentration for the natural estrogens estrone (CASRN 53-16-7) and 17β-
estradiol (CASRN 50-28-2) was 0.5 µg L-1, while 1 µg L-1 of 17α-
ethinylestradiol (CASRN 57-63-6) was added (for structures see Figure 5-2).
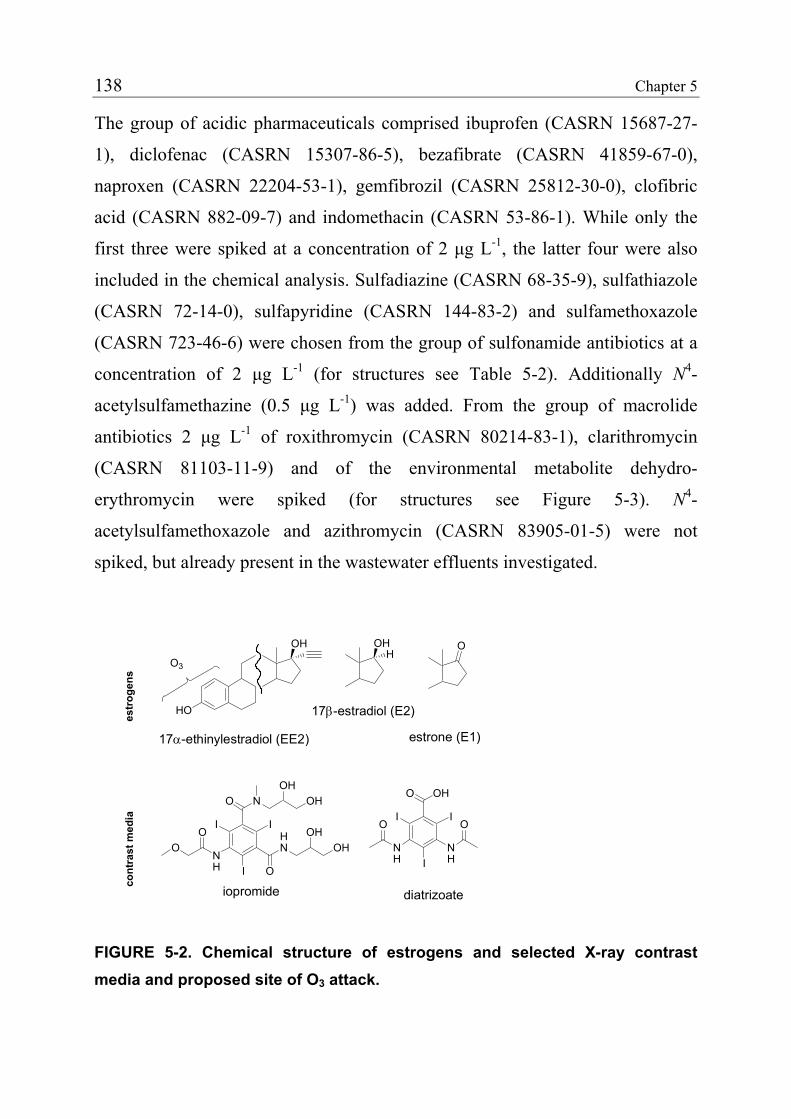
138 Chapter 5
The group of acidic pharmaceuticals comprised ibuprofen (CASRN 15687-27-
1), diclofenac (CASRN 15307-86-5), bezafibrate (CASRN 41859-67-0),
naproxen (CASRN 22204-53-1), gemfibrozil (CASRN 25812-30-0), clofibric
acid (CASRN 882-09-7) and indomethacin (CASRN 53-86-1). While only the
first three were spiked at a concentration of 2 µg L-1, the latter four were also
included in the chemical analysis. Sulfadiazine (CASRN 68-35-9), sulfathiazole
(CASRN 72-14-0), sulfapyridine (CASRN 144-83-2) and sulfamethoxazole
(CASRN 723-46-6) were chosen from the group of sulfonamide antibiotics at a
concentration of 2 µg L-1 (for structures see Table 5-2). Additionally N4-
acetylsulfamethazine (0.5 µg L-1) was added. From the group of macrolide
antibiotics 2 µg L-1 of roxithromycin (CASRN 80214-83-1), clarithromycin
(CASRN 81103-11-9) and of the environmental metabolite dehydro-
erythromycin were spiked (for structures see Figure 5-3). N4-
acetylsulfamethoxazole and azithromycin (CASRN 83905-01-5) were not
spiked, but already present in the wastewater effluents investigated.
OH
HO
O3
OHH
O
17α-ethinylestradiol (EE2)
17β-estradiol (E2)
estrone (E1)
HN OH
NH
O
N
O
O
OH
OHO OH
II
I
iopromide diatrizoate
II
INH
O
O OH
NH
O
es
trog
ens
con
tras
t med
ia
FIGURE 5-2. Chemical structure of estrogens and selected X-ray contrast media and proposed site of O3 attack.
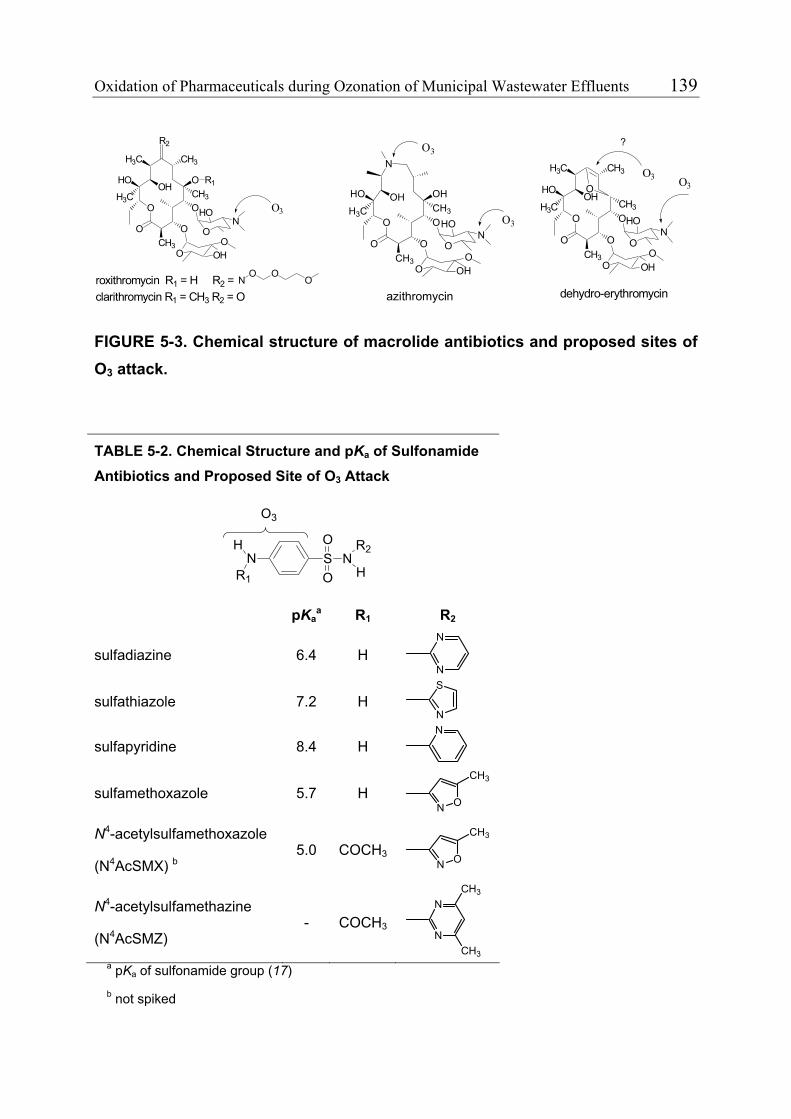
Oxidation of Pharmaceuticals during Ozonation of Municipal Wastewater Effluents 139
O
O
CH3O
O
HO OH OH
H3C
CH3
O
O OHO
NHO
N
O3
O3
azithromycin
R2
O3O
O
CH3
CH3O
O
H3C
HOOH
O
H3C
CH3
O
O OHO
NHO
R1
roxithromycin R1 = H R2 = NO O
O
clarithromycin R1 = CH3 R2 = O
O
O
CH3
CH3O
O
H3C
HOOH
H3C
CH3
O
O OHO
NHO
OO3
dehydro-erythromycin
O3
?
FIGURE 5-3. Chemical structure of macrolide antibiotics and proposed sites of O3 attack.
TABLE 5-2. Chemical Structure and pKa of Sulfonamide Antibiotics and Proposed Site of O3 Attack
N S NR2
H
O
O
H
R1
O3
pKaa R1 R2
sulfadiazine 6.4 H N
N
sulfathiazole 7.2 H N
S
sulfapyridine 8.4 H N
sulfamethoxazole 5.7 H N O
CH3
N4-acetylsulfamethoxazole
(N4AcSMX) b5.0 COCH3
N O
CH3
N4-acetylsulfamethazine
(N4AcSMZ) - COCH3
N
NCH3
CH3 a pKa of sulfonamide group (17) b not spiked
140 Chapter 5
5.2.4 Sampling and Chemical Analysis
Samples were taken from the sample port at the inflow of column 1 (SP-IN),
the sample port between the two columns (SP-MID), and at the outflow of
column 2 (SP-OUT, Figure 5-1). Concentrations of dissolved O3 were
determined in the latter two samples, using the indigo method (18). The
detection limit was 0.05 mg L-1. For the analysis of pharmaceuticals, water
samples of the inflow (SP-IN) and the outflow (SP-OUT) were enriched within
20 h after sampling using solid phase extraction. The dried cartridges were then
frozen and transported to the laboratory, where they were eluted within one
week. Filtration of the samples prior to enrichment was performed in the case of
the acidic pharmaceuticals and the iodinated contrast media. The limits of
quantification were in all cases sufficient to determine a reduction of ≥95% by
ozonation. Details on the methods used have generally been published
elsewhere, and therefore only a short description is given here (19-22).
For the iodinated contrast media 250 mL samples were adjusted to pH 2.8
and enriched on a copolymer material (ENV+, 200 mg). Detection was
performed in the electrospray positive mode (19). In the case of the acidic
pharmaceuticals the samples (250 mL inflow and 500 mL outflow) were
adjusted to pH 2 and enriched on pre-packed Oasis MCX cartridges (60 mg)
(20). Electrospray ionization in the negative ion mode was used for detection.
The selected estrogens were extracted from 250 mL inflow and 500 mL outflow
samples at pH 3 with pre-packed Isolute C18 cartridges (500mg) followed by a
silica clean-up as described by Ternes et al. 1999 (23). Electrospray ionization in
the negative ion mode was performed for the estrogens (24). For the
quantification of iodinated contrast media, acidic pharmaceuticals, and estrogens
a calibration (including SPE and further sample preparation) in local
groundwater was used with desmethoxyiopromide (CASRN 76350-28-2),
fenoprop (CASRN 93-72-1) and 17β-estradiol-17-acetate (CASRN 1743-60-8),
respectively, as surrogate standards. Separation was achieved in all cases with
Oxidation of Pharmaceuticals during Ozonation of Municipal Wastewater Effluents 141
reversed phase chromatography coupled to tandem mass spectrometry. Instead
of an API 365 tandem MS as described in (19) and (20) an API 4000 (Applied
Biosystems, Foster City, CA, USA) was used for detection, maintaining most
crucial method parameters such as the MRM transitions.
For the analysis of antibiotics, 100 mL of inflow and 250 mL of outflow were
taken (n = 2), adjusted to pH 4, and enriched unfiltered using solid phase
extraction on Oasis HLB polymeric cartridges (22). Measurement was
performed using reversed-phase liquid chromatography coupled to electrospray
positive tandem mass spectrometry (TSQ Quantum Discovery, Thermo
Finnigan, San Jose, CA, USA). Quantification was performed using an external
calibration curve in de-ionized water. Results were corrected by relative
recovery rates determined in the same experiment and sample matrix (n = 2-4).
The relative recovery for N4-acetylsulfamethoxazole was set to 100%. The
following substances were used as surrogate standards: sulfamethazine-phenyl-13C6, sulfamethoxazole-d4, sulfadiazine-d4, sulfathiazole-d4, N4-
acetylsulfamethoxazole-d5 and tylosin.
5.2.5 Calculation of Relative Residuals
In general, pharmaceutical concentrations measured in the inflow agreed
reasonably well with the spiked amounts (e.g., < ±30% for sulfonamides and <
±50% for macrolides). Deviations may partly have occurred due to the presence
of respective compounds in the nonspiked wastewater. To compensate
differences in the input concentrations, the outflow concentrations are reported
as relative concentrations which were calculated dividing the concentration
measured in the outflow by the respective concentration measured in the inflow.
The resulting error was calculated by linear error propagation under the
assumption that the errors of both measurements are independent of each other.
142 Chapter 5
5.3 Results and Discussion
An overview of the results of the pilot experiments is provided in Figure 5-4.
Relative residual concentrations of iopromide, roxithromycin, sulfamethoxazole
and 17α-ethinylestradiol (EE2) representing the classes of X-ray contrast media,
macrolide antibiotics, sulfonamide antibiotics and estrogens, respectively, are
plotted as a function of O3 dosage for all three effluents. Additionally, O3
concentrations determined directly at the outlet of column 1 (SP-MID) are
given. The extent of parent compound oxidation increased with increasing O3
dosage, but great differences were observed among the different compound
classes. For iopromide and other contrast media, relative residual concentrations
>40% were measured even at the highest O3 dose. In contrast, roxithromycin,
sulfamethoxazole and EE2 were efficiently oxidized in all three effluents
(>90%) for O3 doses ≥2 mg L-1. These three compounds exhibit high second-
order rate constants for the reaction with O3 (Table 5-3). Therefore, a relatively
low O3 residual as present for O3 doses ≥2 mg L-1 is sufficient to cause the
observed loss of the parent compound. The same behavior was observed for the
rest of the investigated compounds belonging to the respective classes and for
the acidic pharmaceuticals diclofenac, naproxen and indomethacin (data not
shown).
During ozonation, micropollutants can be oxidized either by O3 directly or by
hydroxyl radicals (•OH), which are formed as a consequence of O3 decay. The
two oxidants vary strongly in their reactivity. O3 attacks very selectively certain
functional group, whereas •OH is a non-selective oxidant that reacts very fast
with a large number of moieties. Consequently, most •OH is scavenged by the
water matrix in wastewater (25). Therefore, the oxidation of compounds that
react slowly with O3 is always less efficient than for compounds that react fast
with O3, even if the rate constants for the reaction with •OH is almost diffusion
controlled. Because the direct reaction of iopromide with O3 is very slow (Table
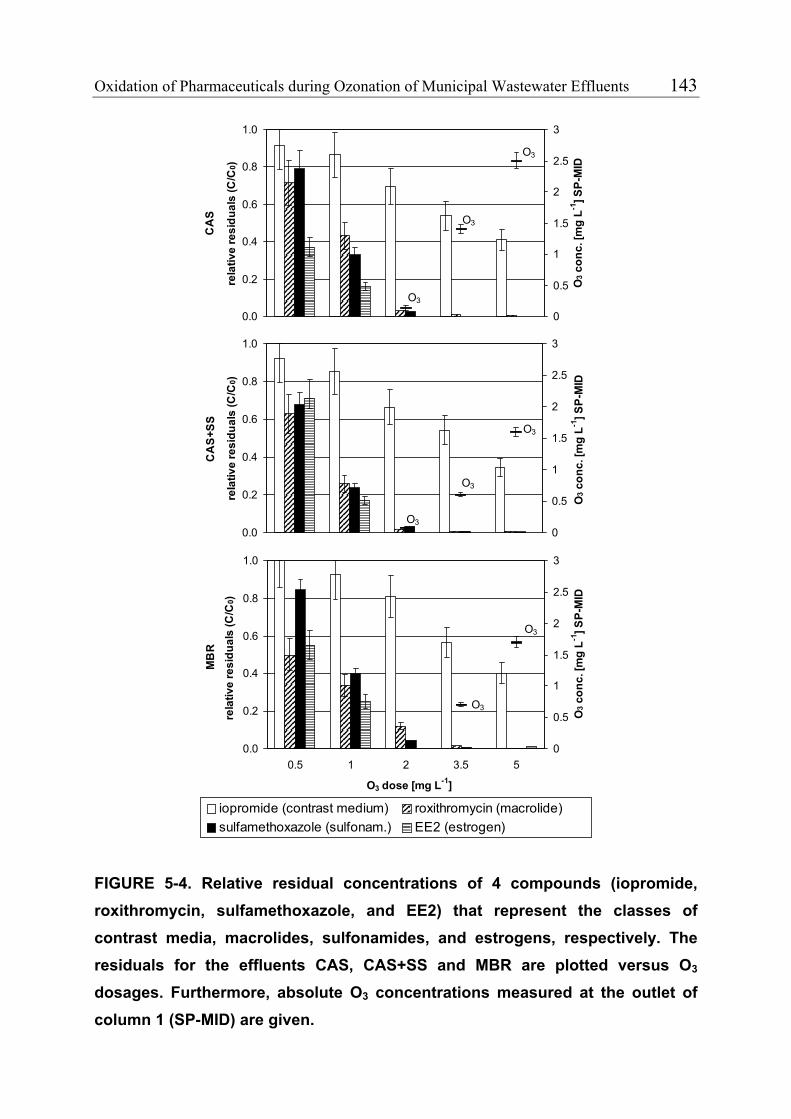
Oxidation of Pharmaceuticals during Ozonation of Municipal Wastewater Effluents 143
CA
S
0.0
0.2
0.4
0.6
0.8
1.0
0
0.5
1
1.5
2
2.5
3
O3 c
onc.
[mg
L-1] S
P-M
ID
O3
O3
O3
rela
tive
resi
dual
s (C
/C0)
CA
S+SS
0.0
0.2
0.4
0.6
0.8
1.0
0
0.5
1
1.5
2
2.5
3
O3 c
onc.
[mg
L-1] S
P-M
ID
O3
O3
O3
rela
tive
resi
dual
s (C
/C0)
MB
R
0.0
0.2
0.4
0.6
0.8
1.0
0.5 1 2 3.5 5
O3 dose [mg L-1]
0
0.5
1
1.5
2
2.5
3O
3 con
c. [m
g L-1
] SP-
MID
iopromide (contrast medium) roxithromycin (macrolide)sulfamethoxazole (sulfonam.) EE2 (estrogen)
O3
O3
rela
tive
resi
dual
s (C
/C0)
FIGURE 5-4. Relative residual concentrations of 4 compounds (iopromide, roxithromycin, sulfamethoxazole, and EE2) that represent the classes of contrast media, macrolides, sulfonamides, and estrogens, respectively. The residuals for the effluents CAS, CAS+SS and MBR are plotted versus O3
dosages. Furthermore, absolute O3 concentrations measured at the outlet of column 1 (SP-MID) are given.
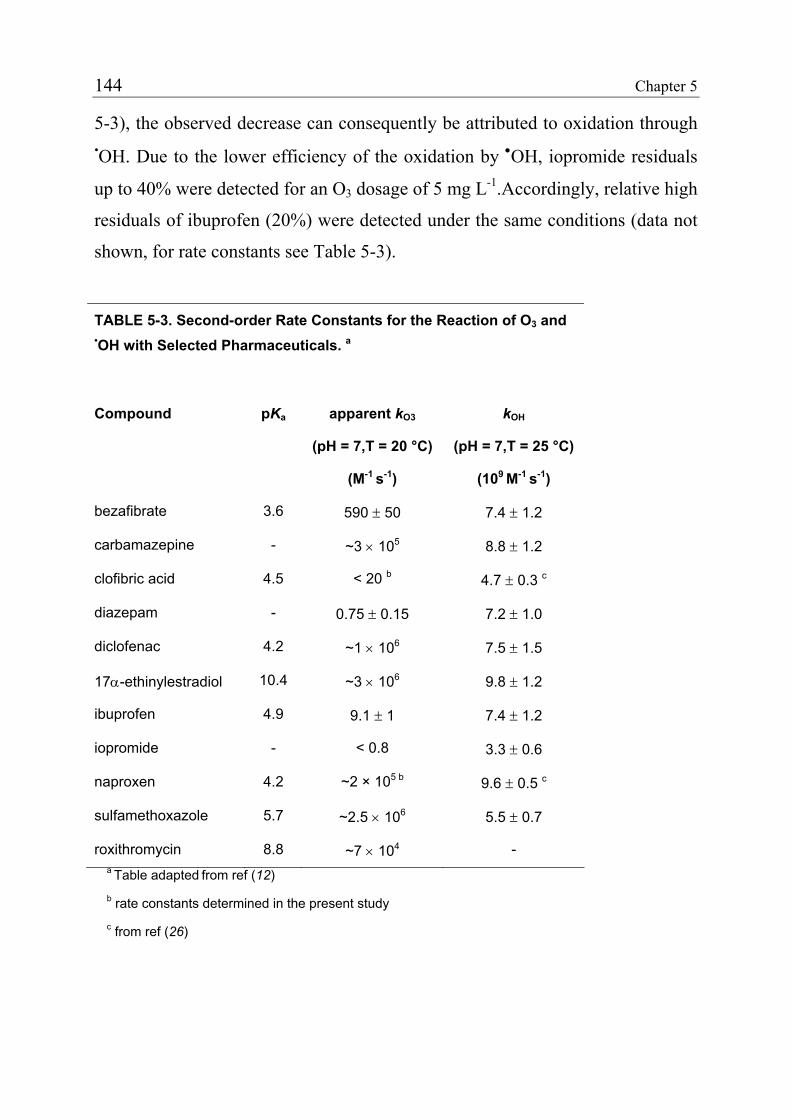
144 Chapter 5
5-3), the observed decrease can consequently be attributed to oxidation through •OH. Due to the lower efficiency of the oxidation by •OH, iopromide residuals
up to 40% were detected for an O3 dosage of 5 mg L-1.Accordingly, relative high
residuals of ibuprofen (20%) were detected under the same conditions (data not
shown, for rate constants see Table 5-3).
TABLE 5-3. Second-order Rate Constants for the Reaction of O3 and •OH with Selected Pharmaceuticals. a
Compound pKa apparent kO3
(pH = 7,T = 20 °C)
(M-1 s-1)
kOH
(pH = 7,T = 25 °C)
(109 M-1 s-1)
bezafibrate 3.6 590 ± 50 7.4 ± 1.2
carbamazepine - ~3 × 10⁵ 8.8 ± 1.2
clofibric acid 4.5 < 20 b 4.7 ± 0.3 c
diazepam - 0.75 ± 0.15 7.2 ± 1.0
diclofenac 4.2 ~1 × 10⁶ 7.5 ± 1.5
17α-ethinylestradiol 10.4 ~3 × 10⁶ 9.8 ± 1.2
ibuprofen 4.9 9.1 ± 1 7.4 ± 1.2
iopromide - < 0.8 3.3 ± 0.6
naproxen 4.2 ~2 × 10⁵ b 9.6 ± 0.5 c
sulfamethoxazole 5.7 ~2.5 × 10⁶ 5.5 ± 0.7
roxithromycin 8.8 ~7 × 10⁴ - a Table adapted from ref (12) b rate constants determined in the present study c from ref (26)
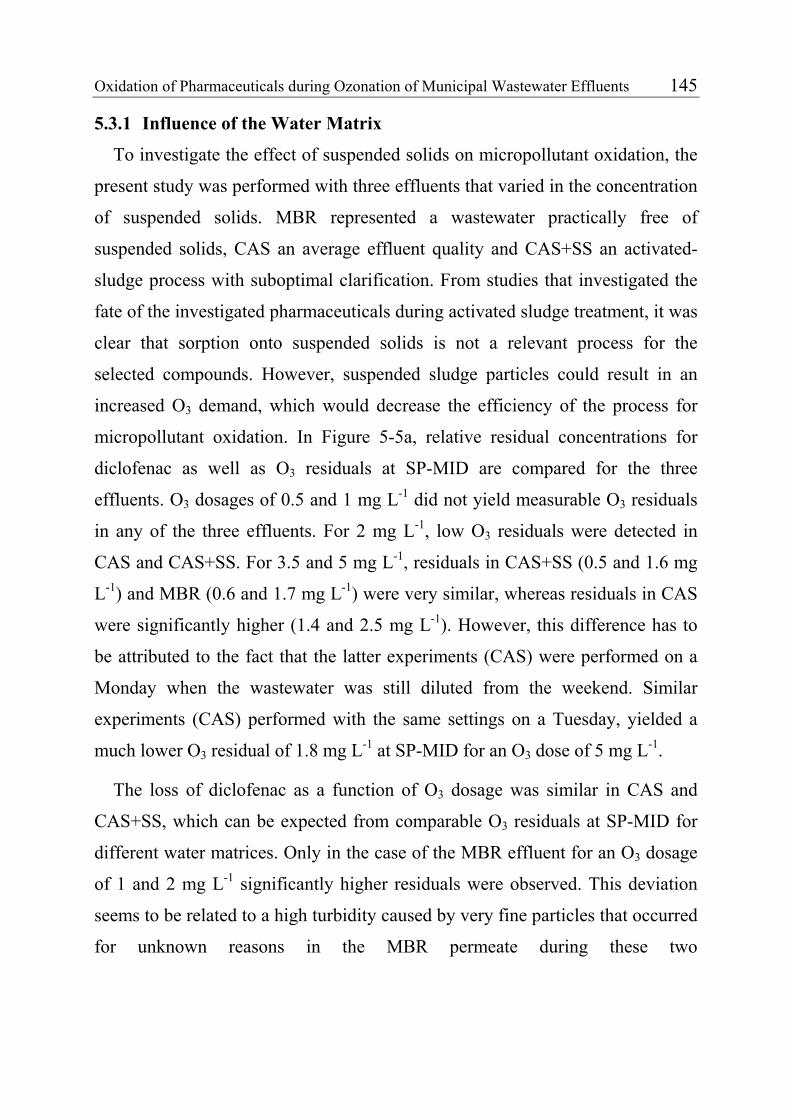
Oxidation of Pharmaceuticals during Ozonation of Municipal Wastewater Effluents 145
5.3.1 Influence of the Water Matrix
To investigate the effect of suspended solids on micropollutant oxidation, the
present study was performed with three effluents that varied in the concentration
of suspended solids. MBR represented a wastewater practically free of
suspended solids, CAS an average effluent quality and CAS+SS an activated-
sludge process with suboptimal clarification. From studies that investigated the
fate of the investigated pharmaceuticals during activated sludge treatment, it was
clear that sorption onto suspended solids is not a relevant process for the
selected compounds. However, suspended sludge particles could result in an
increased O3 demand, which would decrease the efficiency of the process for
micropollutant oxidation. In Figure 5-5a, relative residual concentrations for
diclofenac as well as O3 residuals at SP-MID are compared for the three
effluents. O3 dosages of 0.5 and 1 mg L-1 did not yield measurable O3 residuals
in any of the three effluents. For 2 mg L-1, low O3 residuals were detected in
CAS and CAS+SS. For 3.5 and 5 mg L-1, residuals in CAS+SS (0.5 and 1.6 mg
L-1) and MBR (0.6 and 1.7 mg L-1) were very similar, whereas residuals in CAS
were significantly higher (1.4 and 2.5 mg L-1). However, this difference has to
be attributed to the fact that the latter experiments (CAS) were performed on a
Monday when the wastewater was still diluted from the weekend. Similar
experiments (CAS) performed with the same settings on a Tuesday, yielded a
much lower O3 residual of 1.8 mg L-1 at SP-MID for an O3 dose of 5 mg L-1.
The loss of diclofenac as a function of O3 dosage was similar in CAS and
CAS+SS, which can be expected from comparable O3 residuals at SP-MID for
different water matrices. Only in the case of the MBR effluent for an O3 dosage
of 1 and 2 mg L-1 significantly higher residuals were observed. This deviation
seems to be related to a high turbidity caused by very fine particles that occurred
for unknown reasons in the MBR permeate during these two
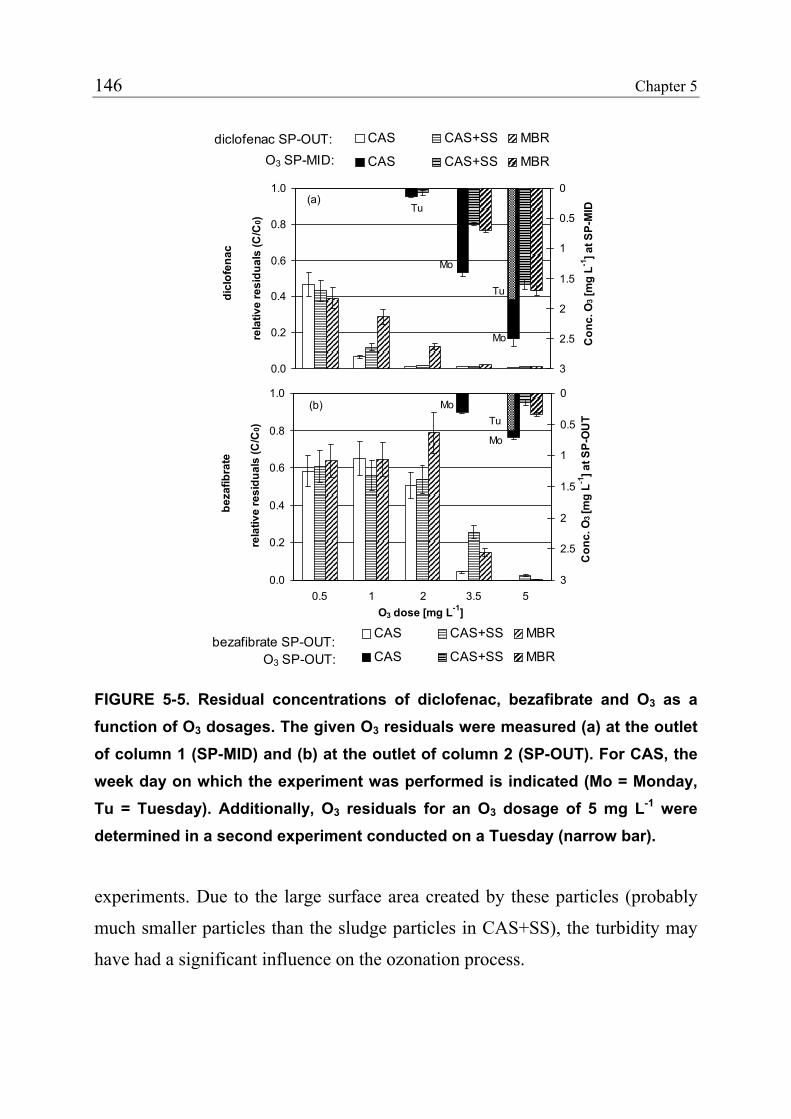
146 Chapter 5
experiments. Due to the large surface area created by these particles (probably
much smaller particles than the sludge particles in CAS+SS), the turbidity may
have had a significant influence on the ozonation process.
0.0
0.2
0.4
0.6
0.8
1.0
rela
tive
resi
dual
s (C
/C0)
0
0.5
1
1.5
2
2.5
3
Con
c. O
3 [m
g L-1
] at S
P-M
ID
CAS CAS+SS MBR
CAS CAS+SS MBR
dicl
ofen
ac
diclofenac SP-OUT:O3 SP-MID:
(a)
Mo
Mo
Tu
Tu
0.0
0.2
0.4
0.6
0.8
1.0
0.5 1 2 3.5 5O3 dose [mg L-1]
rela
tive
resi
dual
s (C
/C0)
0
0.5
1
1.5
2
2.5
3C
onc.
O3
[mg
L-1] a
t SP
-OU
T
CAS CAS+SS MBR
CAS CAS+SS MBR
beza
fibra
te
bezafibrate SP-OUT:O3 SP-OUT:
(b)Tu
Mo
Mo
FIGURE 5-5. Residual concentrations of diclofenac, bezafibrate and O3 as a function of O3 dosages. The given O3 residuals were measured (a) at the outlet of column 1 (SP-MID) and (b) at the outlet of column 2 (SP-OUT). For CAS, the week day on which the experiment was performed is indicated (Mo = Monday, Tu = Tuesday). Additionally, O3 residuals for an O3 dosage of 5 mg L-1 were determined in a second experiment conducted on a Tuesday (narrow bar).
Oxidation of Pharmaceuticals during Ozonation of Municipal Wastewater Effluents 147
Figure 5-5b depicts relative residuals of the acidic pharmaceutical bezafibrate
and O3 residuals determined at SP-OUT. Bezafibrate exhibits an intermediate
reactivity with O3. Therefore, direct reactions with O3 are not important at lower
dosages and oxidation by •OH is the predominant process. The results seem to
indicate that under these conditions (0.5-2 mg L-1 O3) the extent of parent
compound oxidation is independent of the O3 dosage. However, the deviation
might be within the standard deviation of the analytical method and is therefore
not visible. For iopromide, the extent of oxidation was slightly dosage-
dependent as shown in Figure 5-4. At O3 doses of 3.5 and 5 mg L-1, for which
significant O3 residuals are present at SP-MID, oxidation by O3 becomes
relevant. Under these conditions, the pattern of O3 residuals at SP-OUT is well
reflected by the relative bezafibrate residuals, which are lowest for high O3
residuals. The O3 residuals detected at SP-OUT seem to be influenced to some
extent by the water matrix. CAS+SS clearly yielded the lowest O3 residual. But
the fact, that the O3 residual for CAS is higher than for the particle free MBR
indicates that in this case the pH difference is more important than suspended
solids. The pH of MBR effluent was approximately 7.5 as compared to 7 for
CAS and CAS+SS. At higher pH, reactions of O3 with the water matrix and the
O3 decay caused by radical-type chains reaction are accelerated.
Considering O3 residuals at SP-MID and the results presented in Figure 5-4
and 5-5a for two antibiotics, EE2 and diclofenac, it can be concluded that
suspended solids have only a minor influence on the oxidation of compounds
that react fast with O3. Furthermore, the oxidation by •OH was not affected by
suspended solids either, as shown for bezafibrate at low O3 dosages or for
iopromide (Figure 5-4). At higher O3 dosages, however, the oxidation of
compounds with intermediate reactivity seems to be influenced to some extent
by the concentration of suspended solids and the pH due to significant
differences in O3 residuals and the associated O3 exposures.
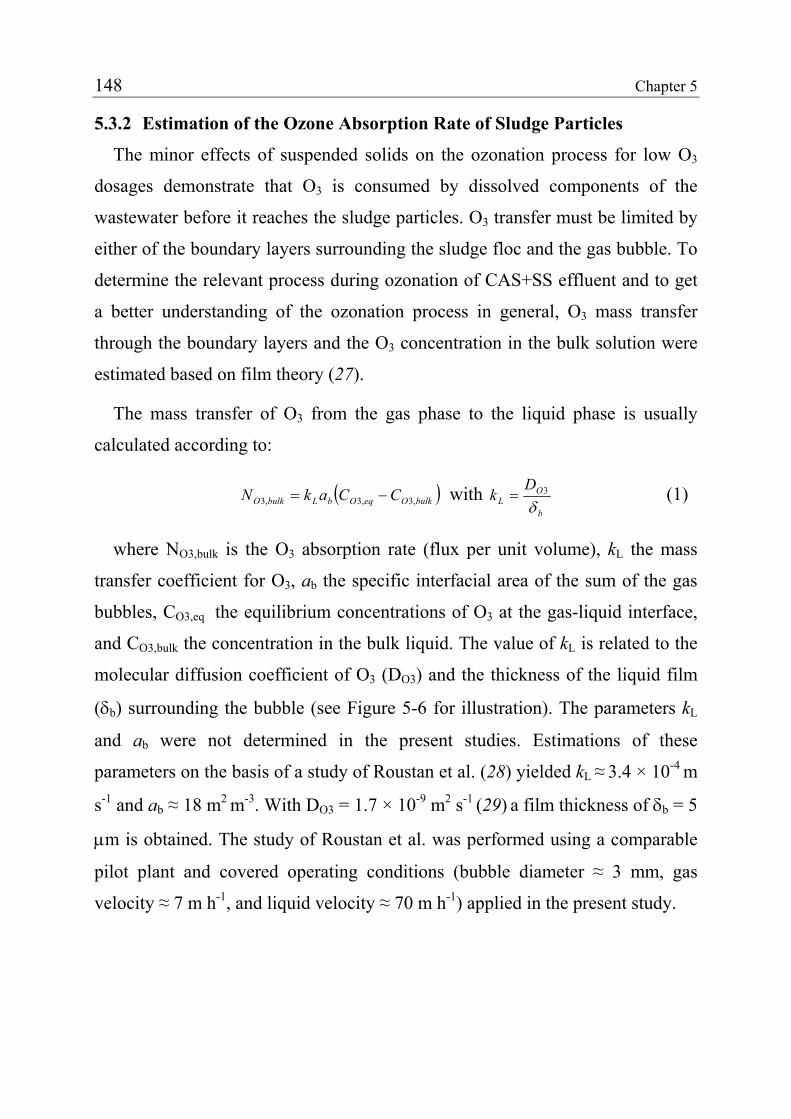
148 Chapter 5
5.3.2 Estimation of the Ozone Absorption Rate of Sludge Particles
The minor effects of suspended solids on the ozonation process for low O3
dosages demonstrate that O3 is consumed by dissolved components of the
wastewater before it reaches the sludge particles. O3 transfer must be limited by
either of the boundary layers surrounding the sludge floc and the gas bubble. To
determine the relevant process during ozonation of CAS+SS effluent and to get
a better understanding of the ozonation process in general, O3 mass transfer
through the boundary layers and the O3 concentration in the bulk solution were
estimated based on film theory (27).
The mass transfer of O3 from the gas phase to the liquid phase is usually
calculated according to:
( ) ,3,3,3 bulkOeqObLbulkO CCakN −= with b
OL
Dk
δ3= (1)
where NO3,bulk is the O3 absorption rate (flux per unit volume), kL the mass
transfer coefficient for O3, ab the specific interfacial area of the sum of the gas
bubbles, CO3,eq the equilibrium concentrations of O3 at the gas-liquid interface,
and CO3,bulk the concentration in the bulk liquid. The value of kL is related to the
molecular diffusion coefficient of O3 (DO3) and the thickness of the liquid film
(δb) surrounding the bubble (see Figure 5-6 for illustration). The parameters kL
and ab were not determined in the present studies. Estimations of these
parameters on the basis of a study of Roustan et al. (28) yielded kL ≈ 3.4 × 10⁻⁴ m
s-1 and ab ≈ 18 m2 m-3. With DO3 = 1.7 × 10⁻⁹ m2 s-1 (29) a film thickness of δb = 5
µm is obtained. The study of Roustan et al. was performed using a comparable
pilot plant and covered operating conditions (bubble diameter ≈ 3 mm, gas
velocity ≈ 7 m h-1, and liquid velocity ≈ 70 m h-1) applied in the present study.
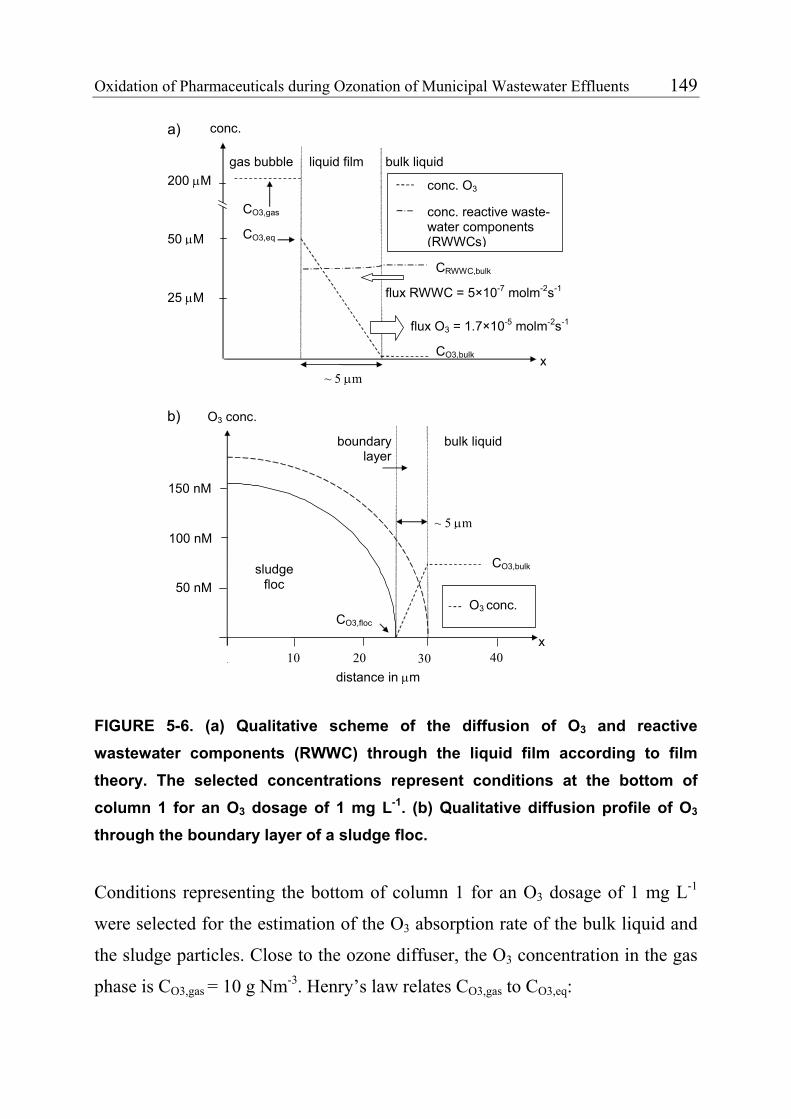
Oxidation of Pharmaceuticals during Ozonation of Municipal Wastewater Effluents 149
Conditions representing the bottom of column 1 for an O3 dosage of 1 mg L-1
were selected for the estimation of the O3 absorption rate of the bulk liquid and
the sludge particles. Close to the ozone diffuser, the O3 concentration in the gas
phase is CO3,gas = 10 g Nm-3. Henry’s law relates CO3,gas to CO3,eq:
conc. reactive waste-water components (RWWCs)
liquid film
flux RWWC = 5×10⁻⁷ molm-2s-1
CO3,gas
CO3,eq
CO3,bulk
gas bubble bulk liquid
x
200 µM
25 µM
50 µM
~ 5 µm
flux O3 = 1.7×10⁻⁵ molm-2s-1
conc. O3
CRWWC,bulk
conc.a)
distance in µm
~ 5 µm
150 nM
sludge floc
boundarylayer
CO3,floc
CO3,bulk
bulk liquid
x
50 nM
100 nM
O3 conc.
b) O3 conc.
10 20 30 40
FIGURE 5-6. (a) Qualitative scheme of the diffusion of O3 and reactive wastewater components (RWWC) through the liquid film according to film theory. The selected concentrations represent conditions at the bottom of column 1 for an O3 dosage of 1 mg L-1. (b) Qualitative diffusion profile of O3
through the boundary layer of a sludge floc.
150 Chapter 5
gasO
eqO
CC
H,3
,3= (2)
where H is the dimensionless Henry constant. Using H = 0.24 (30), eq 2
yields CO3,eq = 2.4 g m-3 or 50 µM. The fact that no O3 residuals could be
measured at SP-MID for an O3 dosage of 1 mg L-1 indicates that CO3,bulk <<
CO3,eq. Assuming that CO3,bulk ≈ 0, eq 1 yields NO3, bulk = 3 × 10⁻⁷ mol s-1 L-1.
In the presence of a high concentration of fast-reacting compounds, the O3
mass transfer can be enhanced by reactions taking place in the liquid film. To
check whether such an enhancement has to be considered in the present case, the
concentration of reactive wastewater components in the bulk liquid (CRWWC,bulk,
e.g., O3 reactive moieties of DOC and reactive inorganic compounds) and their
rate constants with O3 have to be estimated. Low O3 residuals detected at SP-
MID for O3 dosages ≥2 mg L-1 indicated that the fast initial O3 demand of the
wastewater is equivalent to approximately 2 mgO3 L-1 (40 µM) under the
assumption that only direct O3 reactions with a stoichiometry of 1:1 are
involved. Therefore, CRWWC,bulk was set to 40 µM. The rate constant for the
reaction of O3 with RWWC was estimated to be kO3 = 1 × 10⁵ M-1 s-1. This rate
constant is representative for reactive moieties like phenols and amines. To
assess the importance of the reaction of O3 in the liquid film compared to O3
mass transfer across the film, the Hatta number (Ha) was calculated assuming
that in the film CRWWC = const. = CRWWC,bulk.
L
bulkRWWCOO
kCDk
Ha ,33 ⋅⋅= (3)
For the selected conditions, eq 3 yields 0.2. Ha < 0.3 means that gas
absorption follows a so-called slow kinetic regime and that reactions take
primarily place in the bulk liquid (29). Therefore, O3 mass transfer is well
described by eq 1 and no enhancement due to consumption of O3 in the film has
Oxidation of Pharmaceuticals during Ozonation of Municipal Wastewater Effluents 151
to be considered. Figure 5-6a gives a qualitative representation of the diffusion
profiles resulting from the above-described conditions. Solving the differential
equations that describe diffusion and reaction of O3 in the liquid film (29)
yielded very similar results.
Knowing NO3,bulk and CRWWC,bulk, the following equation can be used to
estimate CO3,bulk , which is needed for the calculation of the O3 absorption rate of
the sludge flocs:
)()()()(
,,33,3,3 tCtCktNdt
tdCbulkRWWCbulkOObulkO
bulkO −= (4)
Under steady-state conditions the left side of eq 4 is zero and the variables
become time-independent. Solving eq 4 for CO3,bulk results in a concentration of
CO3,bulk = 7.5 × 10⁻⁸ M. This value corroborates the assumption made for the
calculation of the film diffusion and is in agreement with the fact that O3
concentrations were < 0.05 mg L-1 (<1 × 10⁻⁶ M) at SP-MID for an O3 dosage of
1 mg L-1.
The diffusion of O3 through the boundary layer of a sludge floc can be
represented as shown in Figure 5-6b. The diffusive transport from the bulk
liquid to the sludge flocs can be assessed using the following equation:
( flocObulkOf
OO CC
DF ,3,3
33 −=
δ) (5)
The thickness δf of the boundary layer surrounding the flocs must be in the
same order of magnitude as δb. Because the flocs move more slowly than the
bubbles, it is expected that δf is somewhat larger than δb. To make a
conservative assumption, it was estimated that δf = δb = 5 µm. Assuming that the
O3 concentration at the liquid-floc interface (CO3,floc) is zero, a flux of FO3 = 2.6
10-8 mol s-1 m-2 is obtained using eq 5.
152 Chapter 5
To estimate the O3 absorption rate for 20 mgTSS L-1 (5 mgTSS L-1 of CAS +
15 mgTSS L-1 dosed), the specific interfacial area of the sludge flocs (af) has to
be calculated. An area of af = 48 m2 m-3 was obtained assuming a water content
of the floc of 95%, sperical shape and a diameter of 50 µm. Laser diffraction
analysis of a different activated sludge showed that 90% of the sludge volume is
formed by flocs with a diameter > 50 µm (median = 200 µm) (31). The resulting
O3 absorption rate by the sludge flocs is NO3,floc = FO3 × af / 1000 = 1.2 × 10⁻⁹
mol s-1 L-1 compared to the absorption rate of the bulk phase of NO3,bulk = 3 ×
10-7 mol s-1 L-1. According to this estimate, only 0.4 % of the O3 transferred into
the bulk solution is consumed by sludge particles. Changing the estimated
parameters by a factor of two in any direction will not significantly increase the
absorption rate of the sludge particles. Due to the unambiguity of the result, the
rough estimate of mass transfer demonstrates clearly that the O3 absorption rate
must be limited by O3 diffusion across the boundary layer surrounding the
sludge particles. The fact that O3 absorption by sludge particles is relatively low,
explains also why oxidation by •OH is relatively unaffected by suspended solids.
Because the highest share of O3 reacts in the bulk liquid, •OH is formed in the
bulk liquid as well and does not come into contact with sludge particles due to
its extremely low life time.
The considerations presented above also imply that micropollutants sorbed to
sludge particles will not be oxidized efficiently. Furthermore, the inactivation of
microorganisms present in the floc will be difficult to achieve, because these
microorganisms will only experience a relatively low O3 exposure. In Table 5-4,
concentrations of E. coli before and after ozonation of CAS and CAS+SS
effluent demonstrate clearly the negative impact of suspended solids on
disinfection efficiency.
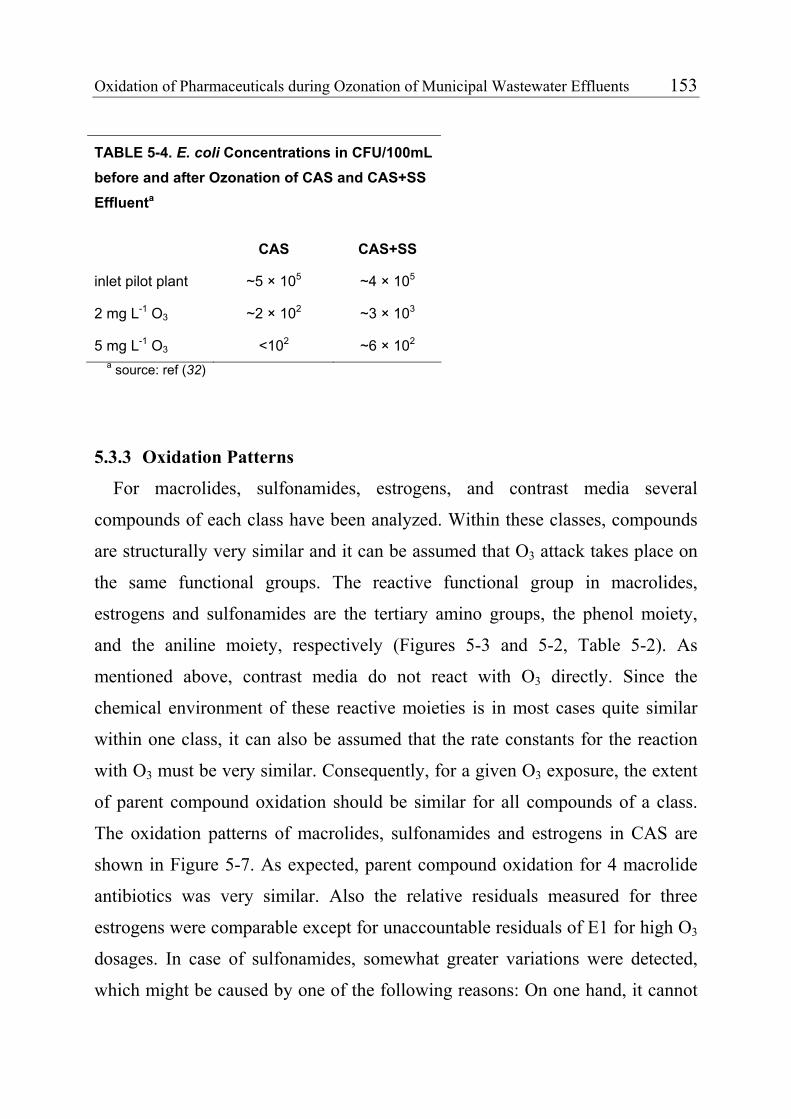
Oxidation of Pharmaceuticals during Ozonation of Municipal Wastewater Effluents 153
TABLE 5-4. E. coli Concentrations in CFU/100mL before and after Ozonation of CAS and CAS+SS Effluenta
CAS CAS+SS
inlet pilot plant ~5 × 10⁵ ~4 × 10⁵
2 mg L-1 O3 ~2 × 10² ~3 × 10³
5 mg L-1 O3 <102 ~6 × 10²
a source: ref (32)
5.3.3 Oxidation Patterns
For macrolides, sulfonamides, estrogens, and contrast media several
compounds of each class have been analyzed. Within these classes, compounds
are structurally very similar and it can be assumed that O3 attack takes place on
the same functional groups. The reactive functional group in macrolides,
estrogens and sulfonamides are the tertiary amino groups, the phenol moiety,
and the aniline moiety, respectively (Figures 5-3 and 5-2, Table 5-2). As
mentioned above, contrast media do not react with O3 directly. Since the
chemical environment of these reactive moieties is in most cases quite similar
within one class, it can also be assumed that the rate constants for the reaction
with O3 must be very similar. Consequently, for a given O3 exposure, the extent
of parent compound oxidation should be similar for all compounds of a class.
The oxidation patterns of macrolides, sulfonamides and estrogens in CAS are
shown in Figure 5-7. As expected, parent compound oxidation for 4 macrolide
antibiotics was very similar. Also the relative residuals measured for three
estrogens were comparable except for unaccountable residuals of E1 for high O3
dosages. In case of sulfonamides, somewhat greater variations were detected,
which might be caused by one of the following reasons: On one hand, it cannot
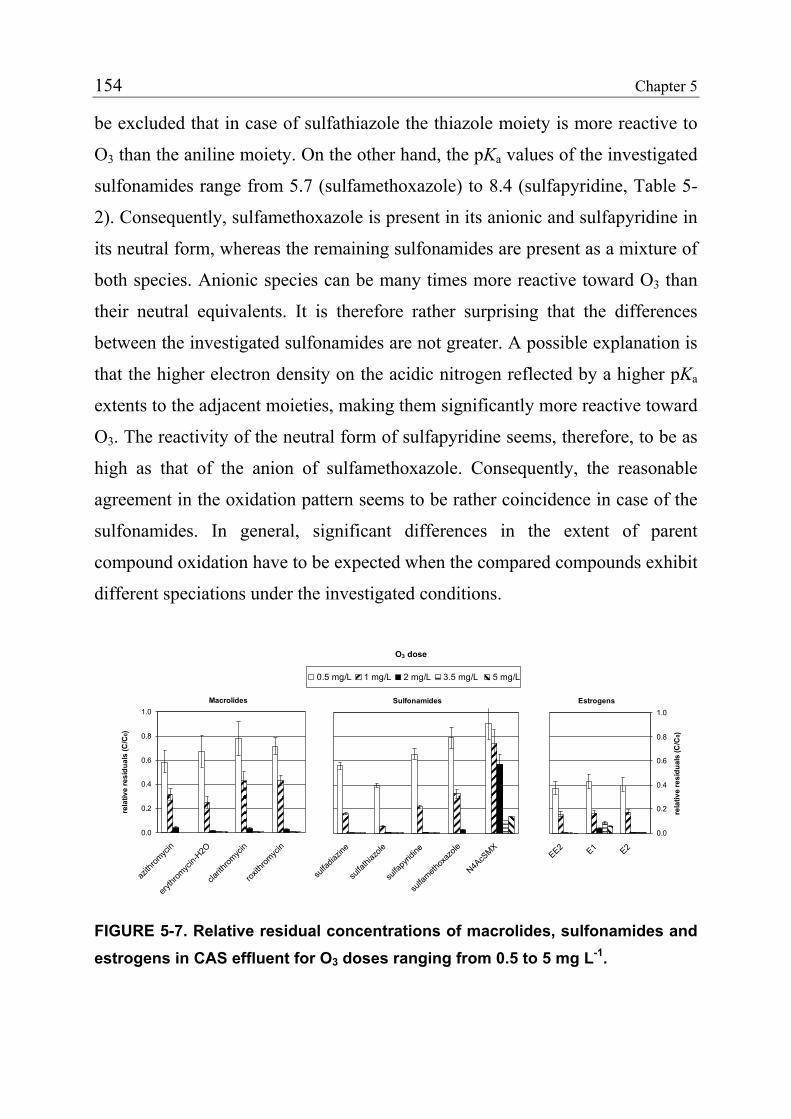
154 Chapter 5
be excluded that in case of sulfathiazole the thiazole moiety is more reactive to
O3 than the aniline moiety. On the other hand, the pKa values of the investigated
sulfonamides range from 5.7 (sulfamethoxazole) to 8.4 (sulfapyridine, Table 5-
2). Consequently, sulfamethoxazole is present in its anionic and sulfapyridine in
its neutral form, whereas the remaining sulfonamides are present as a mixture of
both species. Anionic species can be many times more reactive toward O3 than
their neutral equivalents. It is therefore rather surprising that the differences
between the investigated sulfonamides are not greater. A possible explanation is
that the higher electron density on the acidic nitrogen reflected by a higher pKa
extents to the adjacent moieties, making them significantly more reactive toward
O3. The reactivity of the neutral form of sulfapyridine seems, therefore, to be as
high as that of the anion of sulfamethoxazole. Consequently, the reasonable
agreement in the oxidation pattern seems to be rather coincidence in case of the
sulfonamides. In general, significant differences in the extent of parent
compound oxidation have to be expected when the compared compounds exhibit
different speciations under the investigated conditions.
Macrolides
0.0
0.2
0.4
0.6
0.8
1.0
azith
romyc
in
erythr
omyc
in-H2O
clarith
romyc
in
roxith
romyc
in
rela
tive
resi
dual
s (C
/C0)
Sulfonamides
sulfa
diazin
e
sulfa
thiaz
ole
sulfa
pyrid
ine
sulfa
methox
azole
N4AcS
MX
0.5 mg/L 1 mg/L 2 mg/L 3.5 mg/L 5 mg/L
O3 dose
Estrogens
0.0
0.2
0.4
0.6
0.8
1.0
EE2 E1 E2
rela
tive
resi
dual
s (C
/C0)
FIGURE 5-7. Relative residual concentrations of macrolides, sulfonamides and estrogens in CAS effluent for O3 doses ranging from 0.5 to 5 mg L-1.
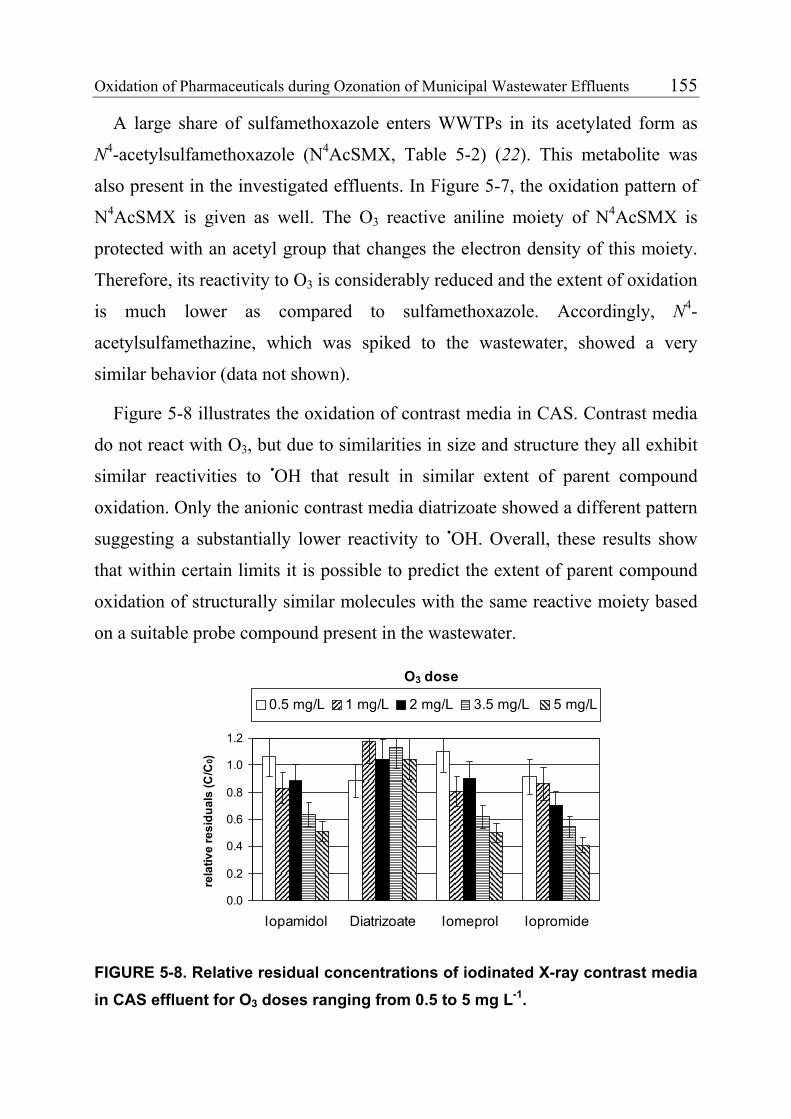
Oxidation of Pharmaceuticals during Ozonation of Municipal Wastewater Effluents 155
A large share of sulfamethoxazole enters WWTPs in its acetylated form as
N4-acetylsulfamethoxazole (N4AcSMX, Table 5-2) (22). This metabolite was
also present in the investigated effluents. In Figure 5-7, the oxidation pattern of
N4AcSMX is given as well. The O3 reactive aniline moiety of N4AcSMX is
protected with an acetyl group that changes the electron density of this moiety.
Therefore, its reactivity to O3 is considerably reduced and the extent of oxidation
is much lower as compared to sulfamethoxazole. Accordingly, N4-
acetylsulfamethazine, which was spiked to the wastewater, showed a very
similar behavior (data not shown).
Figure 5-8 illustrates the oxidation of contrast media in CAS. Contrast media
do not react with O3, but due to similarities in size and structure they all exhibit
similar reactivities to •OH that result in similar extent of parent compound
oxidation. Only the anionic contrast media diatrizoate showed a different pattern
suggesting a substantially lower reactivity to •OH. Overall, these results show
that within certain limits it is possible to predict the extent of parent compound
oxidation of structurally similar molecules with the same reactive moiety based
on a suitable probe compound present in the wastewater.
0.0
0.2
0.4
0.6
0.8
1.0
1.2
Iopamidol Diatrizoate Iomeprol Iopromide
rela
tive
resi
dual
s (C
/C0)
0.5 mg/L 1 mg/L 2 mg/L 3.5 mg/L 5 mg/L
O3 dose
FIGURE 5-8. Relative residual concentrations of iodinated X-ray contrast media in CAS effluent for O3 doses ranging from 0.5 to 5 mg L-1.
156 Chapter 5
5.3.4 Prediction of Parent Compound Oxidation
More important than the prediction of the oxidation of compounds within the
same class of pharmaceuticals (such compounds can usually be measured with a
single analytical method) would be a prediction for compounds of various
classes on the basis of second-order rate constants for their reaction with O3 and •OH and appropriate probe compounds. The rate of oxidation of a pollutant
during ozonation is given by the rate law:
)()()()()(33 tCtCktCtCk
dttdC
pOHOHpOOP −−= (6)
where CP, CO3, and COH are the concentrations of the pollutant, O3, and •OH,
respectively and kO3 and kOH are the second-order rate constants for the reaction
of the pollutant with the respective oxidants. To predict residual concentrations
of a pollutant, the integrated form of eq 6 has to be used:
∫∫=−−
τττ00 33 )()(
)0()( dttCkdttCk
p
p OHOHOOeCC
(7)
If kO3 and kOH are known, only the O3 exposure (∫ CO3(t)dt) and the •OH
exposure (∫ COH(t)dt) have to be determined to make a prediction. On the basis
of eq 7, Elovitz and von Gunten (33) developed the Rct concept, with which the
oxidation of pharmaceuticals that exhibit an intermediate or low kO3 was
successfully predicted in bench-scale experiments performed under drinking
water treatment conditions (12). In the cited study, O3 exposures were
determined by integrating the measured O3 concentrations over time. •OH
exposures were calculated with help of a probe compound and the Rct value.
However, •OH exposures can also be determined without the Rct value by simply
using a probe compound that has a known kOH and that does not react with O3. If
kO3 = 0, eq 7 can be rearranged and the •OH exposure can be calculated based on
the relative residual concentration of the probe compound (CPC) and its rate
constant with •OH (kOH,PC):
Oxidation of Pharmaceuticals during Ozonation of Municipal Wastewater Effluents 157
⎟⎟⎠
⎞⎜⎜⎝
⎛−=∫ )0(
)(ln1)(
,0 PC
PC
PCOHOH C
Ck
dttCττ
(8)
If it is not possible to measure O3 concentrations during an ozonation process,
it should be possible to determine an O3 exposure with an appropriate probe
compound in the same way as for •OH exposures. However, since all organic
compounds react with •OH at appreciable rates, residuals of O3 probes have
always to be corrected for oxidation by •OH.
In the present study it was tested, whether predictions for fast-reacting
pharmaceuticals can be made on the basis of this concept. Ibuprofen and
naproxen were used as the •OH and O3 probes, respectively. To account for the
relatively high uncertainties associated with the high rate constants and the
residual concentrations of the probe compounds, Monte Carlo simulations were
performed using a Matlab script (MathWorks, Inc.) to calculate 90% confidence
intervals for the predictions.
As for drinking water, the prediction of the oxidation by •OH radicals worked
reasonably well for compounds like clofibric acid and iopromide that exhibit a
low reactivity to O3 (data not shown). To assess the quality of the predictions for
fast-reacting pharmaceuticals, only data for an O3 dosage of 1 mg L-1 could be
used among the O3 dosages considered (1, 2, and 3.5 mg L-1), because the low
residuals of fast reacting compounds cannot be properly measured for higher
dosages. Out of the four considered compounds (EE2, sulfamethoxazole,
diclofenac, and roxithormycin) the predictions for EE2 and sulfamethoxazole
deviated strongly from the measured value. Taking into account the model
uncertainty, maximal residuals of <1-2% were calculated compared to measured
residuals of 15-30%. Also, naproxen, diclofenac and roxithromycin were
oxidized to a higher extent than EE2 and sulfamethoxazole despite their lower
rate constants. Obviously, the ozonation process under these conditions is too
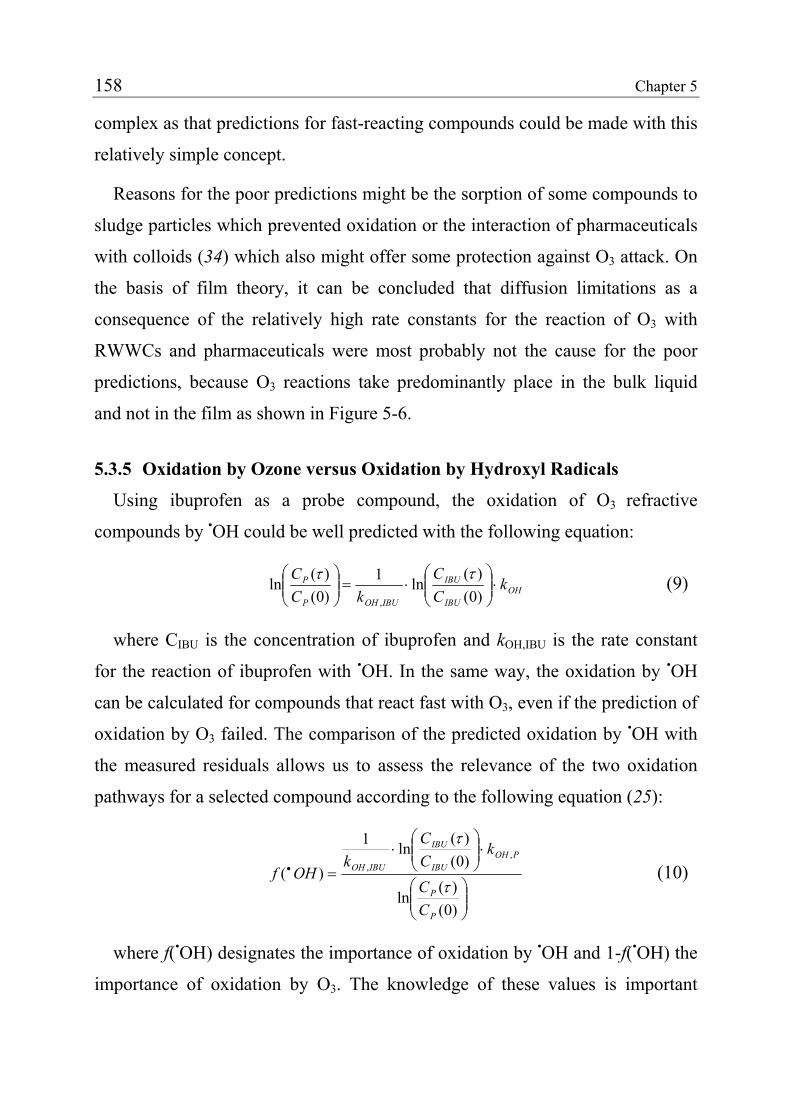
158 Chapter 5
complex as that predictions for fast-reacting compounds could be made with this
relatively simple concept.
Reasons for the poor predictions might be the sorption of some compounds to
sludge particles which prevented oxidation or the interaction of pharmaceuticals
with colloids (34) which also might offer some protection against O3 attack. On
the basis of film theory, it can be concluded that diffusion limitations as a
consequence of the relatively high rate constants for the reaction of O3 with
RWWCs and pharmaceuticals were most probably not the cause for the poor
predictions, because O3 reactions take predominantly place in the bulk liquid
and not in the film as shown in Figure 5-6.
5.3.5 Oxidation by Ozone versus Oxidation by Hydroxyl Radicals
Using ibuprofen as a probe compound, the oxidation of O3 refractive
compounds by •OH could be well predicted with the following equation:
OHIBU
IBU
IBUOHP
P kCC
kCC
⋅⎟⎟⎠
⎞⎜⎜⎝
⎛⋅=⎟⎟
⎠
⎞⎜⎜⎝
⎛)0()(
ln1)0()(
ln,
ττ (9)
where CIBU is the concentration of ibuprofen and kOH,IBU is the rate constant
for the reaction of ibuprofen with •OH. In the same way, the oxidation by •OH
can be calculated for compounds that react fast with O3, even if the prediction of
oxidation by O3 failed. The comparison of the predicted oxidation by •OH with
the measured residuals allows us to assess the relevance of the two oxidation
pathways for a selected compound according to the following equation (25):
⎟⎟⎠
⎞⎜⎜⎝
⎛
⋅⎟⎟⎠
⎞⎜⎜⎝
⎛⋅
=•
)0()(
ln
)0()(
ln1
)(,
,
P
P
POHIBU
IBU
IBUOH
CC
kCC
kOHf
τ
τ
(10)
where f(•OH) designates the importance of oxidation by •OH and 1-f(•OH) the
importance of oxidation by O3. The knowledge of these values is important
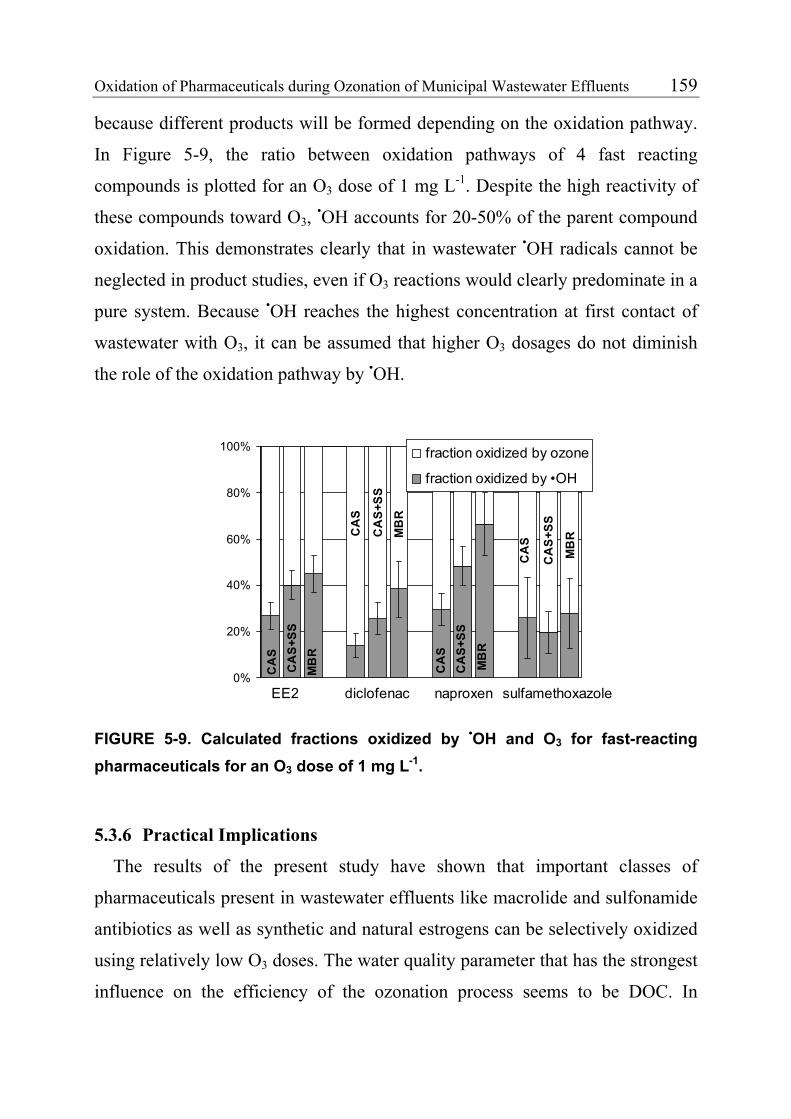
Oxidation of Pharmaceuticals during Ozonation of Municipal Wastewater Effluents 159
because different products will be formed depending on the oxidation pathway.
In Figure 5-9, the ratio between oxidation pathways of 4 fast reacting
compounds is plotted for an O3 dose of 1 mg L-1. Despite the high reactivity of
these compounds toward O3, •OH accounts for 20-50% of the parent compound
oxidation. This demonstrates clearly that in wastewater •OH radicals cannot be
neglected in product studies, even if O3 reactions would clearly predominate in a
pure system. Because •OH reaches the highest concentration at first contact of
wastewater with O3, it can be assumed that higher O3 dosages do not diminish
the role of the oxidation pathway by •OH.
0%
20%
40%
60%
80%
100% fraction oxidized by ozone
fraction oxidized by •OH
EE2 diclofenac naproxen
CA
SC
AS+
SSM
BR
CA
SC
AS
+SS
MB
R
sulfamethoxazole
CA
S
CA
S+SS
MB
R
CA
S
CA
S+S
S
MB
R
FIGURE 5-9. Calculated fractions oxidized by •OH and O3 for fast-reacting pharmaceuticals for an O3 dose of 1 mg L-1.
5.3.6 Practical Implications
The results of the present study have shown that important classes of
pharmaceuticals present in wastewater effluents like macrolide and sulfonamide
antibiotics as well as synthetic and natural estrogens can be selectively oxidized
using relatively low O3 doses. The water quality parameter that has the strongest
influence on the efficiency of the ozonation process seems to be DOC. In
160 Chapter 5
another study, O3 doses >5 mg L-1 had to be applied to achieve a comparable
result for wastewater with a higher DOC (14). Results of the present study show
that suspended solids have only a minor effect on the oxidation of
pharmaceuticals. Ozonation of wastewater effluents will mainly be a viable
solution, when the treatment objectives include micropollutant oxidation and
disinfection. Therefore, it has to be pointed out that suspended solids had a
negative impact on disinfection. In the regular CAS effluent, an O3 dosage of 5
mg L-1 would be sufficient to achieve the guideline values set by the EU bathing
water quality directive. In contrast, this standard could not be achieved with the
higher suspended solids concentration in CAS+SS effluent.
Acknowledgments
We thank Christoph Liebi for the permission to carry out the pilot
experiments in the WWTP Kloten-Opfikon (Switzerland). We also thank the
whole staff of the WWTP and Martin Kampmann from WEDECO for the
generous assistance, Jochen Schumacher (TU Berlin) for the tracer analysis data
describing the hydraulics of the pilot plant , Mr. Hintermann for providing some
of the spiked antibiotics and the firm Fluitec Georg AG (Neftenbach,
Switzerland) for design and supply of a static mixer. This study was performed
within the framework of POSEIDON, European Union project EVK1-CT-2000-
00047. Financial support by the Swiss federal agencies BBW (Bundesamt für
Bildung und Wissenschaft) and BUWAL (Bundesamt für Umwelt, Wald und
Landschaft) is gratefully acknowledged.
Oxidation of Pharmaceuticals during Ozonation of Municipal Wastewater Effluents 161
5.4 References
(1) Ternes, T. A.: Occurrence of drugs in German sewage treatment plants and rivers, Water Res. 1998, 32, 3245-3260.
(2) Kolpin, D. W.; Furlong, E. T.; Meyer, M. T.; Thurman, E. M.; Zaugg, S. D.; Barber, L. B.; Buxton, H. T.: Pharmaceuticals, hormones, and other organic wastewater contaminants in U.S. streams, 1999-2000: a national reconnaissance, Environ. Sci. Technol. 2002, 36, 1202-1211.
(3) Heberer, T.: Occurrence, fate, and removal of pharmaceutical residues in the aquatic environment: a review of recent research data, Toxicol. Lett. 2002, 131, 5-17.
(4) Daughton, C. G.; Ternes, T. A.: Pharmaceuticals and personal care products in the environment: agents of subtle change, Environ. Health Perspect. 1999, 107, 907-938.
(5) Pickering, A., D.; Sumpter, J. P.: Comprehending endocrine disrupters in aquatic environments, Environ. Sci. Technol. 2003, 37, 331A-336A.
(6) Purdom, C. E.; Haridman, P. A.; Bye, V. J.; Eno, N.; Tyler, C. R.; Sumpter, J. P.: Estrogenic effects of effluents from sewage treatment works, Chem. Ecol. 1994, 8, 275.
(7) Pawlowski, S.; van Aerle, R.; Tyler, C. R.; Braunbeck, T.: Effects of 17α- ethinylestradiol in a fathead minnow (Pimephales promelas) gonadal recrudescence assay, Ecotoxicol. Environ. Safety 2004, 57, 330-345.
(8) Jobling, S.; Casey, D.; Rodgers-Gray, T.; Oehlmann, J.; Schulte-Oehlmann, U.; Pawlowski, S.; Braunbeck, T.; Turner, A. P.; Tyler, C. R.: Comparative responses of molluscs and fish to environmental estrogens and an estrogenic effluent, Aquat. Toxicol. 2004, 66, 207-222.
(9) Thorpe, K. L.; Cummings, R. I.; Huchtinson, T. H.; Scholze, M.; Brighty, G.; Sumpter, J. P.; Tyler, C. R.: Relative potencies and combination effects of steroidal estrogens in fish, Environ. Sci. Technol. 2003, 37, 1142-1149.
(10) Göbel, A.; McArdell, C. S.; Joss, A.; Siegrist, H. R.; Giger, W.: Behavior of sulfonamide and macrolide antimicrobials in wastewater treatment II. Evaluation of different treatment technologies, Environ. Sci. Technol. 2004, in preparation.
(11) Joss, A.; Ternes, T. A.; Alder, A.; Göbel, A.; McArdell, C. S.; Elvira, K.; Siegrist, H. R.: Removal of pharmaceuticals and fragrances in biological wastewater treatment, Environ. Sci. Technol. 2004, in preparation.
(12) Huber, M. M.; Canonica, S.; Park, G.-Y.; von Gunten, U.: Oxidation of pharmaceuticals during ozonation and advanced oxidation processes, Environ. Sci. Technol. 2003, 37, 1016-1024.
(13) Ternes, T. A.; Meisenheimer, M.; McDowell, D.; Sacher, F.; Brauch, H.-J.; Haist- Gulde, B.; Preuss, G.; Wilme, U.; Zullei-Seibert, N.: Removal of pharmaceuticals during drinking water treatment, Environ. Sci. Technol. 2002, 36, 3855-3863.
162 Chapter 5
(14) Ternes, T. A.; Stüber, J.; Herrmann, N.; McDowell, D.; Ried, A.; Kampmann, M.; Teiser, B.: Ozonation: a tool for removal of pharmaceuticals, contrast media and musk fragrances from wastewater?, Water Res. 2003, 37, 1976-1982.
(15) Huber, M. M.; Ternes, T. A.; von Gunten, U.: Removal of estrogenic activity and formation of oxidation products during ozonation of 17α-ethinylestradiol, Environ. Sci. Technol. 2004, web release date: August 21.
(16) McDowell, D.; Huber, M. M.; Wagner, M.; von Gunten, U.; Ternes, T. A.: Ozonation of carbamazepine in drinking water: identification and kinetic study of major oxidation products, Environ. Sci. Technol. 2004, in preparation.
(17) Vree, T. B.; Hekster, Y. A. Clinical pharmacokinetics of sulfonamides and their metabolites; Karger: Basel, 1987.
(18) Bader, H.; Hoigné, J.: Determination of ozone in water by the indigo method, Water Res. 1981, 15, 449-456.
(19) Hirsch, R.; Ternes, T. A.; Lindart, A.; Haberer, K.; Wilken, R.-D.: A sensitive method for the determination of iodine containing diagnostic agents in aqueous matrices using LC-electrospray-tandem-MS detection, Fresen. J. Anal. Chem. 2000, 366, 835-841.
(20) Löffler, D.; Ternes, T. A.: Determination of acidic pharmaceuticals, antibiotics and ivermectin in river sediments using liquid chromatography-tandem mass spectrometry., J. Chromatogr. A 2003, 1021, 133-144.
(21) Ternes, T. A.: Analytical methods for the determination of pharmaceuticals in aqueous environmental samples, Trends Anal. Chem. 2001, 20, 419-434.
(22) Göbel, A.; McArdell, C. S.; Suter, M. J.-F.; Giger, W.: Trace determination of macrolide and sulfonamide antimicrobials, a human sulfonamide metabolite, and trimethoprim in wastewater using liquid chromatography coupled to electrospray tandem mass spectrometry, Anal. Chem. 2004, in press.
(23) Ternes, T. A.; Stumpf, M.; Mueller, J.; Haberer, K.; Wilken, R.-D.; Servos, M.: Behaviour and occurrence of estrogens in municipal sewage plants - 1. Investigations in Germany, Canada and Brazil, Sci. Total Environ. 1999, 225, 81-90.
(24) Löffler, D.; Hofmann, B.; Ternes, T. A.: Determination of estrogens in sludge and wastewater: A comparison between LC/MS/MS and GC/MS/MS detection, J. Chromatogr. A 2004, in preparation.
(25) von Gunten, U.: Ozonation of drinking water: Part I. Oxidation kinetics and product formation, Water Res. 2003, 37, 1443-1467.
(26) Packer, J. L.; Werner, J. J.; Douglas, L. E.; McNeill, K.; Arnold, W. A.: Photochemical fate of pharmaceuticals in the environment: Naproxen, diclofenac, clofibric acid, and ibuprofen, Aquat. Sci. 2003, 65, 342-351.
(27) Lewis, W. K.; Whitman, W. G.: Principles of gas absorption, Ind. Eng. Chem. 1924, 16, 1215-1220.
(28) Roustan, M.; Wang, R. Y.; Wolbert, D.: Modeling hydrodynamics and mass transfer parameters in a continuous ozone bubble column, Ozone Sci. Eng. 1996, 18, 99-115.
Oxidation of Pharmaceuticals during Ozonation of Municipal Wastewater Effluents 163
(29) Beltrán, F. J. Ozone reaction kinetics for water and wastewater systems; Lewis Publishers: Boca Raton, 2004.
(30) Bablon, G.; et al.: Fundamental aspects, In Ozone in water treatment: Application and Engineering; Langlais, B., Reckhow, D. A., Brink, D. R., Eds.; Lewis Publishers: Chelsea, 1991.
(31) Manser, R.; Gujer, W.; Siegrist, H. R.: Influence of membrane separation on the kinetics of nitrifiers, Water Res. 2004, in preparation.
(32) Kohnen, W., University of Mainz, Personal communication.
(33) Elovitz, M. S.; von Gunten, U.: Hydroxyl radicals/ozone ratios during ozonation processes. I. The Rct Concept, Ozone Sci. Eng. 1999, 21, 239-260.
(34) Holbrook, D. R.; Love, N. G.; Novak, J. T.: Sorption of 17β-estradiol and 17α- ethinylestradiol by colloidal organic carbon derived from biological wastewater treatment systems, Environ. Sci. Technol. 2004, 38, 3322-3329.


6
General Discussion and Conclusions
166 Chapter 6
The results presented in Chapter 2 and 3 have shown that from a kinetic point
of view ozonation is considerably more effective in oxidizing pharmaceuticals
than chlorine dioxide or chlorine. This finding is linked to the fact that in
comparison with chlorine dioxide and chlorine, the rate constants for the
reaction of ozone with reactive functional groups are generally higher.
Consequently, in addition to amines and phenols, a larger number of moieties
react with ozone at an appreciable rate (e.g., double bonds, alkoxy- and alkyl-
substituted benzenes). Ranking the investigated pharmaceuticals in their
descending order of reactivity toward O3 yields: 17α-ethinylestradiol (EE2) >
sulfamethoxazole ≈ diclofenac > carbamezepine > roxithromycin >> bezafibrate
> ibuprofen > iopromide ≈ diazepam. Among these compounds, only the latter
three pharmaceuticals are relatively O3-refractive. However, due to the
formation of •OH even such O3-refractive compounds are oxidized to a
substantial extent during ozonation.
In addition to the disappearance of the parent compounds, the elimination of
the pharmacological effects associated with the target compounds has also to be
taken into account to assess oxidative treatment processes in a comprehensive
manner. Taking EE2 as an example, the elimination of the estrogenicity during
ozonation was studied in Chapter 4. The estrogenicity of EE2 can be considered
as the primary pharmacological effect of EE2. The results showed that relatively
low ozone doses were sufficient to oxidize EE2 and to produce a significant
decrease in estrogenicity. The identification of oxidation products of EE2
proved that ozone attack primarily took place on the phenolic moiety, which is
also crucial for the binding of estrogens to the estrogen receptor. In the light of
this, EE2 is an excellent example how pharmaceuticals can be deactivated
through selective oxidation of functional groups. Ideally, oxidation products
should also be tested for toxic effects. However, EE2 concentrations in surface
waters are extremely low and it is unlikely that oxidation products exhibit a
General Discussion and Conclusions 167
similarly strong biological activity as the extremely potent parent compound
with respect to estrogenicity. Therefore, it seems to be acceptable to neglect
other biological effects in the case of EE2.
This study on EE2 is the first study that investigated the oxidation of
pharmaceuticals during ozonation in a comprehensive manner, including
oxidation kinetics, product formation, and pharmacological effects of the
oxidation products. To reach a conclusive assessment of ozonation it is
indispensable to investigate further pharmaceuticals with regard to the
elimination of their pharmacological effects and the formation of potentially
toxic oxidation products. However, for many pharmaceuticals easy test systems
which allow for the investigation of their pharmacological effect are not
available. Also, testing oxidation products for toxic effects is a very time-
consuming task. The product identification of EE2 has shown that ozonation can
produce a large number of different oxidation products, which are usually not
commercially available. Consequently, it may often not be feasible to isolate
single oxidation products and to perform toxicity tests with single, pure
compounds. The testing of mixtures of oxidation products may be a more
efficient solution in such cases. If such a screening indicates that toxic oxidation
products are formed for a certain pharmaceutical, the respective compound can
be investigated more extensively to link the observed toxicity to the responsible
oxidation products.
Bench-scale experiments with different natural waters have shown that rate
constants for ozone, hydroxyl radical, and chlorine dioxide, which were
determined in pure aqueous solution, can be applied to predict the oxidation of
pharmaceuticals in natural waters. For chlorine dioxide, it could additionally be
demonstrated that results obtained at relatively high target compound
concentrations are also valid for 3 orders of magnitude lower, realistic
concentrations of pharmaceuticals. The pilot-scale ozonation experiments
168 Chapter 6
presented in Chapter 5 further demonstrated that the determined rate constants
can at least be qualitatively applied to predict the oxidation of pharmaceuticals
in wastewater. Pharmaceuticals with high rate constant were oxidized to an
extent >90-99% for O3 doses ≥2 mg L-1, whereas slow-reacting pharmaceuticals
were still present after treatment with 5 mg L-1 O3. However, smaller differences
in the extent of parent compound oxidation of highly reactive pharmaceuticals
could only partly be explained by differences in rate constants. Probably,
interactions of pharmaceuticals with particles and colloids present in the
wastewater have influenced their oxidation behaviour. Overall the pilot-
experiments confirmed that ozonation works also well at larger scale and at
relatively realistic pharmaceutical concentrations.
To assess the role of •OH during ozonation processes, the fraction of parent
compounds oxidized by •OH was calculated for the investigated pharmaceuticals
under drinking water and wastewater treatment conditions on the basis of •OH
and O3 exposures. Under drinking water treatment conditions, O3-refractive
compounds were oxidized to a substantial extent by •OH, whereas for fast-
reaction pharmaceuticals the oxidation of the parent compound by •OH was
insignificant. In contrast, in wastewater the first oxidation step for fast-reacting
pharmaceuticals proceeded up to 30-50% through oxidation by •OH. These
results imply that in wastewater oxidation by •OH can not be neglected and that
the oxidation products expected from the direct reaction with O3 will only
account for 50-70% of the products.
Within the framework of the POSEIDON project, further treatment processes
applied in drinking water treatment were investigated. Results show that most of
the investigated pharmaceuticals adsorb well to activated carbon. An exception
is the ionic X-ray contrast media diatrizoate. This compound was retained by
fresh granular activated carbon (GAC), but broke through when GAC had been
subjected to higher throughputs. Besides filtration with GAC, also the Cristal®-
General Discussion and Conclusions 169
process, a combination of ultrafiltration with powdered activated carbon proved
to be efficient in removing pharmaceuticals. Ultrafiltration alone did not
significantly remove pharmaceuticals. As expected, membranes with a lower
molecular cut-off (nanofiltration, reverse osmosis) also removed the investigated
pharmaceuticals efficiently. Coagulation and sand filtration had no significant
impact on most of the investigated compounds.
On the basis of the result of this thesis and the POSEIDON project, the
following conclusions can be drawn for the elimination of pharmaceuticals
during treatment of surface water and groundwater:
• In Western Europe, state of the art treatment trains for surface water
include the application of activated carbon and/or ozonation. Often,
these processes are operated in conjunction with bank filtration and
biological treatment (biological activated carbon filtration or slow sand
filtration), which can act as further barriers. Consequently, most of the
pharmaceuticals will be eliminated during treatment of surface waters.
• In the USA, conventional surface water treatment is usually limited to
coagulation, filtration and disinfection with chlorine. In this case, the
only barrier for pharmaceuticals is an oxidation with chlorine. Above
all, compounds exhibiting phenol or amino groups like the estrogens
and various antibiotics will be oxidized during chlorination. However,
many compounds could pass the treatment unhindered.
• For groundwater in Europe and the USA, disinfection is often the only
treatment. The use of chlorine or chlorine dioxide as disinfectant will
result in the oxidation of specific pharmaceuticals (e.g, phenols and
amines), but many compounds will not be affected by the treatment.
Disinfection with UV eliminates specific compounds to some extent
170 Chapter 6
(<20%), but UV doses are generally too small for a substantial
photochemical transformation of pharmaceuticals.
• Groundwater derived from bank filtrate is most likely contaminated
with specific pharmaceuticals such as contrast media and
carbamezepine, which are typically not degraded during bank filtration
even if the hydraulic residence time amounts to several days. For
shorter residence times, also other pharmaceuticals are likely to pass
bank filtration. If such water is not treated with either activated carbon,
ozonation or membranes, the risk of the presence of pharmaceuticals in
the finished drinking water is relatively high.
A part of the conclusion presented above could be confirmed in several full-
scale treatment plants in Germany and France. Overall, it can be concluded that
a contamination of drinking water with pharmaceuticals is unlikely, if advanced
treatment processes are used. Only few pharmaceuticals (e.g., contrast media)
have the potential to pass such treatment. To assure that drinking water derived
from ground water remains free of pharmaceuticals, it is necessary to implement
an efficient water resources protection scheme.


Curriculum Vitae born on October 31, 1974, Brugg, Switzerland 1981-1986 Primary school, Zofingen and Oberwil-Lieli
1986-1990 Middle school, Bezirksschule Mutschellen, Berikon
1990-1994 High school, Kantonsschule Wohlen, Wohlen AG
1994 Matura Typus B
1994-1999 Studies in Environmental Sciences at Swiss Federal Institute of
Technology (ETH), Zürich
1999 Diploma in Environmental Sciences
Diploma Thesis: Evaluation of the Reactivity of Iron Minerals by
the Reductive Dehalogenation of Hexachloroethane at EAWAG,
Dübendorf
2000 Co-manager of a desalination plant in Praia, Cape Verde, West
Africa
2001-2004 Doctoral Studies at the Swiss Federal Institute for Environmental
Science and Technology (EAWAG), Dübendorf, and the Swiss
Federal Institute of Technology (ETH), Zürich


![Chapter 19 - Springer · Tauber [24]. Under sex hormones, estrogens have been detected in plasticizers and preservatives, while 17α-ethinylestradiol (EE2), an active component of](https://img.pdfslide.us/doc/110x75/603dfe0d1acfeb0fd620c7a0/chapter-19-springer-tauber-24-under-sex-hormones-estrogens-have-been-detected.jpg)