Embed Size (px)
Citation preview
128
CHAPTER VI
DEGRADATION AND RESTORATION OF SOIL
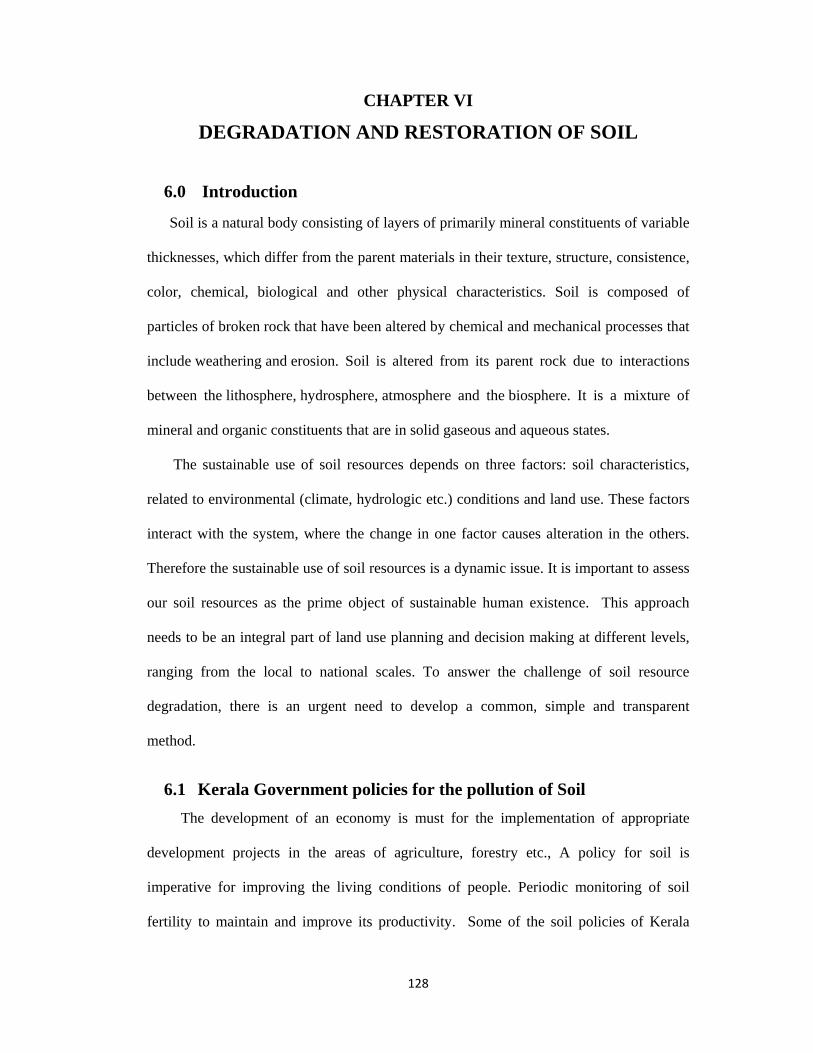
6.0 Introduction
Soil is a natural body consisting of layers of primarily mineral constituents of variable
thicknesses, which differ from the parent materials in their texture, structure, consistence,
color, chemical, biological and other physical characteristics. Soil is composed of
particles of broken rock that have been altered by chemical and mechanical processes that
include weathering and erosion. Soil is altered from its parent rock due to interactions
between the lithosphere, hydrosphere, atmosphere and the biosphere. It is a mixture of
mineral and organic constituents that are in solid gaseous and aqueous states.
The sustainable use of soil resources depends on three factors: soil characteristics,
related to environmental (climate, hydrologic etc.) conditions and land use. These factors
interact with the system, where the change in one factor causes alteration in the others.
Therefore the sustainable use of soil resources is a dynamic issue. It is important to assess
our soil resources as the prime object of sustainable human existence. This approach
needs to be an integral part of land use planning and decision making at different levels,
ranging from the local to national scales. To answer the challenge of soil resource
degradation, there is an urgent need to develop a common, simple and transparent
method.
6.1 Kerala Government policies for the pollution of Soil The development of an economy is must for the implementation of appropriate
development projects in the areas of agriculture, forestry etc., A policy for soil is
imperative for improving the living conditions of people. Periodic monitoring of soil
fertility to maintain and improve its productivity. Some of the soil policies of Kerala
129
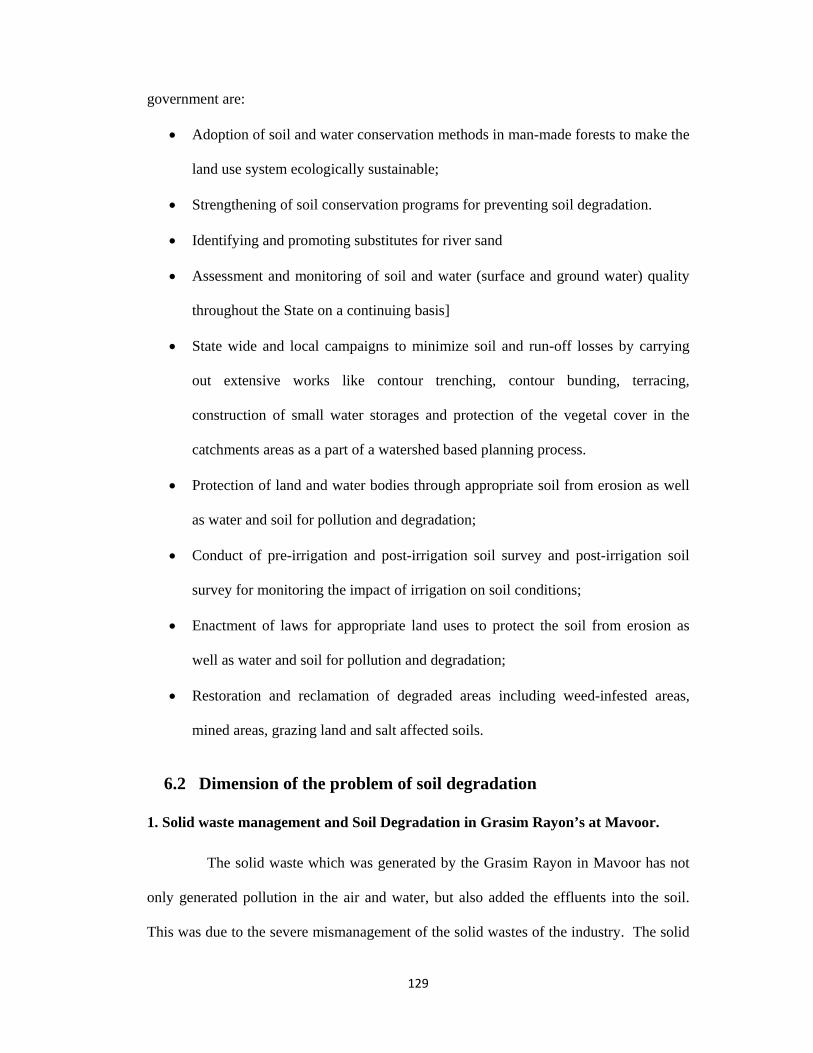
government are:
• Adoption of soil and water conservation methods in man-made forests to make the
land use system ecologically sustainable;
• Strengthening of soil conservation programs for preventing soil degradation.
• Identifying and promoting substitutes for river sand
• Assessment and monitoring of soil and water (surface and ground water) quality
throughout the State on a continuing basis]
• State wide and local campaigns to minimize soil and run-off losses by carrying
out extensive works like contour trenching, contour bunding, terracing,
construction of small water storages and protection of the vegetal cover in the
catchments areas as a part of a watershed based planning process.
• Protection of land and water bodies through appropriate soil from erosion as well
as water and soil for pollution and degradation;
• Conduct of pre-irrigation and post-irrigation soil survey and post-irrigation soil
survey for monitoring the impact of irrigation on soil conditions;
• Enactment of laws for appropriate land uses to protect the soil from erosion as
well as water and soil for pollution and degradation;
• Restoration and reclamation of degraded areas including weed-infested areas,
mined areas, grazing land and salt affected soils.
6.2 Dimension of the problem of soil degradation
1. Solid waste management and Soil Degradation in Grasim Rayon’s at Mavoor.
The solid waste which was generated by the Grasim Rayon in Mavoor has not
only generated pollution in the air and water, but also added the effluents into the soil.
This was due to the severe mismanagement of the solid wastes of the industry. The solid
130
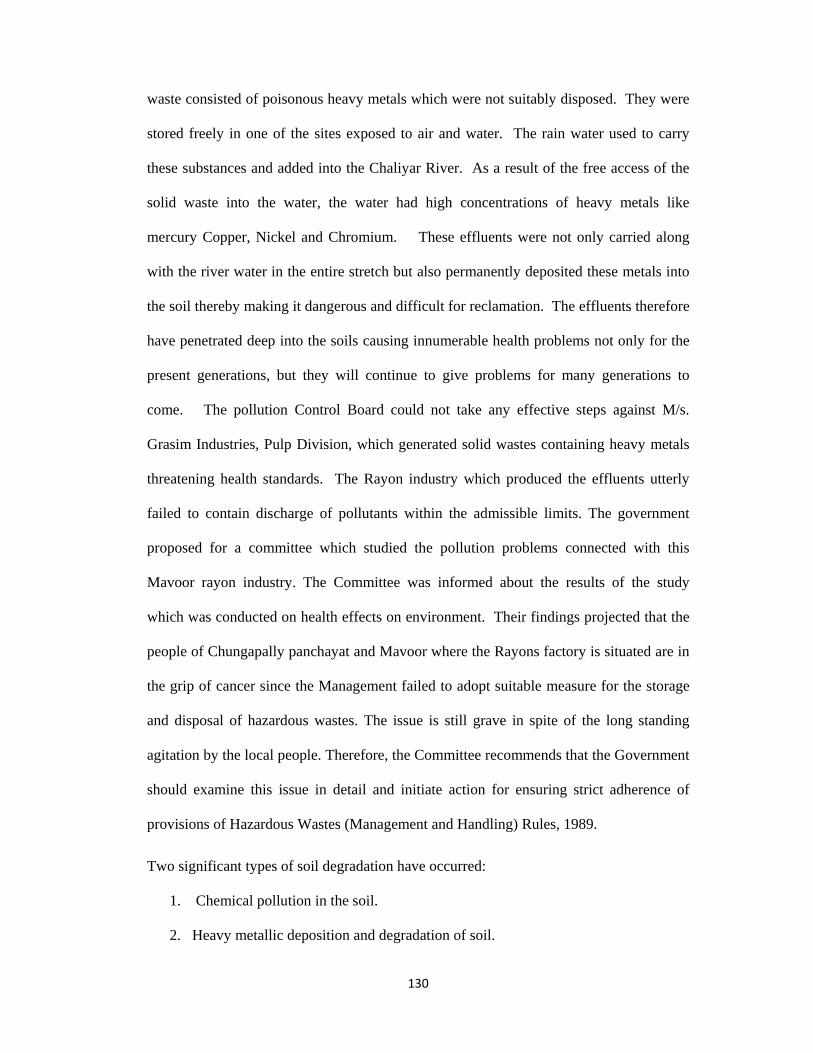
waste consisted of poisonous heavy metals which were not suitably disposed. They were
stored freely in one of the sites exposed to air and water. The rain water used to carry
these substances and added into the Chaliyar River. As a result of the free access of the
solid waste into the water, the water had high concentrations of heavy metals like
mercury Copper, Nickel and Chromium. These effluents were not only carried along
with the river water in the entire stretch but also permanently deposited these metals into
the soil thereby making it dangerous and difficult for reclamation. The effluents therefore
have penetrated deep into the soils causing innumerable health problems not only for the
present generations, but they will continue to give problems for many generations to
come. The pollution Control Board could not take any effective steps against M/s.
Grasim Industries, Pulp Division, which generated solid wastes containing heavy metals
threatening health standards. The Rayon industry which produced the effluents utterly
failed to contain discharge of pollutants within the admissible limits. The government
proposed for a committee which studied the pollution problems connected with this
Mavoor rayon industry. The Committee was informed about the results of the study
which was conducted on health effects on environment. Their findings projected that the
people of Chungapally panchayat and Mavoor where the Rayons factory is situated are in
the grip of cancer since the Management failed to adopt suitable measure for the storage
and disposal of hazardous wastes. The issue is still grave in spite of the long standing
agitation by the local people. Therefore, the Committee recommends that the Government
should examine this issue in detail and initiate action for ensuring strict adherence of
provisions of Hazardous Wastes (Management and Handling) Rules, 1989.
Two significant types of soil degradation have occurred:
1. Chemical pollution in the soil.
2. Heavy metallic deposition and degradation of soil.
131
These two types of pollution are different in their nature and effects. Their regional
concentration also differs between each other.
2. Chemical pollution:
Chemical pollution in the soils has occurred due to the inundation of the waters
from Chaliyar River into the agricultural fields. Chemical pollution is the result of the
chemical effluents which were released into the waters from the Industry. The risk and
spread of the chemical pollution could be observed in the nearby agricultural paddy fields
where the fields are inundated with huge water. Therefore the soil was sampled from the
agricultural fields where their concentrations is very high and they are vulnerable to
harmful pollutants present in the soils where food is grown, since it is a threat to the
health and it will get into our food cycle and affect the health of the population.
3. Heavy metallic deposition:
Heavy metals have occurred due to the mismanagement of the solid waste. The data
pertaining to the heavy metals was collected from the department of Kerala pollution
control board (KPCB). The soil examination was done at the vicinity of the river bed by
the KPCB.
6.3 Materials and methods
Primary survey was conducted at eleven places around the study area to collect
soil samples from agricultural fields to estimate the chemical composition of the coil.
These samples were tested at the Center for Water Resource Development and
Management (CWRDM) soil lab. The secondary data of soil was collected from soil
department of Malappuram and Calicut. The soil analyses were conducted for pH,
Electrical conductivity, Magnesium, Potassium, Calcium, and Sodium. The composition
of soil as existed prior to the starting of this industry was collected from soil department
132
of Malappuram and Kozhikode district. GIS was used to convert point data to spatial
continuous data by spatial interpolation.
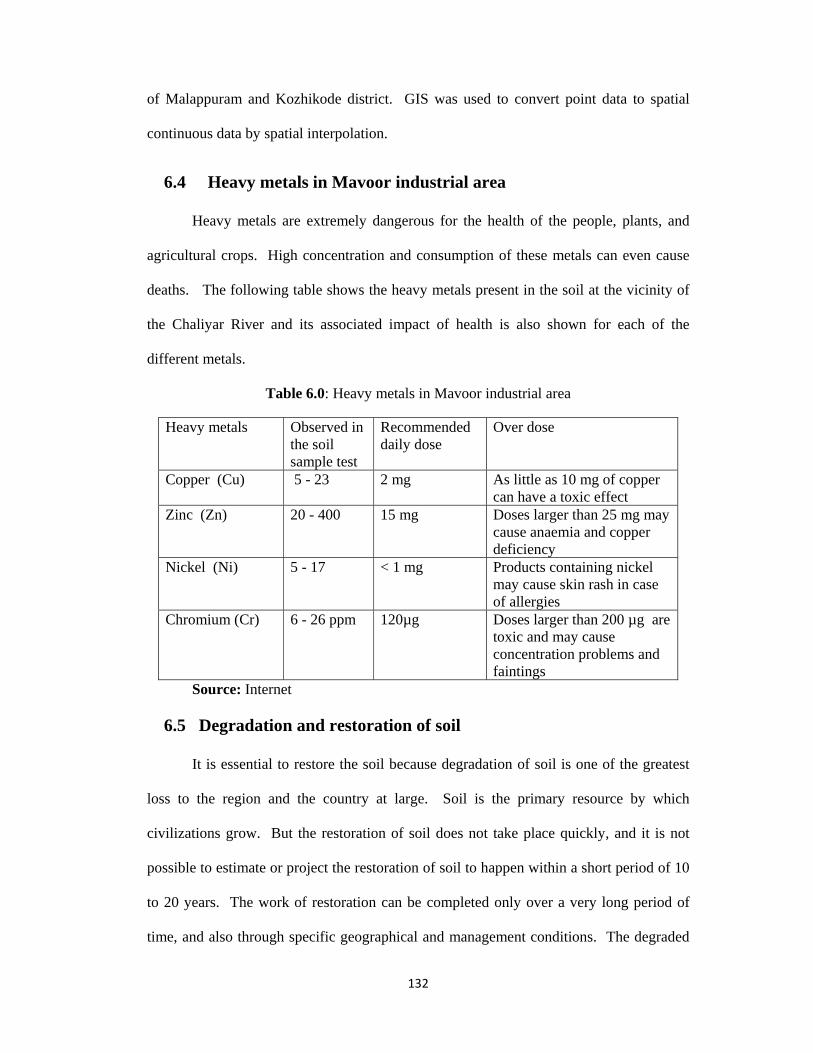
6.4 Heavy metals in Mavoor industrial area
Heavy metals are extremely dangerous for the health of the people, plants, and
agricultural crops. High concentration and consumption of these metals can even cause
deaths. The following table shows the heavy metals present in the soil at the vicinity of
the Chaliyar River and its associated impact of health is also shown for each of the
different metals.
Table 6.0: Heavy metals in Mavoor industrial area
Source: Internet
6.5 Degradation and restoration of soil
It is essential to restore the soil because degradation of soil is one of the greatest
loss to the region and the country at large. Soil is the primary resource by which
civilizations grow. But the restoration of soil does not take place quickly, and it is not
possible to estimate or project the restoration of soil to happen within a short period of 10
to 20 years. The work of restoration can be completed only over a very long period of
time, and also through specific geographical and management conditions. The degraded
Heavy metals Observed in the soil sample test
Recommended daily dose
Over dose
Copper (Cu) 5 - 23
2 mg As little as 10 mg of copper can have a toxic effect
Zinc (Zn)
20 - 400 15 mg Doses larger than 25 mg may cause anaemia and copper deficiency
Nickel (Ni) 5 - 17 < 1 mg Products containing nickel may cause skin rash in case of allergies
Chromium (Cr) 6 - 26 ppm
120µg Doses larger than 200 µg are toxic and may cause concentration problems and faintings
133
soils consisting of concentrated effluents are able to stand a chance for restoration under
the following conditions:
1. In soils under flooded condition the effluents decline gradually over seasons
successively.
2. Cultivation of Rice straw and grain did not contain any Cr in contrast to other
metals, even at very high level of metal addition.
3. The reversion of Cr(VI) to nonextractable form was more sharp in alluvial and
black soils while the laterite soil continued to maintain the extractable Cr(VI) for a
longer period of flooding indicating its potential toxicity.
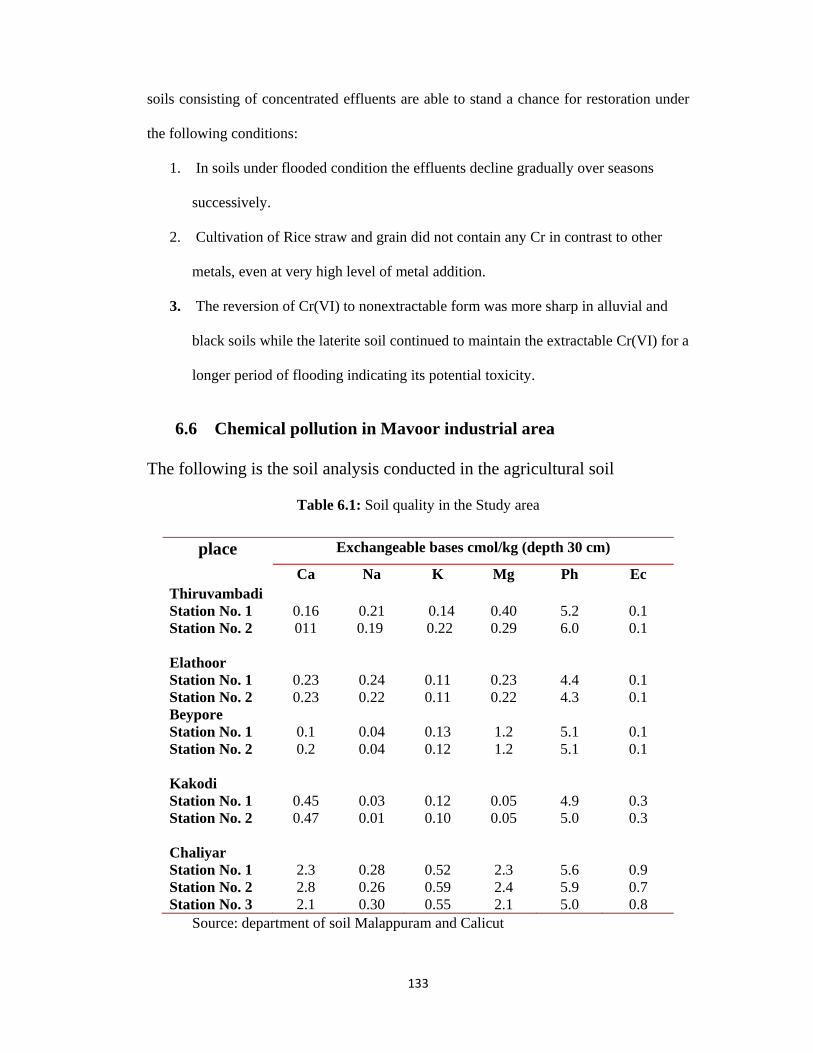
6.6 Chemical pollution in Mavoor industrial area
The following is the soil analysis conducted in the agricultural soil
Table 6.1: Soil quality in the Study area
Source: department of soil Malappuram and Calicut
place Exchangeable bases cmol/kg (depth 30 cm)
Ca Na K Mg Ph Ec Thiruvambadi Station No. 1 Station No. 2
0.16 011
0.21
0.19
0.14
0.22
0.40 0.29
5.2 6.0
0.1 0.1
Elathoor Station No. 1 Station No. 2
0.23 0.23
0.24 0.22
0.11 0.11
0.23 0.22
4.4 4.3
0.1 0.1
Beypore Station No. 1 Station No. 2
0.1 0.2
0.04 0.04
0.13 0.12
1.2 1.2
5.1 5.1
0.1 0.1
Kakodi Station No. 1 Station No. 2
0.45 0.47
0.03 0.01
0.12 0.10
0.05 0.05
4.9 5.0
0.3 0.3
Chaliyar Station No. 1 Station No. 2 Station No. 3
2.3 2.8 2.1
0.28 0.26 0.30
0.52 0.59 0.55
2.3 2.4 2.1
5.6 5.9 5.0
0.9 0.7 0.8
134
6.7 Spatial and temporal aspects in chemical composition of soil in
the study area
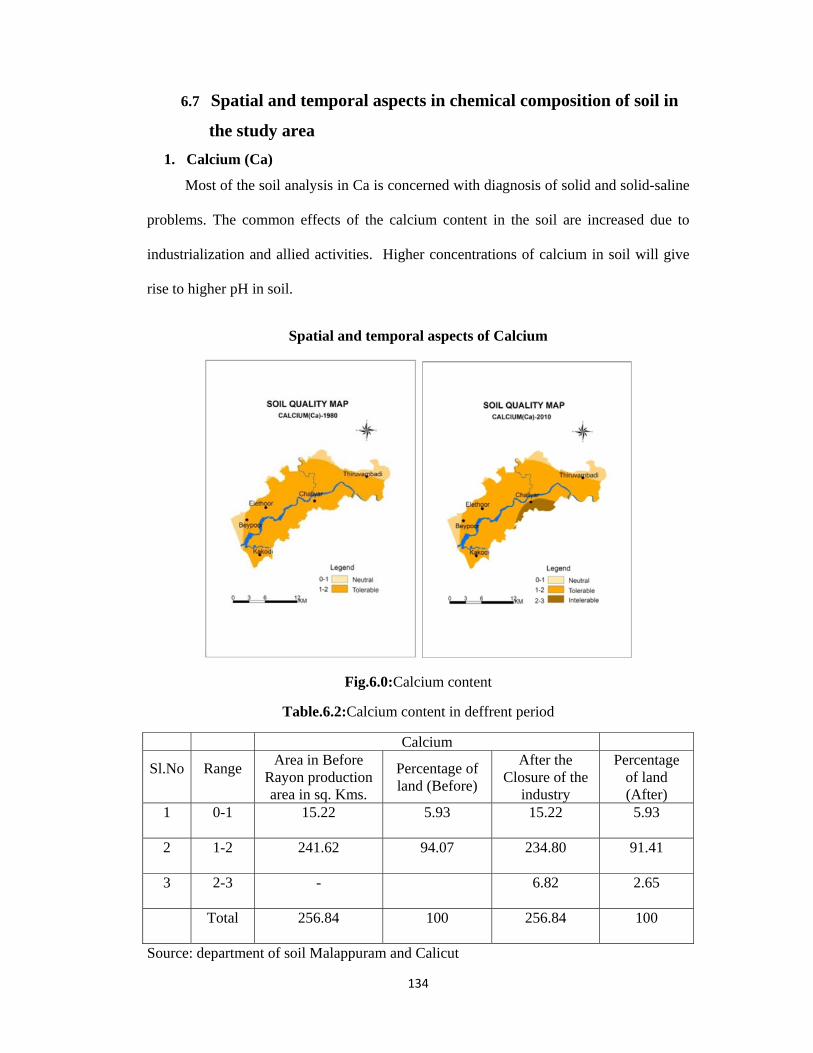
1. Calcium (Ca)
Most of the soil analysis in Ca is concerned with diagnosis of solid and solid-saline
problems. The common effects of the calcium content in the soil are increased due to
industrialization and allied activities. Higher concentrations of calcium in soil will give
rise to higher pH in soil.
Spatial and temporal aspects of Calcium
Fig.6.0:Calcium content
Table.6.2:Calcium content in deffrent period
Calcium
Sl.No Range Area in Before Rayon production area in sq. Kms.
Percentage of land (Before)
After the Closure of the
industry
Percentage of land (After)
1 0-1 15.22 5.93 15.22 5.93
2 1-2 241.62 94.07 234.80 91.41
3 2-3 - 6.82 2.65
Total 256.84 100 256.84 100
Source: department of soil Malappuram and Calicut
135
Thiruvambadi, Elathoor and Beypore are 0.1 cmol/kg and Kakodi and Chaliyar is
0.45cmol/kg and 2.3cmol/kg respectively. During the time of the 1980-1985 the
contamination of the calcium content on the core part of Mavoor industrial region is
neutral.
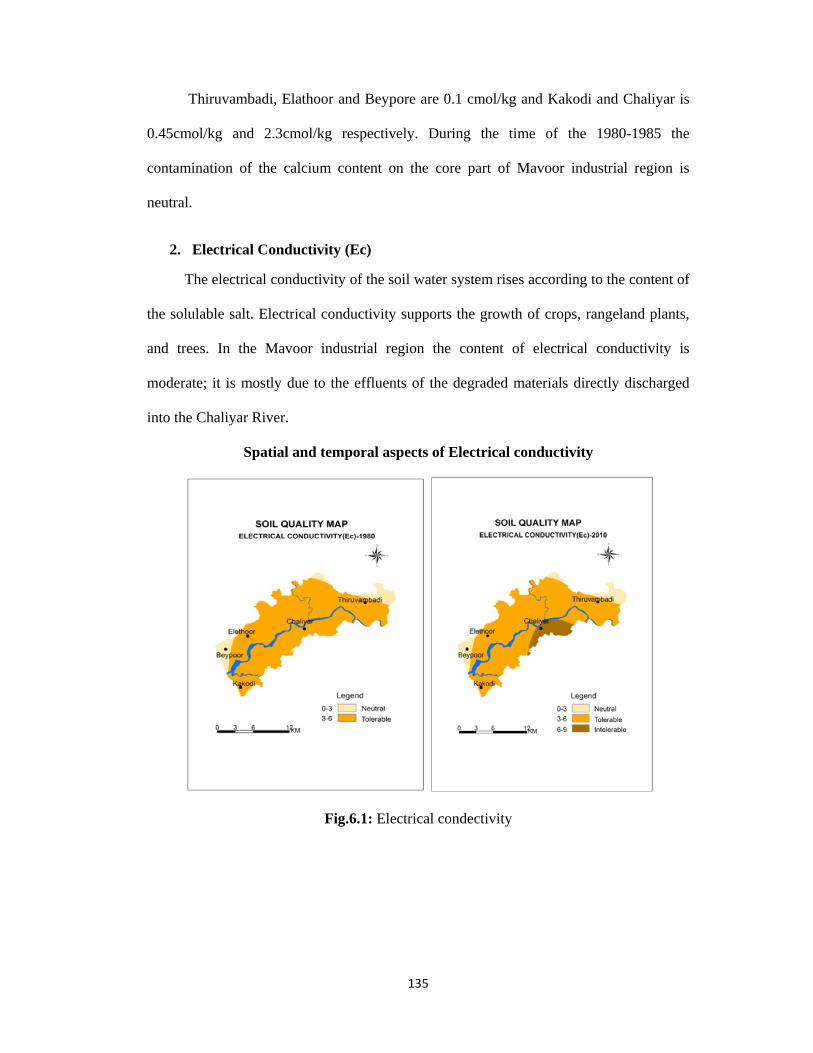
2. Electrical Conductivity (Ec)
The electrical conductivity of the soil water system rises according to the content of
the solulable salt. Electrical conductivity supports the growth of crops, rangeland plants,
and trees. In the Mavoor industrial region the content of electrical conductivity is
moderate; it is mostly due to the effluents of the degraded materials directly discharged
into the Chaliyar River.
Spatial and temporal aspects of Electrical conductivity
Fig.6.1: Electrical condectivity
136
Table.6.3:Electrical condectivity
Electrical conductivity Sl.No Range Area in Before
Rayon production area in sq. Kms.
Percentage of land (Before)
After the Closure of the industry
Percentage of land (After)
1 0-3 17.19 6.69 17.19 6.69
2 3-6 239.43 93.22 223.01 86.82
3 6-9 - 16.42 6.39
Total 256.84 100 256.84 100
Source: department of soil Malappuram and calicut
Sands have low conductivity and clays have high conductivity, soil electrical
conductivity correlates very strongly with particle size and soil texture. Soils prone to
drought or excessive water will show variations in soil texture that can be delineated
using soil electrical conductivity.
Since water-holding capacity is intimately linked to crop yields, there is
enormous potential to use soil electrical conductivity measurements to delineate areas
with different yield potential. Soil electrical conductivity also can delineate differences in
organic matter content and cation exchange capacity (also known as Celectrical
conductivity).
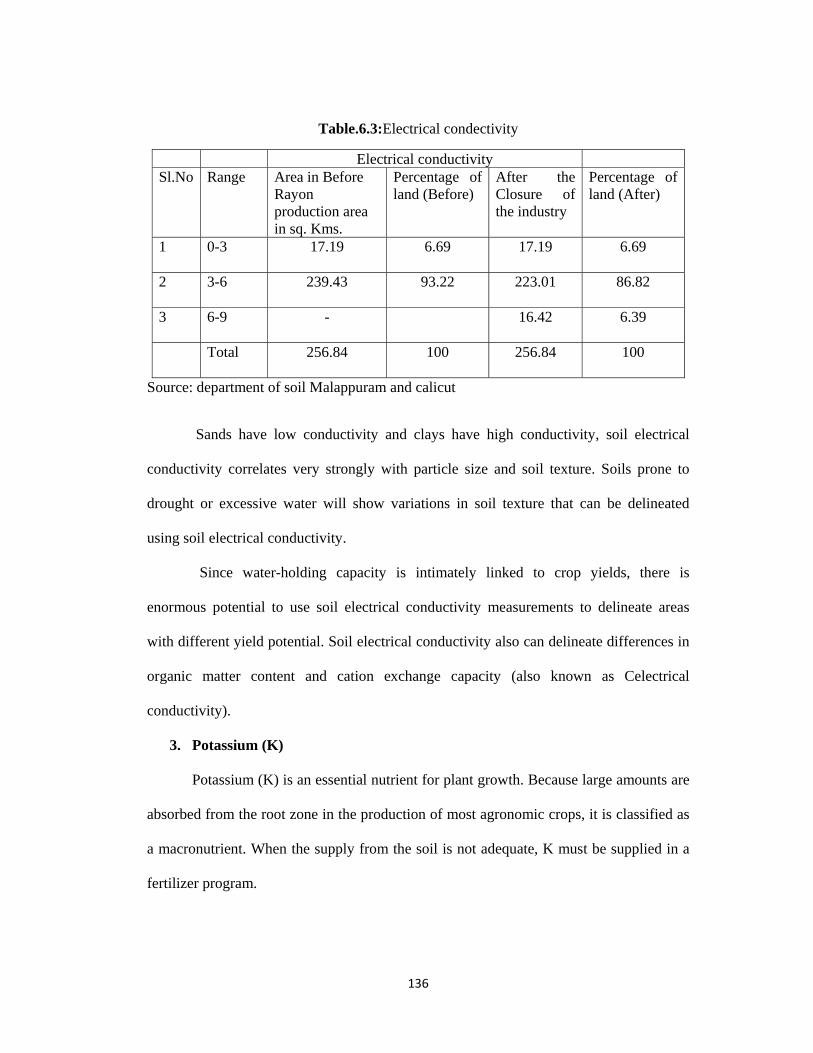
3. Potassium (K)
Potassium (K) is an essential nutrient for plant growth. Because large amounts are
absorbed from the root zone in the production of most agronomic crops, it is classified as
a macronutrient. When the supply from the soil is not adequate, K must be supplied in a
fertilizer program.
137
Spatial and temporal aspects of Potassium
Fig.6.2: Distribution of Potassium
Table.6.4: Potassium content in different period
Potassium Sl.No Area in Before
Rayon production area in sq. Kms.
Percentage of land (Before)
After the Closure of the industry
Percentage of land (After)
1 0-0.2 16.01 6.23 16.01 6.23 2 0.2-0.4 240.83 93.8 225.01 87.61 3 0.4-0.6 - 15.82 6.16 Total 256.84 100 256.84 100 Source: department of soil Malappuram and Calicut
After the closure of the industry the composition of local soil has undergone lot of
changes. Although quick and dramatic changes are not possible within a short time, yet
when man directly interferes definitely changes can happen fast and change the soil’s
ecosystem. The soils of the study area show a sudden transition. There are specific
pockets in the study area which show extremely high levels of potassium.
138
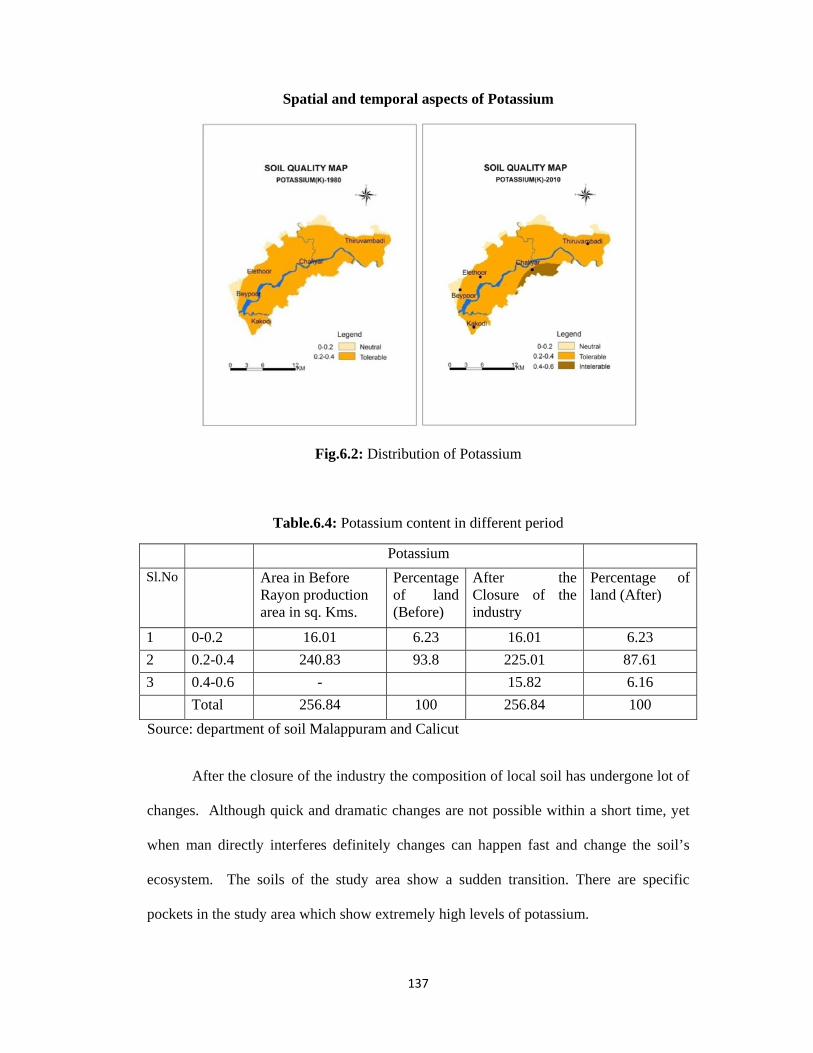
4. Magnesium (Mg)
Soil a non-renewable natural resource, has several functions in the biosphere and for
humans. It is a reactor, transformer and integrator of material and energy from other
natural resources.
Spatial and temporal aspects of Magnesium
Fig.6.3: Distribution of Magnesium
Table.6.5: Magneium content in different period
Magnesium Sl.No Range Area in Before
Rayon production area in sq. Kms.
Percentage of land (Before)
After the Closure of the industry
Percentage of land (After)
1 0-1 14.02 5.53 14.02 5.53
2 1-2 242.6 94.5 225.78 87.91
3 2-3 - 16.82 6.6
Total 256.84 100 256.84 100
Source: department of soil Malappuram and Calicut
139
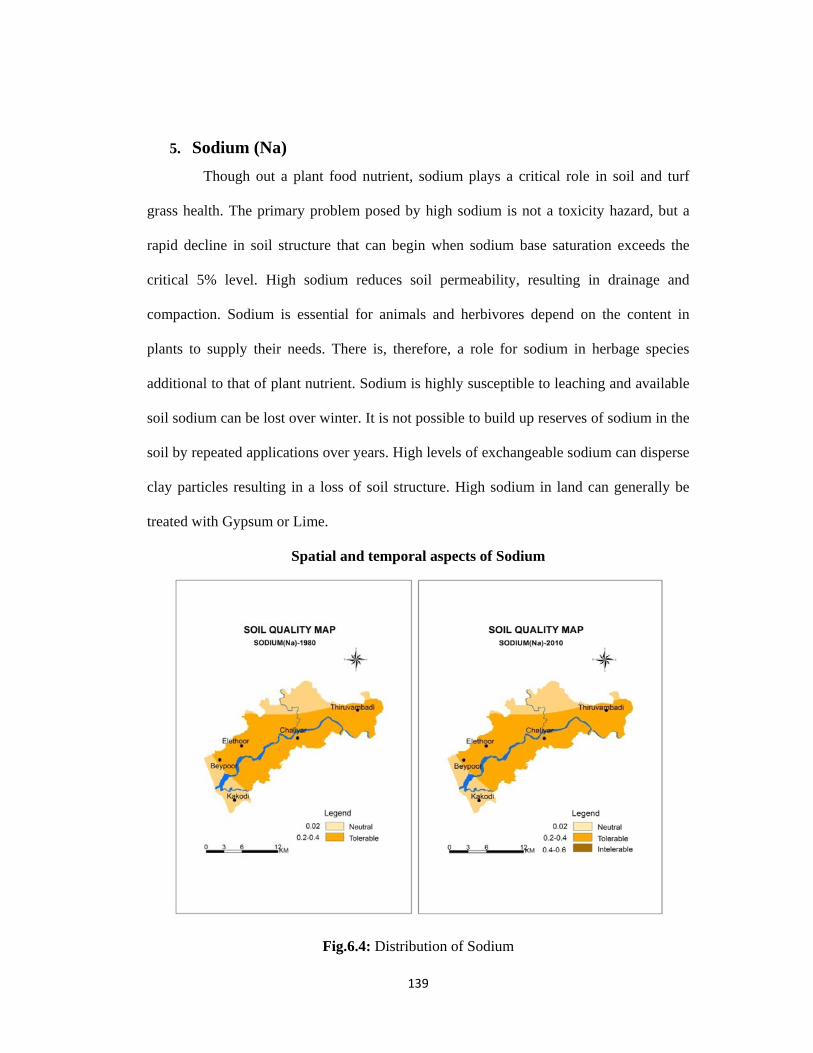
5. Sodium (Na) Though out a plant food nutrient, sodium plays a critical role in soil and turf
grass health. The primary problem posed by high sodium is not a toxicity hazard, but a
rapid decline in soil structure that can begin when sodium base saturation exceeds the
critical 5% level. High sodium reduces soil permeability, resulting in drainage and
compaction. Sodium is essential for animals and herbivores depend on the content in
plants to supply their needs. There is, therefore, a role for sodium in herbage species
additional to that of plant nutrient. Sodium is highly susceptible to leaching and available
soil sodium can be lost over winter. It is not possible to build up reserves of sodium in the
soil by repeated applications over years. High levels of exchangeable sodium can disperse
clay particles resulting in a loss of soil structure. High sodium in land can generally be
treated with Gypsum or Lime.
Spatial and temporal aspects of Sodium
Fig.6.4: Distribution of Sodium
140
Table.6.6: Sodium content in different period
Sodium Sl.No Range Area in Before
Rayon production area in sq. Kms.
Percentage of land (Before)
After the Closure of the industry
Percentage of land (After)
1 0-1 45.22 17.61 45.22 17.61
2 1-2 211.62 82.39 210.62 82.00
3 2-3 - 1.0 0.39
Total 256.84 100 256.84 100
Source: department of soil Malappuram and Calicut
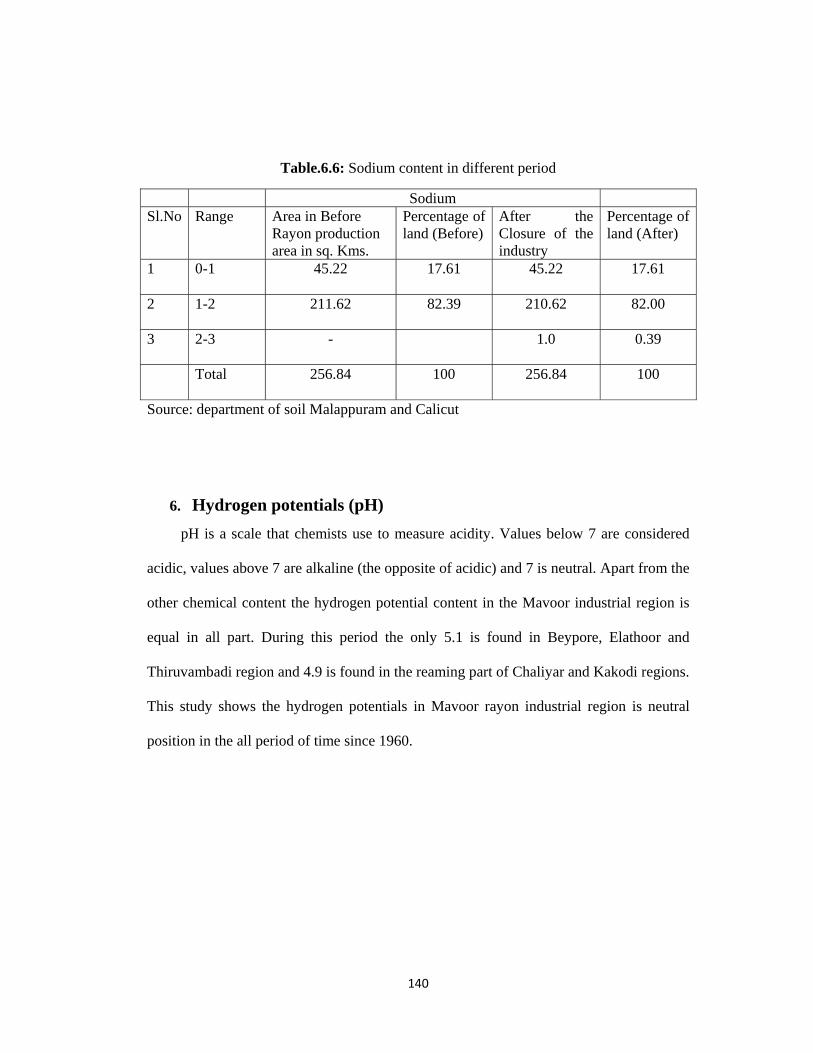
6. Hydrogen potentials (pH) pH is a scale that chemists use to measure acidity. Values below 7 are considered
acidic, values above 7 are alkaline (the opposite of acidic) and 7 is neutral. Apart from the
other chemical content the hydrogen potential content in the Mavoor industrial region is
equal in all part. During this period the only 5.1 is found in Beypore, Elathoor and
Thiruvambadi region and 4.9 is found in the reaming part of Chaliyar and Kakodi regions.
This study shows the hydrogen potentials in Mavoor rayon industrial region is neutral
position in the all period of time since 1960.
141
Spatial and temporal aspects of Hydrogen potential
Fig.6.5:Hytdrogen potential
Table.6.:7 Hydrogen potential content in different period
Hydrogen potential
Sl.No Range Area in Before Rayon
production area in sq. Kms.
Percentage of
land (Before)
After the Closure
of the industry
Percentage of
land (After)
1 4.5-5 -
2 5-5.5 256.84 100 82.93 32.3
3 5.5-6 173.91 67.7
Total 256.84 100 256.84 100
Source: department of soil Malappuram and Calicut
142
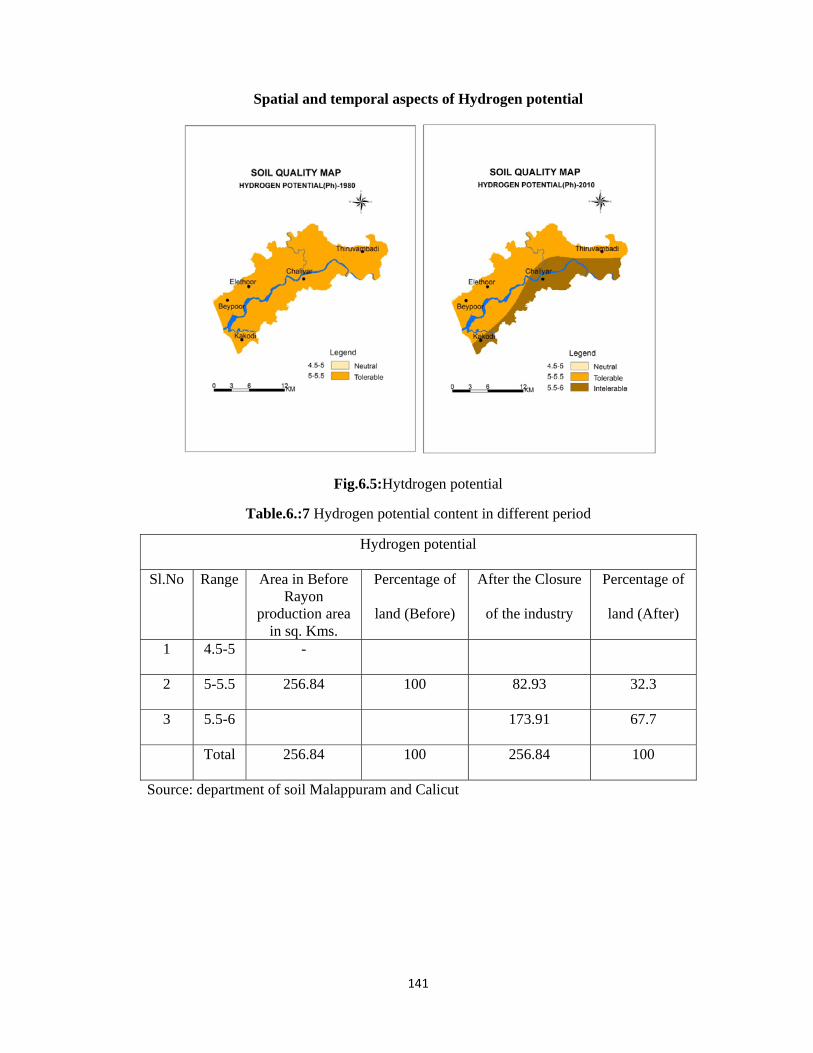
Soil Quality before and after the closure of the rayon industry
(a) (b)
Fig: 6.6 Soil qualities before and after the establishment of Rayon Industry
6.8 Conclusion
Investigations were carried out to characterize the polluted soils from rayon (Mavoor)
industry through a series of laboratory experiments. The soil problems identified in four
out of eleven locations studied in the rice growing area around were mainly due to high
pH (8.5-9) associated with high alkalinity. However, no heavy metal accumulation could
be attributed to the problem in agricultural fields. The liquid waste from rayon factory
was alkaline containing high oxidisable organic carbon (14 mg/1 COml) and low in metal
contaminants.