Embed Size (px)
Citation preview
Deformation–morphology correlations in electrically conductive carbon
nanotube—thermoplastic polyurethane nanocomposites
Hilmar Koernera, Weidong Liua, Max Alexanderb, Peter Miraub,Heather Dowtyb, Richard A. Vaiab,*
aUniversity of Dayton Research Institute, Dayton OH 45469, USAbAir Force Research Laboratory (AFRL/MLBP), Wright-Patterson Air Force Base, OH 45433, USA
Available online 17 March 2005
Abstract
Addition of small amounts (0.5–10 vol%) of multiwall carbon nanotubes (CNT) to thermoplastic elastomer Morthane produced polymer
nanocomposites with high electrical conductivity (sw1–10 S/cm), low electrical percolation (fw0.005) and enhancement of mechanical
properties including increased modulus and yield stress without loss of the ability to stretch the elastomer above 1000% before rupture. In situ
X-ray scattering during deformation indicated that these mechanical enhancements arise not only from the CNTs, but also from their impact
on soft-segment crystallization. The deformation behavior after yielding of the nanocomposites, irrespective of CNT concentration, is similar
to the unfilled elastomer, implying that the mechanistics of large deformation is mainly governed by the matrix. The relative enhancement of
the Young’s modulus of the nanocomposites is comparable to other elastomeric nanocomposites, implying that to the first order specific
chemical details of the elastomeric system is unimportant.
q 2005 Published by Elsevier Ltd.
Keywords: Nanocomposites; Elastomer; Multiwall carbon nanotube
1. Introduction
Elastomers with high electrical conductivity are critical
for applications ranging from seals between pipes used for
transferring flammable gases, electrostatic automotive
painting and electromagnetic shielding for mobile elec-
tronics. Traditionally, conductive fillers, such as carbon
black, chopped carbon fiber or metallic flakes are used.
Conductivity is established by percolative network for-
mation of the fillers and limited by carrier transport
(hopping or tunneling) between filler particles. Thus the
extent of filler dispersion, aspect ratio of the filler, and
wettability of the filler by the elastomeric medium are key
morphological characteristics in determining the conduc-
tivity of the system. The relatively large volume fractions
(O20 vol%) necessary though, negatively impact deform-
ability, processibility, surface finish, and limit the ability to
maintain desired conductivity at extreme deformations
0032-3861/$ - see front matter q 2005 Published by Elsevier Ltd.
doi:10.1016/j.polymer.2005.02.025
* Corresponding author. Tel.: C1 937 255 9184; fax: C1 937 255 9157.
E-mail address: [email protected] (R.A. Vaia).
(O100%). Furthermore, the use of metallic fillers results
in galvanic corrosion issues in many service environments.
The broad availability of nanoscale multiwall carbon
nanotubes with large aspect ratios (O100) and high
electrical conductivity (sw18,000 S/cm along tube axis)
have lead to a resurgence of applied and fundamental
investigations of filled polymers, driven by the potential to
address limitations of classic conductive fillers. Whether
tubes (e.g. single and multiwall carbon nanotubes) or plates
(e.g. exfoliated graphite), the nanoscopic dimensions and
high aspect ratios inherent in these polymer nanocomposites
result in six interrelated characteristics distinguishing them
from classic fillers: (1) low percolation threshold (w0.1–
2 vol%); (2) particle-particle correlation (orientation and
position) arising at low volume fractions (fC!10K3); (3)
large number density of particles per particle volume (106–
108 particles/mm3); (4) extensive interfacial area per volume
of particles (103–104 m2/ml); (5) short interparticle spacing
(10–50 nm at fw1–8 vol%); and (6) comparable size scales
between the rigid nanoparticle inclusion, distance between
particles, and the relaxation volume of the polymer matrix.
These characteristics provide materials with properties of
traditional filled systems, but at lower loadings and thus
enhanced processibility. Additionally, novel properties
Polymer 46 (2005) 4405–4420
www.elsevier.com/locate/polymer
H. Koerner et al. / Polymer 46 (2005) 4405–44204406
absent in traditional filled systems are reported. Recent
reviews of materials fabrication and fundamental structure-
property correlations can be found in the literature [1].
Much of the current effort in polymer nanocomposites
though is plagued by uncertainties as to what is possible,
necessitating substantially more detailed structure-proces-
sing-property investigations.
Carbon nanotube filled plastics are currently under
intensive investigation for enhancement of structural [2,3],
stress-recovery [4], electrical [5,6] and thermal performance
[7,8], while maintaining the inherent processibility and
deformability of the matrix resin. Optimization of electrical
characteristics presents an interesting dilemma. Maximum
dispersion of the nanotubes is desired to provide the lowest
percolation threshold; however, this necessitates favorable
polymer–tube interactions, which will result in a strongly
bound polymer interfacial layer. Conversely, this will
establish a minimum tube–tube distance, which ultimately
determines electrical conductivity by limiting carrier
transport and creating capacitive contacts between tubes.
In addition, for conductive elastomers maximization of
deformability implies minimizing the strength of tube–
polymer interactions. One possibility to address these
conflicting requirements is to utilize a nanotube with a
heterogeneous surface, which spatially segregates strong
tube–tube interactions favoring aggregation from maximum
tube–polymer interactions favoring dispersion.
Following these suppositions, aspects of the defor-
mation-morphology correlation of an electrically conduc-
tive, elastomeric nanocomposite are presented. Uniaxial
elongation in combination with in situ X-ray studies indicate
that nanotube orientation and polymer deformation are
coupled, altering the strain induced soft-segment crystal-
linity and the mechanical response of the polyurethane at
increasing strain. The complex interrelation implies that the
extensive characterization discussed herein is necessary, but
still not sufficient to effectively establish deformation-
morphology relationships for nanotube containing
elastomers.
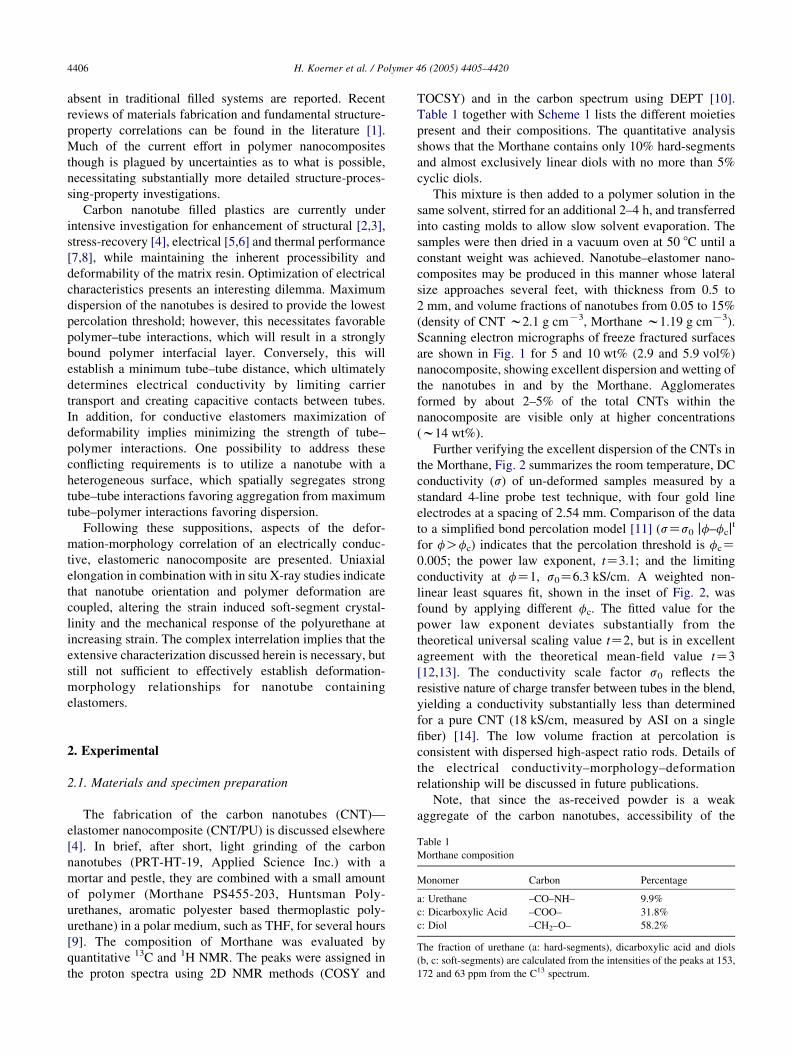
Table 1
Morthane composition
Monomer Carbon Percentage
a: Urethane –CO–NH– 9.9%
c: Dicarboxylic Acid –COO– 31.8%
c: Diol –CH2–O– 58.2%
The fraction of urethane (a: hard-segments), dicarboxylic acid and diols
(b, c: soft-segments) are calculated from the intensities of the peaks at 153,
172 and 63 ppm from the C13 spectrum.
2. Experimental
2.1. Materials and specimen preparation
The fabrication of the carbon nanotubes (CNT)—
elastomer nanocomposite (CNT/PU) is discussed elsewhere
[4]. In brief, after short, light grinding of the carbon
nanotubes (PRT-HT-19, Applied Science Inc.) with a
mortar and pestle, they are combined with a small amount
of polymer (Morthane PS455-203, Huntsman Poly-
urethanes, aromatic polyester based thermoplastic poly-
urethane) in a polar medium, such as THF, for several hours
[9]. The composition of Morthane was evaluated by
quantitative 13C and 1H NMR. The peaks were assigned in
the proton spectra using 2D NMR methods (COSY and
TOCSY) and in the carbon spectrum using DEPT [10].
Table 1 together with Scheme 1 lists the different moieties
present and their compositions. The quantitative analysis
shows that the Morthane contains only 10% hard-segments
and almost exclusively linear diols with no more than 5%
cyclic diols.
This mixture is then added to a polymer solution in the
same solvent, stirred for an additional 2–4 h, and transferred
into casting molds to allow slow solvent evaporation. The
samples were then dried in a vacuum oven at 50 8C until a
constant weight was achieved. Nanotube–elastomer nano-
composites may be produced in this manner whose lateral
size approaches several feet, with thickness from 0.5 to
2 mm, and volume fractions of nanotubes from 0.05 to 15%
(density of CNT w2.1 g cmK3, Morthane w1.19 g cmK3).
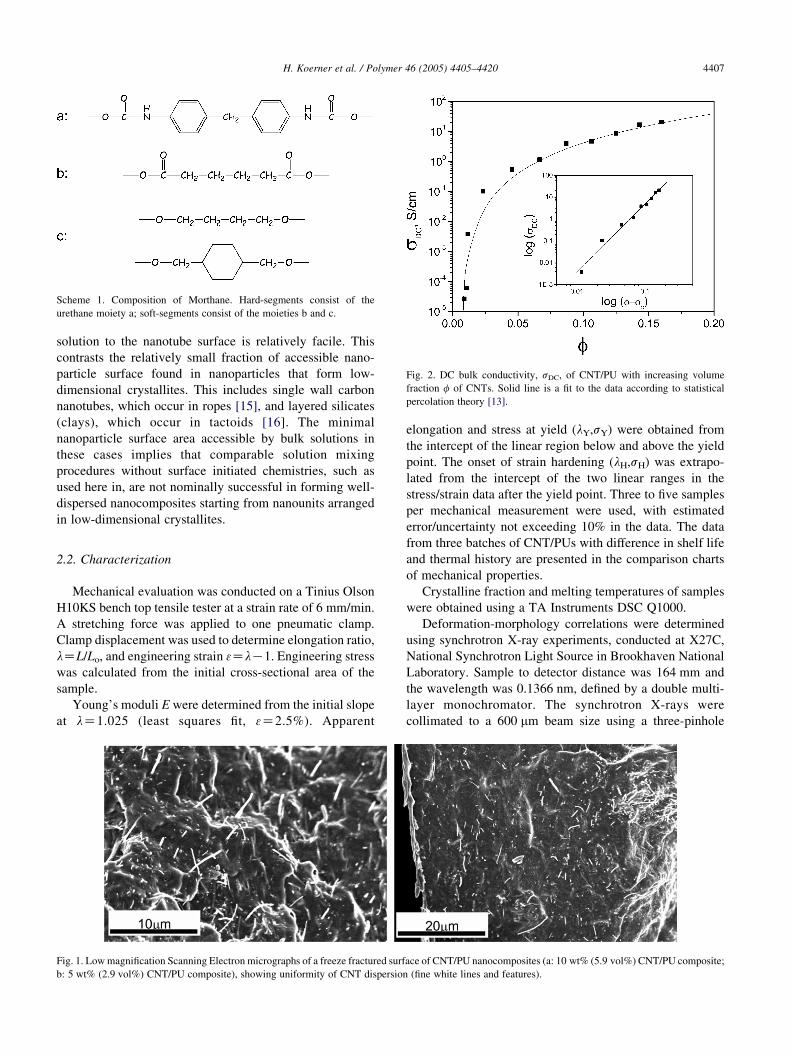
Scanning electron micrographs of freeze fractured surfaces
are shown in Fig. 1 for 5 and 10 wt% (2.9 and 5.9 vol%)
nanocomposite, showing excellent dispersion and wetting of
the nanotubes in and by the Morthane. Agglomerates
formed by about 2–5% of the total CNTs within the
nanocomposite are visible only at higher concentrations
(w14 wt%).
Further verifying the excellent dispersion of the CNTs in
the Morthane, Fig. 2 summarizes the room temperature, DC
conductivity (s) of un-deformed samples measured by a
standard 4-line probe test technique, with four gold line
electrodes at a spacing of 2.54 mm. Comparison of the data
to a simplified bond percolation model [11] (sZs0 jf–fcjt
for fOfc) indicates that the percolation threshold is fcZ0.005; the power law exponent, tZ3.1; and the limiting
conductivity at fZ1, s0Z6.3 kS/cm. A weighted non-
linear least squares fit, shown in the inset of Fig. 2, was
found by applying different fc. The fitted value for the
power law exponent deviates substantially from the
theoretical universal scaling value tZ2, but is in excellent
agreement with the theoretical mean-field value tZ3
[12,13]. The conductivity scale factor s0 reflects the
resistive nature of charge transfer between tubes in the blend,
yielding a conductivity substantially less than determined
for a pure CNT (18 kS/cm, measured by ASI on a single
fiber) [14]. The low volume fraction at percolation is
consistent with dispersed high-aspect ratio rods. Details of
the electrical conductivity–morphology–deformation
relationship will be discussed in future publications.
Note, that since the as-received powder is a weak
aggregate of the carbon nanotubes, accessibility of the
Scheme 1. Composition of Morthane. Hard-segments consist of the
urethane moiety a; soft-segments consist of the moieties b and c.
Fig. 2. DC bulk conductivity, sDC, of CNT/PU with increasing volume
fraction f of CNTs. Solid line is a fit to the data according to statistical
percolation theory [13].
H. Koerner et al. / Polymer 46 (2005) 4405–4420 4407
solution to the nanotube surface is relatively facile. This
contrasts the relatively small fraction of accessible nano-
particle surface found in nanoparticles that form low-
dimensional crystallites. This includes single wall carbon
nanotubes, which occur in ropes [15], and layered silicates
(clays), which occur in tactoids [16]. The minimal
nanoparticle surface area accessible by bulk solutions in
these cases implies that comparable solution mixing
procedures without surface initiated chemistries, such as
used here in, are not nominally successful in forming well-
dispersed nanocomposites starting from nanounits arranged
in low-dimensional crystallites.
2.2. Characterization
Mechanical evaluation was conducted on a Tinius Olson
H10KS bench top tensile tester at a strain rate of 6 mm/min.
A stretching force was applied to one pneumatic clamp.
Clamp displacement was used to determine elongation ratio,
lZL/Lo, and engineering strain 3ZlK1. Engineering stress
was calculated from the initial cross-sectional area of the
sample.
Young’s moduli E were determined from the initial slope
at lZ1.025 (least squares fit, 3Z2.5%). Apparent
Fig. 1. Low magnification Scanning Electron micrographs of a freeze fractured surf
b: 5 wt% (2.9 vol%) CNT/PU composite), showing uniformity of CNT dispersion
elongation and stress at yield (lY,sY) were obtained from
the intercept of the linear region below and above the yield
point. The onset of strain hardening (lH,sH) was extrapo-
lated from the intercept of the two linear ranges in the
stress/strain data after the yield point. Three to five samples
per mechanical measurement were used, with estimated
error/uncertainty not exceeding 10% in the data. The data
from three batches of CNT/PUs with difference in shelf life
and thermal history are presented in the comparison charts
of mechanical properties.
Crystalline fraction and melting temperatures of samples
were obtained using a TA Instruments DSC Q1000.
Deformation-morphology correlations were determined
using synchrotron X-ray experiments, conducted at X27C,
National Synchrotron Light Source in Brookhaven National
Laboratory. Sample to detector distance was 164 mm and
the wavelength was 0.1366 nm, defined by a double multi-
layer monochromator. The synchrotron X-rays were
collimated to a 600 mm beam size using a three-pinhole
ace of CNT/PU nanocomposites (a: 10 wt% (5.9 vol%) CNT/PU composite;
(fine white lines and features).
H. Koerner et al. / Polymer 46 (2005) 4405–44204408
collimator [17]. 40!4!0.5 mm3 samples were mounted in
a uniaxial, symmetrical extension device designed to expose
the gauge section of the sample to the X-ray beam at
arbitrary elongations. The samples were stretched stepwise
to increasing elongations and their X-ray diffraction patterns
obtained at each elongation after 2 min of relaxation.
WAXD images were obtained using a Mar CCD detector.
2.3. X-ray data analysis
The X-ray data was initially corrected for background
scattering, detector sensitivity and variation of incident
X-ray flux.
Azimuthally averaged intensity versus 2Q were obtained
using the software package Fit2D [18]. Deconvolution of
the crystalline peaks and the broad amorphous halo from the
integral averaged 2-theta scans was carried out using a
routine in Genplotw with a combination of Gaussian
(amorphous) and Lorentzian (crystalline) peak profiles.
The polymer crystallinity index and Hermans orientation
parameter of the CNTs were determined from in situ X-ray
scattering.
An internal method was applied to determine the
polymer crystallinity index as described in Alexander
[19]. The crystalline and amorphous phases give distinct
X-ray diffraction patterns. After removal of background
scattering, the diffraction intensity is, to a good approxi-
mation, the superposition of the diffraction intensity from
the crystalline, Ic, and amorphous phases, Ia each being
proportional to the relative volume fraction of the respective
phases (assuming random distribution of the phases in the
scattering plane). The fraction crystallinity, or crystalline
index, is then:
CI ZjZIc
ðIc C IaÞ(1)
It is important to note that the percent of crystallinity of a
given sample determined by different techniques may be
different [19] and we therefore refer to that obtained from
X-ray diffraction as the crystallinity index.
A characteristic feature of X-ray patterns from a uniaxial
oriented sample is the presence of arcs. The azimuthal width
of the arcs provides information about the degree of the
orientation of the respective scattering planes. The relative
intensity along the azimuth, (I(f)) at a 2Q is related to the
orientation distribution function (ODF) of the scattering
planes. Approximating the ODF as a Legendre polynomial
series in cos f, the Hermans orientation parameter Sd (or
equivalently P2) is the second moment average of the ODF
and expressed as:
Sd Z3hcos2 4iK1
2(2)
For uniaxial orientation, Sd assumes values from K0.5
to 1. K0.5 reflects perfect alignment in the plane
perpendicular to the macroscopic elongation; 0 reflects
random orientation; and 1 reflects perfect alignment along
the uniaxial elongation. Herein, the orientation parameter of
the carbon nanotubes, crystalline polymer and amorphous
polymer represents the relative relation between the
direction of uniaxial deformation and the axis of the carbon
nanotube; the normal to the polymer crystallite surface and
largest dimension of the distorted amorphous polymer
chain; respectively. The assumed correspondence to the
X-ray reflections analyzed are: the normal to the graphene
plane in the tube side wall is on average perpendicular to the
tube axis; the plane containing the crystalline soft-segments
are perpendicular to the crystallite surface; and the variation
of azimuthal intensity of the amorphous scattering reflects
increased chain-chain correlation within planes parallel to
the largest component of the ellipsoid reflecting the
distorted random coil configuration. In all cases, the
azimuthal intensity enhancement is orthogonal to
the increase in the orientation distribution function
discussed. Orientation parameters reported are the average
of the orientation parameter determined from each quadrant.
The four values differed by 10% at the most, establishing the
uncertainty range for these measurements.
3. Results
Polyurethanes have been used in a wide range of
applications such as automobile, paint, furniture and textile
industries. Although polymer composition varies with
different products, a urethane linkage covalently bonds
‘hard’ and ‘soft’ segments into a multi-block copolymer.
The two-phase morphology provides the key to controlling
performance and versatility in tuning properties by varying
the composition or content of one or the other phase [20].
The general assumption is that hard-segments break at low
deformations because of local stresses. In addition to nano-
fibril formation, hard-segments rotate parallel to the stress
direction at higher elongations and the soft-segments will
undergo stress-induced crystallization [21].
The nanocomposite discussed herein is comprised of a
thermoplastic polyurethane elastomer (Morthane PS455-
203, Huntsman Polyurethanes) with carbon nanotubes
(CNT: PRT-HT-19, Applied Science Inc.). Morthane
exhibits a low glass transition temperature (TgZK45 8C),
near-ambient melting of soft-segment crystallites (90% soft-
segment content according to NMR, with Tm,sZ48 8C),
outstanding solvent resistance and displays extreme defor-
mation (w700%) and strain-induced crystallization. PRT-
HT-19 are vapor phase produced carbon nanotubes
(nanofibers), approximately 50–120 nm in diameter and
greater than 10 mm in length. A fraction of the tubes contain
graphene sidewalls, which are slightly askew from the tube
axis resulting in so-called ‘bamboo’ tube architecture with
random terminal graphene-sheet edges that leads to a
chemically heterogeneous surface. Additionally, this
H. Koerner et al. / Polymer 46 (2005) 4405–4420 4409
architecture results in a relatively more flexible tube
compared to multi and single wall carbon nanotubes
whose walls are comprised of continuous graphene sheets.
After discussing the uniaxial elongation of the CNT/PU
nanocomposites, morphology changes occurring during
comparable deformation will be presented.
3.1. Mechanical characteristics
To initially visualize the impact of CNT loading on the
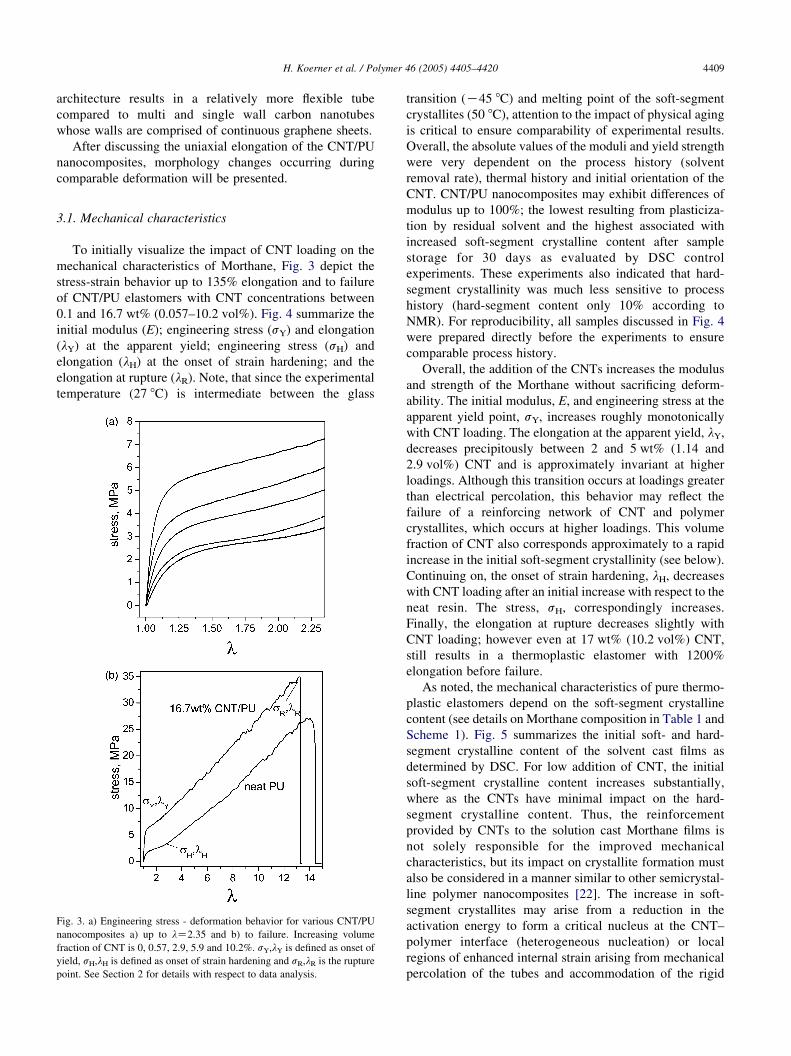
mechanical characteristics of Morthane, Fig. 3 depict the
stress-strain behavior up to 135% elongation and to failure
of CNT/PU elastomers with CNT concentrations between
0.1 and 16.7 wt% (0.057–10.2 vol%). Fig. 4 summarize the
initial modulus (E); engineering stress (sY) and elongation
(lY) at the apparent yield; engineering stress (sH) and
elongation (lH) at the onset of strain hardening; and the
elongation at rupture (lR). Note, that since the experimental
temperature (27 8C) is intermediate between the glass
Fig. 3. a) Engineering stress - deformation behavior for various CNT/PU
nanocomposites a) up to lZ2.35 and b) to failure. Increasing volume
fraction of CNT is 0, 0.57, 2.9, 5.9 and 10.2%. sY,lY is defined as onset of
yield, sH,lH is defined as onset of strain hardening and sR,lR is the rupture
point. See Section 2 for details with respect to data analysis.
transition (K45 8C) and melting point of the soft-segment
crystallites (50 8C), attention to the impact of physical aging
is critical to ensure comparability of experimental results.
Overall, the absolute values of the moduli and yield strength
were very dependent on the process history (solvent
removal rate), thermal history and initial orientation of the
CNT. CNT/PU nanocomposites may exhibit differences of
modulus up to 100%; the lowest resulting from plasticiza-
tion by residual solvent and the highest associated with
increased soft-segment crystalline content after sample
storage for 30 days as evaluated by DSC control
experiments. These experiments also indicated that hard-
segment crystallinity was much less sensitive to process
history (hard-segment content only 10% according to
NMR). For reproducibility, all samples discussed in Fig. 4
were prepared directly before the experiments to ensure
comparable process history.
Overall, the addition of the CNTs increases the modulus
and strength of the Morthane without sacrificing deform-
ability. The initial modulus, E, and engineering stress at the
apparent yield point, sY, increases roughly monotonically
with CNT loading. The elongation at the apparent yield, lY,
decreases precipitously between 2 and 5 wt% (1.14 and
2.9 vol%) CNT and is approximately invariant at higher
loadings. Although this transition occurs at loadings greater
than electrical percolation, this behavior may reflect the
failure of a reinforcing network of CNT and polymer
crystallites, which occurs at higher loadings. This volume
fraction of CNT also corresponds approximately to a rapid
increase in the initial soft-segment crystallinity (see below).
Continuing on, the onset of strain hardening, lH, decreases
with CNT loading after an initial increase with respect to the
neat resin. The stress, sH, correspondingly increases.
Finally, the elongation at rupture decreases slightly with
CNT loading; however even at 17 wt% (10.2 vol%) CNT,
still results in a thermoplastic elastomer with 1200%
elongation before failure.
As noted, the mechanical characteristics of pure thermo-
plastic elastomers depend on the soft-segment crystalline
content (see details on Morthane composition in Table 1 and
Scheme 1). Fig. 5 summarizes the initial soft- and hard-
segment crystalline content of the solvent cast films as
determined by DSC. For low addition of CNT, the initial
soft-segment crystalline content increases substantially,
where as the CNTs have minimal impact on the hard-
segment crystalline content. Thus, the reinforcement
provided by CNTs to the solution cast Morthane films is
not solely responsible for the improved mechanical
characteristics, but its impact on crystallite formation must
also be considered in a manner similar to other semicrystal-
line polymer nanocomposites [22]. The increase in soft-
segment crystallites may arise from a reduction in the
activation energy to form a critical nucleus at the CNT–
polymer interface (heterogeneous nucleation) or local
regions of enhanced internal strain arising from mechanical
percolation of the tubes and accommodation of the rigid
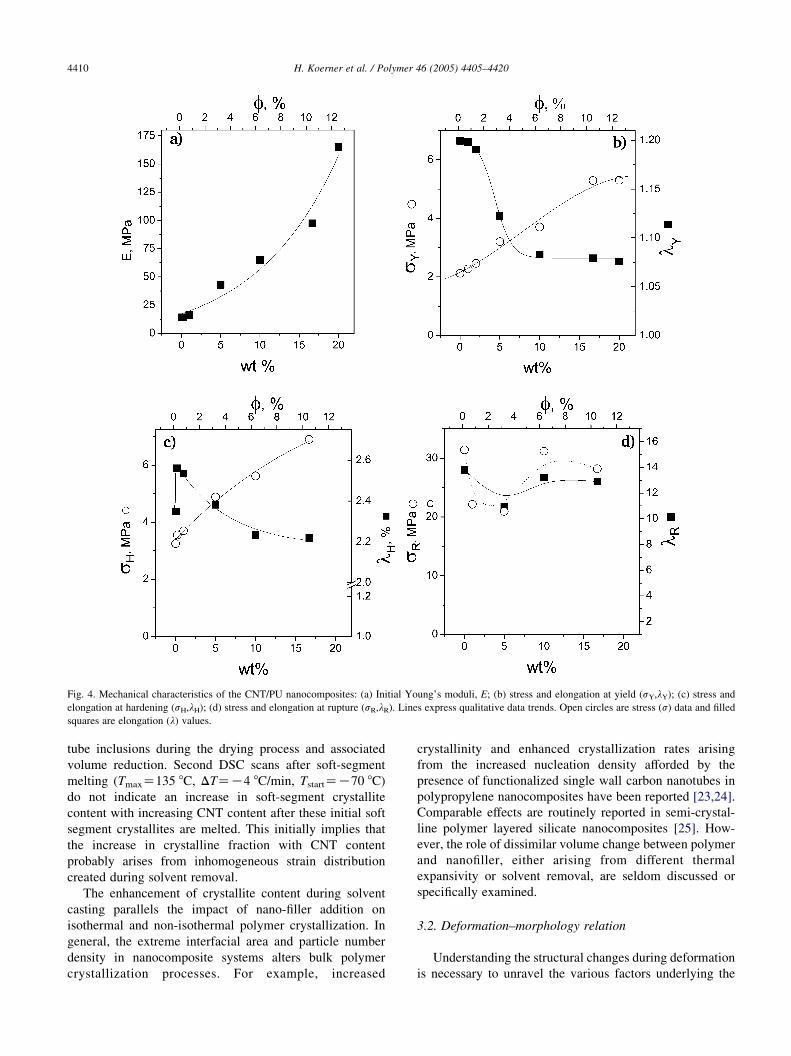
Fig. 4. Mechanical characteristics of the CNT/PU nanocomposites: (a) Initial Young’s moduli, E; (b) stress and elongation at yield (sY,lY); (c) stress and
elongation at hardening (sH,lH); (d) stress and elongation at rupture (sR,lR). Lines express qualitative data trends. Open circles are stress (s) data and filled
squares are elongation (l) values.
H. Koerner et al. / Polymer 46 (2005) 4405–44204410
tube inclusions during the drying process and associated
volume reduction. Second DSC scans after soft-segment
melting (TmaxZ135 8C, DTZK4 8C/min, TstartZK70 8C)
do not indicate an increase in soft-segment crystallite
content with increasing CNT content after these initial soft
segment crystallites are melted. This initially implies that
the increase in crystalline fraction with CNT content
probably arises from inhomogeneous strain distribution
created during solvent removal.
The enhancement of crystallite content during solvent
casting parallels the impact of nano-filler addition on
isothermal and non-isothermal polymer crystallization. In
general, the extreme interfacial area and particle number
density in nanocomposite systems alters bulk polymer
crystallization processes. For example, increased
crystallinity and enhanced crystallization rates arising
from the increased nucleation density afforded by the
presence of functionalized single wall carbon nanotubes in
polypropylene nanocomposites have been reported [23,24].
Comparable effects are routinely reported in semi-crystal-
line polymer layered silicate nanocomposites [25]. How-
ever, the role of dissimilar volume change between polymer
and nanofiller, either arising from different thermal
expansivity or solvent removal, are seldom discussed or
specifically examined.
3.2. Deformation–morphology relation
Understanding the structural changes during deformation
is necessary to unravel the various factors underlying the
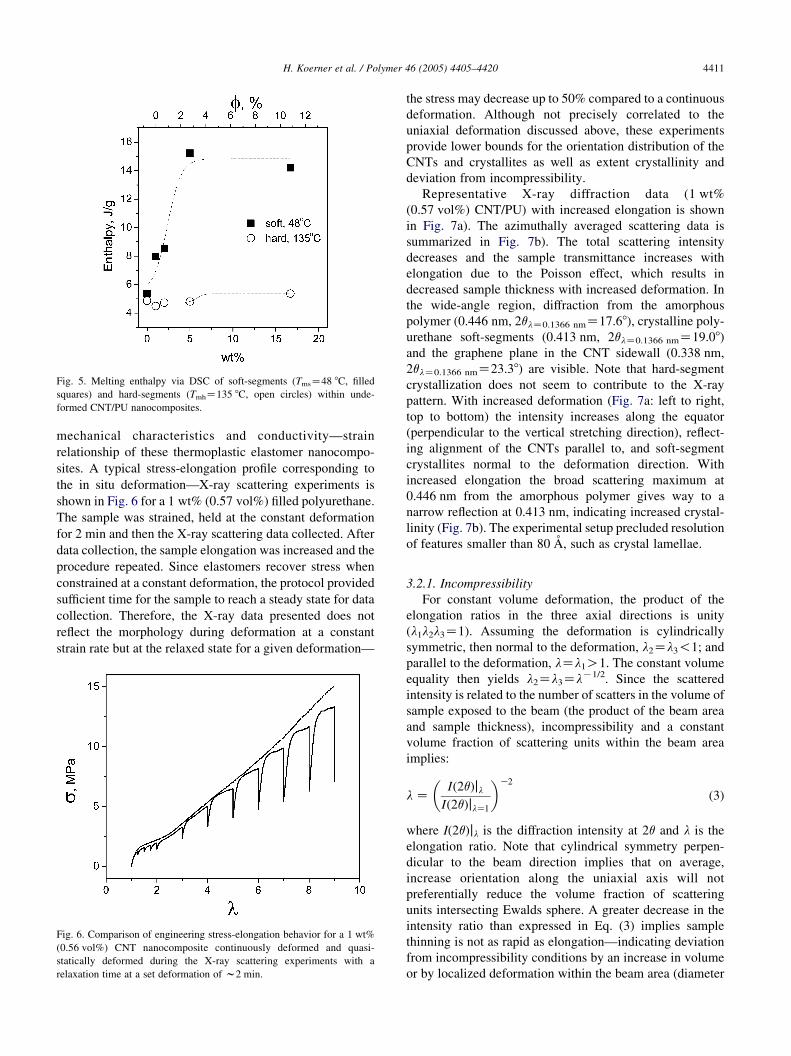
Fig. 5. Melting enthalpy via DSC of soft-segments (TmsZ48 8C, filled
squares) and hard-segments (TmhZ135 8C, open circles) within unde-
formed CNT/PU nanocomposites.
H. Koerner et al. / Polymer 46 (2005) 4405–4420 4411
mechanical characteristics and conductivity—strain
relationship of these thermoplastic elastomer nanocompo-
sites. A typical stress-elongation profile corresponding to
the in situ deformation—X-ray scattering experiments is
shown in Fig. 6 for a 1 wt% (0.57 vol%) filled polyurethane.
The sample was strained, held at the constant deformation
for 2 min and then the X-ray scattering data collected. After
data collection, the sample elongation was increased and the
procedure repeated. Since elastomers recover stress when
constrained at a constant deformation, the protocol provided
sufficient time for the sample to reach a steady state for data
collection. Therefore, the X-ray data presented does not
reflect the morphology during deformation at a constant
strain rate but at the relaxed state for a given deformation—
Fig. 6. Comparison of engineering stress-elongation behavior for a 1 wt%
(0.56 vol%) CNT nanocomposite continuously deformed and quasi-
statically deformed during the X-ray scattering experiments with a
relaxation time at a set deformation of w2 min.
the stress may decrease up to 50% compared to a continuous
deformation. Although not precisely correlated to the
uniaxial deformation discussed above, these experiments
provide lower bounds for the orientation distribution of the
CNTs and crystallites as well as extent crystallinity and
deviation from incompressibility.
Representative X-ray diffraction data (1 wt%
(0.57 vol%) CNT/PU) with increased elongation is shown
in Fig. 7a). The azimuthally averaged scattering data is
summarized in Fig. 7b). The total scattering intensity
decreases and the sample transmittance increases with
elongation due to the Poisson effect, which results in
decreased sample thickness with increased deformation. In
the wide-angle region, diffraction from the amorphous
polymer (0.446 nm, 2qlZ0.1366 nmZ17.68), crystalline poly-
urethane soft-segments (0.413 nm, 2qlZ0.1366 nmZ19.08)
and the graphene plane in the CNT sidewall (0.338 nm,
2qlZ0.1366 nmZ23.38) are visible. Note that hard-segment
crystallization does not seem to contribute to the X-ray
pattern. With increased deformation (Fig. 7a: left to right,
top to bottom) the intensity increases along the equator
(perpendicular to the vertical stretching direction), reflect-
ing alignment of the CNTs parallel to, and soft-segment
crystallites normal to the deformation direction. With
increased elongation the broad scattering maximum at
0.446 nm from the amorphous polymer gives way to a
narrow reflection at 0.413 nm, indicating increased crystal-
linity (Fig. 7b). The experimental setup precluded resolution
of features smaller than 80 A, such as crystal lamellae.
3.2.1. Incompressibility
For constant volume deformation, the product of the
elongation ratios in the three axial directions is unity
(l1l2l3Z1). Assuming the deformation is cylindrically
symmetric, then normal to the deformation, l2Zl3!1; and
parallel to the deformation, lZl1O1. The constant volume
equality then yields l2Zl3ZlK1/2. Since the scattered
intensity is related to the number of scatters in the volume of
sample exposed to the beam (the product of the beam area
and sample thickness), incompressibility and a constant
volume fraction of scattering units within the beam area
implies:
lZIð2qÞjlIð2qÞjlZ1
� �K2
(3)
where I(2q)jl is the diffraction intensity at 2q and l is the
elongation ratio. Note that cylindrical symmetry perpen-
dicular to the beam direction implies that on average,
increase orientation along the uniaxial axis will not
preferentially reduce the volume fraction of scattering
units intersecting Ewalds sphere. A greater decrease in the
intensity ratio than expressed in Eq. (3) implies sample
thinning is not as rapid as elongation—indicating deviation
from incompressibility conditions by an increase in volume
or by localized deformation within the beam area (diameter
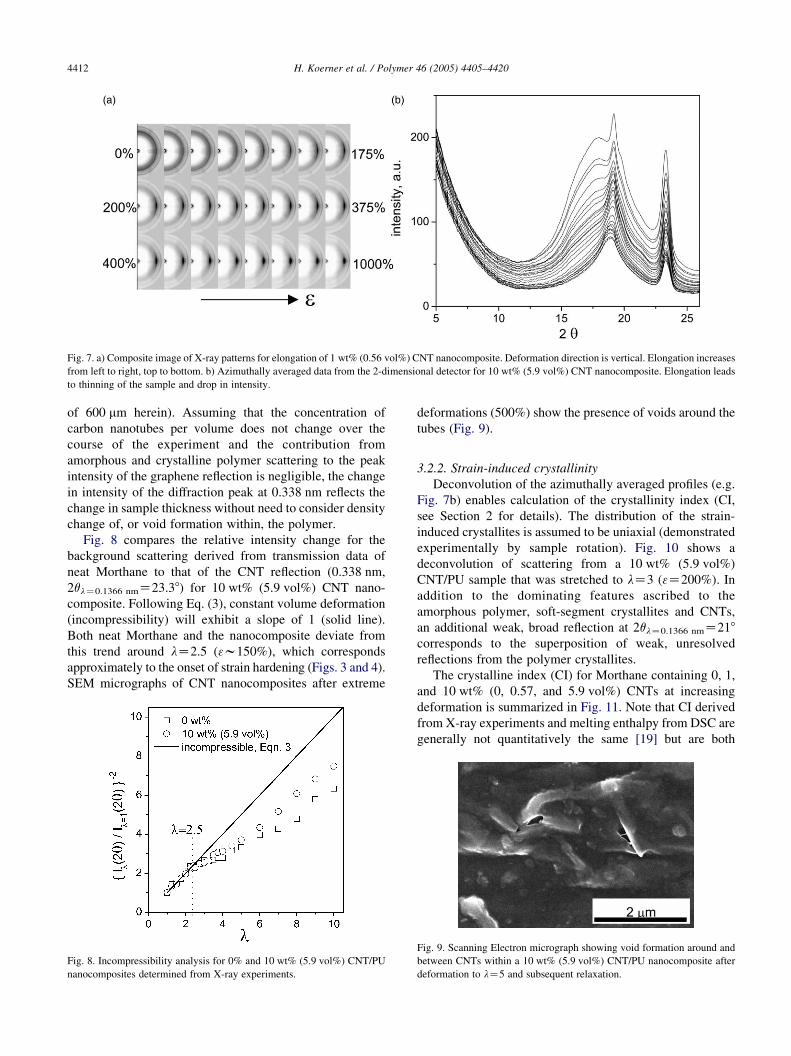
Fig. 7. a) Composite image of X-ray patterns for elongation of 1 wt% (0.56 vol%) CNT nanocomposite. Deformation direction is vertical. Elongation increases
from left to right, top to bottom. b) Azimuthally averaged data from the 2-dimensional detector for 10 wt% (5.9 vol%) CNT nanocomposite. Elongation leads
to thinning of the sample and drop in intensity.
H. Koerner et al. / Polymer 46 (2005) 4405–44204412
of 600 mm herein). Assuming that the concentration of
carbon nanotubes per volume does not change over the
course of the experiment and the contribution from
amorphous and crystalline polymer scattering to the peak
intensity of the graphene reflection is negligible, the change
in intensity of the diffraction peak at 0.338 nm reflects the
change in sample thickness without need to consider density
change of, or void formation within, the polymer.
Fig. 8 compares the relative intensity change for the
background scattering derived from transmission data of
neat Morthane to that of the CNT reflection (0.338 nm,
2qlZ0.1366 nmZ23.38) for 10 wt% (5.9 vol%) CNT nano-
composite. Following Eq. (3), constant volume deformation
(incompressibility) will exhibit a slope of 1 (solid line).
Both neat Morthane and the nanocomposite deviate from
this trend around lZ2.5 (3w150%), which corresponds
approximately to the onset of strain hardening (Figs. 3 and 4).
SEM micrographs of CNT nanocomposites after extreme
Fig. 8. Incompressibility analysis for 0% and 10 wt% (5.9 vol%) CNT/PU
nanocomposites determined from X-ray experiments.
deformations (500%) show the presence of voids around the
tubes (Fig. 9).
3.2.2. Strain-induced crystallinity
Deconvolution of the azimuthally averaged profiles (e.g.
Fig. 7b) enables calculation of the crystallinity index (CI,
see Section 2 for details). The distribution of the strain-
induced crystallites is assumed to be uniaxial (demonstrated
experimentally by sample rotation). Fig. 10 shows a
deconvolution of scattering from a 10 wt% (5.9 vol%)
CNT/PU sample that was stretched to lZ3 (3Z200%). In
addition to the dominating features ascribed to the
amorphous polymer, soft-segment crystallites and CNTs,
an additional weak, broad reflection at 2qlZ0.1366 nmZ218
corresponds to the superposition of weak, unresolved
reflections from the polymer crystallites.
The crystalline index (CI) for Morthane containing 0, 1,
and 10 wt% (0, 0.57, and 5.9 vol%) CNTs at increasing
deformation is summarized in Fig. 11. Note that CI derived
from X-ray experiments and melting enthalpy from DSC are
generally not quantitatively the same [19] but are both
Fig. 9. Scanning Electron micrograph showing void formation around and
between CNTs within a 10 wt% (5.9 vol%) CNT/PU nanocomposite after
deformation to lZ5 and subsequent relaxation.
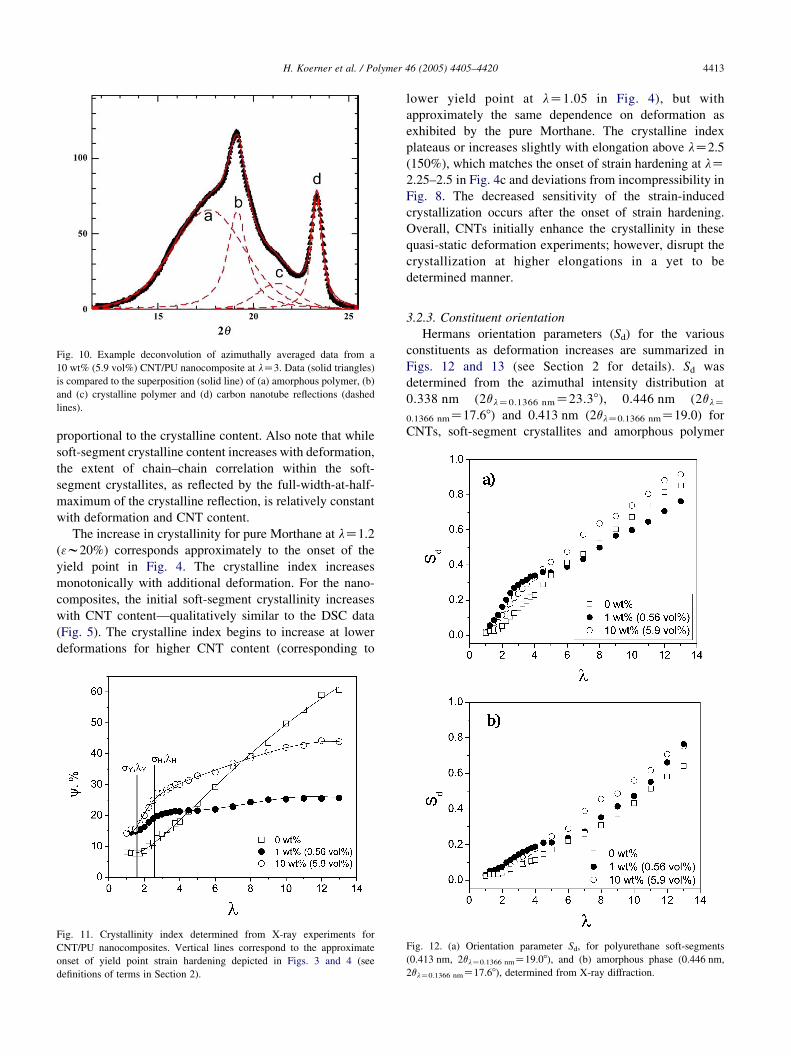
Fig. 10. Example deconvolution of azimuthally averaged data from a
10 wt% (5.9 vol%) CNT/PU nanocomposite at lZ3. Data (solid triangles)
is compared to the superposition (solid line) of (a) amorphous polymer, (b)
and (c) crystalline polymer and (d) carbon nanotube reflections (dashed
lines).
H. Koerner et al. / Polymer 46 (2005) 4405–4420 4413
proportional to the crystalline content. Also note that while
soft-segment crystalline content increases with deformation,
the extent of chain–chain correlation within the soft-
segment crystallites, as reflected by the full-width-at-half-
maximum of the crystalline reflection, is relatively constant
with deformation and CNT content.
The increase in crystallinity for pure Morthane at lZ1.2
(3w20%) corresponds approximately to the onset of the
yield point in Fig. 4. The crystalline index increases
monotonically with additional deformation. For the nano-
composites, the initial soft-segment crystallinity increases
with CNT content—qualitatively similar to the DSC data
(Fig. 5). The crystalline index begins to increase at lower
deformations for higher CNT content (corresponding to
Fig. 11. Crystallinity index determined from X-ray experiments for
CNT/PU nanocomposites. Vertical lines correspond to the approximate
onset of yield point strain hardening depicted in Figs. 3 and 4 (see
definitions of terms in Section 2).
lower yield point at lZ1.05 in Fig. 4), but with
approximately the same dependence on deformation as
exhibited by the pure Morthane. The crystalline index
plateaus or increases slightly with elongation above lZ2.5
(150%), which matches the onset of strain hardening at lZ2.25–2.5 in Fig. 4c and deviations from incompressibility in
Fig. 8. The decreased sensitivity of the strain-induced
crystallization occurs after the onset of strain hardening.
Overall, CNTs initially enhance the crystallinity in these
quasi-static deformation experiments; however, disrupt the
crystallization at higher elongations in a yet to be
determined manner.
3.2.3. Constituent orientation
Hermans orientation parameters (Sd) for the various
constituents as deformation increases are summarized in
Figs. 12 and 13 (see Section 2 for details). Sd was
determined from the azimuthal intensity distribution at
0.338 nm (2qlZ0.1366 nmZ23.38), 0.446 nm (2qlZ
0.1366 nmZ17.68) and 0.413 nm (2qlZ0.1366 nmZ19.0) for
CNTs, soft-segment crystallites and amorphous polymer
Fig. 12. (a) Orientation parameter Sd, for polyurethane soft-segments
(0.413 nm, 2qlZ0.1366 nmZ19.08), and (b) amorphous phase (0.446 nm,
2qlZ0.1366 nmZ17.68), determined from X-ray diffraction.
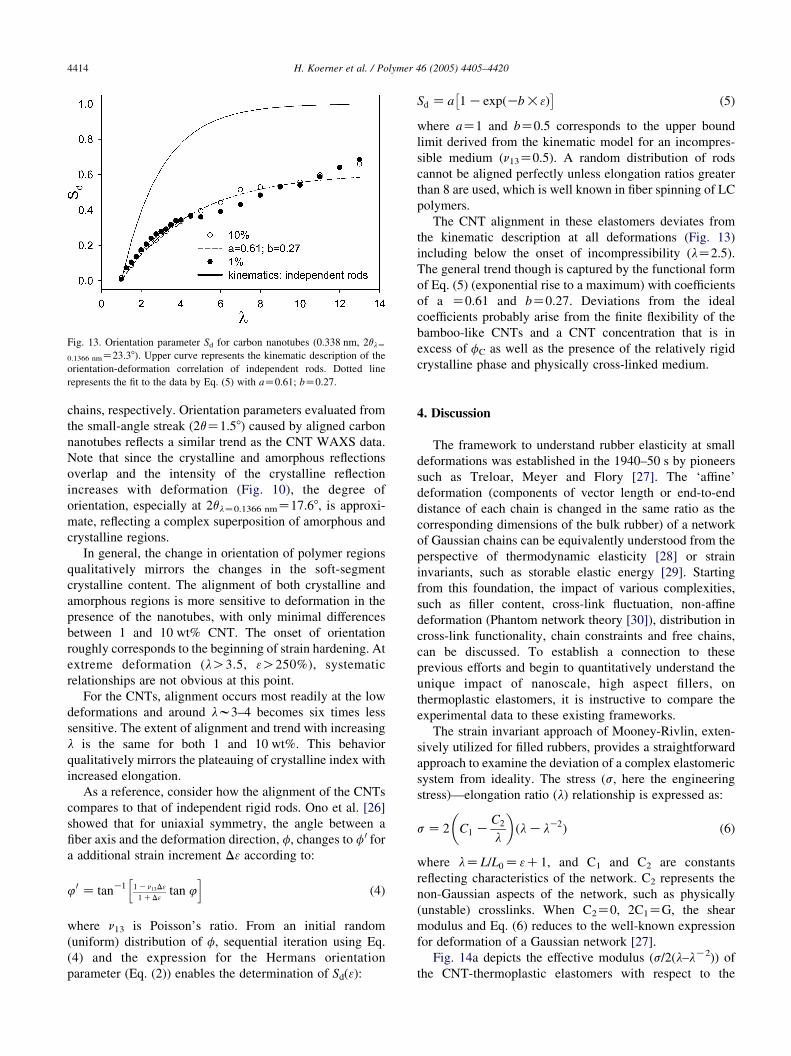
Fig. 13. Orientation parameter Sd for carbon nanotubes (0.338 nm, 2qlZ
0.1366 nmZ23.38). Upper curve represents the kinematic description of the
orientation-deformation correlation of independent rods. Dotted line
represents the fit to the data by Eq. (5) with aZ0.61; bZ0.27.
H. Koerner et al. / Polymer 46 (2005) 4405–44204414
chains, respectively. Orientation parameters evaluated from
the small-angle streak (2qZ1.58) caused by aligned carbon
nanotubes reflects a similar trend as the CNT WAXS data.
Note that since the crystalline and amorphous reflections
overlap and the intensity of the crystalline reflection
increases with deformation (Fig. 10), the degree of
orientation, especially at 2qlZ0.1366 nmZ17.68, is approxi-
mate, reflecting a complex superposition of amorphous and
crystalline regions.
In general, the change in orientation of polymer regions
qualitatively mirrors the changes in the soft-segment
crystalline content. The alignment of both crystalline and
amorphous regions is more sensitive to deformation in the
presence of the nanotubes, with only minimal differences
between 1 and 10 wt% CNT. The onset of orientation
roughly corresponds to the beginning of strain hardening. At
extreme deformation (lO3.5, 3O250%), systematic
relationships are not obvious at this point.
For the CNTs, alignment occurs most readily at the low
deformations and around lw3–4 becomes six times less
sensitive. The extent of alignment and trend with increasing
l is the same for both 1 and 10 wt%. This behavior
qualitatively mirrors the plateauing of crystalline index with
increased elongation.
As a reference, consider how the alignment of the CNTs
compares to that of independent rigid rods. Ono et al. [26]
showed that for uniaxial symmetry, the angle between a
fiber axis and the deformation direction, f, changes to f 0 for
a additional strain increment D3 according to:
40 Z tanK1 1Kn13D3
1CD3tan 4
h i(4)
where n13 is Poisson’s ratio. From an initial random
(uniform) distribution of f, sequential iteration using Eq.
(4) and the expression for the Hermans orientation
parameter (Eq. (2)) enables the determination of Sd(3):
Sd Z a 1KexpðKb!3Þ� �
(5)
where aZ1 and bZ0.5 corresponds to the upper bound
limit derived from the kinematic model for an incompres-
sible medium (n13Z0.5). A random distribution of rods
cannot be aligned perfectly unless elongation ratios greater
than 8 are used, which is well known in fiber spinning of LC
polymers.
The CNT alignment in these elastomers deviates from
the kinematic description at all deformations (Fig. 13)
including below the onset of incompressibility (lZ2.5).
The general trend though is captured by the functional form
of Eq. (5) (exponential rise to a maximum) with coefficients
of a Z0.61 and bZ0.27. Deviations from the ideal
coefficients probably arise from the finite flexibility of the
bamboo-like CNTs and a CNT concentration that is in
excess of fC as well as the presence of the relatively rigid
crystalline phase and physically cross-linked medium.
4. Discussion
The framework to understand rubber elasticity at small
deformations was established in the 1940–50 s by pioneers
such as Treloar, Meyer and Flory [27]. The ‘affine’
deformation (components of vector length or end-to-end
distance of each chain is changed in the same ratio as the
corresponding dimensions of the bulk rubber) of a network
of Gaussian chains can be equivalently understood from the
perspective of thermodynamic elasticity [28] or strain
invariants, such as storable elastic energy [29]. Starting
from this foundation, the impact of various complexities,
such as filler content, cross-link fluctuation, non-affine
deformation (Phantom network theory [30]), distribution in
cross-link functionality, chain constraints and free chains,
can be discussed. To establish a connection to these
previous efforts and begin to quantitatively understand the
unique impact of nanoscale, high aspect fillers, on
thermoplastic elastomers, it is instructive to compare the
experimental data to these existing frameworks.
The strain invariant approach of Mooney-Rivlin, exten-
sively utilized for filled rubbers, provides a straightforward
approach to examine the deviation of a complex elastomeric
system from ideality. The stress (s, here the engineering
stress)—elongation ratio (l) relationship is expressed as:
sZ 2 C1 KC2
l
� �ðlKlK2Þ (6)
where lZL=L0Z3C1, and C1 and C2 are constants
reflecting characteristics of the network. C2 represents the
non-Gaussian aspects of the network, such as physically
(unstable) crosslinks. When C2Z0, 2C1ZG, the shear
modulus and Eq. (6) reduces to the well-known expression
for deformation of a Gaussian network [27].
Fig. 14a depicts the effective modulus (s/2(l–lK2)) of
the CNT-thermoplastic elastomers with respect to the
Fig. 14. a) Mooney–Rivlin plot of CNT/PU nanocomposites. b) Reduced
Mooney–Rivlin plot showing scaling behavior of CNT/PU nanocompo-
sites. Shift factors, Ai obtained by a best overlap of curves in Fig. 14(a) are
reported in Fig. 16.
H. Koerner et al. / Polymer 46 (2005) 4405–4420 4415
inverse elongation ratio, lK1. Affine deformation of an ideal
Gaussian network (C2Z0) would appear as a horizontal
line. The pure thermoplastic elastomer, Morthane, exhibits
substantial non-ideality during deformation, attributed to
meta-stability of physical crosslinks, complex morphology
of hard-segment crystallites and strain-induced crystal-
lization of soft-segments. Previous studies have revealed
that the 10 s of nanometer domains arising from phase
separation of hard and soft-segments evolve with defor-
mation. This evolution of morphology is thought to be the
primary source of hysteresis and cyclic softening.
As the CNT loading increases the non-ideal behavior
increases, especially at low deformation. After yield
though (Morthane: lw1.2; nanocomposites: lw1.1–1.15)
(see Fig. 4b), the relative behavior of the nanocomposites is
similar, irrespective of CNT loading.
Flandin et al. observed similar results for the deformation
of carbon-black containing elastomers and rationalized a
modulus scaling factor to superimpose curves based on a
hydrodynamic perspective, where the effective modulus at
any deformation depends only on the amount of filler.
Following Flandin et al. [31]. Fig. 14b emphasizes the
similarity between all the systems above yielding; implying
that the mechanistics of deformation beyond the yield point
is dominated by the elastomer, with minimal impact from
the CNTs. Also notable in Fig. 14b is the appearance of a
threshold volume fraction at which all nanocomposites
behave identical over the entire deformation range. Below
2.3 vol% the reduced Mooney–Rivlin curves deviate from
this trend. In addition to CNT loading, the initial soft-
segment crystallite content also changes between 0 and
5 vol% CNT and may contribute to this behavior.
4.1. Initial modulus
Numerous phenomenological (‘spring and dash pot’) and
hydrodynamic based models have been developed to
describe the impact of fillers on a rubber modulus.
Fundamentally, the simplest models directly derived from
morphological characteristics of the system are those
processed by Guth and Simha in 1938 [32] and Smallwood
in 1945 [33]. The key contribution to reinforcement in these
models is the concept of ‘hydrodynamic’ [34,33] or ‘strain’
[35] amplification in which the rubber surrounding a rigid
inclusion expresses (experiences) a local microscopic
intrinsic strain, 30, that is in excess of the macroscopic
external strain, 3, of the sample by a factor XZ30/3, the
stress amplification factor. A number of methods have been
applied to describe the relative increases in modulus of filled
elastomers either by theory [36–39] or by computer
simulation with finite element codes [40,41]. The basic
assumption is that all interactions between contiguous
sections of a material are localized at the surface of
separation.
A first order model to describe reinforcement of filled
rubbers with anisotropic particles is the semi-empirical
Guth [34] model with
E=E0 Z 1C0:67gffC1:62g2f f
2 (7)
where E is the modulus of the composite; E0 is the modulus
of the neat matrix elastomer; f is the volume fraction of the
filler; and gf is the aspect ratio of the filler. This expression
has subsequently been refined by numerous researchers
[37]. Boyce provides a comparison of previous models [41].
Additionally, recent efforts by Boyce et al. qualitatively
demonstrated inhomogeneous strain distribution in a two-
dimensional model of uniaxially aligned rods in a soft
matrix [47].
The relative initial moduli, E/Eo for various CNT/PU
nanocomposites are plotted in Fig. 15a. Three batches of
CNT/PU are displayed that differ in their thermal history
and demonstrates the influence of thermal annealing at room
temperature on mechanical properties of the CNT/PU
system. To compare to classic carbon-black filled
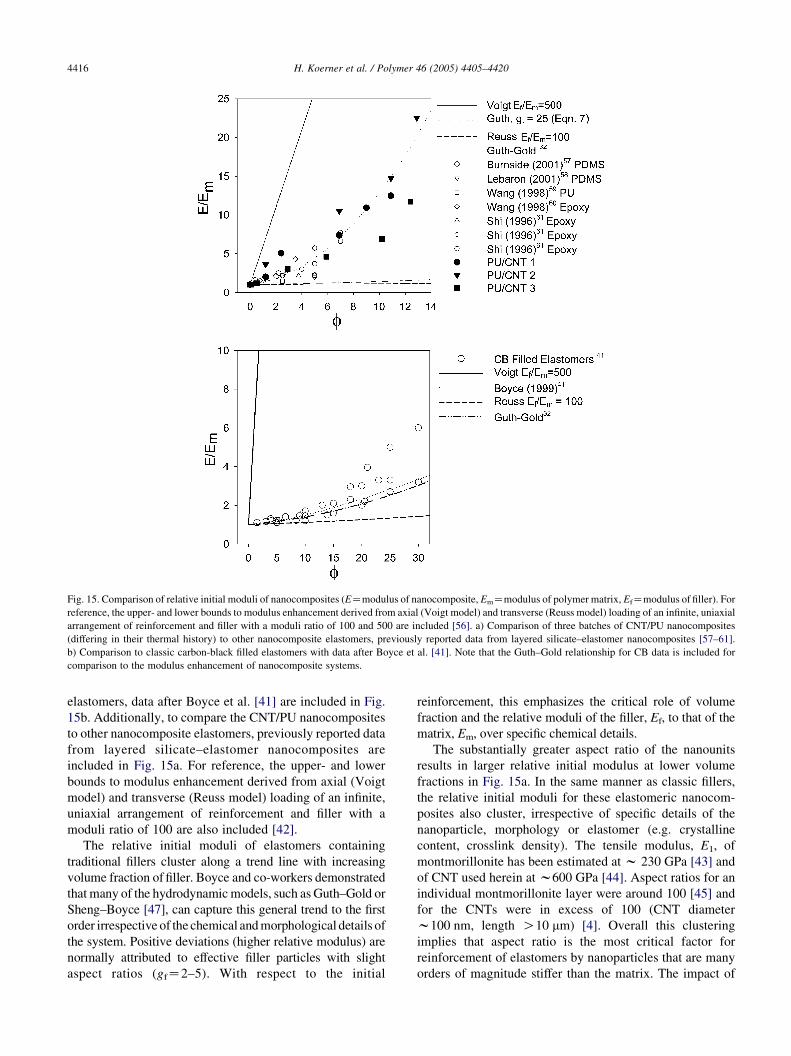
Fig. 15. Comparison of relative initial moduli of nanocomposites (EZmodulus of nanocomposite, EmZmodulus of polymer matrix, EfZmodulus of filler). For
reference, the upper- and lower bounds to modulus enhancement derived from axial (Voigt model) and transverse (Reuss model) loading of an infinite, uniaxial
arrangement of reinforcement and filler with a moduli ratio of 100 and 500 are included [56]. a) Comparison of three batches of CNT/PU nanocomposites
(differing in their thermal history) to other nanocomposite elastomers, previously reported data from layered silicate–elastomer nanocomposites [57–61].
b) Comparison to classic carbon-black filled elastomers with data after Boyce et al. [41]. Note that the Guth–Gold relationship for CB data is included for
comparison to the modulus enhancement of nanocomposite systems.
H. Koerner et al. / Polymer 46 (2005) 4405–44204416
elastomers, data after Boyce et al. [41] are included in Fig.
15b. Additionally, to compare the CNT/PU nanocomposites
to other nanocomposite elastomers, previously reported data
from layered silicate–elastomer nanocomposites are
included in Fig. 15a. For reference, the upper- and lower
bounds to modulus enhancement derived from axial (Voigt
model) and transverse (Reuss model) loading of an infinite,
uniaxial arrangement of reinforcement and filler with a
moduli ratio of 100 are also included [42].
The relative initial moduli of elastomers containing
traditional fillers cluster along a trend line with increasing
volume fraction of filler. Boyce and co-workers demonstrated
that many of the hydrodynamic models, such as Guth–Gold or
Sheng–Boyce [47], can capture this general trend to the first
order irrespective of the chemical and morphological details of
the system. Positive deviations (higher relative modulus) are
normally attributed to effective filler particles with slight
aspect ratios (gfZ2–5). With respect to the initial
reinforcement, this emphasizes the critical role of volume
fraction and the relative moduli of the filler, Ef, to that of the
matrix, Em, over specific chemical details.
The substantially greater aspect ratio of the nanounits
results in larger relative initial modulus at lower volume
fractions in Fig. 15a. In the same manner as classic fillers,
the relative initial moduli for these elastomeric nanocom-
posites also cluster, irrespective of specific details of the
nanoparticle, morphology or elastomer (e.g. crystalline
content, crosslink density). The tensile modulus, E1, of
montmorillonite has been estimated at w 230 GPa [43] and
of CNT used herein at w600 GPa [44]. Aspect ratios for an
individual montmorillonite layer were around 100 [45] and
for the CNTs were in excess of 100 (CNT diameter
w100 nm, length O10 mm) [4]. Overall this clustering
implies that aspect ratio is the most critical factor for
reinforcement of elastomers by nanoparticles that are many
orders of magnitude stiffer than the matrix. The impact of
H. Koerner et al. / Polymer 46 (2005) 4405–4420 4417
increased aspect ratio asymptotically approaches continu-
ous reinforcement as stress-transfer enables complete
utilization of the stiffness of a larger fraction of the
reinforcement [46]. Comparably, extreme differences
between filler and matrix modulus minimizes the ability to
fully capitalize on additional increases in filler stiffness [47]
and thus utilization of fillers with moduli, Ef, that differ by
2–3 times but are 100 s of times more rigid than the matrix,
Em, yield comparable reinforcement.
Although the experimental results can be described by
the hydrodynamic models, the parameters derived do not
correlate with the characteristics of a single nano-particle.
For example, for the semi-empirical Guth [32] model, the
trend represented by the cluster of nanocomposite data can
be described with gfZ20–25 and Ef/EmZ100-substantially
lower than initially anticipated. Some of the data sets may
imply greater aspect ratios at low volume fractions, but in
general there is insufficient information at these very low
loadings to yield reliable values. Overall, the experimental
values are substantially less than what the Guth model
would predict for aspect ratios or for relative moduli greater
than 100.
Three, interrelated reasons associated with the actual
distance between nanoparticles form the core of this
discrepancy—realistic morphology, finite nanoparticle
rigidity and particle-particle correlations. First, the available
morphological characterization indicates that the distri-
bution of nanoparticles in these nanocomposites are
probably far from ideal, where ideal dispersion is defined
when the mean-distance between individual particles equals
the maximum possible distance between particles for a
given volume fraction. This implies that on a meso- or
micro-scale level concentration fluctuations of reinforce-
ment particles occur, creating a hierarchical morphology
and stress and strain distribution must be considered at
multiple length scales. Additionally, the local correlations
between these anisotropic particles, such as represented by a
meso-scale domain where local orientation correlation of
particles is high, even though the macroscopic, global
orientation correlations are isotropic, may result in particles
acting in concert—as a larger-scale effective reinforcement
phase with a smaller effective aspect ratio.
Second, the nano-reinforcement is not infinitely rigid.
Micrographs indicate that before deformation, the tubes and
layers are bent and distorted within the nanocomposites.
The initial aspect ratio will be smaller than the idealized
end-to-end distance. Since these nanoparticles do not have
isotropic moduli–the transverse modulus (w56 GPa for
montmorillonite [43] and w50 GPa for SWNT [48] and for
MWNT [49]) is substantially less than the longitudinal
modulus—less than optimal reinforcement may arise from a
random arrangement of orthotropic reinforcing phase. The
low buckling stress for high aspect ratio structures will also
lead to particle distortions dependent on process history.
This is especially true for the carbon–nanotubes examined
in this study [50].
Finally, the hydrodynamic models are developed with
respect to an isolated particle. As aspect ratio increases, the
volume fraction decreases when particle-particle correlation
occurs, for example through simple volume exclusion.
Although the former issues cannot be disregarded, the
volume fractions for the majority of the nanocomposite data
are greater than the onset of particle–particle correlation or
percolation thresholds, which for aspect ratios greater than
100 are roughly fc%0.001 as delineated by simple excluded
volume arguments [51,52]. Thus the loadings are generally
contrary to the underlying assumptions of the hydrodynamic
models, which presuppose an isolated rigid phase. In
addition, the nanoscale dimensions imply that for a given
volume fraction as nanofiller size decreases, the number
density of filler particles and mean distance between
particles decreases. The extreme number density associated
with fully dispersed nanofillers result in diminishingly small
distance between nanoparticles—comparable to the size of
the nanoparticle at fZ0.01–0.1. Since the spatial decay of
the interfacial stress and strain distribution in the soft phase
at an interface with a rigid phase is invariant to the thickness
of the rigid phase, these distributions will overlap leading to
very inhomogeneous stress and strain distributions within
the nanocomposites. Recent work [47] by Boyce et al. has
demonstrated that for uniaxially aligned, high aspect ratio
fillers, strain shielding associated with particle–particle
spatial correlation develop. This leads to reinforcement by
an effective-particle, where the load is distributed over a
collection of rods. This leads to a reinforcing phase with
lower effective modulus and lower aspect ratio than would
be derived from consideration of only the fundamental rod
unit.
4.2. Deformation
The inelastic, viscoelastic and failure modes of nano-
composites, as with traditional filled polymers, are sub-
stantially more complex to understand and correlate to
generalized frameworks. Overall, the similarity between the
pure Morthane and nanocomposite at deformations beyond
the yield point imply that the presence of the CNTs do not
alter the mechanistics of viscoelastic deformation. This is
very surprising given the substantial morphological change,
both for the content of soft-segment crystallites and the
continual increase of CNT orientation with deformation as
revealed by the X-ray scattering experiments. Following
with hydrodynamic description of reinforcement, the
inverse of the modulus scaling factor used to create the
reduced Mooney–Rivlin analysis above (Fig. 14b) may be
ostensibly analyzed in the same fashion discussed for the
relative modulus enhancement, where the modulus scaling
factor provides a measure of ‘reinforcement’ beyond
yielding. Fig. 16 summarizes the modulus scaling factor
and comparable analysis using Eq. (7) and following
Flandin et al. yields an aspect ratio of only 9. This is
substantially less than observed for the initial modulus and
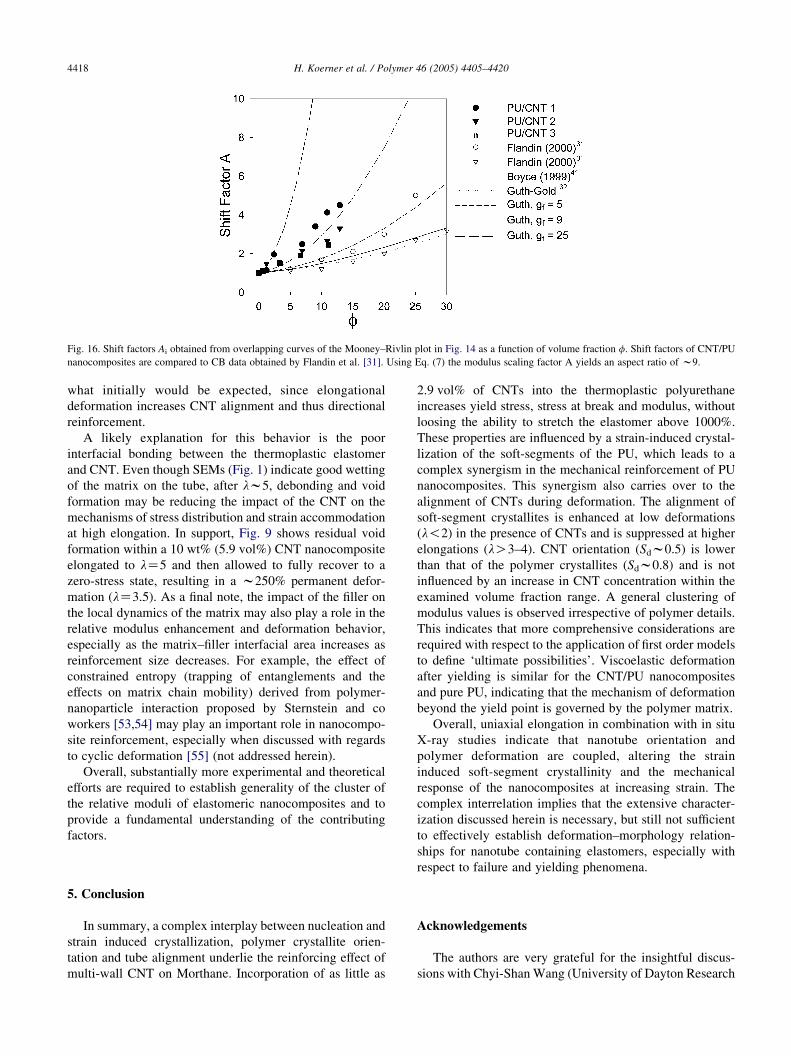
Fig. 16. Shift factors Ai obtained from overlapping curves of the Mooney–Rivlin plot in Fig. 14 as a function of volume fraction f. Shift factors of CNT/PU
nanocomposites are compared to CB data obtained by Flandin et al. [31]. Using Eq. (7) the modulus scaling factor A yields an aspect ratio of w9.
H. Koerner et al. / Polymer 46 (2005) 4405–44204418
what initially would be expected, since elongational
deformation increases CNT alignment and thus directional
reinforcement.
A likely explanation for this behavior is the poor
interfacial bonding between the thermoplastic elastomer
and CNT. Even though SEMs (Fig. 1) indicate good wetting
of the matrix on the tube, after lw5, debonding and void
formation may be reducing the impact of the CNT on the
mechanisms of stress distribution and strain accommodation
at high elongation. In support, Fig. 9 shows residual void
formation within a 10 wt% (5.9 vol%) CNT nanocomposite
elongated to lZ5 and then allowed to fully recover to a
zero-stress state, resulting in a w250% permanent defor-
mation (lZ3.5). As a final note, the impact of the filler on
the local dynamics of the matrix may also play a role in the
relative modulus enhancement and deformation behavior,
especially as the matrix–filler interfacial area increases as
reinforcement size decreases. For example, the effect of
constrained entropy (trapping of entanglements and the
effects on matrix chain mobility) derived from polymer-
nanoparticle interaction proposed by Sternstein and co
workers [53,54] may play an important role in nanocompo-
site reinforcement, especially when discussed with regards
to cyclic deformation [55] (not addressed herein).
Overall, substantially more experimental and theoretical
efforts are required to establish generality of the cluster of
the relative moduli of elastomeric nanocomposites and to
provide a fundamental understanding of the contributing
factors.
5. Conclusion
In summary, a complex interplay between nucleation and
strain induced crystallization, polymer crystallite orien-
tation and tube alignment underlie the reinforcing effect of
multi-wall CNT on Morthane. Incorporation of as little as
2.9 vol% of CNTs into the thermoplastic polyurethane
increases yield stress, stress at break and modulus, without
loosing the ability to stretch the elastomer above 1000%.
These properties are influenced by a strain-induced crystal-
lization of the soft-segments of the PU, which leads to a
complex synergism in the mechanical reinforcement of PU
nanocomposites. This synergism also carries over to the
alignment of CNTs during deformation. The alignment of
soft-segment crystallites is enhanced at low deformations
(l!2) in the presence of CNTs and is suppressed at higher
elongations (lO3–4). CNT orientation (Sdw0.5) is lower
than that of the polymer crystallites (Sdw0.8) and is not
influenced by an increase in CNT concentration within the
examined volume fraction range. A general clustering of
modulus values is observed irrespective of polymer details.
This indicates that more comprehensive considerations are
required with respect to the application of first order models
to define ‘ultimate possibilities’. Viscoelastic deformation
after yielding is similar for the CNT/PU nanocomposites
and pure PU, indicating that the mechanism of deformation
beyond the yield point is governed by the polymer matrix.
Overall, uniaxial elongation in combination with in situ
X-ray studies indicate that nanotube orientation and
polymer deformation are coupled, altering the strain
induced soft-segment crystallinity and the mechanical
response of the nanocomposites at increasing strain. The
complex interrelation implies that the extensive character-
ization discussed herein is necessary, but still not sufficient
to effectively establish deformation–morphology relation-
ships for nanotube containing elastomers, especially with
respect to failure and yielding phenomena.
Acknowledgements
The authors are very grateful for the insightful discus-
sions with Chyi-Shan Wang (University of Dayton Research
H. Koerner et al. / Polymer 46 (2005) 4405–4420 4419
Institute) and Mary Boyce (MIT). We also thank Ben Hsiao
(SUNY Stony Brook) and Fengji Jeh (Advanced Polymer
Beamline (X27C) at BNLS). The Advanced Polymer
Beamline (X27C) is supported by DOE (DE-FG02-99ER
45760). The Air Force Office of Scientific Research and the
Air Force Research Laboratory, Materials and Manufactur-
ing Directorate, provided funding.
References
[1] Ray SS, Okamoto M. Polymer/layered silicate nanocomposites: a
review from preparation to processing. Prog Polym Sci 2003;28:
1539–641. Vaia RA, Kishnamoorti R, editors. Polymer nanocompo-
sites, vol. 804. Washington, DC: American Chemical Society; 2001.
[2] Qian D, Dickey EC, Andrews R, Rantell T. Load transfer and
deformation mechanisms in carbon nanotube–polymer composites.
Appl Phys Lett 2000;76:2868.
[3] Jin L, Bower C, Zhou O. Alignment of carbon nanotubes in a polymer
matrix by mechanical stretching. Appl Phys Lett 1998;73(9):1197–9.
[4] Koerner H, Price G, Pearce NA, Alexander MD, Vaia RA. Remotely
actuated polymer nanocomposites–stress-recovery of carbon-nano-
tube-filled thermoplastic elastomers. Nat Mater 2004;3:115–20.
[5] Stephan C, Nguyen TP, Lefrant S, Vaccarini L, Bernier P. Electrical
properties of singlewalled carbon nanotubes-PMMA composites. AIP
Conference Proceedings. vol. 544(1) 2000. pp. 363–6.
[6] Kim Bumsuk, Lee Jongjin, Yu Insuk. Electrical properties of single-
wall carbon nanotube and epoxy composites. J Appl Phys 2003;
94(10):6724–8.
[7] M. Tanaka, J. Zhang, T. Matsumoto, A. Guzik, Transactions of
JASCOME, vol. 3 (July 2003), Paper No. 03-062009.
[8] Biercuk MJ, Llaguno MC, Radosavljevic M, Hyun JK, Johnson AT,
Fischer E. Carbon nanotube composites for thermal management.
Appl Phys Lett 2002;80(15):2767–9.
[9] US Patent # 6,680,016.
[10] Croasmun WR, Carlson MK, editors. Two-dimensional NMR.
Applications for chemists and biochemists. New York: VCH
Publishers, Inc.; 1994.
[11] Stauffer D, Aharony A. Introduction to percolation theory. 2nd ed.
London: Taylor and Francis; 1992.
[12] Heaney MB. Measurement and interaction of nonuniversal critical
exponents in disordered conductor–insulator composites. Phys Rev B
1995;52:477–80.
[13] Flandin L, Brechet Y, Cavaille J-Y. Electrically conductive polymer
nanocomposites as deformation sensors. Compos Sci Technol 2001;
61:895–901.
[14] ASI data sheet on PRT-HT-19.
[15] Thess A, Lee R, Nikolaev P, Dai H, Petit P, Robert J, et al. Science
1996;273:483.
[16] Pinniavaia TJ, Beall GW, editors. Polymer–clay composites. New
York: Wiley; 2001.
[17] Fu BX, Hsiao BS, Pagola S, Stephens P, White H, Rafailovich M,
et al. Structural development during deformation of polyurethane
containing polyhedral oligomeric silsesquioxanes (POSS) molecules.
Polymer 2001;42:599–611.
[18] Hammersley, A.P., ESRF Internal, Report, ESRF97HA02F, Fit2D: an
introduction and overview, 1997Hammersley AP, Svensson SO,
Hanfland M, Fitch AN, Haeusermann D. Two-dimensional detector
software: from real detector to idealised image or two-theta scan. High
Pressure Research 1996;14:235–48.
[19] Alexander LE. X-ray diffraction methods in polymer science. NY:
Robert E. Kereger Publishing Company; 1979.
[20] Abouzahr S, Ophir Z, Wilkes GL. Polymer 1982;23:1077. Huang S,
Lai J. Eur Polym J 1997;33(10–12):1563–7. Kim HD, Huh JH,
Kim EY, Park CC. J Appl Polym Sci 1998;69:1349–55.
[21] McLean RS, Sauer BB. Nano-deformation of crystalline domains
during tensile stretching studied by atomic force microscopy. J Polym
Sci, Part B: Polym Phys 1999;37:859–66.
[22] Ward IM. Mechanical properties of solid polymers. New York:
Wiley; 1971. p. 253.
[23] Grady BP, Pompeo F, Shambaugh RL, Resasco DE. J Phys Chem B
2002;106:5852.
[24] Bhattacharyya AR, Sreekumar TV, Liu T, Kumar S, Ericson LM,
Hauge RH, et al. Polymer 2003;44:2373–7.
[25] Lincoln DM, Vaia RA, Krishnamoorti R. Macromolecules 2004;
37(12):4554–61.
[26] Taya M, Kim WJ, Ono K. Mech Mater 1998;28:53.
[27] Treloar LRG. The physics of rubber elasticity. Oxford: Clarendon
Press; 1958.P. Flory, Principles of polymer chemistry, 153 (Cornell)
Mayer, Susich v, Valko. Kolloidzschr. 59208.
[28] Krigbaum WR, Roe R-J. Rubber Chem Technol 1965;38:1039–69.
[29] Ferry JD. Viscoelastic properties of polymers. 3rd ed. New York:
Wiley; 1980. p. 571.
[30] Farago O, Kantor Y. Entropic elasticity of phantom percolation
networks. Europhys Lett 2000;52:413–9.
[31] Flandin L, Chang A, Nazarenko A, Hiltner E, Baer E. J Appl Polym
Sci 2000;76:894–905.
[32] Guth E, Simha R. Kolloid-Z 1936;74:266–75. Guth E, Gold O. Phys
Rev 1938;53:322.
[33] Smallwood HM. J Appl Phys 1944;15:758–66.
[34] Guth E. J Appl Phys 1945;16:20.
[35] Mullins L, Tobin NR. J Appl Polym Sci 1965;9:2993–3009.
[36] Jhon MS, Metz RJ, Freed KF. J Stat Phys 1988;52:1325.
[37] Ponte P. Castaneda. Proc R Soc Lond A 1989;422:147–71.
[38] Halpin JC. J Compos Mater 1969;3:732–4. Halpin JC, Kardos JL.
Polym Eng Sci 1976;16:344–52.
[39] (a) Taya M, Kim WJ, Ono K. Mech Mater 1998;28:53.
(b) Taya M, Kim WJ. In: Inoue K, Shen SIY, Taya M, editors. US–
Japan workshop on smart materials and structures. The Minerals,
Metals Materials Society; 1997. p. 243.
[40] Gusev AA. J Mech Phys Solids 1997;45:1449.
[41] Bergstrom JS, Boyce MC. Rubber Chem Technol 1999;72:633–56.
Bergstrom JS, Boyce MC. Mech Mater 2000;32:627–44.
[42] Reuss A. Z Angew Math Mech. 949. Voigt W. Lehrbuch der
kristallphysik. Leipzig: Teubner; 1928. p. 410. Ward IM. Mechanical
properties of solid polymers. New York: Wiley; 1971. p. 255ff.
[43] Manevitch OL, Rutledge GC. J Phys Chem B 2004;108:1428–35.
Bulk modulus for mica, in-plane modulus of a single montmorillonite
sheet is estimated to be 420 GPa) of the montmorillonite 56 GPa
(experimental bulk modulus for muscovite, 390 GPa simulated for a
single MMT sheet).
[44] ASI Company information, data of a single multi-wall tube.
[45] Koerner H, Jacobs D, Tomlin D, Busbee J, Vaia R. Adv Mater 2004;
16:297–302.
[46] Fornes TD, Paul DR. Polymer 2003;44:4993–5013.
[47] Sheng N, Boyce MC, Parks DM, Rutledge GC, Abes JI, Cohen RE.
Multiscale micromechanical modeling of polymer/clay nanocompo-
sites and the effective clay particle. Polymer 2004;45:487–506.
[48] Popov VN, Van Doren VE, Balkanski M. Elastic properties of crystals
of single-walled carbon nanotubes. Solid State Commun 2000;114:
395–9.
[49] Yakobson BI, Avouris Ph. Mechanical properties of carbon
nanotubes, chap. 9. In: Dresselhaus MS, Avouris Ph, editors. Carbon
nanotubes, vol. 287–329. Berlin-Heidelberg: Springer Verlag; 2001.
p. 297.
[50] (a) Hertel T, Martel R, Avouris Ph. J Phys Chem B 1998;102:910.
(b) Falvo MR, Clary GJ, Taylor RM, Chi V, Brooks FP, Washburn S,
et al. Nature 1997;389:582.
[51] Kilbride BE, Coleman JN, Fraysse J, Fournet P, Cadek M, Drury A,
H. Koerner et al. / Polymer 46 (2005) 4405–44204420
et al. Experimental observation of scaling laws for alternating current
and direct current conductivity in polymer–carbon nanotube compo-
site thin films. J Appl Phys 2002;92(7):4024–30.
[52] Ramasubramaniam Rajagopal, Chen Jian, Liu Haiying. Homogeneous
carbon nanotube/polymer composites for electrical applications. Appl
Phys Lett 2003;83(14):2928–30.
[53] Zhu Ai-Jun, Sternstein SS. Nonlinear viscoelasticity of nanofilled
polymers: interfaces, chain statistics and properties recovery kinetics.
Compos Sci Technol 2003;63(8):1113–26.
[54] Sternstein SS, Zhu Ai-Jun. Reinforcement mechanism of nanofilled
polymer melts as elucidated by nonlinear viscoelastic behavior.
Macromolecules 2002;35(19):7262–73.
[55] Qi HJ, Boyce MC. Constitutive model for stretch-induced softening of
the stress-stretch behavior of elastomeric materials. J Mech Phys
Solids, Submitted for publication.
[56] Reuss A. Z Angew Math Mech. 949. Voigt W. Lehrbuch der
kristallphysik. Leipzig: Teubner; 1928. p. 410. Ward IM. Mechanical
properties of solid polymers. New York: Wiley; 1971. p. 255ff.
[57] Burnside SD, Giannelis EP. Nanostructure and properties of
polysiloxane-layered silicate nanocomposites. J Polym Sci Part B
Polym Phys 2000;38:1595–604.
[58] LeBaron PC, Pinnavaia TJ. Clay nanolayer reinforcement of a silicone
elastomer. Chem Mater 2001;13(10):3760–5.
[59] Wang Z, Pinnavaia TJ. Nanolayer reinforcement of elastomeric
polyurethane. Chem Mater 1998;10:3769–71.
[60] Wang Z, Baron PC et al. Nanolayer reinforcement of thermoset
polymers, Additives 1999, International Conference, 8th, San
Francisco, March 22–24, 1999, Paper 10/1-Paper 10/9.
[61] Shi H, Lan T, et al. Interfacial Effects on the reinforcement properties of
polymer–organoclay nanocomposites. Chem Mater 1996;8:1584–7.