Embed Size (px)
Citation preview

Department of Applied Geophysics, Indian School of Mines, Dhanbad
*Reliance Industries Ltd., Mumbai
10th Biennial International Conference & Exposition
P 199
Deformation modeling around a wellbore using finite element technique
Rima Chatterjee, Dip Kumar Singha and P. Sangvai*
Summary
In this paper modeling of in-situ stress and deformation around a wellbore is presented using 2D and 3D finite element
technique. The present model uses the concepts of poroelasticity theory to compute the stationary 2D and 3D, brittle
response of the formation around a borehole that is subjected to compressive horizontal stresses. The 2D and 3D models are
analysed to investigate the effects of differential far-field stresses and the effect of drilling mud pressure around the
wellbore. Differential stresses are the main cause of the elongation of wellbore parallel to the minimum horizontal
compressive stress direction. The direction and relative extension of the observed breakouts at a particular depth are
modeled successfully using formation realistic parameters and dimensions, although the exact shape of the wellbore (at all
angles) was unknown.
Keywords: Stress, Wellbore, Finite Element Analysis
Introduction
The problem of wellbore stability has gained significant
importance in the last 10 years as a response to the
increasing of exploration of complex areas which
represent major engineering challenges in drilling and
production (Charlez and Onaisi, 2001). Severe hole
enlargement has a long list of consequences, from
reducing the drill bit life to causing cleaning hole
problems, stuck pipe, poor cementing, logging problems,
and often the need to sidetrack (Last, 2001). Rock in
natural state is stressed in three principal directions:
vertical stress (Sv) and two horizontal stresses. The two
horizontal stresses are generally not equal - the maximum
and minimum horizontal stresses are expressed as SH and
Sh respectively. As a wellbore is drilled, drilling mud
pressure replaces the support lost by removal of original
column of rock. Drilling mud pressure being uniform in
all directions can not exactly balance the earth stress.
Consequently rock surrounding the wellbore is deformed
and strained and may fail if the redistributed stresses
exceed rock strength (Addis et al., 1993). There are two
failure mechanism : tensile failure when drilling mud
pressure is very high and rock stress exceeds tensile
strength, compressive failure can occur at low or high
mud pressure depending on mechanical properties of rock
where rock stress exceeds compressive strength. Under
compressive failure rocks caves in on spalls off, creating
breakouts. The compressive hoop stress around a hole can
be large enough to exceed the strength of the rock. When
this happens, the rock around a portion of the wellbore
fails and stress-induced wellbore breakouts form (Barton
et al., 1988 and Zoback et al., 1985).
The objectives of this paper are (a) to build a 2D finite
element model (FEM) for a wellbore at a depth of 2800m
surrounded by homogeneous rocks under equal and
differential far-field horizontal stresses, (b) to build 3D
FEM for the same wellbore of 20 m length under
differential stress, (c) to investigate deformation and
elongation of wellbore under these conditions.
Numerical Models
Finite element technique has been used to compute the
deformation and stress trajectories surrounding a circular
wellbore drilled into a homogeneous rock mass. Finite
element models are generated and stresses are calculated
using ANSYS, finite element package. The 2D and 3D
area is divided into a number of finite elements connected
by nodal points. Each element is assigned a displacement
function that is determined by the element’s shape and

2
the positions of the nodal points. The displacement
function and a stress-strain relationship for the element
material fix both the strain and stress distribution in the
element as functions of the element nodal point
displacement. These functions are handled as a matrix
equation for the element. The matrix equation for the
whole system of finite elements is solved for the
equilibrium nodal point displacements by minimizing the
total potential energy of the system with respect to the
nodal point displacements.
Well log data such as: density log is generally used to
estimate vertical stress of any area. In a normal faulting
stress regime vertical stress is greater than the SH and Sh
(Sv≥SH>Sh). In this paper, horizontal section of a circular
wellbore is assumed at a depth of 2800 m. The Sv is
calculated at 2800 m depth using vertical stress gradient
of 22 MPa/km. Pore pressure is estimated from
hydrostatic pressure gradient assuming 0.433 psi/ft
(equivalent to 9.33 MPa/km) and it becomes 26.12 MPa
at the depth of 2800m. Boundary constraints for these
FEMs represent a key element in understanding the
modeling results. These include a far-field stresses (SH =
SV = 62MPa and Sh = 0.7SV = 44MPa) at the model
boundary (Figure 1). Drilling mud pressure of 28MPa is
applied at the well boundary. Displacements along x axis
and y axis of the model boundaries have been assumed
zero values. The 2D model is carried out in the horizontal
plane. The ANSYS software represents the von mises
stress as equivalent stress magnitude. The von mises
stress (Boresi and Schimdt, 2003) for stress models can
be expressed in the following form:
von mises stress = (1/2)1/2[(Sx - Sy)2 + (Sy - Sz)2 + (Sz -
Sx)2 + 6 (τxy + τyz + τzx)2 ]1/2
where Sx, Sy and Sz are the normal stresses along x, y
and z axes respectively. τxy, τyz τzx are the shear
stresses.
To investigate the deformation of homogeneous rock
mass of 2x2 sq.m area around a wellbore of diameter
0.5m, mechanical properties of rock mass such as:
Young’s modulus of 30GPa, Poisson’s ratio of 0.27 and
density of 2.55gm/c.c have been assumed for modeling.
The two numbers of 2D model subjected to equal and
differential horizontal stresses (Figures 1 and 2) and one
3D model subjected to differential stress for 20 m long
wellbore (Figure 3) are presented with the modeling
results.
Results
The resultant displacement for 2D model under equal
compressive horizontal stresses shows uniform variation
along the wellbore boundary. Wellbore diameter is
reduced at all sides (Figure 4). Von mises stress contours
show uniform variation of stress ranging 24 to 35 MPa
prevailing surrounding the wellbore (Figure 5). The stress
vector plot (Figure 6) also show the redistribution of
horizontal stress direction around the wellbore.
The next 2D model subjected to differential compressive
stresses show deformation of the wellbore wall (Figure
7). Wellbore becomes elliptical with its long axis oriented
towards far-field Sh direction. Well diameter is increased
along the application of Sh direction and shortened along
SH direction. Figure 8 displays the von mises stress
contour, showing the stress magnitude of 54 to 80 MPa
and along the direction of long axis of ellipitical wellbore
and 32 to 52 MPa along the short axis of the wellbore.
The stress vector plot (Figure 9) indicates that the
minimum horizontal stress vector is rotated towards the
long axis of ellipse aligning parallel to the far-field Sh
direction. The maximum horizontal stress vector is
aligned perpendicular to the Sh direction. The spalling off
the wall due to differential stresses is termed as breakout.
Therefore the model results can be verified with any
image log of any area under the wellbore condition will
indicate the Sh orientation.
The 3D model is generated to observe the variation of
deformation and stress vector for a cylindrical wellbore
of 20 m length having same diameter. Figure 10 indicates
the wellbore deformation, spalling has occurred
throughout the wall, the diameter of wellbore is increased
along the application of Sh direction. The Figure 11
showing the von mises stress range 69 to 84MPa at the
well wall. The compressive hoop stress becomes
maximum at the wall and breakout occurs. Zoback et al.,
2003 has also indicated the maximum hoop stress at the
wall where elongation takes place. The stress vector plot
(Figure 12) is indicating the same result as in figure 9.

3
Figure 1: Finite element mesh and boundary condition for 2D
model under equal horizontal compressive stresses.
Figure 2: Boundary condition for 2D model under differential
compressive stresses.
Figure 3: Boundary condition for 3D model under differential
compressive stresses.
Fig. 4: Resultant displacement for 2D model under equal
horizontal compressive stresses.

4
Figure 5: Von mises stress contour for 2D model under equal
horizontal compressive stresses
Fig. 6: Principal stress vector plot 2D model under equal
horizontal compressive stresses.
Figure 7: Resultant displacement for 2D model under
differential horizontal compressive stresses.
Fig. 8: Von mises stress contour for 2D model under differential
horizontal compressive stresses. Compressive hoop stress is
maximum at the direction of far-field Sh direction.
Figure 9: Principal stress vector plot 2D model under
differential horizontal compressive stresses. Green and blue
colour presents the minimum and maximum horizontal
principal stress direction.
5
Fig. 10: Resultant displacement for 3D model under differential
horizontal compressive stresses.
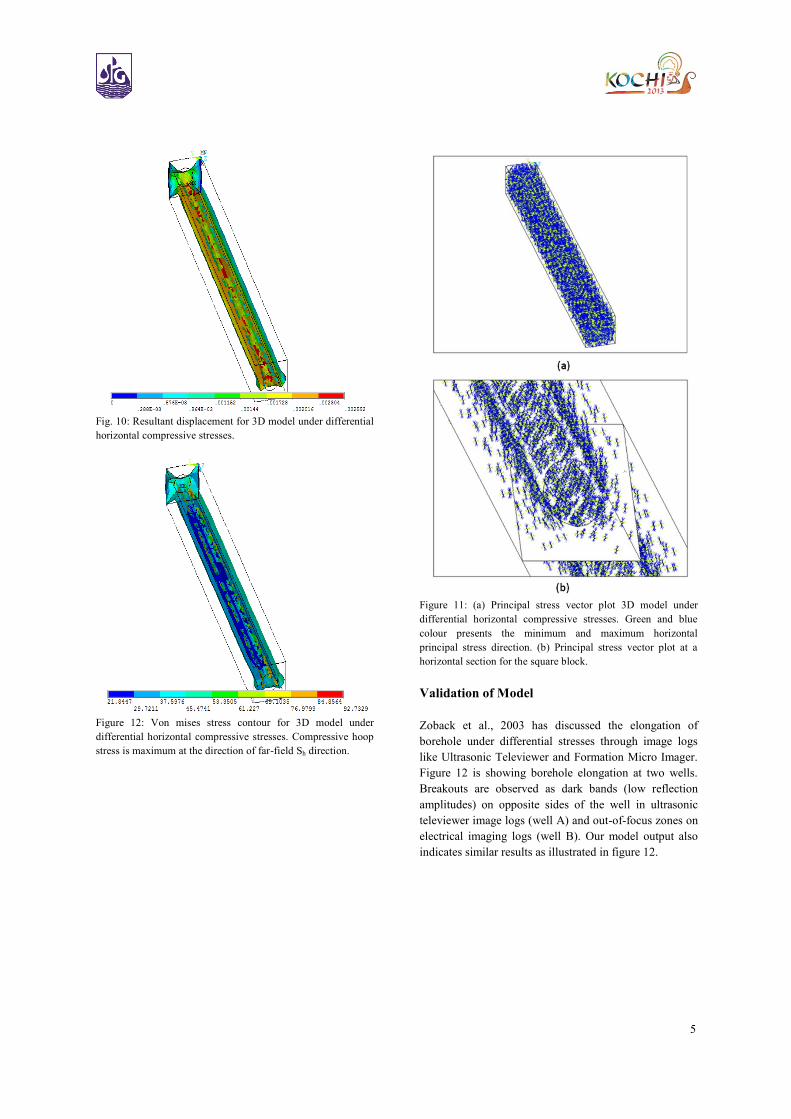
Figure 12: Von mises stress contour for 3D model under
differential horizontal compressive stresses. Compressive hoop
stress is maximum at the direction of far-field Sh direction.
Figure 11: (a) Principal stress vector plot 3D model under
differential horizontal compressive stresses. Green and blue
colour presents the minimum and maximum horizontal
principal stress direction. (b) Principal stress vector plot at a
horizontal section for the square block.
Validation of Model
Zoback et al., 2003 has discussed the elongation of
borehole under differential stresses through image logs
like Ultrasonic Televiewer and Formation Micro Imager.
Figure 12 is showing borehole elongation at two wells.
Breakouts are observed as dark bands (low reflection
amplitudes) on opposite sides of the well in ultrasonic
televiewer image logs (well A) and out-of-focus zones on
electrical imaging logs (well B). Our model output also
indicates similar results as illustrated in figure 12.

6
Figure 12: Illustrates borehole breakout in (a) ultrasonic
televiewer image log in well A and (b) Formation micro
imager, FMI log in well B along with elliptical section of well
A (after Zoback et al., 2003).
Conclusions
This exercise demonstrates the wellbore deformation
under equal and differential far-field horizontal
compressive stresses. The model predicted deformation
indicates that the wellbore diameter is increased along the
application of minimum horizontal stress and is shortened
towards the direction of maximum horizontal stress.
Spalling off around the wellbore wall will occur under
this breakout condition. The stress vector plots indicate
that the breakout direction will provide the orientation of
Sh around any well. Modeling results are validated with
the image logs for two wells.
References
Addis, T., Last, N., Boulter, D., Roca-Ramisa, L. and
Plumb, D., 1993, The quest for Borehole stability in the
Cusiana Field, Colombia, Oilfield Review, April/July,
33-43.
Barton, C. A., Zoback, M. D. and Burns, K. L., 1988, In-
situ stress orientation and magnitude at the Fenton
Geothermal site, New Mexico, determined from wellbore
breakout, Geophysical Research Letters, 15(5),. 467- 470.
Boresi, A. P. and Schmidt, R. J., 2003, Advanced
Mechanics of Materials (6th Edition), John Wiley &
Sons, Inc., Hoboken, NJ.
Charlez, P.S. and Onaisi, A., 2001, Wellbore Stability:
One of the Most Important Engineering Challenges When
Drilling Smart Wells in Interactive Drilling for fast track
Oilfield Development, Ed. J. Lecourtier, TECHNIP, 77-
102.
Last, N.C., 2001, Achieving and Maintaining Improved
Drilling Performance in the Tectonically Stressed Andean
Foothills of Colombia in Interactive Drilling for fast track
Oilfield Development, Ed. J. Lecourtier, TECHNIP, 59-
75.
Zoback, M.D., Barton, C.A., Brudy, M., Castillo, D.A.,
Finkbeiner, T., Grollimund, B.R., Moosb, D.B., Peska,
P., Wardb, C.D. and Wiprut, D.J., 2003, Determination of
stress orientation and magnitude in deep wells,
International Journal of Rock Mechanics & Mining
Sciences, 40, 1049–1076.
Zoback, M. D., Daniel, M. and Mastin, L., 1985,
Wellbore Breakout and in-situ stress, Journal of
Geophysical Research, 90, 5523-5530.