Embed Size (px)
Citation preview

1
Deforestation in Amazonia impacts riverine carbon dynamics 1
2
F. Langerwisch1,2
, A. Walz3, A. Rammig
1,4, B. Tietjen
5,2, K. Thonicke
1,2, W. Cramer
6 3
1 Earth System Analysis, Potsdam Institute for Climate Impact Research (PIK), P.O. Box 60 4
12 03, Telegraphenberg A62, D-14412 Potsdam, Germany 5 2 Berlin-Brandenburg Institute of Advanced Biodiversity Research (BBIB), 14195 Berlin, 6
Germany 7 3 Institute of Earth and Environmental Science, University of Potsdam, Karl-Liebknecht-Str. 8
24-25, D-14476 Potsdam-Golm, Germany 9 4TUM School of Life Sciences Weihenstephan, Land Surface-Atmosphere Interactions, 10
Technische Universität München, Hans-Carl-von-Carlowitz-Platz 2, 85354 Freising, 11
Germany 12 5 Biodiversity and Ecological Modelling, Institute of Biology, Freie Universität Berlin, 13
Altensteinstr. 6, D-14195 Berlin, Germany 14 6 Institut Méditerranéen de Biodiversité et d'Ecologie marine et continentale (IMBE), Aix 15
Marseille Université, CNRS, IRD, Avignon Université, Technopôle Arbois-Méditerranée, 16
Bât. Villemin - BP 80, F-13545 Aix-en-Provence cedex 04, France 17
18
Correspondence to: F. Langerwisch ([email protected]) 19
20
2
21
Abstract 22
Fluxes of organic and inorganic carbon within the Amazon basin are considerably controlled 23
by annual flooding, which triggers the export of terrigenous organic material to the river and 24
ultimately to the Atlantic Ocean. The amount of carbon imported to the river and the further 25
conversion, transport and export of it depend on temperature, atmospheric CO2, terrestrial 26
productivity and carbon storage, as well as discharge. Both, terrestrial productivity and 27
discharge, are influenced by climate and land use change. The coupled LPJmL and RivCM 28
model system (Langerwisch et al., 2015) has been applied to assess the combined impacts of 29
climate and land use change on the Amazon riverine carbon dynamics. Vegetation dynamics 30
(in LPJmL) as well as export and conversion of terrigenous carbon to and within the river 31
(RivCM) are included. The model system has been applied for the years 1901 to 2099 under 32
two deforestation scenarios and with climate forcing of three SRES emission scenarios, each 33
for five climate models. We find that high deforestation (BAU scenario) will strongly 34
decrease (locally by up to 90%) riverine particulate and dissolved organic carbon amount until 35
the end of the current century. At the same time, increase in discharge leaves net carbon 36
transport during the first decades of the century roughly unchanged only if a sufficient area is 37
still forested. After 2050 the amount of transported carbon will decrease drastically. In 38
contrast to that, increased temperature and atmospheric CO2 concentration determine the 39
amount of riverine inorganic carbon stored in the Amazon basin. Higher atmospheric CO2 40
concentrations increase riverine inorganic carbon amount by up to 20% (SRES A2). The 41
changes in riverine carbon fluxes have direct effects on carbon export, either to the 42
atmosphere via outgassing, or to the Atlantic Ocean via discharge. The outgassed carbon will 43
increase slightly in the Amazon basin, but can be regionally reduced by up to 60% due to 44
deforestation. The discharge of organic carbon to the ocean will be reduced by about 40% 45
under the most severe deforestation and climate change scenario. These changes would have 46
local and regional consequences on the carbon balance and habitat characteristics in the 47
Amazon basin itself but also in the adjacent Atlantic Ocean. 48
49
1 Introduction 50
The Amazon basin, defined as the drainage area of the Amazon River, covers approximately 51
six million square kilometres, and more than 70% of it is still covered with intact rainforest 52
(Nobre, 2014). The amount of carbon in biomass in Amazonian rainforest is estimated to be 53
93 ± 23×1015
g C (Malhi et al., 2006). This biomass is stored in a wide range of diverse 54
habitats, including tropical rainforest and savannahs, as well as numerous aquatic habitats, 55
like lakes and wetlands (Goulding et al., 2003; Eva et al., 2004; Keller et al., 2009; Junk, 56
1997). The large diversity in habitats, partly already founded in the geologic formation of 57
Amazonia, leads to a high diversity of animal and plant species (Hoorn et al., 2010), making 58
the Amazon rainforest one of Earth's greatest collections of biodiversity. 59
3
The Amazon River, which floods annually large parts of the forest, plays an important role in 60
supporting the diversity of Amazonian ecosystems. The flooding is most decisive for the 61
coupling of terrestrial and aquatic processes by transporting organic material from the 62
terrestrial ecosystems to the river (Hedges et al., 2000). The input of terrigenous organic 63
material (Melack and Forsberg, 2001; Waterloo et al., 2006), acts, for instance, as fertilizer 64
and food source (Anderson et al., 2011; Horn et al., 2011), and is a modifier of habitats and 65
interacting local carbon cycles (Hedges et al., 2000; Irmler, 1982; Johnson et al., 2006; 66
McClain and Elsenbeer, 2001). Across the Amazon basin, the outgassing carbon from the 67
river to the atmosphere and export of it to the ocean are the two most important processes that 68
have to be included, when assessing the effects on riverine carbon dynamics under climate 69
and land use change. Approximately 470×1012
g C yr−1
is exported to the atmosphere as CO2 70
(Richey et al., 2002), in comparison with about 32.7×10¹²
g C yr−1
of total organic carbon 71
(TOC) is exported to the Atlantic Ocean (Moreira-Turcq et al., 2003). It is estimated that the 72
large scale outgassing of carbon from the Amazon River plays an important role in assessing 73
the future carbon balance of the Amazon basin, integrating riverine as well as terrestrial 74
processes. 75
Deforestation continues to be the largest threat to Amazonia. The transformation of tropical 76
rainforest to cropland and pasture impacts ecosystem stability profoundly due to altered 77
climate regulation and species richness (Foley et al., 2007; Lawrence and Vandecar, 2014; 78
Malhi et al., 2008; Spracklen et al., 2012). Until the year 2012 approximately 20% of the 79
original forest of the Brazilian part of the Amazon basin has been deforested, corresponding 80
to an area of about 750,000 km2 (Godar et al., 2014; INPE, 2013). This deforestation was 81
mainly driven by the land expansion for soybean and cattle production and the expansion of 82
the road network (Malhi et al., 2008; Soares-Filho et al., 2006). Governmental and 83
conservation efforts have helped to decrease recent deforestation rates (Nepstad et al., 2014) 84
but economic instability might reverse this trend (Aguiar et al., 2016; Fearnside, 2015). 85
Deforestation also alters the soil stability and increases erosion (Yang et al., 2003).Together 86
with climate change effects and forest burning, land cover change is predicted to release 87
carbon at rates of 0.5-1.0×10¹⁵
g C yr−1
from this area (Potter et al., 2009). Furthermore, the 88
effects of deforestation on terrestrial carbon storage and fluxes persist several decades after 89
logging because the forest needs about 25 years to recover approximately 70% of its original 90
biomass, and at least another 50 years for the remaining 30% after abandonment of agriculture 91
(Houghton et al., 2000; Poorter et al., 2016). 92
Deforestation immediately reduces the terrestrial organic carbon pools, which fuel riverine 93
respiration (Mayorga et al., 2005), while increasing the velocity and amount of runoff, as well 94
as the discharge (Foley et al., 2002; Costa et al., 2003). Additionally, climate change alters 95
precipitation which then affects inundation patterns (Langerwisch et al., 2013), such as 96
temporal shifts in high and low water months and changes of inundated area. The combined 97
effects of deforestation and climate change have the potential to tremendously alter the 98
exported terrigenous carbon fluxes, the amount of carbon emitted to the atmosphere and 99
exported the ocean. The local export of terrestrial organic carbon to the river changes the 100
nutrient supply and therefore alters the habitat for riverine plants and animals, (Hamilton, 101
2010). 102

4
The aim of our study is to elaborate on these combined effects of climate change and 103
deforestation on the riverine carbon fluxes, on the export of organic material into the Atlantic 104
Ocean and on the outgassing of riverine carbon to the atmosphere. By considering the 105
interactions between riverine and terrestrial carbon processes a complete view on future 106
changes in the regional and basin-wide carbon balance can be achieved for the Amazon basin. 107
We mean in this study the effects of replacing tropical forest with soy bean fields and pasture, 108
i.e. deforestation, and the effects of changed carbon fluxes and pool sizes on crop and pasture 109
land, i.e. changed land use. 110
To address these issues basin-wide data are needed, which not only describe the current 111
situation but also assess future changes, expanding our knowledge obtained from on-site 112
measurements. To partly overcome these limitations we make use of the well-established 113
dynamic global vegetation model LPJmL together with the riverine carbon model RivCM. 114
While LPJmL (Bondeau et al., 2007; Gerten et al., 2004; Rost et al., 2008; Sitch et al., 2003) 115
provides plausible estimates for the carbon and water pools and fluxes within the coupled 116
soil-vegetation system, RivCM (Langerwisch et al., 2015) focuses on the export, conversion 117
and transport of terrestrial fixed carbon in the river and to the atmosphere and ocean. In 118
Langerwisch et al. (2015) the solely effects of climate change have been estimated. The 119
results of the mentioned study show that climate change causes a doubling of riverine organic 120
carbon in the Southern and Western basin while reducing it by 20% in the eastern and 121
northern parts towards the end of this century. In contrast, the amount of riverine inorganic 122
carbon shows a 2- to 3-fold increase in the entire basin, independent of the climate change 123
scenario (SRES). The export of carbon to the atmosphere increases on average by about 30%. 124
The amount of organic carbon exported to the Atlantic Ocean depends on the SRES scenario 125
and is projected to either decrease by about 8.9% (SRES A1B) or increase by about 9.1% 126
(SRES A2). The current study, which is an extension of Langerwisch et al. (2015) goes one 127
step further and investigates the combined effects of climate change and deforestation on the 128
riverine carbon dynamics. The coupled model LPJmL-RivCM was forced by several climate 129
change and deforestation scenarios that cover a wide range of uncertainties. We estimated 130
temporal and spatial changes in three riverine carbon pools as well as changes in carbon 131
emissions to the atmosphere and carbon export the ocean. 132
2 Methods 133
To assess the impacts of climate change and deforestation on riverine carbon pools and fluxes 134
in the Amazonian watershed we applied the model system of LPJmL and RivCM. RivCM is a 135
grid-based model that assesses the transport and export of carbon at monthly time steps and is 136
driven climate data and terrestrial carbon pools (Langerwisch et al., 2015). Climate inputs are 137
taken from different global climate model simulations driven by three SRES scenarios (A1B, 138
A2 and B1; Nakićenović et al., 2000). Terrestrial carbon inputs are calculated by the process-139
based dynamic global vegetation and hydrology model LPJmL (Bondeau et al., 2007; Gerten 140
et al., 2004; Rost et al., 2008; Sitch et al., 2003). To estimate soil and vegetation carbon, 141
LPJmL uses the above mentioned climate data and a set of deforestation scenarios from a 142
regional projections by SimAmazonia (Soares-Filho et al., 2006). An overview of the 143
interconnection between the two models and the scenarios is given in 144

5
Figure 1. 145
2.1 Model descriptions 146
2.1.1 LPJmL – a dynamic global vegetation and hydrology model 147
The process-based global vegetation and hydrology model LPJmL (Bondeau et al., 2007; 148
Gerten et al., 2004; Rost et al., 2008; Sitch et al., 2003) simulates the dynamics of potential 149
natural vegetation and thus carbon pools for vegetation, litter and soil and corresponding 150
water fluxes, in daily time steps and on a spatial resolution of 0.5 × 0.5 degree (lat/lon). The 151
main processes included are photosynthesis (modelled according to Collatz et al., 1992; 152
Farquhar et al., 1980), auto- and heterotrophic respiration, establishment, mortality, and 153
phenology. For calculating these main processes LPJmL uses climate data (temperature, 154
precipitation, and cloud cover), atmospheric CO2 concentration, and soil type as input The 155
simulated water fluxes include evaporation, soil moisture, snowmelt, runoff, discharge, 156
interception, and transpiration, which are directly linked to abiotic and biotic properties. In 157
each grid cell LPJmL calculates the performance of nine plant functional types, which 158
represent an assortment of species classified as being functionally similar. In the Amazon 159
basin primarily three of these types are present, namely tropical evergreen and deciduous trees 160
and C4 grasses. In addition to the potential natural vegetation LPJmL can simulate the 161
dynamics of 16 user-defined crops and pasture on area that is not covered by natural 162
vegetation. In analogy to natural vegetation, LPJmL evaluates carbon storage in vegetation, 163
litter and soil as well as water fluxes for these areas. On areas, which are converted to crops 164
and pasture, the vegetation carbon stored in natural vegetation (carbon in living above- and 165
belowground biomass) is removed from the terrestrial domain and added to the litter pool. 166
Due to deforestation, a large amount of carbon is removed from the living biomass, i.e. after 167
some years, the pool size of potential carbon that can be washed out to the river is decreasing 168
dramatically. On the deforested areas growth and harvest of soy bean and managed grasslands 169
is simulated. We distinguished these two types of land use, because soy bean farming and 170
pasture leave different amounts of litter carbon on site. In LPJmL, during soy harvest a 171
maximum of 30% of the aboveground soy biomass, representing the beans, is removed as 172
harvest every year. The remaining aboveground biomass as well as all belowground biomass 173
is left on site and enters the litter pool. Managed grasslands are harvested regularly as well, 174
but always 50% of the aboveground biomass is removed. The remaining aboveground 175
biomass and the total belowground biomass enter the litter pool. Once a stand is harvested the 176
remaining above- and belowground biomass is added to the litter pool. The soil pool remains 177
unchanged. Only after litter decomposition this carbon enters the soil carbon pool. Therefore, 178
after deforestation the amount of carbon washed out from managed land to the river, and 179
entering the riverine carbon system, is much less in size compared to litter exported to the 180
river from undisturbed forests. Changes of soil characteristics and soil carbon pools due to 181
erosion, which is a common consequence of deforestation (Yang et al., 2003) is not included 182
in the model. In summary, the terrestrial ecosystem is losing carbon due to deforestation 183
followed by harvest. Therefore, the riverine ecosystem is receiving less carbon due to reduced 184
terrestrial carbon input after forest was converted to managed land. 185

6
LPJmL has been shown to reproduce current patterns of biomass production (Cramer et al., 186
2001; Sitch et al., 2003), carbon emission through fire (Thonicke et al., 2010), also including 187
managed land (Bondeau et al., 2007; Fader et al., 2010; Rost et al., 2008), and water dynamics 188
(Biemans et al., 2009; Gerten et al., 2004, 2008; Gordon et al., 2004; Wagner et al., 2003). 189
The simulated patterns in water fluxes, like evapotranspiration, runoff and soil moisture, are 190
comparable to stand-alone global hydrological models (Biemans et al., 2009; Gerten et al., 191
2004; Wagner et al., 2003). 192
2.1.2 RivCM – a riverine carbon model 193
RivCM is a process-based model that calculates four major ecological processes related to the 194
carbon budget of the Amazon River (Figure 1B). These processes include (1) mobilization, 195
(2) decomposition and (3) respiration within the river, and (4) outgassing of CO2 to the 196
atmosphere (Langerwisch et al., 2015). During mobilization parts of terrigenous litter and soil 197
carbon, as it is provided by LPJmL, is imported to the river, depending on inundated area. The 198
further processing of the terrigenous carbon in the river happens during its decomposition, 199
which represents the manual breakup, and its respiration, representing the biochemical 200
breakup. Finally the CO2 that is produced during respiration can outgas if the saturation 201
concentration is exceeded (Langerwisch et al., 2015). These four processes directly control 202
the most relevant riverine carbon pools, namely particulate organic carbon (POC), dissolved 203
organic carbon (DOC), and inorganic carbon (IC), as well as outgassed atmospheric carbon 204
(representing CO2), and exported riverine carbon to the ocean (either as POC, DOC, or IC). 205
The model is coupled to LPJmL by using the calculated monthly litter and soil carbon and 206
water amounts as inputs. It operates at the spatial resolution of 0.5 × 0.5 degree (lat/lon) and 207
on monthly time steps. The ability of the coupled model LPJmL-RivCM to reproduce current 208
conditions in riverine carbon concentration and export to either the atmosphere or the ocean 209
has been shown and discussed by Langerwisch et al. (2015). A validation of the carbon pools 210
and fluxes with observed data shows that RivCM produces results that are within the range of 211
observed concentrations of both organic and inorganic carbon pools. Model results strongly 212
underestimate the amount of outgassed carbon while the carbon discharged to the ocean is 213
overestimated. There are still large uncertainties in the process understanding of riverine carbon 214
processes that translates to uncertainty in the parameter estimation. Therefore, a respective model 215
like we have applied here can currently only reproduce broad estimations of exported CO2 216
(outgassing) and exported organic carbon (discharge). In general the model reaction to climate 217
change alone and in combination with deforestation and land-use change is as expected (e.g. 218
reduction of organic carbon due to deforestation, increase of inorganic carbon due to climate 219
change). Therefore, we think it is reasonable to use our model to estimate changes in process 220
relations and general trends. Further data-model comparison and improved parameterization are 221
still required to allow assessing the simulated absolute numbers model. Despite these 222
shortcomings we make use of the coupled model system of LPJmL and RivCM to assess the 223
combined impacts of climate change and deforestation. 224

7
2.2 Model simulation 225
All transient LPJmL runs were preceded by a 1000-year spin-up during which the pre-226
industrial CO2 level of 280 ppm and the climate of the years 1901-1930 have been repeated to 227
obtain equilibria for vegetation, carbon, and water pools. All transient runs of the coupled 228
model LPJmL-RivCM have been preceded by a 90-years-spinup during which the climate and 229
CO2 levels of 1901-1930 have been repeated to obtain equilibria for riverine carbon pools. 230
LPJmL-RivCM was run on a 0.5° × 0.5° degree (lat/lon) spatial resolution for the years 1901 231
to 2099. For the estimation of the impact of projected climate change (CC) and deforestation 232
(Defor), simulations have been conducted driven by five General Circulation Models 233
(GCMs), each calculated for three SRES emission scenarios, and three LUC scenarios. 234
2.2.1 Climate change and deforestation data sets 235
To assess the effect of future climate change, projections of five GCMs (see also Jupp et al., 236
2010; Randall et al., 2007), using three SRES scenarios (A1B, A2, B1) (Nakićenović et al., 237
2000) have been applied (Figure 1A). The GCMs, namely MIUB-ECHO-G, MPI-ECHAM5, 238
MRI-CGCM2.3.2a, NCAR-CCSM3.0, UKMO-HadCM3, cover a wide range in terms of 239
temperature and precipitation and have therefore been chosen to account for uncertainty in 240
climate projections. The emission scenario SRES A1B describes a development of very rapid 241
economic growth with convergence among regions, and a balanced future energy source 242
between fossil and non-fossil. SRES A2 describes a development of a very heterogeneous 243
world with slow economic growth. And SRES B1 describes a development of converging 244
world similar to A1B but with more emphasis on service and information economy. 245
To estimate the additional effects of deforestation on riverine carbon pools and fluxes three 246
land use scenarios were applied: two scenarios directly relate to different intensity of 247
deforestation, and one represents a reference scenario with complete coverage by natural 248
vegetation (NatVeg scenario, hereafter). The two deforestation scenarios are based on the 249
SimAmazonia projections (Soares-Filho et al., 2006, see also Figure 2). The authors estimate 250
the development of deforestation in the Amazon basin until 2050 based on historical trends 251
and projected developments. In the business-as-usual scenario (BAU) they assume that recent 252
deforestation trends continue, the number of paved highways increases, and new protected 253
areas are not established. In contrast, deforestation is more efficiently controlled in the 254
governance scenario (GOV). For this scenario the authors assume that the Brazilian 255
environmental legislation is implemented across the Amazon basin and the size of the area 256
under the Protected Areas Program increases. The SimAmazonia scenarios cover the years 257
from 2001 to 2050. After 2050 the fraction of deforested area is kept constant. From 2051 258
until the end of the century the only driver of change is the continuing climate change. This 259
approach enables us to estimate the consequences of combined dynamics of deforestation and 260
climate change until 2050 and the effects of intensified climate change after 2050, when 261
deforestation is halted at its maximum. Deforestation rates preceding the scenarios (before 262
2001) were derived from extrapolating the data into the past. LPJmL requires historic land-263
cover information to correctly capture transient carbon dynamics. The model starts to simulate 264
vegetation dynamics from bare ground and can’t be initialized with a land-cover map of a 265

8
particulate year. It was therefore necessary to develop an approach which produced consistent 266
land-cover information for the (undisturbed) past and the deforestation scenarios. For that, the 267
mean annual rate of deforestation was calculated for the reference period of 2001 to 2005 (Eq. 268
(1)) and this rate was applied to calculate the fraction of deforested area Ft for the years 1901 269
to 2000 for each cell (Eq. (2)). 270
𝑟 = ( ∑𝐹𝑡
𝐹𝑡+1
2005
𝑡=2001
) ×1
2006 − 2001
(1)
𝐹𝑡 = 𝐹2001 × 𝑟2001−𝑡 (2)
271
To evaluated spatial differences in the basin we defined three sub-regions (see Table 1). Three 272
regions were selected for further detailed analysis and differ in projected changes in 273
inundation patterns and in deforestation intensity. R1 is located in the Western basin with 274
projected increase in inundation length and inundated area (Langerwisch et al., 2013) 275
combined with low land use intensity. R2 is a region covering the Amazon main stem with 276
intermediate changes in inundation (Langerwisch et al., 2013) and intermediate land use 277
intensity. And R3 is a region with projected decrease in duration of inundation and inundated 278
area (Langerwisch et al., 2013) combined with high land use intensity. In the deforestation 279
scenarios we assume that on 15% of the deforested area soy bean is grown and 85% of the 280
area is used as pasture for beef production (Costa et al., 2007). 281
2.3 Analysis of simulation results 282
The separate effect of deforestation (EDefor) is estimated by calculating the differences 283
between future carbon amounts (2070-2099) produced in the deforestation scenarios (GOV or 284
BAU) and future carbon amounts produced in the potential natural vegetation scenario 285
(NatVeg), where no deforestation is assumed. The combined effect of climate change and 286
deforestation (ECCDefor) is estimated by calculating the differences between future carbon 287
amounts produced in the deforestation scenarios and reference carbon amounts (1971-2000) 288
produced in the NatVeg scenario. We analysed all four riverine carbon pools (riverine 289
particulate organic carbon (POC), dissolved organic carbon (DOC), riverine inorganic carbon 290
(IC) and outgassed carbon). The relative changes in POC and DOC show similar patterns (see 291
Figure S1), therefore exemplary POC is shown and discussed in detail. 292
2.3.1 Evaluation of potential future changes 293
Spatial effects of the two deforestation scenarios (GOV and BAU) on the different riverine 294
carbon pools and fluxes have been estimated by calculating the common logarithm (log10) of 295
the ratio of mean future (2070-2099) carbon amounts of the deforestation scenarios and mean 296
future carbon amounts of the NatVeg scenario (EDefor, Eq. (3)) for each simulation run. 297

9
𝐸𝐷𝑒𝑓𝑜𝑟 = 𝑙𝑜𝑔10
∑ 𝐶𝐷𝑒𝑓𝑜𝑟𝑡
2099𝑡=2070
∑ 𝐶𝑁𝑎𝑡𝑉𝑒𝑔𝑡2099𝑡=2070
(3)
To estimate changes caused by the combination of climate change and deforestation ECCDefor 298
compares future carbon pools in the deforestation scenarios to carbon pools during the 299
reference period (1971-2000) in the NatVeg scenario (Eq. (4)). 300
𝐸𝐶𝐶𝐷𝑒𝑓𝑜𝑟 = 𝑙𝑜𝑔10
∑ 𝐶𝐷𝑒𝑓𝑜𝑟𝑡1
2099𝑡1=2070
∑ 𝐶𝑁𝑎𝑡𝑉𝑒𝑔𝑡22000𝑡2=1971
(4)
Each simulation run combines deforestation and emission scenarios and aggregates the 301
outputs for all five climate model inputs used. To identify areas where the differences 302
between values in the reference period and future values are significant (p-value <0.05), the 303
Wilcoxon Rank Sum Test for not-normally distributed datasets (Bauer, 1972) has been 304
applied for each cell. 305
Additionally to the spatial assessment, time series were deduced based on mean values over 306
the entire basin and each of the three exemplary regions R1, R2 and R3. These means of the 307
carbon pools were calculated for every year during the simulation period. Changes have been 308
expressed as the five-year-running-mean of the quotient of annual future carbon amounts in 309
the deforestation and in the NatVeg scenarios. These analyses have been conducted both for 310
the whole Amazon basin and for three selected sub-regions. 311
2.3.2 Estimating the dominant driver for changes 312
We estimated which factor is causing the observed changes the most. To estimate the 313
contribution of either climate change (DCC, Eq. (5)) or deforestation (DDefor, Eq. (6)), 314
reference carbon amounts of the NatVeg scenario have been compared to future amounts of 315
the NatVeg scenario (DCC), and future carbon amounts of the NatVeg scenario have been 316
compared to future amounts of the deforestation scenarios (DDefor). 317
𝐷𝐶𝐶 = |𝑙𝑜𝑔10
∑ 𝐶𝑁𝑎𝑡𝑉𝑒𝑔𝑡1
2099𝑡1=2070
∑ 𝐶𝑁𝑎𝑡𝑉𝑒𝑔𝑡22000𝑡2=1971
| (5)
𝐷𝐷𝑒𝑓𝑜𝑟 = |𝐸𝐷𝑒𝑓𝑜𝑟| (6)
We define a cell as dominated by climate change effects, if DCC>DDefor and dominated by 318
deforestation effects if DCC<DDefor. The impact values DCC and DDefor (medianPOC = 0.9695, 319
medianIC = 1.0106, and medianoutgassedC = 0.9982) have been rounded to the second decimal 320
place. If both values are equal, the two effects balance each other. 321
322

10
3 Results 323
3.1 Changes caused by deforestation 324
Deforestation decreases riverine particulate and dissolved organic carbon (POC and DOC). 325
When continuing high deforestation rates as projected under the BAU deforestation scenario, 326
the decrease in POC is more intense than under GOV deforestation rates (Figure 3A and 327
Figure 3B; for DOC see Figures. S1A and S1B).In some highly deforested sites in the South-328
East of the basin the amount of POC is only 10% of the amount under no deforestation 329
(indicated by EDefor). This pattern is robust between the model realizations with a high 330
agreement of the results amongst the five climate models. In the deforestation scenarios the 331
changes in future POC are drastic, even though the difference between the three emission 332
scenarios A1B, A2, and B1 are very small. However, in some regions within the Amazon 333
basin POC increases (up to 3fold), especially in mountain regions (e.g. Andes and Guiana 334
Shield). Although POC and DOC respond similar in relative terms (see Figure S1), the 335
absolute amounts are approximately twice as high for DOC compared to POC (Table 2). The 336
mean basin-wide loss in POC ranges between 0.13×10¹²
g yr–1
(A2) and 0.24×10¹²
g yr–1
337
(A1B) in the GOV scenario, and between 0.37×10¹²
g yr–1
(A2) and 0.48×10¹²
g yr–1
(A1B) in 338
the BAU scenario. The SRES A2 scenario causes the largest changes in POC, further 339
increasing the loss caused by deforestation. 340
Changes in outgassed riverine carbon caused by deforestation (Figure 3C and Figure 3D) 341
show a similar pattern as the changes in POC, with an even clearer effect of deforestation on a 342
larger area. In both scenarios deforestation decreases outgassed carbon to up to one tenth 343
compared to the amount produced under the NatVeg scenario. The agreement between the 344
five climate models is even larger than in POC. In contrast to the overall pattern, some areas 345
in the Andes and the Guiana Shield show an increase in outgassed carbon of up to a factor of 346
30, but these areas are an exception. Like in POC the differences between the SRES scenarios 347
are only minor. For the absolute values see Table 2. 348
For riverine inorganic carbon (IC) deforestation caused significant changes (EDefor, p-value 349
<0.05) only in small areas (Figure 3E and Figure 3F). In these regions, in the very South of 350
the basin and in single spots in the North, i.e. in the headwaters of the watershed, IC increases 351
by a factor of up to 1.2. Besides these areas of increase, a slight decrease of about 5% is 352
simulated for the region along the main stem of the Amazon River, downstream of Manaus 353
and along the Rio Madeira and the Rio Tapajós. In contrast to POC, the spatial pattern of 354
change in IC does not obviously follow the deforestation patterns. Therefore, the differences 355
between the two deforestation scenarios GOV and BAU scenarios are minor. Whereas POC, 356
DOC, and outgassed carbon show a clear decrease due to deforestation, IC shows a nearly 357
neutral response with maximal mean basin-wide gains (for absolute values see Table 2). 358
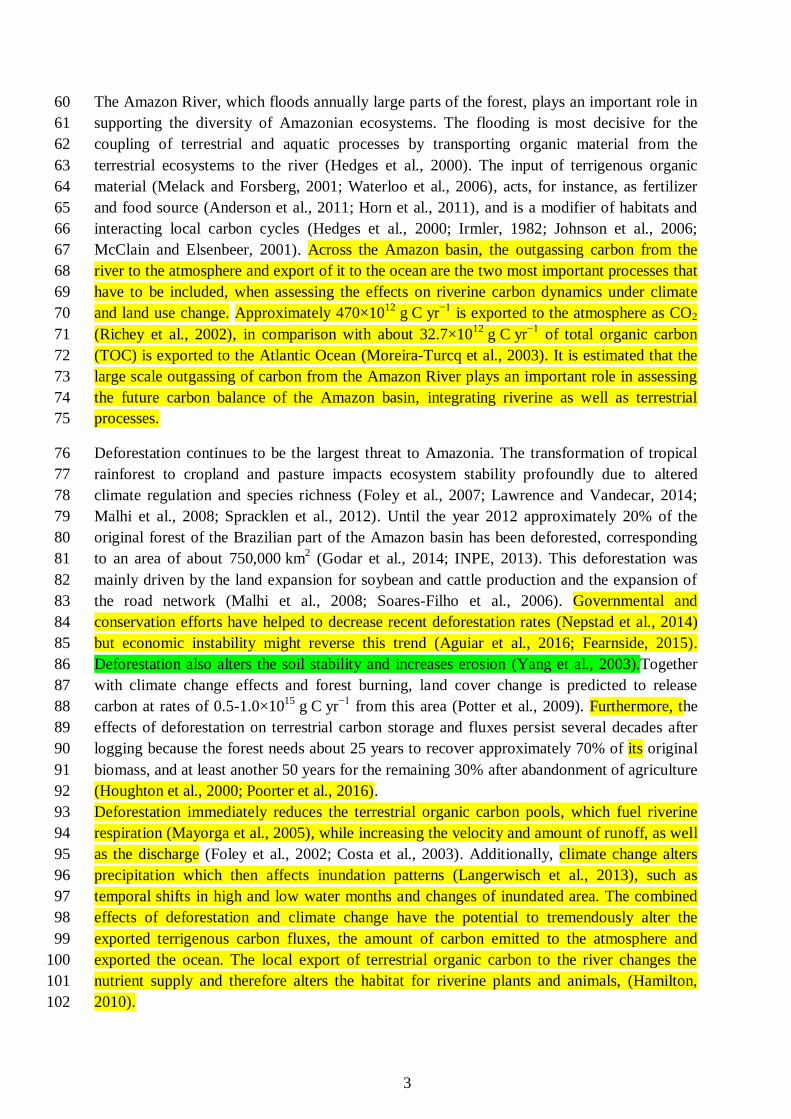
3.2 Changes caused by a combination of deforestation and climate change 359
Climate change and deforestation together will lead to large overall changes in the amount of 360
riverine and exported carbon. Riverine POC and DOC amounts will decrease by about 19.8% 361
and 22.2%, respectively, and exported organic carbon will decrease by about 38.1% (Figure 362

11
5). In contrast riverine IC will increase by about 100%, combined with a slight increase of 363
outgassed carbon by about 2.7% (Figure 5). In detail, the basin-wide changes in the amount 364
of POC (Figure 5A-B and Figure S2) caused by deforestation and climate change range 365
between a 2.5-fold increase and a decrease to one tenth. The increase is mainly caused by 366
climate change (indicated as blue area in the inset in Figure 5), whereas the decrease is mainly 367
caused by deforestation (red area in inset). The differences mainly induced by deforestation 368
are larger in the BAU compared to the GOV scenario. In contrast, the differences caused by 369
climate change show no large differences between the two deforestation scenarios. The 370
differences between the emission scenarios are minor (see also Table 2). In some areas the 371
dominance of forcing shifts from climate change dominance (DCC) for the GOV scenario 372
(green cell border) to deforestation dominance (DDefor) for the BAU scenario (red cell border) 373
due to the higher land use intensity as a result of deforestation (see also Table 3). While in the 374
GOV scenario 20% of all cells are dominated by deforestation impacts, this value increases 375
for the BAU scenario to 30%. During the first decades (2000-2030) basin-wide POC is partly 376
larger in the deforestation scenarios than in the NatVeg scenario by up to 2% in 2000 and 377
about 1% in 2020 (Figure 6A). All climate models show reduced POC amounts in the 378
deforestation scenarios compared to the NatVeg scenario after 2040. The POC amount in the 379
GOV deforestation scenario decreases gradually until the decrease levels off in the late 2060s, 380
i.e. ten years after the constant deforestation area is kept constant. In the BAU scenario, POC 381
decreases strongly in the 2040 to 2060s leading to a loss of about 25% compared to 10% in 382
the GOV scenario. In addition to Figure 6, which shows the temporal development under 383
deforestation only, we provide Figure S2, which shows the developments taking the 384
combination of deforestation and climate change into account. 385
The three sub-regions R1 to R3 show different patterns (Figure 6A). While in region R1 the 386
difference in the POC amounts between the GOV and the BAU scenario is only small, 387
reflecting the low deforestation in this region, the differences between the two deforestation 388
scenarios are more explicit in regions R2 and especially in R3 (with the largest area 389
deforested), where in addition model uncertainty is low. Starting in the 2050s, the variation 390
between different emission scenarios and climate models increases. Alike the results of the 391
impact of deforestation alone POC and DOC show a similar pattern (see also Table 2). 392
The changes in outgassed carbon (Figure 5C-D and Figure 6B) are in the same range as 393
changes in POC. Climate change increases outgassed carbon by about 20%, especially in the 394
North-Western basin (Figure 5C-D). The deforestation induces a decrease on outgassed 395
carbon to one tenth in areas with high fraction of deforested area, i.e. in the Eastern and 396
South-Eastern basin. Again, the differences in effects are much larger between the two 397
deforestation scenarios (GOV vs. BAU) than between the different emission scenarios (see 398
also Table 2). After 2050 the rate of deforestation determines the differences in the amount of 399
outgassed carbon (Figure 6B) as well. The outgassed carbon directly depends on the available 400
POC, therefore the time series of both, POC and IC widely match. Under the GOV scenario 401
the basin-wide loss of outgassed carbon is about 16% towards the end of the century. The 402
results of the BAU scenario show an average loss of outgassed carbon of 28%. 403
Changes in inorganic carbon (IC) are mainly driven by climate change (under all emission 404
scenarios) and less by the magnitude of deforestation (Figure 5E-F and Figure 6C, Tables 2 405

12
and 3). In about half of the Amazon basin the IC amount significantly changes due to climate 406
change (insignificant changes in the other 50%), but in no cell due to deforestation. The 407
magnitude of change varies between emission scenarios: the increase in IC is up to 4-fold in 408
the A2 scenario and up to 2.5-fold in the B1 scenario (see Table 2). For both deforestation 409
scenarios the gain of IC is dominant until 2050, while the basin-wide trend becomes unclear 410
afterwards. However, sub-regions like R1 and R3 show a slight increase during the whole 411
century (Figure 6F,J,M). 412
413
4 Discussion 414
Deforestation is, besides climate change, the largest threat to Amazonia. It leads directly to a 415
decrease in terrestrial biomass and an increase in CO2 emissions (Potter et al., 2009) and has 416
indirect effects on aquatic biomass, diversity of species and their habitats and the climate 417
(Asner and Alencar, 2010; Bernardes et al., 2004; Costa et al., 2003). Our results show that 418
deforestation is also likely to change the amount of riverine organic carbon as well as 419
exported carbon. 420
We identified a basin-wide reduction in riverine particulate and dissolved organic carbon 421
pools by about 10% to 25% by the end of this century (Figure 3 and Figure 6). This reduction 422
is particularly pronounced in areas of high deforestation intensity along the Arc of 423
Deforestation, at the Rio Madeira and the last 500 km stretch of the Rio Amazon, where large 424
deforestation rates reduce terrestrial carbon storage. In the first decades of the 21st century the 425
differences in carbon amounts between the two deforestation scenarios are only small (Figure 426
6). During these decades the deforestation-induced increase in discharge is able to partly 427
offset the decreasing amount of terrigenous organic matter which is the source of riverine 428
organic matter. In the model, the increase of discharge after deforestation is caused by a less 429
intense use of the available (soil) water by the crops, as compared to natural vegetation, which 430
leaves more water for discharge (as also reported by Costa et al., 2003). After the 2050s, the 431
differences in the organic carbon pools caused by deforestation become more obvious (Figure 432
6), with larger carbon decrease under the more severe BAU scenario. The same patterns occur 433
in the two regions with the pronounced deforestation (R1 and R2). Here the reduction of 434
terrestrial carbon directly reduces the amount of riverine carbon. The variation in future 435
riverine carbon fluxes within each deforestation scenario can be attributed to the differences 436
climate projections and emission scenarios, especially after 2060 when deforested area 437
remains constant and the lagged deforestation effects vanish. In regions with low 438
deforestation intensity (i.e. R1) the effects of land use change are much smaller and the 439
climate change effects dominate the change in riverine organic carbon and outgassed carbon. 440
Under the GOV scenario litter is constantly provided by the natural vegetation and small scale 441
deforestation, and therefore fills up the litter and soil carbon pools, which are responsible for 442
the POC and the outgassed carbon. There is a much clearer drop in the BAU scenario, where a 443
larger fraction of the cell is subject to deforestation; partly 100% of the cell area is deforested 444
in this scenario. In areas where the drop already starts before 2050 (e.g. Figure 6K and L, 445
showing the results for R3) the deforestation in parts of the area already reached 100% before 446

13
2050 (also compare with timelines in Figure 2B). In these cells there is a drastically reduced 447
influx of carbon to the litter pool (only from crops) and therefore we already see the drop 448
earlier than in other areas (e.g. R1). 449
The reduction in the riverine organic carbon pools will have consequences for the floodplain 450
and the river itself. Floodplains as well as riverine biotopes depend on the annually recurring 451
input of organic material, either as food supply or fertilizer (Junk and Wantzen, 2004). The 452
productivity of the floodplain forests is mainly driven by the input of nutrients which are 453
basically sediments and organic material (Worbes, 1997). While the sediment input (also 454
adding nutrients) might increase due to increased discharge, the input of organic material 455
from upstream areas will decrease, leading to a reduced terrestrial and riverine productivity. 456
This reduced productivity will certainly impact many animal species that rely on the food 457
supplied by trees, such as fruits or leaves. The reduced supply of fertilizer and food will 458
therefore likely affect plant and animal species compositions on local and regional scales 459
(Junk and Wantzen, 2004; Worbes, 1997). 460
Additionally, deforestation will have secondary effects, including a reduction in evasion of 461
CO2 from the water (outgassed carbon). Lower terrestrial productivity after deforestation 462
decreases the organic carbon material in the river and thus also the respiration to CO2. This is 463
opposed by the higher respiration rate as a result of increased temperatures due to climate 464
change. These indirect effects of deforestation on riverine carbon dynamics have to be 465
included in future carbon balance estimates of the sink/source behaviour of the Amazon basin, 466
since it directly couples the change in land use to the atmospheric, marine and therefore 467
global carbon fluxes. 468
In contrast to the amount of riverine organic carbon and outgassed carbon the amount of 469
riverine inorganic carbon does not show a significant effect of deforestation. The inorganic 470
carbon in the water is only marginally affected by deforestation because the amount of IC that 471
remains in the water depends on the saturation of the water with of IC, which is calculated 472
depending on the water temperature and the atmospheric CO2 concentration. Climate change-473
induced higher water temperature causes a reduction in solubility of CO2, and higher 474
atmospheric CO2 concentrations lead to an increase in dissolved CO2. The combination of 475
both effects leads to a slight increase in dissolved inorganic carbon in the beginning and a 476
neutral signal towards the end of the century independently of the deforestation. Any changes 477
in the amount of IC can either be attributed to climate change (increasing temperatures and 478
atmospheric CO2 concentration) or – to a much smaller extent – to changes in the water 479
amount in the cell. The latter can be an effect of deforestation as it is known that deforestation 480
alters the discharge (Costa et al., 2003). 481
The deforestation of tropical forests will not only affect processes within the rainforest, but 482
also processes in the adjacent Atlantic Ocean. Currently, the annual export of about 6,300 km3 483
of freshwater is accompanied by 40×1012
g of organic carbon to the Atlantic Ocean 484
(Gaillardet et al., 1997; Moreira-Turcq et al., 2003). The present study shows that 485
deforestation leads to a reduction in the exported organic carbon to the ocean by 486
approximately 40%. In the NatVeg scenario the proportion of exported organic carbon to the 487
ocean makes up about 0.8-0.9% of the net primary production (NPP), whereas in the heavily 488

14
deforested BAU scenario this proportion is reduced to about 0.5-0.6%. The reduction in the 489
ratio of exported carbon to NPP by deforestation indicates a less pronounced future sink, since 490
the organic carbon is directly extracted from the forest and additionally indirectly from the 491
ocean. The Amazon basin is considered a carbon sink (Lewis et al., 2011). In central 492
Amazonia net primary production sums up to about 1×10⁹ g C km
−2 yr
−1 (Malhi et al., 2009). 493
Earlier results showed that climate change alone will increase the amount of outgassed carbon 494
from the Amazon basin by about 40%, while the export to the Atlantic Ocean remains nearly 495
unchanged (Langerwisch et al., 2016). Our results show that additional deforestation will 496
offset the trend in outgassed carbon (only +3%), but will have larger effects on the export to 497
the ocean (−38%). Therefore, future assessments of climate-change and deforestation-induced 498
changes on the carbon balance of the Amazon basin have to include the amount of carbon 499
exported to the ocean and outgassed from the river basin to the atmosphere. 500
The import of organic material to the ocean positively impacts the respiration and production 501
of the Atlantic Ocean off the coast of South America (Körtzinger, 2003; Cooley and Yager, 502
2006; Cooley et al., 2007; Subramaniam et al., 2008). A reduction of the import might 503
therefore reduce the productivity in the coast-near ocean since these costal zones depend on 504
the imported organic matter (Cooley and Yager, 2006; Körtzinger, 2003; Subramaniam et al., 505
2008) and might have further impacts along the trophic cascade including herbivorous and 506
piscivorous fish. Besides the reduced organic carbon, higher amounts of nutrients may be 507
imported to the ocean, because the nutrients are only marginally taken up within the river and 508
by the former intact adjacent forests. The imports of both, less organic carbon and more 509
nutrients, might induce changes in oceanic heterotrophy and primary production. 510
511
4.1 Shortcomings of the approach 512
The strong decrease of organic carbon may be overestimated because of our model 513
assumptions, which include a complete removal of the natural vegetation carbon during 514
deforestation (see e.g. Figure 6). In reality, the complete conversion of the floodplain forests 515
to cropland or pasture is not very likely. In the more severe deforestation scenario (BAU) 516
about 6% of the area is deforested (Soares-Filho et al., 2006). In our scenarios this also 517
includes areas which are temporarily flooded. Since temporarily inundated areas cannot be 518
easily converted to agricultural area or settlements, this might lead to an overestimation of 519
deforested area. But, for example in Manaus, floodplains within a radius of about 500 km 520
around the city have been extensively logged for construction purposes between 1960 and 521
1980 (Goulding et al., 2003). 522
In our study deforestation is simulated by partial or complete removal of vegetation carbon. 523
This also reduces the litter and soil carbon through respiration over time, since these carbon 524
pools are reduced in size since less dead organic material generated by the crops and managed 525
land remains on site, other is harvested. Therefore, our estimates represent more drastic 526
changes in riverine carbon dynamics. The sharp decrease in POC and outgassed carbon after 527
2050, as it is one result of our study, is caused by the implementation of carbon removal in the 528
model. During inundation the cells are partly or completely covered with water, which leads 529

15
to the export of organic material. After the gradual decrease of forest cover (and therewith 530
input of organic material) before 2050, there is a depletion of the remaining organic material 531
in the following years. By a more gradual implementation of inundation in the model this 532
harsh decrease would be softened. 533
In this study the mobilization of terrigenous organic material is exclusively controlled by 534
inundation. A model that also considers the impact of precipitation, vegetation cover and 535
slope on erosion would likely lead to an increase in erosion and thus to the import of organic 536
matter to the river (McClain and Elsenbeer, 2001) in the first years after deforestation. 537
However, this additional influx of carbon would only be temporal, since the soil and litter 538
carbon pools would be eroded after some years (McClain and Elsenbeer, 2001). Thus, we 539
assume that for the investigation of the long-term dynamics of carbon pools and fluxes, such 540
erosion effects are only of minor importance. 541
542
5 Conclusion 543
Deforestation decreases terrestrial biomass and contributes to a further increase in CO2 544
emissions, which reduces the terrestrial carbon sequestration potential (Houghton et al., 2000; 545
Potter et al., 2009). Moreover, our results show that deforestation will lead to a significant 546
decrease of exported terrigenous organic carbon, leading to a reduction of the amount of 547
riverine organic carbon. The climate change effects additionally increase in the amount of 548
riverine inorganic carbon. Deforestation further decreases the amount of riverine organic 549
carbon leading to a combined decrease by about 20% compared to 10% under climate change 550
alone (Langerwisch et al. 2015). While climate change alone leaves the export to the Atlantic 551
Ocean with +1% nearly unchanged (Langerwisch et al. 2015), considering deforestation will 552
now decrease the export of organic carbon to the ocean by about 40%. In contrast climate 553
change will strongly increase the outgassed carbon by about 40% (Langerwisch et al. 2015), 554
but including deforestation will reduces this increase to only +3%. 555
These changes in the hydrological regimes and the fluvial carbon pools might add to the 556
pressures that are being imposed on the Amazon ecosystems (Asner et al., 2006; Asner and 557
Alencar, 2010), with strong consequences for ecosystem stability (Brown and Lugo, 1990; 558
Foley et al., 2002; von Randow et al., 2004). For instance, fish play a key role in seed 559
dispersal along the Amazon. If floodplains turn into less productive grounds for juvenile fish, 560
these changes might have considerable effects on local vegetation recruitment dynamics and 561
regional plant biodiversity (Horn et al., 2011). We therefore strongly advocate the combined 562
terrestrial and fluvial perspective of our approach, and its ability to address both climate and 563
land use change. 564
565
Acknowledgements. We thank “Pakt für Forschung der Leibniz-Gemeinschaft” for funding the 566
TRACES project for FL. AR was funded by FP7 AMAZALERT (Project ID 282664) and 567
Helmholtz Alliance ‘Remote Sensing and Earth System Dynamics’. We also thank Susanne 568
16
Rolinski and Dieter Gerten for discussing the hydrological aspects. We thank Alice Boit for 569
fruitful comments on the manuscript. Additionally we thank our LPJmL and ECOSTAB 570
colleagues at PIK for helpful comments on the design of the study and the manuscript. We 571
also thank the anonymous reviewers and the handling editor whose comments and 572
suggestions greatly improved the manuscript. 573
Author contributions. Model development: FL, BT, WC. Data analysis: FL, AR, KT. Drafting 574
the article: FL, AW, BT, AR, KT. 575
576
6 References 577
Aguiar, A. P. D., Vieira, I. C. G., Assis, T. O., Dalla-Nora, E. L., Toledo, P. M., Oliveira 578
Santos-Junior, R. A., Batistella, M., Coelho, A. S., Savaget, E. K., Aragão, L. E. O. C., Nobre, 579
C. A. and Ometto, J. P. H.: Land use change emission scenarios: anticipating a forest 580
transition process in the Brazilian Amazon, Global Change Biology, 22(5), 1821–1840, 581
doi:10.1111/gcb.13134, 2016. 582
Anderson, J. T., Nuttle, T., Saldaña Rojas, J. S., Pendergast, T. H. and Flecker, A. S.: 583
Extremely long-distance seed dispersal by an overfished Amazonian frugivore, Proceedings 584
of the Royal Society B: Biological Sciences, 278, 3329–3335, doi:10.1098/rspb.2011.0155, 585
2011. 586
Asner, G. P. and Alencar, A.: Drought impacts on the Amazon forest: the remote sensing 587
perspective, New Phytologist, 187(3), 569–578, doi:10.1111/j.1469-8137.2010.03310.x, 588
2010. 589
Asner, G. P., Broadbent, E. N., Oliveira, P. J. C., Keller, M., Knapp, D. E. and Silva, J. N. M.: 590
Condition and fate of logged forests in the Brazilian Amazon, Proceedings of the National 591
Academy of Sciences, 103(34), 12947–12950, 2006. 592
Bauer, D. F.: Constructing confidence sets using rank statistics, Journal of the American 593
Statistical Association, 67(339), 687–690, 1972. 594
Bernardes, M. C., Martinelli, L. A., Krusche, A. V., Gudeman, J., Moreira, M., Victoria, R. 595
L., Ometto, J. P. H. B., Ballester, M. V. R., Aufdenkampe, A. K., Richey, J. E. and Hedges, J. 596
I.: Riverine organic matter composition as a function of land use changes, Southwest 597
Amazon, Ecological Applications, 14(4), S263–S279, doi:10.1890/01-6028, 2004. 598
Biemans, H., Hutjes, R. W. A., Kabat, P., Strengers, B. J., Gerten, D. and Rost, S.: Effects of 599
precipitation uncertainty on discharge calculations for main river basins, Journal of 600
Hydrometeorology, 10(4), 1011–1025, doi:10.1175/2008jhm1067.1, 2009. 601
Bondeau, A., Smith, P. C., Zaehle, S., Schaphoff, S., Lucht, W., Cramer, W., Gerten, D., 602
Lotze-Campen, H., Müller, C., Reichstein, M. and Smith, B.: Modelling the role of agriculture 603
for the 20th century global terrestrial carbon balance, Global Change Biology, 13(3), 679–604
706, doi:10.1111/j.1365-2486.2006.01305.x, 2007. 605
Brown, S. and Lugo, A. E.: Tropical secondary forests, Journal of Tropical Ecology, 6(1), 1–606
32, 1990. 607
17
Collatz, G. J., Ribas-Carbo, M. and Berry, J. A.: Coupled photosynthesis-stomatal 608
conductance model for leaves of C4 plants, Functional Plant Biology, 19(5), 519–538, 609
doi:10.1071/PP9920519, 1992. 610
Cooley, S. R. and Yager, P. L.: Physical and biological contributions to the western tropical 611
North Atlantic Ocean carbon sink formed by the Amazon River plume, Journal of 612
Geophysical Research-Oceans, 111(C08018), doi:10.1029/2005JC002954, 2006. 613
Cooley, S. R., Coles, V. J., Subramaniam, A. and Yager, P. L.: Seasonal variations in the 614
Amazon plume-related atmospheric carbon sink, Global Biogeochemical Cycles, 21(3), 615
doi:10.1029/2006GB002831, 2007. 616
Costa, M. H., Botta, A. and Cardille, J. A.: Effects of large-scale changes in land cover on the 617
discharge of the Tocantins River, Southeastern Amazonia, Journal of Hydrology, 283(1–4), 618
206–217, doi:10.1016/S0022-1694(03)00267-1, 2003. 619
Costa, M. H., Yanagi, S. N. M., Souza, P., Ribeiro, A. and Rocha, E. J. P.: Climate change in 620
Amazonia caused by soybean cropland expansion, as compared to caused by pastureland 621
expansion, Geophysical Research Letters, 34(7), doi:10.1029/2007GL029271, 2007. 622
Cramer, W., Bondeau, A., Woodward, F. I., Prentice, I. C., Betts, R. A., Brovkin, V., Cox, P. 623
M., Fisher, V., Foley, J. A., Friend, A. D., Kucharik, C., Lomas, M. R., Ramankutty, N., 624
Sitch, S., Smith, B., White, A. and Young-Molling, C.: Global response of terrestrial 625
ecosystem structure and function to CO2 and climate change: results from six dynamic global 626
vegetation models, Global Change Biology, 7(4), 357–373, 2001. 627
Eva, H. D., Belward, A. S., De Miranda, E. E., Di Bella, C. M., Gond, V., Huber, O., Jones, 628
S., Sgrenzaroli, M. and Fritz, S.: A land cover map of South America, Global Change 629
Biology, 10(5), 731–744, 2004. 630
Fader, M., Rost, S., Müller, C., Bondeau, A. and Gerten, D.: Virtual water content of 631
temperate cereals and maize: Present and potential future patterns, Journal of Hydrology, 632
384(3–4), 218–231, doi:10.1016/j.jhydrol.2009.12.011, 2010. 633
Farquhar, G. D., van Caemmerer, S. and Berry, J. A.: A biochemical model of photosynthet ic 634
CO2 assimilation in leaves of C3 species, Planta, 149, 78–90, 1980. 635
Fearnside, P. M.: Environment: Deforestation soars in the Amazon, Nature, 521(7553), 423–636
423, doi:10.1038/521423b, 2015. 637
Foley, J. A., Botta, A., Coe, M. T. and Costa, M. H.: El Niño-Southern Oscillation and the 638
climate, ecosystems and rivers of Amazonia, Global Biogeochemical Cycles, 16(4), 79/1-639
79/17, doi:10.1029/2002GB001872, 2002. 640
Foley, J. A., Asner, G. P., Costa, M. H., Coe, M. T., DeFries, R., Gibbs, H. K., Howard, E. A., 641
Olson, S., Patz, J., Ramankutty, N. and Snyder, P.: Amazonia revealed: forest degradation and 642
loss of ecosystem goods and services in the Amazon Basin, Frontiers in Ecology and the 643
Environment, 5(1), 25–32, doi:10.1890/1540-9295(2007)5[25:ARFDAL]2.0.CO;2, 2007. 644
Gaillardet, J., Dupré, B., Allègre, C. J. and Négrel, P.: Chemical and physical denudation in 645
the Amazon River basin, Chemical Geology, 142(3–4), 141–173, 1997. 646

18
Gerten, D., Schaphoff, S., Haberlandt, U., Lucht, W. and Sitch, S.: Terrestrial vegetation and 647
water balance - hydrological evaluation of a dynamic global vegetation model, Journal of 648
Hydrology, 286(1–4), 249–270, doi:10.1016/j.jhydrol.2003.09.029, 2004. 649
Gerten, D., Rost, S., von Bloh, W. and Lucht, W.: Causes of change in 20th century global 650
river discharge, Geophysical Research Letters, 35(20), doi:L20405 10.1029/2008gl035258, 651
2008. 652
Godar, J., Gardner, T. A., Tizado, E. J. and Pacheco, P.: Actor-specific contributions to the 653
deforestation slowdown in the Brazilian Amazon, Proceedings of the National Academy of 654
Sciences, 111(43), 15591–15596, doi:10.1073/pnas.1322825111, 2014. 655
Gordon, W. S., Famiglietti, J. S., Fowler, N. L., Kittel, T. G. F. and Hibbard, K. A.: 656
Validation of simulated runoff from six terrestrial ecosystem models: results from VEMAP, 657
Ecological Applications, 14(2), 527–545, doi:10.1890/02-5287, 2004. 658
Goulding, M., Barthem, R. and Ferreira, E.: The Smithsonian Atlas of the Amazon, 659
Smithsonian, Washington and London., 2003. 660
Hamilton, S. K.: Biogeochemical implications of climate change for tropical rivers and 661
floodplains, Hydrobiologia, 657(1), 19–35, doi:10.1007/s10750-009-0086-1, 2010. 662
Hedges, J. I., Mayorga, E., Tsamakis, E., McClain, M. E., Aufdenkampe, A., Quay, P., 663
Richey, J. E., Benner, R., Opsahl, S., Black, B., Pimentel, T., Quintanilla, J. and Maurice, L.: 664
Organic matter in Bolivian tributaries of the Amazon River: A comparison to the lower 665
mainstream, Limnology and Oceanography, 45(7), 1449–1466, 2000. 666
Hoorn, C., Wesselingh, F. P., ter Steege, H., Bermudez, M. A., Mora, A., Sevink, J., 667
Sanmartin, I., Sanchez-Meseguer, A., Anderson, C. L., Figueiredo, J. P., Jaramillo, C., Riff, 668
D., Negri, F. R., Hooghiemstra, H., Lundberg, J., Stadler, T., Sarkinen, T. and Antonelli, A.: 669
Amazonia through time: Andean uplift, climate change, landscape evolution, and biodiversity, 670
Science, 330(6006), 927–931, doi:10.1126/science.1194585, 2010. 671
Horn, M. H., Correa, S. B., Parolin, P., Pollux, B. J. A., Anderson, J. T., Lucas, C., Widmann, 672
P., Tjiu, A., Galetti, M. and Goulding, M.: Seed dispersal by fishes in tropical and temperate 673
fresh waters: The growing evidence, Acta Oecologica, 37, 561–577, 674
doi:10.1016/j.actao.2011.06.004, 2011. 675
Houghton, R. A., Skole, D. L., Nobre, C. A., Hackler, J. L., Lawrence, K. T. and 676
Chomentowski, W. H.: Annual fluxes or carbon from deforestation and regrowth in the 677
Brazilian Amazon, Nature, 403(6767), 301–304, 2000. 678
INPE: Projeto PRODES: Monitoramento da floresta Amazônica Brasileira por satélite. 679
[online] Available from: http://www.obt.inpe.br/prodes/index.php (Accessed 28 April 2015), 680
2013. 681
Irmler, U.: Litterfall and nitrogen turnover in an Amazonian blackwater inundation forest, 682
Plant and Soil, 67(1–3), 355–358, 1982. 683
Johnson, M. S., Lehmann, J., Selva, E. C., Abdo, M., Riha, S. and Couto, E. G.: Organic 684
carbon fluxes within and streamwater exports from headwater catchments in the southern 685
Amazon, Hydrological Processes, 20(12), 2599–2614, 2006. 686

19
Junk, W. J.: The central Amazon floodplain - Ecology of a pulsing system, Springer., 1997. 687
Junk, W. J. and Wantzen, K. M.: The flood pulse concept: New aspects, approaches and 688
applications - An update, in Proceedings of the Second International Symposium on the 689
Management of large Rivers for Fisheries, edited by R. L. Welcomme and T. Petr, pp. 117–690
140., 2004. 691
Jupp, T. E., Cox, P. M., Rammig, A., Thonicke, K., Lucht, W. and Cramer, W.: Development 692
of probability density functions for future South American rainfall, New Phytologist, 187, 693
682–693, doi:10.1111/j.1469-8137.2010.03368.x, 2010. 694
Keller, M., Bustamante, M., Gash, J. and Silva Dias, P., Eds.: Amazonia and global change, 695
American Geophysical Union, Washington, DC., 2009. 696
Körtzinger, A.: A significant CO2 sink in the tropical Atlantic Ocean associated with the 697
Amazon River plume, Geophysical Research Letters, 30(24), doi:10.1029/2003GL018841, 698
2003. 699
Langerwisch, F., Rost, S., Gerten, D., Poulter, B., Rammig, A. and Cramer, W.: Potential 700
effects of climate change on inundation patterns in the Amazon Basin, Hydrology and Earth 701
System Sciences, 17(6), 2247–2262, doi:10.5194/hess-17-2247-2013, 2013. 702
Langerwisch, F., Walz, A., Rammig, A., Tietjen, B., Thonicke, K. and Cramer, W.: Climate 703
change increases riverine carbon outgassing while export to the ocean remains uncertain, 704
Earth System Dynamics Discussions, 6(2), 1445–1497, doi:10.5194/esdd-6-1445-2015, 2015. 705
Langerwisch, F., Walz, A., Rammig, A., Tietjen, B., Thonicke, K. and Cramer, W.: Climate 706
change increases riverine carbon outgassing, while export to the ocean remains uncertain, 707
Earth System Dynamics, 7(3), 559–582, doi:10.5194/esd-7-559-2016, 2016. 708
Lawrence, D. and Vandecar, K.: Effects of tropical deforestation on climate and agriculture, 709
Nature Climate Change, 5(1), 27–36, doi:10.1038/nclimate2430, 2014. 710
Lewis, S. L., Brando, P. M., Phillips, O. L., van der Heijden, G. M. . and Nepstad, D.: The 711
2010 amazon drought, Science, 331(6017), 554, doi:10.1126/science.1200807, 2011. 712
Malhi, Y., Wood, D., Baker, T. R., Wright, J., Phillips, O. L., Cochrane, T., Meir, P., Chave, 713
J., Almeida, S., Arroyo, L., Higuchi, N., Killeen, T. J., Laurance, S. G., Laurance, W. F., 714
Lewis, S. L., Monteagudo, A., Neill, D. A., Vargas, P. N., Pitman, N. C. A., Quesada, C. A., 715
Salomão, R., Silva, J. N. M., Lezama, A. T., Terborgh, J., Martínez, R. V. and Vinceti, B.: 716
The regional variation of aboveground live biomass in old-growth Amazonian forests, Global 717
Change Biology, 12(7), 1107–1138, 2006. 718
Malhi, Y., Roberts, J. T., Betts, R. A., Killeen, T. J., Li, W. and Nobre, C. A.: Climate change, 719
deforestation, and the fate of the Amazon, Science, 319(5860), 169–172, 2008. 720
Malhi, Y., Saatchi, S., Girardin, C. and Aragão, L. E. O. C.: The production, storage, and flow 721
of carbon in Amazonian forests, in Amazonia and Global Change, pp. 355–372, American 722
Geophysical Union, Washington, DC., 2009. 723
Mayorga, E., Aufdenkampe, A. K., Masiello, C. A., Krusche, A. V., Hedges, J. I., Quay, P. 724
D., Richey, J. E. and Brown, T. A.: Young organic matter as a source of carbon dioxide 725

20
outgassing from Amazonian rivers, Nature, 436(7050), 538–541, doi:10.1038/nature03880, 726
2005. 727
McClain, M. E. and Elsenbeer, H.: Terrestrial inputs to Amazon streams and internal 728
biogeochemical processing, in The Biogeochemistry of the Amazon Basin, edited by M. E. 729
McClain, R. L. Victoria, and J. E. Richey, pp. 185–208, Oxford University Press, New York., 730
2001. 731
Melack, J. M. and Forsberg, B.: Biogeochemistry of Amazon floodplain lakes and associated 732
wetlands, in The Biogeochemistry of the Amazon Basin and its Role in a Changing World, 733
pp. 235–276, Oxford University Press, Eds. McClain, M. E.; Victoria, R. L.; Richey, J. E., 734
2001. 735
Moreira-Turcq, P., Seyler, P., Guyot, J. L. and Etcheber, H.: Exportation of organic carbon 736
from the Amazon River and its main tributaries, Hydrological Processes, 17(7), 1329–1344, 737
doi:10.1002/hyp.1287, 2003. 738
Nakićenović, N., Davidson, O., Davis, G., Grübler, A., Kram, T., Lebre La Rovere, E., Metz, 739
B., Morita, T., Pepper, W., Pitcher, H., Sankovski, A., Shukla, P., Swart, R. and Dadi, Z.: 740
IPCC Special report on emission scenarios, [online] Available from: 741
http://www.ipcc.ch/ipccreports/sres/emission/index.php?idp=0, 2000. 742
Nepstad, D., McGrath, D., Stickler, C., Alencar, A., Azevedo, A., Swette, B., Bezerra, T., 743
DiGiano, M., Shimada, J., Seroa da Motta, R., Armijo, E., Castello, L., Brando, P., Hansen, 744
M. C., McGrath-Horn, M., Carvalho, O. and Hess, L.: Slowing Amazon deforestation through 745
public policy and interventions in beef and soy supply chains, Science, 344(6188), 1118–746
1123, doi:10.1126/science.1248525, 2014. 747
Nobre, A. D.: The Future Climate of Amazonia: Scientific Assessment Report, INPA and 748
ARA, São José dos Campos, Brazil. [online] Available from: http://www.ccst.inpe.br/wp-749
content/uploads/2014/11/ The_Future_Climate_of_Amazonia_Report.pdf (Accessed 31 750
August 2015), 2014. 751
Poorter, L., Bongers, F., Aide, T. M., Almeyda Zambrano, A. M., Balvanera, P., Becknell, J. 752
M., Boukili, V., Brancalion, P. H. S., Broadbent, E. N., Chazdon, R. L., Craven, D., de 753
Almeida-Cortez, J. S., Cabral, G. A. L., de Jong, B. H. J., Denslow, J. S., Dent, D. H., 754
DeWalt, S. J., Dupuy, J. M., Durán, S. M., Espírito-Santo, M. M., Fandino, M. C., César, R. 755
G., Hall, J. S., Hernandez-Stefanoni, J. L., Jakovac, C. C., Junqueira, A. B., Kennard, D., 756
Letcher, S. G., Licona, J.-C., Lohbeck, M., Marín-Spiotta, E., Martínez-Ramos, M., Massoca, 757
P., Meave, J. A., Mesquita, R., Mora, F., Muñoz, R., Muscarella, R., Nunes, Y. R. F., Ochoa-758
Gaona, S., de Oliveira, A. A., Orihuela-Belmonte, E., Peña-Claros, M., Pérez-García, E. A., 759
Piotto, D., Powers, J. S., Rodríguez-Velázquez, J., Romero-Pérez, I. E., Ruíz, J., Saldarriaga, 760
J. G., Sanchez-Azofeifa, A., Schwartz, N. B., Steininger, M. K., Swenson, N. G., Toledo, M., 761
Uriarte, M., van Breugel, M., van der Wal, H., Veloso, M. D. M., Vester, H. F. M., Vicentini, 762
A., Vieira, I. C. G., Bentos, T. V., Williamson, G. B. and Rozendaal, D. M. A.: Biomass 763
resilience of Neotropical secondary forests, Nature, 530(7589), 211–214, 764
doi:10.1038/nature16512, 2016. 765
Potter, C., Klooster, S. and Genovese, V.: Carbon emissions from deforestation in the 766
Brazilian Amazon Region, Biogeosciences, 6(11), 2369–2381, 2009. 767

21
Randall, D. A., Wood, R. A., Bony, S., Colman, R., Fichefet, T., Fyfe, J., Kattsov, V., Pitman, 768
A., Shukla, J., Srinivasan, J., Stouffer, R. J., Sumi, A. and Taylor, K. E.: Climate models and 769
their evaluation, in Climate Change 2007: The Physical Science Basis. Contribution of 770
Working Group I to the Fourth Assessment Report of the Intergovernmental Panel on Climate 771
Change, edited by S. Solomon, D. Qin, M. Manning, Z. Chen, M. Marquis, K. B. Averyt, M. 772
Tignor, and H. L. Miller, Cambridge University Press., 2007. 773
von Randow, C., Manzi, A. O., Kruijt, B., de Oliveira, P. J., Zanchi, F. B., Silva, R. L., 774
Hodnett, M. G., Gash, J. H. C., Elbers, J. A., Waterloo, M. J., Cardoso, F. L. and Kabat, P.: 775
Comparative measurements and seasonal variations in energy and carbon exchange over 776
forest and pasture in South West Amazonia, Theoretical and Applied Climatology, 78(1–3), 777
5–26, doi:10.1007/s00704-004-0041-z, 2004. 778
Richey, J. E., Melack, J. M., Aufdenkampe, A. K., Ballester, V. M. and Hess, L. L.: 779
Outgassing from Amazonian rivers and wetlands as a large tropical source of atmospheric 780
CO2, Nature, 416(6881), 617–620, doi:10.1038/416617a, 2002. 781
Rost, S., Gerten, D., Bondeau, A., Lucht, W., Rohwer, J. and Schaphoff, S.: Agricultural 782
green and blue water consumption and its influence on the global water system, Water 783
Resources Research, 44(9), doi:W09405 10.1029/2007wr006331, 2008. 784
Sitch, S., Smith, B., Prentice, I. C., Arneth, A., Bondeau, A., Cramer, W., Kaplan, J. O., 785
Levis, S., Lucht, W., Sykes, M. T., Thonicke, K. and Venevsky, S.: Evaluation of ecosystem 786
dynamics, plant geography and terrestrial carbon cycling in the LPJ dynamic global 787
vegetation model, Global Change Biology, 9(2), 161–185, doi:10.1046/j.1365-788
2486.2003.00569.x, 2003. 789
Soares-Filho, B. S., Nepstad, D. C., Curran, L. M., Cerqueira, G. C., Garcia, R. A., Ramos, C. 790
A., Voll, E., McDonald, A., Lefebvre, P. and Schlesinger, P.: Modelling conservation in the 791
Amazon basin, Nature, 440(7083), 520–523, 2006. 792
Spracklen, D. V., Arnold, S. R. and Taylor, C. M.: Observations of increased tropical rainfall 793
preceded by air passage over forests, Nature, 489(7415), 282–285, doi:10.1038/nature11390, 794
2012. 795
Subramaniam, A., Yager, P. L., Carpenter, E. J., Mahaffey, C., Bjorkman, K., Cooley, S., 796
Kustka, A. B., Montoya, J. P., Sanudo-Wilhelmy, S. A., Shipe, R. and Capone, D. G.: 797
Amazon River enhances diazotrophy and carbon sequestration in the tropical North Atlantic 798
Ocean, Proceedings of the National Academy of Sciences, 105(30), 10460–10465, 799
doi:10.1073/pnas.0710279105, 2008. 800
Thonicke, K., Spessa, A., Prentice, I. C., Harrison, S. P., Dong, L. and Carmona-Moreno, C.: 801
The influence of vegetation, fire spread and fire behaviour on biomass burning and trace gas 802
emissions: results from a process-based model, Biogeosciences, 7(6), 1991–2011, 803
doi:10.5194/bg-7-1991-2010, 2010. 804
Wagner, W., Scipal, K., Pathe, C., Gerten, D., Lucht, W. and Rudolf, B.: Evaluation of the 805
agreement between the first global remotely sensed soil moisture data with model and 806
precipitation data, Journal of Geophysical Research, 108(4611), doi:10.1029/2003JD003663, 807
2003. 808
Waterloo, M. J., Oliveira, S. M., Drucker, D. P., Nobre, A. D., Cuartas, L. A., Hodnett, M. G., 809
Langedijk, I., Jans, W. W. P., Tomasella, J., de Araújo, A. C., Pimentel, T. P. and Estrada, J. 810

22
C. M.: Export of organic carbon in run-off from an Amazonian rainforest blackwater 811
catchment, Hydrological Processes, 20(12), 2581–2597, 2006. 812
Worbes, M.: The forest ecosystem of the floodplains, in The Central Amazon Floodplain, 813
edited by W. J. Junk, pp. 223–265, Springer, Berlin, Germany., 1997. 814
Yang, D., Kanae, S., Oki, T., Koike, T. and Musiake, K.: Global potential soil erosion with 815
reference to land use and climate changes, Hydrological Processes, 17(14), 2913–2928, 816
doi:10.1002/hyp.1441, 2003. 817
818
819

23
820
7 Tables 821
Table 1: Location and characteristics of the three sub-regions. 822
North-West corner
South-East corner
area [10
3km
2]
changes in inundation
length*
changes inundated
area*
land use intensity
R1 0.5°S / 78.5°W 7.0°S / 72°W 523.03 1 month longer larger low
R2 1.0°S / 70.0°W 5.0°S / 52°W 891.32 ±½ month shift heterogeneous medium
R3 4.5°S / 58.0°W 11.0°S / 52°W 523.03 ½ month shorter
smaller high
Regions are depicted in Figure 2. * Changes in inundation compared to the average of 1961-823
1990, as estimated and discussed in Langerwisch et al. (2013) 824
825

24
826
Table 2: Basin-wide (B) and region wise (R1-R3) amount of carbon in POC and DOC, 827
outgassed carbon and IC [1012
g month–1
] averaged over 30 years and five climate 828
models. 829
NatVegref NatVegfut GOVfutA1B BAUfutA1B GOVfutA2 BAUfutA2 GOVfutB1 BAUfutB1
POC
B 1.64±0.06
1.76±0.51 1.52±0.43 1.28±0.35 1.63±0.41 1.39±0.34 1.55±0.31
1.30±0.24
R1 0.16±0.01 0.22±0.05 0.20±0.05 0.20±0.05 0.21±0.05 0.21±0.05 0.18±0.02 0.18±0.02
R2 0.42±0.01 0.43± 0.15 0.37±0.12 0.30±0.09 0.40±0.13 0.33±0.10 0.38±0.09 0.31±0.07
R3 0.15±0.01 0.14±0.05 0.11±0.04 0.07±0.03 0.12±0.04 0.08±0.02 0.12±0.03 0.08±0.02
DOC
B 3.41±0.13 3.58±1.05 3.07±0.87 2.59±0.71 3.29±0.84 2.77±0.69 3.15±0.63 2.64±0.48
R1 0.34±0.02 0.46±0.11 0.43±0.10 0.42±0.10 0.45±0.10 0.44±0.10 0.39±0.05 0.38±0.05
R2 0.93±0.03 0.91±0.32 0.77±0.26 0.64±0.20 0.84±0.27 0.69±0.21 0.81±0.20 0.66±0.15
R3 0.34±0.02 0.30±0.11 0.24±0.09 0.16±0.06 0.26±0.08 0.17±0.05 0.27±0.07 0.17±0.04
outgassed carbon
B 11.82±0.41 16.63±4.14 14.30±3.44 12.05±2.76 15.75±3.43 13.24±2.80 13.37±2.20 11.15±1.68
R1 1.15±0.06 2.05±0.38 1.93±0.35 1.91±0.35 2.10±0.35 2.08±0.35 1.61±0.13 1.60±0.14
R2 2.52±0.08 3.36±0.99 2.81±0.78 2.37±0.6 3.09±0.85 2.59±0.66 2.66±0.56 2.22±0.43
R3 0.99±0.04 1.12±0.42 0.91±0.34 0.55±0.20 1.03±0.32 0.62±0.18 0.94±0.26 0.56±0.14
IC
B 0.227±0.003 0.457±0.119 0.457±0.120 0.456±0.121 0.523±0.137 0.522±0.138 0.365±0.063 0.364±0.064
R1 0.005±0.001 0.016±0.003 0.013±0.003 0.013±0.003 0.015±0.004 0.015±0.004 0.009±0.001 0.009±0.001
R2 0.153±0.002 0.308±0.081 0.308±0.082 0.307±0.083 0.351±0.094 0.350±0.096 0.245±0.044 0.244±0.044
R3 0.006±0.000
1
0.011±0.003
0.011±0.003 0.011±0.003 0.013±0.003 0.013±0.003 0.009±0.001 0.009±0.001
‘ref’ refers to mean amounts during reference period 1971-2000. ‘fut’ refers to mean amounts 830
during future period 2070-2099. Values given are the mean ± standard deviation of the five 831
climate models. 832
833

25
834
Table 3: Proportion [%] of area dominated by climate or land use change impacts. 835
significantly changed
fraction
climate change
dominated1
land use change
dominated1
balanced1
A1B A2 B1 A1B A2 B1 A1B A2 B1 A1B A2 B1
POC
GOV 50.85 50.91 50.86 58.8 58.7 54.9 40.9 40.7 44.6 0.3 0.6 0.5
BAU 50.80 50.85 50.85 42.3 43.7 40.1 57.5 56.2 59.8 0.2 0.1 0.1
IC
GOV 50.80 50.80 50.80 100.0 100.0 100.0 0.0 0.0 0.0 0.0 0.0 0.0
BAU 50.80 50.80 50.80 100.0 100.0 100.0 0.0 0.0 0.0 0.0 0.0 0.0
outgassed carbon
GOV 97.6 97.60 97.61 70.5 77.7 68.4 29.3 22.3 31.1 0.2 0.0 0.4
BAU 97.55 97.65 97.60 52.4 56.9 50.2 47.6 43.0 49.7 0.1 0.1 0.1
If both impacts compensate each other the cell is balanced. 1The proportions refer to the 836
significantly changed overall fraction (first columns). 837

26
8 Figures 838
A B
839
Figure 1: Overview of the general transfer of data between scenarios and models (A) 840
and the detailed calculation of carbon fluxes within and between LPJmL and RivCM. 841 842

27
843
A
B
Figure 2: Fraction of deforested area per cell [%] in 2050. Data are based on Soares-Filho 844
et al. (2006). Panel A refers to the BAU deforestation scenario, whereas panel B refers to the 845
GOV scenario. The three sub-regions discussed in the main text are highlighted in the map. 846
The timelines (right panels) show the development until 2050 for each sub-region 847
(deforestation kept constant after 2050). 848

28
849
Figure 3: Change in carbon caused by deforestation. Climate model mean (EDefor) of the 850
change of particulate organic carbon POC (A, B), outgassed carbon (C, D) and inorganic 851
carbon IC (E, F). Results of the SRES emission scenario A1B are averaged over five climate 852
models. Areas in yellow and red indicate a gain and areas in green and blue indicate a loss in 853
carbon caused by deforestation (GOV and BAU). White areas within the Amazon basin 854
represent cells where changes are not significant (p-value >0.05). 855

29
856
857
Figure 4: Averaged annual amounts and change in the basin carbon budget due to 858
climate change and deforestation. Dark boxes indicate the amount of carbon during the 859
reference period (1971-2000), intermediate boxes during the future period (2070-2099) under 860
climate change only (Langerwisch et al., 2015), light boxes during the future period under the 861
forcing of climate change and deforestation (BAU) together (average over all SRES scenarios 862
and GCMs). Amount is given for future period with relative change compared to reference. 863
Arrows indicate the direction of carbon transfer. 864
865
866

30
867
Figure 5: Change in carbon caused by deforestation and climate change. Climate model 868
mean (ECCDefor) of the change of particulate organic carbon POC (A, B), outgassed carbon (C, 869
D) and inorganic carbon IC (E, F). The inset maps show blue areas where changes are 870
predominantly caused by climate change (DCC) and red areas where changes are 871
predominantly caused by deforestation (DDefor). For further details see Figure 3. White areas 872
within the Amazon basin represent cells where changes are not significant (p-value >0.05). 873
874
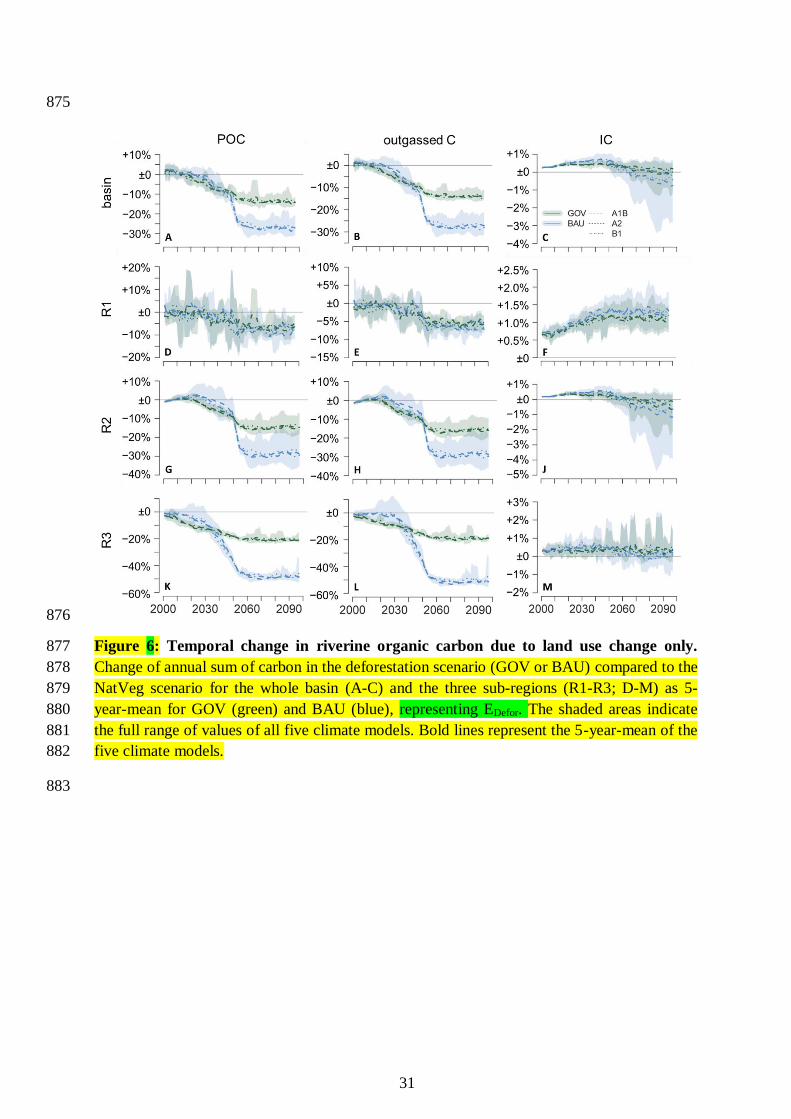
31
875
876
Figure 6: Temporal change in riverine organic carbon due to land use change only. 877
Change of annual sum of carbon in the deforestation scenario (GOV or BAU) compared to the 878
NatVeg scenario for the whole basin (A-C) and the three sub-regions (R1-R3; D-M) as 5-879
year-mean for GOV (green) and BAU (blue), representing EDefor. The shaded areas indicate 880
the full range of values of all five climate models. Bold lines represent the 5-year-mean of the 881
five climate models. 882
883

32
884
Figure S1: Similar change in dissolved (A, B) and particulate organic carbon (C, D) due 885
to deforestation. SRES scenario is A1B, climate model is MPI-ECHAM5. Positive values 886
(yellow and red) indicate a gain and negative values (green and blue) indicate a loss in carbon 887
caused by deforestation (GOV and BAU). Only cells with significant changes (p<0.05, 888
Wilcoxon Rank Sum Test) are shown. 889
890

33
891
Figure S2: Temporal change in riverine organic carbon due to the combination of 892
climate and land use change. Change of annual sum of carbon in the deforestation scenario 893
(GOV or BAU) compared to the NatVeg scenario (average over 1971-2000) for the whole 894
basin (A-C) and the three sub-regions (R1-R3; D-M) as 5-year-mean for GOV (green) and 895
BAU (blue), representing ECCDefor. The shaded areas indicate the full range of values of all 896
five climate models. Bold lines represent the 5-year-mean of the five climate models. 897
898
899