Embed Size (px)
Citation preview
Deforestation and climate change
CONTENTS
Deforestation in protected areas 4
Methodology 5
Assessment results 8
ARPA’s effect 11
Influence from management objective and use 14
Influence of the scope of administration 15
Deforestation Arch 16
Peaks 18
PAs having atypical deforestation 20
Deforestation decrease 20
Recommendations 21
Annex 1 23
Histograms: deforestation X analysis criteria 23
Annex 2 34
List of all PAs analized 34
References 42
Protected areas and climate change 43
ARPA introduced new ranking 46
Monitoring, patrol and insurance 47
Further studies and guidelines 48
PAs prevent illegal and predatory actions 50
Brazil’s differentials 51
Crucial role 52
REDD+ 60
Scenarios for 2050 62
The cost-benefit balance 63
Green barrier 64
References and notes 65
Federative Republic of Brazil
PresidentDilma Rousseff
Vice-PresidentMichel Temer
Federal Ministry of the Environment
MinisterIzabella Teixeira
Executive SecretaryFrancisco Gaetani
Head of Biodiversity and Forests DepartmentRoberto Cavalcanti
Protected Areas DirectorAna Paula Leite Prates
Head of Amazon Region Protected Areas Program (ARPA)Trajano Quinhões
Publication title – 2nd edition: ARPA – Making the difference on Amazon conservation
Publisher:Amazon Region Protected Areas Program (ARPA):Federal Ministry of the EnvironmentICMBioState governments in the Brazilian Amazon: Acre, Amapá,Amazonas, Mato Grosso, Rondônia, Pará and TocantinsWWF-BrazilFUNBIOGerman Cooperation through KfW Development Bank & GTZ Technical Cooperation AgencyWorld Bank GEFAmazonia FundBNDES – Brazilian National Bank for Development
Organized and produced by:WWF-Brazil:
CEOMaria Cecília Wey de Brito
Head of the Amazon Program Mauro Armelin
Communications ManagerAndréa de Lima
Technical ReviewAndré Nahur - Conservation officer, WWF-BrazilCláudio C. Maretti – Conservation Director, WWF-Brazil in 2010Carlos Rittl – Climate Change Program Manager, WWF-BrazilDaniela Leite - Program Management FunbioDaniela Oliveira - PhD in Sustainable Development - CDS / UnBFábio França de Araújo - MMA- SBF-DAP (BrazilianMinistry of the Environment) in 2010Fabio Leite – Program Manager, FUNBIOFrancisco Barbosa Oliveira Jr. – Amazon Protected Areasand ARPA Support Program Officer, WWF-Brazil in 2010Magaly Oliveira – GIS expert, WWF-BrazilMárcia Soares – Communications Officer, FUNBIOMariana Napolitano Ferreira – Conservation officer, WWF-BrazilMario Barroso – GIS expert, WWF-BrazilMarisete Catapan – Protected Areas expert, WWF-BrazilMauro Armelin – Head of the Amazon Program, WWF-BrazilRosiane Pinto - Environmental Analyst - MMA / SBF / DAP / ARPATrajano Quinhões - Project Manager / Coordinator of ARPA - MMA / SBF / DAP / ARPA
Technical analysis and reportChapter on Biodiversity – Mariana Ferreira, Mario Barroso, Paula Valdujo and Gabriel CostaChapter on Management Effectiveness – Mariana Ferreira, MariseteCatapan, Maria Auxiliadora Drummond and Cristina Onaga.Chapter on Deforestation and Climate Change – André Nahur, Mônica TakakoShimabukuro, Regina Vasquez, Mario Barroso, and Cláudio Maretti.Chapter on ARPA’s Financial and Operational Management – Fábio França,Marcos Araújo, Daniela Leite, Rosiane Pinto e Trajano Quinhões
Writing & editingRegina Vasquez & Marcos Gonçalves
English translationRegina Vasquez & Martin Charles Nicholl
Production, final editing and reviewLigia Paes de Barros – Communications officer, WWF-Brazil
Graphic designMárcio Duarte - M10 Design
ImagesWWF-Brazil
AcknowledgementsICMBio, Sedam-RO, Sema-AC, Sema-MT, SDS-AM
* Part of the studies for this publication were done with the support of the Federal Ministry for the Environment, Nature Conservation, and Nuclear Safety (BMU) of the Federal Republic of Germany
4 Deflorestation and climate change
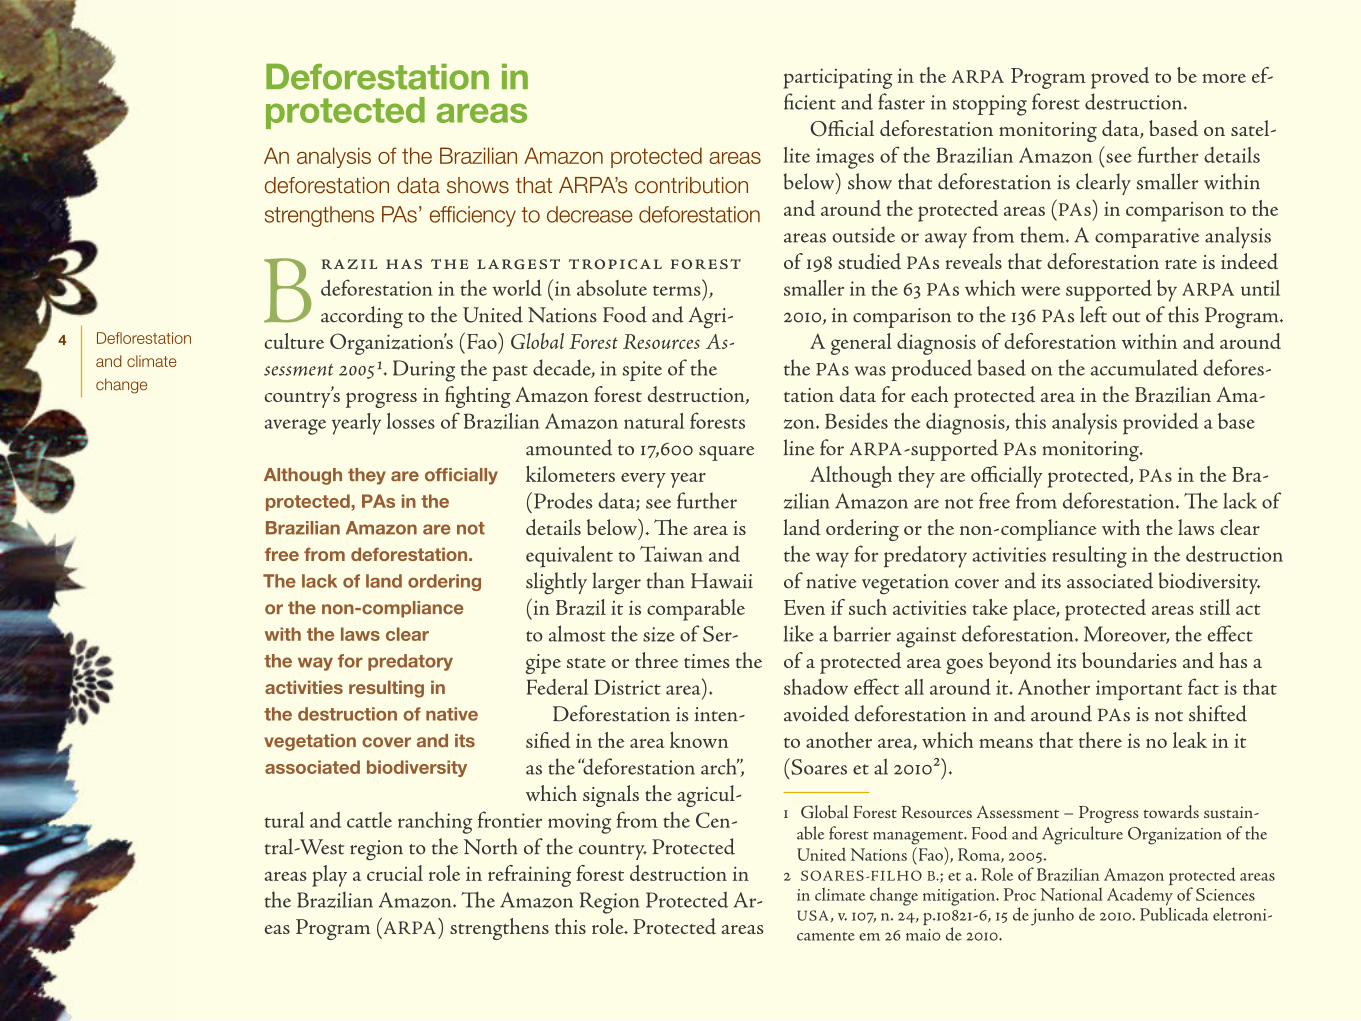
Deforestation in protected areasAn analysis of the Brazilian Amazon protected areas deforestation data shows that ARPA’s contribution strengthens PAs’ efficiency to decrease deforestation
B razil has the largest tropical forest deforestation in the world (in absolute terms), according to the United Nations Food and Agri-
culture Organization’s (Fao) Global Forest Resources As-sessment 20051. During the past decade, in spite of the country’s progress in fighting Amazon forest destruction, average yearly losses of Brazilian Amazon natural forests
amounted to 17,600 square kilometers every year (Prodes data; see further details below). The area is equivalent to Taiwan and slightly larger than Hawaii (in Brazil it is comparable to almost the size of Ser-gipe state or three times the Federal District area).
Deforestation is inten-sified in the area known as the “deforestation arch”, which signals the agricul-
tural and cattle ranching frontier moving from the Cen-tral-West region to the North of the country. Protected areas play a crucial role in refraining forest destruction in the Brazilian Amazon. The Amazon Region Protected Ar-eas Program (ARPA) strengthens this role. Protected areas
participating in the ARPA Program proved to be more ef-ficient and faster in stopping forest destruction.
Official deforestation monitoring data, based on satel-lite images of the Brazilian Amazon (see further details below) show that deforestation is clearly smaller within and around the protected areas (PAs) in comparison to the areas outside or away from them. A comparative analysis of 198 studied PAs reveals that deforestation rate is indeed smaller in the 63 PAs which were supported by ARPA until 2010, in comparison to the 136 PAs left out of this Program.
A general diagnosis of deforestation within and around the PAs was produced based on the accumulated defores-tation data for each protected area in the Brazilian Ama-zon. Besides the diagnosis, this analysis provided a base line for ARPA-supported PAs monitoring.
Although they are officially protected, PAs in the Bra-zilian Amazon are not free from deforestation. The lack of land ordering or the non-compliance with the laws clear the way for predatory activities resulting in the destruction of native vegetation cover and its associated biodiversity. Even if such activities take place, protected areas still act like a barrier against deforestation. Moreover, the effect of a protected area goes beyond its boundaries and has a shadow effect all around it. Another important fact is that avoided deforestation in and around PAs is not shifted to another area, which means that there is no leak in it (Soares et al 20102).
Although they are officially protected, PAs in the Brazilian Amazon are not free from deforestation. The lack of land ordering or the non-compliance with the laws clear the way for predatory activities resulting in the destruction of native vegetation cover and its associated biodiversity
1 Global Forest Resources Assessment – Progress towards sustain-able forest management. Food and Agriculture Organization of the United Nations (Fao), Roma, 2005.
2 SOARES-FILHO B.; et a. Role of Brazilian Amazon protected areas in climate change mitigation. Proc National Academy of Sciences USA, v. 107, n. 24, p.10821-6, 15 de junho de 2010. Publicada eletroni-camente em 26 mai0 de 2010.
5 Deflorestation and climate change
The deforested area within each one of the 198 PAs under analysis totals 9,520 square kilometers – the equiv-alent to 1.4% of those PAs total area (699,258 sq. km). According to the Brazilian Amazon Forest Monitoring System through Satellite Surveillance (Prodes), 17,600 sq. km of natural forest were lost every year from 2000 to 2009 in the Brazilian Amazon region.
Greenhouse gas emissions illuminate the implications of a forest conversion of such magnitude: around 0.7 to 1.4 GT C02 were generated per year as a result of 195,000 sq. km deforested in the 1996-2005 period (Nepstad et al. 2010)3. According to the United Nations Framework Convention on Climate Change (UNFCCC), this is the equivalent to 10-25% of USA emissions in 2008.
Consolidated results for the extent of deforestation (measured in square kilometers) within the Amazon protected areas show that in 48% of PAs deforestation was limited to 10 sq. km or less. Together, those PAs account for 267 sq. km of deforested area. Another 29% of PAs lost 10 to 50 sq. km of forests and their deforested area totaled 1,446 sq. km. Over half of the PAs in that group (31 PAs) is located in the Deforestation Arch. The remaining 23% refer to PAs which lost over 50 sq. km of their native vegetation and, together, they account for 7,805.9 sq. km of deforested area. Three fourths of them (76%) are located in the Arch.
The average percentage of deforested area within the PAs is 7%. In near three fourths of the PAs (73%), almost the en-tire forest cover was kept standing (at least 95% of the PA’s total area was preserved), while 16% of the PAs lost over 10% of its forests. The other remaining 11% had between 5 and 10 sq. km of deforestation. One tenth of deforested area is
the threshold beyond which vegetation destruction starts having a very negative impact upon ecology and climate.
Methodology
Late in 2009, deforestation within the PAs was calculated by the Brazilian Ministry of the Environment’s Biodiver-sity and Forest Department (MMA/SBF) and the Na-tional Space Research Institute (Inpe), which is linked to the Brazilian Ministry of Science and Technology (MCT), using the 2000-2008 yearly data from Prodes. The out-put of that computing work became the data basis for an analysis of the effectiveness of ARPA support to the PAs in preventing deforestation.
The analysis took into account the quantitative data about deforestation in all protected areas in the Brazilian Amazon. From a total of 304 PAs existing in the Ama-zon (table 1), we excluded PAs in the following categories: Environmental Protection Area (APA) and Forest, both from the sustainable use group. Three other categories – Natural Monument and Wildlife Refuge, in the strict protection group, and Area of Special Ecological Inter-est, in the sustainable use group, are not eligible for ARPA support and therefore do not appear in the ARPA group of PAs. Considering that those categories represent a very small minority, the fact that they only appear in the group of PAs without ARPA support does not affect the analysis outcome. Therefore, only 198 PAs were analyzed for this assessment. Table 2 presents the 198 PAs composing the data base for this assessment, according to category dis-tribution. The categories having more PAs are Extractive Reserves (71 PAs, corresponding to 23% of total PAs) and Parks (64 PAs, corresponding to 21% of total PAs).3 NEPSTAD, D.; et al. The End of Deforestation in the Brazilian Ama-
zon. Science, v. 326, n. 5958, p. 1350-1351, 2009.
6 Deflorestation and climate change
Table 1 · PA distribution according to management
groups and protection categories
Management Group
CategoryNumber of PAS
%
Strict Protection
Park (IUCN category II) 64 21
Ecological Station (IUCN category I)
23 8
Biological Reserve (IUCN category I)
14 5
Natural Monument (IUCN III) 1 0
Wildlife Refuge (IUCN III) 2 1
Sustainable Use
Extractive Reserve (IUCN VI) 71 23
Forest (IUCN VI) 61 20
Area of Special Ecological Interest (IUCN IV)
3 1
Sustainable Development Reserve (IUCN VI)
20 7
Environmental Protection Area (IUCN V)
45 15
T O TA L PA S 304
Table 2 · Distribution of analyzed PAs according to
management groups and protection categories
Category # of PAs
Park 64
Ecological Station 23
Biological Reserve 14
Extractive Reserve 71
Sustainable Development Reserve 20
Anaylised sampe subtotal 192
Natural Monument* 1
Wildlife Refuge* 2
Area of Special Ecological Interest * 3
T O TA L A N A LY Z E D PA S 198
* Categories only included in the non-ARPA group
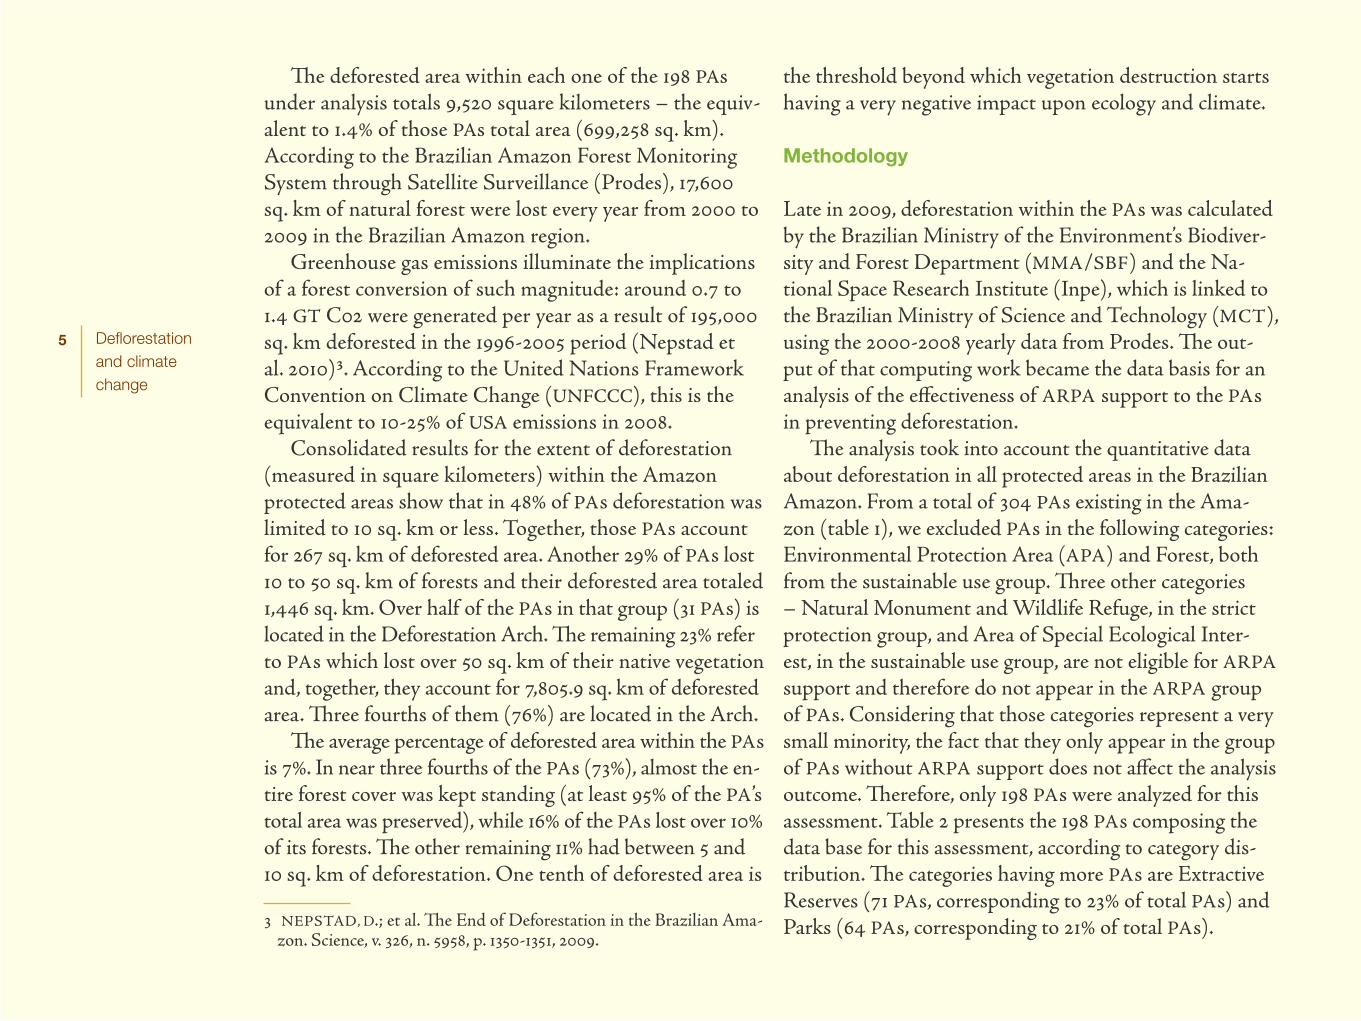
Several criteria were used to analyze the levels of forest conversion: management objective (sustainable use re-serves or strict protection areas); location in or out of the agriculture frontier expansion area (in or out of the De-forestation Arch); whether they are supported by ARPA Program or not; scope of administration (state or federal government level); and the deforestation path within and around the PA.
There is a similar number of PAs in the various scopes, management category groups, and location in or out of the Deforestation Arch. There is also a similar area that was occupied by all of the 136 PAs without ARPA support by 2010 (373,846 sq. km) and the set of 63 PAs supported by ARPA then (325,412 sq. km). Numerical difference only appears in the distinction between the ARPA group, rep-resenting 31% of total PAs, and the group left out of ARPA (table 3). The situation is the same when the focus is on the Arch of Deforestation. Among the PAs located in the Arch region, 37% belong to ARPA and the ratio between sus-tainable use and strict protection is maintained (table 3).
Juan
Pra
tgin
esto
s /
WW
F-C
anon
7 Deflorestation and climate change
Table 3 · Distribution of PAs according to
scope of administration, management objective,
geographical location and ARPA support
Criteria Scope Number of PAs % of total PAs
ScopeFederal 94 47
State 104 53
Management objective
Strict protection 104 53
Sustainable use 94 47
Deforestation ArchIn 88 44
Out 110 56
ARPA supportYes 62 31
No 136 69
T O TA L 1 9 8 1 9 8
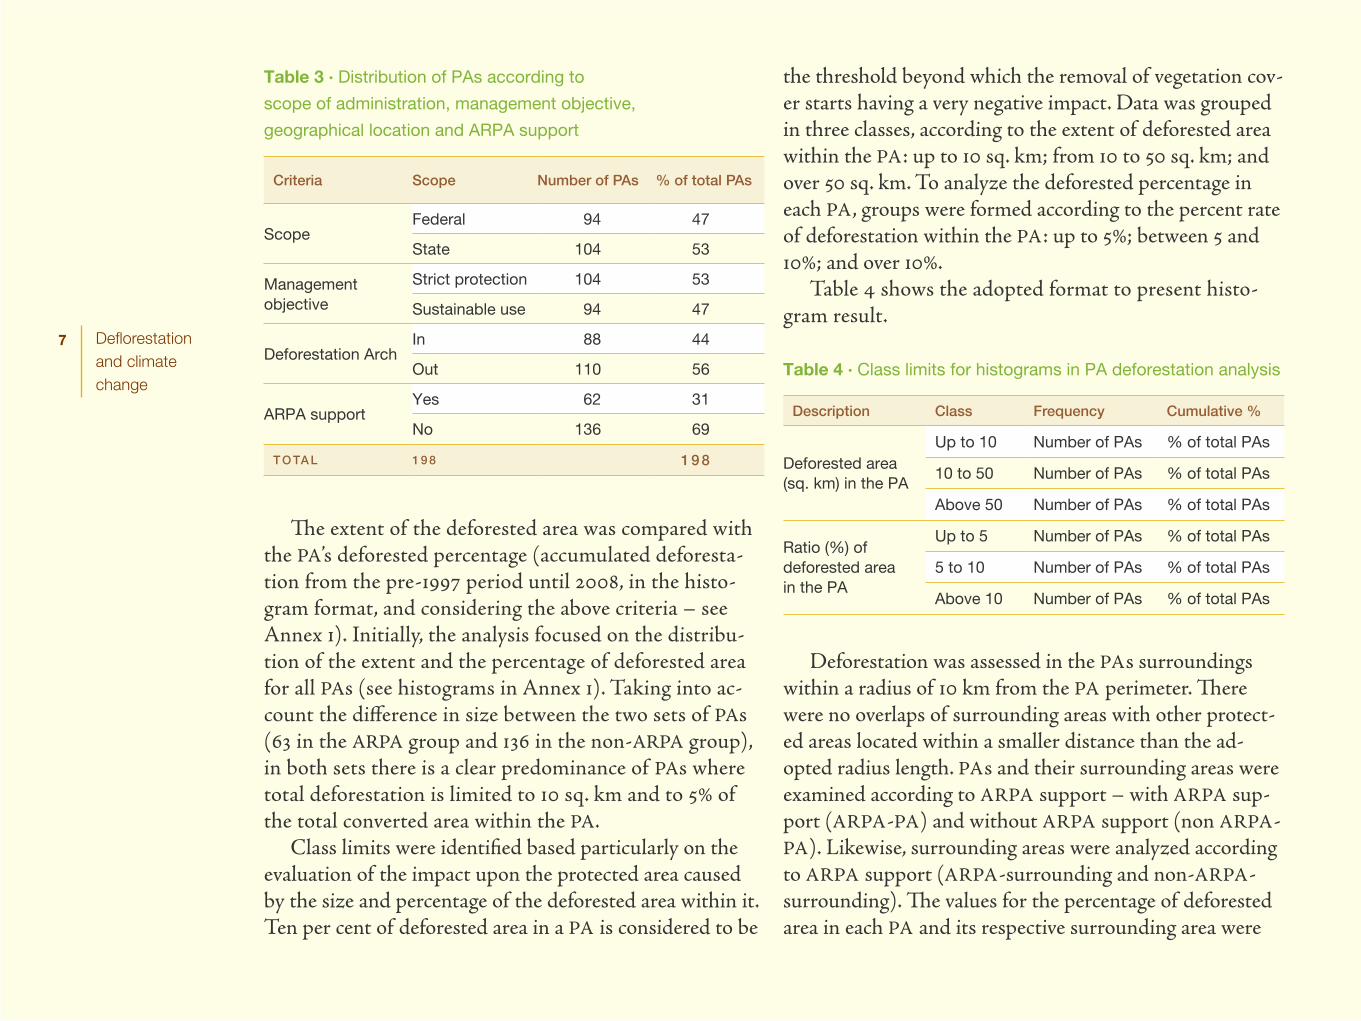
The extent of the deforested area was compared with the PA’s deforested percentage (accumulated deforesta-tion from the pre-1997 period until 2008, in the histo-gram format, and considering the above criteria – see Annex 1). Initially, the analysis focused on the distribu-tion of the extent and the percentage of deforested area for all PAs (see histograms in Annex 1). Taking into ac-count the difference in size between the two sets of PAs (63 in the ARPA group and 136 in the non-ARPA group), in both sets there is a clear predominance of PAs where total deforestation is limited to 10 sq. km and to 5% of the total converted area within the PA.
Class limits were identified based particularly on the evaluation of the impact upon the protected area caused by the size and percentage of the deforested area within it. Ten per cent of deforested area in a PA is considered to be
the threshold beyond which the removal of vegetation cov-er starts having a very negative impact. Data was grouped in three classes, according to the extent of deforested area within the PA: up to 10 sq. km; from 10 to 50 sq. km; and over 50 sq. km. To analyze the deforested percentage in each PA, groups were formed according to the percent rate of deforestation within the PA: up to 5%; between 5 and 10%; and over 10%.
Table 4 shows the adopted format to present histo-gram result.
Table 4 · Class limits for histograms in PA deforestation analysis
Description Class Frequency Cumulative %
Deforested area (sq. km) in the PA
Up to 10 Number of PAs % of total PAs
10 to 50 Number of PAs % of total PAs
Above 50 Number of PAs % of total PAs
Ratio (%) of deforested area in the PA
Up to 5 Number of PAs % of total PAs
5 to 10 Number of PAs % of total PAs
Above 10 Number of PAs % of total PAs
Deforestation was assessed in the PAs surroundings within a radius of 10 km from the PA perimeter. There were no overlaps of surrounding areas with other protect-ed areas located within a smaller distance than the ad-opted radius length. PAs and their surrounding areas were examined according to ARPA support – with ARPA sup-port (ARPA-PA) and without ARPA support (non ARPA-PA). Likewise, surrounding areas were analyzed according to ARPA support (ARPA-surrounding and non-ARPA-surrounding). The values for the percentage of deforested area in each PA and its respective surrounding area were
8 Deflorestation and climate change
added up, thus generating just one average annual value for each one of the four assessed situations.
When analyzing the deforestation dynamics in the PAs with ARPA support, one must take into account that the im-plementation of ARPA Program is quite recent (it started in 2002) and also that the creation of protected areas and their inclusion in the Program happened gradually, which does not allow the identification of a time and space base line.
The deforestation path along 2000-2008 was assessed in order to analyze the impact of ARPA support in the PAs – as well as in their surrounding areas – located in the Deforestation Arch. Data referring to deforestation occurring before 1997 was disregarded because, unlike other annual data, it represents forest conversion accumu-lated along several years.
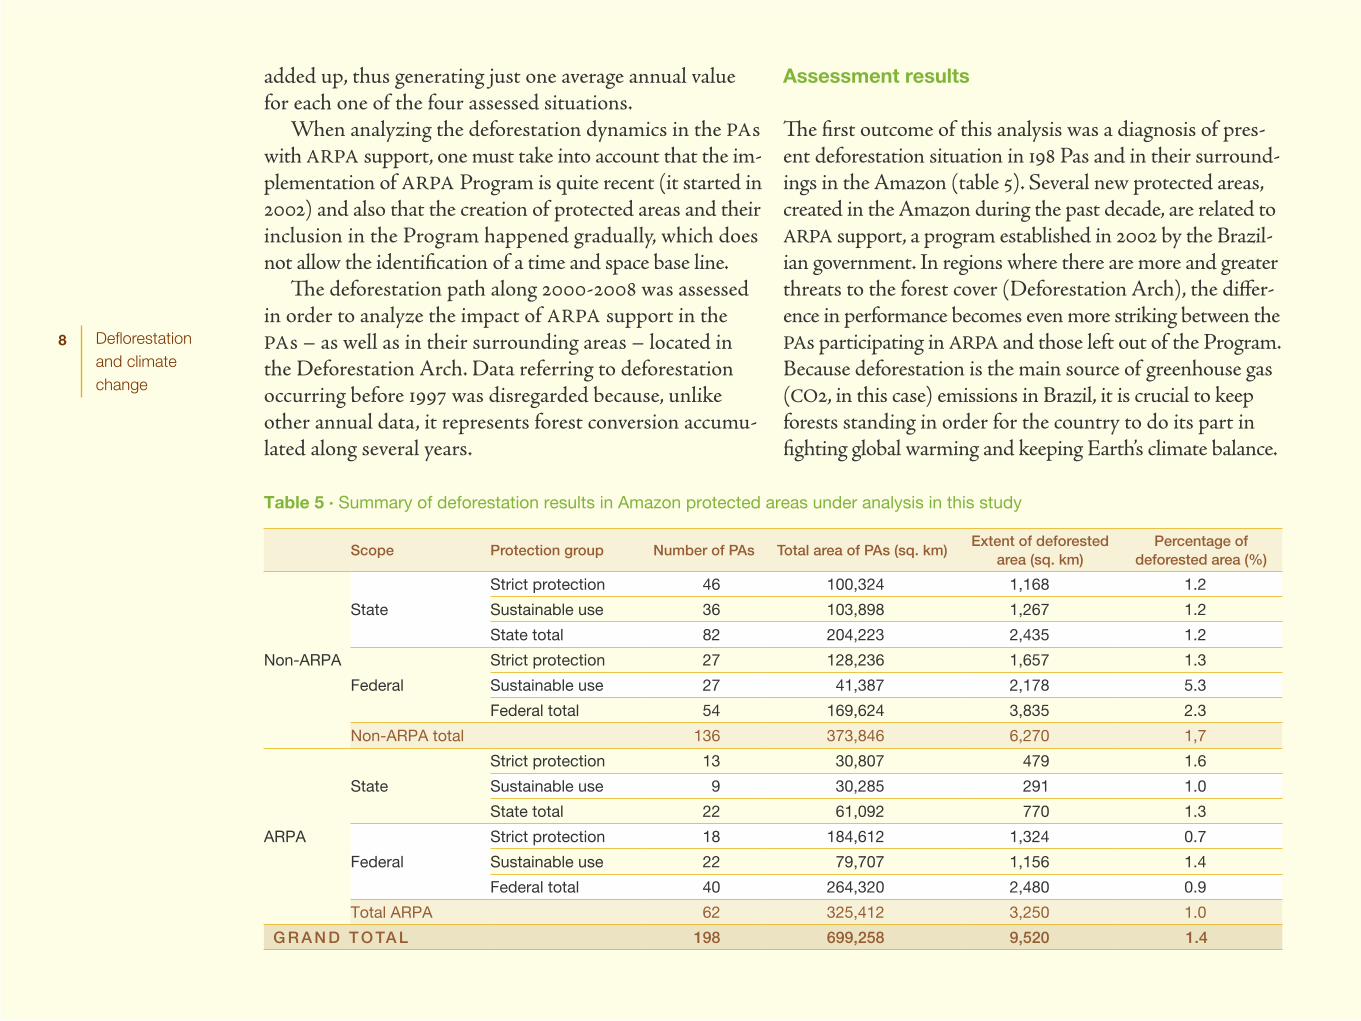
Assessment results
The first outcome of this analysis was a diagnosis of pres-ent deforestation situation in 198 Pas and in their surround-ings in the Amazon (table 5). Several new protected areas, created in the Amazon during the past decade, are related to ARPA support, a program established in 2002 by the Brazil-ian government. In regions where there are more and greater threats to the forest cover (Deforestation Arch), the differ-ence in performance becomes even more striking between the PAs participating in ARPA and those left out of the Program. Because deforestation is the main source of greenhouse gas (CO2, in this case) emissions in Brazil, it is crucial to keep forests standing in order for the country to do its part in fighting global warming and keeping Earth’s climate balance.
Table 5 · Summary of deforestation results in Amazon protected areas under analysis in this study
Scope Protection group Number of PAs Total area of PAs (sq. km)Extent of deforested
area (sq. km)Percentage of
deforested area (%)
Non-ARPA
State
Strict protection 46 100,324 1,168 1.2
Sustainable use 36 103,898 1,267 1.2
State total 82 204,223 2,435 1.2
Federal
Strict protection 27 128,236 1,657 1.3
Sustainable use 27 41,387 2,178 5.3
Federal total 54 169,624 3,835 2.3
Non-ARPA total 136 373,846 6,270 1,7
ARPA
State
Strict protection 13 30,807 479 1.6
Sustainable use 9 30,285 291 1.0
State total 22 61,092 770 1.3
Federal
Strict protection 18 184,612 1,324 0.7
Sustainable use 22 79,707 1,156 1.4
Federal total 40 264,320 2,480 0.9
Total ARPA 62 325,412 3,250 1.0
G R A N D T O TA L 198 699,258 9,520 1.4
9 Deflorestation and climate change
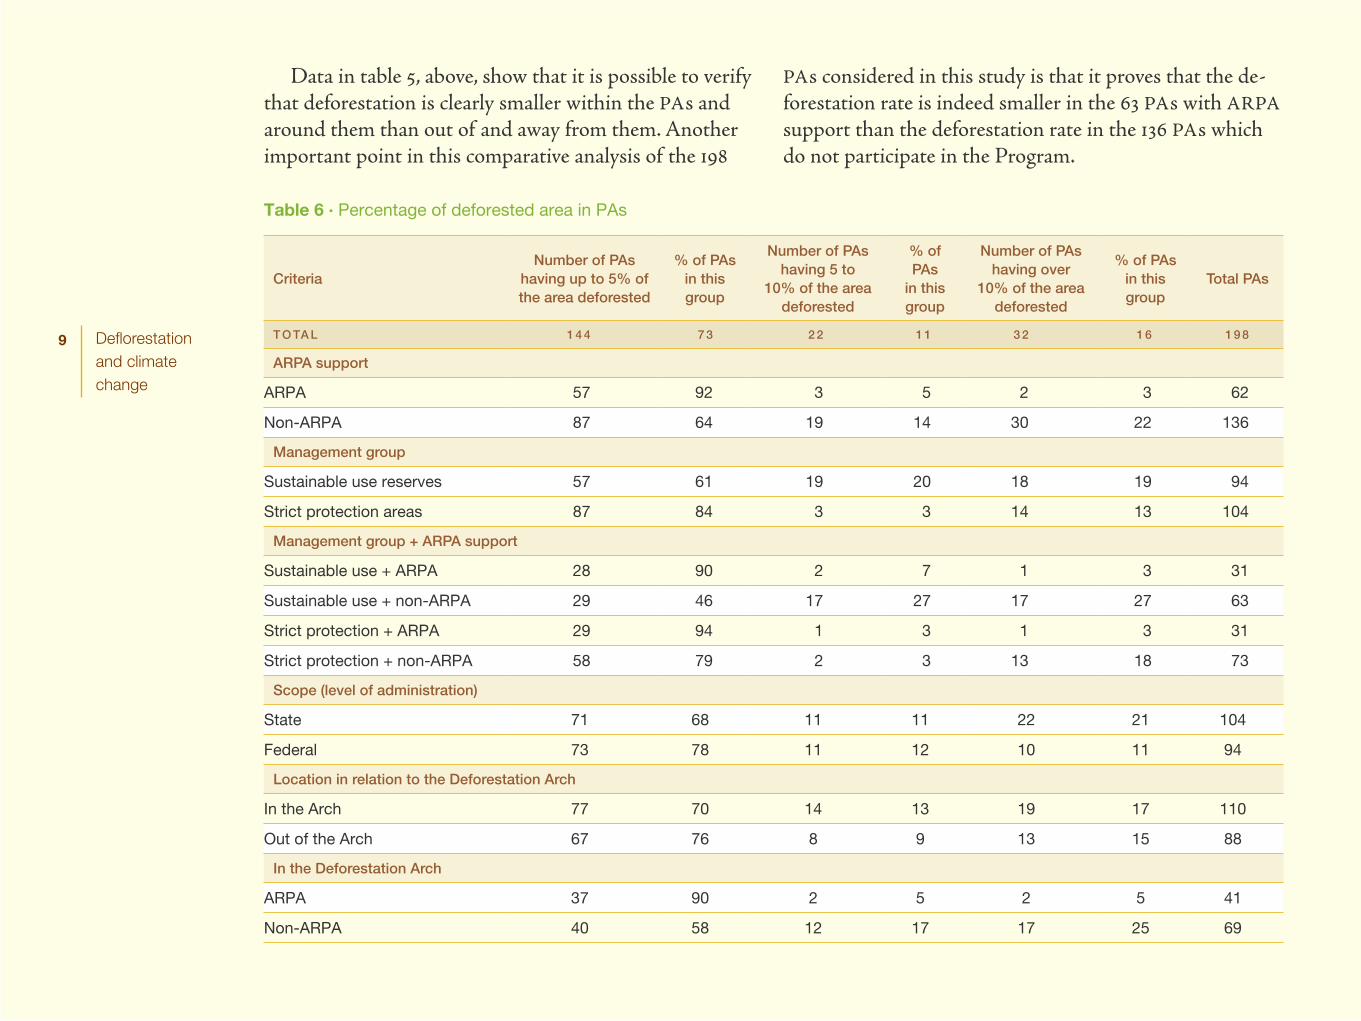
Data in table 5, above, show that it is possible to verify that deforestation is clearly smaller within the PAs and around them than out of and away from them. Another important point in this comparative analysis of the 198
PAs considered in this study is that it proves that the de-forestation rate is indeed smaller in the 63 PAs with ARPA support than the deforestation rate in the 136 PAs which do not participate in the Program.
Table 6 · Percentage of deforested area in PAs
CriteriaNumber of PAs
having up to 5% of the area deforested
% of PAs in this group
Number of PAs having 5 to
10% of the area deforested
% of PAs
in this group
Number of PAs having over
10% of the area deforested
% of PAs in this group
Total PAs
T O TA L 1 4 4 7 3 2 2 1 1 3 2 1 6 1 9 8
ARPA support
ARPA 57 92 3 5 2 3 62
Non-ARPA 87 64 19 14 30 22 136
Management group
Sustainable use reserves 57 61 19 20 18 19 94
Strict protection areas 87 84 3 3 14 13 104
Management group + ARPA support
Sustainable use + ARPA 28 90 2 7 1 3 31
Sustainable use + non-ARPA 29 46 17 27 17 27 63
Strict protection + ARPA 29 94 1 3 1 3 31
Strict protection + non-ARPA 58 79 2 3 13 18 73
Scope (level of administration)
State 71 68 11 11 22 21 104
Federal 73 78 11 12 10 11 94
Location in relation to the Deforestation Arch
In the Arch 77 70 14 13 19 17 110
Out of the Arch 67 76 8 9 13 15 88
In the Deforestation Arch
ARPA 37 90 2 5 2 5 41
Non-ARPA 40 58 12 17 17 25 69
10 Deflorestation and climate change
CriteriaNumber of PAs
having up to 5% of the area deforested
% of PAs in this group
Number of PAs having 5 to
10% of the area deforested
% of PAs
in this group
Number of PAs having over
10% of the area deforested
% of PAs in this group
Total PAs
Sustainable use reserves 34 58 11 19 14 24 59
Strict protection areas 43 84 3 6 5 10 51
ARPA + sustainable use 20 91 1 4 1 5 22
ARPA + strict protection 17 89 1 6 1 5 19
ARPA + state 17 94 0 0 1 6 18
ARPA + federal 20 87 2 9 1 4 23
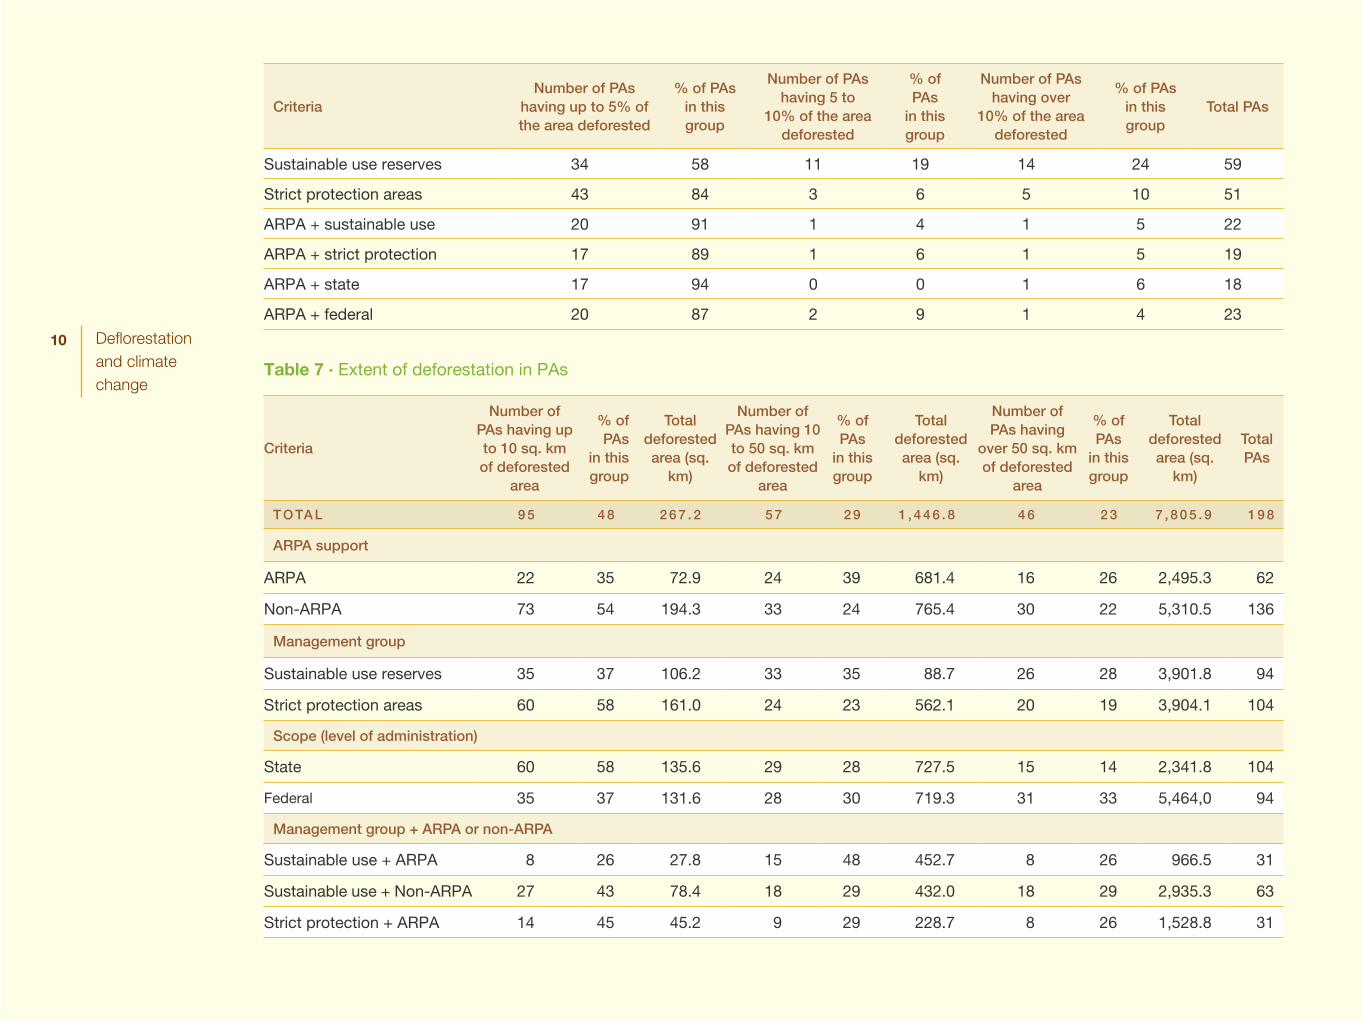
Table 7 · Extent of deforestation in PAs
Criteria
Number of PAs having up to 10 sq. km of deforested
area
% of PAs
in this group
Total deforested area (sq.
km)
Number of PAs having 10 to 50 sq. km of deforested
area
% of PAs
in this group
Total deforested area (sq.
km)
Number of PAs having
over 50 sq. km of deforested
area
% of PAs
in this group
Total deforested area (sq.
km)
Total PAs
T O TA L 9 5 4 8 2 6 7 . 2 5 7 2 9 1 , 4 4 6 . 8 4 6 2 3 7 , 8 0 5 . 9 1 9 8
ARPA support
ARPA 22 35 72.9 24 39 681.4 16 26 2,495.3 62
Non-ARPA 73 54 194.3 33 24 765.4 30 22 5,310.5 136
Management group
Sustainable use reserves 35 37 106.2 33 35 88.7 26 28 3,901.8 94
Strict protection areas 60 58 161.0 24 23 562.1 20 19 3,904.1 104
Scope (level of administration)
State 60 58 135.6 29 28 727.5 15 14 2,341.8 104
Federal 35 37 131.6 28 30 719.3 31 33 5,464,0 94
Management group + ARPA or non-ARPA
Sustainable use + ARPA 8 26 27.8 15 48 452.7 8 26 966.5 31
Sustainable use + Non-ARPA 27 43 78.4 18 29 432.0 18 29 2,935.3 63
Strict protection + ARPA 14 45 45.2 9 29 228.7 8 26 1,528.8 31
11 Deflorestation and climate change
Criteria
Number of PAs having up to 10 sq. km of deforested
area
% of PAs
in this group
Total deforested area (sq.
km)
Number of PAs having 10 to 50 sq. km of deforested
area
% of PAs
in this group
Total deforested area (sq.
km)
Number of PAs having
over 50 sq. km of deforested
area
% of PAs
in this group
Total deforested area (sq.
km)
Total PAs
Strict protection + Non-ARPA 46 63 115.9 15 21 333.4 12 16 2,375.2 73
Location in relation to the Deforestation Arch
In the Arch 44 40 118.7 31 28 784.5 35 32 6,594.4 110
Out of the Arch 51 58 148.5 26 30 662.3 11 13 1,211.4 88
In the Deforestation Arch
ARPA 15 37 36.9 12 29 367.6 14 34 2,201.4 41
Non-ARPA 29 42 81.8 19 28 416.9 21 30 4,393.0 69
Sustainable use reserves 21 36 44.3 19 32 507.9 19 32 3,143.6 59
Strict protection areas 23 45 74.4 12 24 276.7 16 31 3,450.8 51
Sustainable use + ARPA 6 27 9.6 9 41 293.7 7 32 835.6 22
Strict protection + ARPA 9 47 27.3 3 16 73.9 7 37 1,365.8 19
State + ARPA 11 61 27.2 5 28 153.7 2 11 378.5 18
Federal + ARPA 4 17 9.7 7 30 213.9 12 52 1,822.9 23
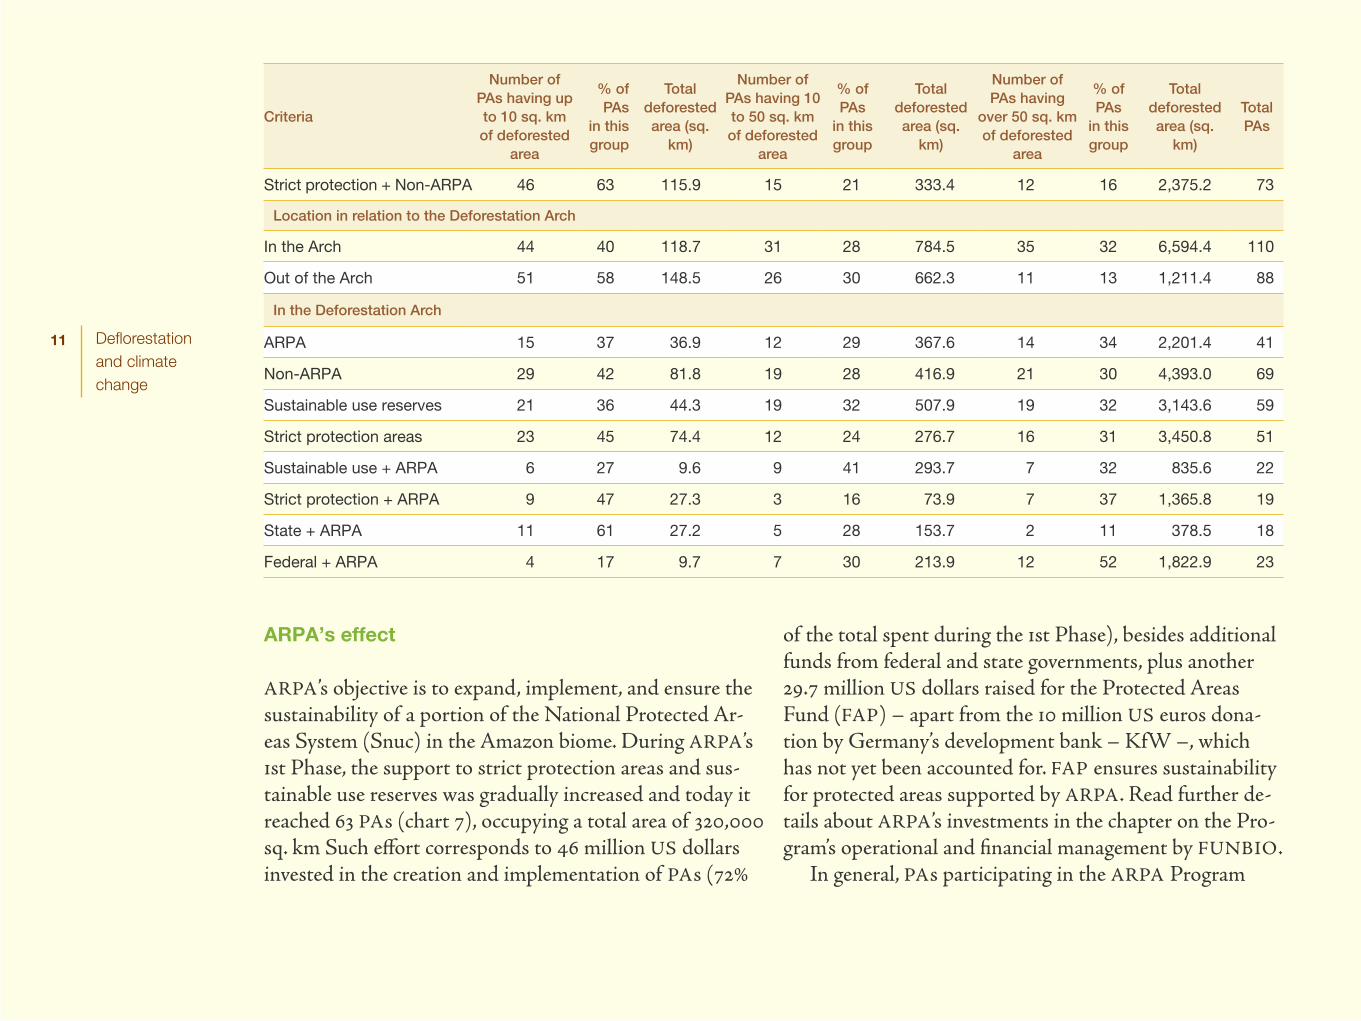
ARPA’s effect
ARPA’s objective is to expand, implement, and ensure the sustainability of a portion of the National Protected Ar-eas System (Snuc) in the Amazon biome. During ARPA’s 1st Phase, the support to strict protection areas and sus-tainable use reserves was gradually increased and today it reached 63 PAs (chart 7), occupying a total area of 320,000 sq. km Such effort corresponds to 46 million US dollars invested in the creation and implementation of PAs (72%
of the total spent during the 1st Phase), besides additional funds from federal and state governments, plus another 29.7 million US dollars raised for the Protected Areas Fund (FAP) – apart from the 10 million US euros dona-tion by Germany’s development bank – KfW –, which has not yet been accounted for. FAP ensures sustainability for protected areas supported by ARPA. Read further de-tails about ARPA’s investments in the chapter on the Pro-gram’s operational and financial management by FUNBIO.
In general, PAs participating in the ARPA Program
12 Deflorestation and climate change
Chart 1 · Distribution of the size (extent) of
deforested area in PAs with ARPA support
Chart 2 · Distribution of the size (extent) of
deforested area in PAs without ARPA support
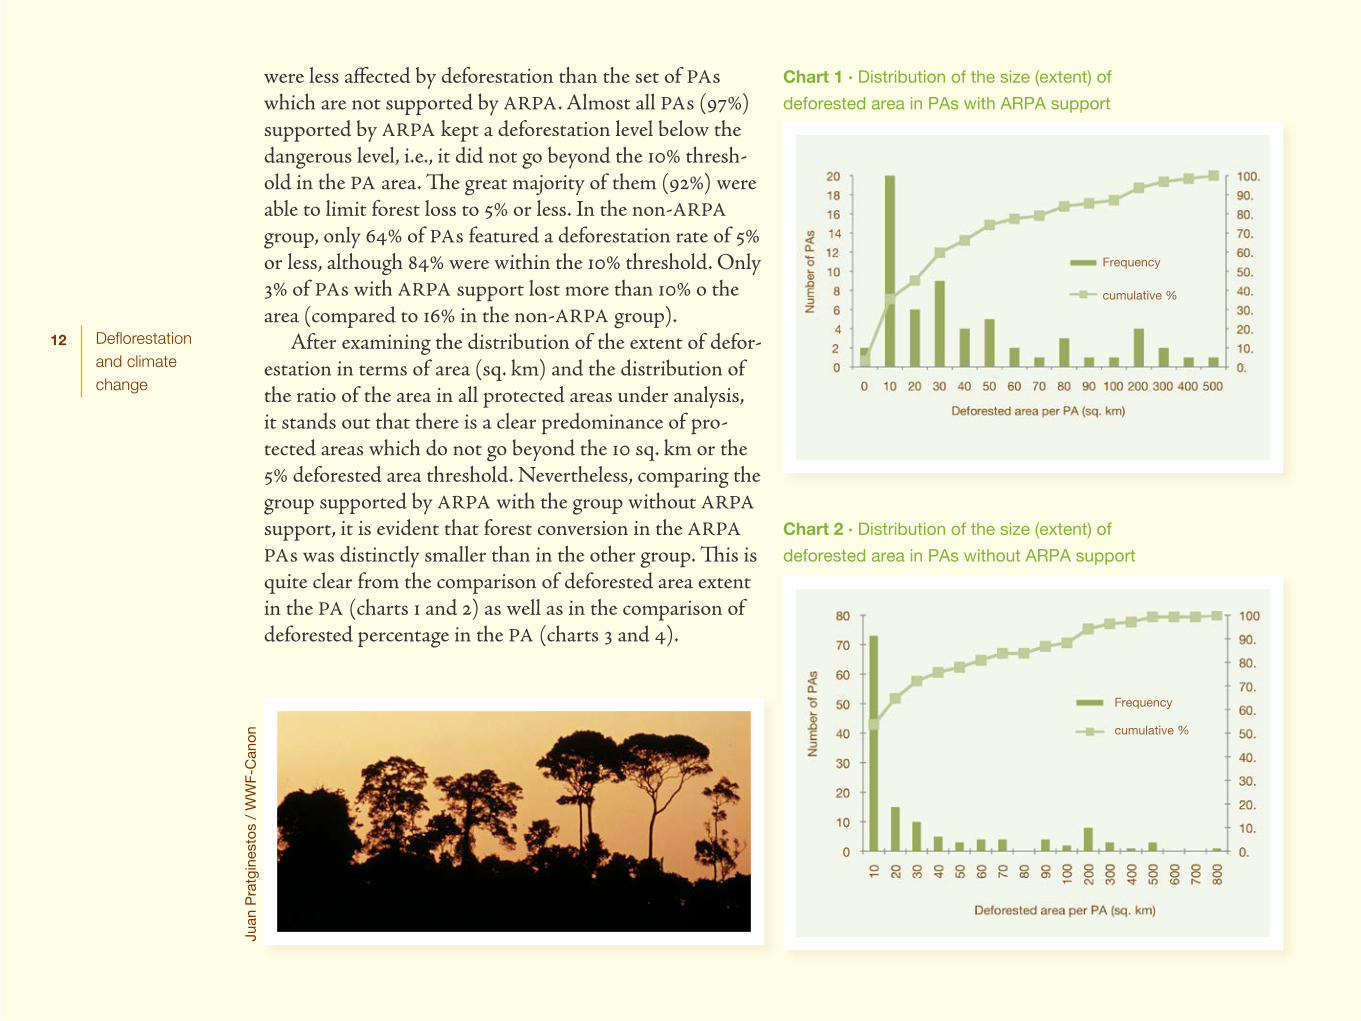
were less affected by deforestation than the set of PAs which are not supported by ARPA. Almost all PAs (97%) supported by ARPA kept a deforestation level below the dangerous level, i.e., it did not go beyond the 10% thresh-old in the PA area. The great majority of them (92%) were able to limit forest loss to 5% or less. In the non-ARPA group, only 64% of PAs featured a deforestation rate of 5% or less, although 84% were within the 10% threshold. Only 3% of PAs with ARPA support lost more than 10% o the area (compared to 16% in the non-ARPA group).
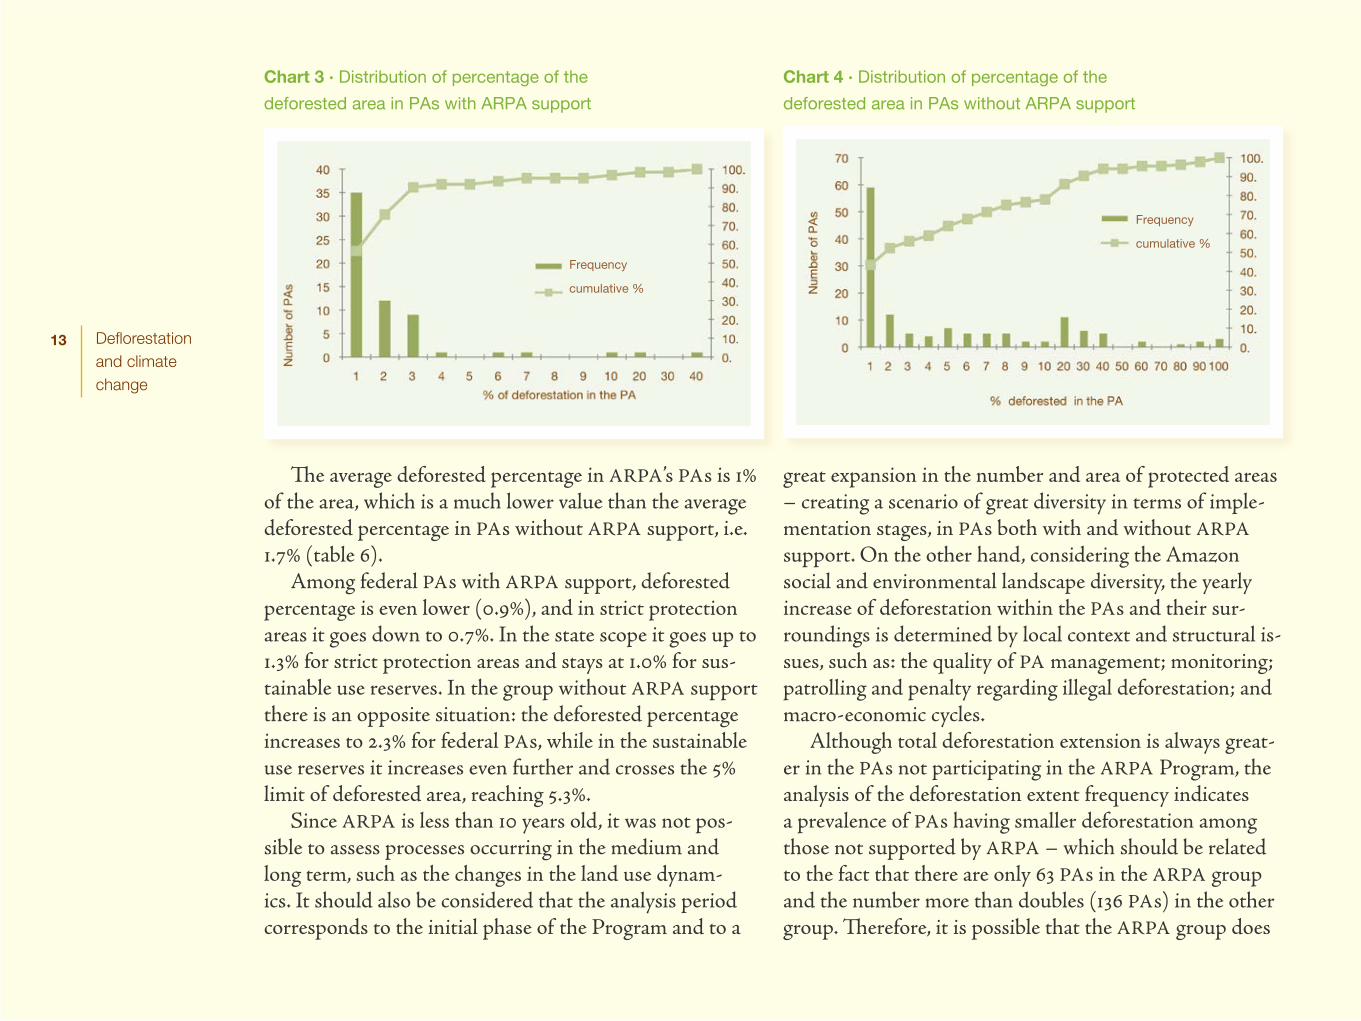
After examining the distribution of the extent of defor-estation in terms of area (sq. km) and the distribution of the ratio of the area in all protected areas under analysis, it stands out that there is a clear predominance of pro-tected areas which do not go beyond the 10 sq. km or the 5% deforested area threshold. Nevertheless, comparing the group supported by ARPA with the group without ARPA support, it is evident that forest conversion in the ARPA PAs was distinctly smaller than in the other group. This is quite clear from the comparison of deforested area extent in the PA (charts 1 and 2) as well as in the comparison of deforested percentage in the PA (charts 3 and 4).
Frequency
cumulative %
Frequency
cumulative %
Jua
n P
ratg
ines
tos
/ W
WF-
Can
on
13 Deflorestation and climate change
Chart 3 · Distribution of percentage of the
deforested area in PAs with ARPA support
Chart 4 · Distribution of percentage of the
deforested area in PAs without ARPA support
Frequency
cumulative %
Frequency
cumulative %
The average deforested percentage in ARPA’s PAs is 1% of the area, which is a much lower value than the average deforested percentage in PAs without ARPA support, i.e. 1.7% (table 6).
Among federal PAs with ARPA support, deforested percentage is even lower (0.9%), and in strict protection areas it goes down to 0.7%. In the state scope it goes up to 1.3% for strict protection areas and stays at 1.0% for sus-tainable use reserves. In the group without ARPA support there is an opposite situation: the deforested percentage increases to 2.3% for federal PAs, while in the sustainable use reserves it increases even further and crosses the 5% limit of deforested area, reaching 5.3%.
Since ARPA is less than 10 years old, it was not pos-sible to assess processes occurring in the medium and long term, such as the changes in the land use dynam-ics. It should also be considered that the analysis period corresponds to the initial phase of the Program and to a
great expansion in the number and area of protected areas – creating a scenario of great diversity in terms of imple-mentation stages, in PAs both with and without ARPA support. On the other hand, considering the Amazon social and environmental landscape diversity, the yearly increase of deforestation within the PAs and their sur-roundings is determined by local context and structural is-sues, such as: the quality of PA management; monitoring; patrolling and penalty regarding illegal deforestation; and macro-economic cycles.
Although total deforestation extension is always great-er in the PAs not participating in the ARPA Program, the analysis of the deforestation extent frequency indicates a prevalence of PAs having smaller deforestation among those not supported by ARPA – which should be related to the fact that there are only 63 PAs in the ARPA group and the number more than doubles (136 PAs) in the other group. Therefore, it is possible that the ARPA group does
14 Deflorestation and climate change
not provide a sample showing all the different occupation conditions occurring in the Amazon region.
In terms of the percentage of destroyed area, the num-ber of PAs keeping deforestation below 5% in the ARPA group corresponds to 92% – this a much higher value than the 64% in the non-ARPA group. Furthermore, only 3% of the ARPA PAs have more than 10% of their area deforest-ed, while in the non-ARPA PAs the frequency is 22%. The data indicates that conservation is best in PAs supported by ARPA and this becomes more evident than when look-ing at absolute numbers.
Annual increase in deforestation from 2000 to 2009 is generally a small one (less than 20 sq. km) in the ARPA group of PAs; this applies to both strict protec-tion areas and sustainable use reserves. Nevertheless, atypical values were detected in seven cases. Between 2003 and 2004 – times of record deforestation in the Amazon –, peaks were registered in regions where pro-tected areas were created: Cristalino State Park (Mato Grosso state), 97 sq. km; Serra do Pardo National Park (Pará state), 93 sq. km; Terra do Meio Ecological Station (Pará state), 150 sq.km; and Verde para Sempre Extrac-tive Reserve (Pará state) – the latter was only created in 2005 –, 176 sq. km. In 2001, when ARPA Program did not yet exist, there were peaks in three Extractive Re-serves: Terra Grande-Pracuuba (37 sq. km), Arioca-Pru-anã (65 sq. km) and Ipaú-Anilzinho (75 sq. km).
Influence from management objective and use
Among the 198 analyzed protected areas, there is a pro-portional balance among the two groups according to management objective: 104 are strict protection areas and
94 are sustainable use reserves. In comparison with the sustainable use group, the strict protection group features a smaller number of forest conversion occurrence, both in absolute area (extent) and in the percentage of deforested area of each protected area. In general, sustainable use PAs were liable to more deforestation than the strict protection areas, although the difference was not remarkable.
In the group of PAs having up to 5% of deforested area (table 6), the strict protection areas have higher absolute (87 PAs) and relative (84%) numbers than the sustainable use reserves (57 PAs, corresponding to 61%). When the criterion is the 10% threshold, the ARPA PAs featuring deforested areas up to 10 sq. km (table 7) represent 26% and total 27 sq. km; PAs having between 10 and 50 sq. km of deforested area represent 48% and total 452 sq. km; and those with over 50 sq. km of deforested area are 26% and add up to 966 sq. km. Meanwhile, among the sustainable use reserves which do not benefit from ARPA, 43% have a deforested area going up to 10 sq. km (deforested area total is 78 sq. km); 29% lost between 10 and 50 sq. km (totaling 432 sq. km); and 29% lost more than 50 sq. km of defor-ested area (totaling 2,935 sq. km).
In terms of the percentage of deforested area in the sustainable use reserves (table 6), 90% of those with ARPA support have their extent of damage limited to 5% of the area; 7% have between 5 and 10% deforested and 3% went beyond the 10% threshold. Among the 63 PAs not benefitting from ARPA, it is more common to have PAs with a higher percentage of deforested area: in 46% of the PAs 5% of the forest was converted; 27% have between 5 and 10% deforested area; while 27% have already gone beyond the 10% threshold.
In the strict protection area group there is a good level
15 Deflorestation and climate change
of protection among the 31 PAs in the ARPA group and 94% of them have less than 5% deforested area (table 6). Another 6% are equally distributed between the 5 and 10% range and also in the range higher than 10%. Moreover, one notices (table 7) that 45% of the strict protection areas with ARPA support have up to 10 sq. km deforestation (45 sq. km in total); 29% range among 10 and 50 sq. km (228 sq. km in total); and 26% have more than 50 sq. km (1,528 sq. km deforested).
Among 73 strict protection areas which do not belong in the ARPA Program, PAs having over 10% of its area deforested (table 6) has already reached 18% of total PAs. Another 3% of the strict protection areas out of the ARPA group feature between 5 and 10% deforested area. A small-er number (14 PAs or 13%) of strict protection PAs feature over 10% of deforested area, as compared to the sustain-able use PAs (18 PAs or 19%).
Up to 10 sq. km of deforestation (table 7) are found in 58% of the strict protection PAs (totaling 161 sq. km) and in 37% of the sustainable use PAs (totaling 106 sq. km). There are 23% strict protection PAs featuring between 10 and 50 sq. km deforestation (totaling 562 sq. km), and 19% with over 50 sq. km (totaling 3,904 sq. km). Among the sustainable use PAs, 35% feature between 20 and 50 sq. km (totaling 884 sq.km) and 28% with over 50 sq. km defores-tation (totaling 3,901 sq. km).
In the ARPA group, the percentage of PAs conserv-ing 95% or more of its area is much higher than the other group (table 6). Nevertheless, the management objective is not relevant for that: 94% of the strict protection PAs and 90% of the sustainable use ones having ARPA support featured 5% or lesser deforestation. Without ARPA, the difference is more noticeable: 79% of the strict protection
PAs and only 46% of the sustainable use PAs were able to keep withing this threshold.
In the sustainable use group, the PAs with ARPA sup-port feature less than 5% of converted area. Regarding the extent of the deforested area (table 7), 63% of the 73 strict protection PAs out of ARPA lost up to 10 sq. km (totaling 115 sq. km); 21% lost between 10 and 50 sq. km (totaling 333 sq. km); and 16% had over 50 sq. km deforested (total-ing 2,375 sq. km of deforested area).
Influence of the scope of administration
PA deforestation was also compared according to the scope of administration. The group under analysis is composed of 104 state PAs and 94 federal ones. From the point of view of the extent of the deforested area (table 7) deforestation up to 10 sq. km are present in 58% of the state PAs (totaling 135 sq. km deforested area) and 37% of federal PAs (131 sq. km) – total deforested area is equivalent in the groups, in spite of the difference in the percentage in each scope. Ranging from 10 to 50 sq. km of deforested area, the numbers are equivalent for both cri-teria: state areas represent 28%, with 727 sq. km of area; and the federal PAs are 31%, totaling 719 sq. km. Among PAs with over 50 sq. km of deforested area, a more marked difference stands out: state PAs are 14% (2,341 sq. km) and federal PAs are 33% (5,464 sq. km).
State protected areas have smaller deforestation than federal areas. In terms of damaged percentage (table 6), 68% of state PAs belong in the group with up to 5% de-forested area – this is a lower value than the 78% found in the federal group. There is an opposite situation, however, when comparing PAs having more than 10% deforested
16 Deflorestation and climate change
area: 22% of state PAs and 10% of federal PAs. This may be due to the fact that state areas are smaller: 72% of state PAs measure up to 2,000 sq. km, while only 45% of the federal PAs fit in this size limit.
In the Deforestation Arch, the difference among the state and federal PAs frequency as to the extent of defor-estation suggests a better situation among the state pro-tected areas with ARPA support (table 7): 61% of state PAs and 17% of federal PAs in the ARPA group which are located in the Arch kept deforestation limited to 10 sq. km or less. As to the percentage of total deforested area (table 6), the deforestation pattern in the ARPA group located in the Arch is similar among state PAs (94% have up to 5% deforestation) and also among federal ones (87%).
Deforestation Arch
A sizeable portion of deforestation is concentrated in a large region located upon the line dividing the North and Central-West regions in Brazil, following the ecotone
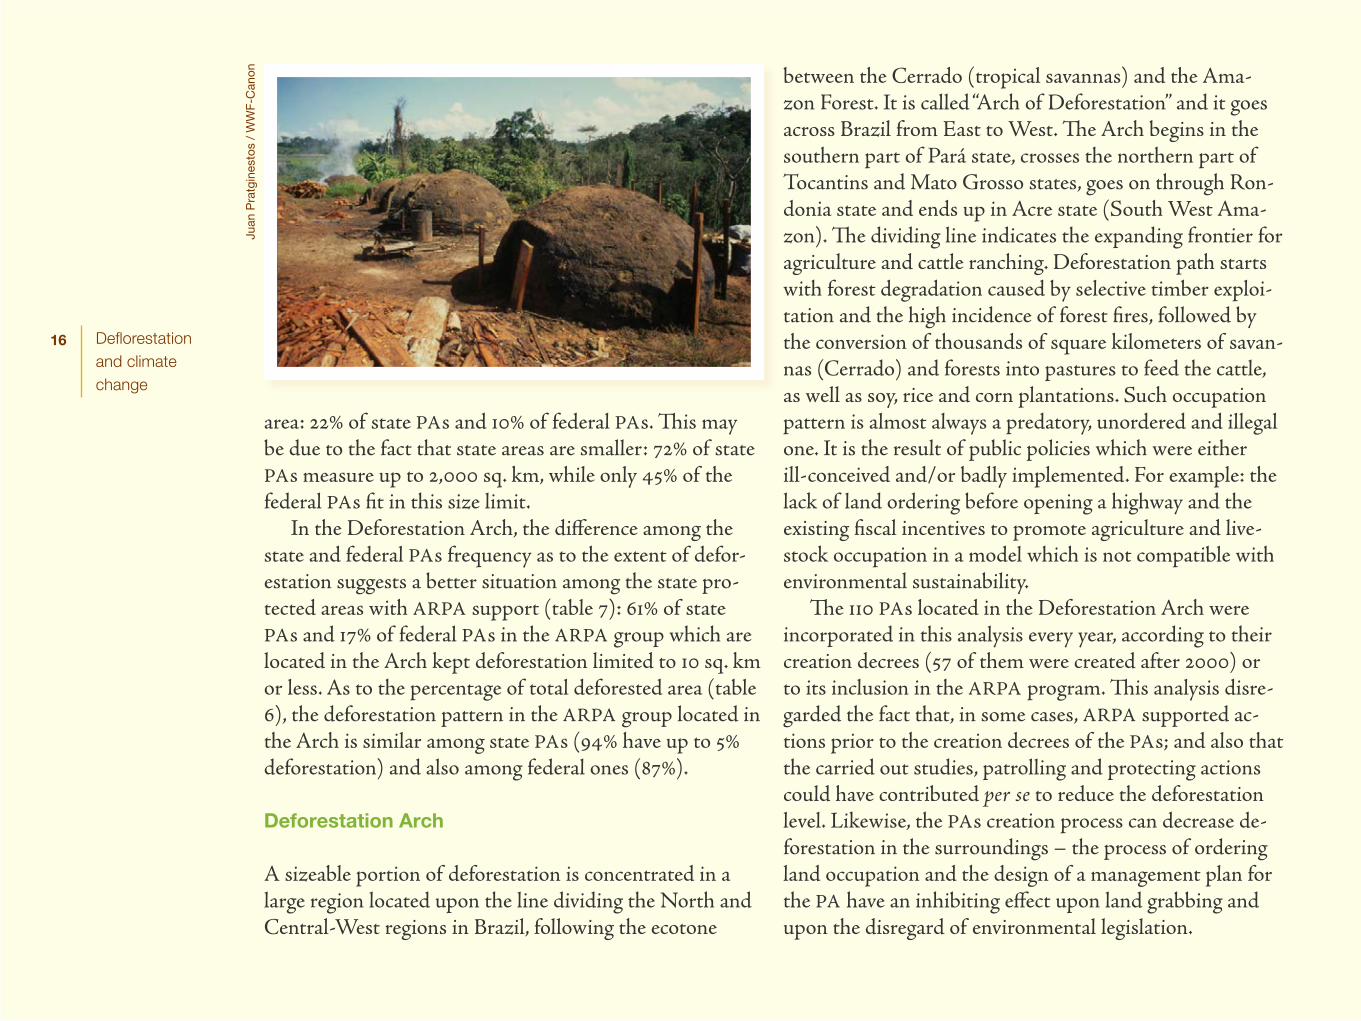
between the Cerrado (tropical savannas) and the Ama-zon Forest. It is called “Arch of Deforestation” and it goes across Brazil from East to West. The Arch begins in the southern part of Pará state, crosses the northern part of Tocantins and Mato Grosso states, goes on through Ron-donia state and ends up in Acre state (South West Ama-zon). The dividing line indicates the expanding frontier for agriculture and cattle ranching. Deforestation path starts with forest degradation caused by selective timber exploi-tation and the high incidence of forest fires, followed by the conversion of thousands of square kilometers of savan-nas (Cerrado) and forests into pastures to feed the cattle, as well as soy, rice and corn plantations. Such occupation pattern is almost always a predatory, unordered and illegal one. It is the result of public policies which were either ill-conceived and/or badly implemented. For example: the lack of land ordering before opening a highway and the existing fiscal incentives to promote agriculture and live-stock occupation in a model which is not compatible with environmental sustainability.
The 110 PAs located in the Deforestation Arch were incorporated in this analysis every year, according to their creation decrees (57 of them were created after 2000) or to its inclusion in the ARPA program. This analysis disre-garded the fact that, in some cases, ARPA supported ac-tions prior to the creation decrees of the PAs; and also that the carried out studies, patrolling and protecting actions could have contributed per se to reduce the deforestation level. Likewise, the PAs creation process can decrease de-forestation in the surroundings – the process of ordering land occupation and the design of a management plan for the PA have an inhibiting effect upon land grabbing and upon the disregard of environmental legislation.
Jua
n P
ratg
ines
tos
/ W
WF-
Can
on
17 Deflorestation and climate change
Over half of the analyzed PAs (55% of them or 110 protected areas) is situated in the Deforestation Arch. To-gether, those PAs account for 84% (6,594 sq. km) of total deforested area (7,805 sq. km), within a set of analyzed Amazon PAs.
Considering the frequency of PAs in the various extent ranges of deforestation, the forest cover in the non-ARPA group is now more protected; however, if referring to the ratio of total deforested area, there is a similar situation in and out of the Deforestation Arch – although numbers area slightly lower for those located out of the Arch.
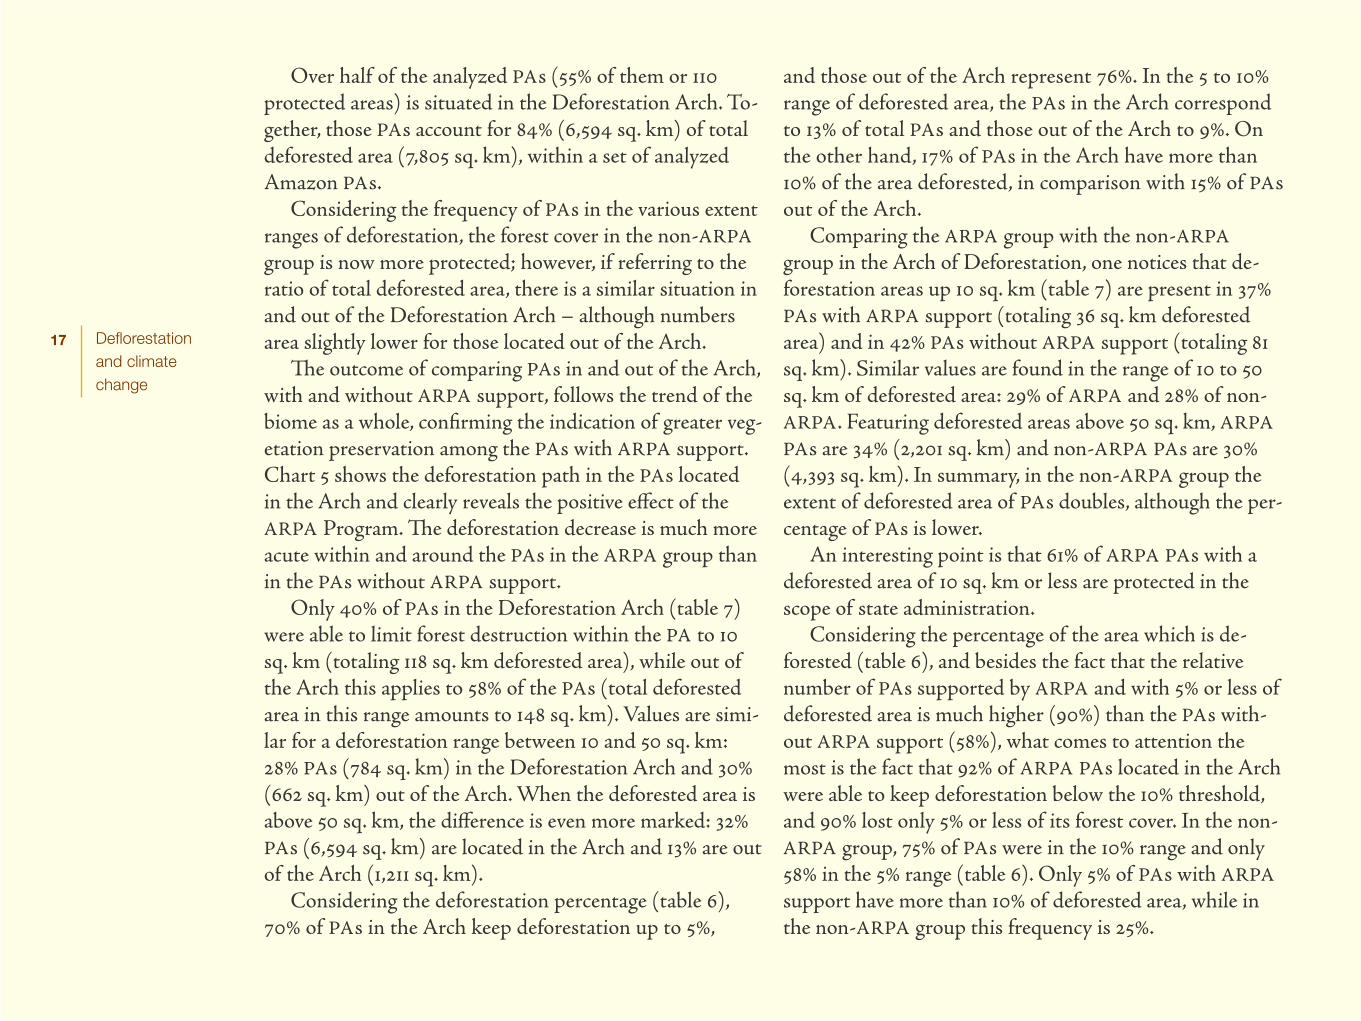
The outcome of comparing PAs in and out of the Arch, with and without ARPA support, follows the trend of the biome as a whole, confirming the indication of greater veg-etation preservation among the PAs with ARPA support. Chart 5 shows the deforestation path in the PAs located in the Arch and clearly reveals the positive effect of the ARPA Program. The deforestation decrease is much more acute within and around the PAs in the ARPA group than in the PAs without ARPA support.
Only 40% of PAs in the Deforestation Arch (table 7) were able to limit forest destruction within the PA to 10 sq. km (totaling 118 sq. km deforested area), while out of the Arch this applies to 58% of the PAs (total deforested area in this range amounts to 148 sq. km). Values are simi-lar for a deforestation range between 10 and 50 sq. km: 28% PAs (784 sq. km) in the Deforestation Arch and 30% (662 sq. km) out of the Arch. When the deforested area is above 50 sq. km, the difference is even more marked: 32% PAs (6,594 sq. km) are located in the Arch and 13% are out of the Arch (1,211 sq. km).
Considering the deforestation percentage (table 6), 70% of PAs in the Arch keep deforestation up to 5%,
and those out of the Arch represent 76%. In the 5 to 10% range of deforested area, the PAs in the Arch correspond to 13% of total PAs and those out of the Arch to 9%. On the other hand, 17% of PAs in the Arch have more than 10% of the area deforested, in comparison with 15% of PAs out of the Arch.
Comparing the ARPA group with the non-ARPA group in the Arch of Deforestation, one notices that de-forestation areas up 10 sq. km (table 7) are present in 37% PAs with ARPA support (totaling 36 sq. km deforested area) and in 42% PAs without ARPA support (totaling 81 sq. km). Similar values are found in the range of 10 to 50 sq. km of deforested area: 29% of ARPA and 28% of non-ARPA. Featuring deforested areas above 50 sq. km, ARPA PAs are 34% (2,201 sq. km) and non-ARPA PAs are 30% (4,393 sq. km). In summary, in the non-ARPA group the extent of deforested area of PAs doubles, although the per-centage of PAs is lower.
An interesting point is that 61% of ARPA PAs with a deforested area of 10 sq. km or less are protected in the scope of state administration.
Considering the percentage of the area which is de-forested (table 6), and besides the fact that the relative number of PAs supported by ARPA and with 5% or less of deforested area is much higher (90%) than the PAs with-out ARPA support (58%), what comes to attention the most is the fact that 92% of ARPA PAs located in the Arch were able to keep deforestation below the 10% threshold, and 90% lost only 5% or less of its forest cover. In the non-ARPA group, 75% of PAs were in the 10% range and only 58% in the 5% range (table 6). Only 5% of PAs with ARPA support have more than 10% of deforested area, while in the non-ARPA group this frequency is 25%.
18 Deflorestation and climate change
Peaks
In the 2000-2008 deforestation path in the Arch, the an-nual increases are usually small among the ARPA PAs (in both strict protection areas and sustainable use reserves). In 2003 and 2004 there were deforestation peaks in Cris-talino State Park in Mato Grosso state (97 sq. km were deforested) and in two areas where strict protection areas were later created, both of them in Pará state: Serra do Pardo National Park, created in 2005, lost 93 sq. km dur-ing that period; and the Terra do Meio Ecological Station, created in 2005, lost 150 sq. km.
In 2001, three other areas in Pará state, where sustain-able use reserves were later created, also had deforestation peaks: Terra Grande-Pracuuba (37 sq. km), created in 2006; Arioca-Pruanã (65 sq. km), and Ipaú-Anilzinho (75 sq. km), created in 2005 – all of them are Extractive Re-serves. In 2003 a peak (176 sq. km) was also registered in the area where the Verde para Sempre Extractive Reserve was created in 2004, also in Pará state.
In the group of 35 strict protection areas without ARPA support, the annual deforestation increase is around 20 sq. km. In seven of those areas the annual increase reached 20 to 60 sq. km, concentrated in 2000 and between 2002 and 2004. The most severe case was that of Gurupi Biological Reserve, in Maranhão state, where 299 sq. km were devas-tated during just one year, in 2001.
There was a similar pattern among the 37 sustainable use PAs without ARPA support and the usual values were up to or below 10 sq. km, although seven PAs had between 10 and 60 sq. km of deforested area. Three of those had peaks ranging between 80 and 122 sq. km and all of them are Extractive Reserves (Tapajós-Arapiuns, in Pará state,
86 sq. km deforested; Quilombo do Frexal, in Maranhão state, 88 sq. km; and Rio Jaci-Paraná, in Rondônia state, 122 sq. km). The peaks were registered predominantly in 2000-01, 2003-04 and for the last time in 2007.
Chart 5 · Deforestation path within and in the
surrounding (10 km) area of PAs, with and without
ARPA support, located in the Deforestation Arch
Combining criteria, the effect of the scope of administra-tion among ARPA PAs in the Deforestation Arch was also analyzed. Considering area extent (table 7), deforestation up to 10 sq. km is present in 61% of state ARPA PAs (27 sq. km total deforestation) and 17% of federal ARPA PAs (9 sq. km). In the intermediary range (from 10 to 50 sq. km), there is a similar situation among state areas (28% and 153 sq. km) and federal areas (30% and 213 sq. km). Considering the PAs with deforestation beyond 50 sq. km, state ARPA PAs total 11% and federal ARPA PAs correspond to 52%, respectively accounting for 378 sq. km and 1.822 sq. km.
In the percentage of the loss of forest cover in the Arch
19 Deflorestation and climate change
(table 6), the number of PAs with over 5% deforestation in the state ARPA group represents 94% and in the federal ARPA group it represents 87%. In the range of 5 to 10% there are no state PAs; and only one PA has more than 10% deforestation.
Just like it happens all over the Brazilian Amazon, in the Deforestation Arch the strict protection areas are more preserved than the sustainable use reserves. This can be verified in terms of the extent and of the percentage of deforested area. The group of PAs having up to 10 sq. km of deforested area corresponds to 45% of strict protection areas (UCPI) and 36% of sustainable use reserves (UCUS); respectively 74 and 44 sq. km total deforested area. In the range of 10 to 50 sq. km deforestation, there is an inci-dence of 24% strict protection areas and 32% sustainable use PAs. The range of deforestation above 50 sq. km corre-sponds to 31% of the strict protection areas and 32% of the sustainable use reserves; respectively totaling 3,450 and 3,143 sq. km.
In the range of up to 5% of deforested area, strict pro-tection areas feature higher number of PAs (43) and higher percentage (84%) than the sustainable use reserves (34 PAs corresponding to 58%). In the intermediary range (5 to 10%), the strict protection areas meant 6% (3 PAs) versus 19% sustainable use areas (11 PAs). There are 5 PAs (10%) with over 10% deforested area among the strict protection areas and 14 PAs (24%) among the sustainable use reserves.
Still in the Arch, the management objective criterion was applied to assess only the PAs with ARPA support. Deforestation in both strict protection areas and sustain-able use reserves, with ARPA support and situated in the Arch, have very similar low values. This indicates that both groups are in a good state of conservation and that there is
no relevant difference among them. This is unlike the pat-tern for the Brazilian Amazon as a whole, where deforesta-tion impact in the strict protected areas was smaller.
As to the extent, deforested areas up to 10 sq. km are present in 47% of strict protection areas and 27% of sus-tainable use reserves, with respectively 27 and 9 sq. km of total deforested area, while 16% of strict protection areas and 41% of sustainable use reserves (73 and 293 sq. km) fall in the intermediary range (between 10 and 50 sq. km). As for PAs having more than 50 sq. km of deforestation, the strict protection areas total 37% and the sustainable use reserves total 32% – respectively corresponding to 1,365 and 835 sq. km.
Referring to the deforested percentage in each protect-ed area in the ARPA group in the Arch, 89% of the strict protection areas and 91% of the sustainable use reserves belong in the range of up to 5% of area being deforested. In the 5 to 10% range and also in the group with over 10% of deforested area, both strict protection areas and sus-tainable use reserves have similar values (6% of strict pro-tection areas versus 4% of sustainable use reserves in the intermediary range and 5% for both in this range).
Jua
n P
ratg
ines
tos
/ W
WF-
Can
on
20 Deflorestation and climate change
PAs having atypical deforestation
Ten PAs present atypical deforestation (above 34%, cor-responding to twice the standard deviation). Four of them are in Maranhão state, two in Rondonia, one in Pará, one in Tocantins, one in Amazonas state and one in Mato Gros-so. They are the following: Quilombo do Frexal Extractive Reserve, in Maranhão state (100% of the area is cleared); Sumaúma State Park, in Amazonas state (99%); Extrac-tive Reserve Extremo Norte in Tocantins state (92%); Mata Grande Extractive Reserve, in Maranhão (87%); Sítio do Rangedor Ecological Station in Maranhão state (85%); Siríaco Extractive Reserve also in Maranhão (71%); Cande-ias State Park in Rondônia state (59%); Parecis State Park in Rondônia (58%); Utinga State Park in Pará state(38%); Águas Quentes State Park in Mato Grosso (35%).
Deforestation decrease
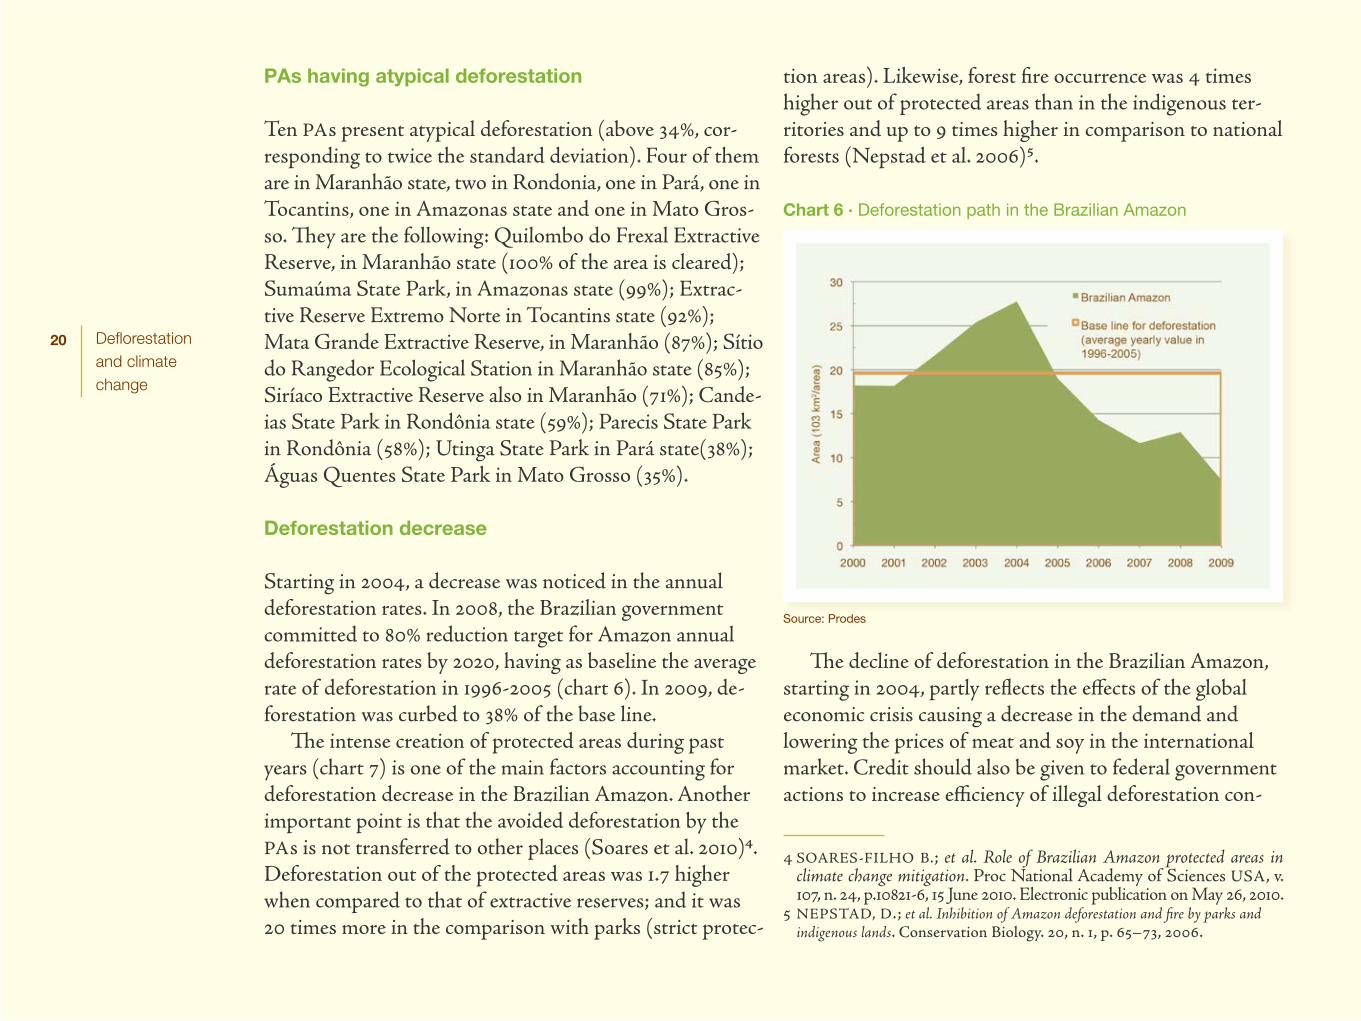
Starting in 2004, a decrease was noticed in the annual deforestation rates. In 2008, the Brazilian government committed to 80% reduction target for Amazon annual deforestation rates by 2020, having as baseline the average rate of deforestation in 1996-2005 (chart 6). In 2009, de-forestation was curbed to 38% of the base line.
The intense creation of protected areas during past years (chart 7) is one of the main factors accounting for deforestation decrease in the Brazilian Amazon. Another important point is that the avoided deforestation by the PAs is not transferred to other places (Soares et al. 2010)4. Deforestation out of the protected areas was 1.7 higher when compared to that of extractive reserves; and it was 20 times more in the comparison with parks (strict protec-
tion areas). Likewise, forest fire occurrence was 4 times higher out of protected areas than in the indigenous ter-ritories and up to 9 times higher in comparison to national forests (Nepstad et al. 2006)5.
Chart 6 · Deforestation path in the Brazilian Amazon
Source: Prodes
The decline of deforestation in the Brazilian Amazon, starting in 2004, partly reflects the effects of the global economic crisis causing a decrease in the demand and lowering the prices of meat and soy in the international market. Credit should also be given to federal government actions to increase efficiency of illegal deforestation con-
4 SOARES-FILHO B.; et al. Role of Brazilian Amazon protected areas in climate change mitigation. Proc National Academy of Sciences USA, v. 107, n. 24, p.10821-6, 15 June 2010. Electronic publication on May 26, 2010.
5 NEPSTAD, D.; et al. Inhibition of Amazon deforestation and fire by parks and indigenous lands. Conservation Biology. 20, n. 1, p. 65–73, 2006.
21 Deflorestation and climate change
trol and patrolling, and to the adoption of public policies to fight forest destruction.
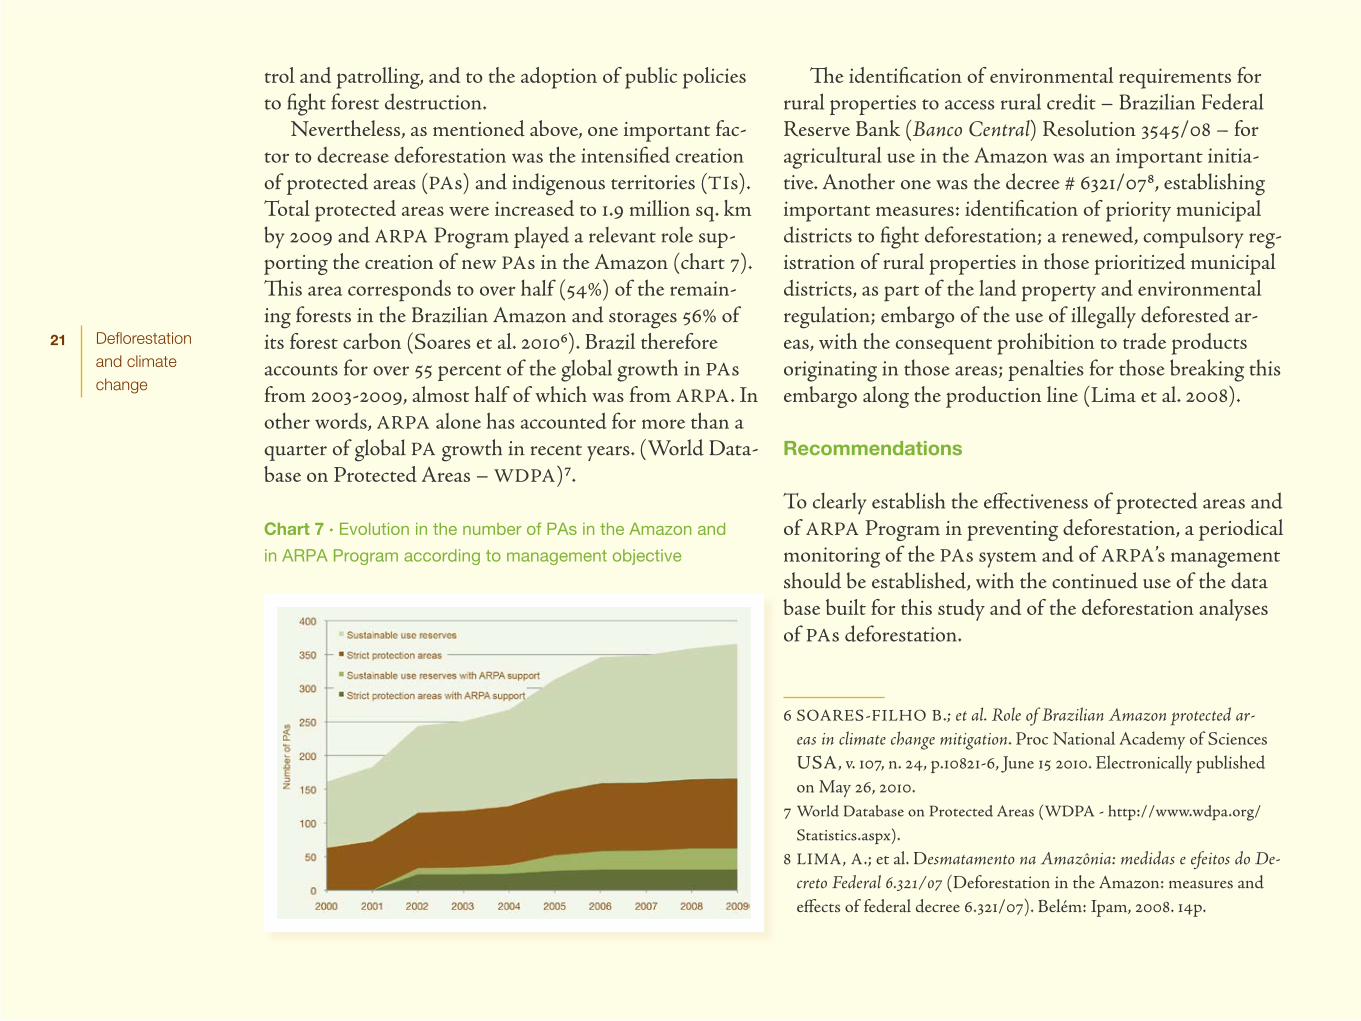
Nevertheless, as mentioned above, one important fac-tor to decrease deforestation was the intensified creation of protected areas (PAs) and indigenous territories (TIs). Total protected areas were increased to 1.9 million sq. km by 2009 and ARPA Program played a relevant role sup-porting the creation of new PAs in the Amazon (chart 7). This area corresponds to over half (54%) of the remain-ing forests in the Brazilian Amazon and storages 56% of its forest carbon (Soares et al. 20106). Brazil therefore accounts for over 55 percent of the global growth in PAs from 2003-2009, almost half of which was from ARPA. In other words, ARPA alone has accounted for more than a quarter of global PA growth in recent years. (World Data-base on Protected Areas – WDPA)7.
Chart 7 · Evolution in the number of PAs in the Amazon and
in ARPA Program according to management objective
The identification of environmental requirements for rural properties to access rural credit – Brazilian Federal Reserve Bank (Banco Central) Resolution 3545/08 – for agricultural use in the Amazon was an important initia-tive. Another one was the decree # 6321/078, establishing important measures: identification of priority municipal districts to fight deforestation; a renewed, compulsory reg-istration of rural properties in those prioritized municipal districts, as part of the land property and environmental regulation; embargo of the use of illegally deforested ar-eas, with the consequent prohibition to trade products originating in those areas; penalties for those breaking this embargo along the production line (Lima et al. 2008).
Recommendations
To clearly establish the effectiveness of protected areas and of ARPA Program in preventing deforestation, a periodical monitoring of the PAs system and of ARPA’s management should be established, with the continued use of the data base built for this study and of the deforestation analyses of PAs deforestation.
6 SOARES-FILHO B.; et al. Role of Brazilian Amazon protected ar-eas in climate change mitigation. Proc National Academy of Sciences USA, v. 107, n. 24, p.10821-6, June 15 2010. Electronically published on May 26, 2010.
7 World Database on Protected Areas (WDPA - http://www.wdpa.org/Statistics.aspx).
8 LIMA, A.; et al. Desmatamento na Amazônia: medidas e efeitos do De-creto Federal 6.321/07 (Deforestation in the Amazon: measures and effects of federal decree 6.321/07). Belém: Ipam, 2008. 14p.
22 Deflorestation and climate change
Stop Amazon deforestation is a challenge requiring constant surveillance and creativeness in strategy design to establish a sustainable development model based on keep-ing the forest standing. Should the demand for meat and soy regain the accelerated expansion rhythm broken by the recent global economic crisis, and if the profit from con-verting forests into agricultural and livestock use increases once again, the trend will be increased deforestation. In order to stop that from happening, it is necessary to inte-grate public policies with private sector policies, seeking to promote the following: •Surveillance and patrol actions to effectively detect and
fight deforestation fronts, continuously improving moni-toring systems and environmental patrolling.
•Attribute value to the forest asset, through forest sus-tainable management.
•Sustainable agroforestry systems for small properties and traditional population, through multi-function agriculture
and agroecology in order to decrease forest conversion. •Maintain the flow of protected areas creation and inten-
sify the implementation process in those areas.•Good practices and responsible production systems in
soy plantations and cattle ranching. Regularized proper-ties ought to be valued and encouraged.
•Increase cattle ranching productivity to weaken its role as the main inducer of opening new areas (as it has been in the past two decades).
•Offset systems and payments for environmental services focusing on the decrease of emissions and climate stabil-ity, in order to ensure correct benefit sharing among all the involved actors.
•Rigorous penalty for trading products from illegally de-forested areas, as well as from areas under embargo and along the various links in the chain of custody.
•Intensification of land ordering policies, particularly through the implementation of agroecological zoning. To ensure conservation of representative biodiversity and to induce a compatible land use with the agronomic potential in each region.
In the 2nd Phase of the Program, extending until 2015, the target is to support the creation of 135 thousand sq. km of PAs and to implement another 320 thousand sq. km of pre-existing PAs. Moreover, ARPA intends to raise 100 million US dollars for the Protected Areas Fund (FAP). A Program with such a degree of ambition and resources involved requires constant and long term monitoring and analysis of its effectiveness in reducing deforestation. J
uan
Pra
tgin
esto
s /
WW
F-C
anon
23 Deflorestation and climate change
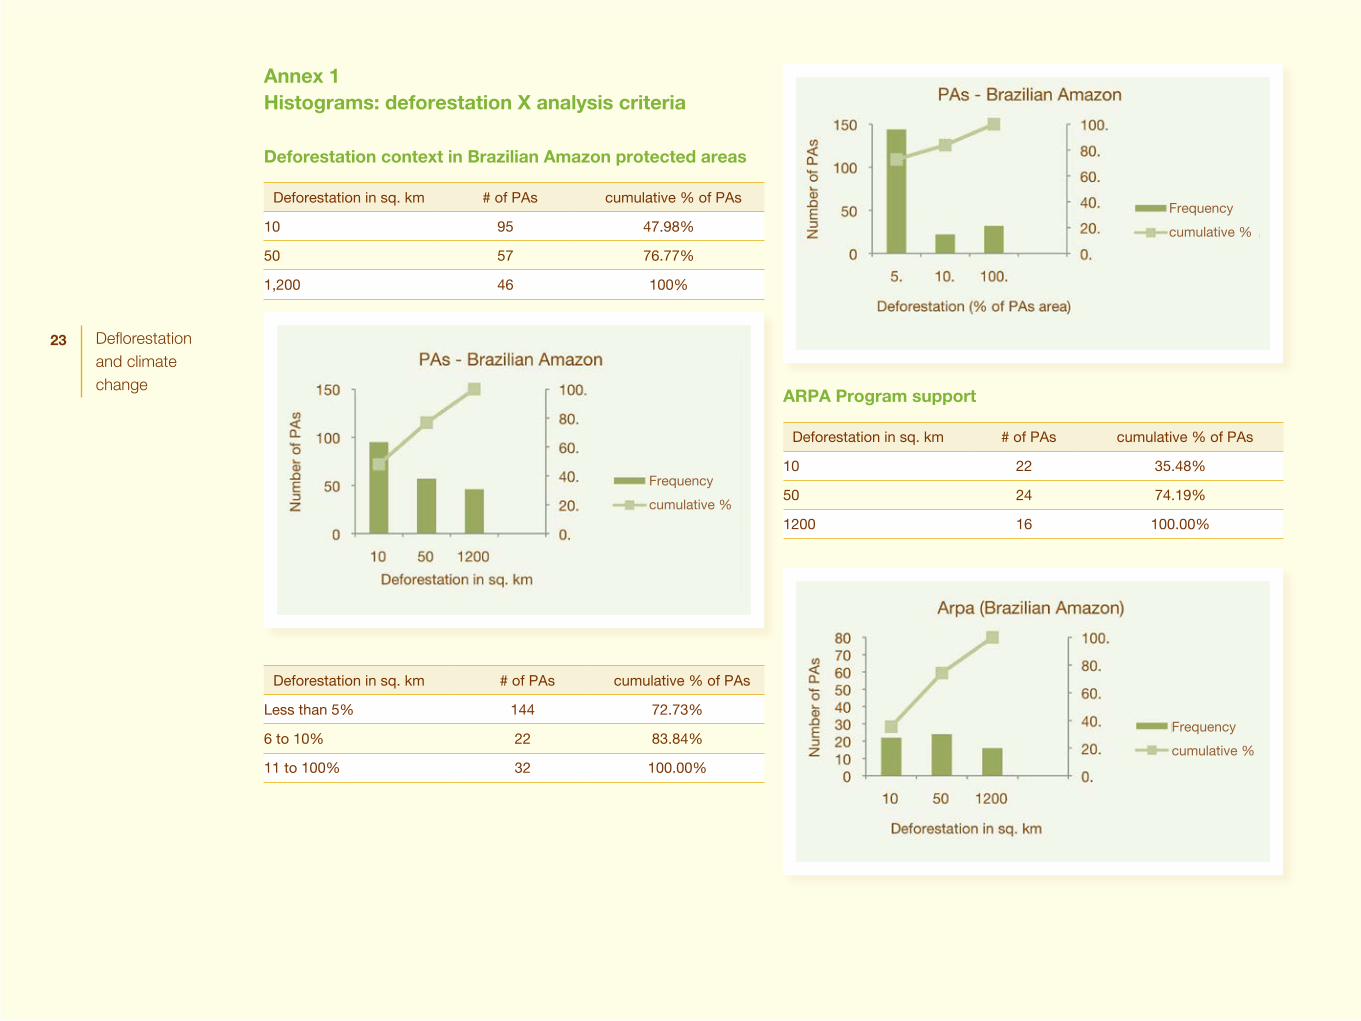
Annex 1Histograms: deforestation X analysis criteria
Deforestation context in Brazilian Amazon protected areas
Deforestation in sq. km # of PAs cumulative % of PAs
10 95 47.98%
50 57 76.77%
1,200 46 100%
Deforestation in sq. km # of PAs cumulative % of PAs
Less than 5% 144 72.73%
6 to 10% 22 83.84%
11 to 100% 32 100.00%
ARPA Program support
Deforestation in sq. km # of PAs cumulative % of PAs
10 22 35.48%
50 24 74.19%
1200 16 100.00%
Frequency
cumulative %
Frequency
cumulative %
Frequency
cumulative %
24 Deflorestation and climate change
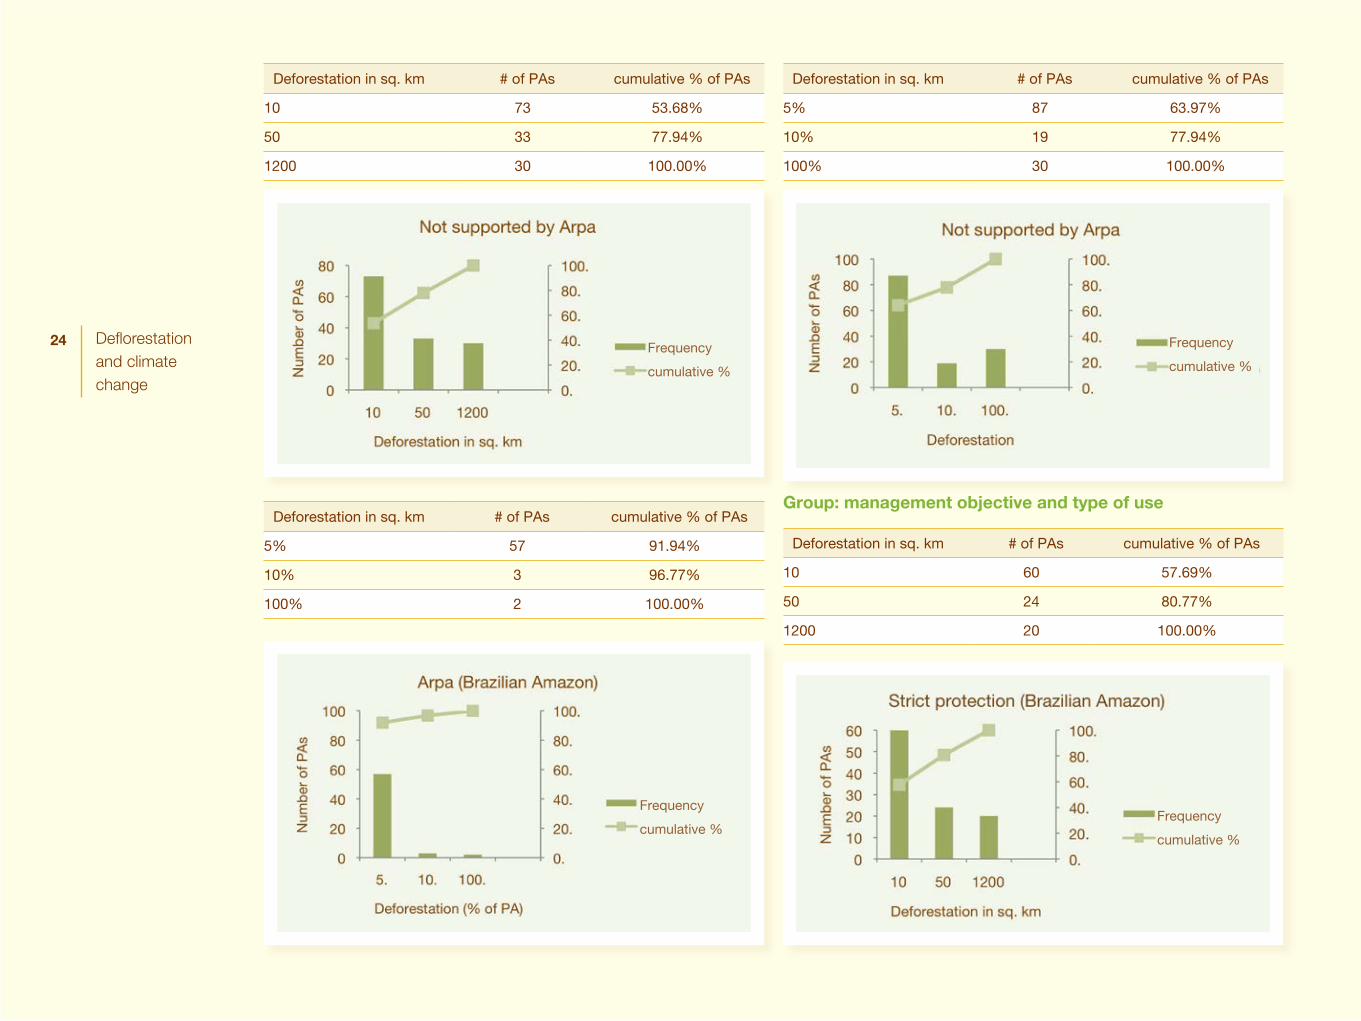
Deforestation in sq. km # of PAs cumulative % of PAs
5% 87 63.97%
10% 19 77.94%
100% 30 100.00%
Group: management objective and type of use
Deforestation in sq. km # of PAs cumulative % of PAs
10 60 57.69%
50 24 80.77%
1200 20 100.00%
Deforestation in sq. km # of PAs cumulative % of PAs
10 73 53.68%
50 33 77.94%
1200 30 100.00%
Deforestation in sq. km # of PAs cumulative % of PAs
5% 57 91.94%
10% 3 96.77%
100% 2 100.00%
Frequency
cumulative %
Frequency
cumulative %
Frequency
cumulative %Frequency
cumulative %
25 Deflorestation and climate change
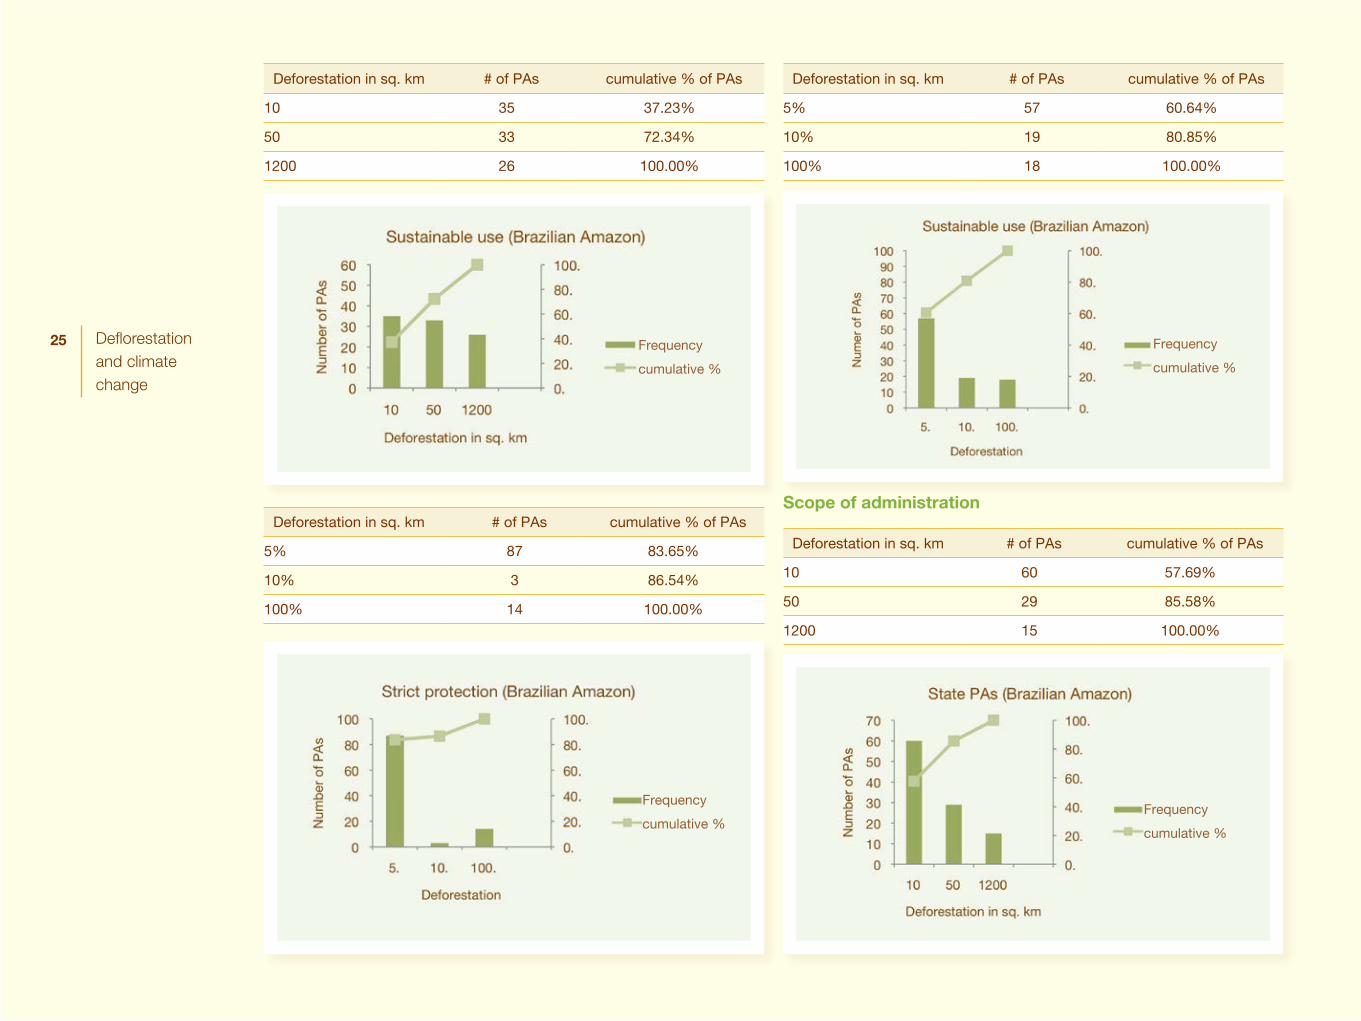
Deforestation in sq. km # of PAs cumulative % of PAs
10 35 37.23%
50 33 72.34%
1200 26 100.00%
Deforestation in sq. km # of PAs cumulative % of PAs
5% 87 83.65%
10% 3 86.54%
100% 14 100.00%
Deforestation in sq. km # of PAs cumulative % of PAs
5% 57 60.64%
10% 19 80.85%
100% 18 100.00%
Scope of administration
Deforestation in sq. km # of PAs cumulative % of PAs
10 60 57.69%
50 29 85.58%
1200 15 100.00%
Frequency
cumulative %
Frequency
cumulative %
Frequency
cumulative %Frequency
cumulative %
26 Deflorestation and climate change
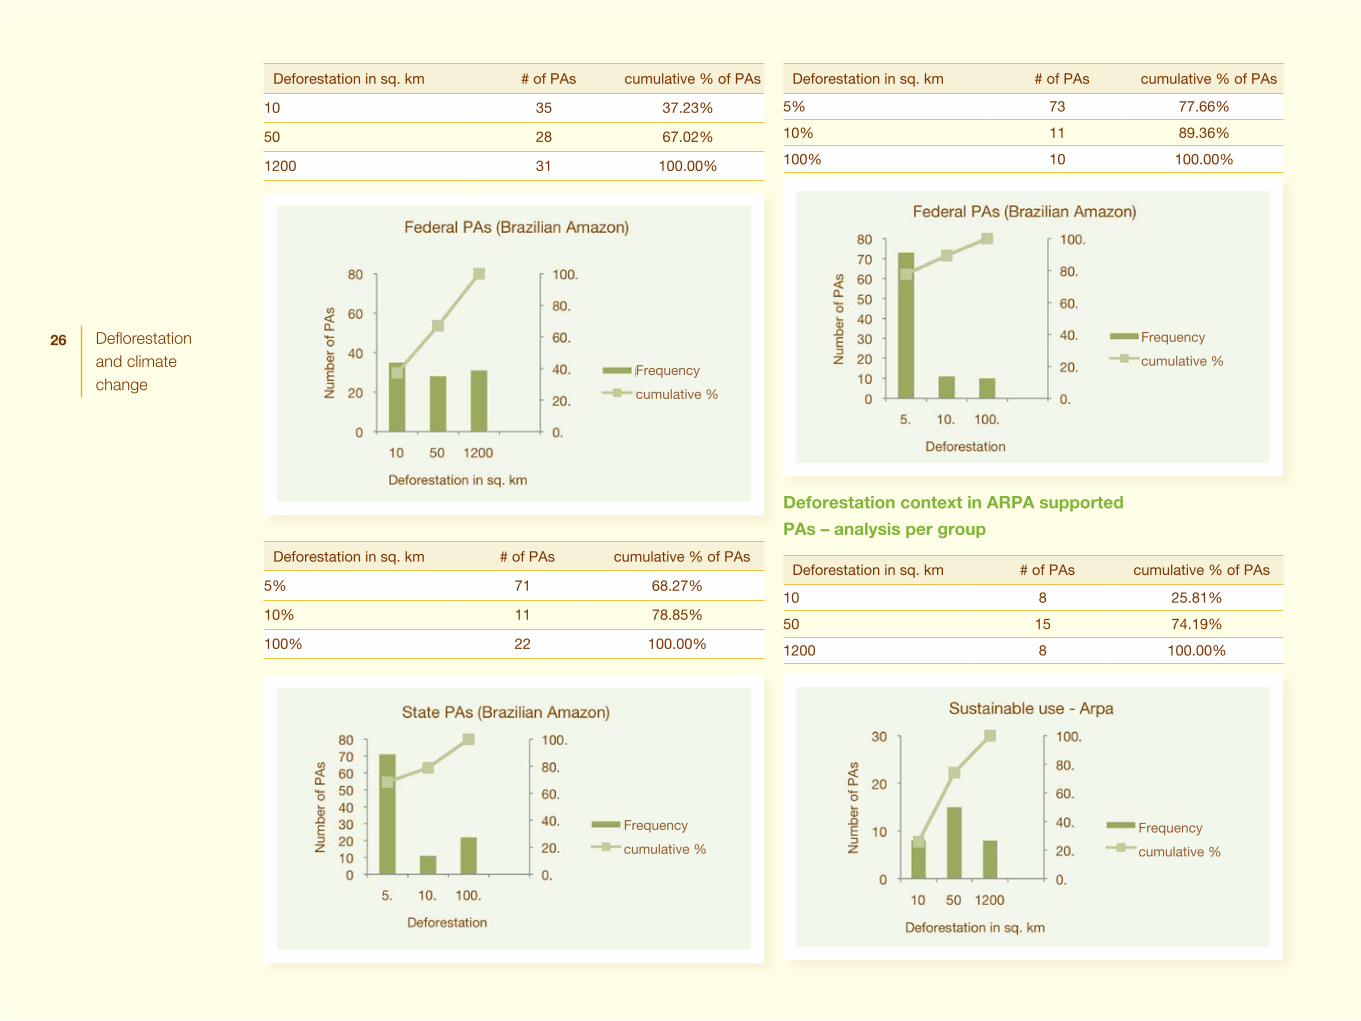
Deforestation in sq. km # of PAs cumulative % of PAs
10 35 37.23%
50 28 67.02%
1200 31 100.00%
Deforestation in sq. km # of PAs cumulative % of PAs
5% 71 68.27%
10% 11 78.85%
100% 22 100.00%
Deforestation in sq. km # of PAs cumulative % of PAs
5% 73 77.66%
10% 11 89.36%
100% 10 100.00%
Deforestation context in ARPA supported
PAs – analysis per group
Deforestation in sq. km # of PAs cumulative % of PAs
10 8 25.81%
50 15 74.19%
1200 8 100.00%
Frequency
cumulative %
Frequency
cumulative %
Frequency
cumulative %
Frequency
cumulative %
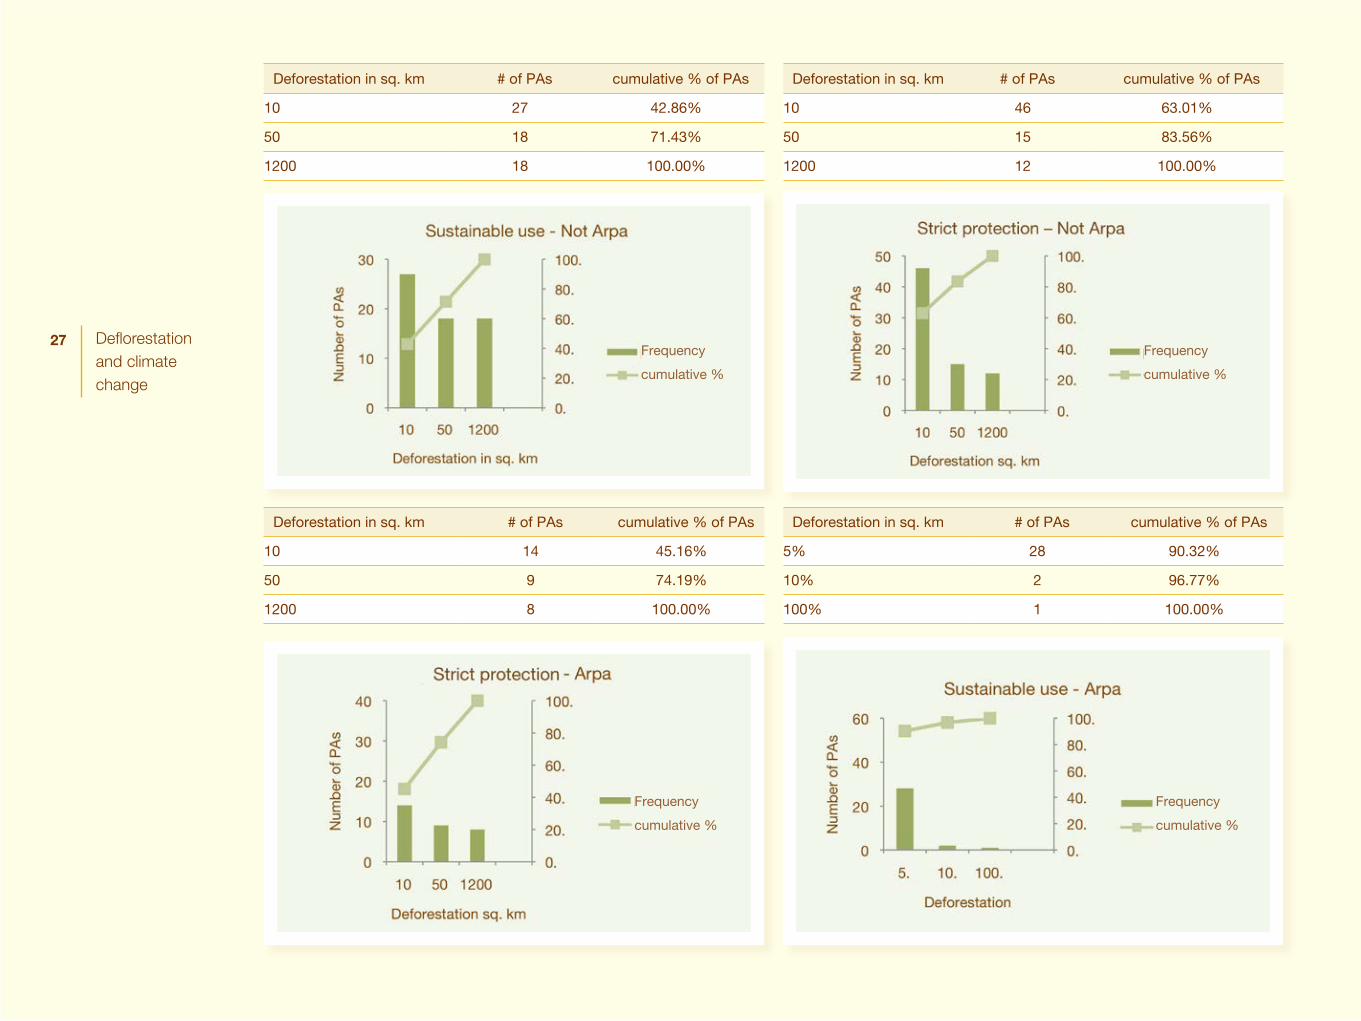
27 Deflorestation and climate change
Deforestation in sq. km # of PAs cumulative % of PAs
10 27 42.86%
50 18 71.43%
1200 18 100.00%
Deforestation in sq. km # of PAs cumulative % of PAs
10 14 45.16%
50 9 74.19%
1200 8 100.00%
Deforestation in sq. km # of PAs cumulative % of PAs
10 46 63.01%
50 15 83.56%
1200 12 100.00%
Deforestation in sq. km # of PAs cumulative % of PAs
5% 28 90.32%
10% 2 96.77%
100% 1 100.00%
Frequency
cumulative %
Frequency
cumulative %
Frequency
cumulative %
Frequency
cumulative %
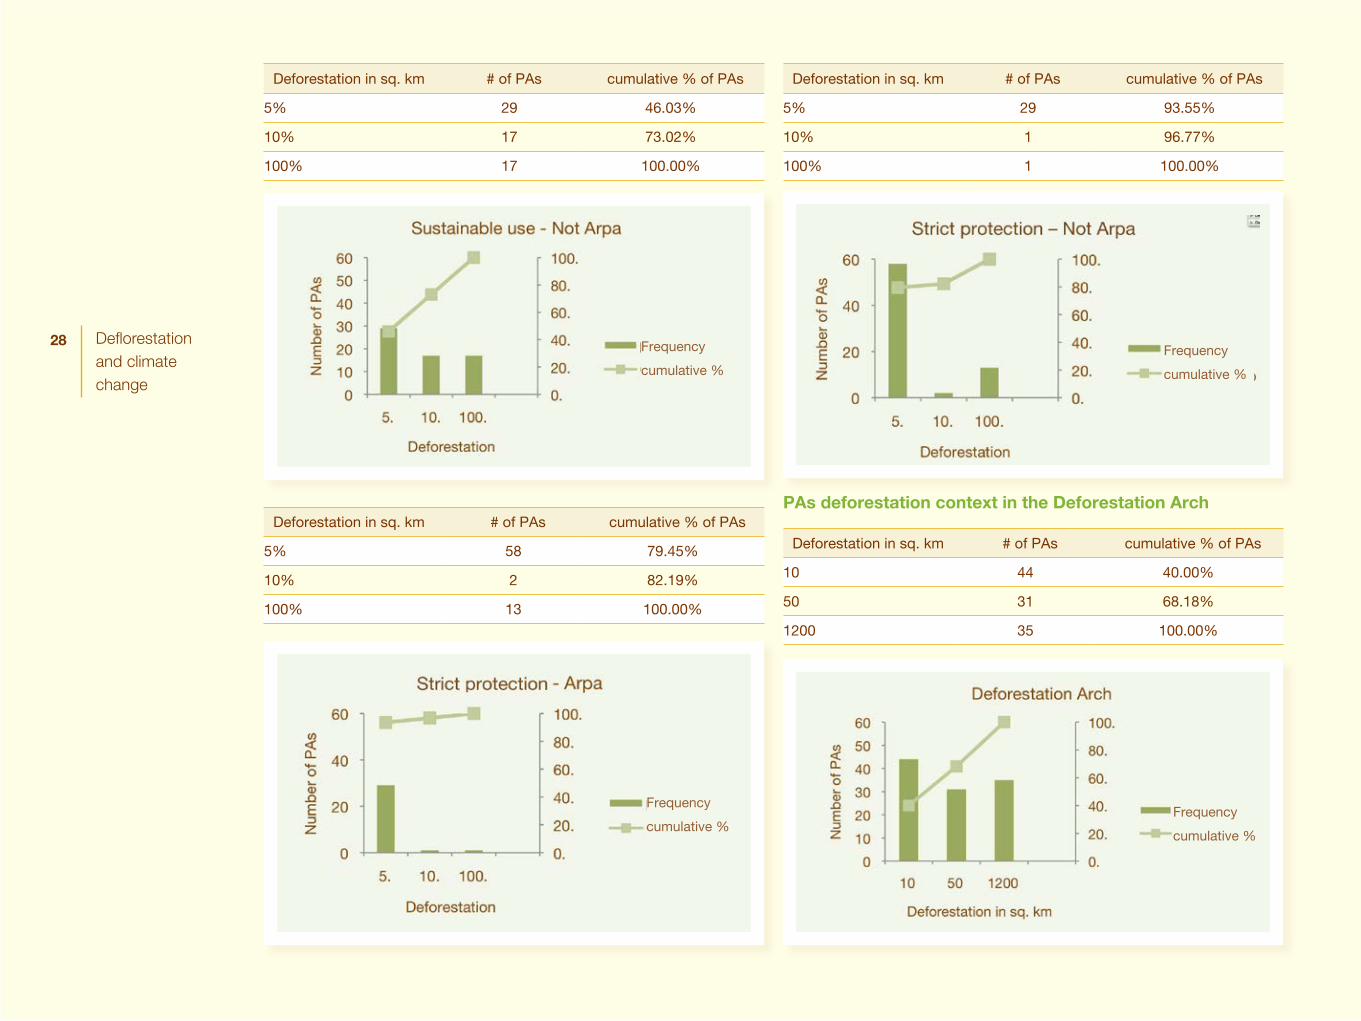
28 Deflorestation and climate change
Deforestation in sq. km # of PAs cumulative % of PAs
5% 29 46.03%
10% 17 73.02%
100% 17 100.00%
Deforestation in sq. km # of PAs cumulative % of PAs
5% 58 79.45%
10% 2 82.19%
100% 13 100.00%
Deforestation in sq. km # of PAs cumulative % of PAs
5% 29 93.55%
10% 1 96.77%
100% 1 100.00%
PAs deforestation context in the Deforestation Arch
Deforestation in sq. km # of PAs cumulative % of PAs
10 44 40.00%
50 31 68.18%
1200 35 100.00%
Frequency
cumulative %
Frequency
cumulative %
Frequency
cumulative %Frequency
cumulative %
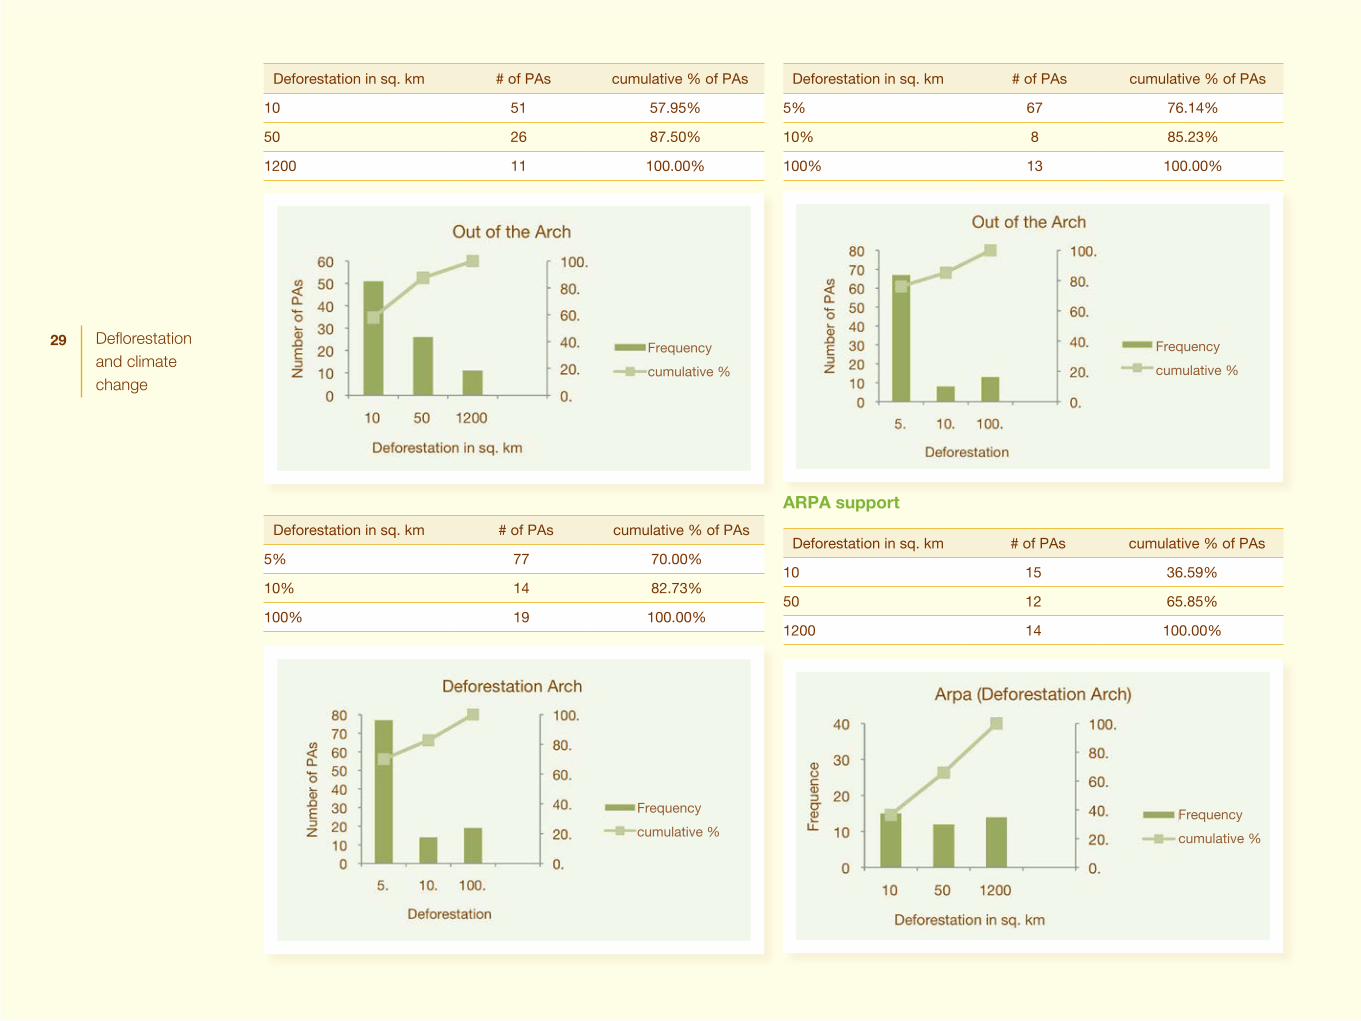
29 Deflorestation and climate change
Deforestation in sq. km # of PAs cumulative % of PAs
10 51 57.95%
50 26 87.50%
1200 11 100.00%
Deforestation in sq. km # of PAs cumulative % of PAs
5% 77 70.00%
10% 14 82.73%
100% 19 100.00%
Deforestation in sq. km # of PAs cumulative % of PAs
5% 67 76.14%
10% 8 85.23%
100% 13 100.00%
ARPA support
Deforestation in sq. km # of PAs cumulative % of PAs
10 15 36.59%
50 12 65.85%
1200 14 100.00%
Frequency
cumulative %
Frequency
cumulative %
Frequency
cumulative %Frequency
cumulative %
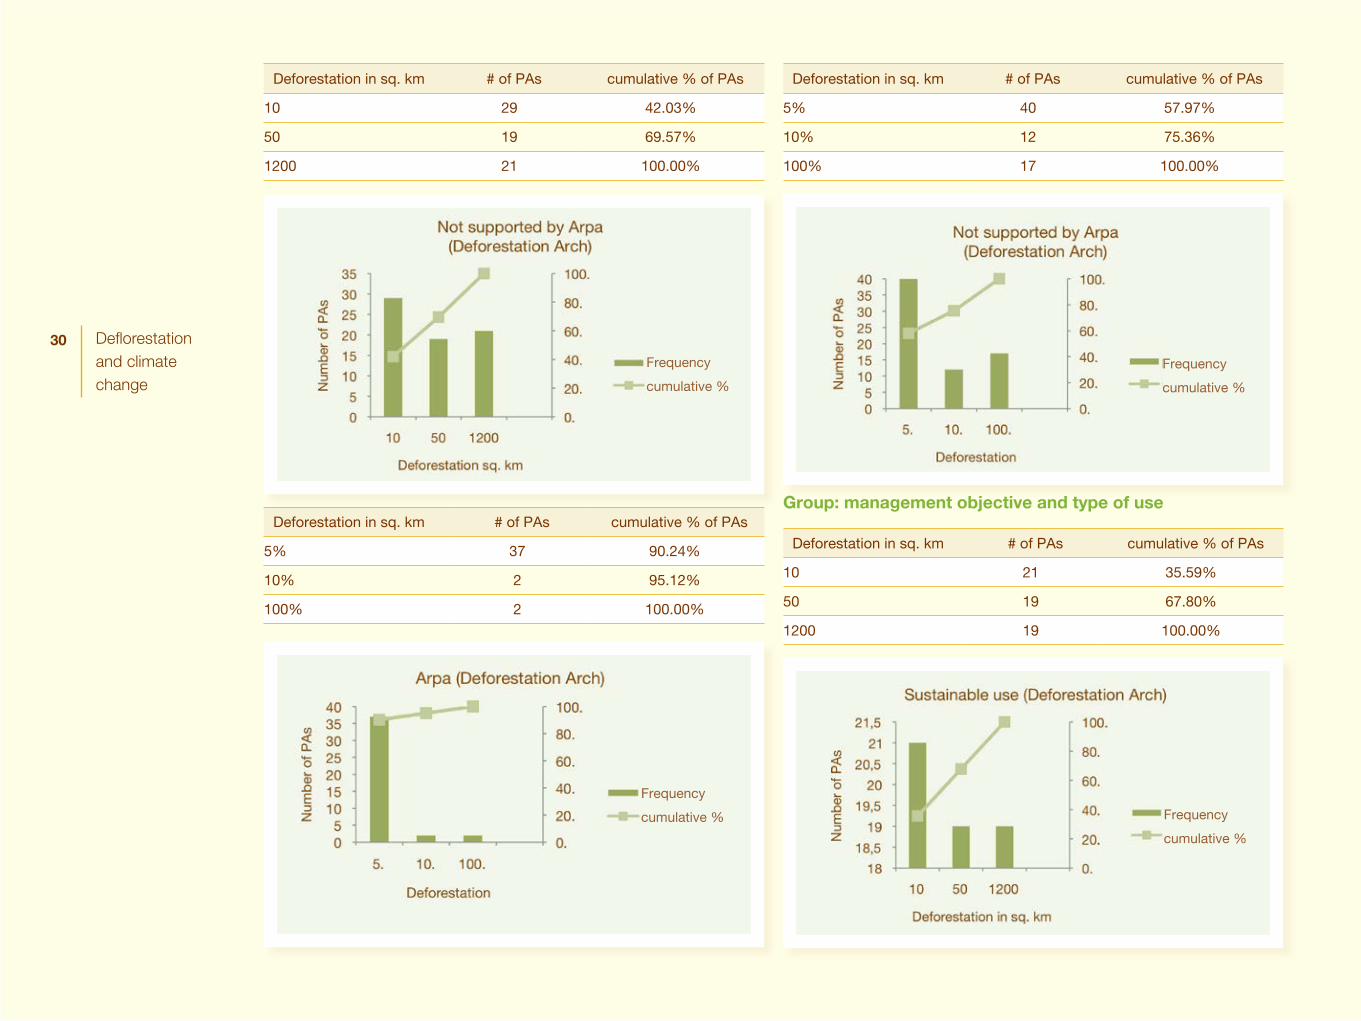
30 Deflorestation and climate change
Deforestation in sq. km # of PAs cumulative % of PAs
10 29 42.03%
50 19 69.57%
1200 21 100.00%
Deforestation in sq. km # of PAs cumulative % of PAs
5% 37 90.24%
10% 2 95.12%
100% 2 100.00%
Deforestation in sq. km # of PAs cumulative % of PAs
5% 40 57.97%
10% 12 75.36%
100% 17 100.00%
Group: management objective and type of use
Deforestation in sq. km # of PAs cumulative % of PAs
10 21 35.59%
50 19 67.80%
1200 19 100.00%
Frequency
cumulative %
Frequency
cumulative %
Frequency
cumulative % Frequency
cumulative %
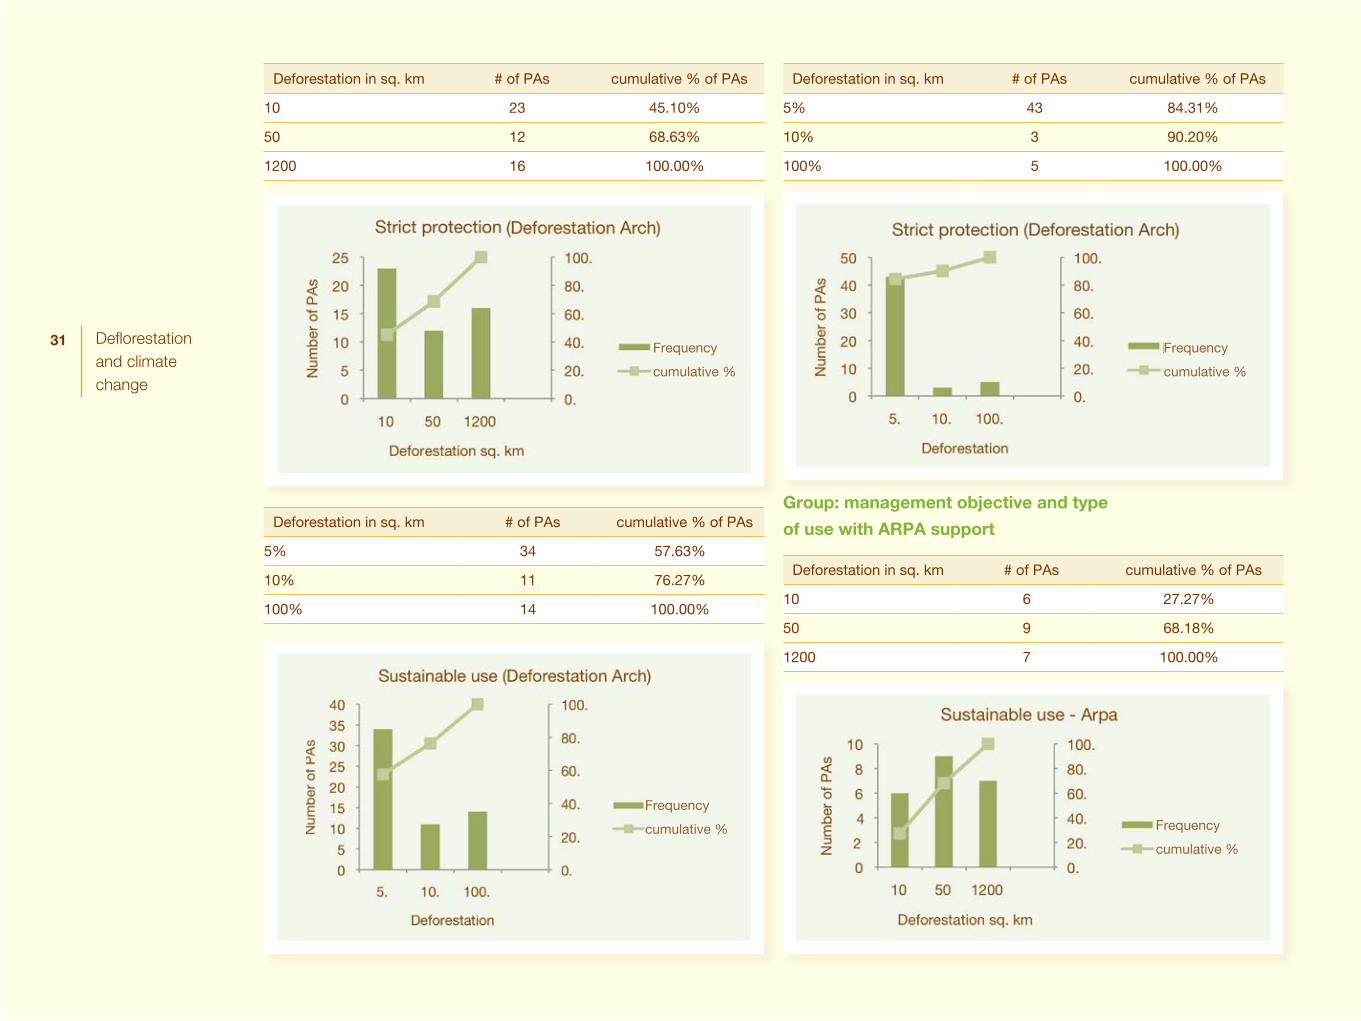
31 Deflorestation and climate change
Deforestation in sq. km # of PAs cumulative % of PAs
10 23 45.10%
50 12 68.63%
1200 16 100.00%
Deforestation in sq. km # of PAs cumulative % of PAs
5% 34 57.63%
10% 11 76.27%
100% 14 100.00%
Deforestation in sq. km # of PAs cumulative % of PAs
5% 43 84.31%
10% 3 90.20%
100% 5 100.00%
Group: management objective and type
of use with ARPA support
Deforestation in sq. km # of PAs cumulative % of PAs
10 6 27.27%
50 9 68.18%
1200 7 100.00%
Frequency
cumulative %
Frequency
cumulative %
Frequency
cumulative % Frequency
cumulative %
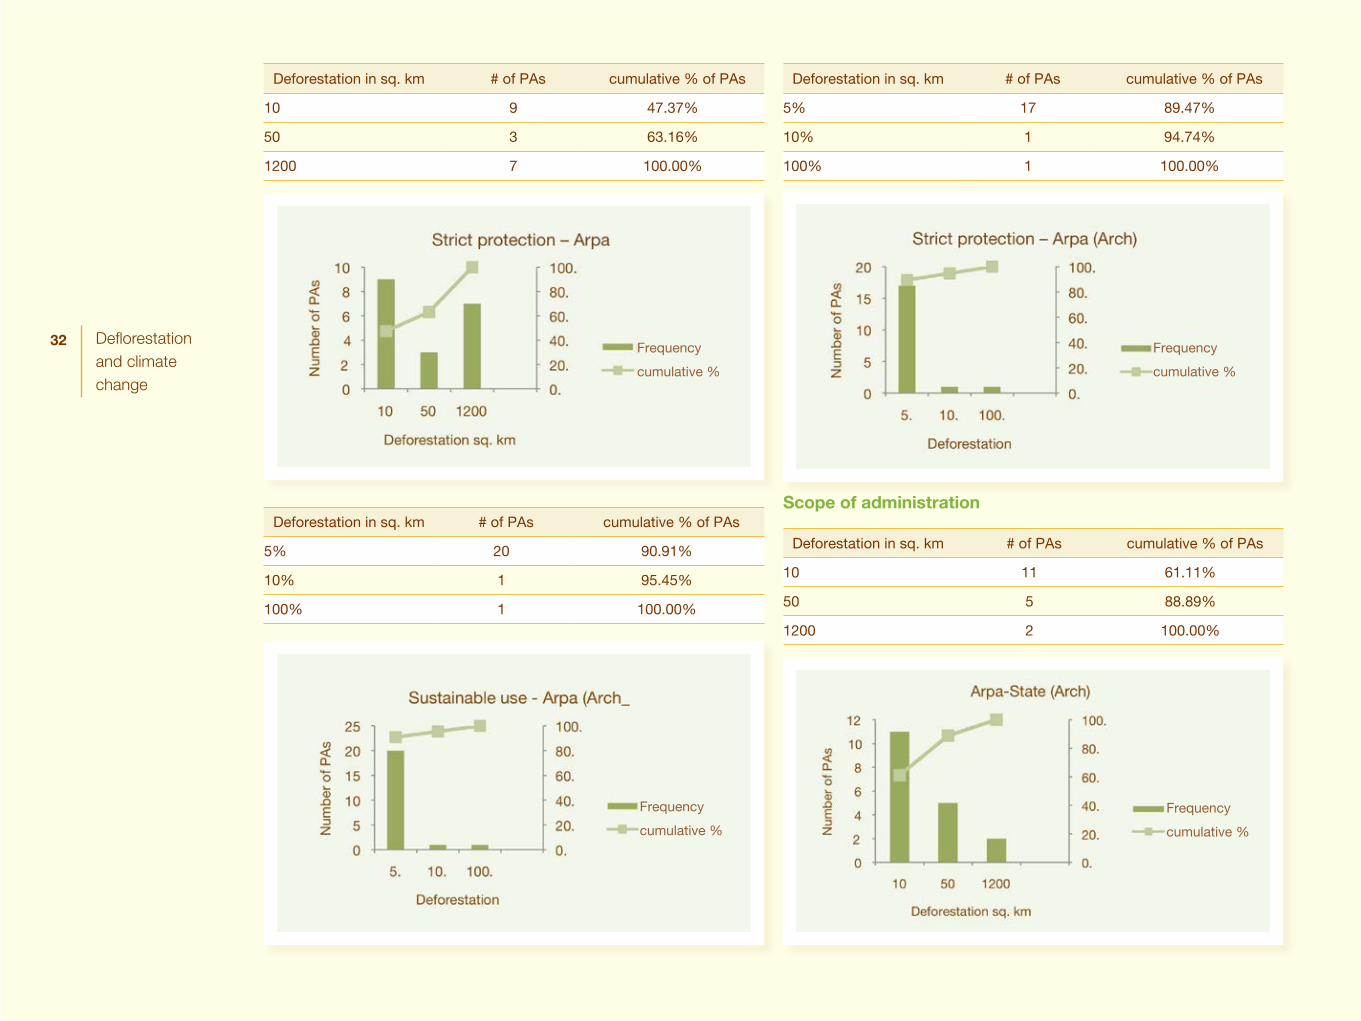
32 Deflorestation and climate change
Deforestation in sq. km # of PAs cumulative % of PAs
10 9 47.37%
50 3 63.16%
1200 7 100.00%
Deforestation in sq. km # of PAs cumulative % of PAs
5% 20 90.91%
10% 1 95.45%
100% 1 100.00%
Deforestation in sq. km # of PAs cumulative % of PAs
5% 17 89.47%
10% 1 94.74%
100% 1 100.00%
Scope of administration
Deforestation in sq. km # of PAs cumulative % of PAs
10 11 61.11%
50 5 88.89%
1200 2 100.00%
Frequency
cumulative %
Frequency
cumulative %
Frequency
cumulative %
Frequency
cumulative %
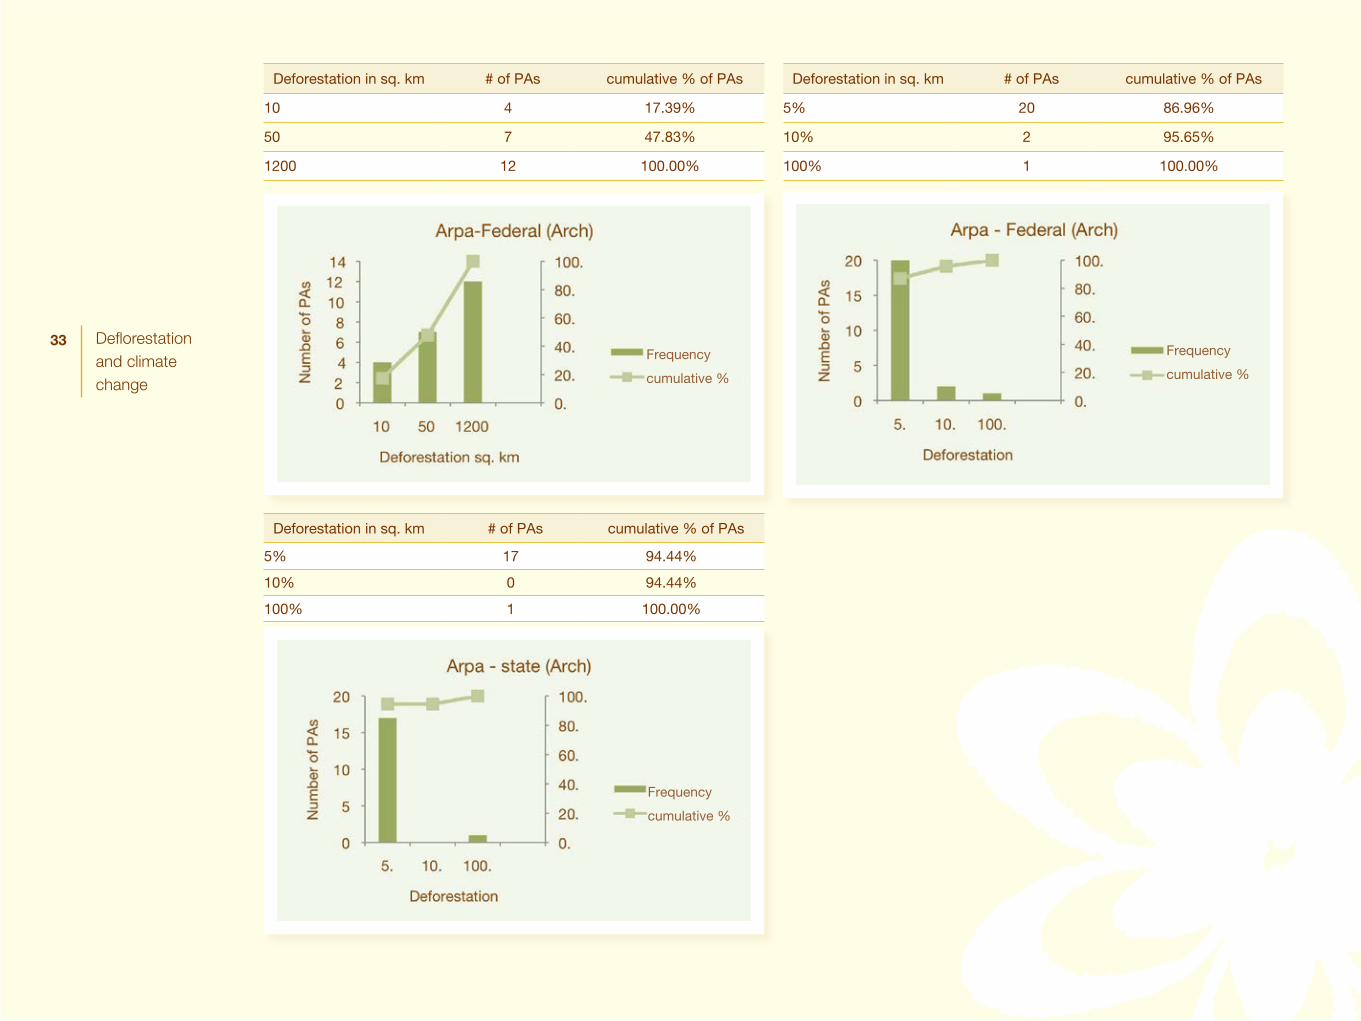
33 Deflorestation and climate change
Deforestation in sq. km # of PAs cumulative % of PAs
10 4 17.39%
50 7 47.83%
1200 12 100.00%
Deforestation in sq. km # of PAs cumulative % of PAs
5% 17 94.44%
10% 0 94.44%
100% 1 100.00%
Deforestation in sq. km # of PAs cumulative % of PAs
5% 20 86.96%
10% 2 95.65%
100% 1 100.00%
Frequency
cumulative %
Frequency
cumulative %
Frequency
cumulative %
34 Deflorestation and climate change
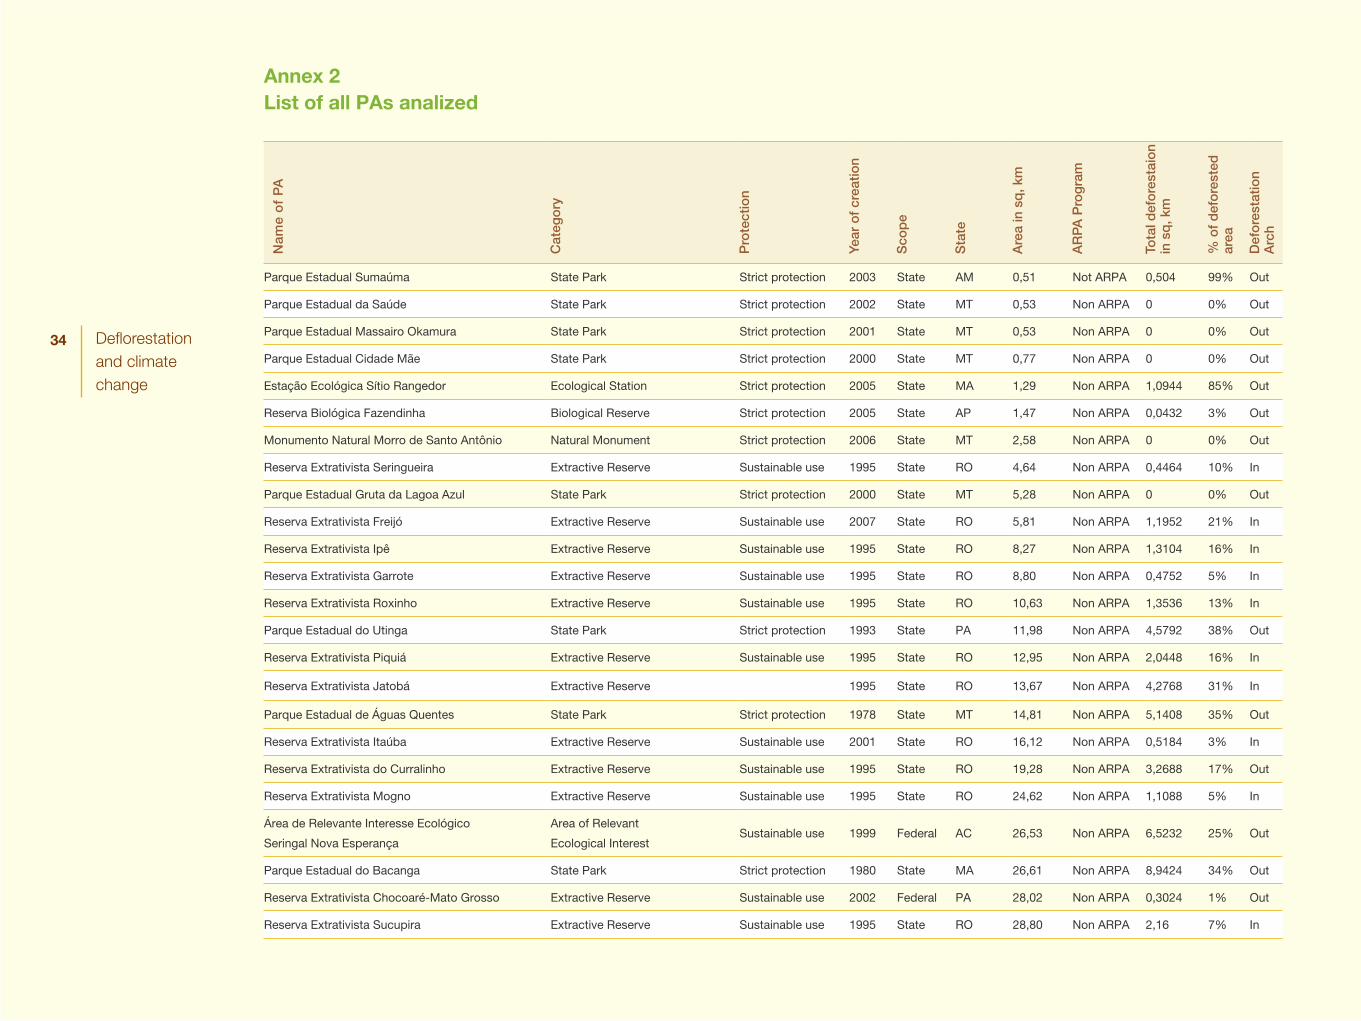
Annex 2List of all PAs analized
Nam
e o
f P
A
Cat
ego
ry
Pro
tect
ion
Year
of
crea
tion
Sco
pe
Sta
te
Are
a in
sq
, km
AR
PA
Pro
gra
m
Tota
l def
ore
stai
on
in s
q, k
m
% o
f d
efo
rest
ed
area
Def
ore
stat
ion
Arc
h
Parque Estadual Sumaúma State Park Strict protection 2003 State AM 0,51 Not ARPA 0,504 99% Out
Parque Estadual da Saúde State Park Strict protection 2002 State MT 0,53 Non ARPA 0 0% Out
Parque Estadual Massairo Okamura State Park Strict protection 2001 State MT 0,53 Non ARPA 0 0% Out
Parque Estadual Cidade Mãe State Park Strict protection 2000 State MT 0,77 Non ARPA 0 0% Out
Estação Ecológica Sítio Rangedor Ecological Station Strict protection 2005 State MA 1,29 Non ARPA 1,0944 85% Out
Reserva Biológica Fazendinha Biological Reserve Strict protection 2005 State AP 1,47 Non ARPA 0,0432 3% Out
Monumento Natural Morro de Santo Antônio Natural Monument Strict protection 2006 State MT 2,58 Non ARPA 0 0% Out
Reserva Extrativista Seringueira Extractive Reserve Sustainable use 1995 State RO 4,64 Non ARPA 0,4464 10% In
Parque Estadual Gruta da Lagoa Azul State Park Strict protection 2000 State MT 5,28 Non ARPA 0 0% Out
Reserva Extrativista Freijó Extractive Reserve Sustainable use 2007 State RO 5,81 Non ARPA 1,1952 21% In
Reserva Extrativista Ipê Extractive Reserve Sustainable use 1995 State RO 8,27 Non ARPA 1,3104 16% In
Reserva Extrativista Garrote Extractive Reserve Sustainable use 1995 State RO 8,80 Non ARPA 0,4752 5% In
Reserva Extrativista Roxinho Extractive Reserve Sustainable use 1995 State RO 10,63 Non ARPA 1,3536 13% In
Parque Estadual do Utinga State Park Strict protection 1993 State PA 11,98 Non ARPA 4,5792 38% Out
Reserva Extrativista Piquiá Extractive Reserve Sustainable use 1995 State RO 12,95 Non ARPA 2,0448 16% In
Reserva Extrativista Jatobá Extractive Reserve 1995 State RO 13,67 Non ARPA 4,2768 31% In
Parque Estadual de Águas Quentes State Park Strict protection 1978 State MT 14,81 Non ARPA 5,1408 35% Out
Reserva Extrativista Itaúba Extractive Reserve Sustainable use 2001 State RO 16,12 Non ARPA 0,5184 3% In
Reserva Extrativista do Curralinho Extractive Reserve Sustainable use 1995 State RO 19,28 Non ARPA 3,2688 17% Out
Reserva Extrativista Mogno Extractive Reserve Sustainable use 1995 State RO 24,62 Non ARPA 1,1088 5% In
Área de Relevante Interesse Ecológico
Seringal Nova Esperança
Area of Relevant
Ecological InterestSustainable use 1999 Federal AC 26,53 Non ARPA 6,5232 25% Out
Parque Estadual do Bacanga State Park Strict protection 1980 State MA 26,61 Non ARPA 8,9424 34% Out
Reserva Extrativista Chocoaré-Mato Grosso Extractive Reserve Sustainable use 2002 Federal PA 28,02 Non ARPA 0,3024 1% Out
Reserva Extrativista Sucupira Extractive Reserve Sustainable use 1995 State RO 28,80 Non ARPA 2,16 7% In
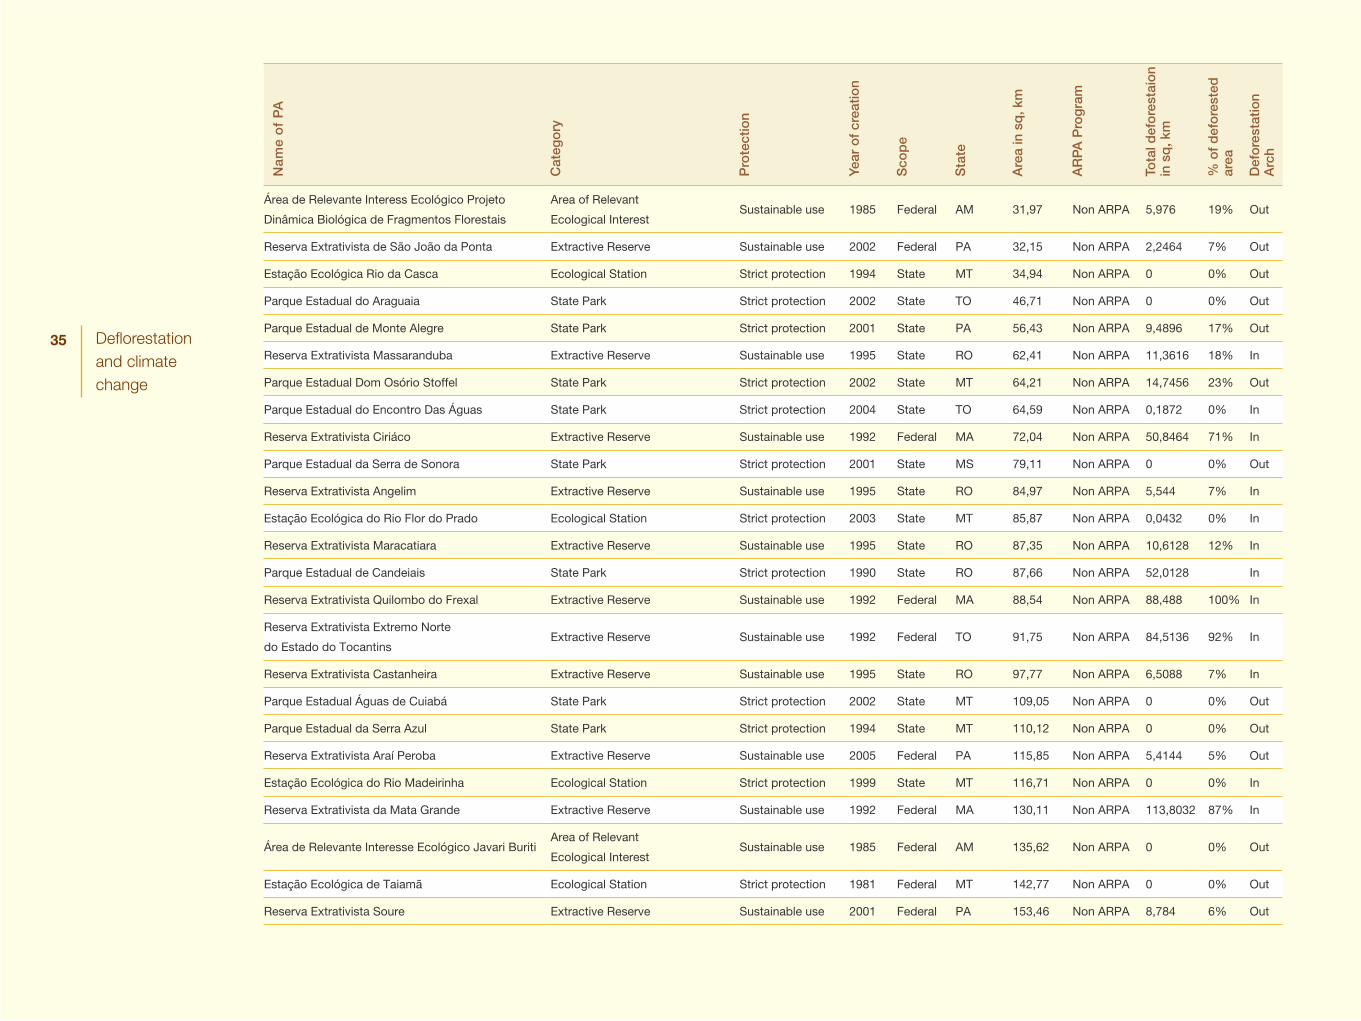
35 Deflorestation and climate change
Nam
e o
f P
A
Cat
ego
ry
Pro
tect
ion
Year
of
crea
tion
Sco
pe
Sta
te
Are
a in
sq
, km
AR
PA
Pro
gra
m
Tota
l def
ore
stai
on
in s
q, k
m
% o
f d
efo
rest
ed
area
Def
ore
stat
ion
Arc
h
Área de Relevante Interess Ecológico Projeto
Dinâmica Biológica de Fragmentos Florestais
Area of Relevant
Ecological InterestSustainable use 1985 Federal AM 31,97 Non ARPA 5,976 19% Out
Reserva Extrativista de São João da Ponta Extractive Reserve Sustainable use 2002 Federal PA 32,15 Non ARPA 2,2464 7% Out
Estação Ecológica Rio da Casca Ecological Station Strict protection 1994 State MT 34,94 Non ARPA 0 0% Out
Parque Estadual do Araguaia State Park Strict protection 2002 State TO 46,71 Non ARPA 0 0% Out
Parque Estadual de Monte Alegre State Park Strict protection 2001 State PA 56,43 Non ARPA 9,4896 17% Out
Reserva Extrativista Massaranduba Extractive Reserve Sustainable use 1995 State RO 62,41 Non ARPA 11,3616 18% In
Parque Estadual Dom Osório Stoffel State Park Strict protection 2002 State MT 64,21 Non ARPA 14,7456 23% Out
Parque Estadual do Encontro Das Águas State Park Strict protection 2004 State TO 64,59 Non ARPA 0,1872 0% In
Reserva Extrativista Ciriáco Extractive Reserve Sustainable use 1992 Federal MA 72,04 Non ARPA 50,8464 71% In
Parque Estadual da Serra de Sonora State Park Strict protection 2001 State MS 79,11 Non ARPA 0 0% Out
Reserva Extrativista Angelim Extractive Reserve Sustainable use 1995 State RO 84,97 Non ARPA 5,544 7% In
Estação Ecológica do Rio Flor do Prado Ecological Station Strict protection 2003 State MT 85,87 Non ARPA 0,0432 0% In
Reserva Extrativista Maracatiara Extractive Reserve Sustainable use 1995 State RO 87,35 Non ARPA 10,6128 12% In
Parque Estadual de Candeiais State Park Strict protection 1990 State RO 87,66 Non ARPA 52,0128 In
Reserva Extrativista Quilombo do Frexal Extractive Reserve Sustainable use 1992 Federal MA 88,54 Non ARPA 88,488 100% In
Reserva Extrativista Extremo Norte
do Estado do TocantinsExtractive Reserve Sustainable use 1992 Federal TO 91,75 Non ARPA 84,5136 92% In
Reserva Extrativista Castanheira Extractive Reserve Sustainable use 1995 State RO 97,77 Non ARPA 6,5088 7% In
Parque Estadual Águas de Cuiabá State Park Strict protection 2002 State MT 109,05 Non ARPA 0 0% Out
Parque Estadual da Serra Azul State Park Strict protection 1994 State MT 110,12 Non ARPA 0 0% Out
Reserva Extrativista Araí Peroba Extractive Reserve Sustainable use 2005 Federal PA 115,85 Non ARPA 5,4144 5% Out
Estação Ecológica do Rio Madeirinha Ecological Station Strict protection 1999 State MT 116,71 Non ARPA 0 0% In
Reserva Extrativista da Mata Grande Extractive Reserve Sustainable use 1992 Federal MA 130,11 Non ARPA 113,8032 87% In
Área de Relevante Interesse Ecológico Javari BuritiArea of Relevant
Ecological InterestSustainable use 1985 Federal AM 135,62 Non ARPA 0 0% Out
Estação Ecológica de Taiamã Ecological Station Strict protection 1981 Federal MT 142,77 Non ARPA 0 0% Out
Reserva Extrativista Soure Extractive Reserve Sustainable use 2001 Federal PA 153,46 Non ARPA 8,784 6% Out
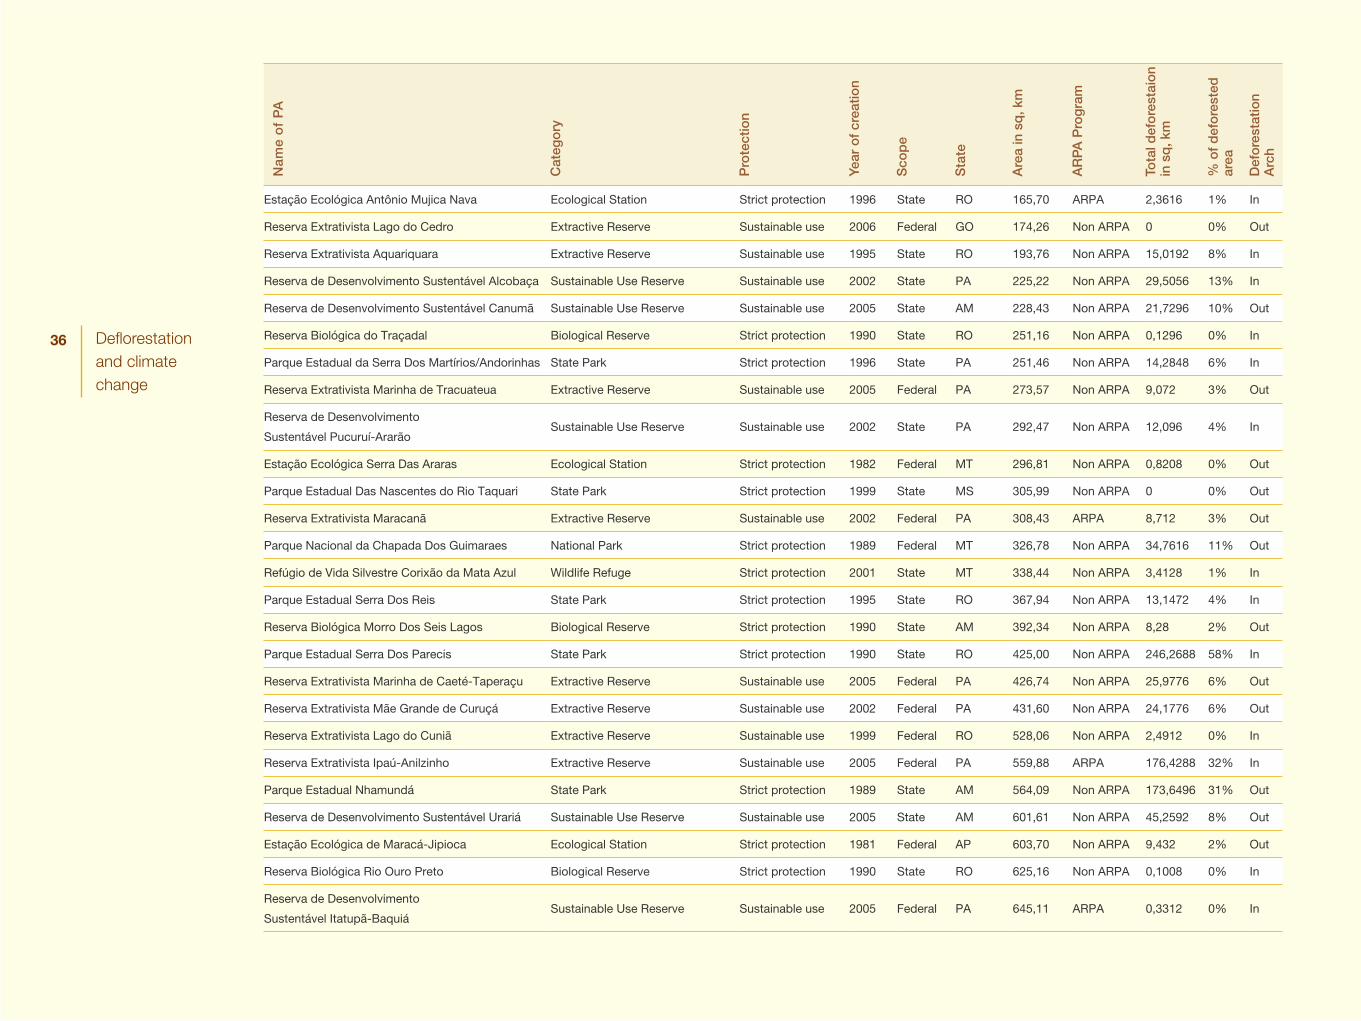
36 Deflorestation and climate change
Nam
e o
f P
A
Cat
ego
ry
Pro
tect
ion
Year
of
crea
tion
Sco
pe
Sta
te
Are
a in
sq
, km
AR
PA
Pro
gra
m
Tota
l def
ore
stai
on
in s
q, k
m
% o
f d
efo
rest
ed
area
Def
ore
stat
ion
Arc
h
Estação Ecológica Antônio Mujica Nava Ecological Station Strict protection 1996 State RO 165,70 ARPA 2,3616 1% In
Reserva Extrativista Lago do Cedro Extractive Reserve Sustainable use 2006 Federal GO 174,26 Non ARPA 0 0% Out
Reserva Extrativista Aquariquara Extractive Reserve Sustainable use 1995 State RO 193,76 Non ARPA 15,0192 8% In
Reserva de Desenvolvimento Sustentável Alcobaça Sustainable Use Reserve Sustainable use 2002 State PA 225,22 Non ARPA 29,5056 13% In
Reserva de Desenvolvimento Sustentável Canumã Sustainable Use Reserve Sustainable use 2005 State AM 228,43 Non ARPA 21,7296 10% Out
Reserva Biológica do Traçadal Biological Reserve Strict protection 1990 State RO 251,16 Non ARPA 0,1296 0% In
Parque Estadual da Serra Dos Martírios/Andorinhas State Park Strict protection 1996 State PA 251,46 Non ARPA 14,2848 6% In
Reserva Extrativista Marinha de Tracuateua Extractive Reserve Sustainable use 2005 Federal PA 273,57 Non ARPA 9,072 3% Out
Reserva de Desenvolvimento
Sustentável Pucuruí-ArarãoSustainable Use Reserve Sustainable use 2002 State PA 292,47 Non ARPA 12,096 4% In
Estação Ecológica Serra Das Araras Ecological Station Strict protection 1982 Federal MT 296,81 Non ARPA 0,8208 0% Out
Parque Estadual Das Nascentes do Rio Taquari State Park Strict protection 1999 State MS 305,99 Non ARPA 0 0% Out
Reserva Extrativista Maracanã Extractive Reserve Sustainable use 2002 Federal PA 308,43 ARPA 8,712 3% Out
Parque Nacional da Chapada Dos Guimaraes National Park Strict protection 1989 Federal MT 326,78 Non ARPA 34,7616 11% Out
Refúgio de Vida Silvestre Corixão da Mata Azul Wildlife Refuge Strict protection 2001 State MT 338,44 Non ARPA 3,4128 1% In
Parque Estadual Serra Dos Reis State Park Strict protection 1995 State RO 367,94 Non ARPA 13,1472 4% In
Reserva Biológica Morro Dos Seis Lagos Biological Reserve Strict protection 1990 State AM 392,34 Non ARPA 8,28 2% Out
Parque Estadual Serra Dos Parecis State Park Strict protection 1990 State RO 425,00 Non ARPA 246,2688 58% In
Reserva Extrativista Marinha de Caeté-Taperaçu Extractive Reserve Sustainable use 2005 Federal PA 426,74 Non ARPA 25,9776 6% Out
Reserva Extrativista Mãe Grande de Curuçá Extractive Reserve Sustainable use 2002 Federal PA 431,60 Non ARPA 24,1776 6% Out
Reserva Extrativista Lago do Cuniã Extractive Reserve Sustainable use 1999 Federal RO 528,06 Non ARPA 2,4912 0% In
Reserva Extrativista Ipaú-Anilzinho Extractive Reserve Sustainable use 2005 Federal PA 559,88 ARPA 176,4288 32% In
Parque Estadual Nhamundá State Park Strict protection 1989 State AM 564,09 Non ARPA 173,6496 31% Out
Reserva de Desenvolvimento Sustentável Urariá Sustainable Use Reserve Sustainable use 2005 State AM 601,61 Non ARPA 45,2592 8% Out
Estação Ecológica de Maracá-Jipioca Ecological Station Strict protection 1981 Federal AP 603,70 Non ARPA 9,432 2% Out
Reserva Biológica Rio Ouro Preto Biological Reserve Strict protection 1990 State RO 625,16 Non ARPA 0,1008 0% In
Reserva de Desenvolvimento
Sustentável Itatupã-BaquiáSustainable Use Reserve Sustainable use 2005 Federal PA 645,11 ARPA 0,3312 0% In
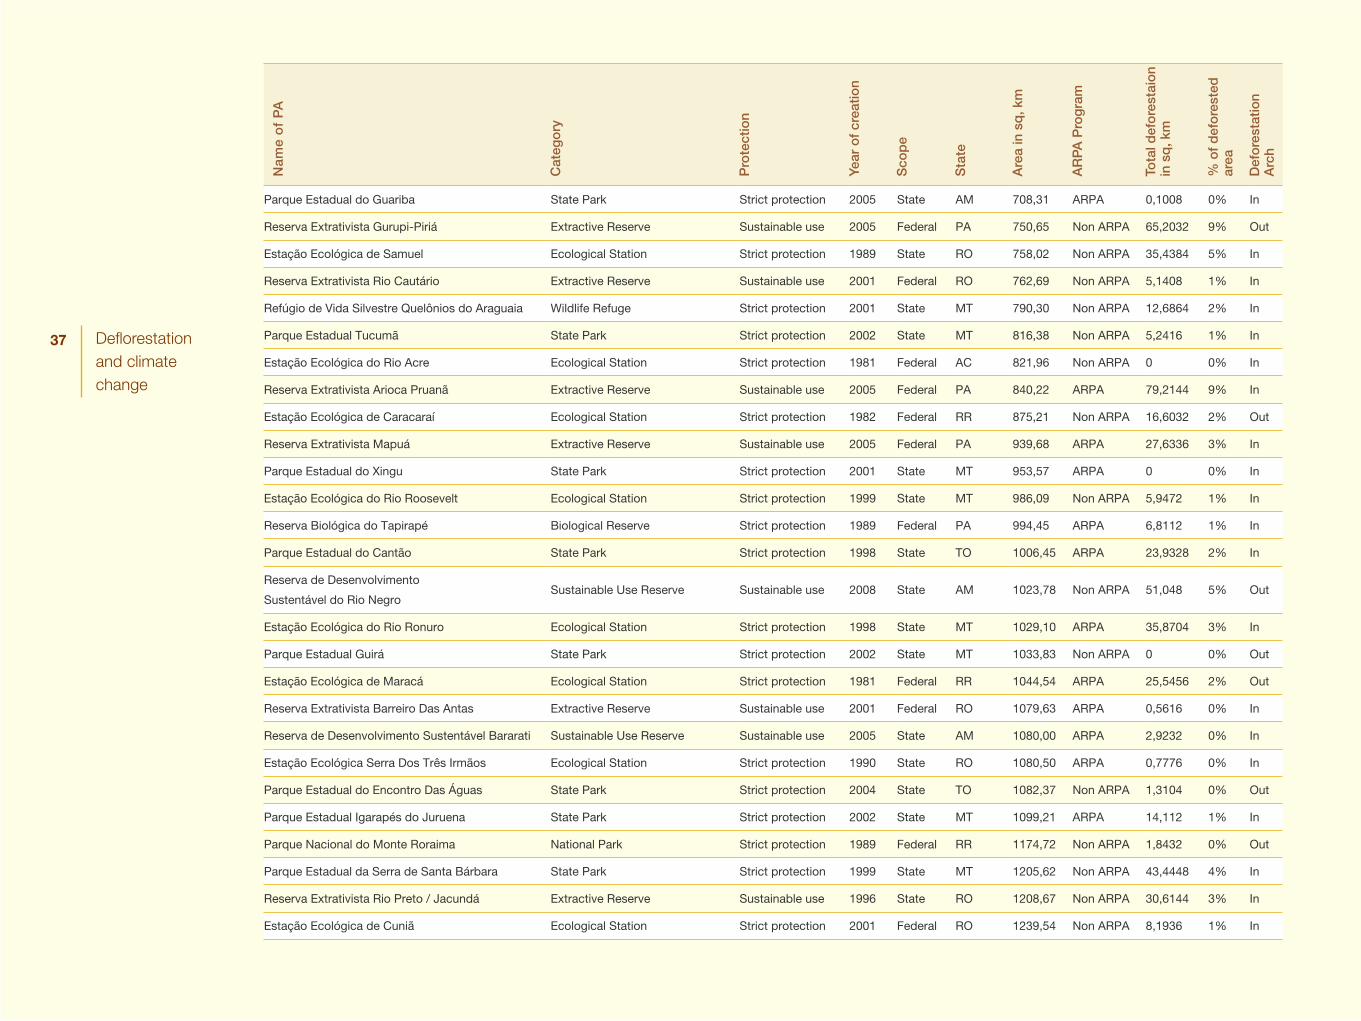
37 Deflorestation and climate change
Nam
e o
f P
A
Cat
ego
ry
Pro
tect
ion
Year
of
crea
tion
Sco
pe
Sta
te
Are
a in
sq
, km
AR
PA
Pro
gra
m
Tota
l def
ore
stai
on
in s
q, k
m
% o
f d
efo
rest
ed
area
Def
ore
stat
ion
Arc
h
Parque Estadual do Guariba State Park Strict protection 2005 State AM 708,31 ARPA 0,1008 0% In
Reserva Extrativista Gurupi-Piriá Extractive Reserve Sustainable use 2005 Federal PA 750,65 Non ARPA 65,2032 9% Out
Estação Ecológica de Samuel Ecological Station Strict protection 1989 State RO 758,02 Non ARPA 35,4384 5% In
Reserva Extrativista Rio Cautário Extractive Reserve Sustainable use 2001 Federal RO 762,69 Non ARPA 5,1408 1% In
Refúgio de Vida Silvestre Quelônios do Araguaia Wildlife Refuge Strict protection 2001 State MT 790,30 Non ARPA 12,6864 2% In
Parque Estadual Tucumã State Park Strict protection 2002 State MT 816,38 Non ARPA 5,2416 1% In
Estação Ecológica do Rio Acre Ecological Station Strict protection 1981 Federal AC 821,96 Non ARPA 0 0% In
Reserva Extrativista Arioca Pruanã Extractive Reserve Sustainable use 2005 Federal PA 840,22 ARPA 79,2144 9% In
Estação Ecológica de Caracaraí Ecological Station Strict protection 1982 Federal RR 875,21 Non ARPA 16,6032 2% Out
Reserva Extrativista Mapuá Extractive Reserve Sustainable use 2005 Federal PA 939,68 ARPA 27,6336 3% In
Parque Estadual do Xingu State Park Strict protection 2001 State MT 953,57 ARPA 0 0% In
Estação Ecológica do Rio Roosevelt Ecological Station Strict protection 1999 State MT 986,09 Non ARPA 5,9472 1% In
Reserva Biológica do Tapirapé Biological Reserve Strict protection 1989 Federal PA 994,45 ARPA 6,8112 1% In
Parque Estadual do Cantão State Park Strict protection 1998 State TO 1006,45 ARPA 23,9328 2% In
Reserva de Desenvolvimento
Sustentável do Rio NegroSustainable Use Reserve Sustainable use 2008 State AM 1023,78 Non ARPA 51,048 5% Out
Estação Ecológica do Rio Ronuro Ecological Station Strict protection 1998 State MT 1029,10 ARPA 35,8704 3% In
Parque Estadual Guirá State Park Strict protection 2002 State MT 1033,83 Non ARPA 0 0% Out
Estação Ecológica de Maracá Ecological Station Strict protection 1981 Federal RR 1044,54 ARPA 25,5456 2% Out
Reserva Extrativista Barreiro Das Antas Extractive Reserve Sustainable use 2001 Federal RO 1079,63 ARPA 0,5616 0% In
Reserva de Desenvolvimento Sustentável Bararati Sustainable Use Reserve Sustainable use 2005 State AM 1080,00 ARPA 2,9232 0% In
Estação Ecológica Serra Dos Três Irmãos Ecological Station Strict protection 1990 State RO 1080,50 ARPA 0,7776 0% In
Parque Estadual do Encontro Das Águas State Park Strict protection 2004 State TO 1082,37 Non ARPA 1,3104 0% Out
Parque Estadual Igarapés do Juruena State Park Strict protection 2002 State MT 1099,21 ARPA 14,112 1% In
Parque Nacional do Monte Roraima National Park Strict protection 1989 Federal RR 1174,72 Non ARPA 1,8432 0% Out
Parque Estadual da Serra de Santa Bárbara State Park Strict protection 1999 State MT 1205,62 Non ARPA 43,4448 4% In
Reserva Extrativista Rio Preto / Jacundá Extractive Reserve Sustainable use 1996 State RO 1208,67 Non ARPA 30,6144 3% In
Estação Ecológica de Cuniã Ecological Station Strict protection 2001 Federal RO 1239,54 Non ARPA 8,1936 1% In
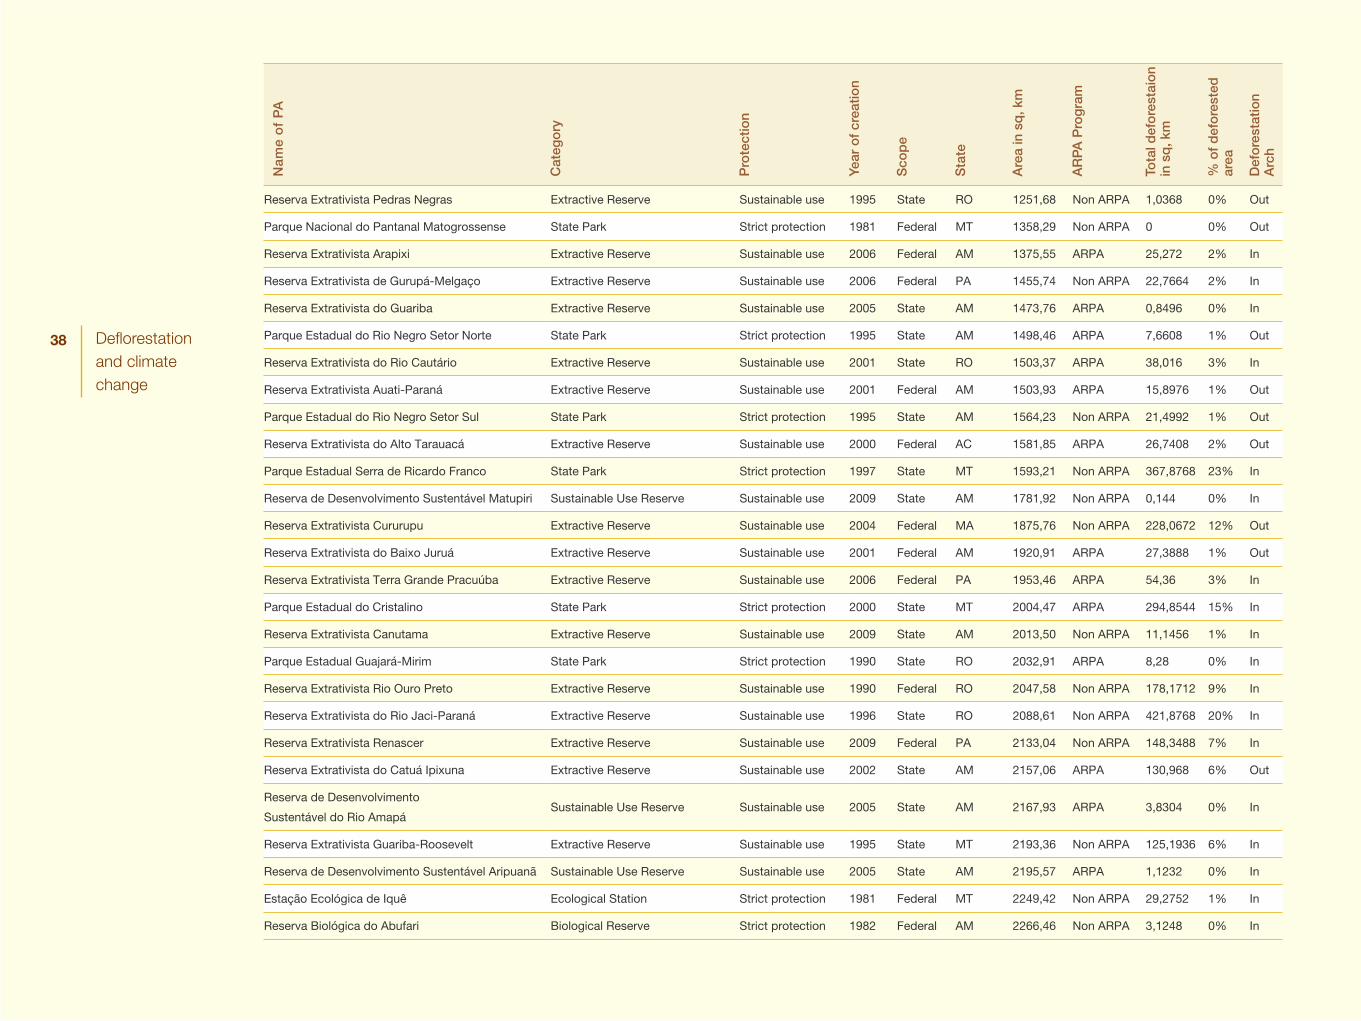
38 Deflorestation and climate change
Nam
e o
f P
A
Cat
ego
ry
Pro
tect
ion
Year
of
crea
tion
Sco
pe
Sta
te
Are
a in
sq
, km
AR
PA
Pro
gra
m
Tota
l def
ore
stai
on
in s
q, k
m
% o
f d
efo
rest
ed
area
Def
ore
stat
ion
Arc
h
Reserva Extrativista Pedras Negras Extractive Reserve Sustainable use 1995 State RO 1251,68 Non ARPA 1,0368 0% Out
Parque Nacional do Pantanal Matogrossense State Park Strict protection 1981 Federal MT 1358,29 Non ARPA 0 0% Out
Reserva Extrativista Arapixi Extractive Reserve Sustainable use 2006 Federal AM 1375,55 ARPA 25,272 2% In
Reserva Extrativista de Gurupá-Melgaço Extractive Reserve Sustainable use 2006 Federal PA 1455,74 Non ARPA 22,7664 2% In
Reserva Extrativista do Guariba Extractive Reserve Sustainable use 2005 State AM 1473,76 ARPA 0,8496 0% In
Parque Estadual do Rio Negro Setor Norte State Park Strict protection 1995 State AM 1498,46 ARPA 7,6608 1% Out
Reserva Extrativista do Rio Cautário Extractive Reserve Sustainable use 2001 State RO 1503,37 ARPA 38,016 3% In
Reserva Extrativista Auati-Paraná Extractive Reserve Sustainable use 2001 Federal AM 1503,93 ARPA 15,8976 1% Out
Parque Estadual do Rio Negro Setor Sul State Park Strict protection 1995 State AM 1564,23 Non ARPA 21,4992 1% Out
Reserva Extrativista do Alto Tarauacá Extractive Reserve Sustainable use 2000 Federal AC 1581,85 ARPA 26,7408 2% Out
Parque Estadual Serra de Ricardo Franco State Park Strict protection 1997 State MT 1593,21 Non ARPA 367,8768 23% In
Reserva de Desenvolvimento Sustentável Matupiri Sustainable Use Reserve Sustainable use 2009 State AM 1781,92 Non ARPA 0,144 0% In
Reserva Extrativista Cururupu Extractive Reserve Sustainable use 2004 Federal MA 1875,76 Non ARPA 228,0672 12% Out
Reserva Extrativista do Baixo Juruá Extractive Reserve Sustainable use 2001 Federal AM 1920,91 ARPA 27,3888 1% Out
Reserva Extrativista Terra Grande Pracuúba Extractive Reserve Sustainable use 2006 Federal PA 1953,46 ARPA 54,36 3% In
Parque Estadual do Cristalino State Park Strict protection 2000 State MT 2004,47 ARPA 294,8544 15% In
Reserva Extrativista Canutama Extractive Reserve Sustainable use 2009 State AM 2013,50 Non ARPA 11,1456 1% In
Parque Estadual Guajará-Mirim State Park Strict protection 1990 State RO 2032,91 ARPA 8,28 0% In
Reserva Extrativista Rio Ouro Preto Extractive Reserve Sustainable use 1990 Federal RO 2047,58 Non ARPA 178,1712 9% In
Reserva Extrativista do Rio Jaci-Paraná Extractive Reserve Sustainable use 1996 State RO 2088,61 Non ARPA 421,8768 20% In
Reserva Extrativista Renascer Extractive Reserve Sustainable use 2009 Federal PA 2133,04 Non ARPA 148,3488 7% In
Reserva Extrativista do Catuá Ipixuna Extractive Reserve Sustainable use 2002 State AM 2157,06 ARPA 130,968 6% Out
Reserva de Desenvolvimento
Sustentável do Rio AmapáSustainable Use Reserve Sustainable use 2005 State AM 2167,93 ARPA 3,8304 0% In
Reserva Extrativista Guariba-Roosevelt Extractive Reserve Sustainable use 1995 State MT 2193,36 Non ARPA 125,1936 6% In
Reserva de Desenvolvimento Sustentável Aripuanã Sustainable Use Reserve Sustainable use 2005 State AM 2195,57 ARPA 1,1232 0% In
Estação Ecológica de Iquê Ecological Station Strict protection 1981 Federal MT 2249,42 Non ARPA 29,2752 1% In
Reserva Biológica do Abufari Biological Reserve Strict protection 1982 Federal AM 2266,46 Non ARPA 3,1248 0% In
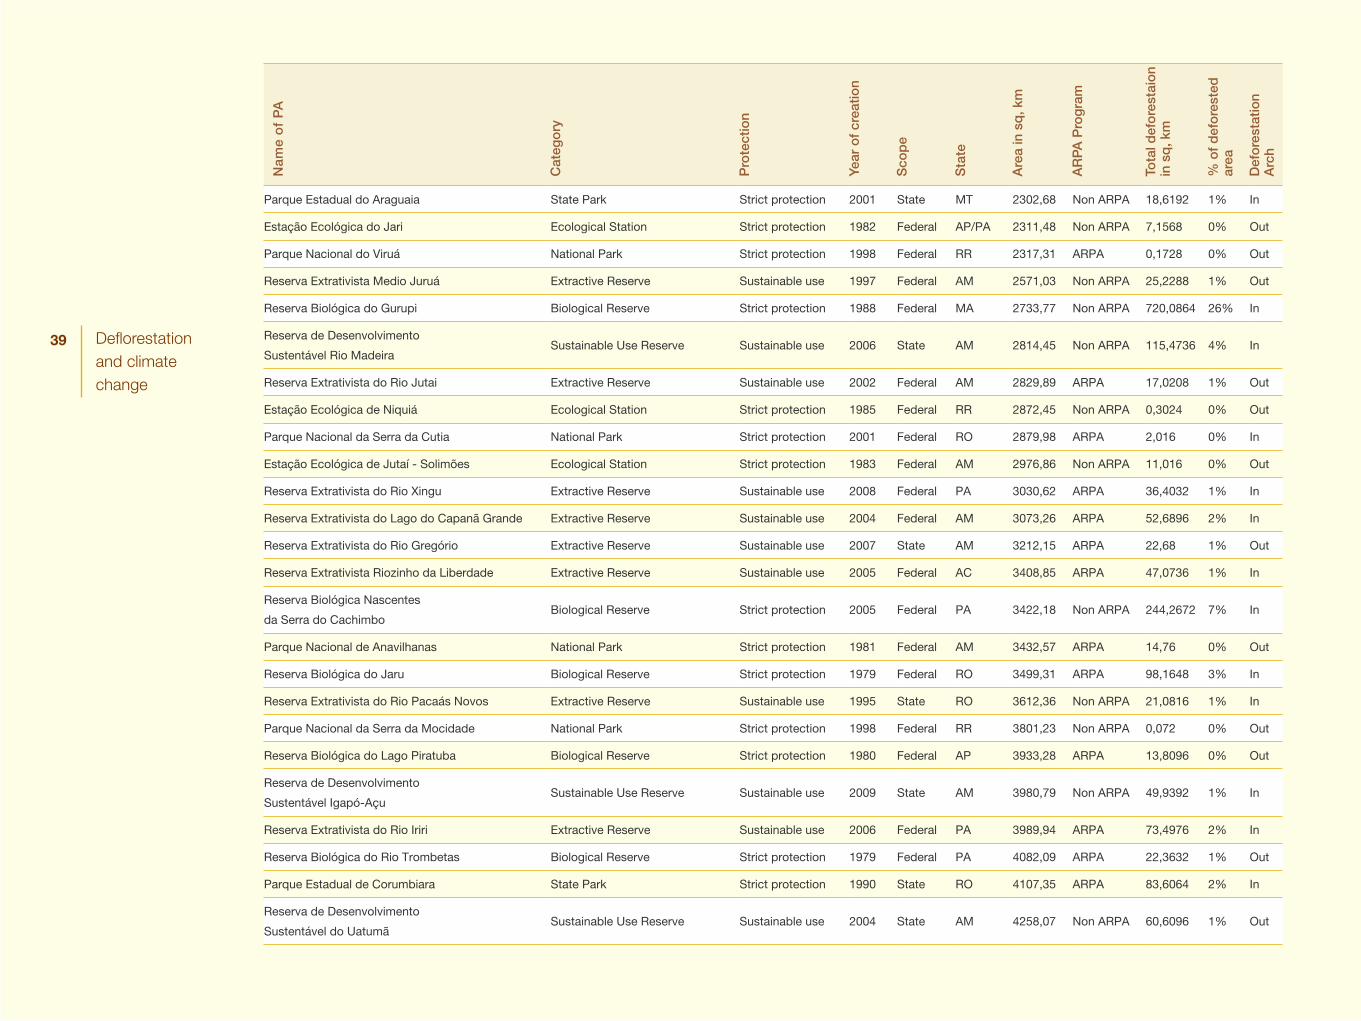
39 Deflorestation and climate change
Nam
e o
f P
A
Cat
ego
ry
Pro
tect
ion
Year
of
crea
tion
Sco
pe
Sta
te
Are
a in
sq
, km
AR
PA
Pro
gra
m
Tota
l def
ore
stai
on
in s
q, k
m
% o
f d
efo
rest
ed
area
Def
ore
stat
ion
Arc
h
Parque Estadual do Araguaia State Park Strict protection 2001 State MT 2302,68 Non ARPA 18,6192 1% In
Estação Ecológica do Jari Ecological Station Strict protection 1982 Federal AP/PA 2311,48 Non ARPA 7,1568 0% Out
Parque Nacional do Viruá National Park Strict protection 1998 Federal RR 2317,31 ARPA 0,1728 0% Out
Reserva Extrativista Medio Juruá Extractive Reserve Sustainable use 1997 Federal AM 2571,03 Non ARPA 25,2288 1% Out
Reserva Biológica do Gurupi Biological Reserve Strict protection 1988 Federal MA 2733,77 Non ARPA 720,0864 26% In
Reserva de Desenvolvimento
Sustentável Rio MadeiraSustainable Use Reserve Sustainable use 2006 State AM 2814,45 Non ARPA 115,4736 4% In
Reserva Extrativista do Rio Jutai Extractive Reserve Sustainable use 2002 Federal AM 2829,89 ARPA 17,0208 1% Out
Estação Ecológica de Niquiá Ecological Station Strict protection 1985 Federal RR 2872,45 Non ARPA 0,3024 0% Out
Parque Nacional da Serra da Cutia National Park Strict protection 2001 Federal RO 2879,98 ARPA 2,016 0% In
Estação Ecológica de Jutaí - Solimões Ecological Station Strict protection 1983 Federal AM 2976,86 Non ARPA 11,016 0% Out
Reserva Extrativista do Rio Xingu Extractive Reserve Sustainable use 2008 Federal PA 3030,62 ARPA 36,4032 1% In
Reserva Extrativista do Lago do Capanã Grande Extractive Reserve Sustainable use 2004 Federal AM 3073,26 ARPA 52,6896 2% In
Reserva Extrativista do Rio Gregório Extractive Reserve Sustainable use 2007 State AM 3212,15 ARPA 22,68 1% Out
Reserva Extrativista Riozinho da Liberdade Extractive Reserve Sustainable use 2005 Federal AC 3408,85 ARPA 47,0736 1% In
Reserva Biológica Nascentes
da Serra do CachimboBiological Reserve Strict protection 2005 Federal PA 3422,18 Non ARPA 244,2672 7% In
Parque Nacional de Anavilhanas National Park Strict protection 1981 Federal AM 3432,57 ARPA 14,76 0% Out
Reserva Biológica do Jaru Biological Reserve Strict protection 1979 Federal RO 3499,31 ARPA 98,1648 3% In
Reserva Extrativista do Rio Pacaás Novos Extractive Reserve Sustainable use 1995 State RO 3612,36 Non ARPA 21,0816 1% In
Parque Nacional da Serra da Mocidade National Park Strict protection 1998 Federal RR 3801,23 Non ARPA 0,072 0% Out
Reserva Biológica do Lago Piratuba Biological Reserve Strict protection 1980 Federal AP 3933,28 ARPA 13,8096 0% Out
Reserva de Desenvolvimento
Sustentável Igapó-AçuSustainable Use Reserve Sustainable use 2009 State AM 3980,79 Non ARPA 49,9392 1% In
Reserva Extrativista do Rio Iriri Extractive Reserve Sustainable use 2006 Federal PA 3989,94 ARPA 73,4976 2% In
Reserva Biológica do Rio Trombetas Biological Reserve Strict protection 1979 Federal PA 4082,09 ARPA 22,3632 1% Out
Parque Estadual de Corumbiara State Park Strict protection 1990 State RO 4107,35 ARPA 83,6064 2% In
Reserva de Desenvolvimento
Sustentável do UatumãSustainable Use Reserve Sustainable use 2004 State AM 4258,07 Non ARPA 60,6096 1% Out
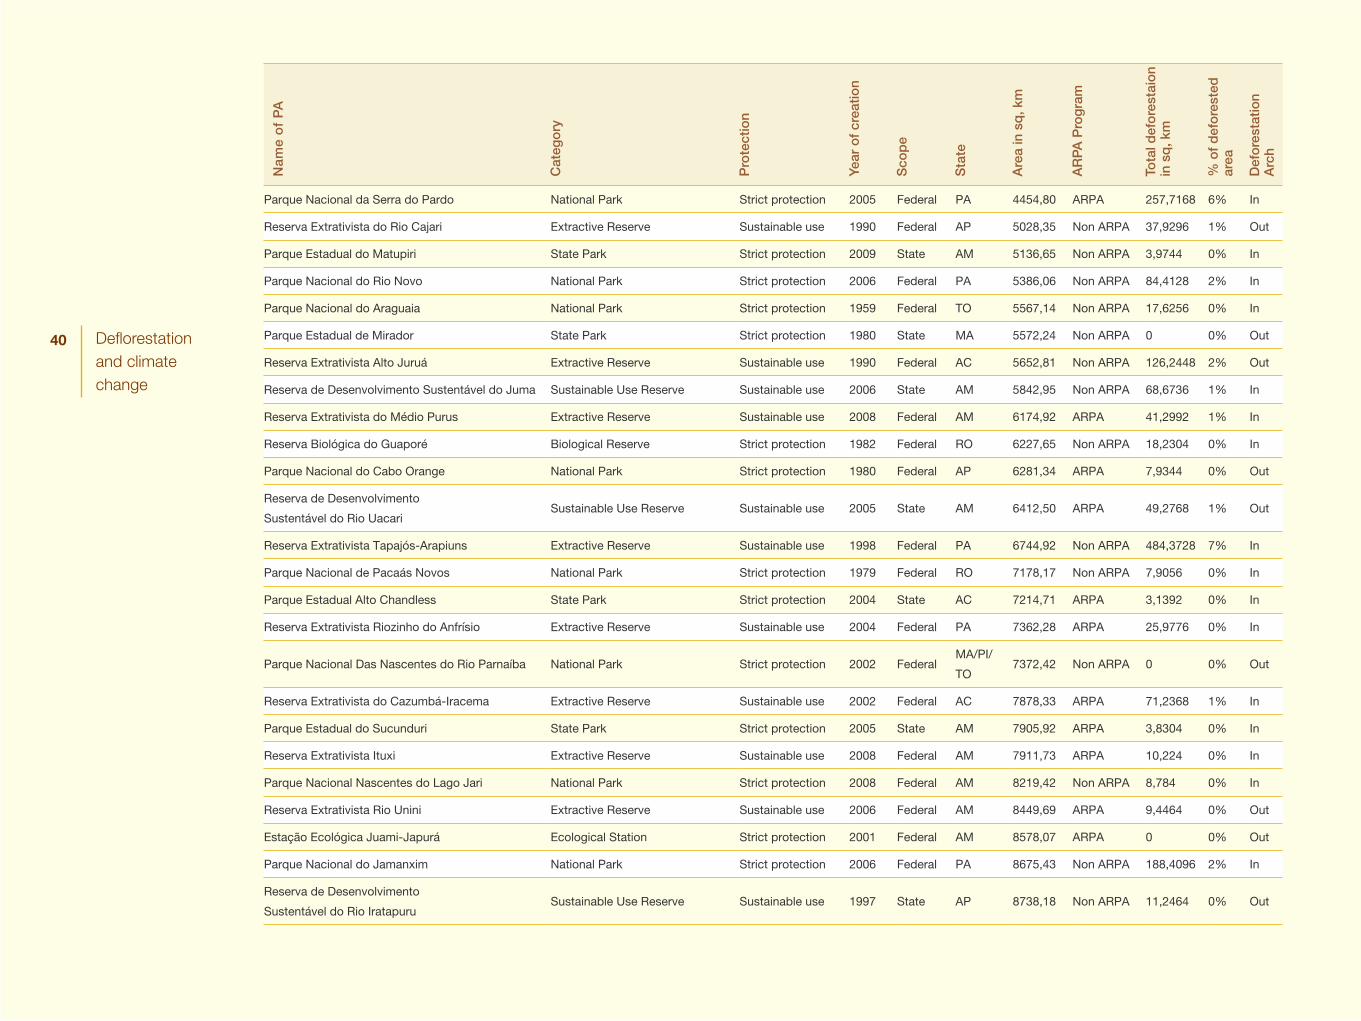
40 Deflorestation and climate change
Nam
e o
f P
A
Cat
ego
ry
Pro
tect
ion
Year
of
crea
tion
Sco
pe
Sta
te
Are
a in
sq
, km
AR
PA
Pro
gra
m
Tota
l def
ore
stai
on
in s
q, k
m
% o
f d
efo
rest
ed
area
Def
ore
stat
ion
Arc
h
Parque Nacional da Serra do Pardo National Park Strict protection 2005 Federal PA 4454,80 ARPA 257,7168 6% In
Reserva Extrativista do Rio Cajari Extractive Reserve Sustainable use 1990 Federal AP 5028,35 Non ARPA 37,9296 1% Out
Parque Estadual do Matupiri State Park Strict protection 2009 State AM 5136,65 Non ARPA 3,9744 0% In
Parque Nacional do Rio Novo National Park Strict protection 2006 Federal PA 5386,06 Non ARPA 84,4128 2% In
Parque Nacional do Araguaia National Park Strict protection 1959 Federal TO 5567,14 Non ARPA 17,6256 0% In
Parque Estadual de Mirador State Park Strict protection 1980 State MA 5572,24 Non ARPA 0 0% Out
Reserva Extrativista Alto Juruá Extractive Reserve Sustainable use 1990 Federal AC 5652,81 Non ARPA 126,2448 2% Out
Reserva de Desenvolvimento Sustentável do Juma Sustainable Use Reserve Sustainable use 2006 State AM 5842,95 Non ARPA 68,6736 1% In
Reserva Extrativista do Médio Purus Extractive Reserve Sustainable use 2008 Federal AM 6174,92 ARPA 41,2992 1% In
Reserva Biológica do Guaporé Biological Reserve Strict protection 1982 Federal RO 6227,65 Non ARPA 18,2304 0% In
Parque Nacional do Cabo Orange National Park Strict protection 1980 Federal AP 6281,34 ARPA 7,9344 0% Out
Reserva de Desenvolvimento
Sustentável do Rio UacariSustainable Use Reserve Sustainable use 2005 State AM 6412,50 ARPA 49,2768 1% Out
Reserva Extrativista Tapajós-Arapiuns Extractive Reserve Sustainable use 1998 Federal PA 6744,92 Non ARPA 484,3728 7% In
Parque Nacional de Pacaás Novos National Park Strict protection 1979 Federal RO 7178,17 Non ARPA 7,9056 0% In
Parque Estadual Alto Chandless State Park Strict protection 2004 State AC 7214,71 ARPA 3,1392 0% In
Reserva Extrativista Riozinho do Anfrísio Extractive Reserve Sustainable use 2004 Federal PA 7362,28 ARPA 25,9776 0% In
Parque Nacional Das Nascentes do Rio Parnaíba National Park Strict protection 2002 FederalMA/PI/
TO7372,42 Non ARPA 0 0% Out
Reserva Extrativista do Cazumbá-Iracema Extractive Reserve Sustainable use 2002 Federal AC 7878,33 ARPA 71,2368 1% In
Parque Estadual do Sucunduri State Park Strict protection 2005 State AM 7905,92 ARPA 3,8304 0% In
Reserva Extrativista Ituxi Extractive Reserve Sustainable use 2008 Federal AM 7911,73 ARPA 10,224 0% In
Parque Nacional Nascentes do Lago Jari National Park Strict protection 2008 Federal AM 8219,42 Non ARPA 8,784 0% In
Reserva Extrativista Rio Unini Extractive Reserve Sustainable use 2006 Federal AM 8449,69 ARPA 9,4464 0% Out
Estação Ecológica Juami-Japurá Ecological Station Strict protection 2001 Federal AM 8578,07 ARPA 0 0% Out
Parque Nacional do Jamanxim National Park Strict protection 2006 Federal PA 8675,43 Non ARPA 188,4096 2% In
Reserva de Desenvolvimento
Sustentável do Rio IratapuruSustainable Use Reserve Sustainable use 1997 State AP 8738,18 Non ARPA 11,2464 0% Out
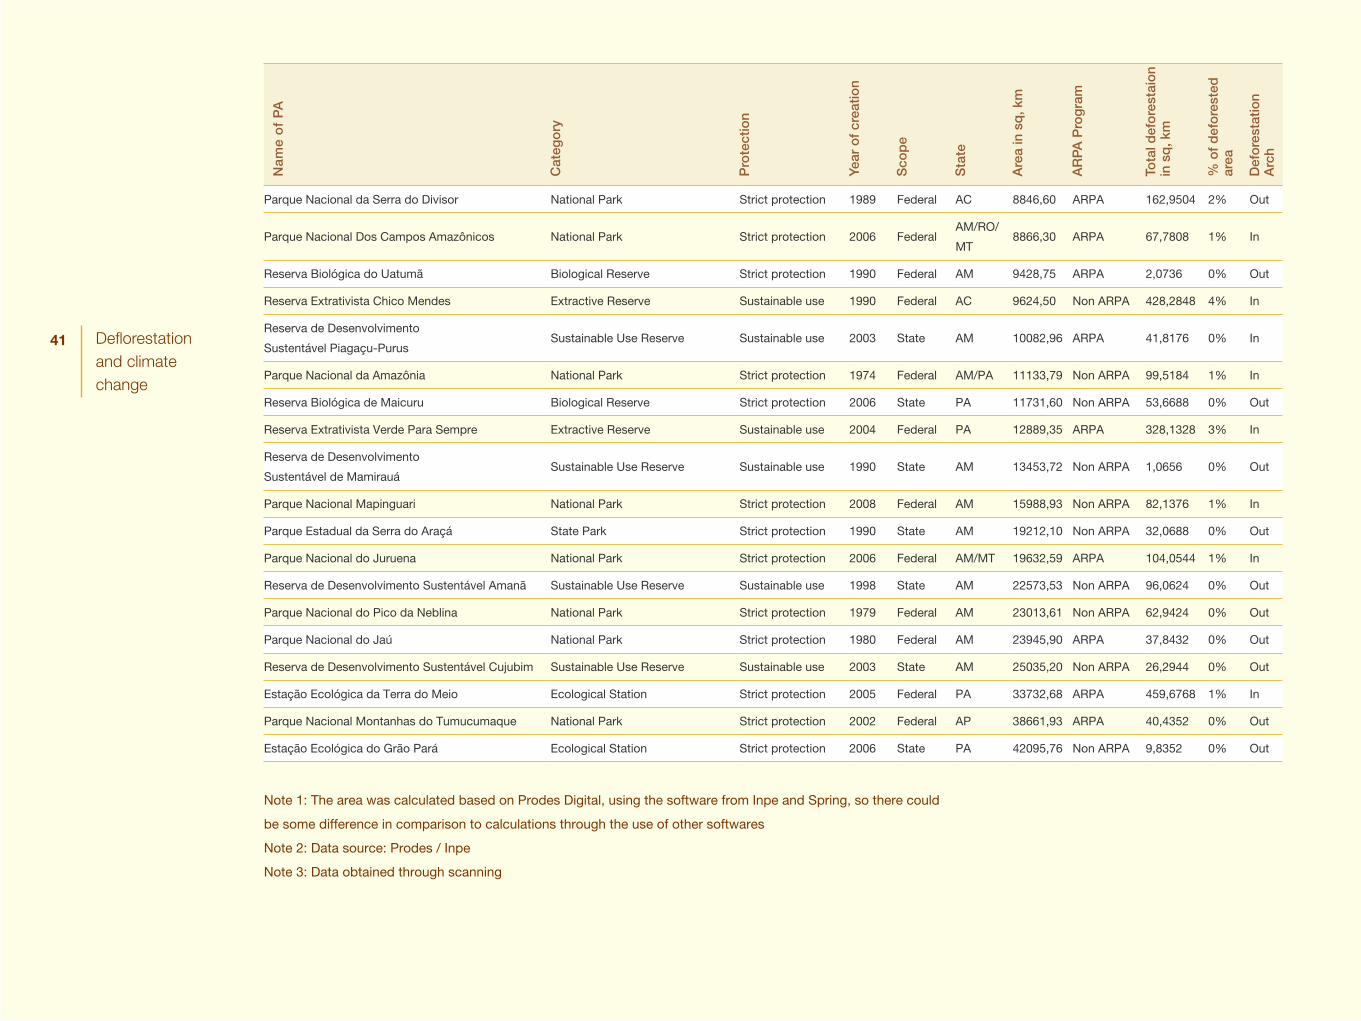
41 Deflorestation and climate change
Nam
e o
f P
A
Cat
ego
ry
Pro
tect
ion
Year
of
crea
tion
Sco
pe
Sta
te
Are
a in
sq
, km
AR
PA
Pro
gra
m
Tota
l def
ore
stai
on
in s
q, k
m
% o
f d
efo
rest
ed
area
Def
ore
stat
ion
Arc
h
Parque Nacional da Serra do Divisor National Park Strict protection 1989 Federal AC 8846,60 ARPA 162,9504 2% Out
Parque Nacional Dos Campos Amazônicos National Park Strict protection 2006 FederalAM/RO/
MT8866,30 ARPA 67,7808 1% In
Reserva Biológica do Uatumã Biological Reserve Strict protection 1990 Federal AM 9428,75 ARPA 2,0736 0% Out
Reserva Extrativista Chico Mendes Extractive Reserve Sustainable use 1990 Federal AC 9624,50 Non ARPA 428,2848 4% In
Reserva de Desenvolvimento
Sustentável Piagaçu-PurusSustainable Use Reserve Sustainable use 2003 State AM 10082,96 ARPA 41,8176 0% In
Parque Nacional da Amazônia National Park Strict protection 1974 Federal AM/PA 11133,79 Non ARPA 99,5184 1% In
Reserva Biológica de Maicuru Biological Reserve Strict protection 2006 State PA 11731,60 Non ARPA 53,6688 0% Out
Reserva Extrativista Verde Para Sempre Extractive Reserve Sustainable use 2004 Federal PA 12889,35 ARPA 328,1328 3% In
Reserva de Desenvolvimento
Sustentável de MamirauáSustainable Use Reserve Sustainable use 1990 State AM 13453,72 Non ARPA 1,0656 0% Out
Parque Nacional Mapinguari National Park Strict protection 2008 Federal AM 15988,93 Non ARPA 82,1376 1% In
Parque Estadual da Serra do Araçá State Park Strict protection 1990 State AM 19212,10 Non ARPA 32,0688 0% Out
Parque Nacional do Juruena National Park Strict protection 2006 Federal AM/MT 19632,59 ARPA 104,0544 1% In
Reserva de Desenvolvimento Sustentável Amanã Sustainable Use Reserve Sustainable use 1998 State AM 22573,53 Non ARPA 96,0624 0% Out
Parque Nacional do Pico da Neblina National Park Strict protection 1979 Federal AM 23013,61 Non ARPA 62,9424 0% Out
Parque Nacional do Jaú National Park Strict protection 1980 Federal AM 23945,90 ARPA 37,8432 0% Out
Reserva de Desenvolvimento Sustentável Cujubim Sustainable Use Reserve Sustainable use 2003 State AM 25035,20 Non ARPA 26,2944 0% Out
Estação Ecológica da Terra do Meio Ecological Station Strict protection 2005 Federal PA 33732,68 ARPA 459,6768 1% In
Parque Nacional Montanhas do Tumucumaque National Park Strict protection 2002 Federal AP 38661,93 ARPA 40,4352 0% Out
Estação Ecológica do Grão Pará Ecological Station Strict protection 2006 State PA 42095,76 Non ARPA 9,8352 0% Out
Note 1: The area was calculated based on Prodes Digital, using the software from Inpe and Spring, so there could
be some difference in comparison to calculations through the use of other softwares
Note 2: Data source: Prodes / Inpe
Note 3: Data obtained through scanning
42 Deflorestation and climate change
References
BRASIL. Ministério do Meio Ambiente. Secretaria Executiva/Sec-retaria de Biodiversidade e Florestas Programa Áreas Protegidas da Amazônia – ARPA – Fase II. Brasília: SBF, 2010.i 79p.Documento de Programa do Governo Brasileiro.
Global Forest Resources Assessment – Progress towards sustainable forest management. Food and Agriculture Organization of the United Na-tions (Fao), Roma, 2005.
JENKINS, C.N. JOPPA, L. Expansion of the global terrestrial protected area system, Biological Conservation, v. 142, n. 10, p. 2166-2174, outubro de 2009.
LIMA, A.; et al. Desmatamento na Amazônia: medidas e efeitos do De-creto Federal 6.321/07. Belém: Ipam, 2008. 14p.
NEPSTAD, D.; et al. The End of Deforestation in the Brazilian Amazon. Science, v. 326, n. 5958, p. 1350-1351, 2009.
NEPSTAD, D.; et al. Inhibition of Amazon deforestation and fire by parks and indigenous lands. Conservation Biology. 20, n. 1, p. 65–73, 2006
SOARES-FILHO B.; et a. Role of Brazilian Amazon protected areas in climate change mitigation. Proc National Academy of Sciences USA, v. 107, n. 24, p.10821-6, 15 de junho de 2010. Publicada eletronicamente em 26 mai0 de 2010.
43 Deflorestation and climate change
Protected areas and climate changeProtected areas today are the fastest, more effective and lower cost alternative for climate change minimization (mitigation) in countries having tropical forests. This is particularly the case of Brazil and of the Amazon.
G lobal warming is caused by increased greenhouse gas (such as CO2) emissions in the atmosphere. Final effect of such warming is the
intensification of extreme climate events and the change in seasonal patterns. Climate change impacts the planet as a whole with effects on life and the economy, touching everyone without distinction. Up to 20% of global green-house gas emissions are caused by cutting down forests and degradation – this corresponds to more emissions than those caused by all types of vehicles together (cars and other road vehicles, trains, planes, ships). To prevent climate change from getting out of control, it is necessary to ensure that the increase in temperature does not go beyond 2 degrees Celsius. In order to ensure this, all countries must contribute for emissions decrease and adopt mitiga-tion measures to minimize the impacts of global warming.
There is urgent need to decrease greenhouse gas (GHG) emissions now to stop global warming. Present trend, however, is one of increase. Therefore, we must act to accomplish the necessary reduction.
Studies based on the Inter-governmental Panel on Cli-mate Change (IPCC) model scenarios reached the conclu-sion that global yearly emissions must be cut down to 44 Giga tons of CO2 or less by 2020 for the world to have a
higher than 50% chance of stopping global warming. One of the most simple and fastest ways of decreasing emis-sions is to protect forests. Standing forests mean carbon stocks. Forest destruction contributes to making global warming more acute. Besides avoiding CO2 emissions, for-est conservation is important for climate balance, due to forests role in regulating the temperature and water cycles, among various other services and products supplied by forests to society.
Around 70% of total GHG emissions in Brazil origi-nate from deforestation and forest degradation. This country shelters one third of the remaining tropical forests in the world and 60% of the Amazon – the largest con-tinuous stretch of tropical forest on Earth. The Amazon biome (in Brazil) covers 4,196,943 square kilometers, cor-responding to 49% of the national territory.
Therefore, Brazilian forests, with their ecosystems and biodiversity, must be left standing. The most adequate and convenient approach to this is the investment in protected areas – the cost-benefit relation, viability, and term to de-liver results are better than in any other alternative.
Protected areas in the Brazilian Amazon may represent the non emission of 8 billion tons of carbon by 2050, ac-cording to a study by Ipam, UFMG, WWF-Brazil and The Woods Hole Research Center1. Amazon Region Pro-tected Areas Program (ARPA) plays a major role in that to make it happen. The outcome of ARPA’s 1st Phase (read further details below) proves that it is possible.
The importance of tropical forests for Earth’s cli-mate balance is quite evident. There is also proof that Protected Areas (PAs) are capable of inhibiting tropical forest destruction, avoiding CO2 emissions and keeping carbon stocks.
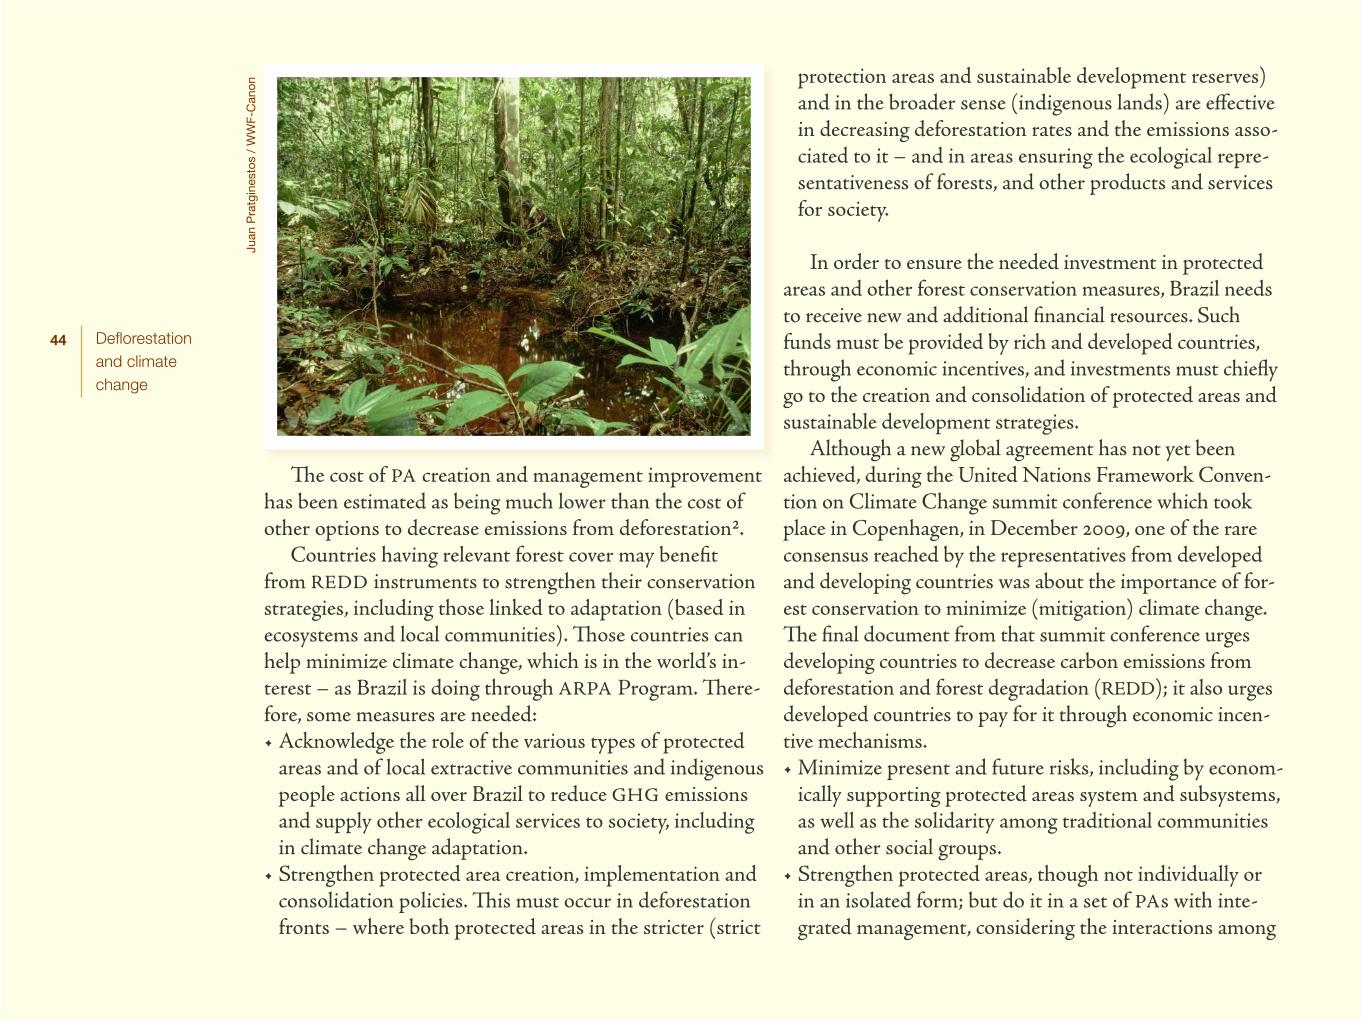
44 Deflorestation and climate change
The cost of PA creation and management improvement has been estimated as being much lower than the cost of other options to decrease emissions from deforestation2.
Countries having relevant forest cover may benefit from REDD instruments to strengthen their conservation strategies, including those linked to adaptation (based in ecosystems and local communities). Those countries can help minimize climate change, which is in the world’s in-terest – as Brazil is doing through ARPA Program. There-fore, some measures are needed:•Acknowledge the role of the various types of protected
areas and of local extractive communities and indigenous people actions all over Brazil to reduce GHG emissions and supply other ecological services to society, including in climate change adaptation.
•Strengthen protected area creation, implementation and consolidation policies. This must occur in deforestation fronts – where both protected areas in the stricter (strict
protection areas and sustainable development reserves) and in the broader sense (indigenous lands) are effective in decreasing deforestation rates and the emissions asso-ciated to it – and in areas ensuring the ecological repre-sentativeness of forests, and other products and services for society.
In order to ensure the needed investment in protected areas and other forest conservation measures, Brazil needs to receive new and additional financial resources. Such funds must be provided by rich and developed countries, through economic incentives, and investments must chiefly go to the creation and consolidation of protected areas and sustainable development strategies.
Although a new global agreement has not yet been achieved, during the United Nations Framework Conven-tion on Climate Change summit conference which took place in Copenhagen, in December 2009, one of the rare consensus reached by the representatives from developed and developing countries was about the importance of for-est conservation to minimize (mitigation) climate change. The final document from that summit conference urges developing countries to decrease carbon emissions from deforestation and forest degradation (REDD); it also urges developed countries to pay for it through economic incen-tive mechanisms.•Minimize present and future risks, including by econom-
ically supporting protected areas system and subsystems, as well as the solidarity among traditional communities and other social groups.
•Strengthen protected areas, though not individually or in an isolated form; but do it in a set of PAs with inte-grated management, considering the interactions among
Jua
n P
ratg
ines
tos
/ W
WF-
Can
on
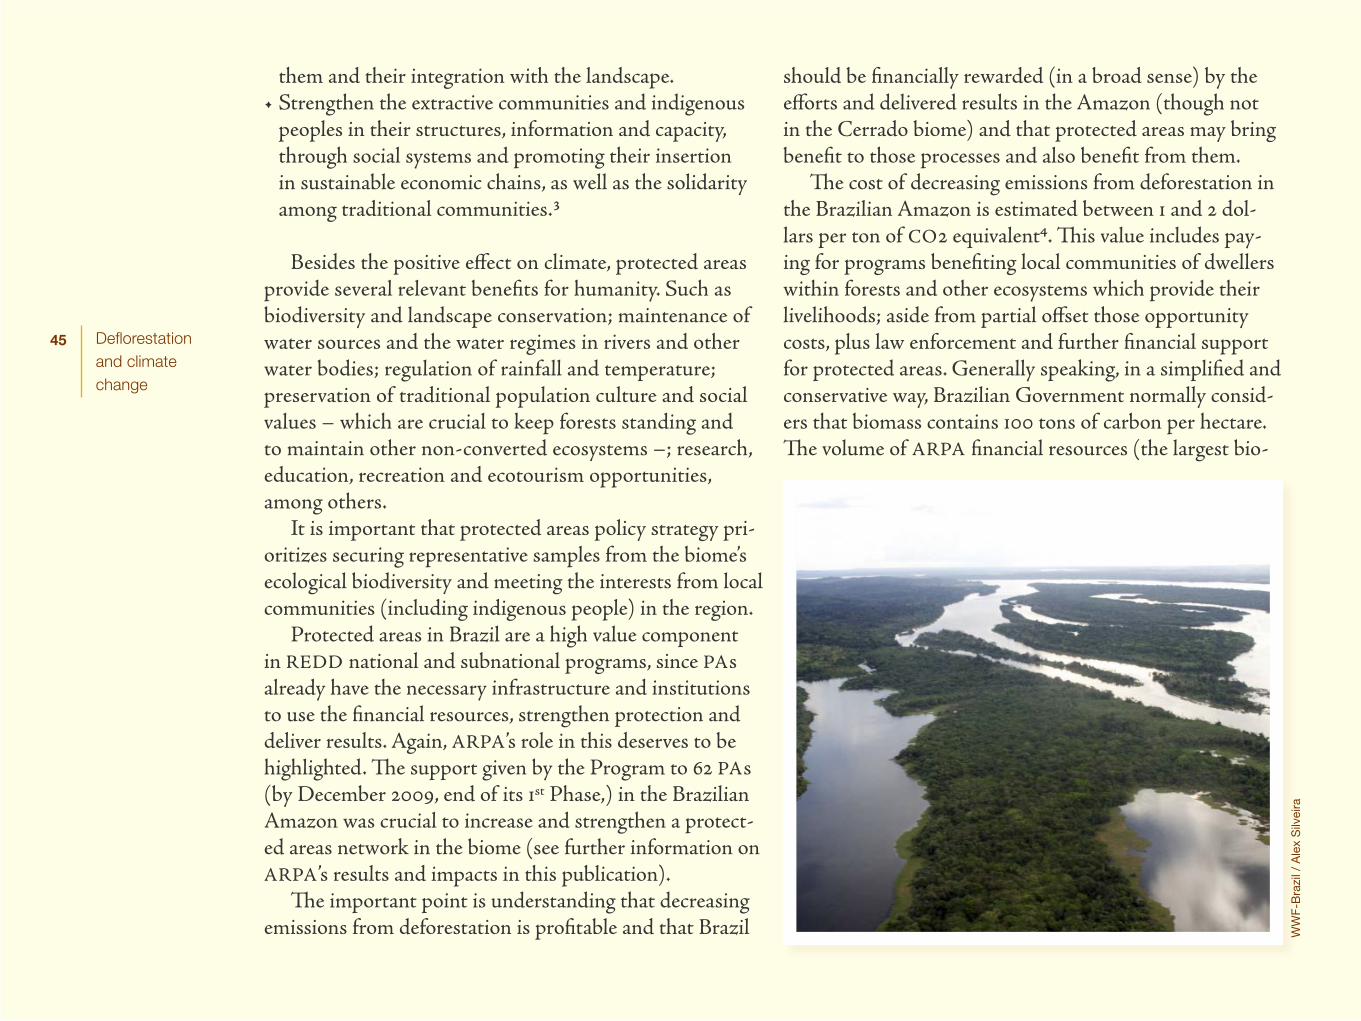
45 Deflorestation and climate change
them and their integration with the landscape. •Strengthen the extractive communities and indigenous
peoples in their structures, information and capacity, through social systems and promoting their insertion in sustainable economic chains, as well as the solidarity among traditional communities.3
Besides the positive effect on climate, protected areas provide several relevant benefits for humanity. Such as biodiversity and landscape conservation; maintenance of water sources and the water regimes in rivers and other water bodies; regulation of rainfall and temperature; preservation of traditional population culture and social values – which are crucial to keep forests standing and to maintain other non-converted ecosystems –; research, education, recreation and ecotourism opportunities, among others.
It is important that protected areas policy strategy pri-oritizes securing representative samples from the biome’s ecological biodiversity and meeting the interests from local communities (including indigenous people) in the region.
Protected areas in Brazil are a high value component in REDD national and subnational programs, since PAs already have the necessary infrastructure and institutions to use the financial resources, strengthen protection and deliver results. Again, ARPA’s role in this deserves to be highlighted. The support given by the Program to 62 PAs (by December 2009, end of its 1st Phase,) in the Brazilian Amazon was crucial to increase and strengthen a protect-ed areas network in the biome (see further information on ARPA’s results and impacts in this publication).
The important point is understanding that decreasing emissions from deforestation is profitable and that Brazil
should be financially rewarded (in a broad sense) by the efforts and delivered results in the Amazon (though not in the Cerrado biome) and that protected areas may bring benefit to those processes and also benefit from them.
The cost of decreasing emissions from deforestation in the Brazilian Amazon is estimated between 1 and 2 dol-lars per ton of CO2 equivalent4. This value includes pay-ing for programs benefiting local communities of dwellers within forests and other ecosystems which provide their livelihoods; aside from partial offset those opportunity costs, plus law enforcement and further financial support for protected areas. Generally speaking, in a simplified and conservative way, Brazilian Government normally consid-ers that biomass contains 100 tons of carbon per hectare. The volume of ARPA financial resources (the largest bio-
WW
F-B
razi
l / A
lex
Silv
eira
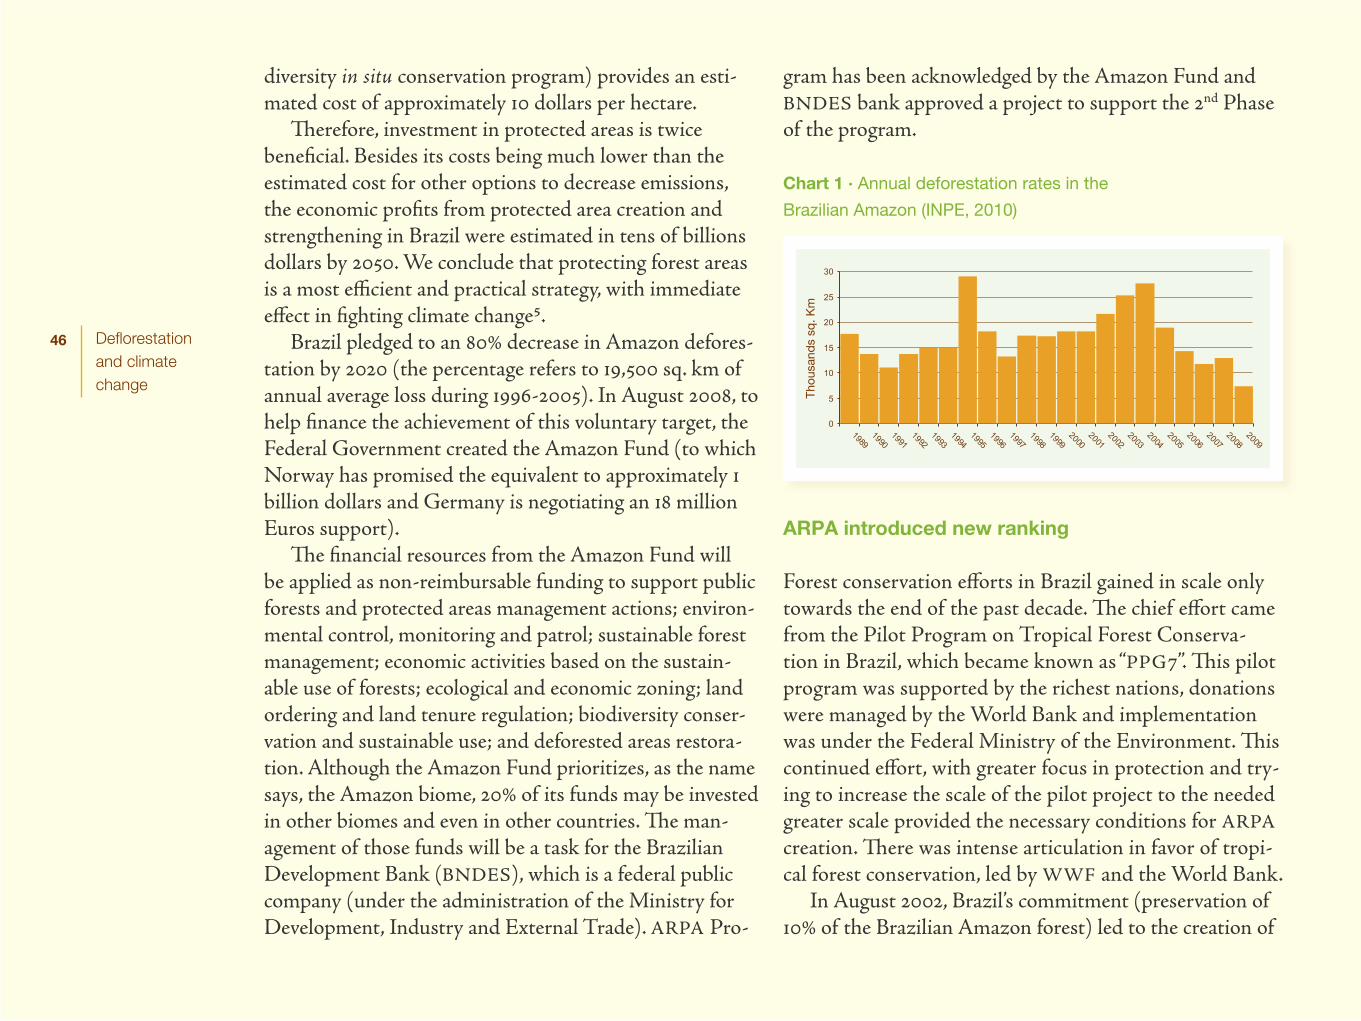
46 Deflorestation and climate change
diversity in situ conservation program) provides an esti-mated cost of approximately 10 dollars per hectare.
Therefore, investment in protected areas is twice beneficial. Besides its costs being much lower than the estimated cost for other options to decrease emissions, the economic profits from protected area creation and strengthening in Brazil were estimated in tens of billions dollars by 2050. We conclude that protecting forest areas is a most efficient and practical strategy, with immediate effect in fighting climate change5.
Brazil pledged to an 80% decrease in Amazon defores-tation by 2020 (the percentage refers to 19,500 sq. km of annual average loss during 1996-2005). In August 2008, to help finance the achievement of this voluntary target, the Federal Government created the Amazon Fund (to which Norway has promised the equivalent to approximately 1 billion dollars and Germany is negotiating an 18 million Euros support).
The financial resources from the Amazon Fund will be applied as non-reimbursable funding to support public forests and protected areas management actions; environ-mental control, monitoring and patrol; sustainable forest management; economic activities based on the sustain-able use of forests; ecological and economic zoning; land ordering and land tenure regulation; biodiversity conser-vation and sustainable use; and deforested areas restora-tion. Although the Amazon Fund prioritizes, as the name says, the Amazon biome, 20% of its funds may be invested in other biomes and even in other countries. The man-agement of those funds will be a task for the Brazilian Development Bank (BNDES), which is a federal public company (under the administration of the Ministry for Development, Industry and External Trade). ARPA Pro-
gram has been acknowledged by the Amazon Fund and BNDES bank approved a project to support the 2nd Phase of the program.
Chart 1 · Annual deforestation rates in the
Brazilian Amazon (INPE, 2010)
ARPA introduced new ranking
Forest conservation efforts in Brazil gained in scale only towards the end of the past decade. The chief effort came from the Pilot Program on Tropical Forest Conserva-tion in Brazil, which became known as “PPG7”. This pilot program was supported by the richest nations, donations were managed by the World Bank and implementation was under the Federal Ministry of the Environment. This continued effort, with greater focus in protection and try-ing to increase the scale of the pilot project to the needed greater scale provided the necessary conditions for ARPA creation. There was intense articulation in favor of tropi-cal forest conservation, led by WWF and the World Bank.
In August 2002, Brazil’s commitment (preservation of 10% of the Brazilian Amazon forest) led to the creation of
0
5
10
15
20
25
30
19891990
19911992
19931994
19951996
19971998
19992000
20012002
20032004
20052006
2007
Milh
ares
de
Km2
20082009
Thou
sand
s sq
. Km
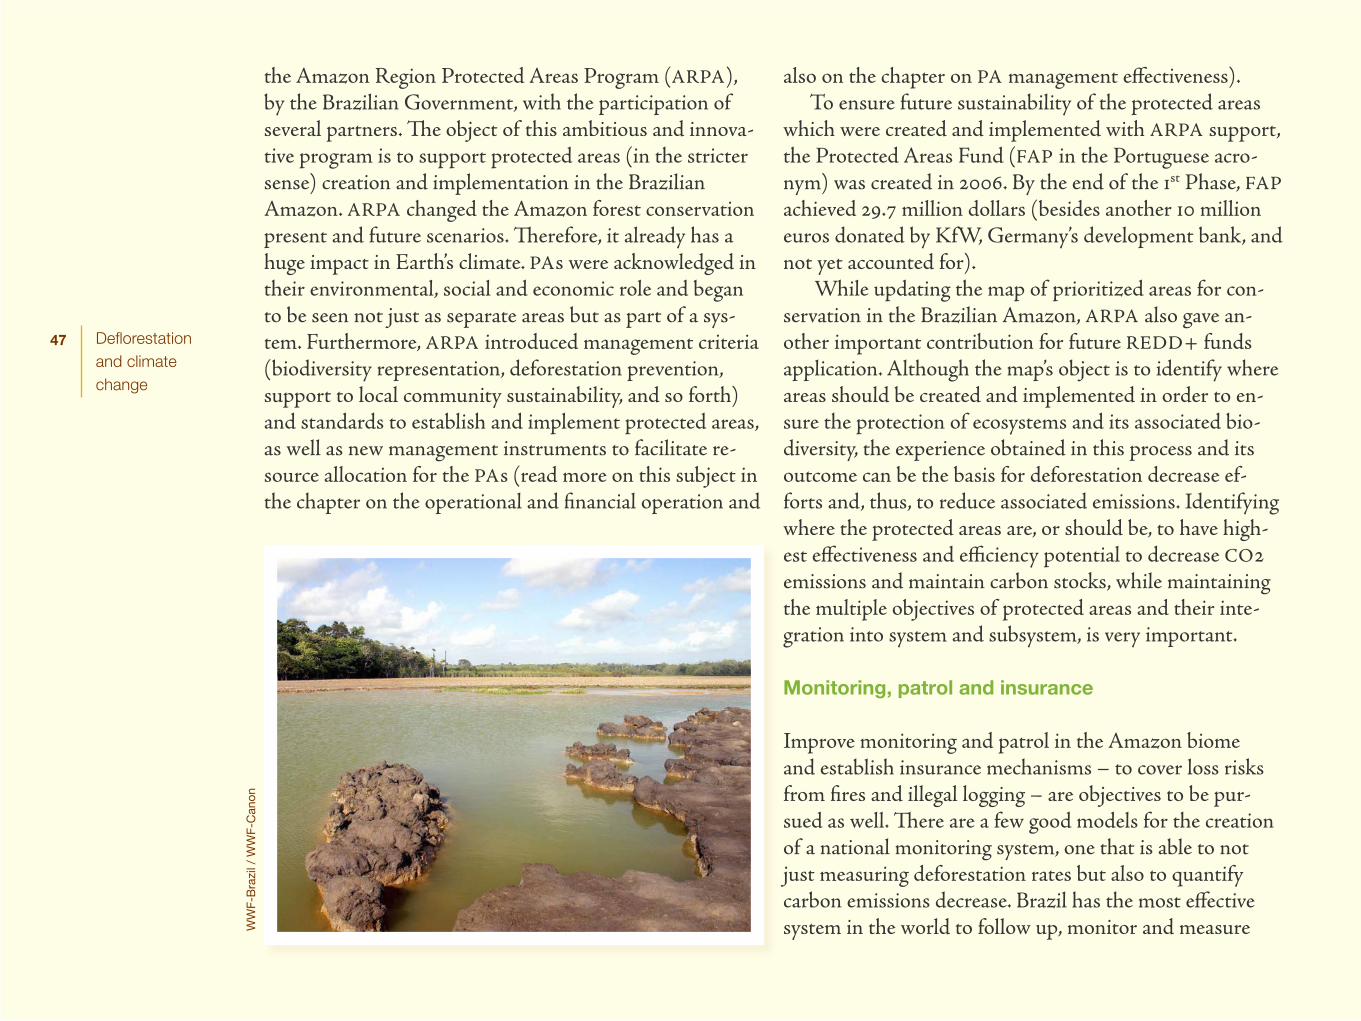
47 Deflorestation and climate change
the Amazon Region Protected Areas Program (ARPA), by the Brazilian Government, with the participation of several partners. The object of this ambitious and innova-tive program is to support protected areas (in the stricter sense) creation and implementation in the Brazilian Amazon. ARPA changed the Amazon forest conservation present and future scenarios. Therefore, it already has a huge impact in Earth’s climate. PAs were acknowledged in their environmental, social and economic role and began to be seen not just as separate areas but as part of a sys-tem. Furthermore, ARPA introduced management criteria (biodiversity representation, deforestation prevention, support to local community sustainability, and so forth) and standards to establish and implement protected areas, as well as new management instruments to facilitate re-source allocation for the PAs (read more on this subject in the chapter on the operational and financial operation and
also on the chapter on PA management effectiveness). To ensure future sustainability of the protected areas
which were created and implemented with ARPA support, the Protected Areas Fund (FAP in the Portuguese acro-nym) was created in 2006. By the end of the 1st Phase, FAP achieved 29.7 million dollars (besides another 10 million euros donated by KfW, Germany’s development bank, and not yet accounted for).
While updating the map of prioritized areas for con-servation in the Brazilian Amazon, ARPA also gave an-other important contribution for future REDD+ funds application. Although the map’s object is to identify where areas should be created and implemented in order to en-sure the protection of ecosystems and its associated bio-diversity, the experience obtained in this process and its outcome can be the basis for deforestation decrease ef-forts and, thus, to reduce associated emissions. Identifying where the protected areas are, or should be, to have high-est effectiveness and efficiency potential to decrease CO2 emissions and maintain carbon stocks, while maintaining the multiple objectives of protected areas and their inte-gration into system and subsystem, is very important.
Monitoring, patrol and insurance
Improve monitoring and patrol in the Amazon biome and establish insurance mechanisms – to cover loss risks from fires and illegal logging – are objectives to be pur-sued as well. There are a few good models for the creation of a national monitoring system, one that is able to not just measuring deforestation rates but also to quantify carbon emissions decrease. Brazil has the most effective system in the world to follow up, monitor and measure W
WF-
Bra
zil /
WW
F-C
anon
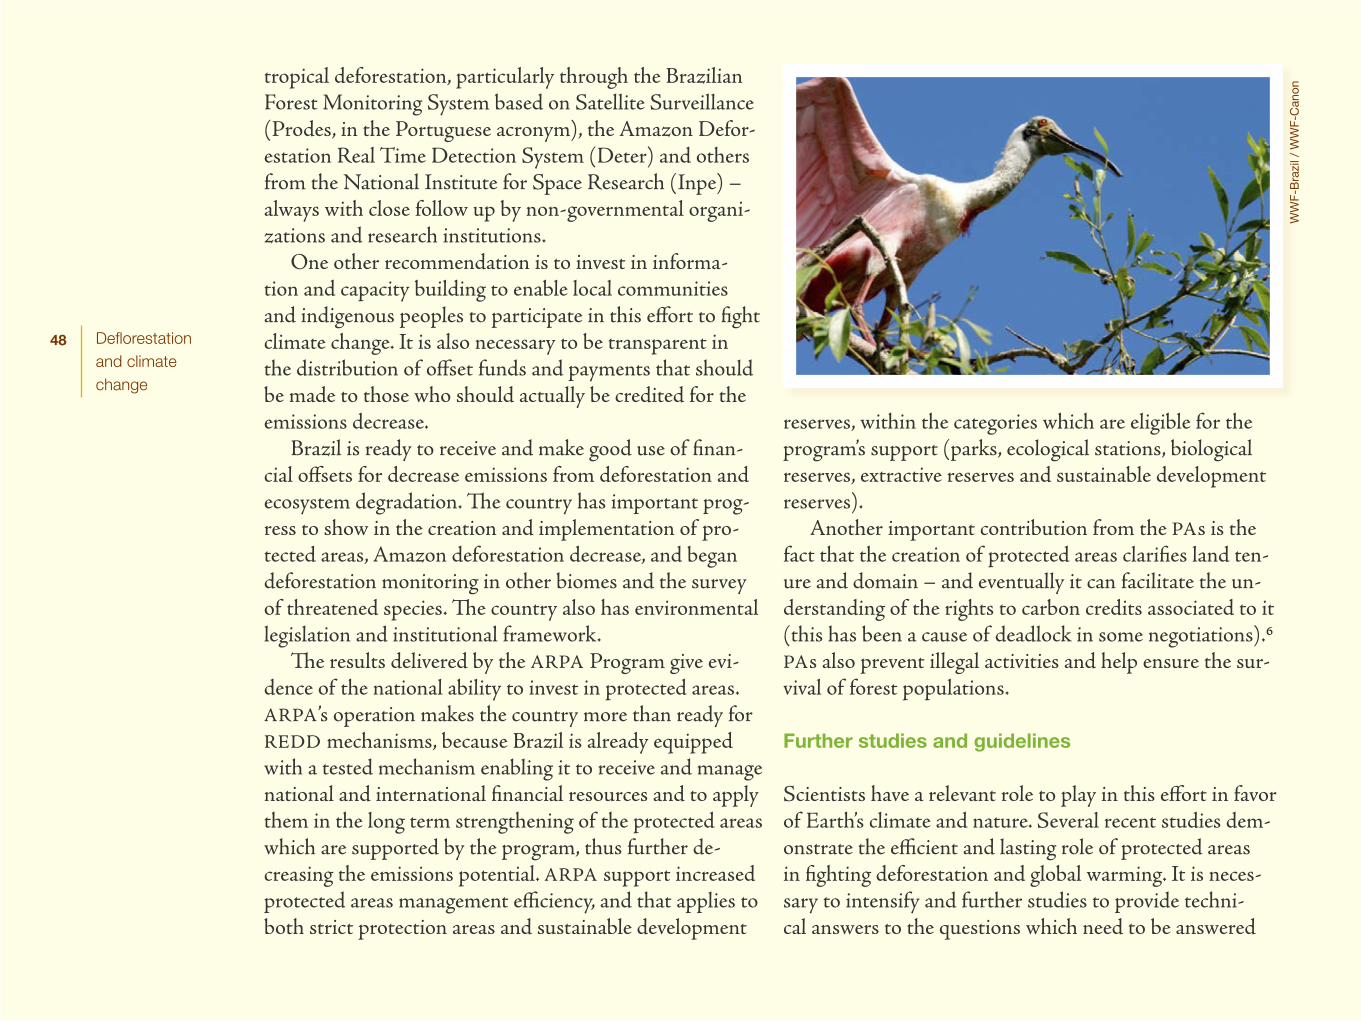
48 Deflorestation and climate change
tropical deforestation, particularly through the Brazilian Forest Monitoring System based on Satellite Surveillance (Prodes, in the Portuguese acronym), the Amazon Defor-estation Real Time Detection System (Deter) and others from the National Institute for Space Research (Inpe) – always with close follow up by non-governmental organi-zations and research institutions.
One other recommendation is to invest in informa-tion and capacity building to enable local communities and indigenous peoples to participate in this effort to fight climate change. It is also necessary to be transparent in the distribution of offset funds and payments that should be made to those who should actually be credited for the emissions decrease.
Brazil is ready to receive and make good use of finan-cial offsets for decrease emissions from deforestation and ecosystem degradation. The country has important prog-ress to show in the creation and implementation of pro-tected areas, Amazon deforestation decrease, and began deforestation monitoring in other biomes and the survey of threatened species. The country also has environmental legislation and institutional framework.
The results delivered by the ARPA Program give evi-dence of the national ability to invest in protected areas. ARPA’s operation makes the country more than ready for REDD mechanisms, because Brazil is already equipped with a tested mechanism enabling it to receive and manage national and international financial resources and to apply them in the long term strengthening of the protected areas which are supported by the program, thus further de-creasing the emissions potential. ARPA support increased protected areas management efficiency, and that applies to both strict protection areas and sustainable development
reserves, within the categories which are eligible for the program’s support (parks, ecological stations, biological reserves, extractive reserves and sustainable development reserves).
Another important contribution from the PAs is the fact that the creation of protected areas clarifies land ten-ure and domain – and eventually it can facilitate the un-derstanding of the rights to carbon credits associated to it (this has been a cause of deadlock in some negotiations).6 PAs also prevent illegal activities and help ensure the sur-vival of forest populations.
Further studies and guidelines
Scientists have a relevant role to play in this effort in favor of Earth’s climate and nature. Several recent studies dem-onstrate the efficient and lasting role of protected areas in fighting deforestation and global warming. It is neces-sary to intensify and further studies to provide techni-cal answers to the questions which need to be answered
WW
F-B
razi
l / W
WF-
Can
on
49 Deflorestation and climate change
by nations in order to define the policies to be adopted, particularly those referring to REDD strategies. Scientific support is crucial to increase credibility and success in the strategies to fight global warming. It is essential to deter-mine how effective the different features of protected areas can be in decreasing emissions from deforestation. Which should be the focus of investments? Carbon stocks must be identified, mapped and quantified, as well as the de-forestation risks and opportunity costs, in order to make choices based on the best cost-benefit relations.
Nevertheless, the integrated forest management per-spective should be maintained (protection, sustainable use, threat decrease etc.), as well as the protected areas mul-tiple objectives and benefits and the organization of PAs in system and subsystems, the strengthening of local com-munities and indigenous peoples and their rights, and the solidarity among them.
It is crucial for developing countries (like Brazil) where funds must be applied, as well as for developed and rich countries, which should provide the greater portion of those funds. They all depend on the best application of resources in order to obtain positive results for Earth’s climate.
There are no guidelines to direct the managers of the protected area systems to more strategic application of their limited resources. Which are the criteria and meth-ods to evaluate the contribution from each PA in reducing emissions? Is the amount of resources invested in a PA a determinant factor? Or does the greatest burden fall on PA management effectiveness? Or perhaps it falls on exter-nal social and economic factors? How can we quantify the relevance of local population presence and performance in the PA? It is known that all those factors contribute to de-
creasing emissions. What we do not know exactly is how and how much.
Forest degradation is much less studied than defores-tation. According to 2002 Asner et alii7 estimate, 20% of emissions from the Brazilian Amazon are caused by selec-tive logging and are associated to forest degradation. How-ever, exactly how effective are the strategies to fight forest degradation? Which is the role of protected areas in this sense? How can resource investment be optimized to fight forest degradation?
It is necessary to complement the measures which have already been adopted in favor of forests and climate through economic incentive mechanisms. Besides reduc-ing their own emissions, developed nations must support developing countries in their actions to decrease emissions and conserve their forest carbon stocks. Brazil, for ex-ample, should receive economic incentives to conserve its forests, especially in the Amazon, which shelters the most extended natural forests in the planet.
In spite of the accelerated forest destruction, around 80% of Amazon forests are still standing; they were not converted for other uses, such as agriculture and pastures. Protected areas play an essential role to keep those forests standing and to conserve the associated biodiversity and carbon stocks.
The study by Ipam, UFMG, WWF-Brazil and The Woods Hole Research Center8 proved that the PAs sup-ported by ARPA have in fact inhibited the Brazilian Amazon forest destruction and that the probability of oc-curring deforestation within a protected area is up to ten times lower than in its surroundings. The probability of a surrounding area to be deforested decreases as it comes closer to the protected area. To reach this conclusion the
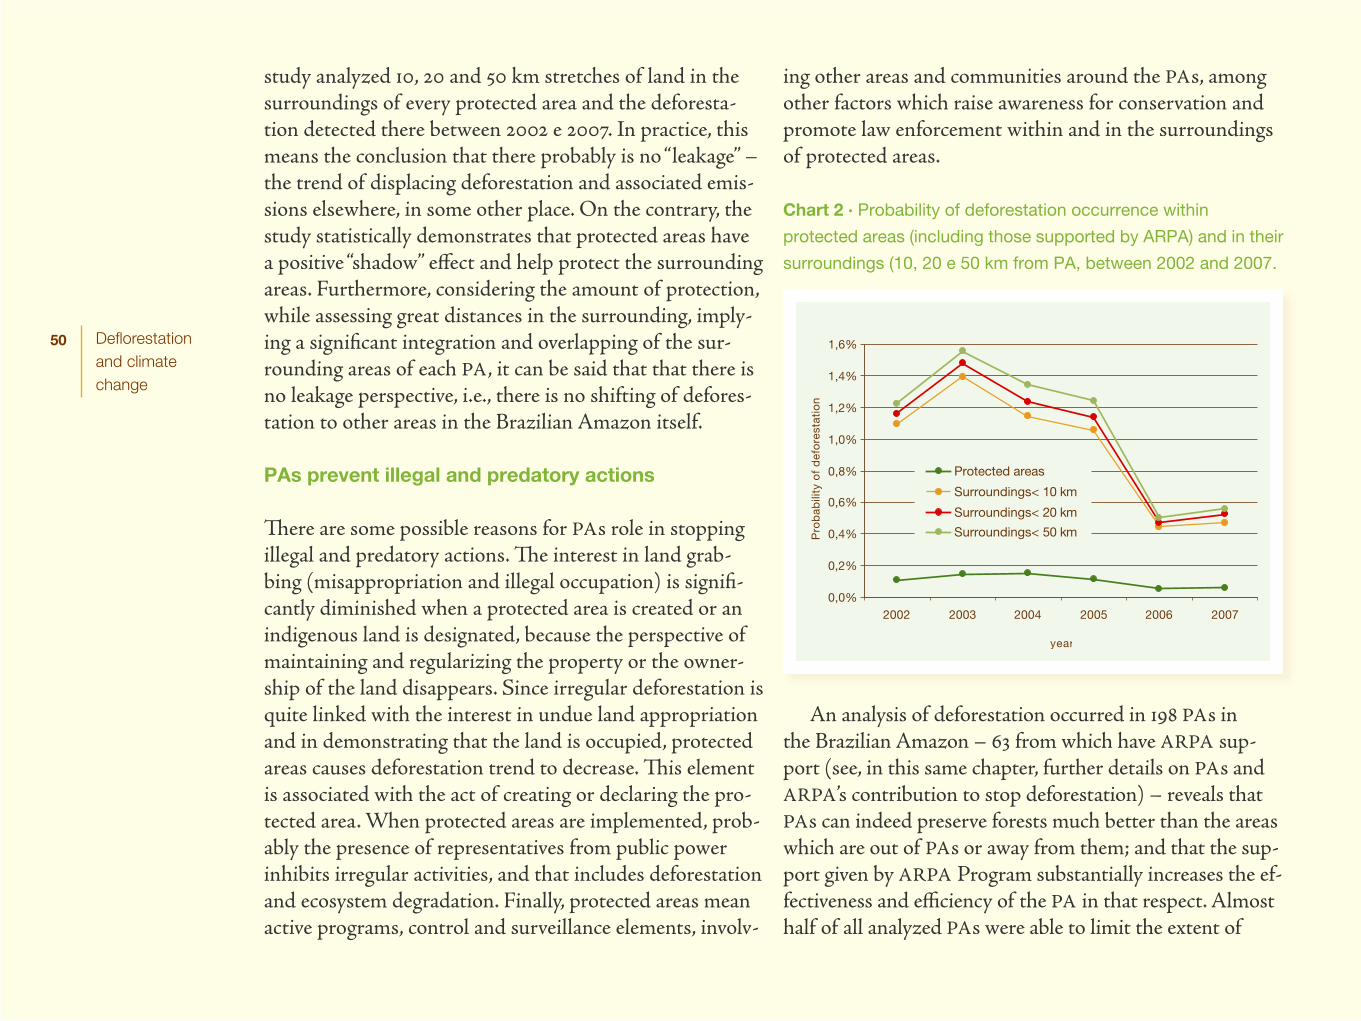
50 Deflorestation and climate change
study analyzed 10, 20 and 50 km stretches of land in the surroundings of every protected area and the deforesta-tion detected there between 2002 e 2007. In practice, this means the conclusion that there probably is no “leakage” – the trend of displacing deforestation and associated emis-sions elsewhere, in some other place. On the contrary, the study statistically demonstrates that protected areas have a positive “shadow” effect and help protect the surrounding areas. Furthermore, considering the amount of protection, while assessing great distances in the surrounding, imply-ing a significant integration and overlapping of the sur-rounding areas of each PA, it can be said that that there is no leakage perspective, i.e., there is no shifting of defores-tation to other areas in the Brazilian Amazon itself.
PAs prevent illegal and predatory actions
There are some possible reasons for PAs role in stopping illegal and predatory actions. The interest in land grab-bing (misappropriation and illegal occupation) is signifi-cantly diminished when a protected area is created or an indigenous land is designated, because the perspective of maintaining and regularizing the property or the owner-ship of the land disappears. Since irregular deforestation is quite linked with the interest in undue land appropriation and in demonstrating that the land is occupied, protected areas causes deforestation trend to decrease. This element is associated with the act of creating or declaring the pro-tected area. When protected areas are implemented, prob-ably the presence of representatives from public power inhibits irregular activities, and that includes deforestation and ecosystem degradation. Finally, protected areas mean active programs, control and surveillance elements, involv-
ing other areas and communities around the PAs, among other factors which raise awareness for conservation and promote law enforcement within and in the surroundings of protected areas.
Chart 2 · Probability of deforestation occurrence within
protected areas (including those supported by ARPA) and in their
surroundings (10, 20 e 50 km from PA, between 2002 and 2007.
An analysis of deforestation occurred in 198 PAs in the Brazilian Amazon – 63 from which have ARPA sup-port (see, in this same chapter, further details on PAs and ARPA’s contribution to stop deforestation) – reveals that PAs can indeed preserve forests much better than the areas which are out of PAs or away from them; and that the sup-port given by ARPA Program substantially increases the ef-fectiveness and efficiency of the PA in that respect. Almost half of all analyzed PAs were able to limit the extent of
0,0%
0,2%
0,4%
0,6%
0,8%
1,0%
1,2%
1,4%
1,6%
2002 2003 2004 2005 2006 2007
year
Pro
bab
ility
of
def
ore
stat
ion
Protected areas
Surroundings< 10 km
Surroundings< 20 km
Surroundings< 50 km
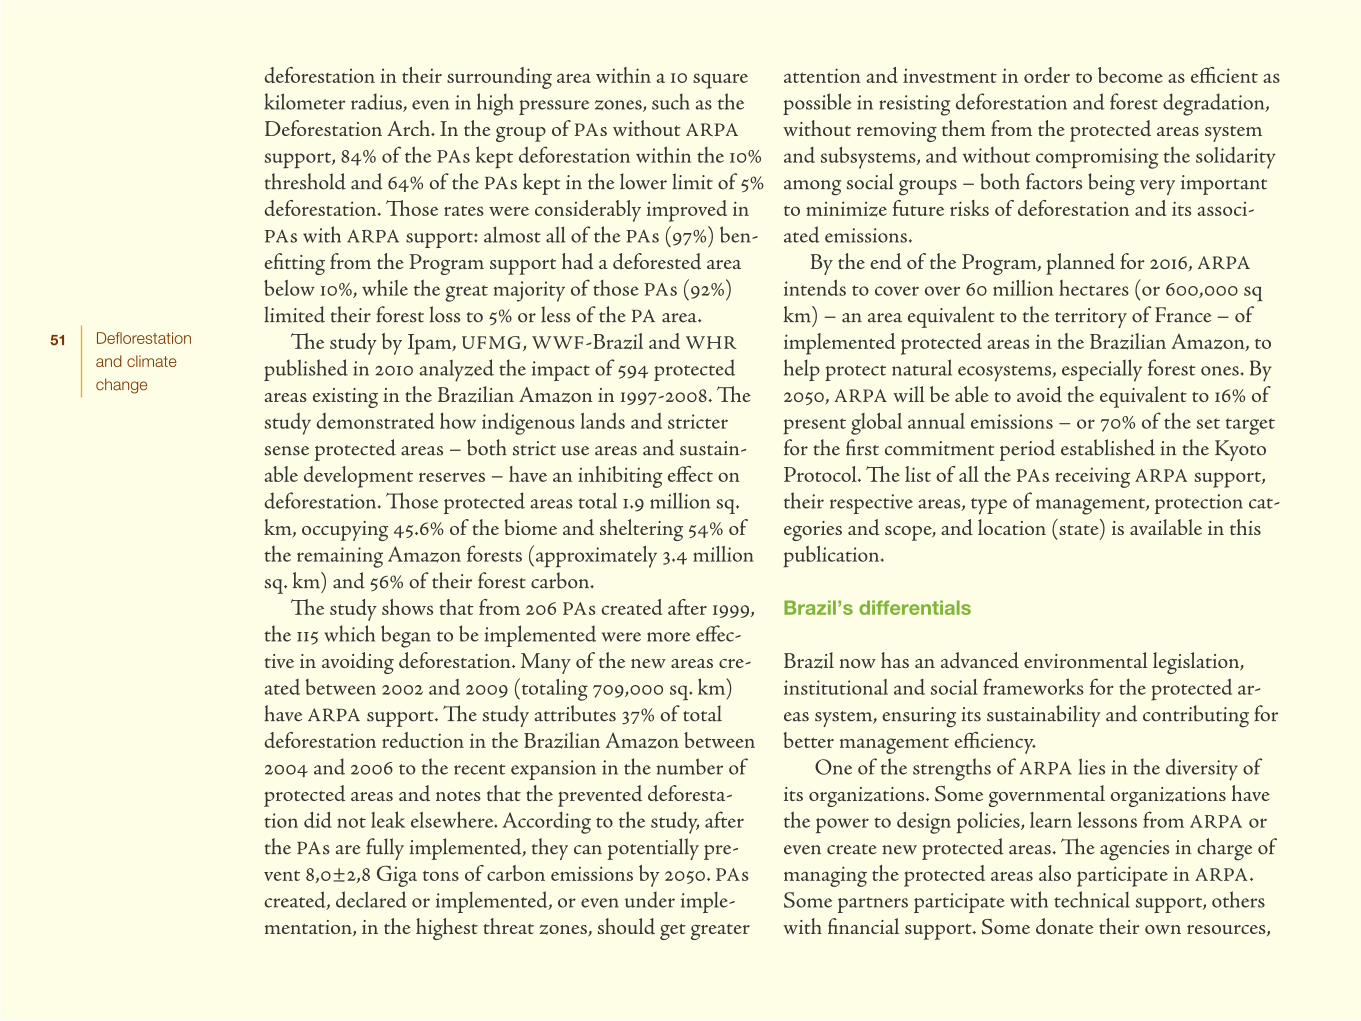
51 Deflorestation and climate change
deforestation in their surrounding area within a 10 square kilometer radius, even in high pressure zones, such as the Deforestation Arch. In the group of PAs without ARPA support, 84% of the PAs kept deforestation within the 10% threshold and 64% of the PAs kept in the lower limit of 5% deforestation. Those rates were considerably improved in PAs with ARPA support: almost all of the PAs (97%) ben-efitting from the Program support had a deforested area below 10%, while the great majority of those PAs (92%) limited their forest loss to 5% or less of the PA area.
The study by Ipam, UFMG, WWF-Brazil and WHR published in 2010 analyzed the impact of 594 protected areas existing in the Brazilian Amazon in 1997-2008. The study demonstrated how indigenous lands and stricter sense protected areas – both strict use areas and sustain-able development reserves – have an inhibiting effect on deforestation. Those protected areas total 1.9 million sq. km, occupying 45.6% of the biome and sheltering 54% of the remaining Amazon forests (approximately 3.4 million sq. km) and 56% of their forest carbon.
The study shows that from 206 PAs created after 1999, the 115 which began to be implemented were more effec-tive in avoiding deforestation. Many of the new areas cre-ated between 2002 and 2009 (totaling 709,000 sq. km) have ARPA support. The study attributes 37% of total deforestation reduction in the Brazilian Amazon between 2004 and 2006 to the recent expansion in the number of protected areas and notes that the prevented deforesta-tion did not leak elsewhere. According to the study, after the PAs are fully implemented, they can potentially pre-vent 8,0±2,8 Giga tons of carbon emissions by 2050. PAs created, declared or implemented, or even under imple-mentation, in the highest threat zones, should get greater
attention and investment in order to become as efficient as possible in resisting deforestation and forest degradation, without removing them from the protected areas system and subsystems, and without compromising the solidarity among social groups – both factors being very important to minimize future risks of deforestation and its associ-ated emissions.
By the end of the Program, planned for 2016, ARPA intends to cover over 60 million hectares (or 600,000 sq km) – an area equivalent to the territory of France – of implemented protected areas in the Brazilian Amazon, to help protect natural ecosystems, especially forest ones. By 2050, ARPA will be able to avoid the equivalent to 16% of present global annual emissions – or 70% of the set target for the first commitment period established in the Kyoto Protocol. The list of all the PAs receiving ARPA support, their respective areas, type of management, protection cat-egories and scope, and location (state) is available in this publication.
Brazil’s differentials
Brazil now has an advanced environmental legislation, institutional and social frameworks for the protected ar-eas system, ensuring its sustainability and contributing for better management efficiency.
One of the strengths of ARPA lies in the diversity of its organizations. Some governmental organizations have the power to design policies, learn lessons from ARPA or even create new protected areas. The agencies in charge of managing the protected areas also participate in ARPA. Some partners participate with technical support, others with financial support. Some donate their own resources,
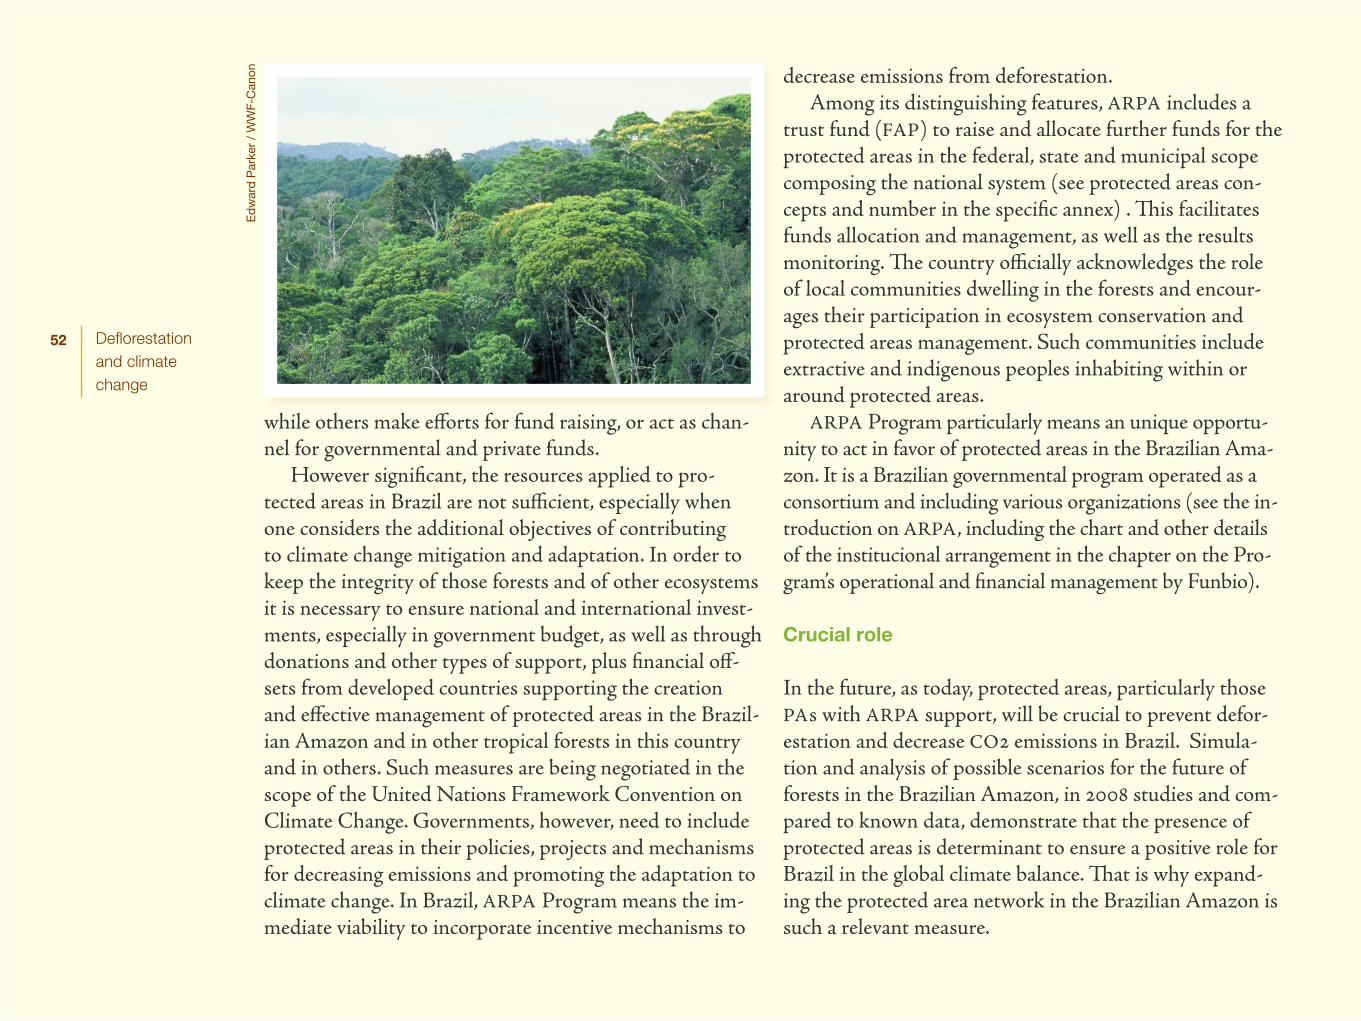
52 Deflorestation and climate change
while others make efforts for fund raising, or act as chan-nel for governmental and private funds.
However significant, the resources applied to pro-tected areas in Brazil are not sufficient, especially when one considers the additional objectives of contributing to climate change mitigation and adaptation. In order to keep the integrity of those forests and of other ecosystems it is necessary to ensure national and international invest-ments, especially in government budget, as well as through donations and other types of support, plus financial off-sets from developed countries supporting the creation and effective management of protected areas in the Brazil-ian Amazon and in other tropical forests in this country and in others. Such measures are being negotiated in the scope of the United Nations Framework Convention on Climate Change. Governments, however, need to include protected areas in their policies, projects and mechanisms for decreasing emissions and promoting the adaptation to climate change. In Brazil, ARPA Program means the im-mediate viability to incorporate incentive mechanisms to
decrease emissions from deforestation. Among its distinguishing features, ARPA includes a
trust fund (FAP) to raise and allocate further funds for the protected areas in the federal, state and municipal scope composing the national system (see protected areas con-cepts and number in the specific annex) . This facilitates funds allocation and management, as well as the results monitoring. The country officially acknowledges the role of local communities dwelling in the forests and encour-ages their participation in ecosystem conservation and protected areas management. Such communities include extractive and indigenous peoples inhabiting within or around protected areas.
ARPA Program particularly means an unique opportu-nity to act in favor of protected areas in the Brazilian Ama-zon. It is a Brazilian governmental program operated as a consortium and including various organizations (see the in-troduction on ARPA, including the chart and other details of the institucional arrangement in the chapter on the Pro-gram’s operational and financial management by Funbio).
Crucial role
In the future, as today, protected areas, particularly those PAs with ARPA support, will be crucial to prevent defor-estation and decrease CO2 emissions in Brazil. Simula-tion and analysis of possible scenarios for the future of forests in the Brazilian Amazon, in 2008 studies and com-pared to known data, demonstrate that the presence of protected areas is determinant to ensure a positive role for Brazil in the global climate balance. That is why expand-ing the protected area network in the Brazilian Amazon is such a relevant measure.
Ed
war
d P
arke
r /
WW
F-C
anon
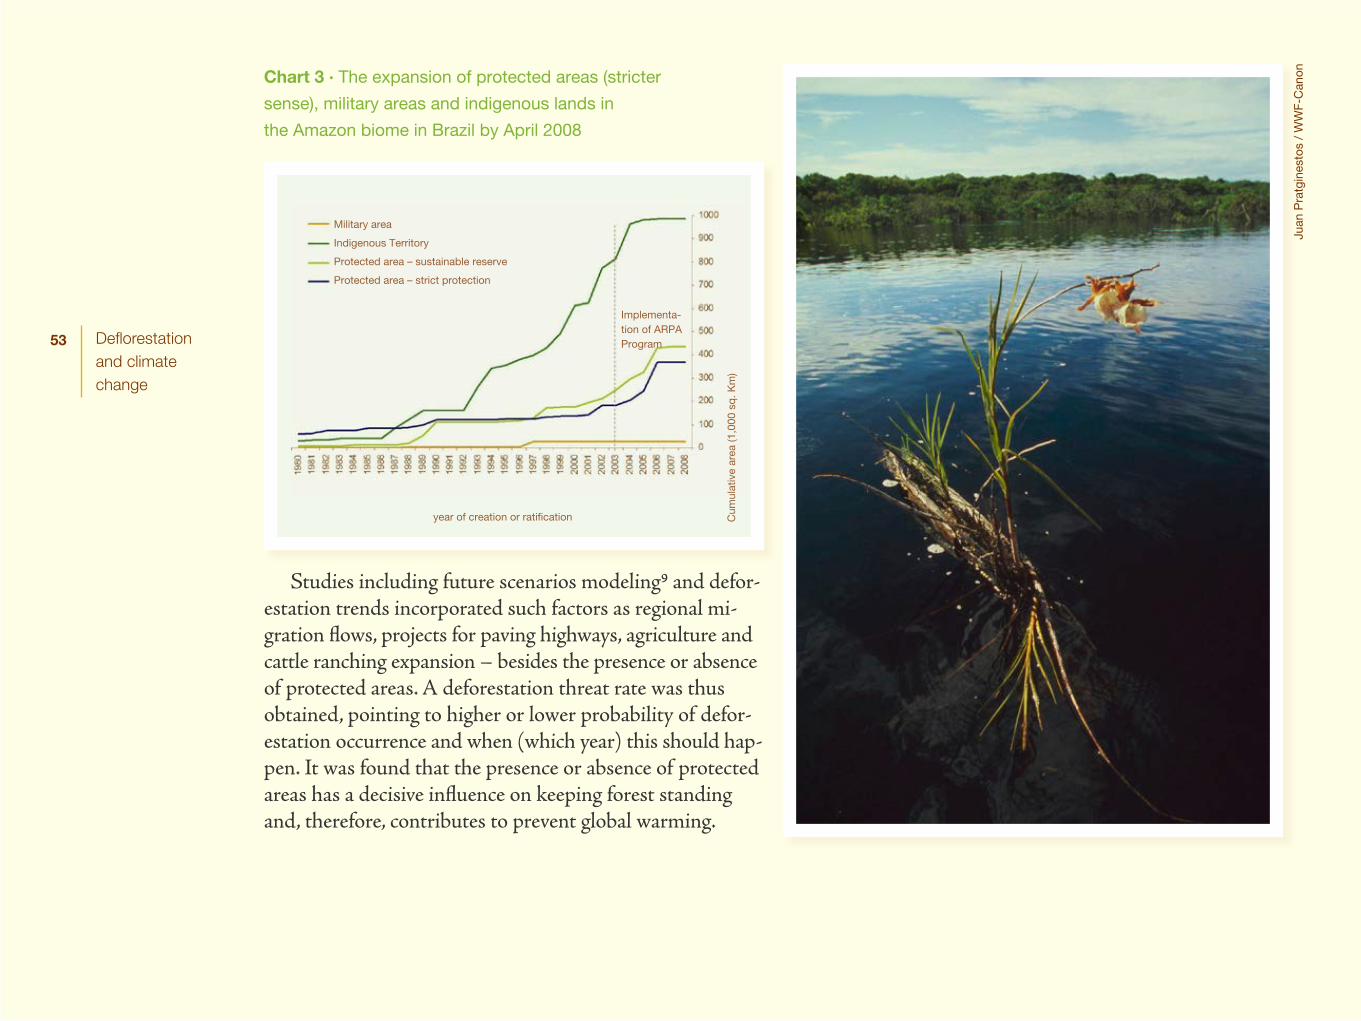
53 Deflorestation and climate change
Chart 3 · The expansion of protected areas (stricter
sense), military areas and indigenous lands in
the Amazon biome in Brazil by April 2008
Studies including future scenarios modeling9 and defor-estation trends incorporated such factors as regional mi-gration flows, projects for paving highways, agriculture and cattle ranching expansion – besides the presence or absence of protected areas. A deforestation threat rate was thus obtained, pointing to higher or lower probability of defor-estation occurrence and when (which year) this should hap-pen. It was found that the presence or absence of protected areas has a decisive influence on keeping forest standing and, therefore, contributes to prevent global warming.
Juan
Pra
tgin
esto
s /
WW
F-C
anon
Military area
Indigenous Territory
Protected area – sustainable reserve
Protected area – strict protection
Implementa-tion of ARPA Program
year of creation or ratification Cum
ulat
ive
area
(1,0
00 s
q. K
m)
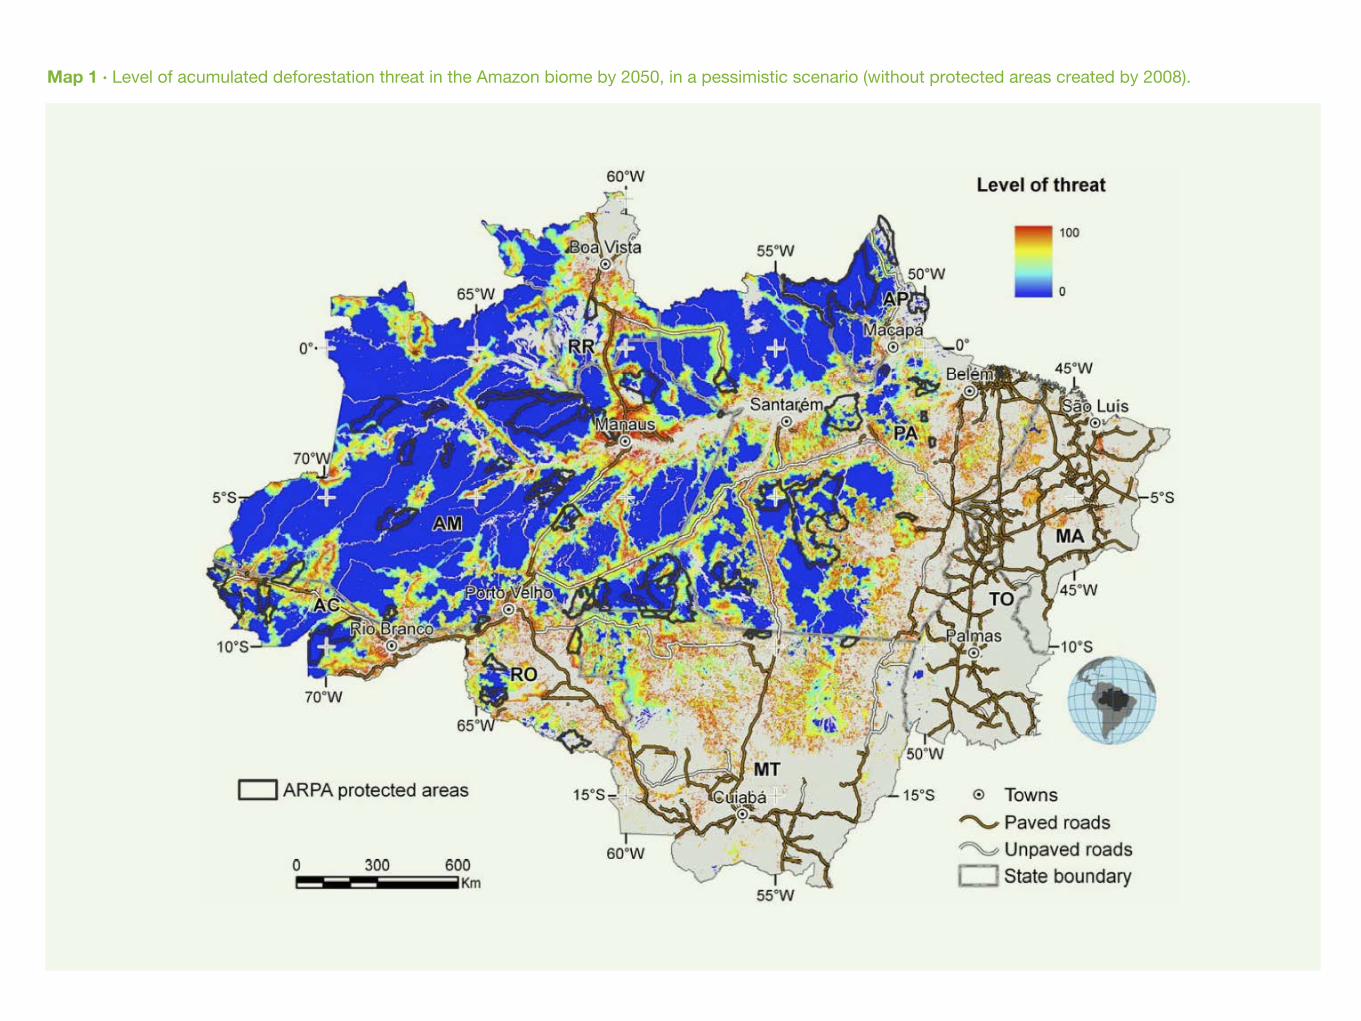
54 Deflorestation and climate change
Map 1 · Level of acumulated deforestation threat in the Amazon biome by 2050, in a pessimistic scenario (without protected areas created by 2008).
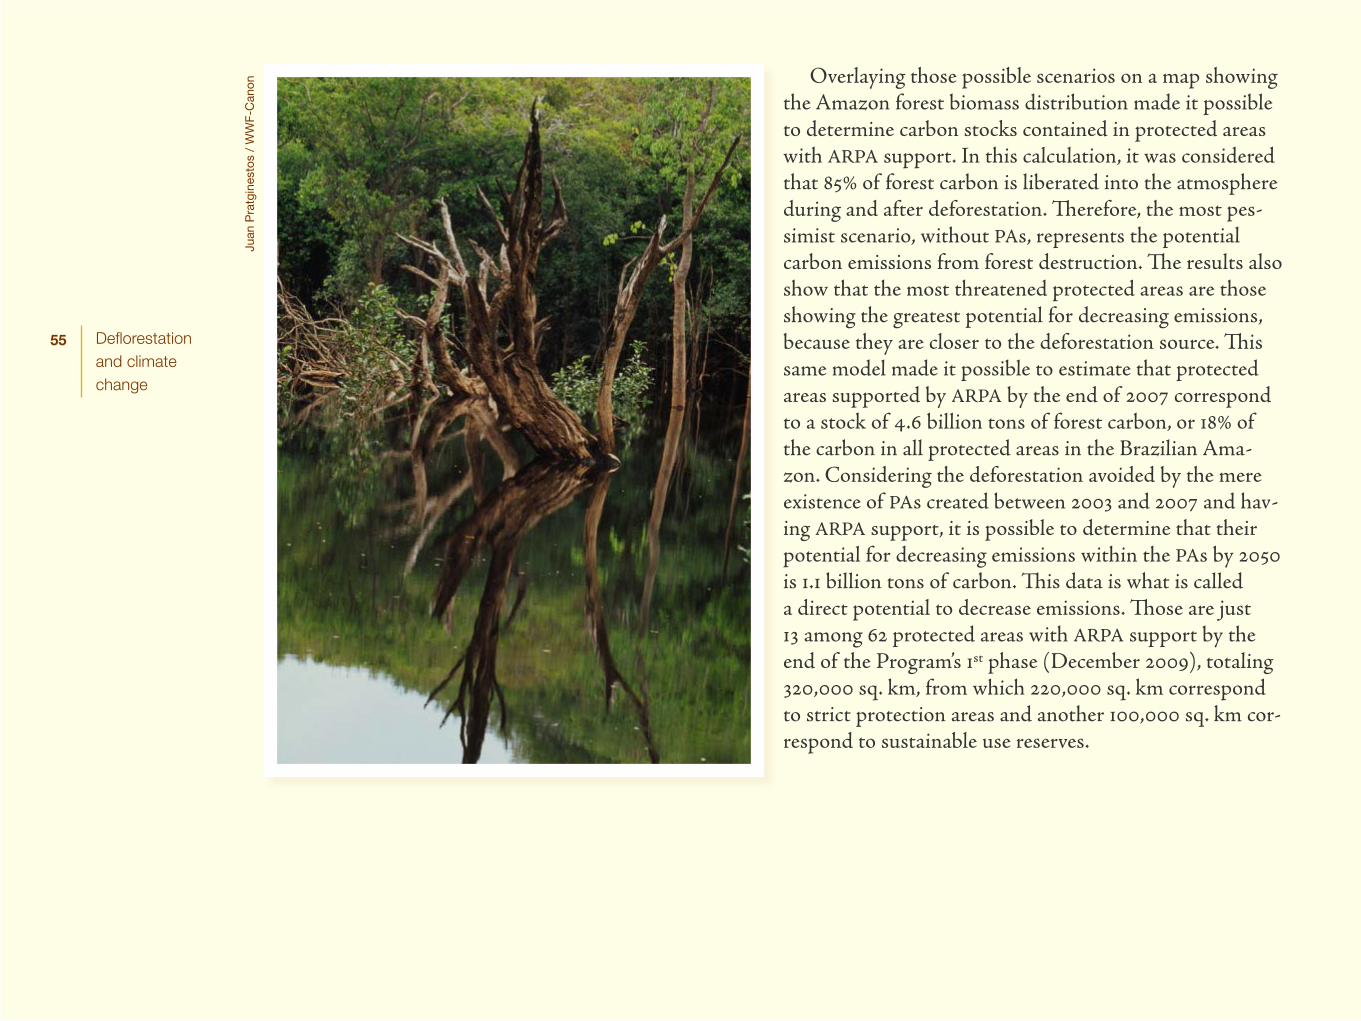
55 Deflorestation and climate change
Juan
Pra
tgin
esto
s /
WW
F-C
anon Overlaying those possible scenarios on a map showing
the Amazon forest biomass distribution made it possible to determine carbon stocks contained in protected areas with ARPA support. In this calculation, it was considered that 85% of forest carbon is liberated into the atmosphere during and after deforestation. Therefore, the most pes-simist scenario, without PAs, represents the potential carbon emissions from forest destruction. The results also show that the most threatened protected areas are those showing the greatest potential for decreasing emissions, because they are closer to the deforestation source. This same model made it possible to estimate that protected areas supported by ARPA by the end of 2007 correspond to a stock of 4.6 billion tons of forest carbon, or 18% of the carbon in all protected areas in the Brazilian Ama-zon. Considering the deforestation avoided by the mere existence of PAs created between 2003 and 2007 and hav-ing ARPA support, it is possible to determine that their potential for decreasing emissions within the PAs by 2050 is 1.1 billion tons of carbon. This data is what is called a direct potential to decrease emissions. Those are just 13 among 62 protected areas with ARPA support by the end of the Program’s 1st phase (December 2009), totaling 320,000 sq. km, from which 220,000 sq. km correspond to strict protection areas and another 100,000 sq. km cor-respond to sustainable use reserves.
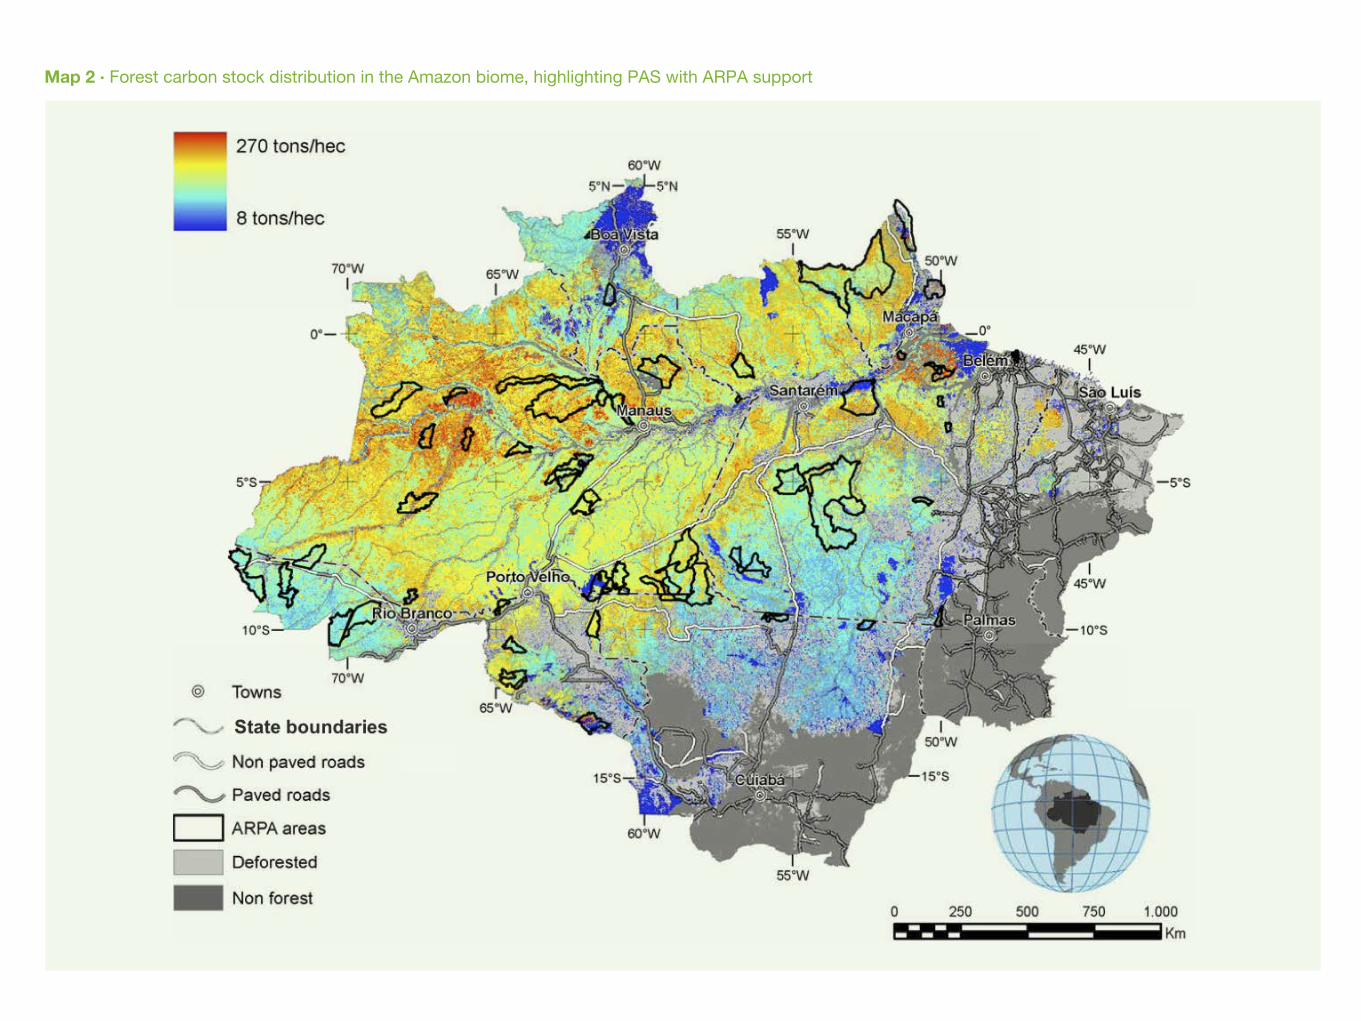
56 Deflorestation and climate change
Map 2 · Forest carbon stock distribution in the Amazon biome, highlighting PAS with ARPA support
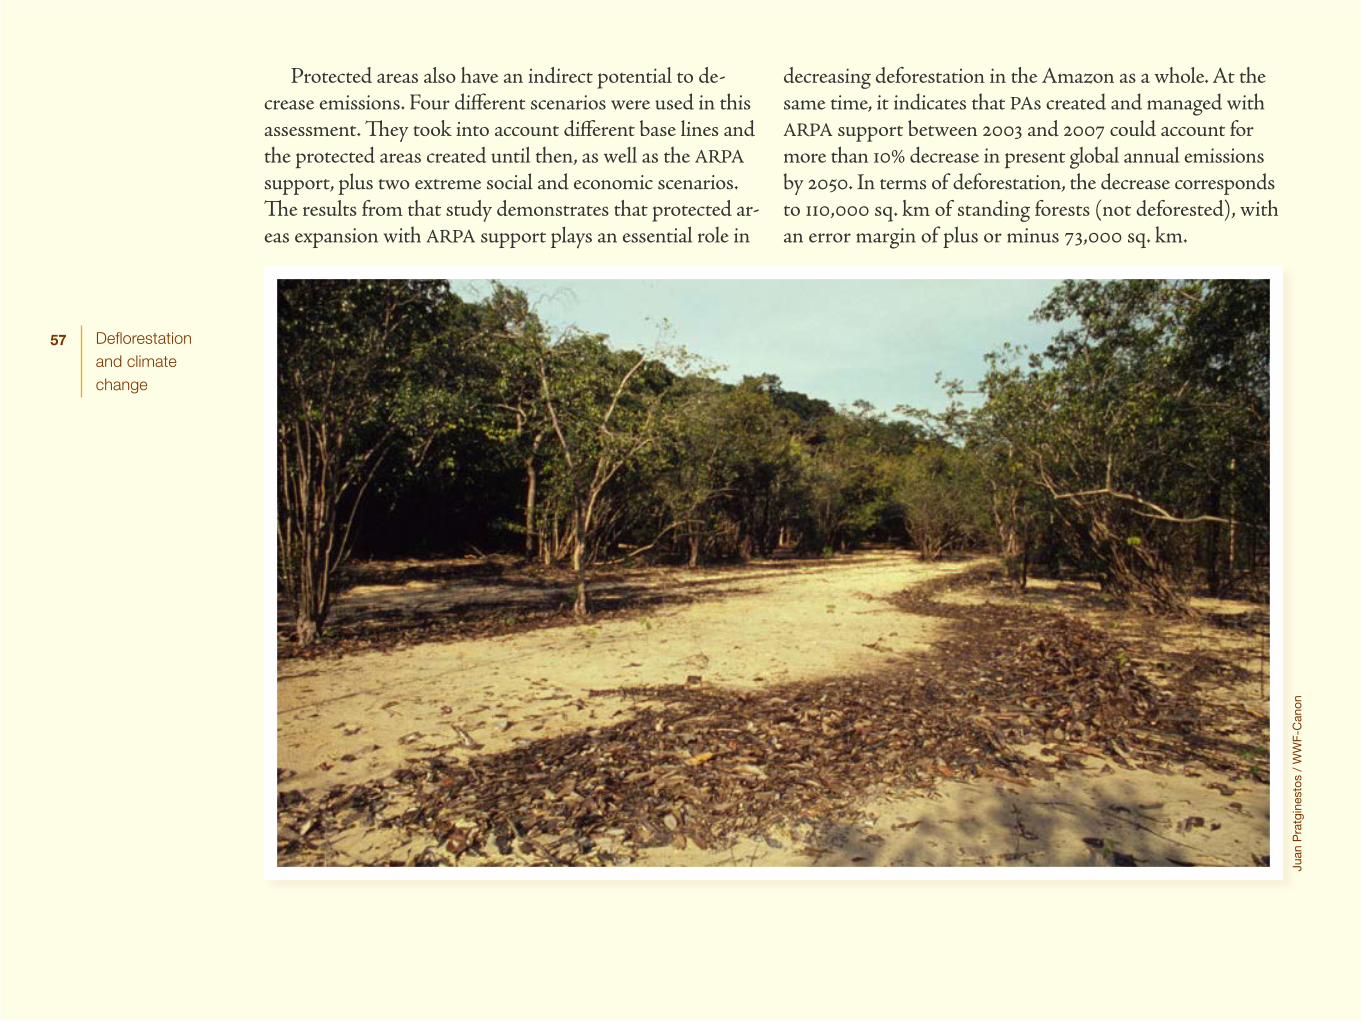
57 Deflorestation and climate change
Protected areas also have an indirect potential to de-crease emissions. Four different scenarios were used in this assessment. They took into account different base lines and the protected areas created until then, as well as the ARPA support, plus two extreme social and economic scenarios. The results from that study demonstrates that protected ar-eas expansion with ARPA support plays an essential role in
decreasing deforestation in the Amazon as a whole. At the same time, it indicates that PAs created and managed with ARPA support between 2003 and 2007 could account for more than 10% decrease in present global annual emissions by 2050. In terms of deforestation, the decrease corresponds to 110,000 sq. km of standing forests (not deforested), with an error margin of plus or minus 73,000 sq. km.
Juan
Pra
tgin
esto
s /
WW
F-C
anon
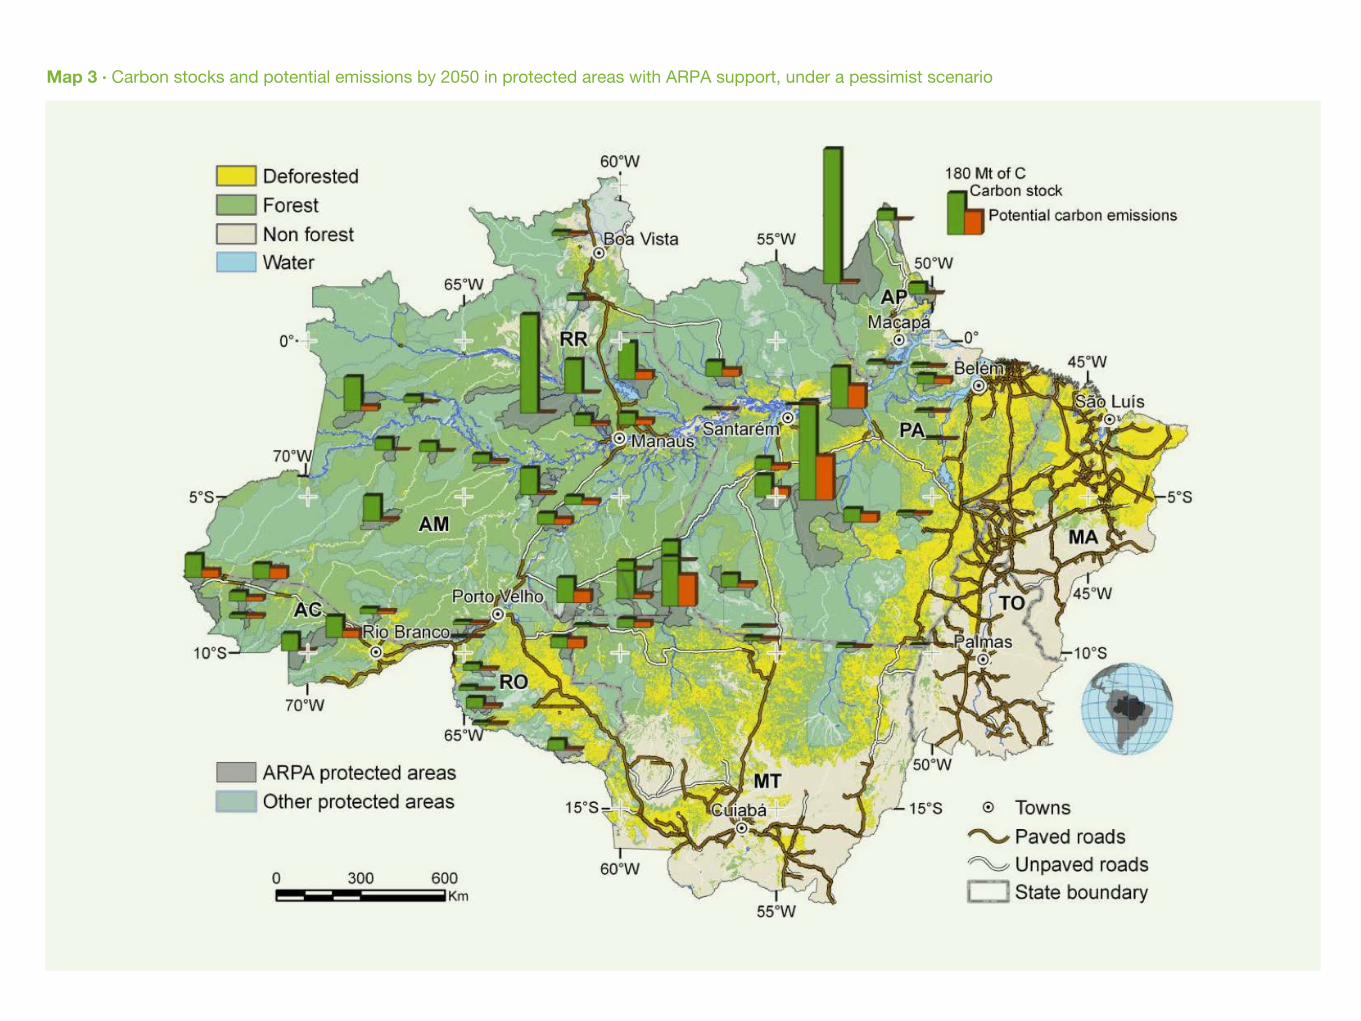
58 Deflorestation and climate change
Map 3 · Carbon stocks and potential emissions by 2050 in protected areas with ARPA support, under a pessimist scenario
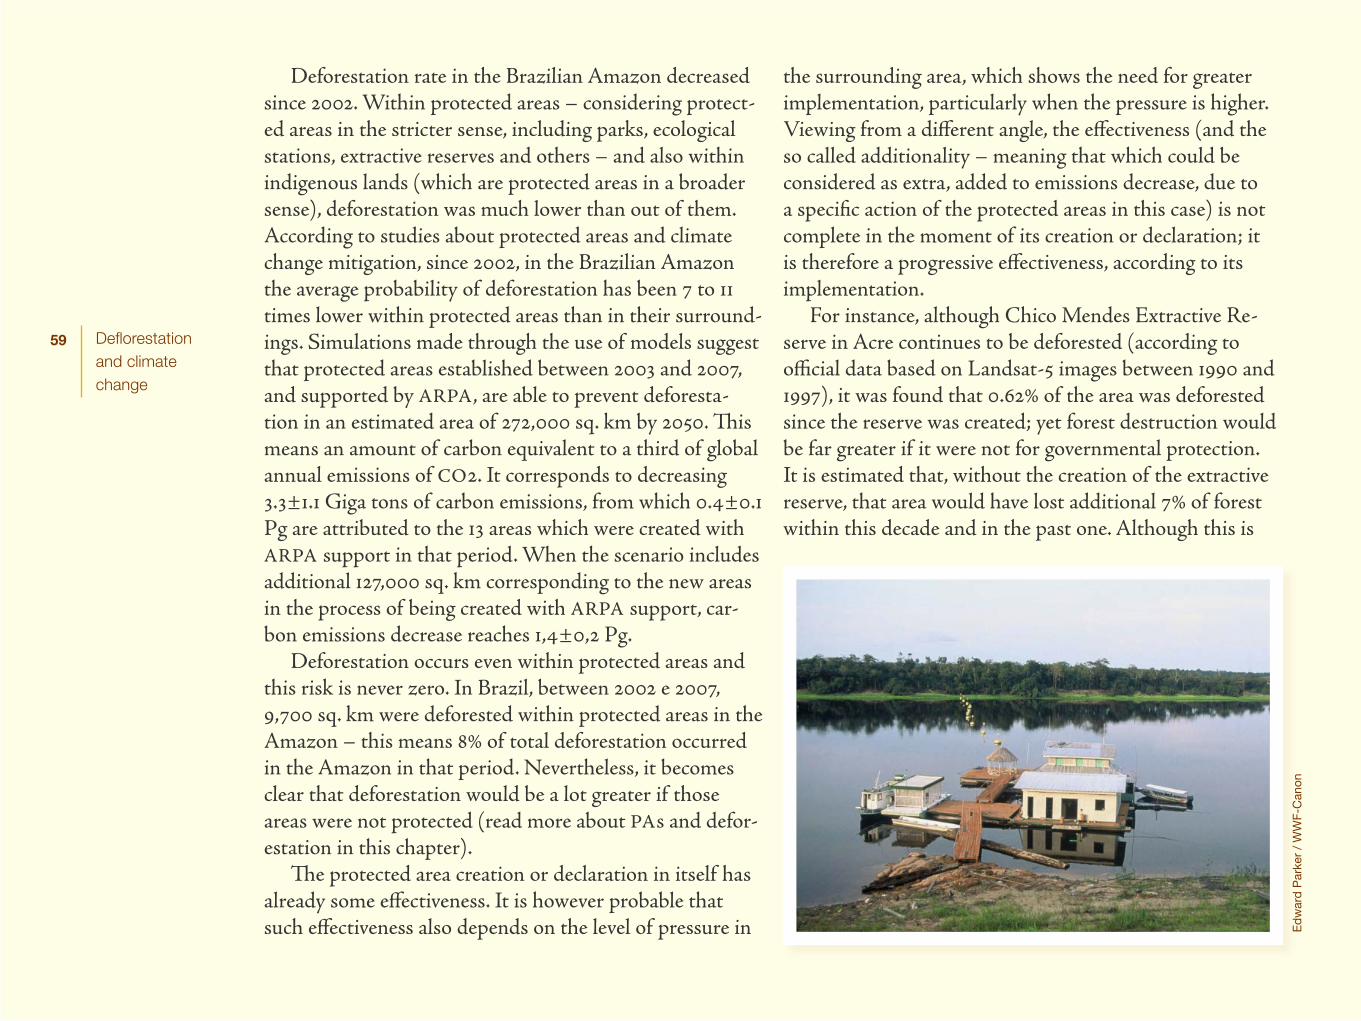
59 Deflorestation and climate change
Deforestation rate in the Brazilian Amazon decreased since 2002. Within protected areas – considering protect-ed areas in the stricter sense, including parks, ecological stations, extractive reserves and others – and also within indigenous lands (which are protected areas in a broader sense), deforestation was much lower than out of them. According to studies about protected areas and climate change mitigation, since 2002, in the Brazilian Amazon the average probability of deforestation has been 7 to 11 times lower within protected areas than in their surround-ings. Simulations made through the use of models suggest that protected areas established between 2003 and 2007, and supported by ARPA, are able to prevent deforesta-tion in an estimated area of 272,000 sq. km by 2050. This means an amount of carbon equivalent to a third of global annual emissions of CO2. It corresponds to decreasing 3.3±1.1 Giga tons of carbon emissions, from which 0.4±0.1 Pg are attributed to the 13 areas which were created with ARPA support in that period. When the scenario includes additional 127,000 sq. km corresponding to the new areas in the process of being created with ARPA support, car-bon emissions decrease reaches 1,4±0,2 Pg.
Deforestation occurs even within protected areas and this risk is never zero. In Brazil, between 2002 e 2007, 9,700 sq. km were deforested within protected areas in the Amazon – this means 8% of total deforestation occurred in the Amazon in that period. Nevertheless, it becomes clear that deforestation would be a lot greater if those areas were not protected (read more about PAs and defor-estation in this chapter).
The protected area creation or declaration in itself has already some effectiveness. It is however probable that such effectiveness also depends on the level of pressure in
the surrounding area, which shows the need for greater implementation, particularly when the pressure is higher. Viewing from a different angle, the effectiveness (and the so called additionality – meaning that which could be considered as extra, added to emissions decrease, due to a specific action of the protected areas in this case) is not complete in the moment of its creation or declaration; it is therefore a progressive effectiveness, according to its implementation.
For instance, although Chico Mendes Extractive Re-serve in Acre continues to be deforested (according to official data based on Landsat-5 images between 1990 and 1997), it was found that 0.62% of the area was deforested since the reserve was created; yet forest destruction would be far greater if it were not for governmental protection. It is estimated that, without the creation of the extractive reserve, that area would have lost additional 7% of forest within this decade and in the past one. Although this is
Ed
war
d P
arke
r /
WW
F-C
anon
60 Deflorestation and climate change
stronger in regions under high deforestation pressure, it seems quite clear that the creation of a protected area con-tributes to decrease present or future deforestation poten-tial, even in faraway regions – as it is the case of Chandless State Park, located in Acre state as well –, thus decreasing future risks.
One of the discussions about where and how to ap-ply the resources meant to decrease emissions from de-forestation and forest degradation is whether the focus of investments should be the areas under high development pressure (for instance, along highways or in the expanding agriculture frontier), or in more remote areas with high biodiversity. It is clear that both areas deserve attention, because protected areas objectives and benefits are multiple ones. A deviation (leakage) in the deforestation decrease trends would most probably occur in an area under the pressure of expanding agriculture and cattle ranching, and in the presence of infrastructure (particularly transporta-tion infrastructure). To prevent it, other measures may be adopted. The protected areas system and subsystem ap-proach and the solidarity among social groups are a more stable and safer system. So, even if a particular area today accounts for the greater part of decreased (or avoided) emissions – considering mainly the carbon flow –, financial investments should be allocated to the set of PAs – and eventually consider stocks, or other ecosystems benefits, or else other social reasons. This would ensure greater stabili-ty to the region in the future. The processes of conservation systematic planning and decision support systems can work with multiple criteria and support participation of different social actors, taking into consideration not only those inter-ests but also complementary ones, among others.
REDD+
REDD+ is an approach proposal for climate change mitigation representing opportunities to direct financial resources not just to decrease deforestation and degra-dation but also to conservation and to increase forest carbon stocks, as well as for forest sustainable manage-ment. For REDD+ to be more effective, it is necessary to prevent possible leakage of avoided deforestation into other areas. REDD+ mechanisms should reward forest conservation. REDD+ could support diversified activi-ties with a fair system of benefit sharing, valuing the stakeholders’ efforts in decreasing deforestation and for-est degradation. It is worth stressing, however, that the processes linked to the Convention on Climate Change consider the possibility of creating official REDD or REDD+ mechanisms according to which there would be a possibility of not only targeting funds but also to offset the compulsory amount of decreased emissions. On the other hand, we could consider as lato sensu or generic REDD (or REDD+) all mechanisms, official or not, which promote investments (or financial offset) for the efforts to decrease emissions from deforestation and ecosystem degradation.
Proposal of a global financial mechanism to reduce emissions from deforestation and degradation needs to advance to come true. ARPA demands immediate and substantial financial resources for its long term sus-tainability and the Program must be prioritized in the incentives and offsets to be adopted. In the Amazon deforestation map below, we can notice, in highlights, the protected areas which are supported by ARPA.
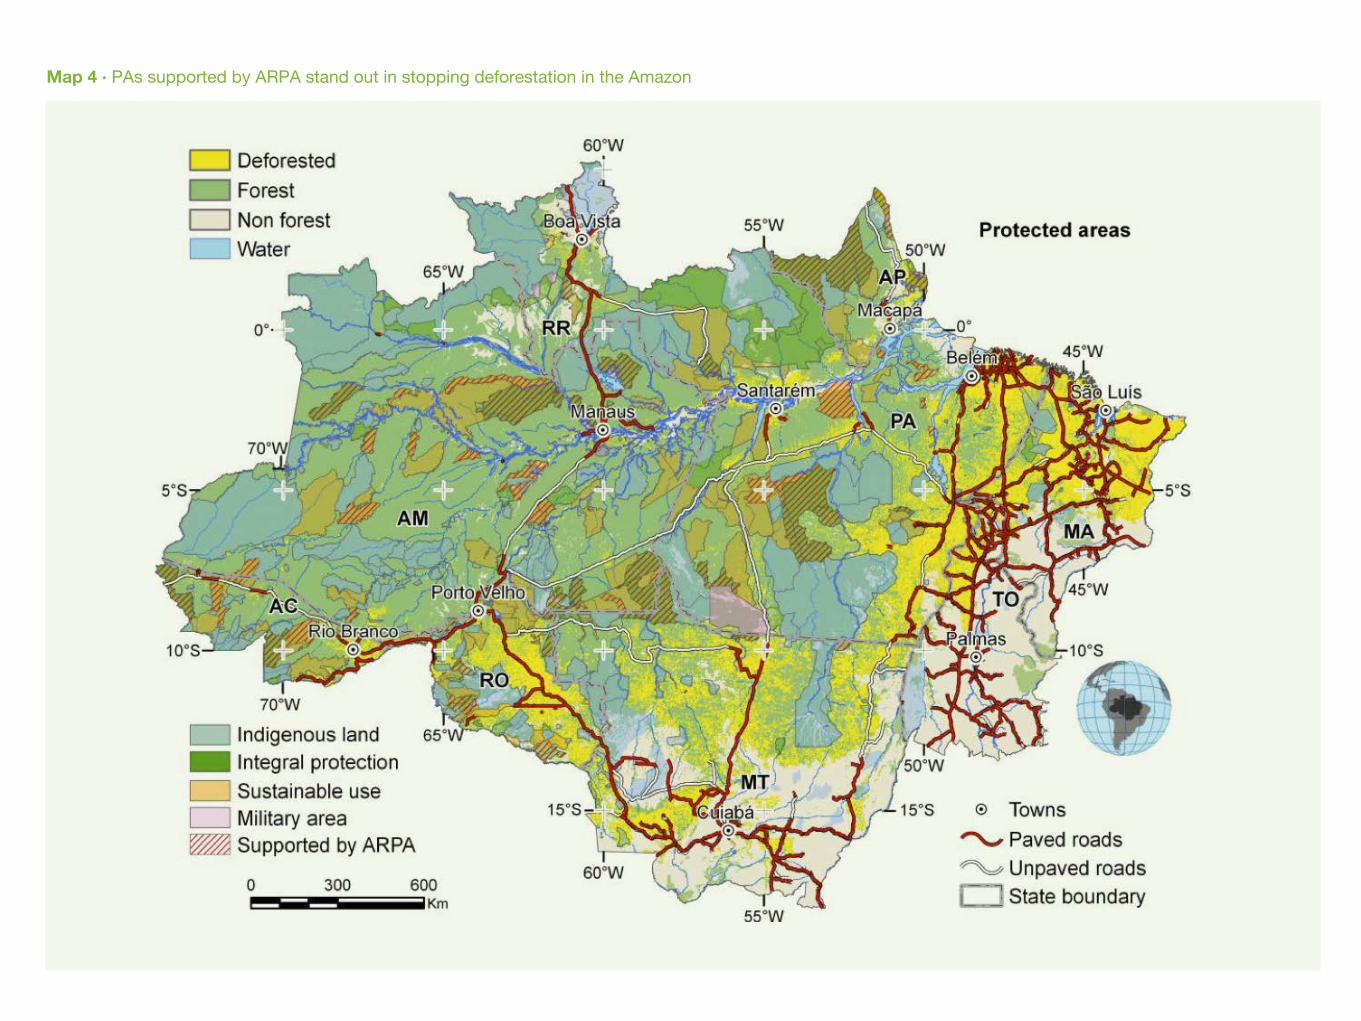
61 Deflorestation and climate change
Map 4 · PAs supported by ARPA stand out in stopping deforestation in the Amazon
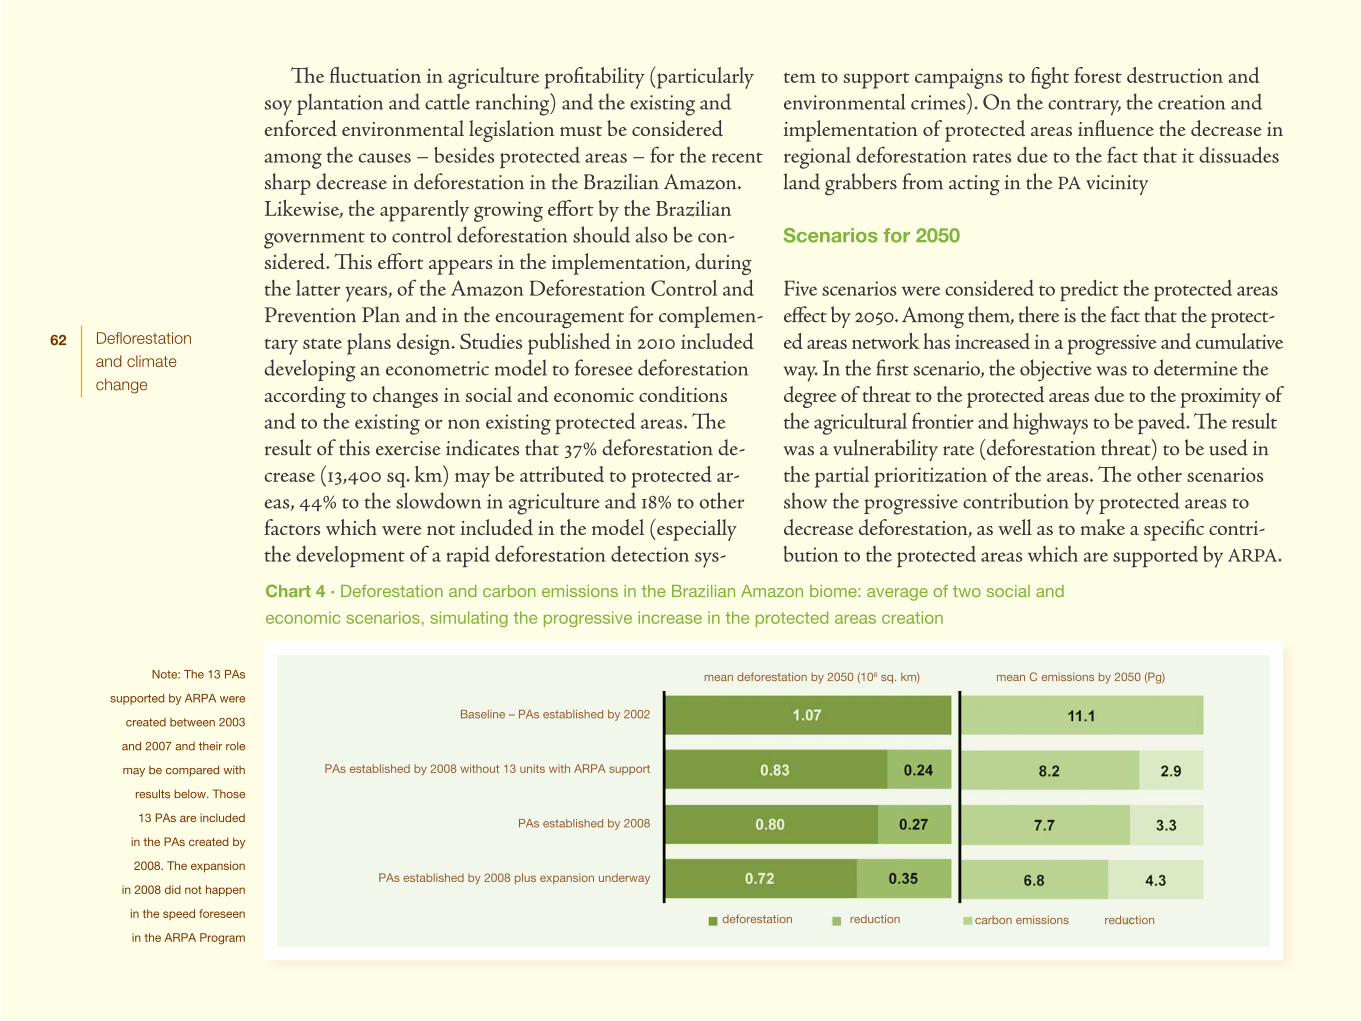
62 Deflorestation and climate change
Baseline – PAs established by 2002
PAs established by 2008 without 13 units with ARPA support
PAs established by 2008
PAs established by 2008 plus expansion underway
The fluctuation in agriculture profitability (particularly soy plantation and cattle ranching) and the existing and enforced environmental legislation must be considered among the causes – besides protected areas – for the recent sharp decrease in deforestation in the Brazilian Amazon. Likewise, the apparently growing effort by the Brazilian government to control deforestation should also be con-sidered. This effort appears in the implementation, during the latter years, of the Amazon Deforestation Control and Prevention Plan and in the encouragement for complemen-tary state plans design. Studies published in 2010 included developing an econometric model to foresee deforestation according to changes in social and economic conditions and to the existing or non existing protected areas. The result of this exercise indicates that 37% deforestation de-crease (13,400 sq. km) may be attributed to protected ar-eas, 44% to the slowdown in agriculture and 18% to other factors which were not included in the model (especially the development of a rapid deforestation detection sys-
tem to support campaigns to fight forest destruction and environmental crimes). On the contrary, the creation and implementation of protected areas influence the decrease in regional deforestation rates due to the fact that it dissuades land grabbers from acting in the PA vicinity
Scenarios for 2050
Five scenarios were considered to predict the protected areas effect by 2050. Among them, there is the fact that the protect-ed areas network has increased in a progressive and cumulative way. In the first scenario, the objective was to determine the degree of threat to the protected areas due to the proximity of the agricultural frontier and highways to be paved. The result was a vulnerability rate (deforestation threat) to be used in the partial prioritization of the areas. The other scenarios show the progressive contribution by protected areas to decrease deforestation, as well as to make a specific contri-bution to the protected areas which are supported by ARPA.
Chart 4 · Deforestation and carbon emissions in the Brazilian Amazon biome: average of two social and
economic scenarios, simulating the progressive increase in the protected areas creation
mean deforestation by 2050 (106 sq. km) mean C emissions by 2050 (Pg)
deforestation reduction carbon emissions reduction
Note: The 13 PAs
supported by ARPA were
created between 2003
and 2007 and their role
may be compared with
results below. Those
13 PAs are included
in the PAs created by
2008. The expansion
in 2008 did not happen
in the speed foreseen
in the ARPA Program
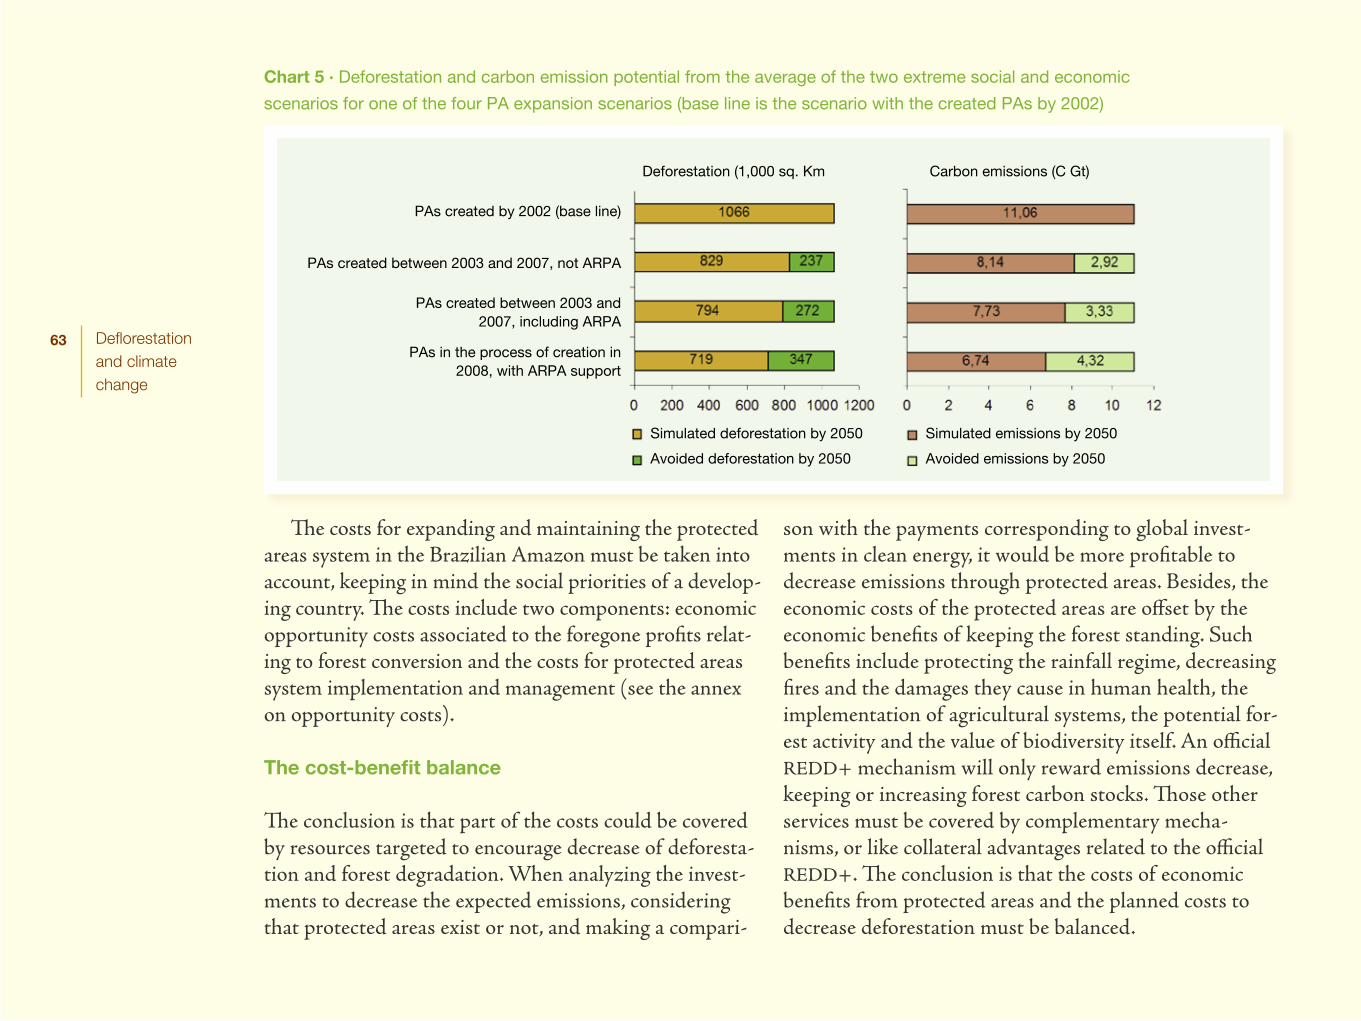
63 Deflorestation and climate change
The costs for expanding and maintaining the protected areas system in the Brazilian Amazon must be taken into account, keeping in mind the social priorities of a develop-ing country. The costs include two components: economic opportunity costs associated to the foregone profits relat-ing to forest conversion and the costs for protected areas system implementation and management (see the annex on opportunity costs).
The cost-benefit balance
The conclusion is that part of the costs could be covered by resources targeted to encourage decrease of deforesta-tion and forest degradation. When analyzing the invest-ments to decrease the expected emissions, considering that protected areas exist or not, and making a compari-
son with the payments corresponding to global invest-ments in clean energy, it would be more profitable to decrease emissions through protected areas. Besides, the economic costs of the protected areas are offset by the economic benefits of keeping the forest standing. Such benefits include protecting the rainfall regime, decreasing fires and the damages they cause in human health, the implementation of agricultural systems, the potential for-est activity and the value of biodiversity itself. An official REDD+ mechanism will only reward emissions decrease, keeping or increasing forest carbon stocks. Those other services must be covered by complementary mecha-nisms, or like collateral advantages related to the official REDD+. The conclusion is that the costs of economic benefits from protected areas and the planned costs to decrease deforestation must be balanced.
Chart 5 · Deforestation and carbon emission potential from the average of the two extreme social and economic
scenarios for one of the four PA expansion scenarios (base line is the scenario with the created PAs by 2002)
PAs created by 2002 (base line)
PAs created between 2003 and 2007, not ARPA
PAs created between 2003 and 2007, including ARPA
PAs in the process of creation in 2008, with ARPA support
Deforestation (1,000 sq. Km Carbon emissions (C Gt)
Simulated deforestation by 2050
Avoided deforestation by 2050
Simulated emissions by 2050
Avoided emissions by 2050
64 Deflorestation and climate change
Green barrier
The expansion of a protected area network in the Brazilian Amazon established a new environmental conservation paradigm. Focus includes not only the areas concentrating great biodiversity and which are under threat – hotspots – but the establishing of large forest blocks which can act like a green barrier to stop deforestation. Excellent Ama-zon conservation strategy, according to the study, should include protected areas which are rich in biodiversity and face low risk. Thus it would be possible to ensure lasting protection of biodiversity samples while acting to decrease carbon emissions.
Finally, special attention should be given to private con-servation initiatives, integrating them with public policies and more direct government application (such as forest control, public protected areas creation and management etc.) through an integrated approach, considered to be vital for programs meant to reduce emissions from defor-estation and ecosystem degradation. Such approach would include strategies like the expansion of markets which attribute value to better environmental and social perfor-mance in forest and agricultural activities; land use zon-ing to prevent uncontrolled expansion of agribusiness and cattle ranching; improved monitoring and law enforce-ment by government agencies; economic and technical incentives to help land owners and occupants to comply with the Brazilian Forest Law10.
In order to measure the effectiveness of protected areas in stopping deforestation in local terms, several variables were taken into consideration: the distance from rivers and highways, the value of income from soy and cattle ranching, adequacy of soil and land to mechanized crops, soil elevation and gradient (slope), the attraction to urban
centers. Other analyzed factors include spatial dependence between the protected area creation and deforestation, protected area contribution to the recent decrease in Ama-zon deforestation rates and its future contribution to de-crease deforestation, the costs of protected areas. In order to simulate potential income from a REDD market for the Amazon protected areas, this study applied a deforesta-tion model together with the map of opportunity costs.
The participants in the seminary entitled The role of protected areas in decreasing emissions from deforestation (REDD) got together in Brasilia in October 2009 and their discussions went beyond ARPA, although they re-mained within the context of the National Protected Ar-eas System. They concluded that protected areas creation and efficient management, shared with indigenous peoples and extractive communities, play a crucial role in decreas-ing GHG emissions from deforestation and ecosystem degradation (REDD) in Brazil. Protected areas offer a se-ries of other services and benefits to society. They stressed the economic advantages represented by PAs and recom-mend that protected areas be a part of all policies, proj-ects and mechanisms for emissions decrease and climate change adaptation, as well as to receive the investments, particularly the economic incentives.
They also recommend the development of sustainable use of natural resources policies and associated markets. Not only do they help avoiding deforestation as they also strengthen social structure of local communities and in-digenous people. For instance: forest and extractive eco-nomic chains, products and service chain associated to protected areas – like tourism, ecological services, research and others. Another measure emphasized in this seminary was fair benefit sharing from the effort to reduce GHG emissions caused by deforestation in Brazil.
65 Deflorestation and climate change
References and notes
1 Soares-Fº., B.; Dietzsch, L; Moutinho, P.; Falieri, A.; Rodrigues, H.; Pinto, E.; Maretti, C. C.; Scaramuzza, C. A. de M.; Anderson, A.; Suassuna, K.; Lanna, M. & Vasconcelos de Araújo, F. 2009. Redução das Emissões de Carbono do Desmatamento no Brasil: o papel do Programa Áreas Protegidas da Amazônia (ARPA), Brasília, WWF-Brasil. 21 p. / Soares-Fº., B.; Dietzsch, L; Moutinho, P.; Falieri, A.; Rodrigues, H.; Pinto, E.; Maretti, C. C.; Scaramuzza, C. A. de M.; Anderson, A.; Suassuna, K.; Lanna, M. & Vasconcelos de Araújo, F. 2009. Reducing Carbon Emissions from Deforestation: the Role of ARPA’s Protected Areas in the Brazilian Amazon, Brasília, WWF-Brasil. 11 p.
2 The above text is mainly based in the following documents:
Soares-Fº. et alii, 2010 (op.cit.).
Soares-Fº., B.; Moutinho, P.; Nepstad, D.; Anderson, A.; Rodrigues, H.; Garcia, R.; Dietzsch, L.; Merry, F.; Bowman, M.; Hissa, L.; Sil-vestrini, R. & Maretti, C. 2010. Role of Brazilian Amazon protected areas in climate change mitigation. PNAS: www.pnas.org/cgi/doi/10.1073/pnas.0913048107.
Ricketts, T.H; Soares-Fº., B.; Fonseca, G.A.B. da; Nepstad, D.; Pfaff, A.; Petsonk, A.; Anderson, A.; Boucher, D.; Cattaneo, A.; Conte, M.; Creighton, K.; Linden, L.; Maretti, C.; Moutinho, P.; Ullman, R.; Victurine, R.; . 2010. Indigenous Lands,Protected Areas, and Slowing Climate Change. PLoS Biol 8(3): e1000331. doi:10.1371/journal.pbio.1000331.
Brasil. 2010. Programa Áreas Protegidas da Amazônia, Fase II; documento de programa do Governo Brasileiro. Brasília, MMA-SBF-DAP-ARPA. 79 p.
WWF-Brasil, Ipam, Linden Trust for Conservation et alii. 2009.
As mudanças climáticas, a redução das emissões oriundas de des-matamento e as áreas protegidas. Brasília, 08 de outubro de 2009.Declaração do seminário. / Climate change, reducing emissions from deforestation, and protected areas. Brasilia, October 8th, 2009. Worshop declaration. 7 p. (PAs-Redd seminary 2009Oct8,final statement (Declaração final do seminário sobre mudanças climáticas e REDD, Brasília, 8 de outubro de 2009
Nepstad, D. C.; Stickler, C. M. & Almeida, O. T.,2006. Globaliza-tion of the Amazon soy and beef industries: opportunities for con-servation. Conservation Biology 20:1595-1603
Landel-Mills, N. & Porras, T.I. 2002. Silver bullet or folls’ gold; a global review of markets for forest environmental services and their impact on the poor. London International Institute for Environment and Development; apud Ricketts et alii, 2010 (op.cit.).
3 Ricketts et alii, 2010 (op.cit.)
4 Nepstad, D.; Soares-Fº., B. S.; Merry, F.; Lima, A.; Mouinho, P. et alii. 2009.The end of deforestation in the Brazilian Amazon. Science 326: 1350-1351; apud Ricketts et alii, 2010 (op.cit.).
5 Ricketts et alii, 2010 (op.cit.)
6 Soares-Fº. et alii, 2010 (op.cit.).
7 Asner, G.P.; Knapp, D.E.; Broadbet, E. N.; Oliveira, P.J.C.; Keller, M. et alii. 2005., Selective logging in the Brazilian Amazon. Science 310: 480-482.
8 Soares-Fº. et alii, 2010 (op.cit.).
9 Like SimAmazônia-2.
10 It is worth noting that, especially at this moment, the Brazilian Forest Law is a frequent target for attempts to change this law, to weaken it or to eliminate native vegetation protection requirements. There is a
66 Deflorestation and climate change
proposal in Congress intended for the benefit of the agribusiness sec-tor interests and of those of great landowners, in detriment of forest conservation, including in Permanent Preservation Areas. Brazilian environmental organizations follow up this process and make state-ments positioning themselves against this proposal and alerting po-litical and government leaders, as well as public opinion, against this threat. Nevertheless, this is not about a battle between the so called “ruralists” and the environmentalists. In fact this is about a struggle between the “old economy” and the “new economy” – i.e., on one hand there are those defending a backward view of a predatory economy, accumulation of assets, appropriation at any cost, production increase through infinite expansion of areas, those who believe that lands and
natural resources may be considered to be endless; and on the other hand, there are those who understand that sustainability presents new challenges, within which there is room for Brazil to make even further progress, and development will in fact occur, and that it will be more fair and long lasting; those who defend green economy and attribute adequate economic value to biodiversity and the services supplied by ecosystems.
To keep and improve the enforcement of the Forest Law is important for Brazil to fight deforestation, decrease GHG emissions, particularly CO2, and to not only preserve forests and native vegetation, as well as its associated biodiversity, but also its landscape, relief, water sources and river flow, with the thorough functioning of the ecosystems.
67 Deflorestation and climate change