Embed Size (px)
Citation preview
Prepared By:
707 17th Street, 40TH Floor Denver, Colorado 80202 USA Phone 303.462.7000
Canadian National Instrument 43-101 Technical Report
Çöpler Sulfide Expansion Project
Feasibility Study Erzincan Province, Turkey
Prepared for:
9635 Maroon Circle, Suite 300 Englewood, CO. 80112 USA
Report Date: July 29th, 2014 Effective Date: July 29th, 2014
Richard Bohling, PE, Jacobs
Richard Kiel, PE, Golder Associates Inc.
Dale Armstrong, CPG, RG, Golder Associates Inc.
Mark Liskowich, P. Geo, SRK Consulting (Canada) Inc.
Jeff Parshley, P.G., CPG, C.E.M., SRK Consulting (U.S.) Inc.
Bret Swanson, B. Eng., SRK Consulting (U.S.) Inc.
Gordon Seibel, R.M. SME, AMEC E&C Services Inc. (AMEC)
Dr. Harry Parker, PhD, R.M. SME, AMEC E&C Services Inc. (AMEC)
Lisa Bascombe, B. Geo., Optiro Pty Ltd (Optiro)
In Collaboration with:
IMPORTANT NOTICE This report was prepared as a National Instrument 43-101 Technical Report for Alacer Gold Corp (Alacer) prepared by Jacobs with portions of the report contributed by Jacobs, Golder Associates, SRK Consulting and AMEC E&C Services Inc. (AMEC) (collectively the Consulting Engineering Firms). The quality of information, conclusions, and estimates contained within the contributor-prepared sections is consistent with the level of effort involved in the contributors various services, based on i) information available at the time of preparation, ii) data supplied by outside sources, and iii) the assumptions, conditions, and qualifications set forth in this report. This report is intended for use by Alacer subject to the terms and conditions of its contracts with the Consulting Engineering Firms. Those contracts permit Alacer to file this report as a Technical Report with Canadian Securities Regulatory Authorities pursuant to provincial and territorial securities legislation. Except for the purposes legislated under Canadian provincial and territorial securities law, any other use of, or reliance on, the contributor-prepared sections of this report by any third party is at that party’s sole risk.
CERTIFICATE OF QUALIFIED PERSON
I, Richard A. Bohling, as a co-author of the Technical Report, do hereby certify that:
1. I am currently Technical Services Manager for:
Jacobs Engineering Group 707 17th Street Denver, Colorado, USA, 80202
2. This certificate applies to the technical report prepared for Alacer Gold Corporation (Alacer) entitled Çöpler Sulfide Expansion Project Definitive Feasibility Study, Erzincan Province, Turkey with an effective date of July 29th, 2014 and a report date of July 29th, 2014.
3. I graduated from the Colorado School of Mines in 1975 with a Bachelor of Science degree in Metallurgical Engineering. I have practiced my profession continuously for thirty-nine years since graduation and have experience in the engineering, operation, and management of mining, mineral processing, metallurgical, water treatment plants and support facilities. I have been responsible for feasibility studies, operating cost estimates, financial evaluations, metallurgical and environmental testing and monitoring, project management, and project supervision. I have provided mineral processing, metallurgical, and general process expertise for the evaluation, design, and construction of new and existing facilities, and have been involved in the permitting, startup and daily operations of several mills, heap leach operations, tailings facilities, and water treatment plants. I have experience with environmental permitting, permit compliance, and the operation of remediation facilities.
4. I am a Registered Professional Engineer in the state of Colorado (19639) and am a member of the Society for Mining, Metallurgy, and Exploration (SME).
5. I visited the Çöpler project site on March 24th, 2012 for 4 days.
6. I am responsible for Sections 1.1-1.2, portions of 1.3 related to production targets and forecast financial information, 1.4, 1.13, 1.17, 1.18.1, 1.19, 1.21-1.26,, 2.1-2.3.2, 3, 13, 17, 18.1, 18.3-18.11, 19, 21 (excluding 21.3.1, 2.18.2 and 21.8.5), 22-24, 25.4, 25.5, 25.7, 25.10, 25.11, 25.12, 25.13, 26.4, 26.5, 26.7, 26.10, 26.11, 26.12, and 27 of the Technical Report.
7. I am independent of the technical report issuer per Section 1.5 of NI 43-101.
8. I have had no prior involvement with the property that is the subject of this technical report.
9. I have read NI-43-101 and the sections of the Technical Report under my responsibility have been prepared in compliance with the instrument.
10. Those, as the effective date of the Technical Report, to best of my knowledge, information, and belief, the sections of the Technical report under my responsibility contain all scientific and technical information required to be disclosed to make the technical Report not misleading.
Dated: July 29th, 2014
“Original Signed and Sealed”
Richard A. Bohling, PE
Technical Services Manager
SRK Consulting (Canada) Inc. 205–2100 Airport Drive Saskatoon, SK S7L 6M6 T: +1.306.955.4778 F: +1.306.955.4750
ML Certificate July 2014
I, Mark Liskowich, of Saskatoon, Saskatchewan, Canada do hereby certify:
1. That I am a professional Geologist employed as a Principal Consultant with SRK Consulting (Canada) Inc. at 205, 2100 Airport Drive, Saskatoon, Saskatchewan.
2. This certificate applies to the Technical Report titled “Canadian National Instrument 43-101 Technical Report - Çöpler Sulfide Expansion Project Feasibility Study” with an Effective Date of July 29, 2014 and a Report Date of July 29, 2014 (the “Technical Report”).
3. That I am a member of the Association of Professional Engineers and Geoscientists of Saskatchewan.
4. That I am a graduate of the University of Regina. I graduated with a B.Sc (geology) degree in May 1989.
5. That I have practiced my profession within the mineral exploration, mining industry since 1989. I have been directly involved, professionally, in the environmental and social management of mineral exploration and mining projects covering a wide range of commodities since 1992 with both the public and private sector. My areas of expertise are environmental management, environmental auditing, project permitting, licensing, public and regulatory consultation.
6. I have read the definition of “qualified person” set out in National Instrument 43-101 (“NI 43-101”) and certify that I am a “qualified person” for the purposes of NI 43-101.
7. That I, Mark Liskowich, visited the Copler project on September 21 and 22, 2010.
8. I am responsible for sections 1.5, 1.6, 1.7, 1.20, 2.3.6, 2.6, 4, 5, 6, 20.1 to 20.12, 25.8, and 26.8 of the Technical Report.
9. I am independent of Alacer as described in Section 1.5 of NI 43-101.
10. I have had no prior involvement with the Alacer Çöpler Sulfide Expansion Project.
11. I have read NI 43-101 and this Technical Report has been prepared in compliance with that instrument.
12. That as of the date of this certificate, to the best of my knowledge, information and belief, this Technical Report contains all scientific and technical information that is required to be disclosed to make the Technical Report not misleading.
Signed this 29 day of July 2014.
“Original Signed and Sealed”
Mark W. Liskowich, P.Geo
SRK Consulting (U.S.) Inc. 5250 Neil Road, Suite 300 Reno, Nevada 89502 T: (775) 828-6800 F: (775) 828-6820 [email protected] www.srk.com
U.S. Offices: Anchorage 907.677.3520 Denver 303.985.1333 Elko 775.753.4151 Fort Collins 970.407.8302 Reno 775.828.6800 Tucson 520.544.3688
Mexico Office:Hermosillo 52.662.215.1050 Queretaro 52.442.218.1030 Zacatecas 52.492.927.8982
Canadian Offices: Saskatoon 306.955.4778 Sudbury 705.682.3270 Toronto 416.601.1445 Vancouver 604.681.4196 Yellowknife 867.873.8670
Group Offices:Africa Asia Australia Europe North America South America
JVP NI43-101_QP_Certificate__T94100_03_JP_20140725_FNL(Revised)_Electronic.docx July 2014
CERTIFICATE OF QUALIFIED PERSON
I, Jeffrey Vaughan Parshley, CPG do hereby certify that:
1. I am a Corporate Consultant for SRK Consulting (U.S.), Inc., 5250 Neil Road, Suite 300, Reno, NV, USA, 89502.
2. This certificate applies to the technical report titled “Çöpler Sulfide Expansion Project, Definitive Feasibility Study, Erzincan Province, Turkey” with an Effective Date of July 29, 2014 (the “Technical Report”).
3. I graduated with a degree in B.A. in Geology from Dartmouth College in 1980. I am a Certified Professional Geologist of the American Institute of Professional Geologists. I have worked as a Geologist for a total of 33 years since my graduation from university. My relevant experience includes more than 25 years of mine permitting, closure and environmental studies in the U.S. and internationally.
4. I have read the definition of “qualified person” set out in National Instrument 43-101 (NI 43-101) and certify that by reason of my education, affiliation with a professional association (as defined in NI 43-101) and past relevant work experience, I fulfill the requirements to be a “qualified person” for the purposes of NI 43-101.
5. I have not personally visited the Çöpler Project site but relied on a site visit completed by Mr. Patric Lassiter, P.G., a co-author of the Technical Report;
6. I am responsible for the preparation of Sections 2.3.6, 2.6, 20.13 through 20.18, 25.9 and 26.9 of the Technical Report.
7. I am independent of the issuer applying all of the tests in section 1.5 of NI 43-101. 8. I have had prior involvement with the property that is the subject of the Technical Report. The nature of
my prior involvement is to have reviewed current the project closure liabilities each year since 2012. 9. I have read NI 43-101 and Form 43-101F1 and the sections of the Technical Report I am responsible for
have been prepared in compliance with that instrument and form. 10. As of the aforementioned Effective Date, to the best of my knowledge, information and belief, the
sections of the Technical Report I am responsible for contains all scientific and technical information that is required to be disclosed to make the Technical Report not misleading.
Dated this 29th Day of July, 2014. “Original Signed and Sealed” ________________________________
Jeffrey Vaughan Parshley
SRK Denver 7175 West Jefferson Avenue. Suite 3000 Lakewood, CO 80235
T: 303.985.1333 F: 303.985.9947
[email protected] www.srk.com
CERTIFICATE OF AUTHOR
I, Bret C. Swanson, B.Eng. (Mining), MMSAQP (01418QP) do hereby certify that:
1. I am Principal Mining Engineer of SRK Consulting (U.S.), Inc., 7175 W. Jefferson Ave, Suite 3000,Denver, CO, USA, 80235.
2. This certificate applies to the technical report titled “Canadian National Instrument 43-101 TechnicalReport - Çöpler Sulfide Expansion Project Feasibility Study” with an Effective Date of July 29, 2014 (the“Technical Report”).
3. I graduated with a degree in Bachelor of Engineering in Mining Engineering from the University ofWollongong in 1995. I am a current member of the Mining & Metallurgical Society of America #01418QP.I have worked as a Mining Engineer for a total of 19 years since my graduation from university. Myrelevant experience includes contributions to numerous feasibility, pre-feasibility, preliminary assessmentand competent person reports while employed with SRK, Denver. Previously, I worked on the design andimplementation of mine planning and scheduling systems, long term mine design with environmentalfocus, and mine planning corporate standards for Solid Energy, New Zealand. In addition, I have workedin various sales and support roles utilizing Vulcan Software and MineSuite Production Statistics where Igained considerable exposure to mining operations and projects around the world.
4. I have read the definition of “qualified person” set out in National Instrument 43-101 (NI 43-101) andcertify that by reason of my education, affiliation with a professional association (as defined in NI 43-101)and past relevant work experience, I fulfill the requirements to be a “qualified person” for the purposes ofNI 43-101.
5. I visited the Alacer Çöpler property on March 24, 2012 for 4 days.6. I am responsible for the preparation of Mineral Reserve Estimates, Geotechnical Pit Slope Stability and
Mining Methods in portions of Sections 1.3 related to the estimated Mineral Reserves and MineralResources, 1.15, 1.16, 2.3.5, 2.6, 15, 16 (excluding 16.3 and 16.5), 21.8.2, 25.2, and 26.2 of theTechnical Report.
7. I am independent of the issuer applying all of the tests in section 1.5 of NI 43-101.8. I have had prior involvement with the property that is the subject of the Technical Report. The nature of
my involvement was in preparation of the report titled, “Canadian National Instrument 43-101 TechnicalReport – Technical Report on the Çöpler Mineral Resource Update, Erzincan Province, Turkey” with anEffective Date of March 28th, 2013.
9. I have read NI 43-101 and Form 43-101-F1 and the sections of the Technical Report I am responsible forhave been prepared in compliance with that instrument and form.
10. As of the aforementioned effective date, to the best of my knowledge, information and belief, the sectionsof the Technical Report I am responsible for contains all scientific and technical information that isrequired to be disclosed to make the Technical Report not misleading.
Dated this 24th Day of July, 2014.
“Signed and Sealed”
Bret C. Swanson, B.Eng. (Mining), MAusIMM, MMSAQP
U.S. Offices: Anchorage 907.677.3520 Denver 303.985.1333 Elko 775.753.4151 Fort Collins 970.407.8302 Reno 775.828.6800 Tucson 520.544.3688
Mexico Offices: Querétaro 52.442.218.1030
Canadian Offices: Saskatoon 306.955.4778 Sudbury 705.682.3270 Toronto 416.601.1445 Vancouver 604.681.4196 Yellowknife 867.873.8670
Group Offices: Africa Asia Australia Europe North America South America
Level 3, 50 Colin Street West Perth WA 6005 PO Box 1646 West Perth WA 6872 Australia T: + 61 8 9215 0000 F: + 61 8 9215 0011
CERTIFICATE OF QUALIFIED PERSON
I, Lisa Bascombe of Perth Western Australia, Australia do hereby certify:
1. That I am Senior Consultant Geologist at Optiro Pty Ltd with a business address Level 3/50 Colin St, West Perth, Western Australia, 6005.
2. This certificate applies to the technical report titled “Çöpler Sulfide Expansion Project Feasibility Study” dated July 29th, 2014 with an effective date of July 29th, 2014 (the “Technical Report”).
3. That I am a member in good standing of the Australian Institute of Geoscientists (AIG), membership number 3520.
4. That I am a graduate of Macquarie University, New South Wales, Australia, graduating with BSc Geology in 1996.
5. That I have worked as an Exploration Geologist, Underground Mine Geologist, Senior Mine Geologist, Resource Geologist, Senior Resource Geologist and Senior Consultant Geologist for a total of 16 years.
6. I have read the definition of “qualified person” set out in National Instrument 43-101 (“NI 43-101”) and certify that I am a “qualified person” for the purposes of NI 43-101.
7. That I, Lisa Bascombe have visited the Çöpler Project multiple times, the most recent of which was in March and April 2014 for a period of 30 days.
8. I am responsible for sections 1.8 through 1.11, 7.1 through 7.3, and 8 through 11 of the Technical Report.
9. I am not independent of Alacer Gold Corp. as described in Section 1.5 of NI 43-101.
10. I previously held the position of Senior Resource Geologist at Alacer and was responsible for Çöpler Mineral Resource Estimation. I provided technical assistance to Çöpler’s Exploration, Mine Geology and Mining departments. I have reviewed the Çöpler Exploration drilling, logging and sampling systems and procedures in detail. I have conducted on-site laboratory reviews of ALS Chemex Vancouver, Canada and ALS Chemex Izmir, Turkey. I was a Qualified Person for the Technical Report that was effective March 30, 2012.
11. I have read NI 43-101 and the parts of the Technical Report for which I am responsible have been prepared in compliance with NI 43-101.
12. That as of the effective date of the Technical Report, to the best of my knowledge, information and belief, the parts of the Technical Report for which I am responsible contain all scientific and technical information that is required to be disclosed to make the Technical Report not misleading.
Signed this _24th__ day of __July____, 2014.
Original signed and sealed _______________________ Lisa Bascombe BSc, MAIG Optiro.
AMEC E&C Services, Inc. 961 Matley Lane, Suite 110 Reno, NV, 89502 Tel: 775 331 2375 Fax: 775-331-4153 www.amec.com
CERTIFICATE OF QUALIFIED PERSON
I, Harry Parker, RM SME., am employed as a Consulting Mining Geologist and Geostatistician with AMEC E&C Services Inc. (AMEC).
This certificate applies to the technical report titled “NI 43-101 Çöpler Sulfide Expansion Project Definitive Feasibility Study Erzincan Province, Turkey” that has an effective date of 29 July, 2014 (the technical report).
I am a Fellow of the Australian Institute of Mining and Metallurgy (#113051), and a Registered Member of the Society for Mining, Metallurgy and Exploration (#2460450). I graduated from Stanford University with BSc and PhD degrees in Geology in 1967 and 1975 respectively. I graduated from Harvard University in 1969 with an AM degree in Geology. I graduated from Stanford University with an MSc degree in Statistics in 1974.
I have practiced my profession for 47 years during which time I have been involved in the estimation of mineral resources and mineral reserves for various gold exploration projects and operating gold mines associated with intrusions. These include Colomac, NWT; Fort Knox, AK, Silangan, Philippines; Cripple Creek, Colorado; Lihir, PNG; Porgera, PNG.
As a result of my experience and qualifications, I am a Qualified Person as defined in National Instrument 43–101 Standards of Disclosure for Mineral Projects (NI 43–101).
I visited the Çöpler mine site from May 5 to 11, 2014.
I am responsible for Sections 1.12, 1.14, 2.3.4, 2.6, 3.1, 12, 14, 25.1, 26.1 and 27 of the technical report.
I am independent of Alacer Gold Corp. as independence is described by Section 1.5 of NI 43–101.
I have been involved with the Çöpler Project during the preparation of this technical report.
I have read NI 43–101 and the sections of the technical report for which I am responsible have been prepared in compliance with that Instrument.

AMEC E&C Services, Inc. 961 Matley Lane, Suite 110 Reno, NV, 89502 Tel: 775 331 2375 Fax: 775-331-4153 www.amec.com
As of the effective date of the technical report, to the best of my knowledge, information and belief, the sections of the technical report for which I am responsible contain all scientific and technical information that is required to be disclosed to make those sections of the technical report not misleading.
Dated: 29 July 2014
“Signed and stamped”
Dr Harry Parker, RM SME
AMEC E&C Services, Inc. 961 Matley Lane, Suite 110 Reno, NV, 89502 Tel: 775 331 2375 Fax: 775-331-4153 www.amec.com
CERTIFICATE OF QUALIFIED PERSON
I, Gordon Seibel, RM SME., am employed as a Principal Geologist with AMEC E&C Services Inc. (AMEC).
This certificate applies to the technical report titled “NI 43-101 Çöpler Sulfide Expansion Project Definitive Feasibility Study Erzincan Province, Turkey” that has an effective date of 29 July 2014 (the technical report).
I am a Registered Member of the Society for Mining, Metallurgy and Exploration (RM SME; #2894840). I graduated from the University of Colorado with a Bachelor of Arts degree in Geology in 1980. In addition, I obtained a Masters of Science degree in Geology from Colorado State University in 1991.
I have practiced my profession for 33 years, during which time I have been directly involved in the development of resource models and mineral resource estimation for mineral projects in North America, South America, Africa, and Australia since 1991. I have previously estimated or audited gold Mineral Resources for Cripple Creek and Victor Gold Mining Company, Colorado; Spring Valley, Nevada; Soledad Mountain, California; Midas, Nevada; Callie, NT Australia; Conga, Peru; Donlin Creek, Alaska; Leeville, Nevada; Subika, Ghana and Ahafo North, Ghana.
As a result of my experience and qualifications, I am a Qualified Person as defined in National Instrument 43–101 Standards of Disclosure for Mineral Projects (NI 43–101).
I visited the Çöpler mine site from May 5 to 11, 2014.
I am responsible for Sections 1.12, 1.14, 2.3.4, 2.6, 3.1, 12, 14, 25.1, 26.1 and 27 of the technical report.
I am independent of Alacer Gold Corp. as independence is described by Section 1.5 of NI 43–101.
I have been involved with the Çöpler Project during the preparation of this technical report.
I have read NI 43–101 and the sections of the technical report for which I am responsible have been prepared in compliance with that Instrument.
AMEC E&C Services, Inc. 961 Matley Lane, Suite 110 Reno, NV, 89502 Tel: 775 331 2375 Fax: 775-331-4153 www.amec.com
As of the effective date of the technical report, to the best of my knowledge, information and belief, the sections of the technical report for which I am responsible contain all scientific and technical information that is required to be disclosed to make those sections of the technical report not misleading.
Dated: 29 July 2014
“Signed and stamped”
Gordon Seibel, RM SME
C:\Users\ZahariCL\AppData\Local\Microsoft\Windows\Temporary Internet Files\Content.Outlook\C2Q29JRU\1238169614 021 L3 Rev2 CertOfAuthor-RKiel 29JUL14-signed and sealed.docx
Golder Associates Inc. 44 Union Boulevard, Suite 300
Lakewood, CO 80228 USA Tel: (303) 980-0540 Fax: (303) 985-2080 www.golder.com
Golder Associates: Operations in Africa, Asia, Australasia, Europe, North America and South America
Golder, Golder Associates and the GA globe design are trademarks of Golder Associates Corporation
July 29, 2014 1238169614 021 L3 Rev2
Christa Zaharias Jacobs Engineering 707 17th Street, Suite 2300 Denver, Colorado 80202-5131 USA
RE: CERTIFICATE OF AUTHOR – RICHARD E. KIEL
Dear Christa:
As a co-author of this Technical Report dated July 29, 2014 (Çöpler Sulfide Expansion Project, Feasibility Study) on the Çöpler Sulfide Project for Alacer Gold Corporation, 9635 Maroon Circle, Suite 300, Englewood, Colorado, USA, I, Richard E. Kiel, do hereby certify that:
1. I am a Principal and carried out this assignment for Golder Associates Inc., 44 Union Boulevard, Suite 300, Lakewood, Colorado 80228, USA, tel. (303) 980-0540, fax (303) 985-2080, e-mail [email protected].
2. I hold the following academic qualifications:
A. B.Sc., 1979, Geological Engineering, South Dakota School of Mines & Technology
3. I am a registered Member of the Society for Mining, Metallurgy, and Exploration (SME).
4. I am a registered professional civil engineer in California, Nevada, Colorado, and Wyoming.
5. I have worked as a civil and geological engineer in the minerals industry for 24 years.
6. I am familiar with NI 43-101 and – by reason of education, experience, and professional registration – I fulfill the requirements of a Qualified Person as defined in NI 43-101. My work experience includes 22 years as a consulting engineer on precious metals, base metals, and rare earth oxides, and 2 years as a geologist and engineer at an operating uranium mine. I have an additional 10 years of experience in a related industry (e.g., solid and hazardous waste management). I am qualified to prepare and review the engineering for the tailings storage facility and for geotechnical engineering aspects of the Çöpler Sulfide Project.
7. I am independent of Alacer as described in Section 1.5 of NI 43-101.
8. I visited the property three times: from May 8-15, 2012, and more recently from June 6-9, 2014, and July 9-13, 2014.
9. As of the date of this certificate, to the best of my knowledge, information, and belief, the Technical Report contains all scientific and technical information that is required to be disclosed to make this report not misleading.

Christa Zaharias July 29, 2014 Jacobs Engineering 2 1238169614 021 L3 Rev2
C:\Users\ZahariCL\AppData\Local\Microsoft\Windows\Temporary Internet Files\Content.Outlook\C2Q29JRU\1238169614 021 L3 Rev2 CertOfAuthor-RKiel 29JUL14-signed
and sealed.docx
10. I am responsible for the preparation of Sections 1.18.2, 2.3.3, 2.6, 16.5, 18.2, 18.12 through 18.15, 21.3.1, 21.8.5, 25.3, 25.6, 26.3, and 26.6 of the Technical Report pertinent to the Waste Rock and Stockpile Storage, Plant Site Geotechnical, Tailings Storage Facility, and Tailings Storage Facility Costs.
Sincerely,
GOLDER ASSOCIATES INC.
Signed and Sealed
Richard E. Kiel, P.E. Senior Geological Engineer
C:\Users\ZahariCL\AppData\Local\Microsoft\Windows\Temporary Internet Files\Content.Outlook\C2Q29JRU\1238169614 022 L4 Rev2 CertOfAuthor-DArmstrong 29JUL14_signed and sealed.docx
Golder Associates Inc. 4730 N. Oracle Road, Suite 210
Tucson, AZ 85705 USA Tel: (520) 888-8818 Fax: (520) 888-8817 www.golder.com
Golder Associates: Operations in Africa, Asia, Australasia, Europe, North America and South America
Golder, Golder Associates and the GA globe design are trademarks of Golder Associates Corporation
July 29, 2014 1238169614 022 L4 Rev2
Christa Zaharias Jacobs Engineering 707 17th Street, Suite 2300 Denver, Colorado 80202-5131 USA
RE: CERTIFICATE OF AUTHOR – DALE ARMSTRONG
Dear Christa:
As a co-author of this Technical Report dated July 29, 2014 (Çöpler Sulfide Expansion Project, Feasibility Study) on the Çöpler Sulfide Project for Alacer Gold Corporation, 9635 Maroon Circle, Suite 300, Englewood, Colorado, USA, I, Dale Armstrong, do hereby certify that:
1. I am an Associate and carried out this assignment for Golder Associates Inc., 4730 North Oracle Road, Suite 202, Tucson, Arizona, USA, tel. (520) 888-8818, fax (520) 888-8817, e-mail [email protected].
2. I hold the following academic qualifications:
A. BS, 1973, Geological Sciences, University of New Mexico, Albuquerque, New Mexico.
3. I am a Certified Professional Geologist, American Institute of Professional Geologists (AIPG) Certification #6629.
4. I am a registered geologist in Arizona, Registration #18431.
5. I have worked as a professional geologist in the natural resource industry for 41 years.
6. I am familiar with NI 43-101 and – by reason of education, experience, and professional certification and registration – I fulfill the requirements of a Qualified Person as defined in NI 43-101. My work experience includes 41 years as a professional geologist and hydrogeologist on precious metals, base metals, and industrial minerals. I am qualified to prepare and review the groundwater hydrogeology of the Çöpler Sulfide Project.
7. I am independent of Alacer as described in Section 1.5 of NI 43-101.
8. I visited the property from March 23-26, 2012.
9. As of the date of this certificate, to the best of my knowledge, information, and belief, the Technical Report contains all scientific and technical information that is required to be disclosed to make this report not misleading.
Christa Zaharias July 29, 2014 Jacobs Engineering 2 1238169614 022 L4 Rev2
C:\Users\ZahariCL\AppData\Local\Microsoft\Windows\Temporary Internet Files\Content.Outlook\C2Q29JRU\1238169614 022 L4 Rev2 CertOfAuthor-DArmstrong
29JUL14_signed and sealed.docx
10. I am responsible for the preparation of the portion of the Technical Report pertinent to the site hydrogeology, hydrology and pit dewatering technical sections (Sections 7.4 and 16.3) within the report.
Sincerely,
GOLDER ASSOCIATES INC.
Signed and Sealed
Dale Armstrong, CPG, RG Senior Hydrogeologist
Çöpler Sulfide Expansion Project Feasibility Study
43-101 Technical Report
Page i
TABLE OF CONTENTS
1.0 SUMMARY ........................................................................................................................ 1-1 1.1 Introduction and Scope of Work ............................................................................................. 1-1 1.2 Contributors and Qualified Persons ....................................................................................... 1-1 1.3 Basis for Production Targest and Forecase Financial Information ........................................ 1-2 1.4 Key Outcomes ........................................................................................................................ 1-3 1.5 Property Description and Location ......................................................................................... 1-3 1.6 Accessibility, Climate, Local Resources, Infrastructure and Physiography ........................... 1-4 1.7 History ..................................................................................................................................... 1-4 1.8 Geological Setting and Mineralization .................................................................................... 1-4 1.9 Exploration .............................................................................................................................. 1-6 1.10 Drilling ..................................................................................................................................... 1-6 1.11 Sampling Method, Approach and Analyses ........................................................................... 1-6 1.12 Data Verification ..................................................................................................................... 1-7
Collar Surveys ....................................................................................................................... 1-7 1.12.1 Downhole Surveys ................................................................................................................. 1-7 1.12.2 Geology Logs, Density Logs, RQD Logs ............................................................................... 1-8 1.12.3 Assay Data – 2000 to 2003 ................................................................................................... 1-8 1.12.4 Assay Data –2004 to 2013 .................................................................................................... 1-8 1.12.5 AMEC Witness Samples ........................................................................................................ 1-8 1.12.6 Quality Assurance and Quality Control Results ..................................................................... 1-9 1.12.7
1.13 Metallurgical Testwork .......................................................................................................... 1-10 Historical Testwork .............................................................................................................. 1-10 1.13.1 Mineralogy ........................................................................................................................... 1-11 1.13.2 Flowsheet Determination Testwork ...................................................................................... 1-12 1.13.3
1.14 Mineral Resource Estimates ................................................................................................. 1-13 1.15 Mineral Reserve Estimates ................................................................................................... 1-15 1.16 Mining Methods .................................................................................................................... 1-17 1.17 Process Plants ...................................................................................................................... 1-17 1.18 Project Infrastructure ............................................................................................................ 1-22
Infrastructure ....................................................................................................................... 1-22 1.18.1 Tailings Storage Facility ....................................................................................................... 1-22 1.18.2
1.19 Market Studies and Contracts .............................................................................................. 1-22 1.20 Environmental and Permitting .............................................................................................. 1-23 1.21 Capital and Operating Costs ................................................................................................ 1-24
Capital Costs ....................................................................................................................... 1-24 1.21.1 Operating Costs ................................................................................................................... 1-25 1.21.2
1.22 Economic Analysis ............................................................................................................... 1-27 1.23 Adjacent Properties .............................................................................................................. 1-32 1.24 Other Relevant Data and Information ................................................................................... 1-32 1.25 Interpretation and Conclusions ............................................................................................. 1-32 1.26 Recommendations ................................................................................................................ 1-32
2.0 INTRODUCTION ............................................................................................................... 2-1 2.1 Scope of Study ....................................................................................................................... 2-1 2.2 Forward-Looking Information .................................................................................................. 2-2 2.3 Main Contributors Scope of Services ..................................................................................... 2-3
Alacer .................................................................................................................................... 2-3 2.3.1
Çöpler Sulfide Expansion Project Feasibility Study
43-101 Technical Report
Page ii
Jacobs ................................................................................................................................... 2-3 2.3.2 Golder .................................................................................................................................... 2-3 2.3.3 AMEC .................................................................................................................................... 2-4 2.3.4 SRK (US) ............................................................................................................................... 2-4 2.3.5 SRK Turkey ........................................................................................................................... 2-4 2.3.6
2.4 Other Contributors Scope of Services .................................................................................... 2-5 Hazen Research Incorporated ............................................................................................... 2-5 2.4.1 McClelland Laboratories Incorporated ................................................................................... 2-5 2.4.2 Tetra Tech ............................................................................................................................. 2-5 2.4.3
2.5 Effective Dates and Declaration ............................................................................................. 2-5 2.6 Site Visits ................................................................................................................................ 2-6
3.0 RELIANCE ON OTHER EXPERTS .................................................................................. 3-1 3.1 Çakmak Avukatlik Bürosu ....................................................................................................... 3-1
4.0 PROPERTY DESCRIPTION AND LOCATION ................................................................. 4-1 4.1 Location .................................................................................................................................. 4-1 4.2 Environmental Liabilities ......................................................................................................... 4-2 4.3 Permits .................................................................................................................................... 4-2
5.0 ACCESSIBILITY, CLIMATE, LOCAL RESOURCES, INFRASTRUCTURE AND PHYSIOGRAPHY ............................................................................................................. 5-1 5.1 Accessibility ............................................................................................................................ 5-1 5.2 Local Resources and Infrastructure ....................................................................................... 5-1 5.3 Climate and Environmental Conditions .................................................................................. 5-2 5.4 Physiography .......................................................................................................................... 5-3
6.0 HISTORY .......................................................................................................................... 6-1 6.1 General History ....................................................................................................................... 6-1 6.2 Exploration and Development History .................................................................................... 6-1 6.3 Production History .................................................................................................................. 6-2
7.0 GEOLOGICAL SETTING AND MINERALIZATION .......................................................... 7-1 7.1 Geological Setting .................................................................................................................. 7-1
Regional Geology .................................................................................................................. 7-1 7.1.1 Property Geology ................................................................................................................... 7-2 7.1.2
7.2 Mineralization ......................................................................................................................... 7-5 Main Zone .............................................................................................................................. 7-5 7.2.1 Manganese Mine Zone .......................................................................................................... 7-5 7.2.2 Main Zone East ..................................................................................................................... 7-6 7.2.3 Marble Contact Zone ............................................................................................................. 7-6 7.2.4 West Zone ............................................................................................................................. 7-6 7.2.5 Main Zone West..................................................................................................................... 7-6 7.2.6
7.3 Structural Geology .................................................................................................................. 7-7 7.4 Hydrogeology.......................................................................................................................... 7-7
Existing Data Evaluation, Field Investigation, Hydrogeologic Conceptual Model Update ...... 7-7 7.4.1 Monitoring Well Installation Program ..................................................................................... 7-8 7.4.2 Groundwater Flow Model ..................................................................................................... 7-11 7.4.3 Pit Lake Development .......................................................................................................... 7-16 7.4.4
Çöpler Sulfide Expansion Project Feasibility Study
43-101 Technical Report
Page iii
8.0 DEPOSIT TYPES .............................................................................................................. 8-1
9.0 EXPLORATION ................................................................................................................. 9-1 9.1 Surface Mapping and Sampling ............................................................................................. 9-1 9.2 Geophysics ............................................................................................................................. 9-1
10.0 DRILLING ........................................................................................................................ 10-1 10.1 Collar Locations .................................................................................................................... 10-1 10.2 Collar and Downhole Survey ................................................................................................ 10-2
11.0 SAMPLE PREPARATION, ANALYSIS AND SECURITY ............................................... 11-1 11.1 Sample Collection ................................................................................................................. 11-1
Reverse Circulation Sample Collection ................................................................................ 11-1 11.1.1 Diamond Drilling Core Sample Collection ............................................................................ 11-3 11.1.2 Drill Hole Logging and Data Collection ................................................................................ 11-5 11.1.3
11.2 Sample Preparation .............................................................................................................. 11-5 RC Sample Preparation ....................................................................................................... 11-5 11.2.1 DD Sample Preparation ....................................................................................................... 11-6 11.2.2
11.3 Sample Analysis ................................................................................................................... 11-7 11.4 Sample Security ................................................................................................................... 11-8 11.5 QA/QC Procedures ............................................................................................................... 11-8 11.6 Opinion on Adequacy ........................................................................................................... 11-9
12.0 DATA VERIFICATION .................................................................................................... 12-1 12.1 Collar Location ...................................................................................................................... 12-1 12.2 Down-hole Surveys .............................................................................................................. 12-2 12.3 Geology Logs, Density Logs and RQD Logs ........................................................................ 12-3 12.4 Assays – 2000 to 2003 ......................................................................................................... 12-3 12.5 Assays – 2004 to 2013 ......................................................................................................... 12-8 12.6 AMEC Witness Samples ...................................................................................................... 12-8 12.7 Quality Assurance Quality Control Results .......................................................................... 12-9
Screen Analyses .................................................................................................................. 12-9 12.7.1 Blank Samples ................................................................................................................... 12-10 12.7.2 Standards .......................................................................................................................... 12-10 12.7.3 Field Duplicates ................................................................................................................. 12-12 12.7.4 Check assays .................................................................................................................... 12-15 12.7.5
12.8 Discussion .......................................................................................................................... 12-16 12.9 Opinion on Adequacy ......................................................................................................... 12-17
13.0 MINERAL PROCESSING AND METALLURGICAL TESTING ....................................... 13-1 13.1 Historical Testwork ............................................................................................................... 13-1
Mineralogy ........................................................................................................................... 13-3 13.1.1 Flowsheet Determination Testwork ...................................................................................... 13-4 13.1.2 Head Characterization ......................................................................................................... 13-5 13.1.3 Comminution Tests ............................................................................................................ 13-12 13.1.4 Direct Cyanidation ............................................................................................................. 13-16 13.1.5 Campaign 1 ....................................................................................................................... 13-18 13.1.6 Campaign 2 ....................................................................................................................... 13-22 13.1.7 Campaign 3 ....................................................................................................................... 13-25 13.1.8 Campaign 4 ....................................................................................................................... 13-27 13.1.9
Hot Cure Testing................................................................................................................ 13-29 13.1.10
Çöpler Sulfide Expansion Project Feasibility Study
43-101 Technical Report
Page iv
Iron/Arsenic Precipitation ................................................................................................... 13-30 13.1.11 Metal Sulfide Precipitation Testing..................................................................................... 13-30 13.1.12 Solid-Liquid Separation Tests ............................................................................................ 13-30 13.1.13 Tailings Filtration Testing ................................................................................................... 13-33 13.1.14 Bulk Cyanidation and Carbon Loading Kinetics ................................................................. 13-33 13.1.15 Cyanide Destruction and Environmental Testing ............................................................... 13-36 13.1.16 Variability Testing .............................................................................................................. 13-39 13.1.17 Flotation Tests Following Campaign 4 ............................................................................... 13-45 13.1.18
14.0 MINERAL RESOURCE ESTIMATES ............................................................................. 14-1 14.1 Introduction ........................................................................................................................... 14-1 14.2 Key Assumptions/Basis of Mineral Resource Estimate ....................................................... 14-2 14.3 Base Model ........................................................................................................................... 14-3 14.4 Domains ................................................................................................................................ 14-6 14.5 Lithology Model .................................................................................................................... 14-6 14.6 Data Summary ...................................................................................................................... 14-8 14.7 Exploratory Data Analyses (EDA) ........................................................................................ 14-8
Summary Statistics .............................................................................................................. 14-8 14.7.1 Boxplots ............................................................................................................................. 14-10 14.7.2 Correlation Coefficients ..................................................................................................... 14-11 14.7.3
14.8 Core Recovery .................................................................................................................... 14-12 14.9 Twin Holes .......................................................................................................................... 14-12 14.10 Contact Plots ...................................................................................................................... 14-12 14.11 Capping (Top Cutting) ........................................................................................................ 14-14 14.12 Drill Hole Compositing ........................................................................................................ 14-15 14.13 Variography ........................................................................................................................ 14-16 14.14 Sulfur Model........................................................................................................................ 14-18 14.15 Gold Model ......................................................................................................................... 14-21 14.16 Resource Classification ...................................................................................................... 14-27 14.17 Vulcan Model ...................................................................................................................... 14-28
Vulcan Density Model ........................................................................................................ 14-28 14.17.114.18 Combined Model ................................................................................................................ 14-31 14.19 Model Validation ................................................................................................................. 14-31
Visual ................................................................................................................................. 14-31 14.19.1 Global Bias ........................................................................................................................ 14-31 14.19.2 Local Bias .......................................................................................................................... 14-32 14.19.3 Change of Support ............................................................................................................. 14-34 14.19.4
14.20 Assessment of Reasonable Prospects of Eventual Economic Extraction ......................... 14-36 14.21 Mineral Resource Tabulation .............................................................................................. 14-36 14.22 Risks and Opportunities ..................................................................................................... 14-39
15.0 MINERAL RESERVE ESTIMATES ................................................................................. 15-1 15.1 Mine Production Schedule .................................................................................................... 15-2 15.2 Risks and Opportunities ....................................................................................................... 15-7 15.3 Conclusions and Recommendations .................................................................................... 15-8
16.0 MINING METHODS ........................................................................................................ 16-1 16.1 Whittle Pit Shell Optimization ............................................................................................... 16-1
Mining and Processing Economics ...................................................................................... 16-1 16.1.1 Processing Recovery ........................................................................................................... 16-3 16.1.2
Çöpler Sulfide Expansion Project Feasibility Study
43-101 Technical Report
Page v
Pit Slope Angle .................................................................................................................... 16-5 16.1.3 Whittle Optimization Process ............................................................................................... 16-5 16.1.4
16.2 Pit Design ............................................................................................................................. 16-8 Geotechnical Design Parameters ........................................................................................ 16-8 16.2.1 Bench Design ...................................................................................................................... 16-8 16.2.2 Haul Roads .......................................................................................................................... 16-8 16.2.3 Phase Design ...................................................................................................................... 16-8 16.2.4
16.3 Hydrology and Pit Dewatering ............................................................................................ 16-11 Hydrology Background ...................................................................................................... 16-11 16.3.1 Rainfall ............................................................................................................................... 16-11 16.3.2 Site-Wide Surface Water Hydrology .................................................................................. 16-13 16.3.3 Surface Water Management Structures ............................................................................. 16-13 16.3.4 Pit Dewatering ................................................................................................................... 16-14 16.3.5
16.4 Geotechnical Pit Slope Stability.......................................................................................... 16-15 Operational Recommendations: ........................................................................................ 16-15 16.4.1 Design Recommendations: ................................................................................................ 16-16 16.4.2 Geotechnical Domains ....................................................................................................... 16-17 16.4.3
16.5 Waste Rock and Stockpile Storage .................................................................................... 16-18 Waste Rock Geotechnical Design ..................................................................................... 16-19 16.5.1 Waste Rock Geochemical Review ..................................................................................... 16-22 16.5.2
16.6 Mining Operations .............................................................................................................. 16-23 Safety ................................................................................................................................ 16-23 16.6.1 Drilling and Blasting ........................................................................................................... 16-23 16.6.2 Ore Control ........................................................................................................................ 16-24 16.6.3 Loading and Hauling .......................................................................................................... 16-26 16.6.4 Ancillary Mine Equipment .................................................................................................. 16-26 16.6.5 Ore Stockpile Rehandle ..................................................................................................... 16-26 16.6.6
17.0 RECOVERY METHODS ................................................................................................. 17-1
18.0 PROJECT INFRASTRUCTURE ..................................................................................... 18-1 18.1 Introduction ........................................................................................................................... 18-1 18.2 Plant Site Geotechnical Considerations ............................................................................... 18-1 18.3 Buildings ............................................................................................................................... 18-2
Existing Infrastructure .......................................................................................................... 18-2 18.3.1 Administration Building ........................................................................................................ 18-2 18.3.2 Maintenance Shop (Mechanical and Electrical) ................................................................... 18-2 18.3.3 Warehouse .......................................................................................................................... 18-2 18.3.4 Laboratory Facilities ............................................................................................................. 18-3 18.3.5 Primary Crushing Control Room .......................................................................................... 18-3 18.3.6 Grinding Building ................................................................................................................. 18-3 18.3.7 POX Building and Central Control Room ............................................................................. 18-3 18.3.8 ADR Building ....................................................................................................................... 18-4 18.3.9
ADR Refinery ....................................................................................................................... 18-4 18.3.10 Office Space ........................................................................................................................ 18-4 18.3.11 Electrical Buildings/Power Distribution Centers (PDC) ........................................................ 18-4 18.3.12 Other Buildings .................................................................................................................... 18-4 18.3.13
18.4 Water and Sewage ............................................................................................................... 18-5 Fresh Water Supply ............................................................................................................. 18-5 18.4.1 Potable Water Treatment ..................................................................................................... 18-5 18.4.2 Waste Management ............................................................................................................. 18-6 18.4.3
18.5 Bulk Fuel Storage ................................................................................................................. 18-6 18.6 Power to Site ........................................................................................................................ 18-6
Çöpler Sulfide Expansion Project Feasibility Study
43-101 Technical Report
Page vi
18.7 Emergency Backup Power ................................................................................................... 18-6 18.8 Communications ................................................................................................................... 18-6 18.9 Site Roads ............................................................................................................................ 18-7 18.10 Plant Fire Protection System ................................................................................................ 18-7 18.11 Plant Lighting System ........................................................................................................... 18-7 18.12 Tailings Storage Facility ....................................................................................................... 18-7
Site Selection ....................................................................................................................... 18-8 18.12.1 TSF Geology ....................................................................................................................... 18-8 18.12.2 Ziyaret Tepe Fault Hazard Evaluation ............................................................................... 18-10 18.12.3
18.13 Tailings Storage Facility Design ......................................................................................... 18-10 TSF Description and Design Criteria ................................................................................. 18-10 18.13.1 Embankment Type Selection and Design .......................................................................... 18-12 18.13.2 Impoundment Underdrain System ..................................................................................... 18-16 18.13.3 Composite Liner System .................................................................................................... 18-16 18.13.4 Impoundment Overdrain System ....................................................................................... 18-16 18.13.5 Seepage Analyses ............................................................................................................. 18-17 18.13.6 Stability Analyses ............................................................................................................... 18-17 18.13.7 Embankment and Foundation Settlement .......................................................................... 18-18 18.13.8 Tailings Impoundment and Consolidation Settlement ........................................................ 18-18 18.13.9
18.14 Project Water Balance and Management ........................................................................... 18-19 TSF Water Balance ........................................................................................................... 18-19 18.14.1 Tailings Slurry Delivery and Reclaim Water ....................................................................... 18-20 18.14.2
18.15 Construction Schedule ....................................................................................................... 18-20
19.0 MARKET STUDIES AND CONTRACTS ......................................................................... 19-1 19.1 Copper Marketing Study ....................................................................................................... 19-1
Scope of Work ..................................................................................................................... 19-1 19.1.1 Copper Precipitate Analysis ................................................................................................. 19-1 19.1.2 Possibilities for Copper Precipitate Distribution ................................................................... 19-2 19.1.3 Terms and Conditions .......................................................................................................... 19-4 19.1.4
20.0 ENVIRONMENTAL STUDIES, PERMITTING AND SOCIAL OR COMMUNITY IMPACT 20-1 20.1 Introduction ........................................................................................................................... 20-1 20.2 Comparison of Turkish EIA and International ESIA Studies ................................................ 20-1 20.3 Status of Permitting .............................................................................................................. 20-3 20.4 Public Consultation ............................................................................................................... 20-4 20.5 Baseline Observations .......................................................................................................... 20-5 20.6 Soil Types ............................................................................................................................. 20-5
Main Soil Groups ................................................................................................................. 20-5 20.6.1 Soil Characterization ............................................................................................................ 20-6 20.6.2
20.7 Physical Features ................................................................................................................. 20-9 Climate ................................................................................................................................ 20-9 20.7.1 Air Quality and Noise ........................................................................................................... 20-9 20.7.2 Surface Water Resources .................................................................................................. 20-10 20.7.3
20.8 Land Use ............................................................................................................................ 20-13 20.9 Biological Features ............................................................................................................. 20-21 20.10 Socio-Economic Features .................................................................................................. 20-22 20.11 Risks and Opportunities ..................................................................................................... 20-24 20.12 Conclusions and Recommendations .................................................................................. 20-24 20.13 Mine Closure and Sustainability ......................................................................................... 20-25
Çöpler Sulfide Expansion Project Feasibility Study
43-101 Technical Report
Page vii
Legal Requirements ........................................................................................................... 20-25 20.13.1 Rehabilitation Objectives/Sustainability ............................................................................. 20-25 20.13.2 Physical Stability ................................................................................................................ 20-26 20.13.3 Chemical Stability .............................................................................................................. 20-26 20.13.4 Open Pits ........................................................................................................................... 20-26 20.13.5 Waste Rock Dumps ........................................................................................................... 20-26 20.13.6 Heap Leach Facility (HLF) ................................................................................................. 20-26 20.13.7 Tailings Storage Facility ..................................................................................................... 20-27 20.13.8 Infrastructure ..................................................................................................................... 20-27 20.13.9
20.14 Long Term Water Management.......................................................................................... 20-28 Open Pits ........................................................................................................................... 20-28 20.14.1 Heap Leach ....................................................................................................................... 20-28 20.14.2 Tailings .............................................................................................................................. 20-28 20.14.3 Waste Rock Dumps ........................................................................................................... 20-29 20.14.4 Surface Water .................................................................................................................... 20-29 20.14.5
20.15 Closure Approach and Basis for Closure Cost Estimate .................................................... 20-29 Open Pit ............................................................................................................................. 20-29 20.15.1 Tailings .............................................................................................................................. 20-29 20.15.2 Heap Leach Pad ................................................................................................................ 20-30 20.15.3 Waste Rock Dumps ........................................................................................................... 20-30 20.15.4 Yards and Roads ............................................................................................................... 20-31 20.15.5 Processing, Administration and Other Infrastructure ......................................................... 20-31 20.15.6 Other Facilities ................................................................................................................... 20-31 20.15.7 Post Closure Monitoring and Maintenance ........................................................................ 20-32 20.15.8 Closure Schedule .............................................................................................................. 20-32 20.15.9
20.16 Closure Costs ..................................................................................................................... 20-33 Closure Cost Unit Rates .................................................................................................... 20-33 20.16.1 Closure Cost Productivities ................................................................................................ 20-33 20.16.2 Key Assumptions ............................................................................................................... 20-34 20.16.3 Final Closure Costs ........................................................................................................... 20-34 20.16.4
20.17 Risks and Opportunities ..................................................................................................... 20-35 20.18 Conclusions and Recommendations .................................................................................. 20-36
21.0 CAPITAL AND OPERATING COSTS ............................................................................. 21-1 21.1 Capital Cost Summary .......................................................................................................... 21-1 21.2 Basis of Estimate .................................................................................................................. 21-1
General ................................................................................................................................ 21-1 21.2.1 Estimate Type / Accuracy .................................................................................................... 21-2 21.2.2
21.3 Direct Cost Elements ............................................................................................................ 21-2 Tailings Storage Facility, Including Sustaining Costs ........................................................... 21-2 21.3.1 Mining .................................................................................................................................. 21-3 21.3.2 Process Plant ...................................................................................................................... 21-3 21.3.3 Power to Site ....................................................................................................................... 21-5 21.3.4 Sustaining Capital Costs (Life of Mine) ................................................................................ 21-5 21.3.5
21.4 Indirect Cost Elements ......................................................................................................... 21-5 EPCM Cost .......................................................................................................................... 21-5 21.4.1 Construction Management (CM) .......................................................................................... 21-5 21.4.2 Owner’s Cost ....................................................................................................................... 21-6 21.4.3 Temporary Buildings and Facilities ...................................................................................... 21-6 21.4.4 Temporary Construction Utility Services .............................................................................. 21-6 21.4.5 Construction Fuel ................................................................................................................. 21-6 21.4.6 Spare Parts .......................................................................................................................... 21-7 21.4.7 Initial Fills ............................................................................................................................. 21-7 21.4.8
Çöpler Sulfide Expansion Project Feasibility Study
43-101 Technical Report
Page viii
Freight ................................................................................................................................. 21-7 21.4.9 Vendor’s Representatives – Construction/Commissioning .................................................. 21-7 21.4.10 Taxes and Duties ................................................................................................................. 21-8 21.4.11 Commissioning and Start-up ............................................................................................... 21-8 21.4.12
21.5 Escalation ............................................................................................................................. 21-8 21.6 Contingency .......................................................................................................................... 21-8
Application of Contingency .................................................................................................. 21-9 21.6.1 Monte Carlo Simulation / Probabilities of Under-Run ........................................................... 21-9 21.6.2
21.7 Capital Cost Qualifications and Exclusions ........................................................................ 21-10 21.8 Operating Costs (OPEX) .................................................................................................... 21-10
Introduction ........................................................................................................................ 21-10 21.8.1 Mine Operating Cost Estimate ........................................................................................... 21-13 21.8.2 Heap Leach Operating Costs ............................................................................................ 21-13 21.8.3 Sulfide Processing Costs ................................................................................................... 21-14 21.8.4 Tailing Management Facility .............................................................................................. 21-24 21.8.5
22.0 ECONOMIC ANALYSIS .................................................................................................. 22-1 22.1 Introduction ........................................................................................................................... 22-1 22.2 Methods, Assumptions, and Basis ....................................................................................... 22-1 22.3 Royalties ............................................................................................................................... 22-4 22.4 Salvage Value ...................................................................................................................... 22-4 22.5 Taxation ................................................................................................................................ 22-5 22.6 Financial Analysis Summary ................................................................................................ 22-5 22.7 Sensitivity Analysis ............................................................................................................... 22-8
Gold Price Sensitivity ........................................................................................................... 22-9 22.7.1 Copper Price Sensitivity ..................................................................................................... 22-10 22.7.2 Sulfide Capital Cost Sensitivity .......................................................................................... 22-11 22.7.3 Sulfide Operating Cost Sensitivity...................................................................................... 22-12 22.7.4 USD to TRY Conversion Sensitivity ................................................................................... 22-13 22.7.5 EURO to USD Conversion Sensitivity ................................................................................ 22-14 22.7.6
23.0 ADJACENT PROPERTIES ............................................................................................. 23-1
24.0 OTHER RELEVENT DATA AND INFORMATION .......................................................... 24-1 24.1 Project Execution and Schedule .......................................................................................... 24-1
Introduction .......................................................................................................................... 24-1 24.1.1 Schedule .............................................................................................................................. 24-2 24.1.2
25.0 INTERPRETATION AND CONCLUSIONS ..................................................................... 25-1 25.1 Mineral Resources ................................................................................................................ 25-1 25.2 Mining and Mineral Reserves ............................................................................................... 25-2 25.3 Waste Dump Facility ............................................................................................................. 25-2 25.4 Metallurgy and Mineral Processing ...................................................................................... 25-2 25.5 Infrastructure......................................................................................................................... 25-5 25.6 Tailings Storage Facility ....................................................................................................... 25-6 25.7 Marketing .............................................................................................................................. 25-7 25.8 Environmental/Permitting ..................................................................................................... 25-7 25.9 Mine Closure and Sustainability ........................................................................................... 25-8 25.10 Capital Cost Estimate ........................................................................................................... 25-9 25.11 Operating Cost Estimate .................................................................................................... 25-10
Çöpler Sulfide Expansion Project Feasibility Study
43-101 Technical Report
Page ix
25.12 Economic Analysis ............................................................................................................. 25-10 25.13 Project Execution Plan ....................................................................................................... 25-11
26.0 RECOMMENDATIONS ................................................................................................... 26-1 26.1 Database, QAQC and Mineral Resource Estimation ........................................................... 26-1 26.2 Mining and Mineral Reserves ............................................................................................... 26-2 26.3 Waste Dump Facilities .......................................................................................................... 26-3 26.4 Metallurgy and Mineral Processing ...................................................................................... 26-3 26.5 Infrastructure......................................................................................................................... 26-4 26.6 Tailings Storage Facility ....................................................................................................... 26-5 26.7 Marketing .............................................................................................................................. 26-5 26.8 Environmental/Permitting ..................................................................................................... 26-5 26.9 Mine Closure and Sustainability ........................................................................................... 26-5 26.10 Capital Cost Estimate ........................................................................................................... 26-6 26.11 Operating Cost Estimate ...................................................................................................... 26-6 26.12 Economic Analysis ............................................................................................................... 26-6
27.0 REFERENCES ................................................................................................................ 27-1
Çöpler Sulfide Expansion Project Feasibility Study
43-101 Technical Report
Page x
TABLE OF TABLES
Table 1-1 Summary of Qualified Persons and Associated Information .......................................................... 1-2 Table 1-2 Summary of Key Parameters Used in Lerchs Grossmann Conceptual Pit Shell......................... 1-14 Table 1-3 Mineral Resource Tabulation by Resource Classification and Oxide State ................................. 1-14 Table 1-4 Mineral Reserves for the Çöpler Gold Deposit .............................................................................. 1-16 Table 1-5 Overall Project Capital Cost Summary .......................................................................................... 1-24 Table 1-6 Summary of Life of Mine Operating Costs ..................................................................................... 1-26 Table 1-7 Summary of All in Cash Costs Net of By-Products ....................................................................... 1-26 Table 1-8 Life-of-Mine Sulfide Process Operating Costs by Cost Component ............................................. 1-27 Table 1-9 Respective Life of Mine Key Values Used for Differential Cash Flow Calculation ....................... 1-29 Table 1-10 Financial NPV, IRR, and Payback Period ................................................................................... 1-30 Table 1-11 Project Sensitivity ......................................................................................................................... 1-32 Table 6-1 Annual Production Summary for Ҫӧpler Gold Mine ........................................................................ 6-3 Table 7-1 Listing of the Groundwater Monitoring Wells (GMW) ...................................................................... 7-9 Table 7-2 Listing of the Groundwater Monitoring Wells (GMW) .................................................................... 7-10 Table 7-3 Reported Water Budget Values Used in Initial Modeling Stages ................................................. 7-13 Table 9-1 Çöpler - Geophysical Survey Details, Life of Project ...................................................................... 9-2 Table 10-1 Çöpler - Drilling by Method, through year end December 2013 ................................................. 10-1 Table 12-1 ALS Assay Audit Summary .......................................................................................................... 12-8 Table 12-2 AMEC Witness Sample Results .................................................................................................. 12-9 Table 12-3 Alacer CRM Summary (2007 to 2013) ...................................................................................... 12-11 Table 13-1 Master Composite Ore Mineral Compositions ............................................................................ 13-6 Table 13-2 Head Assay of Master Composite 4 (MC4) ................................................................................. 13-7 Table 13-3 Summary of Statistical Data for VSP1 Head Assays .................................................................. 13-8 Table 13-4 Summary of Statistical Data for VSP2 Head Assays .................................................................. 13-9 Table 13-5 Summary of Statistical Data for VSP1 Clay Mineralogy ........................................................... 13-10 Table 13-6 Summary of Statistical Data for VSP2 Clay Mineralogy ........................................................... 13-11 Table 13-7 Summary Variability Comminution Test Results ....................................................................... 13-13 Table 13-8 Hazen Whole Ore CIL Cyanidation on Campaign 1 to 3 Individual Rock Type Composites .. 13-17 Table 13-9 Summary of Hazen Batch POX and Residue Cyanidation on MC1 ......................................... 13-19 Table 13-10 Campaign 1 Pilot Plant Run Conditions .................................................................................. 13-20 Table 13-11 Summary Campaign 1 Pilot Results – Acidulation, POX, and Cyanidation ........................... 13-21 Table 13-12 Campaign 2 Summary of Operating Conditions ..................................................................... 13-23 Table 13-13 Summary Campaign 2 Pilot Results – Acidulation, POX, and Cyanidation ........................... 13-24 Table 13-14 Campaign 3 Summary Operating Condition ........................................................................... 13-25 Table 13-15 Summary Campaign 3 Pilot Results – Acidulation, POX, and Cyanidation ........................... 13-26 Table 13-16 Summary of Campaign 4 Pilot Plant Results – Acidulation, POX and Cyanidation .............. 13-28 Table 13-17 Hot Cure XRD Results ............................................................................................................. 13-29 Table 13-18 MSP Pilot Plant Results ........................................................................................................... 13-30 Table 13-19 Summary Design Criteria and Target Thickener U/F Densities ............................................. 13-31 Table 13-20 Grinding Thickener Test Result Summary .............................................................................. 13-31 Table 13-21 POX Feed Thickener Test Result Summary ........................................................................... 13-31 Table 13-22 Decant Thickener Test Result Summary ................................................................................. 13-32 Table 13-23 CCD Thickener Test Result Summary .................................................................................... 13-32 Table 13-24 Tailings Thickener Test Result Summary ................................................................................ 13-32 Table 13-25 Copper Precipitation Thickener Test Result Summary ........................................................... 13-32
Çöpler Sulfide Expansion Project Feasibility Study
43-101 Technical Report
Page xi
Table 13-26 Summary of Cyanidation for Cyanide Concentration Optimization ........................................ 13-33 Table 13-27 Summary of Equilibrium Carbon Loading Data ....................................................................... 13-34 Table 13-28 Carbon Adsorption Rate Data .................................................................................................. 13-35 Table 13-29 Summary of Cyanco CN Destruct Test 1 through 5 ................................................................ 13-37 Table 13-30 Summary of Cyanco CN Destruct Test 6 through 9 ................................................................ 13-38 Table 13-31 Summary Statistical Data for Phase 1 Variability Batch POX and Cyanidation of POX Residues13-40 Table 13-32 Summary of FLSmidth Flotation Test Results ......................................................................... 13-46 Table 14-1 Block Model Parameters for the Çöpler Resource Model ........................................................... 14-3 Table 14-2 Gold and Sulfur Indicator Estimation Parameters ....................................................................... 14-5 Table 14-3 Samples – General Gold Statistics by Geology (based on 1 m composites) ............................ 14-9 Table 14-4 Key Element Statistics (based on 1 m composites) .................................................................... 14-9 Table 14-5 Correlation Coefficients (5m composites) .................................................................................. 14-11 Table 14-6 Comparison of the Different Capping Methods for Gold (units g/t)........................................... 14-15 Table 14-7 Capping Thresholds Applied Globally........................................................................................ 14-15 Table 14-8 Drill Hole Composite Statistics (based on 5 m composites) ..................................................... 14-16 Table 14-9 Variogram Parameters Used in the Mineral Resource Estimation ........................................... 14-18 Table 14-10 Datamine Sulfur Estimation Parameters ................................................................................. 14-20 Table 14-11 Summary of the Estimation Parameters Used in the PACK Estimations ............................... 14-26 Table 14-12 Density Outliers Removed by Rock Type ................................................................................ 14-29 Table 14-13 Bulk Density Values Assigned to the Block Model by Rock Type and Vertical Depth .......... 14-31 Table 14-14 Global Bias by Metal and Domain ........................................................................................... 14-32 Table 14-15 Summary of Key Parameters Used in Lerchs-Grossmann Conceptual Pit Shell .................. 14-36 Table 14-16 Mineral Resource Table by Classification and Oxide State .................................................... 14-37 Table 15-1 Mineral Reserves for the Çöpler Gold Deposit ............................................................................ 15-1 Table 15-2 Mining and Processing Schedule 2014 through 2020 ................................................................ 15-4 Table 15-3 Mining and Processing Schedule 2021 through 2034 ................................................................ 15-5 Table 16-1 Mining and Processing Costs for Whittle Optimization ............................................................... 16-2 Table 16-2 Costs Attributable to Gold Sales .................................................................................................. 16-2 Table 16-3 Whittle Optimization Recoveries .................................................................................................. 16-4 Table 16-4 Whittle Optimization Slope Parameters ....................................................................................... 16-5 Table 16-5 Alacer Pit Design Slope Parameters ........................................................................................... 16-8 Table 16-6 2014 Ҫӧpler Phase Design Tonnage and Grade ........................................................................ 16-9 Table 16-7 Summary of Gauge Records with Sufficient Data for Analysis ................................................. 16-12 Table 16-8 24-hour Storm Depths for Çöpler Project .................................................................................. 16-12 Table 16-9 Average Rainfall for Çöpler Project ........................................................................................... 16-12 Table 16-10 Golder Recommended Pit Slope Angles ................................................................................. 16-17 Table 16-11 Alacer Pit Design Slope Parameters ....................................................................................... 16-17 Table 16-12 Lower Ҫӧpler East and West WRSA Design Factor of Safety ............................................... 16-21 Table 16-13 Waste Rock Geochemical Classification (SRK, 2012c) .......................................................... 16-23 Table 18-1 Displacement results from different methods ............................................................................ 18-18 Table 19-1 Project Copper Precipitate Analysis ............................................................................................ 19-2 Table 19-2 Raw Material and Commodity Brokers ........................................................................................ 19-3 Table 19-3 European Copper Smelters.......................................................................................................... 19-4 Table 20-1 Environmental Permits Obtained for Çöpler Gold Mine (Oxide Ore) .......................................... 20-4 Table 20-2 Results of Soil Sample Analysis .................................................................................................. 20-8 Table 20-3 EBS (2005-2006) Analyses Results .......................................................................................... 20-13 Table 20-4 EMP (2008-2011) Analyses Results .......................................................................................... 20-13
Çöpler Sulfide Expansion Project Feasibility Study
43-101 Technical Report
Page xii
Table 20-5 EBS (2012- ) Analyses Results .................................................................................................. 20-13 Table 20-6 Population and Number of Households of the Project Affected Villages ................................. 20-23 Table 20-7 Closure Schedule ....................................................................................................................... 20-32 Table 20-8 Closure Costs ............................................................................................................................. 20-35 Table 21-1 Overall Capital Cost Summary ..................................................................................................... 21-1 Table 21-2 TSF Initial and Sustaining Capital Costs ..................................................................................... 21-3 Table 21-3 Direct Field Cost Area Summary ................................................................................................. 21-4 Table 21-4 Summary of Life-of-Mine Operating Costs ................................................................................ 21-11 Table 21-5 Summary of All-In Cash Costs Net of By-Products ................................................................... 21-11 Table 21-6 Life-of-Mine Total Sulfide Process Cost by Cost Component .................................................. 21-12 Table 21-7 Life-of-Mine Total Sulfide Process Cost by Plant Area ............................................................. 21-13 Table 21-8 Alacer Heap Leach Process Cost used in Mineral Reserve Model .......................................... 21-14 Table 21-9 Oxygen Plant Processing Cost per tonne Sulfide Feed ............................................................ 21-15 Table 21-10 Total Oxygen Plant Costs per tonne of Oxygen Consumed ................................................... 21-16 Table 21-11 Sulfide Process Salaried Labor ................................................................................................ 21-17 Table 21-12 Non-Exempt Labor ................................................................................................................... 21-18 Table 21-13 Life-of-Mine Sulfide Process Labor Costs ............................................................................... 21-19 Table 21-14 Operating and Maintenance Unit Supplies Costs ................................................................... 21-21 Table 21-15 Unit Supplies, Usage Rates & Costs by Plant Area ................................................................ 21-23 Table 21-16 Projected Electrical Use ........................................................................................................... 21-24 Table 22-1 Financial Model Inputs ................................................................................................................. 22-3 Table 22-2 Respective Life of Mine Key Values used for Differential Cash Flow Calculation ..................... 22-4 Table 22-3 Financial NPV, IRR, and Payback Period ................................................................................... 22-5 Table 22-4 Cash Flow Differential – Combined Sulfide Process Plant + Heap Leach and Heap Leach .... 22-6 Table 22-5 Project Sensitivity ......................................................................................................................... 22-8
Çöpler Sulfide Expansion Project Feasibility Study
43-101 Technical Report
Page xiii
TABLE OF FIGURES
Figure 1-1 Project Location Map....................................................................................................................... 1-3 Figure 1-2 Structural Setting of Anatolia .......................................................................................................... 1-5 Figure 1-3 Çöpler Sulfide Process Schematic ............................................................................................... 1-21 Figure 1-4 Cumulative Cash Flows for Sulfide Project and Oxide Projects and Oxide Project Only ........... 1-31 Figure 4-1 Location of the Project..................................................................................................................... 4-1 Figure 4-2 Çöpler Mine License and Surrounding Licenses (UTM Grid) ........................................................ 4-2 Figure 7-1 Structural Setting of Anatolia .......................................................................................................... 7-1 Figure 7-2 Contact between Munzur Formation Limestone and Çöpler Intrusive-Metasediment Complex,
Looking West .................................................................................................................................. 7-2 Figure 7-3 Local Geology (Alacer Geological Map) ......................................................................................... 7-4 Figure 7-4 Groundwater Elevations for the Çöpler Site, November 2012 Data ............................................ 7-10 Figure 7-5 Project Area with Various Model Grids ......................................................................................... 7-11 Figure 7-6 Individual Geologic Models Created in Leapfrog ......................................................................... 7-14 Figure 7-7 Hydrogeologic Model with MODFLOW Grid and Layering .......................................................... 7-15 Figure 7-8 Cross Section and Plan View of Model Domain with MODFLOW Grid and Layers ................... 7-16 Figure 10-1 Drill Hole Collar Locations and Main Deposit Areas (E1950 UTM6) ......................................... 10-2 Figure 11-1 Current RC Sample Preparation Procedure ............................................................................... 11-6 Figure 11-2 Current DD Sample Preparation Procedure ............................................................................... 11-7 Figure 12-1 3D View of Drill Holes vs Pre-mining Topography, Perspective View, No Scale, Looking South12-2 Figure 12-2 Histogram of 10m OMAC Composites ....................................................................................... 12-4 Figure 12-3 Histogram of 10m ALS Composites ........................................................................................... 12-5 Figure 12-4 QQ Plot OMAC vs ALS Au Grade Distribution ........................................................................... 12-6 Figure 12-5 Location of 10 m Composites over 4 g/t Au ............................................................................... 12-7 Figure 12-6 ALS Sample Prep - Crusher Screen Test – 2mm ...................................................................... 12-9 Figure 12-7 ALS Sample Prep - Pulverizer Screen Test – 75 µm .............................................................. 12-10 Figure 12-8 CRM Summary Chart (2007 – 2013) ........................................................................................ 12-12 Figure 12-9 Assay Precision, Core Duplicate - Gold ................................................................................... 12-14 Figure 12-10 Assay Precision, Core Duplicate – Sulfur .............................................................................. 12-15 Figure 13-1 AMTEL Gold Particle Size Distribution of Feed Ore .................................................................. 13-4 Figure 13-2 “S” Curve Rock Type Cumulative % as a Function of Bond Work Index ................................ 13-14 Figure 13-3 “S” Curve Rock Type Cumulative % as a Function of SPI Minutes ........................................ 13-15 Figure 13-4 Equilibrium Carbon Loading Data ............................................................................................. 13-35 Figure 13-5 Carbon Adsorption Rate ........................................................................................................... 13-36 Figure 13-6 Gold Extraction from POX Residue as a Function of CIL Head Grade ................................... 13-41 Figure 13-7 POX Copper Extraction as a Function of POX Residue Sulfide Sulfur ................................... 13-43 Figure 13-8 Silver Tail Assay as a Function of POX Residue Sulfide Sulfur .............................................. 13-44 Figure 14-1 Geographic Domains with Drill Hole Collar Locations ............................................................... 14-2 Figure 14-2 Cross Section Showing the Geometry of the Low-Grade Economic Mineralization, Defined by
the Low-Grade Indicator Model; Section 459,060E, looking East .............................................. 14-5 Figure 14-3 Oblique View Looking Southeast Showing the Gold Grades in the Resource Model and the
Domains ........................................................................................................................................ 14-6 Figure 14-4 Lithology Model – Manganese Zone, Section 459,900E, Looking West .................................. 14-7 Figure 14-5 Lithology Model – Marble Contact Zone, Section 459, 650E, Looking West ............................ 14-8 Figure 14-6 Boxplot of Au Categorized by Lithology (1m composites) ....................................................... 14-10 Figure 14-7 Boxplot of S Categorized by Lithology (1m composites) ......................................................... 14-10
Çöpler Sulfide Expansion Project Feasibility Study
43-101 Technical Report
Page xiv
Figure 14-8 Contact plot of Gold across the Diorite–Metasediments Contact for ≥ 2% S Material ........... 14-13 Figure 14-9 Gold Assays above 1 Gram at Lithology Contacts, Section 459,400E, Looking West .......... 14-14 Figure 14-10 Example Gold Variogram for Marble Domain, < 2% S .......................................................... 14-17 Figure 14-11 Cross-Section of Sulfur Model, Section 459,600E, Looking East ......................................... 14-20 Figure 14-12 Summary of the Two Pass PACK Method ............................................................................. 14-22 Figure 14-13 Cross Section Illustrating the Geometry of the Low-Grade Gold Indicator PACK Model; Section
459,060E, looking East .............................................................................................................. 14-23 Figure 14-14 Cross Section illustrating the Geometry of the High-Grade Gold Indicator PACK Model;
Section 459,060E, looking East ................................................................................................. 14-24 Figure 14-15 Cross Section Illustrating the Combined Low- and High-Grade PACK Gold Estimates; Section
459,060E, looking East .............................................................................................................. 14-25 Figure 14-16 Plan of Resource Classification Showing Indicated (Green) with Inferred (Blue) Material
Forming a Ring around the Indicated Material .......................................................................... 14-28 Figure 14-17 Diorite Bulk Density Values by Depth below Surface ............................................................ 14-30 Figure 14-18 Metasediments Bulk Density Values by Depth below Surface .............................................. 14-30 Figure 14-19 Gold Grade Trend Plot by Easting .......................................................................................... 14-33 Figure 14-20 Gold Grade Trend Plot by Northing ........................................................................................ 14-33 Figure 14-21 Gold Grade Trend Plot by Elevation ....................................................................................... 14-34 Figure 14-22 Herco Plots Categorized by Low (<2% S) and High (>=2%) Sulfur Content ........................ 14-35 Figure 14-23 Distribution Curve for <2% S Material Classified as Indicated Mineral Resources within the
2014 Lerchs-Grossmann Conceptual Pit Shell ......................................................................... 14-38 Figure 14-24 Grade-Tonnage Curve for >=2% S Material Classified as Indicated Mineral Resources within
the Lerchs-Grossmann Conceptual Pit Shell ............................................................................ 14-38 Figure 15-1 Example of Pit Design Solids Reserved by Chronos ................................................................. 15-2 Figure 15-2 2017 End of Year Map ................................................................................................................ 15-6 Figure 16-1 Gold Recovery Equation (where HGAu is the gold head grade) ............................................... 16-3 Figure 16-2 Example Whittle Best/Selected/Worst Case Results ................................................................. 16-7 Figure 16-3 Whittle Pit Shell for Design (Oxide Cut-off: BE+0.05, Sulfide Cut-off: 1.5, Pit 7-$800Au) ........ 16-7 Figure 16-4 Final Pit Layout .......................................................................................................................... 16-10 Figure 16-5 Ҫӧpler WRSA General Arrangement ....................................................................................... 16-19 Figure 16-6 Ҫӧpler Blast Hole Sampling Procedure .................................................................................... 16-25 Figure 17-1 Çöpler Sulfide Process Schematic ............................................................................................. 17-5 Figure 18-1 TSF Starter Embankment and Impoundment Grading Plan.................................................... 18-13 Figure 18-2 Ultimate TSF Grading Plan ....................................................................................................... 18-14 Figure 18-3 TSF Ultimate Embankment Profile ........................................................................................... 18-15 Figure 20-1 Main Soil Groups and Soil Sampling Locations ......................................................................... 20-7 Figure 20-2 Water Quality Sampling Locations for Çöpler Project .............................................................. 20-12 Figure 20-3 Current Land Use Types ........................................................................................................... 20-15 Figure 20-4 Land Use Capability Classes (LUCC) ...................................................................................... 20-16 Figure 20-5 Cadastral Map for the Çöpler Sulfide Expansion Project ........................................................ 20-17 Figure 20-6 Site View from the Project Area - 1........................................................................................... 20-18 Figure 20-7 Site View from the Project Area – 2 .......................................................................................... 20-19 Figure 20-8 Forest Area Types ..................................................................................................................... 20-20 Figure 20-9 Structure of the IUCN Risk Categories ..................................................................................... 20-21 Figure 21-1 Oxygen Plant Operating Cost per tonne of Oxygen Consumed as Function of Oxygen
Consumed per Year ................................................................................................................... 21-16 Figure 22-1 Cumulative Cash Flows of the Sulfide + Oxide Project and Oxide Project Only ...................... 22-7 Figure 22-2 Gold Price Sensitivity versus Differential Cash Flow IRR .......................................................... 22-9
Çöpler Sulfide Expansion Project Feasibility Study
43-101 Technical Report
Page xv
Figure 22-3 Gold Price Sensitivity versus NPV @ 5% Discount Rate .......................................................... 22-9 Figure 22-4 Copper Price Sensitivity versus Differential Cash Flow IRR ................................................... 22-10 Figure 22-5 Copper Price Sensitivity versus NPV @ 5% Discount Rate .................................................... 22-10 Figure 22-6 Sulfide Capital Cost Sensitivity versus Differential Cash Flow IRR......................................... 22-11 Figure 22-7 Sulfide Capital Cost Sensitivity versus NPV @ 5% Discount Rate ......................................... 22-11 Figure 22-8 Sulfide Operating Cost Sensitivity versus Differential Cash Flow IRR .................................... 22-12 Figure 22-9 Sulfide Operating Cost Sensitivity versus NPV @ 5% Discount Rate .................................... 22-12 Figure 22-10 USD to TRY Conversion Sensitivity versus Differential Cash Flow IRR ............................... 22-13 Figure 22-11 USD to TRY Conversion Sensitivity versus NPV @ 5% Discount Rate ............................... 22-13 Figure 22-12 EURO to USD Conversion Sensitivity versus Differential Cash Flow IRR ........................... 22-14 Figure 22-13 EURO to USD Conversion Sensitivity versus NPV @ 5% Discount Rate ............................ 22-14 Figure 24-1 Preliminary Milestone Schedule ................................................................................................. 24-1
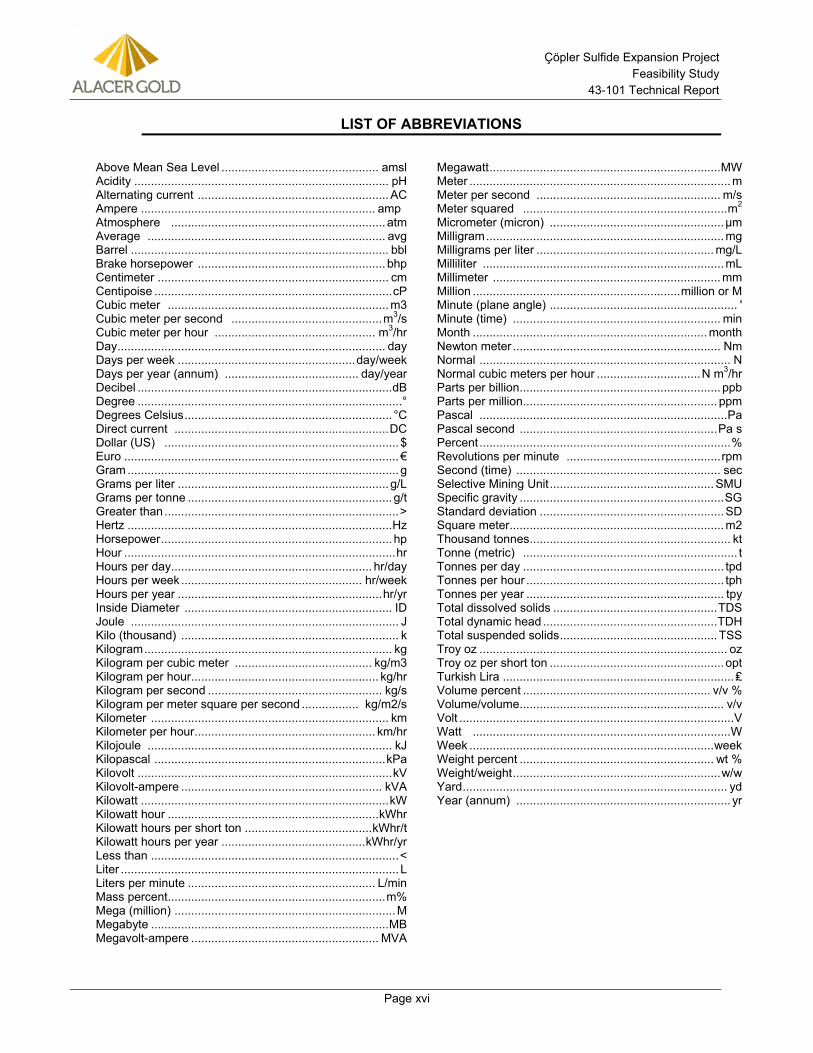
Çöpler Sulfide Expansion Project Feasibility Study
43-101 Technical Report
Page xvi
LIST OF ABBREVIATIONS
Above Mean Sea Level ............................................... amsl Acidity ............................................................................ pH Alternating current ......................................................... AC Ampere ...................................................................... amp Atmosphere ................................................................ atm Average ....................................................................... avg Barrel ............................................................................. bbl Brake horsepower ........................................................ bhp Centimeter ..................................................................... cm Centipoise ....................................................................... cP Cubic meter .................................................................. m3 Cubic meter per second ............................................. m3/s Cubic meter per hour ................................................ m3/hr Day ................................................................................ day Days per week ..................................................... day/week Days per year (annum) ........................................ day/year Decibel ............................................................................ dB Degree ...............................................................................° Degrees Celsius .............................................................. °C Direct current ................................................................ DC Dollar (US) ...................................................................... $ Euro .................................................................................. € Gram ................................................................................. g Grams per liter ............................................................... g/L Grams per tonne ............................................................. g/t Greater than ...................................................................... > Hertz ............................................................................... Hz Horsepower ..................................................................... hp Hour ................................................................................. hr Hours per day............................................................ hr/day Hours per week ...................................................... hr/week Hours per year ............................................................. hr/yr Inside Diameter .............................................................. ID Joule ................................................................................ J Kilo (thousand) ................................................................. k Kilogram .......................................................................... kg Kilogram per cubic meter ......................................... kg/m3 Kilogram per hour ........................................................ kg/hr Kilogram per second .................................................... kg/s Kilogram per meter square per second ................. kg/m2/s Kilometer ....................................................................... km Kilometer per hour ...................................................... km/hr Kilojoule ......................................................................... kJ Kilopascal ..................................................................... kPa Kilovolt ............................................................................ kV Kilovolt-ampere ............................................................ kVA Kilowatt .......................................................................... kW Kilowatt hour ............................................................... kWhr Kilowatt hours per short ton ...................................... kWhr/t Kilowatt hours per year ........................................... kWhr/yr Less than .......................................................................... < Liter ................................................................................... L Liters per minute ........................................................ L/min Mass percent................................................................. m% Mega (million) .................................................................. M Megabyte ....................................................................... MB Megavolt-ampere ........................................................ MVA
Megawatt ..................................................................... MW Meter .............................................................................. m Meter per second ....................................................... m/s Meter squared ............................................................. m2 Micrometer (micron) .................................................... µm Milligram ....................................................................... mg Milligrams per liter ..................................................... mg/L Milliliter ........................................................................ mL Millimeter .................................................................... mm Million .............................................................. million or M Minute (plane angle) ........................................................ ' Minute (time) .............................................................. min Month ...................................................................... month Newton meter .............................................................. Nm Normal ........................................................................... N Normal cubic meters per hour ............................... N m3/hr Parts per billion ............................................................ ppb Parts per million .......................................................... ppm Pascal .......................................................................... Pa Pascal second ........................................................... Pa s Percent ........................................................................... % Revolutions per minute .............................................. rpm Second (time) ............................................................. sec Selective Mining Unit ................................................. SMU Specific gravity ............................................................. SG Standard deviation ....................................................... SD Square meter................................................................ m2 Thousand tonnes ............................................................ kt Tonne (metric) ................................................................ t Tonnes per day ............................................................ tpd Tonnes per hour ........................................................... tph Tonnes per year ........................................................... tpy Total dissolved solids ................................................. TDS Total dynamic head .................................................... TDH Total suspended solids ............................................... TSS Troy oz .......................................................................... oz Troy oz per short ton .................................................... opt Turkish Lira ..................................................................... ₤ Volume percent ........................................................ v/v % Volume/volume ............................................................. v/v Volt .................................................................................. V Watt ............................................................................. W Week ......................................................................... week Weight percent .......................................................... wt % Weight/weight .............................................................. w/w Yard ............................................................................... yd Year (annum) ................................................................ yr
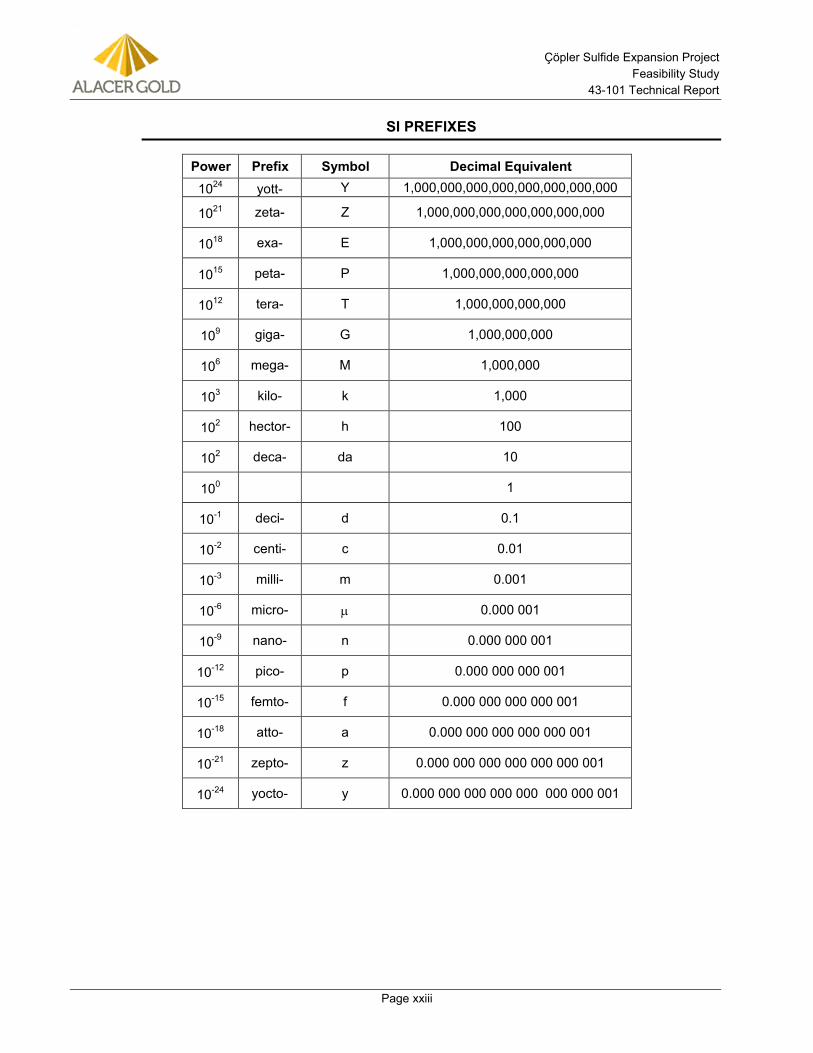
Çöpler Sulfide Expansion Project Feasibility Study
43-101 Technical Report
Page xxiii
SI PREFIXES
Power Prefix Symbol Decimal Equivalent 1024 yott- Y 1,000,000,000,000,000,000,000,000
1021 zeta- Z 1,000,000,000,000,000,000,000
1018 exa- E 1,000,000,000,000,000,000
1015 peta- P 1,000,000,000,000,000
1012 tera- T 1,000,000,000,000
109 giga- G 1,000,000,000
106 mega- M 1,000,000
103 kilo- k 1,000
102 hector- h 100
102 deca- da 10
100 1
10-1 deci- d 0.1
10-2 centi- c 0.01
10-3 milli- m 0.001
10-6 micro- µ 0.000 001
10-9 nano- n 0.000 000 001
10-12 pico- p 0.000 000 000 001
10-15 femto- f 0.000 000 000 000 001
10-18 atto- a 0.000 000 000 000 000 001
10-21 zepto- z 0.000 000 000 000 000 000 001
10-24 yocto- y 0.000 000 000 000 000 000 000 001
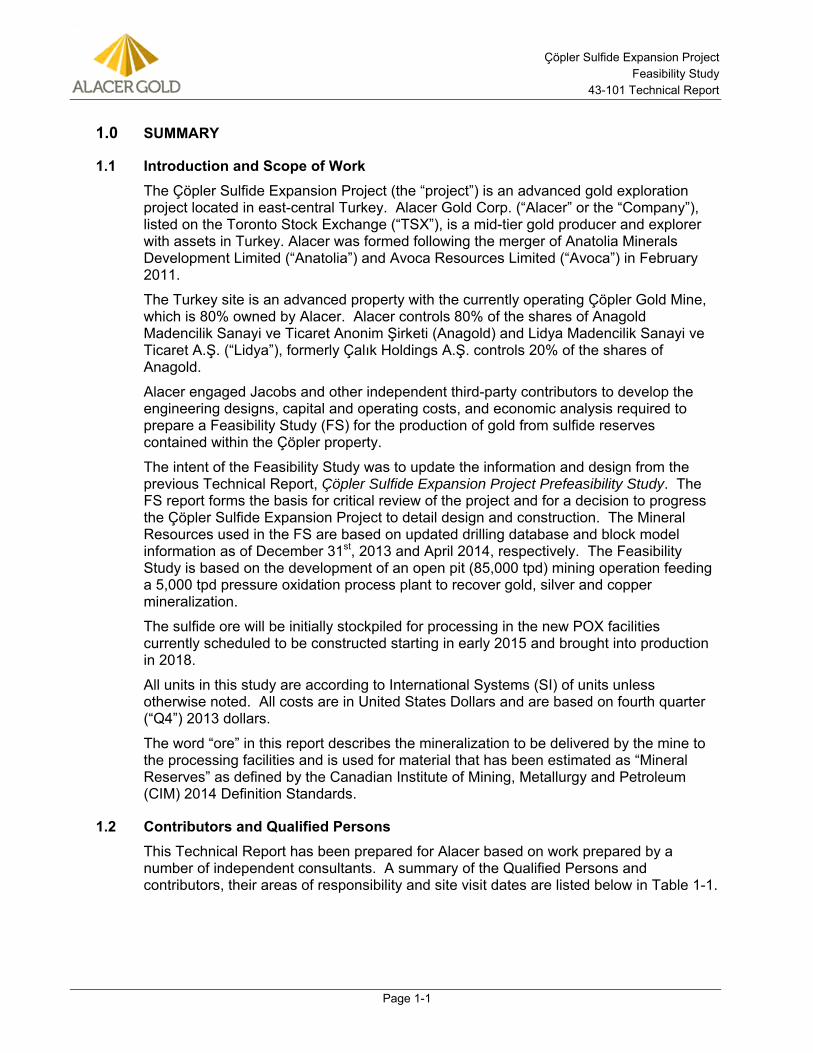
Çöpler Sulfide Expansion Project Feasibility Study
43-101 Technical Report
Page 1-1
1.0 SUMMARY
1.1 Introduction and Scope of Work The Çöpler Sulfide Expansion Project (the “project”) is an advanced gold exploration project located in east-central Turkey. Alacer Gold Corp. (“Alacer” or the “Company”), listed on the Toronto Stock Exchange (“TSX”), is a mid-tier gold producer and explorer with assets in Turkey. Alacer was formed following the merger of Anatolia Minerals Development Limited (“Anatolia”) and Avoca Resources Limited (“Avoca”) in February 2011.
The Turkey site is an advanced property with the currently operating Çöpler Gold Mine, which is 80% owned by Alacer. Alacer controls 80% of the shares of Anagold Madencilik Sanayi ve Ticaret Anonim Şirketi (Anagold) and Lidya Madencilik Sanayi ve Ticaret A.Ş. (“Lidya”), formerly Çalık Holdings A.Ş. controls 20% of the shares of Anagold.
Alacer engaged Jacobs and other independent third-party contributors to develop the engineering designs, capital and operating costs, and economic analysis required to prepare a Feasibility Study (FS) for the production of gold from sulfide reserves contained within the Çöpler property.
The intent of the Feasibility Study was to update the information and design from the previous Technical Report, Çöpler Sulfide Expansion Project Prefeasibility Study. The FS report forms the basis for critical review of the project and for a decision to progress the Çöpler Sulfide Expansion Project to detail design and construction. The Mineral Resources used in the FS are based on updated drilling database and block model information as of December 31st, 2013 and April 2014, respectively. The Feasibility Study is based on the development of an open pit (85,000 tpd) mining operation feeding a 5,000 tpd pressure oxidation process plant to recover gold, silver and copper mineralization.
The sulfide ore will be initially stockpiled for processing in the new POX facilities currently scheduled to be constructed starting in early 2015 and brought into production in 2018.
All units in this study are according to International Systems (SI) of units unless otherwise noted. All costs are in United States Dollars and are based on fourth quarter (“Q4”) 2013 dollars.
The word “ore” in this report describes the mineralization to be delivered by the mine to the processing facilities and is used for material that has been estimated as “Mineral Reserves” as defined by the Canadian Institute of Mining, Metallurgy and Petroleum (CIM) 2014 Definition Standards.
1.2 Contributors and Qualified Persons This Technical Report has been prepared for Alacer based on work prepared by a number of independent consultants. A summary of the Qualified Persons and contributors, their areas of responsibility and site visit dates are listed below in Table 1-1.
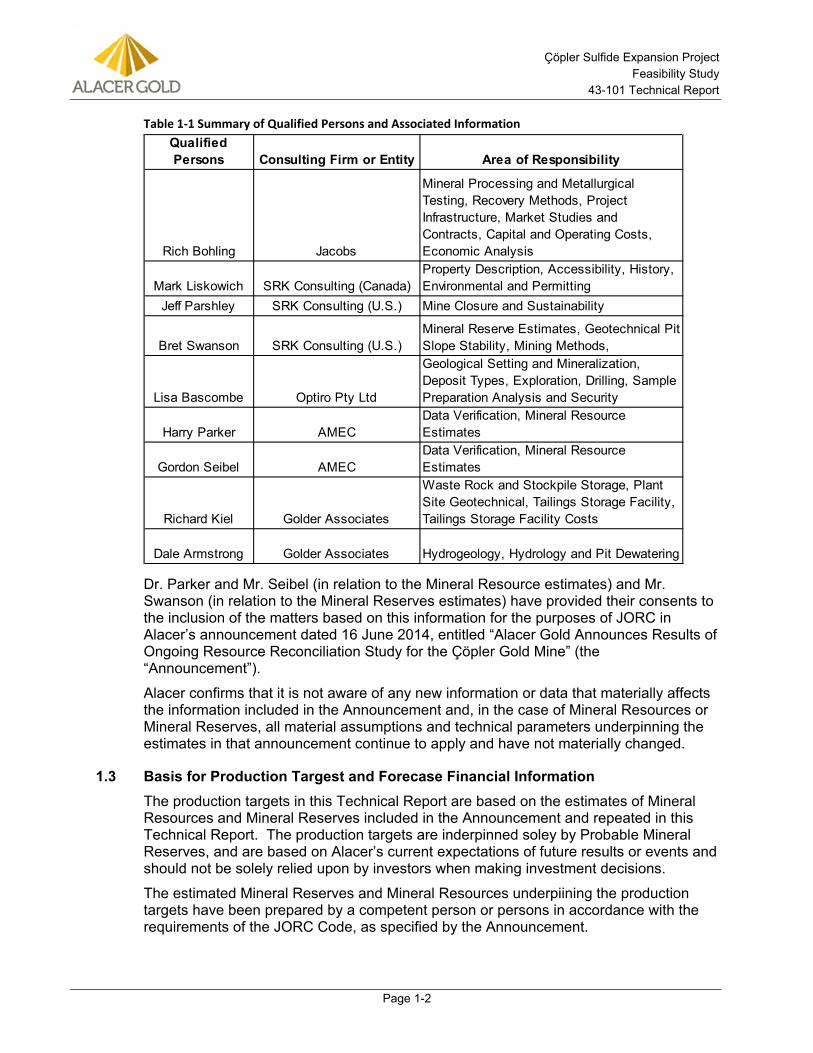
Çöpler Sulfide Expansion Project Feasibility Study
43-101 Technical Report
Page 1-2
Table 1-1 Summary of Qualified Persons and Associated Information
Dr. Parker and Mr. Seibel (in relation to the Mineral Resource estimates) and Mr. Swanson (in relation to the Mineral Reserves estimates) have provided their consents to the inclusion of the matters based on this information for the purposes of JORC in Alacer’s announcement dated 16 June 2014, entitled “Alacer Gold Announces Results of Ongoing Resource Reconciliation Study for the Çöpler Gold Mine” (the “Announcement”).
Alacer confirms that it is not aware of any new information or data that materially affects the information included in the Announcement and, in the case of Mineral Resources or Mineral Reserves, all material assumptions and technical parameters underpinning the estimates in that announcement continue to apply and have not materially changed.
1.3 Basis for Production Targest and Forecase Financial Information The production targets in this Technical Report are based on the estimates of Mineral Resources and Mineral Reserves included in the Announcement and repeated in this Technical Report. The production targets are inderpinned soley by Probable Mineral Reserves, and are based on Alacer’s current expectations of future results or events and should not be solely relied upon by investors when making investment decisions.
The estimated Mineral Reserves and Mineral Resources underpiining the production targets have been prepared by a competent person or persons in accordance with the requirements of the JORC Code, as specified by the Announcement.
Qualified Persons Consulting Firm or Entity Area of Responsibility
Rich Bohling Jacobs
Mineral Processing and Metallurgical Testing, Recovery Methods, Project Infrastructure, Market Studies and Contracts, Capital and Operating Costs, Economic Analysis
Mark Liskowich SRK Consulting (Canada)Property Description, Accessibility, History, Environmental and Permitting
Jeff Parshley SRK Consulting (U.S.) Mine Closure and Sustainability
Bret Swanson SRK Consulting (U.S.)Mineral Reserve Estimates, Geotechnical Pit Slope Stability, Mining Methods,
Lisa Bascombe Optiro Pty Ltd
Geological Setting and Mineralization, Deposit Types, Exploration, Drilling, Sample Preparation Analysis and Security
Harry Parker AMECData Verification, Mineral Resource Estimates
Gordon Seibel AMECData Verification, Mineral Resource Estimates
Richard Kiel Golder Associates
Waste Rock and Stockpile Storage, Plant Site Geotechnical, Tailings Storage Facility, Tailings Storage Facility Costs
Dale Armstrong Golder Associates Hydrogeology, Hydrology and Pit Dewatering
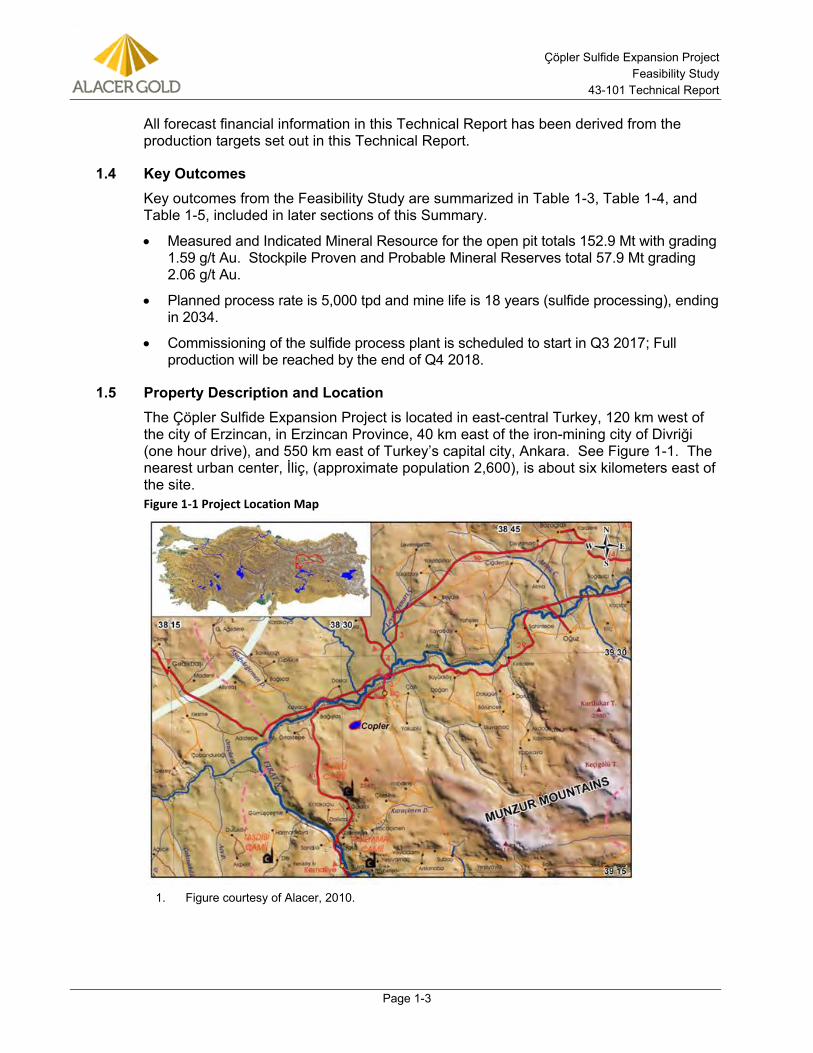
Çöpler Sulfide Expansion Project Feasibility Study
43-101 Technical Report
Page 1-3
All forecast financial information in this Technical Report has been derived from the production targets set out in this Technical Report.
1.4 Key Outcomes Key outcomes from the Feasibility Study are summarized in Table 1-3, Table 1-4, and Table 1-5, included in later sections of this Summary.
• Measured and Indicated Mineral Resource for the open pit totals 152.9 Mt with grading 1.59 g/t Au. Stockpile Proven and Probable Mineral Reserves total 57.9 Mt grading 2.06 g/t Au.
• Planned process rate is 5,000 tpd and mine life is 18 years (sulfide processing), ending in 2034.
• Commissioning of the sulfide process plant is scheduled to start in Q3 2017; Full production will be reached by the end of Q4 2018.
1.5 Property Description and Location The Çöpler Sulfide Expansion Project is located in east-central Turkey, 120 km west of the city of Erzincan, in Erzincan Province, 40 km east of the iron-mining city of Divriği (one hour drive), and 550 km east of Turkey’s capital city, Ankara. See Figure 1-1. The nearest urban center, İliç, (approximate population 2,600), is about six kilometers east of the site. Figure 1-1 Project Location Map
Figure courtesy of Alacer, 2010. 1.
Çöpler Sulfide Expansion Project Feasibility Study
43-101 Technical Report
Page 1-4
1.6 Accessibility, Climate, Local Resources, Infrastructure and Physiography The mine is accessible by a maintained unpaved road from the south end of the town of İliç, routed to the north entrance to the mine. There is also a completed bypass road, commencing just north of İliç near the railway station to the Çöpler mining area.
The project area is located in the Eastern Anatolia geographical district of Turkey. The climate is typically continental with wet, cold winters and dry, hot summers. The Çöpler mining area is accessed from the main paved highway between Erzincan and Kemaliye.
1.7 History The Turkish “Geological Survey” (MTA) carried out regional exploration work in the early 1960s that was predominately confined to mapping. During 1964, a local Turkish company started manganese mining which continued until closing in 1973. Unimangan acquired the property in January 1979 and restarted manganese production, continuing until 1992.
In September 1998, Alacer predecessor Anatolia Minerals Development Ltd (Anatolia) identified several porphyry-style gold-copper prospects in east-central Turkey and applied for an exploration license totaling over 100,000 hectares covering these prospects. During this work, Anatolia identified a prospect in the Çöpler basin. This prospect and the supporting work was the basis for a joint venture agreement for exploration with Rio Tinto.
In January 2004, Anatolia acquired the interests of Rio Tinto and Unimangan. The property was under sole control of Anatolia until the joint venture agreement between Anatolia and Lydia was executed in August 2009.
Anatolia merged with Avoca Resources Limited, an Australian company, to form Alacer Gold Corporation in February of 2010.
In October 2013, Alacer sold its Australian Business Unit (which included the Higginsville and South Kalgoorlie Operations) to a subsidiary of Metals X Limited, an Australian public company.
In most cases the company will be referred to as Alacer even though it may have been Anagold or Anatolia at the time referenced in the report.
1.8 Geological Setting and Mineralization The Çöpler Project is located near the north margin of a complex collision zone lying between the Pontide Belt/North Anatolian Fault, the Arabian Plate and the East Anatolian Fault which bounds several major plates. The region underwent crustal thickening related to the closure of a single ocean, or possibly several oceanic and micro-continental realms, in the late Cretaceous to early Tertiary. Figure 1-2 illustrates the broad structural setting of the Anatolia region of Turkey. The small yellow square located between Divriği and Ovacık marks the location of the Çöpler Project.
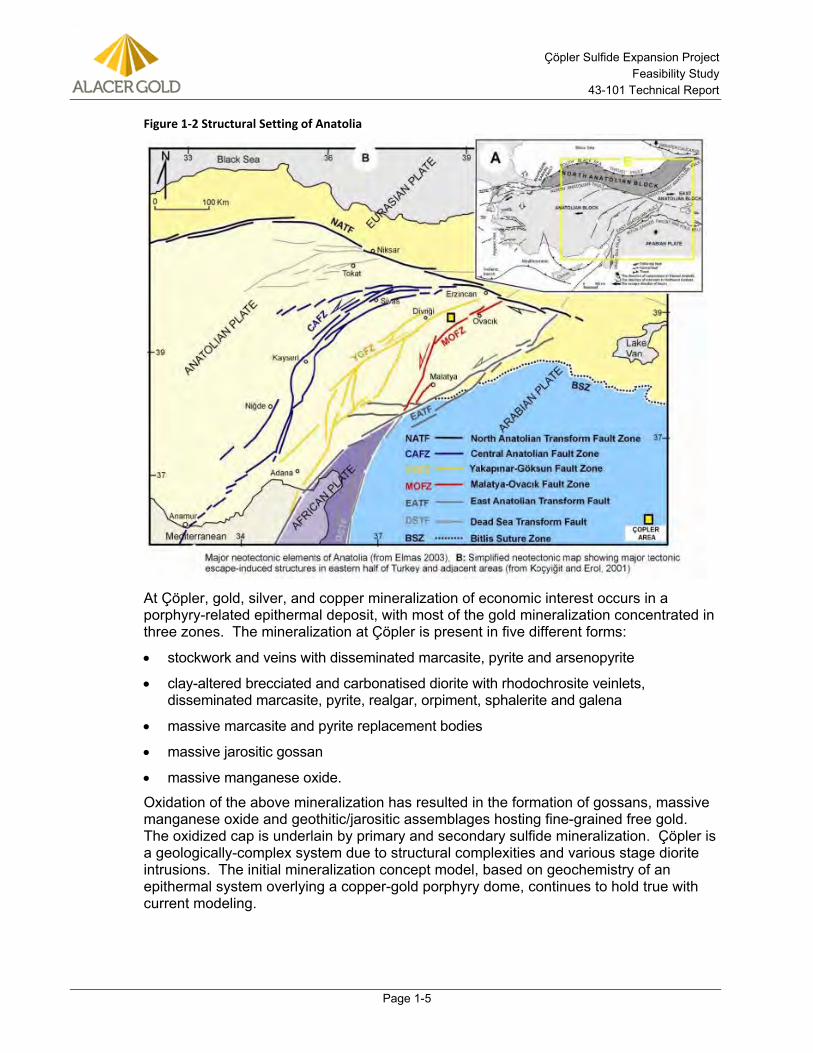
Çöpler Sulfide Expansion Project Feasibility Study
43-101 Technical Report
Page 1-5
Figure 1-2 Structural Setting of Anatolia
At Çöpler, gold, silver, and copper mineralization of economic interest occurs in a porphyry-related epithermal deposit, with most of the gold mineralization concentrated in three zones. The mineralization at Çöpler is present in five different forms:
• stockwork and veins with disseminated marcasite, pyrite and arsenopyrite
• clay-altered brecciated and carbonatised diorite with rhodochrosite veinlets, disseminated marcasite, pyrite, realgar, orpiment, sphalerite and galena
• massive marcasite and pyrite replacement bodies
• massive jarositic gossan
• massive manganese oxide.
Oxidation of the above mineralization has resulted in the formation of gossans, massive manganese oxide and geothitic/jarositic assemblages hosting fine-grained free gold. The oxidized cap is underlain by primary and secondary sulfide mineralization. Çöpler is a geologically-complex system due to structural complexities and various stage diorite intrusions. The initial mineralization concept model, based on geochemistry of an epithermal system overlying a copper-gold porphyry dome, continues to hold true with current modeling.
Çöpler Sulfide Expansion Project Feasibility Study
43-101 Technical Report
Page 1-6
1.9 Exploration The primary exploration effort at Çöpler was completed by:
• Anatolia during 1998 and 1999 prior to entering into a joint venture with Rio Tinto
• A joint venture between Anatolia and Rio Tinto from 2000 to 2004
• Anatolia from 2004 to 2010, and
• Alacer from Feb 2011 to date
Initial exploration at Çöpler was directed at evaluating the economic potential for recovering gold by either heap leaching or conventional milling technics from near-surface oxide mineralization.
A drilling program specifically designed to investigate the sulfides was commenced late in 2009 and completed early in 2010. Infill resource drilling has continued at Çöpler in an attempt to define extensions to the current resource and collect additional information within the current resource boundary. Drill testing continues to date in order to better define both the oxide and sulfide portions of the deposit. In 2013, drilling occurred primarily in the western and northern portions of the Çöpler deposit.
Surficial mapping and geochemical soil sampling has continued in the district over the life of the project.
1.10 Drilling A significant amount of drilling has been undertaken at the project in order to locate, test and define the mineralization and its extents. Over 1,000 reverse circulation (RC) drill holes and over 650 diamond core holes (DD) have provided more than 280 km of drill sample.
The current drill hole spacing at surface is a nominal 50 m by 50 m; however infill drilling to 25 m by 25 m has been undertaken in some locations.
1.11 Sampling Method, Approach and Analyses From 2004 to late 2012, samples were prepared at ALS Chemex İzmir, Turkey and analyzed at ALS Chemex Vancouver, Canada. From late 2012 to present, samples were prepared and analyzed at ALS Chemex İzmir, Turkey.
ALS Chemex İzmir has ISO 9001:2008 certification and ALS Chemex Vancouver is ISO/IEC 17025:2005 accredited for precious and base metal assay methods.
ALS Chemex is a specialist analytical testing services company which is independent of Alacer.
The samples are analyzed for gold using the ALS Chemex method Au-AA25 which comprises a fire assay of a 30g pulp sample followed by measurement of gold grades Atomic Absorption Spectroscopy (AAS). The lower and upper gold detection limits are 0.01 g/t and 100 g/t respectively. Samples with returned gold grades above the upper detection limit are re-analyzed using the gravimetric method Au-GRA21.
Analysis of 33 other elements is accomplished through the ALS method ME-ICP61 which involves a four acid (perchloric, nitric, hydrofluoric and hydrochloric acid) sample digest followed by measurement of element grades by Inductively Coupled Plasma –
Çöpler Sulfide Expansion Project Feasibility Study
43-101 Technical Report
Page 1-7
Atomic Emission Spectroscopy (ICP-AES). Silver, copper, lead, zinc and manganese are among the 33 elements analyzed by this method.
1.12 Data Verification AMEC reviewed the Çöpler deposit database in order to verify that the data are of sufficient quality to support Mineral Resource estimation for the Çöpler deposit. AMEC chose to limit the audit to the 1,479 holes defined as being within Mineral Resource model area. Data from drill holes outside this area were not used in the resource estimation. AMEC randomly selected 5% of the drill holes inside the Mineral Resource model area and requested scans of the drill logs for audit purposes. Original drill logs for many of the early holes had not been retained. The data from these logs were entered into the Alacer database prior to the logs being lost. Alacer was able to provide scans of geology logs for 593 out of 1,479 drill holes.
AMEC compared scans of available original drill logs (lithology, RQD and bulk density) to values contained in the database. Assay results from early drill holes (2000 to 2003) assayed by OMAC Laboratories Limited were unable to be verified. Assay results from 2004 to 2013 were provided by ALS and were compared to the database. As well, AMEC evaluated the available QAQC data to ensure the assay data were suitable to support Mineral Resource estimation.
Collar Surveys 1.12.1AMEC could not verify the collar location data. Alacer has not retained the original collar survey documentation provided by the mine site survey department. Physical collar locations for all drill holes could not be confirmed, with 615 drill hole collars having been removed by active mining. During the May 2014 site visit, AMEC recorded the location of 38 drill hole collar monuments or best indicator of where the hole was drilled in the field. Although 37 of the holes were located less than 5 m from their positions recorded in the Alacer database, one hole, CRC490, differed by 13 m. Alacer site staff has been urged to revisit the locations of these holes to resolve the variance.
Downhole Surveys 1.12.2AMEC could not verify the downhole survey data. The original downhole survey documentation had not been retained by Alacer.
AMEC was able to measure the approximate azimuth and dip of 29 of the 38 drill hole when the casing could be located in the field. In general the azimuths matched, but the dip of one hole, CRC490, was found to be significantly different than was stated in the database. Alacer site staff has been urged to resolve these differences.
AMEC recommends that Alacer initiate a procedure to retain the down-hole survey data as they are collected. This information should be reviewed by the responsible geologist, then signed and dated and added to the drill hole folder.
AMEC also recommends Alacer apply the present magnetic declination correction of 5.6°E rather than the 3.0°E correction currently being applied at site. AMEC notes the declination correction has varied from 4.5°E in 2000 to 5.6°E in 2014). The correction applied should be based on the year the data were collected.
Çöpler Sulfide Expansion Project Feasibility Study
43-101 Technical Report
Page 1-8
Geology Logs, Density Logs, RQD Logs 1.12.3AMEC requested scanned copies of 58 original geology logs selected from the drill database. Three of the 58 logs were available for comparison. The remaining logs were not located. AMEC did not discover any material issues when auditing the available logs compared to the database. The geology model was constructed based on digital data obtained from the original logs.
AMEC recommends Alacer attempt to locate original logs for the missing holes. For current and future holes, AMEC recommends the Alacer Senior Geologist review, sign and date the final log.
Twenty-two density logs were requested by AMEC, with 11 logs located. AMEC did not discover any material issues when auditing the density portion of the database. AMEC recommends the Alacer Senior Geologist reviews, signs and dates the final density logs.
During the site visit, AMEC conducted a review of the Alacer procedure used to determine the density values and did not note any material issues.
Twenty-four RQD logs were requested, with 14 logs provided. AMEC did not discover any material issues when auditing the RQD data. AMEC recommends the Alacer Senior Geologist reviews, signs and dates the final RQD and recovery log sheets.
Assay Data – 2000 to 2003 1.12.4Laboratory certificates for drilling prior to the year 2004 were not available. Rio Tinto operated the drilling program, and samples were submitted to the OMAC laboratory in Ireland. ALS assumed ownership of the OMAC laboratory in 2011. Effort is underway to obtain laboratory certificates from ALS at the time of this report.
AMEC used statistical methods to validate these data against the ALS data and found the gold assay results to be comparable.
Assay Data –2004 to 2013 1.12.5AMEC reviewed assay results for gold, silver, copper, arsenic, iron, manganese, sulphur and zinc. The review identified differences between the ALS data and the assay data stored in the Alacer database. AMEC has provided a complete list of these differences to Alacer for review. Sample intervals and percent vary by element. Numbers and percentages are shown in Section 12.5. These should be corrected and the corrections verified prior to future Mineral Resource estimates.
AMEC Witness Samples 1.12.6AMEC collected 10 witness samples obtained from blast hole cuttings which were submitted to both the Çöpler site laboratory and to ALS. The mean of ALS results is 8% higher than the mean of the results provided by the Çöpler site laboratory. If the result from one high-grade sample (above 4 g/t gold) is removed from the comparison, the mean ALS gold grade is only 3% higher than the mine site laboratory. In AMEC’s opinion this is acceptable agreement between the two laboratories.
Çöpler Sulfide Expansion Project Feasibility Study
43-101 Technical Report
Page 1-9
Quality Assurance and Quality Control Results 1.12.7 Screen Test Results 1.12.7.1
AMEC reviewed data from ALS crusher and pulveriser screen tests from 2011 to 2013. Only 8 out of 1,724 crusher screen test results failed to meet the specification of 70% passing 2mm. A total of 443 (11%) of the 3,945 pulveriser screen test results failed to meet the specification of 85% passing 75µm.
AMEC recommends increased diligence by ALS to ensure the quoted pulverization specifications are met.
Certified Reference Material (CRM) Results 1.12.7.2AMEC reviewed the gold results from CRMs, with over 50 results reviewed for the period 2007 to 2013. There are results where the CRM has been mislabeled, affecting the calculated bias. This indicates the QAQC results are not being reviewed in a timely manner. For a QAQC program to be effective, it is important that the results are reviewed in real time, and that corrective action is taken where warranted.
AMEC noted the overall relative bias for the CRMs is within 5% and considers that the assay accuracy is sufficient for Mineral Resource estimation. A 2004 Rio Tinto report states the CRM results from the samples submitted to OMAC Laboratories indicates that acceptable accuracy was achieved by OMAC: for 632 out of 651 gold standards and blanks used, gold analyses for 97% fell within the + 2SD accepted range.
Blanks 1.12.7.3AMEC reviewed the results from 2,437 blank samples blindly inserted into drill sample submissions. Although the results indicate that there is likely some carry-over contamination of gold, the amount of contamination is not sufficiently high to materially affect project assay results; hence AMEC concludes there is no significant risk to the Mineral Resource estimate. Rio Tinto did not note any issues with sample contamination at OMAC Laboratories.
Core Duplicate Samples 1.12.7.4AMEC used an oxide cut-off grade of 0.30 g/t gold for assessing the precision of the gold assays. The absolute value of relative differences for the core duplicates (2009 to 2013) is 55% for gold at the 90th percentile of the cumulative distribution. This measure of the relative precision for gold is below the sought level of 30%. In AMEC’s experience, gold assays often do not meet this threshold. Improved grinding may help to increase the precision obtained for gold assays. AMEC used 0.10% sulfur (ten times the sulfur detection limit) to assess the precision for sulfur assays. The AVRD for sulfur is 30%.
Duplicate samples collected by Rio Tinto between 2000 and 2003 and submitted to OMAC Laboratories were described in a report by Rio Tinto. Rio Tinto submitted both coarse reject and pulp reject duplicate samples. They noted an issue possibly due to coarse gold in the coarse rejects. The pulp reject duplicates showed excellent agreement.
AMEC requested but did not receive any duplicate results for the period between 2004 and 2009.
Çöpler Sulfide Expansion Project Feasibility Study
43-101 Technical Report
Page 1-10
Check Assay Results 1.12.7.5Rio Tinto submitted a total of 403 samples of re-prepared coarse reject material and 203 samples of fine reject material for check gold (± copper and silver) assays at OMAC, ALS and Bondar Clegg. AMEC did not receive the data for these samples, but Rio Tinto reported there is excellent agreement between inter-laboratory analyses for OMAC, ALS and Bondar Clegg.
It does not appear check samples were submitted from 2005 to 2009 or from 2011 to present.
There were 308 samples (3.5%) selected from the 2009 and 2010 drill program which were submitted to ACME Laboratories for analysis. AMEC did not receive the check assay results, but a report written by Georgi Magaranov, dated 06 April, 2010, states the gold assays from ALS are biased 6% high compared to ACME for the RC holes. Gold assays from ALS are biased 8% higher than ACME for the core drill holes. AMEC accepts a 5% difference between assay laboratories; these results are very close to this value.
In AMEC’s opinion, the data contained in the Alacer database is of sufficient quality to support Mineral Resource estimation.
1.13 Metallurgical Testwork Historical Testwork 1.13.1Historical testing for Alacer (at the time of testing, Anatolia Minerals Development Ltd.) was conducted on samples from the sulfide resource in several phases. Resource Development Inc. (RDI) performed several sulfide processing scoping level investigations from 2006 to 2009. A two-phase program on sulfide resource samples was conducted at SGS Lakefield Research Limited (SGS) in 2009 and 2010 to support a Pre-Feasibility study completed by Samuel Engineering (Samuel, 2011). A QEMSCAN mineralogy study on six oxide and three sulfide resource samples were performed by AMMTEC in December 2008.
The historical work completed at both RDI and SGS concentrated on evaluating sulfide processing options including direct cyanidation, flotation, cyanidation of flotation concentrates, pressure oxidation (POX) coupled with cyanidation and roasting coupled with cyanidation. The evaluation of the historical data in the Pre-Feasibility Study resulted in the choice of pressure oxidation coupled with cyanidation as the process to further evaluate with testing and a Feasibility Study.
Initial metallurgical testwork carried out by Resource Development Inc. (RDI) in Denver, Colorado had testwork results that indicated that 11% to 30% of the gold content in the Çöpler sulfide resource, as demonstrated by diagnostic leaching, may be amenable to whole cyanidation. 60% to 80% of the gold content was associated with sulfide minerals and would require some type of oxidation step to liberate the gold for cyanidation.
Pre-treatment using POX was the most effective treatment per the RDI scoping studies and displayed the potential to achieve greater than 90% gold extractions. Flotation tests indicated that gold could be recovered by flotation but the concentrates were low grade with relatively high mass pulls and relatively low
Çöpler Sulfide Expansion Project Feasibility Study
43-101 Technical Report
Page 1-11
gold recovery. Testwork found flotation concentrates and tailings did not leach well using cyanide, even after being finely ground.
The scoping test program on the samples by SGS Canada (SGS) in 2009 was used to evaluate the findings of RDI and to develop the metallurgical flowsheet. Results from the flotation testwork were consistent with the RDI tests, demonstrating that it was not feasible to make either a saleable copper concentrate or saleable sulfide concentrate.
Test results also demonstrated the Çöpler sulfide resource was refractory to cyanidation without a pre-treatment oxidation step. Pressure oxidation was able to oxidize 90% to 99% of the sulfide content and provide gold extractions consistently in the range of 90% to 96%. Roasting was able to oxidize the contained sulfide minerals; however, gold was not fully liberated for cyanidation, yielding gold cyanidation extractions around 79%.
In 2010, a second phase of metallurgical testing was completed by SGS to support a Pre-Feasibility Study with the process focused on pressure oxidation followed by cyanidation. The main conclusions of the 2010 SGS test program were that pressure oxidation followed by cyanidation of POX residues continued to achieve superior gold extractions as compared to alternative treatment options. The alternative treatment options included ultra-fine grinding followed by direct cyanidation of sulfide resource material and Albion oxidation followed by cyanidation.
SGS demonstrated that the SO2/Air cyanide destruction process could be used following cyanidation of POX residues. Several batch tests indicated that the POX pregnant solution could be neutralized with limestone followed by copper precipitation using NaHS. This is consistent with previous testwork.
Mineralogy 1.13.2In December of 2008, Alacer had QEMSCAN PMS, TMS, and EDS mineralogy analyses performed on three sulfide resource samples by AMMTEC Ltd. Analyses were performed on samples of Diorite, Metasediments (MTS), and Massive Pyrite rock types.
The findings from the 2008 QEMSCAN analyses indicated that the gangue mineralization in the sulfide resource is composed mainly of quartz, micas/clays and feldspars of approximately 30.6%, 26.9%, and 20.8%, respectively. The sulfide mineralization consists of pyrite, arsenopyrite, chalcopyrite and sphalerite.
A gold deportment study was performed by AMTEL Ltd. on a sample of sulfide composite MC4 and concluded the gold is primarily carried by sulfide minerals with the overwhelming majority of the gold present in a submicroscopic form. Arsenopyrite is the principal carrier of submicroscopic gold followed by pyrite of secondary importance. Gold mineral grains are a secondary form of gold in the sample with the gold being carried by grains of less than 5 µm in size and would be difficult to recover by flotation. Direct cyanidation at P80 of 90 µm, extracted only 17% of the gold. An additional 10% of the gold was extracted using ultra-fine grinding (P80 of 5 µm) and cyanidation. AMTEL indicated that the gold deportment dictates either whole pre-oxidation or flotation
Çöpler Sulfide Expansion Project Feasibility Study
43-101 Technical Report
Page 1-12
Flowsheet Determination Testwork 1.13.3A preliminary process flowsheet for treating the Çöpler sulfide resource (pressure oxidation circuit, followed by a copper and gold recovery circuit) was proposed as part of the project Pre-Feasibility Study. The flowsheet was based primarily on design criteria developed from the metallurgical testing completed at SGS in 2009 and 2010.
Alacer developed and implemented a metallurgical test program with Hazen Research Inc. (Hazen) in early 2012 to support a Feasibility Study. Alacer personnel identified and shipped samples representing the Çöpler sulfide resource rock types to Hazen in Golden, Colorado. Sample preparation and the majority of testwork were performed by Hazen focusing on determining the operating conditions for a POX circuit and supporting treatment processes. Hazen completed multiple batch testwork campaigns and multiple pilot plant campaigns. The phases are denoted as Campaigns 1 through 4. Additional testwork was performed by other firms supporting the test program at Hazen. The first objective of campaigns 1 through 4 metallurgical test programs was to develop a feasible pressure oxidation process for the Çöpler Sulfide resource coupled with conventional cyanidation of pressure oxidation residues for the recovery of gold and copper values. The second objective was to develop metallurgical data to support completion of a Feasibility Study. This included developing the data to demonstrate on a continuous basis from pilot plant operation that the pressure oxidation process would successfully treat the Çöpler sulfide resource to recover metal values.
The four test campaigns were also designed to determine the metallurgical response variability of the Çöpler sulfide resource to the selected operating parameters using a number of sulfide resource samples representing the depth and breadth of the resource. The tests were also designed to develop data to project metal recoveries, process reagent requirements, and to support process equipment sizing and selection.
The following were completed and are summarized in detail in Section 13.0: • Head Characterization of Campaigns 1 through 4 and VSP1 and VSP2
• Comminution Testing
• Direct Cyanidation
• POX Testing
• Hot Cure Testing
• Iron Arsenic Precipitation
• Metal Sulfide Precipitation (MSP) (for copper recovery)
• Solid-Liquid Separation
• Tailings Filtration
• Bulk Cyanidation and Carbon Kinetics
• Cyanide Destruction and Environmental Testing
• Sulfide Feed Stock Variability Testing
Çöpler Sulfide Expansion Project Feasibility Study
43-101 Technical Report
Page 1-13
• Flotation Testing
The testwork confirmed and was consistent with historical testwork, demonstrating that Pressure Oxidation followed by residue cyanidation is the best processing option for the Çöpler sulfide resource as compared to the other options tested.
1.14 Mineral Resource Estimates The Mineral Resource model was constructed by Gordon Seibel, SME Registered Member, AMEC’s Principal Geologist and Loren Ligocki, Alacer’s Senior Resource Geologist and full-time employee of Alacer. The Mineral Resource estimates were reviewed by Dr. Harry Parker, SME Registered Member, Consulting Mining Geologist and Geostatistician for AMEC. Gordon Seibel and Dr. Harry Parker are the Qualified Persons for the Mineral Resource estimate.
The estimation method was designed to address the variable nature of the epithermal structural and disseminated styles of gold mineralization while honoring the bi-modal distribution of the sulfur mineralization that is critical for mine planning. Since no obvious correlations were observed between gold (Au) and sulfur (S), Au and S were domained and estimated separately. Gold showed little correlation with lithology, and was domained by mining areas (Manganese, Main and Marble) to reflect the different trends of the mineralization that commonly follow structures and/or the lithological contacts. Due to the strong correlation between S and lithology, S was domained by lithology. However, since each lithology may contain <2% S and ≥ 2% S material (criteria used to classify the material as “oxide” for the heap leach and “sulfide” material being stockpiled for the proposed POX plant), each lithology was additionally separated into < 2% S and ≥ 2% S sub-domains.
Probability assigned constrained kriging (PACK) was used to estimate the Au mineralization. Probabilistic envelopes were first generated to define the limits of the economic mineralization. The envelopes were then used in the estimation to prevent the potentially economic assays being “smeared” into non-economic zones, and conversely to restrict waste assays from diluting the potentially economic mineralization. Two Au PACK models were constructed. The first (low-grade) model used a 0.3 Au g/t indicator threshold that was later applied to ≤ 2% S material, and the second (high-grade) model used a 1.0 Au g/t threshold that was later applied to ≥ 2% S material.
Each Au model was reconciled to past production using a cut-off grade of 0.3 Au g/t for the < 2% S material, and 1.0 Au g/t for the ≥ 2% S material. Geology, exploratory data analysis (EDA), composite /model grade comparisons, and other checks were performed to adjust the parameters used to construct the models. Mineral Resource categories were assigned to each block based on drill hole density and data quality.
Mineral Resources were assessed for reasonable prospects for eventual economic extraction by reporting only material that fell within a Lerchs-Grossmann conceptual pit shell using metal prices of $1500/oz for gold, $24.75/oz for silver, and $3.45/lb for copper, and the key parameters are summarized in Table 1-2. A conceptual production rate of 10,000 tonne per day was used. Mineral Resources are reported inclusive of Mineral Reserves, and have been tabulated by resource classification and oxidation state in Table 1-3.
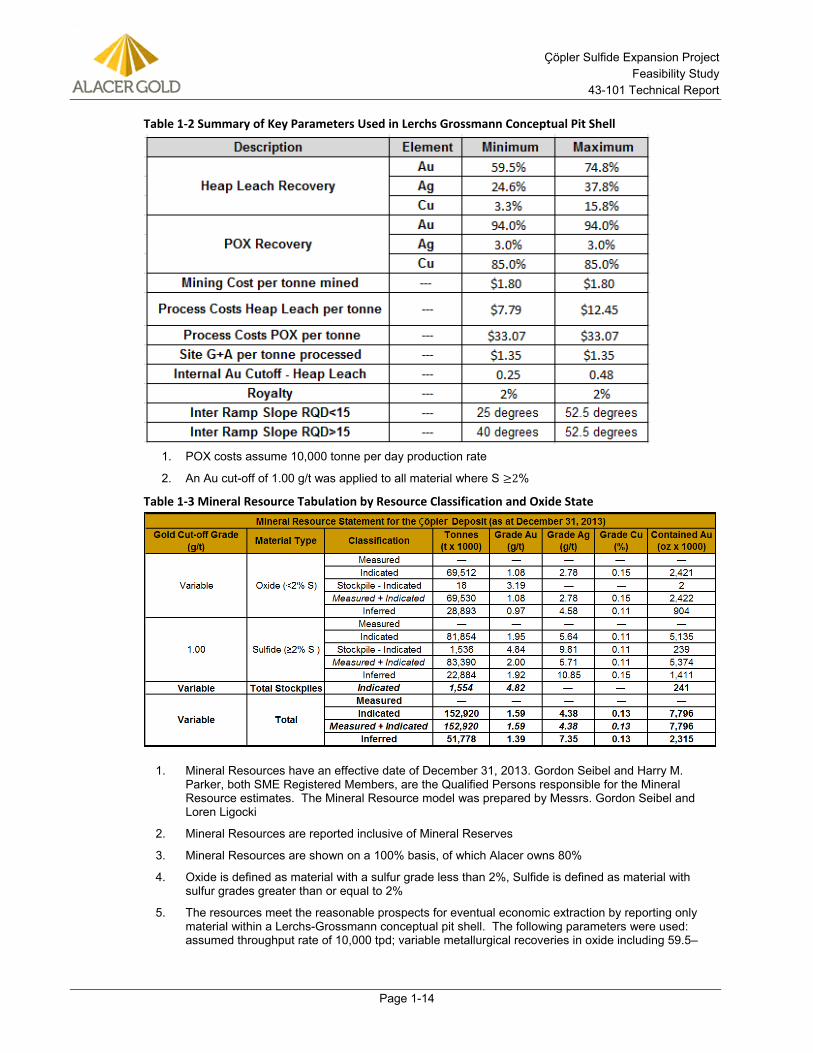
Çöpler Sulfide Expansion Project Feasibility Study
43-101 Technical Report
Page 1-14
Table 1-2 Summary of Key Parameters Used in Lerchs Grossmann Conceptual Pit Shell
POX costs assume 10,000 tonne per day production rate 1.
An Au cut-off of 1.00 g/t was applied to all material where S ≥2% 2.
Table 1-3 Mineral Resource Tabulation by Resource Classification and Oxide State
Mineral Resources have an effective date of December 31, 2013. Gordon Seibel and Harry M. 1.Parker, both SME Registered Members, are the Qualified Persons responsible for the Mineral Resource estimates. The Mineral Resource model was prepared by Messrs. Gordon Seibel and Loren Ligocki
Mineral Resources are reported inclusive of Mineral Reserves 2.
Mineral Resources are shown on a 100% basis, of which Alacer owns 80% 3.
Oxide is defined as material with a sulfur grade less than 2%, Sulfide is defined as material with 4.sulfur grades greater than or equal to 2%
The resources meet the reasonable prospects for eventual economic extraction by reporting only 5.material within a Lerchs-Grossmann conceptual pit shell. The following parameters were used: assumed throughput rate of 10,000 tpd; variable metallurgical recoveries in oxide including 59.5–
Çöpler Sulfide Expansion Project Feasibility Study
43-101 Technical Report
Page 1-15
74.8% for Au, 24.6–37.8% for Ag, 3.3–15.8% for Cu; metallurgical recoveries in sulfide including 94% for Au, 3% for Ag and 85% for Cu; mining cost of $1.80/t; process cost of $7.79–$12.45/t leached and $33.07/t through the POX; general and administrative charges of $1.35/t; 2% royalty payable; inter-ramp slope angles that vary from 25–52.5º.
Reported Mineral Resources contain no allowances for unplanned dilution, or mining recovery. 6.
Tonnage and grade measurements are in metric units. Contained gold is reported in troy ounces 7.
Tonnages are rounded to the nearest thousand tonnes; grades are rounded to two decimal places 8.
Rounding as required by reporting guidelines may result in apparent summation differences between 9.tonnes, grade and contained metal content
Mineral Resources that are not Mineral Reserves do not have demonstrated economic viability. 10.
1.15 Mineral Reserve Estimates Alacer currently operates a heap leach operation at the Ҫӧpler mine with a production rate of approximately 6.2 MM tonnes of oxide ore per annum with an average LOM grade of 1.3 g/t. Current heap leach operations are expected to continue through 2017. A large sulfide resource exists below the known oxide Mineral Reserve at Ҫӧpler and a Feasibility Study has been developed to recognize the potential that exists for the development of a sulfide processing facility and the mining operations necessary to deliver the sulfide ore to the mill. All mining at Çöpler is undertaken by conventional open pit mining techniques. At present, all mining activities related to the extraction of material from the pits is being conducted by a contractor, retained by Alacer. It is anticipated that this method of operation will continue throughout the entire life of the operation.
Through the process of pit optimization and restrictions on heap leach capacity and tailings disposal capacity, the Çöpler pit design and 2014 budget delineates 26.2 MM tonnes of oxide ore and 31.7 MM tonnes of sulfide ore. The total tonnage defined from the beginning of 2014 is 230 MM tonnes with a strip ratio of 3.08 (Waste/Ore). The pit design includes phases that define oxide ore to be targeted while the POX plant construction is ongoing followed by sulfide phases targeting high grade material where possible. The final pit is spread out over 2.7km from west to east, 1.1km from north to south with a maximum depth of around 230m.
For the Çöpler mine production schedule, the Vulcan Chronos scheduling tool was used to schedule the extraction of ore from the mine, within the constraints of filling the mill, filling the heap leach pad, and keeping the waste stripping as balanced as possible. The first scheduling period was started as of January 1, 2014 and for the first 12 months duplicated the 2014 budget mine schedule accepted for operations. During the first four years (2014 – 2017), all sulfide ore is shipped to one of three sulfide ore stockpiles. The three sulfide ore stockpiles will be used for Low-Grade (1.5 – 2.3 g/t Au), Medium-Grade (2.3 – 3.1 g/t Au), and High-Grade (3.1 g/t Au and higher) sulfide ore. The mill is scheduled to be in production through 2034 when it will exhaust the remainder of the low-grade sulfide ore contained in stockpile. Mining activities will cease to operate in 2026.
An updated resource block model completed by AMEC and Alacer in April 2014 was used as the basis for detailed economic pit optimization using GEMCOM’s Whittle Version 4.4.1 pit optimization software. This software, in conjunction with economic, metallurgical, and geotechnical criteria, was used to develop a series of economic pit
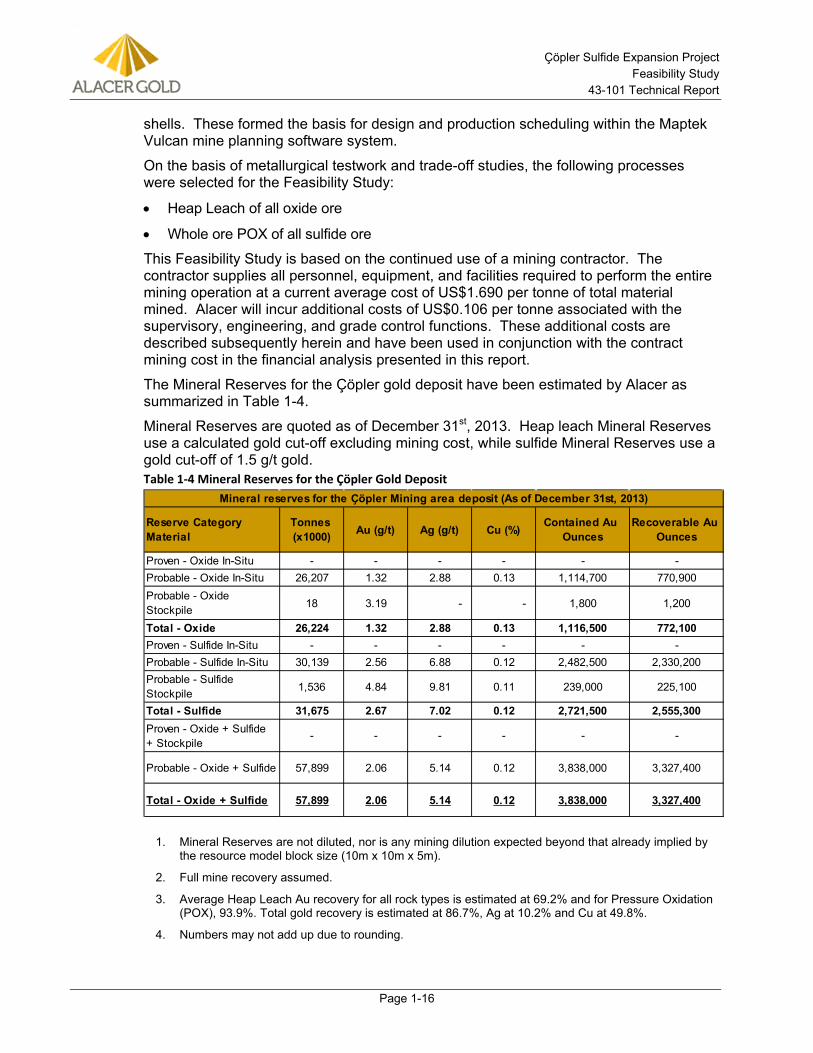
Çöpler Sulfide Expansion Project Feasibility Study
43-101 Technical Report
Page 1-16
shells. These formed the basis for design and production scheduling within the Maptek Vulcan mine planning software system.
On the basis of metallurgical testwork and trade-off studies, the following processes were selected for the Feasibility Study:
• Heap Leach of all oxide ore
• Whole ore POX of all sulfide ore
This Feasibility Study is based on the continued use of a mining contractor. The contractor supplies all personnel, equipment, and facilities required to perform the entire mining operation at a current average cost of US$1.690 per tonne of total material mined. Alacer will incur additional costs of US$0.106 per tonne associated with the supervisory, engineering, and grade control functions. These additional costs are described subsequently herein and have been used in conjunction with the contract mining cost in the financial analysis presented in this report.
The Mineral Reserves for the Çöpler gold deposit have been estimated by Alacer as summarized in Table 1-4.
Mineral Reserves are quoted as of December 31st, 2013. Heap leach Mineral Reserves use a calculated gold cut-off excluding mining cost, while sulfide Mineral Reserves use a gold cut-off of 1.5 g/t gold. Table 1-4 Mineral Reserves for the Çöpler Gold Deposit
Mineral Reserves are not diluted, nor is any mining dilution expected beyond that already implied by 1.the resource model block size (10m x 10m x 5m).
Full mine recovery assumed. 2.
Average Heap Leach Au recovery for all rock types is estimated at 69.2% and for Pressure Oxidation 3.(POX), 93.9%. Total gold recovery is estimated at 86.7%, Ag at 10.2% and Cu at 49.8%.
Numbers may not add up due to rounding. 4.
Reserve Category Material
Tonnes (x1000) Au (g/t) Ag (g/t) Cu (%) Contained Au
OuncesRecoverable Au
Ounces
Proven - Oxide In-Situ - - - - - - Probable - Oxide In-Situ 26,207 1.32 2.88 0.13 1,114,700 770,900Probable - Oxide Stockpile 18 3.19 - - 1,800 1,200
Total - Oxide 26,224 1.32 2.88 0.13 1,116,500 772,100Proven - Sulfide In-Situ - - - - - - Probable - Sulfide In-Situ 30,139 2.56 6.88 0.12 2,482,500 2,330,200Probable - Sulfide Stockpile 1,536 4.84 9.81 0.11 239,000 225,100
Total - Sulfide 31,675 2.67 7.02 0.12 2,721,500 2,555,300Proven - Oxide + Sulfide + Stockpile
- - - - - -
Probable - Oxide + Sulfide 57,899 2.06 5.14 0.12 3,838,000 3,327,400
Total - Oxide + Sulfide 57,899 2.06 5.14 0.12 3,838,000 3,327,400
Mineral reserves for the Ҫӧpler Mining area deposit (As of December 31st, 2013)
Çöpler Sulfide Expansion Project Feasibility Study
43-101 Technical Report
Page 1-17
The Mineral Reserves are based on end of year topography for 2013 and include budgetary 5.production estimates for 2014. The Mineral Reserves were calculated in May 2014, with an effective date of December 31, 2014.
A calculated gold internal cut-off grade was applied to Oxide Heap Leach Mineral Reserves using the 6.equation: Xc = Po / (r * (V-R)) where Xc = Cut-off Grade (g/t), Po = Processing Cost of Ore (USD/tonne of ore), r = Recovery, V = Gold Sell Price (USD/gram), Refining Costs (USD/gram). A gold cut-off grade of 1.5 g/t was used for Sulfide Pressure Oxidation Ore.
Mineral Reserves are based on US$ 1,300/Oz Au Gold Price. 7.
The Mineral Reserves were estimated by Stephen Statham, PE (Colorado License #PE.0048263) of 8.Alacer. Bret C Swanson, BE (Min) MMSAQP #04418QP of SRK, a Qualified Person as defined in NI 43-101, reviewed the reserve calculations.
CIM Standards on Mineral Resources and Mineral Reserves define Proven Mineral Reserve as “the economically mineable part of a Measured Mineral Resource” and Probable Mineral Reserve as “the economically mineable part of an Indicated Mineral Resource, and in some circumstances a Measured Mineral Resource. These criteria have been applied to the Mineral Reserve estimate reported in Table 1-4.
The Mineral Reserves disclosure presented in Table 1-4 were estimated by Stephen Statham, PE (Colorado License #PE.0048263), Senior Project Mining Engineer, who is a full-time employee of Alacer. Bret Swanson, BE (Min) MMSAQP #04418QP of SRK USA, a Qualified Person as defined in NI 43-101, reviewed and consulted during reserve calculations.
The mine plan developed in this report is based on Proven and Probable Mineral Reserves only. There is opportunity to upgrade at least some of the inferred resource mineralization to the measured or indicated classification with additional infill drilling.
A significant Mineral Reserve exists within the confines of the designed open pit presented within this report. The design is well suited for open-pit mining operations by conventional mining equipment by an outside contractor. With the use of extensive ore stockpiling during the 47 months prior to the POX mill being commissioned, it is possible to obtain very high average POX mill feed grades near 5.0 g/t Au during the first 18 months of POX operations, and 4.0 g/t Au during the next 18 months. The production schedule is readily achievable and the mining operation will continue in the same manner as the existing oxide production at the Çöpler mine site.
1.16 Mining Methods All mining at Çöpler will be undertaken by conventional open pit mining techniques. At present, all mining activities related to the extraction of material from the pits is being conducted by a contractor, retained by Alacer. It is planned that this method of operation will continue throughout the entire life of the operation.
1.17 Process Plants The Çöpler Sulfide Expansion Project is designed to nominally treat 5,000 metric tonnes per day of feed from the Çöpler sulfide resource from which gold-silver doré and a copper sulfide concentrate will be produced. The mill is designed based on an 85% availability with an average life-of-mine head grade of 2.67 g/t Au and a design grade of 5 g/t Au. These projections include periods of higher-grade feed in the initial years of mining.
Life-of-Mine average metal recoveries are projected as follows:
Çöpler Sulfide Expansion Project Feasibility Study
43-101 Technical Report
Page 1-18
• Gold Recovery – 93.9%
• Silver Recovery – 2.4%
• Copper Recovery – 88.4%
Run-of-Mine (ROM) sulfide process feed stock will be transported from the four mine pits by haul trucks to the sulfide process stockpile. Sulfide process feed stock will be deposited in specified areas in the process stockpile according to sulfide feed blending parameters. The POX circuit has been designed to run within a specific range of feed parameters. In order to feed the pressure oxidation system a consistent blend meeting these parameters, front-end loaders will be used to deliver sulfide process feed stock from the various areas of the stockpile according to blending parameters.
A sizer-type crusher has been selected as the primary crusher to directly feed the SAG mill, due to the high clay content of the Çöpler Sulfide resource.
A SAG-Ball mill circuit was chosen for the grinding system. The grinding circuit product from the cyclone cluster overflow is thickened in the grinding circuit thickener. The thickener underflow slurry is pumped to the acidulation feed tanks.
Slurry is pumped from the acidulation feed tanks to the acidulation tanks and is acidulated using recycled acid from the decant thickener overflow, supplemented with fresh sulfuric acid, if required. The acidulated slurry is pumped to the POX feed thickener with most of the thickener overflow pumped to the decant thickener. Excess thickener overflow is bled to the iron/arsenic precipitation tank as needed. The thickened acidulated POX feed slurry is pumped to the POX feed surge tank to decouple the thickener system from the autoclaving system.
Thickened acidulated slurry is pumped from the POX feed surge tank to the low temperature splash tank for initial heating of slurry. The low temperature splash tank heats the slurry using steam generated in the low temperature flash tank. The heated slurry from the low temperature splash tank is pumped to the high temperature splash tank for additional heating using steam from the high temperature flash tank. The heated slurry is pumped from the high temperature splash tank to the autoclaves at the required POX system operating pressure.
The autoclave circuit will incorporate a train of seven (7) vertical autoclave vessels with the first three arranged in parallel. The combined discharge from these three vessels then feeds four (4) vessels in series. This arrangement will mimic the operation of a multi-compartmented horizontal autoclave. Due to weight and size limitations and dimensional restrictions of the Turkish roads, it is not feasible to transport a large, heavy multi-compartment conventional horizontal autoclave vessel to the project site. The process has instead been designed to use multiple vertical autoclave vessels. These vertical vessels can be fabricated to meet size and weight transport limits, enabling transport to the site.
The slurry flows by gravity through the autoclave vessels. Treated slurry exits the last vertical vessel through the pressure letdown system consisting of a high pressure and a low pressure flash vessel.
The depressurized hot slurry will be combined with the POX feed thickener overflow and thickened in the decant thickener. The thickened slurry is pumped to the iron/arsenic precipitation system. Most of the thickener overflow is recycled to the acidulation circuit
Çöpler Sulfide Expansion Project Feasibility Study
43-101 Technical Report
Page 1-19
to minimize fresh acid addition. Excess thickener overflow is bled to the iron/arsenic precipitation tank as needed.
The iron/arsenic precipitation system consists of two agitated tanks in series. Limestone is added raising the slurry pH and to form a stable iron arsenate precipitate.
The treated slurry from the iron/arsenic precipitation system is pumped to the three-stage Counter Current Decantation (CCD) thickener system to remove copper from the slurry as a pregnant solution. This step is required to limit copper consumption of cyanide and to recover soluble copper as a saleable product. Washed slurry from CCD thickener #3 is pumped to the pre-leach tank, the first step of the cyanidation circuit. The copper pregnant solution from thickener #1 is pumped to the copper precipitation circuit.
Soluble copper in the CCD pregnant solution will be precipitated as copper sulfide by adding sodium hydrosulfide to the copper precipitation tanks. The overflow from the copper precipitation tanks flows by gravity to the copper precipitation thickener where flocculant is added to the slurry feed to promote settling. Thickener overflow flows to the copper precipitation water tank for recycle to the CCD thickener system. The majority of the thickened precipitate is recycled to the copper precipitation tanks. Thickened precipitate will also be pumped from the copper precipitation thickener to the copper precipitation filter feed tank by a separate pumping system. Slurry from the filter feed tank will be filtered on a batch basis in a plate and frame filter. Filtrate will be pumped to the copper precipitation water tank for recycle. The filter cake will drop into a concentrate storage bin. The concentrate can be shipped by truck and sold to a smelter. It should be noted that the copper precipitate is pyrophoric if the moisture content drops to a low level (below 8 to 10%). Provisions have been provided to maintain the precipitate moisture level while in storage. Instrumentation will also be provided to monitor for heat and combustion in the storage area.
The washed slurry from CCD thickener #3 feeds the pre-leach tank where lime is added raising the slurry pH to about 10.5 prior to feeding the three-stage cyanide leach tank system. Sodium cyanide is added in the leach tanks to solubilize gold and a small amount of silver in the solids in the feed slurry. The leached slurry feeds a six-stage carbon-in-pulp (CIP) system.
In the CIP tanks, the solubilized precious metals load onto carbon that is mixed with the leached slurry in each tank. Slurry flows continuously from tank to tank through carbon screens which retain the carbon in each tank. Loaded carbon is removed from the first CIP tank and pumped to the new ADR plant.
A new ADR facility and refinery will be provided to strip loaded carbon producing a pregnant solution for feeding an electrowinning system. This system will be used to recover precious metals from pregnant electrowinning solution. The new ADR plant and refinery will be equipped with air emissions control equipment to scrub the gas being vented to meet Turkish air emission limits. Stripped carbon will be reactivated using a carbon kiln and reused in the CIP circuit.
CIP tailings will be processed in a cyanide destruction circuit utilizing SO2 /air treatment
technology. The system will reduce the slurry cyanide concentration to meet Turkish discharge regulations. The detoxified slurry is pumped to the tailings neutralization circuit.
The detoxified CIP tailings are combined with the copper precipitation solution bleed stream where milk-of-lime slurry is added to raise the pH to precipitate manganese and
Çöpler Sulfide Expansion Project Feasibility Study
43-101 Technical Report
Page 1-20
magnesium stabilizing the slurry in the neutralization tanks. The neutralized slurry flows to the tailings thickener. The thickener underflow is pumped to the tailings holding tank. The tailings are pumped from the holding tank through the tailings pipeline to the tailings storage facility. Tailings thickener overflow is pumped to the process water tank for reuse in the process.
A pumping system will be provided in the tailings storage facility to reclaim decanted water and return the water to the process water tank.
Reagent systems will be provided to mix and deliver the require reagents to the various addition point in the process.
Utility systems including compressed air, steam generators, and water distribution systems will be provided to service the process systems.
A schematic flowsheet of the process is presented in Figure 1-3.
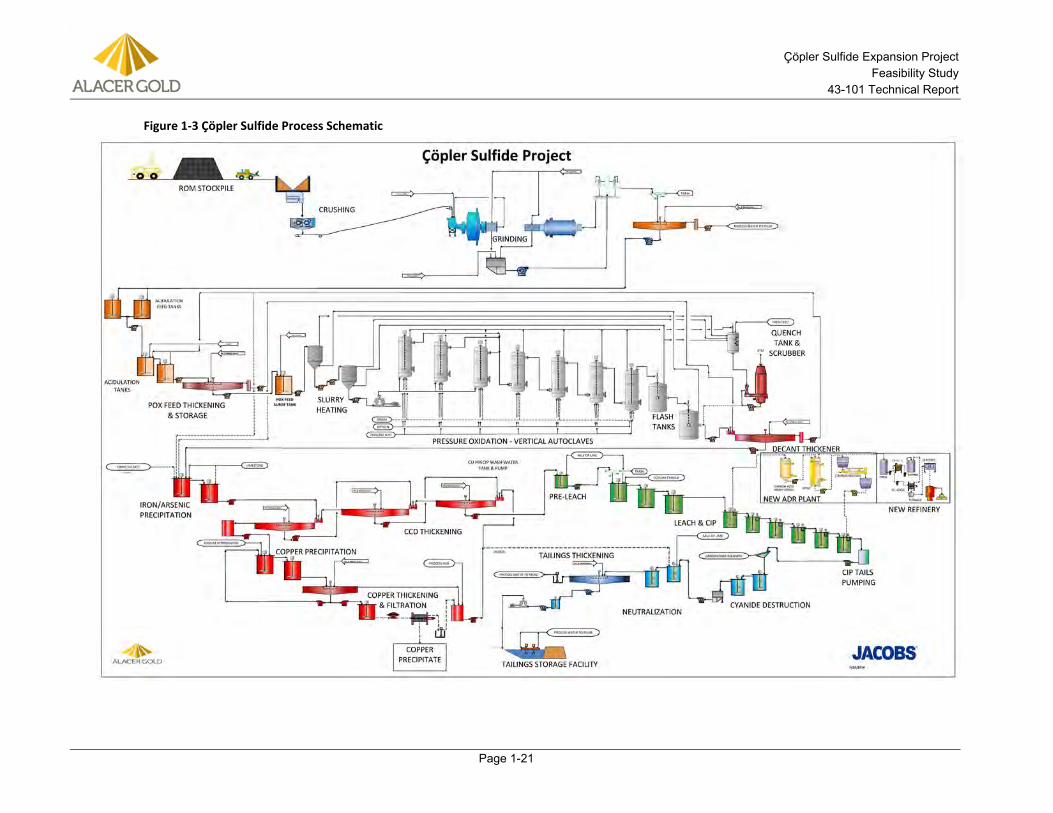
Çöpler Sulfide Expansion Project Feasibility Study
43-101 Technical Report
Page 1-21
Figure 1-3 Çöpler Sulfide Process Schematic
Çöpler Sulfide Expansion Project Feasibility Study
43-101 Technical Report
Page 1-22
1.18 Project Infrastructure Infrastructure 1.18.1
The infrastructure of the new sulfide project will be minimally supported by the existing facility infrastructure. Some of the existing infrastructure will adequately support the new facility, while other components will be modified to meet the design criteria of the overall mine. The majority of the infrastructure for the sulfide project will be new.
The planning and design of new infrastructure was developed in conjunction with the available area and required resources at the site. Consideration was given to the topography, geotechnical information, space constraints and economical process flow requirements during construction and operation. All aspects of the design reflect the compliance to applicable Turkish national codes and local codes.
The new infrastructure includes power supply, buildings, water and sewage, communications, site roads, plant fire protection system, and plant lighting system.
Tailings Storage Facility 1.18.2The Tailings Storage Facility (TSF) for the sulfide project has been designed to provide containment for up to 36.7 Mt of mill tailings. The tailings will be pumped to the fully lined tailings impoundment over an approximate 18-year mine life. Approximately 5,796 tpd of tailings will be pumped at a slurry density of 37% by weight from the cyanide detoxification and arsenic removal unit to the TSF.
The sulfide project will make use of the same TSF location proposed in 2007 with an increase in overall height of the embankment crest from 1224 m to 1238 m amsl to accommodate the increased mass of tailings anticipated in the current mine plan.
The current Golder TSF design utilizes the same general design concept as developed by Tetra Tech in 2007 and included in the Pre-Feasibility Study performed by Samuel Engineering (Samuel, 2011). The TSF design includes a rockfill embankment with downstream raise construction, an impoundment underdrain system, a composite liner system, and an overdrain system.
1.19 Market Studies and Contracts The markets for copper precipitate, silver and gold doré are international and generally robust but variable, depending on supply and demand marketing aspects.
Currently, 50% of the gold and silver from Çöpler heap leach operations is delivered to Johnson Matthey in Canada. The other 50% is delivered to the Istanbul Gold refinery. Sales of gold recovered from the sulfide process plant will likely be similar to the current arrangement.
The copper product from the Çöpler Project will likely be marketed in Europe or Asia.
Jacobs performed a copper marketing study to examine the marketability of the copper precipitate produced from the Çöpler Sulfide Project and to develop an understanding of the likely terms for the sales of the product.
The study concluded that the copper precipitate with a concentrate grade of approximately 47% Cu should be readily marketable. Analyses of the precipitate indicate that there are several impurities, including arsenic which assayed about 0.26% in sample from pilot testing, which pose problems at smelters and could result in the
Çöpler Sulfide Expansion Project Feasibility Study
43-101 Technical Report
Page 1-23
imposition of penalties by the smelter purchasing the concentrate. Arsenic penalties can start as low as 0.1 to 0.2%. It is expected that the plant arsenic removal process can be optimized to produce a concentrate that will assay below the penalty levels.
The study concluded that there are at least 3 smelters interested in processing the precipitate and one broker interested in marketing the product. It is believed that the copper product can be sold by direct contract to the smelters or through a concentrate sales broker. The copper marketing study information can be found in Section 19.0.
1.20 Environmental and Permitting An Environmental Impact Assessment (EIA) study was completed in 2008 for the oxide ores of the Çöpler Gold Mine operating 15,500 tpd heap leach facility. The EIA permit was obtained from the Turkish Ministry of Environment and Urbanization (MEU) on April 16th, 2008. The project description for the 2008 EIA included three main open pits (manganese, marble contact, and main zones), five waste rock dumps, a heap leach pad, a processing plant, and a TSF. The 2008 project description involved only the oxide resources.
The Çöpler mine started its open pit and heap leach operation in 2010, and first gold was poured in December 2010. Additional EIA studies conducted and environmental permits received for Çöpler Gold Mine since the start of the gold mine operations are as follows:
• EIA permit dated April 10th, 2012 for the operation of mobile crushing plant,
• EIA permit dated May 17th, 2012 for capacity expansion involving (i) increasing the operation rate to 23,500 tpd; (ii) increasing the Çöpler waste rock dump footprint area; (iii) adding a SART plant to the process in order to decrease the cyanide consumption due to high copper content in some ores.
The EIA studies were conducted according to the format stipulated by the Turkish EIA Regulation. The scope of the Turkish EIA studies differs from the scope of international Environmental and Social Impact Assessment (ESIA) studies (as established by the IFC’s Environmental and Social Performance Standards), especially in terms of social impacts and public disclosure processes. While the social impact assessment and public disclosure processes are also parts of the Turkish EIA studies, they are treated less rigorously than in IFC standards. In the period following the receipt of the 2008 EIA permit, Alacer conducted further studies to supplement the Turkish EIA study and subsequently meet the IFC requirements. These studies involved a Resettlement Action Plan (RAP) for the Çöpler village, a socio-economic baseline study for Çöpler Village, a human rights assessment study, an Environmental Management Plan, and a biodiversity study.
SRK Danışmanlık ve Mühendislik A.Ş. (SRK) was retained by Alacer to undertake the Çöpler Sulfide Project Environmental and Social Impact Assessment (ESIA) study for permitting and possible financing purposes.
Much of the content in this section originated from the Çöpler Mine Sulfide Expansion Feasibility Study – Environment and Permitting report prepared by SRK Turkey (SRK Turkey, 2012b).
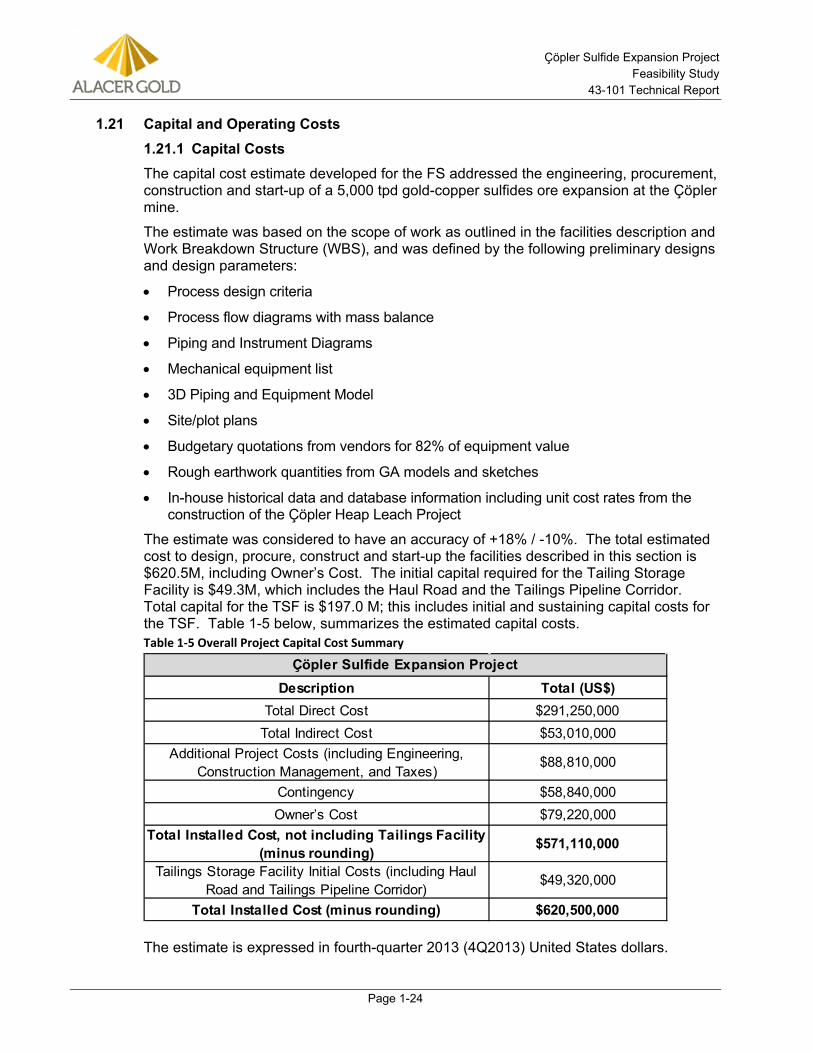
Çöpler Sulfide Expansion Project Feasibility Study
43-101 Technical Report
Page 1-24
1.21 Capital and Operating Costs Capital Costs 1.21.1
The capital cost estimate developed for the FS addressed the engineering, procurement, construction and start-up of a 5,000 tpd gold-copper sulfides ore expansion at the Çöpler mine.
The estimate was based on the scope of work as outlined in the facilities description and Work Breakdown Structure (WBS), and was defined by the following preliminary designs and design parameters:
• Process design criteria
• Process flow diagrams with mass balance
• Piping and Instrument Diagrams
• Mechanical equipment list
• 3D Piping and Equipment Model
• Site/plot plans
• Budgetary quotations from vendors for 82% of equipment value
• Rough earthwork quantities from GA models and sketches
• In-house historical data and database information including unit cost rates from the construction of the Çöpler Heap Leach Project
The estimate was considered to have an accuracy of +18% / -10%. The total estimated cost to design, procure, construct and start-up the facilities described in this section is $620.5M, including Owner’s Cost. The initial capital required for the Tailing Storage Facility is $49.3M, which includes the Haul Road and the Tailings Pipeline Corridor. Total capital for the TSF is $197.0 M; this includes initial and sustaining capital costs for the TSF. Table 1-5 below, summarizes the estimated capital costs. Table 1-5 Overall Project Capital Cost Summary
The estimate is expressed in fourth-quarter 2013 (4Q2013) United States dollars.
Description Total (US$)Total Direct Cost $291,250,000
Total Indirect Cost $53,010,000 Additional Project Costs (including Engineering,
Construction Management, and Taxes)$88,810,000
Contingency $58,840,000 Owner’s Cost $79,220,000
Total Installed Cost, not including Tailings Facility (minus rounding) $571,110,000
Tailings Storage Facility Initial Costs (including Haul Road and Tailings Pipeline Corridor)
$49,320,000
Total Installed Cost (minus rounding) $620,500,000
Çöpler Sulfide Expansion Project
Çöpler Sulfide Expansion Project Feasibility Study
43-101 Technical Report
Page 1-25
Items not included in the capital estimate are as follows:
• Sunk costs: costs prior to the completion of the Feasibility Study (i.e. exploration drilling, sample preparation, metallurgical testwork, Pre-Feasibility Study, EIA, etc.)
• Oxygen plant (included as operating cost)
• Mining capital costs
• Owner’s corporate costs
• Allowance for special incentives (schedule, safety, etc.)
• Value Added Tax (VAT) and withholding tax
• Foreign currency exchange rate fluctuations
• Working capital and sustaining capital (included in cash flow model)
• Interest and financing cost
• Risk due to political upheaval, government policy changes, and labor disputes, permitting delays, weather delays or any other force majeure occurrences.
Where source information was provided in other currencies, these amounts have been converted at the following rates:
1USD = 2.20 TRY (Turkey Lira)
1USD = 0.77 EUR (Euros)
Mining operations for the heap leach facility is currently contracted to an outside party. For the sulfide expansion project, it is assumed that this arrangement would continue. Therefore, no capital cost is included for mining equipment or facilities. All such costs are built into the unit rate for mining operations included in the operating cost estimate.
Operating Costs 1.21.2All costs are expressed in Q4 2013 U.S. Dollars with no allowance for contingency.
Operating cash costs are included as $/tonne or total tonnes processed (heap leach and sulfide ore), $/oz of total gold recovered and the average total operating in million $/year. Due to rounding, some totals listed in the tables below may differ slightly.
The projected life of mine operating cost estimate is summarized in Table 1-6.
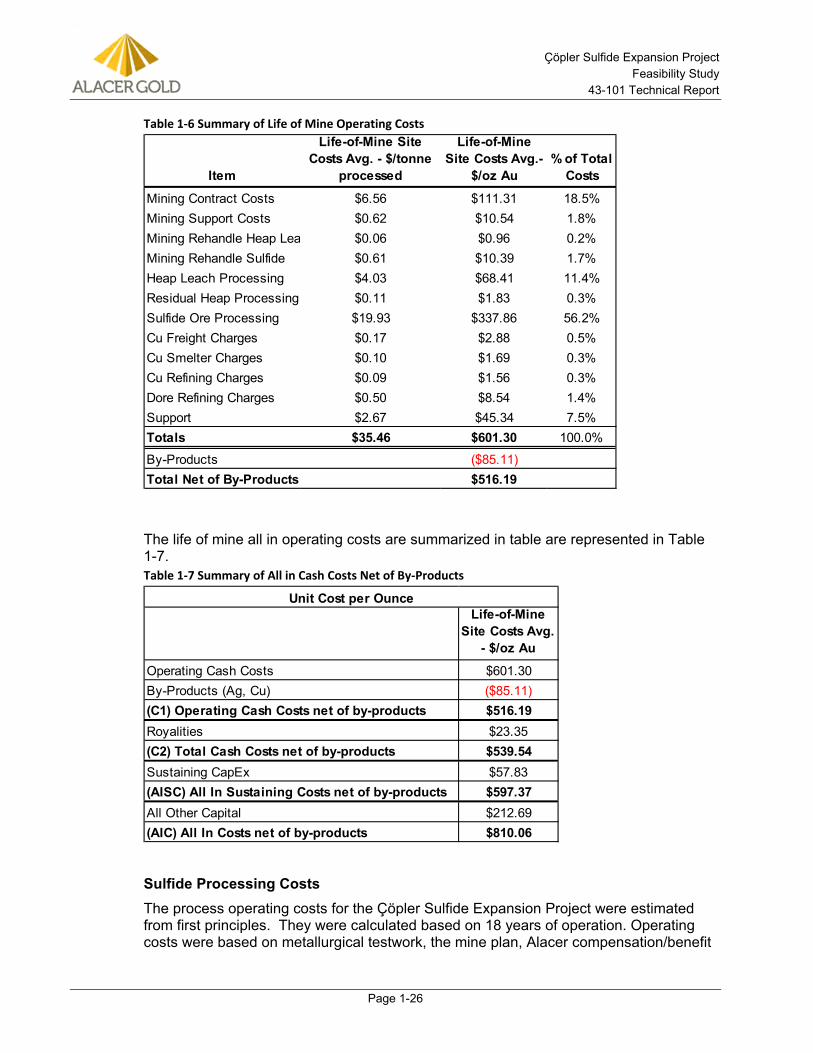
Çöpler Sulfide Expansion Project Feasibility Study
43-101 Technical Report
Page 1-26
Table 1-6 Summary of Life of Mine Operating Costs
The life of mine all in operating costs are summarized in table are represented in Table 1-7. Table 1-7 Summary of All in Cash Costs Net of By-Products
Sulfide Processing Costs The process operating costs for the Çöpler Sulfide Expansion Project were estimated from first principles. They were calculated based on 18 years of operation. Operating costs were based on metallurgical testwork, the mine plan, Alacer compensation/benefit
Item
Life-of-Mine Site Costs Avg. - $/tonne
processed
Life-of-Mine Site Costs Avg.-
$/oz Au% of Total
Costs
Mining Contract Costs $6.56 $111.31 18.5%Mining Support Costs $0.62 $10.54 1.8%Mining Rehandle Heap Lea $0.06 $0.96 0.2%Mining Rehandle Sulfide $0.61 $10.39 1.7%Heap Leach Processing $4.03 $68.41 11.4%Residual Heap Processing $0.11 $1.83 0.3%Sulfide Ore Processing $19.93 $337.86 56.2%Cu Freight Charges $0.17 $2.88 0.5%Cu Smelter Charges $0.10 $1.69 0.3%Cu Refining Charges $0.09 $1.56 0.3%Dore Refining Charges $0.50 $8.54 1.4%Support $2.67 $45.34 7.5%Totals $35.46 $601.30 100.0%
By-Products ($85.11)Total Net of By-Products $516.19
Life-of-Mine Site Costs Avg.
- $/oz Au
Operating Cash Costs $601.30By-Products (Ag, Cu) ($85.11)(C1) Operating Cash Costs net of by-products $516.19Royalities $23.35(C2) Total Cash Costs net of by-products $539.54Sustaining CapEx $57.83(AISC) All In Sustaining Costs net of by-products $597.37All Other Capital $212.69(AIC) All In Costs net of by-products $810.06
Unit Cost per Ounce
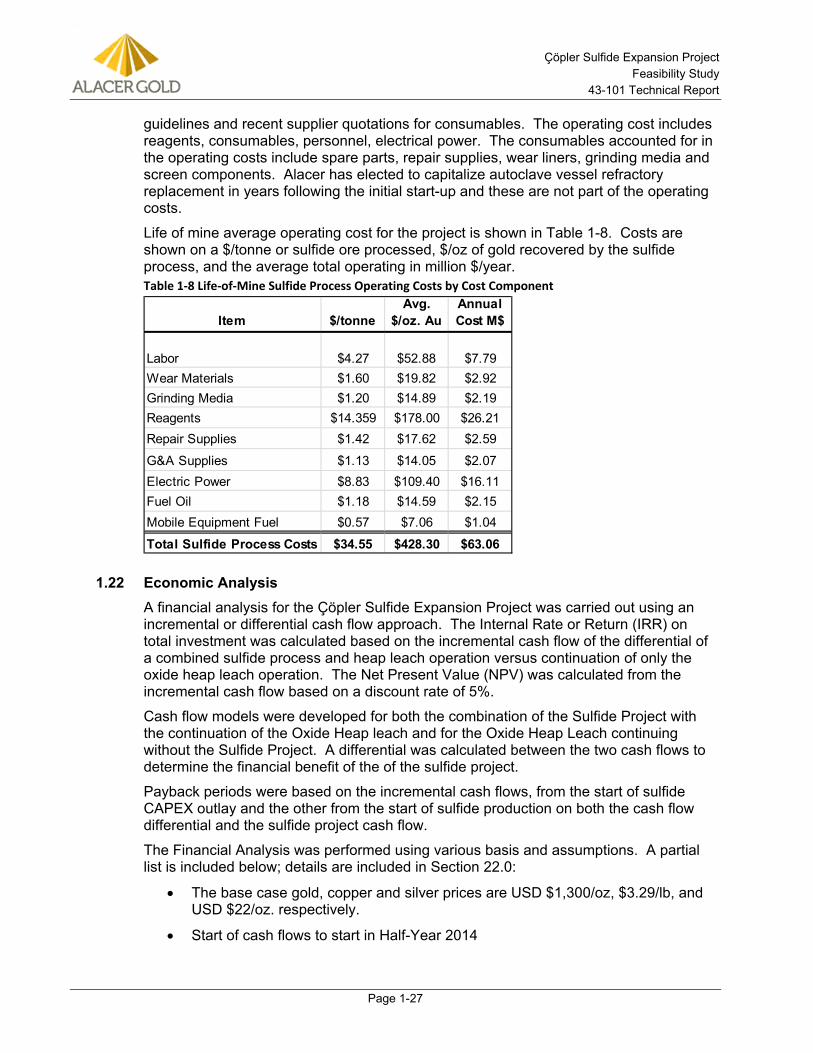
Çöpler Sulfide Expansion Project Feasibility Study
43-101 Technical Report
Page 1-27
guidelines and recent supplier quotations for consumables. The operating cost includes reagents, consumables, personnel, electrical power. The consumables accounted for in the operating costs include spare parts, repair supplies, wear liners, grinding media and screen components. Alacer has elected to capitalize autoclave vessel refractory replacement in years following the initial start-up and these are not part of the operating costs.
Life of mine average operating cost for the project is shown in Table 1-8. Costs are shown on a $/tonne or sulfide ore processed, $/oz of gold recovered by the sulfide process, and the average total operating in million $/year. Table 1-8 Life-of-Mine Sulfide Process Operating Costs by Cost Component
1.22 Economic Analysis A financial analysis for the Çöpler Sulfide Expansion Project was carried out using an incremental or differential cash flow approach. The Internal Rate or Return (IRR) on total investment was calculated based on the incremental cash flow of the differential of a combined sulfide process and heap leach operation versus continuation of only the oxide heap leach operation. The Net Present Value (NPV) was calculated from the incremental cash flow based on a discount rate of 5%.
Cash flow models were developed for both the combination of the Sulfide Project with the continuation of the Oxide Heap leach and for the Oxide Heap Leach continuing without the Sulfide Project. A differential was calculated between the two cash flows to determine the financial benefit of the of the sulfide project.
Payback periods were based on the incremental cash flows, from the start of sulfide CAPEX outlay and the other from the start of sulfide production on both the cash flow differential and the sulfide project cash flow.
The Financial Analysis was performed using various basis and assumptions. A partial list is included below; details are included in Section 22.0:
• The base case gold, copper and silver prices are USD $1,300/oz, $3.29/lb, and USD $22/oz. respectively.
• Start of cash flows to start in Half-Year 2014
Item $/tonneAvg.
$/oz. AuAnnual Cost M$
Labor $4.27 $52.88 $7.79Wear Materials $1.60 $19.82 $2.92Grinding Media $1.20 $14.89 $2.19Reagents $14.359 $178.00 $26.21Repair Supplies $1.42 $17.62 $2.59
G&A Supplies $1.13 $14.05 $2.07Electric Power $8.83 $109.40 $16.11Fuel Oil $1.18 $14.59 $2.15Mobile Equipment Fuel $0.57 $7.06 $1.04
Total Sulfide Process Costs $34.55 $428.30 $63.06
Çöpler Sulfide Expansion Project Feasibility Study
43-101 Technical Report
Page 1-28
• The cash flows take into account depreciation, cash taxes, delta working capital, and tax credits.
• Commercial production will begin in Q4 2017.
• All cost and sales estimates are in constant Q4 2013 U.S. Dollars with no inflation or escalation factors taken into account.
The results of the economic analysis summarized below represent forward–looking information as defined under Canadian securities law. Actual results may differ materially from those expressed or implied by forward-looking information. The reader should refer to the Cautionary Note with respect to forward-looking information at the front of this Report for more information regarding forward-looking statements, including material assumptions (in addition to those discussed in this section and elsewhere in the Report) and risks, uncertainties and other factors that could cause actual results to differ material from those expressed or implied in this section (and elsewhere in the Report).
Table 1-9 summarizes the life of mine financials and key values for both the Heap Leach and Sulfide Plant operating together and the Heap Leach operation only. Due to rounding, some totals listed in the tables below may differ slightly.
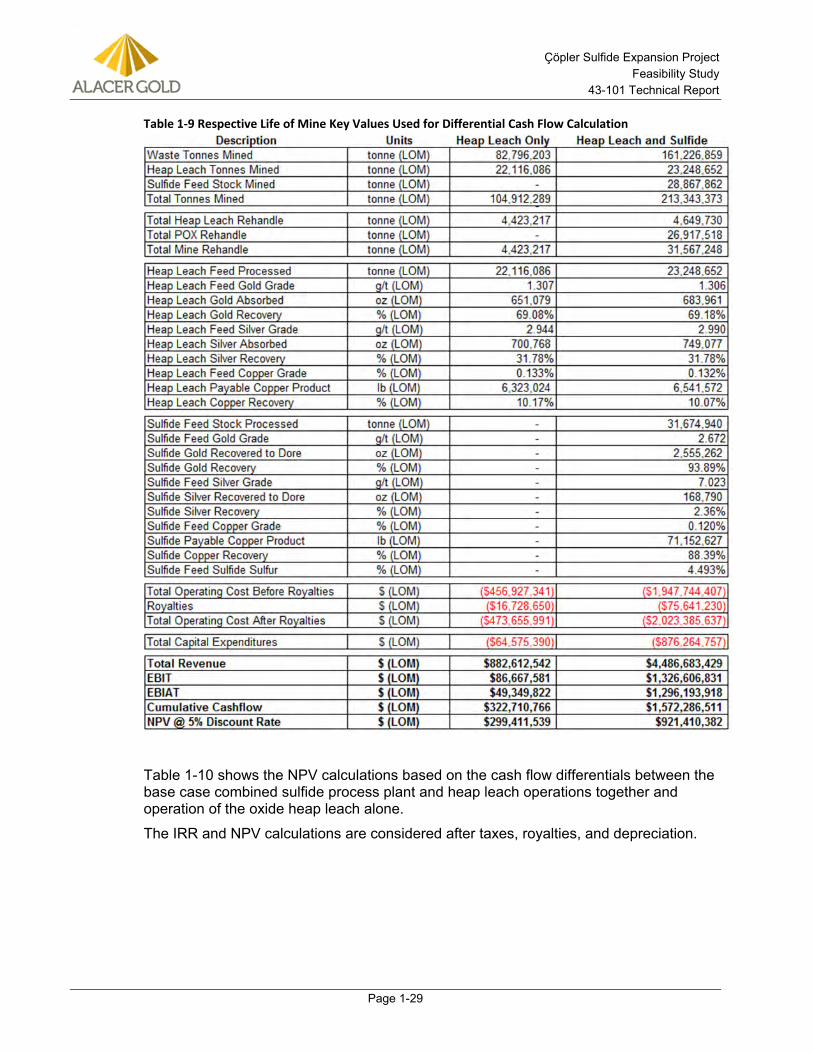
Çöpler Sulfide Expansion Project Feasibility Study
43-101 Technical Report
Page 1-29
Table 1-9 Respective Life of Mine Key Values Used for Differential Cash Flow Calculation
Table 1-10 shows the NPV calculations based on the cash flow differentials between the base case combined sulfide process plant and heap leach operations together and operation of the oxide heap leach alone.
The IRR and NPV calculations are considered after taxes, royalties, and depreciation.
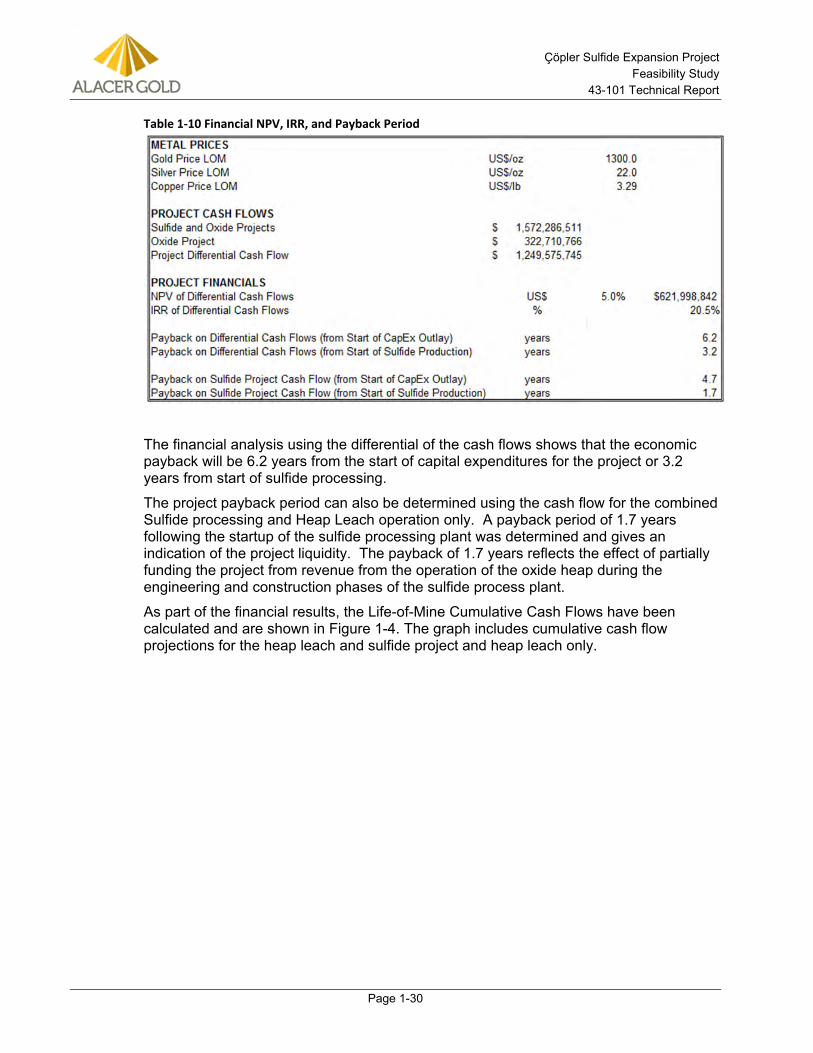
Çöpler Sulfide Expansion Project Feasibility Study
43-101 Technical Report
Page 1-30
Table 1-10 Financial NPV, IRR, and Payback Period
The financial analysis using the differential of the cash flows shows that the economic payback will be 6.2 years from the start of capital expenditures for the project or 3.2 years from start of sulfide processing.
The project payback period can also be determined using the cash flow for the combined Sulfide processing and Heap Leach operation only. A payback period of 1.7 years following the startup of the sulfide processing plant was determined and gives an indication of the project liquidity. The payback of 1.7 years reflects the effect of partially funding the project from revenue from the operation of the oxide heap during the engineering and construction phases of the sulfide process plant.
As part of the financial results, the Life-of-Mine Cumulative Cash Flows have been calculated and are shown in Figure 1-4. The graph includes cumulative cash flow projections for the heap leach and sulfide project and heap leach only.

Çöpler Sulfide Expansion Project Feasibility Study
43-101 Technical Report
Page 1-31
Figure 1-4 Cumulative Cash Flows for Sulfide Project and Oxide Projects and Oxide Project Only
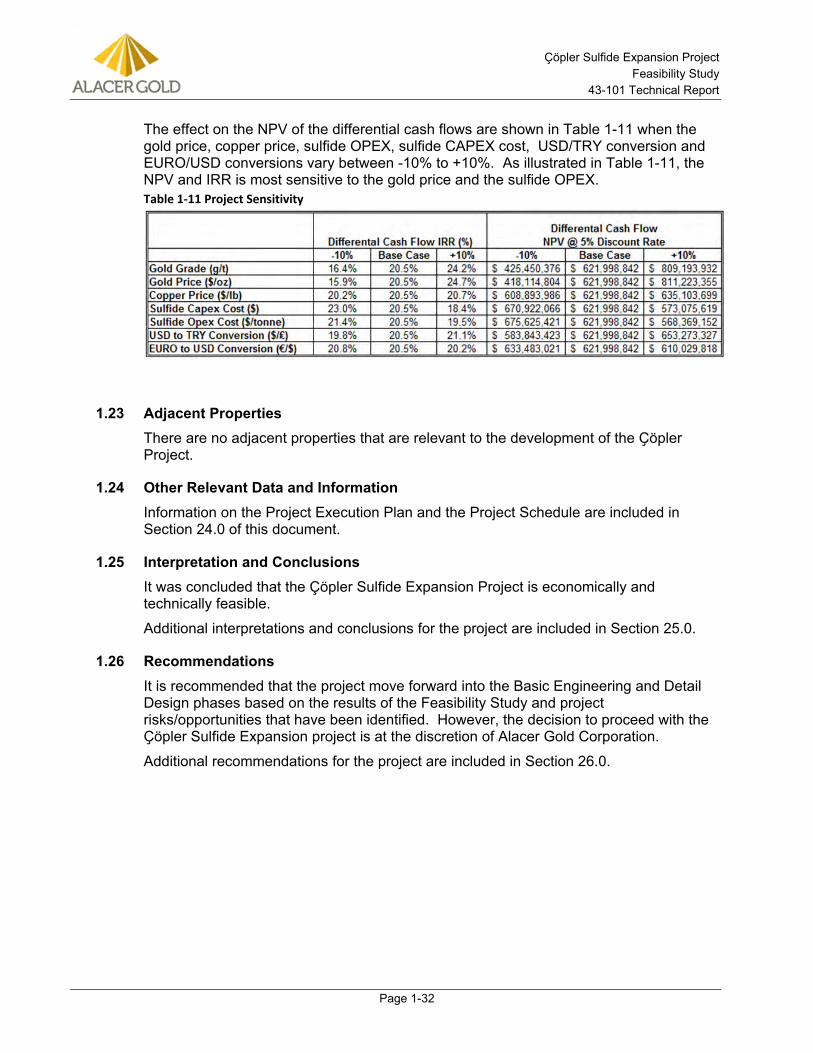
Çöpler Sulfide Expansion Project Feasibility Study
43-101 Technical Report
Page 1-32
The effect on the NPV of the differential cash flows are shown in Table 1-11 when the gold price, copper price, sulfide OPEX, sulfide CAPEX cost, USD/TRY conversion and EURO/USD conversions vary between -10% to +10%. As illustrated in Table 1-11, the NPV and IRR is most sensitive to the gold price and the sulfide OPEX. Table 1-11 Project Sensitivity
1.23 Adjacent Properties There are no adjacent properties that are relevant to the development of the Ҫӧpler Project.
1.24 Other Relevant Data and Information Information on the Project Execution Plan and the Project Schedule are included in Section 24.0 of this document.
1.25 Interpretation and Conclusions It was concluded that the Çöpler Sulfide Expansion Project is economically and technically feasible.
Additional interpretations and conclusions for the project are included in Section 25.0.
1.26 Recommendations It is recommended that the project move forward into the Basic Engineering and Detail Design phases based on the results of the Feasibility Study and project risks/opportunities that have been identified. However, the decision to proceed with the Ҫӧpler Sulfide Expansion project is at the discretion of Alacer Gold Corporation.
Additional recommendations for the project are included in Section 26.0.
Çöpler Sulfide Expansion Project Feasibility Study
43-101 Technical Report
Page 2-1
2.0 INTRODUCTION
2.1 Scope of Study The following Technical Report (the report) presents the results of the Feasibility Study (FS). In September of 2013, Alacer engaged Jacobs to perform the study, with contributions from a number of independent consulting firms. This report was prepared at the request of Robert Benbow, Senior Vice President of Strategic Projects. As of the date of this Report, Alacer is a Canadian publicly traded company listed on the Toronto Stock Exchange (“TSX”) under the trading symbol ASR. Its corporate office is located at
9635 Maroon Circle, Suite 300 Englewood, CO. 80112 USA (303)-292-1299
The FS was initiated after the completion of the Pre-Feasibility Study (PFS) performed by Samuel Engineering (Samuel, 2011). Additional metallurgical testwork was performed before and during the FS to support the process development. Previous studies, including the PFS, were reviewed for guidance, and to improve the confidence and accuracy of relevant information. This Feasibility Study forms the basis for critical review of the Project and for a decision to progress the Sulfide Expansion Project to detail design and construction.
The boundary conditions for the project scope-of-work include the process plant from run-of-mine stockpile and primary crushing to tailings discharge and tailings storage facility. Also included are a new Absorption, Desorption and Refining (ADR) facility, a new warehouse/maintenance shop, and utilities including standby power generation and power distribution. Additional permanent office facilities will be provided as part of the project scope. The existing administration facilities will continue to be used for owner personnel supporting the existing heap leach and as space allows, part of the personnel required for support of the sulfide expansion project.
Both oxide and sulfide material are contained within the Çöpler Sulfide Expansion Project gold resource. All material that is heap leachable will be processed in the existing Heap Leaching Plant (HLP) facilities.
On the basis of metallurgical testwork results and the Pre-Feasibility Study, the whole ore pressure oxidation process was selected as the basis for this Feasibility Study. The sulfide resource material will be processed in the new mill and pressure oxidation (POX) facilities. The new processing facilities will be constructed adjacent to the existing heap leach facilities.
The processing facility will have a design capacity of 5,000 tonnes per day. The average estimated copper precipitate production is 18.5 tonnes per day (cake), and the average estimated gold production is 369 troy ounces per day.
Çöpler Sulfide Expansion Project Feasibility Study
43-101 Technical Report
Page 2-2
The proposed tailings dam is designed with a capacity of 31.9 Mt to support the 5,000 tpd Sulfide Expansion Project.
Potential POX process feed is currently being stockpiled in anticipation of the construction of the new sulfide processing facilities scheduled to start construction in 2015 and be brought into operation in the fourth quarter of 2017.
2.2 Forward-Looking Information Except for statements of historical fact relating to Alacer, certain statements contained in this presentation constitute forward-looking information, future oriented financial information, or financial outlooks (collectively “forward-looking information”) within the meaning of Canadian securities laws. Forward-looking information may be contained in this document and other public filings of Alacer.
Forward-looking information often relates to statements concerning Alacer’s future outlook and anticipated events or results and, in some cases, can be identified by terminology such as “may”, “will”, “could”, “should”, “expect”, “plan”, “anticipate”, “believe”, “intend”, “estimate”, “projects”, “predict”, “potential”, “continue” or other similar expressions concerning matters that are not historical facts.
Forward-looking information includes statements concerning, among other things, preliminary cost reporting in this presentation, production, cost and capital expenditure guidance; development plans for processing sulfide ore at Çöpler; ability to discover additional oxide gold ore, amount of contained ounces in sulfide ore; results of any gold reconciliations; ability to discover additional oxide gold ore, the generation of free cash flow and payment of dividends; matters relating to proposed exploration, communications with local stakeholders and community relations; negotiations of joint ventures, negotiation and completion of transactions; commodity prices; mineral resources, mineral reserves, realization of mineral reserves, existence or realization of mineral resource estimates; the development approach, the timing and amount of future production, timing of studies, announcements and analyses, the timing of construction and development of proposed mines and process facilities; capital and operating expenditures; economic conditions; availability of sufficient financing; exploration plans and any and all other timing, exploration, development, operational, financial, budgetary, economic, legal, social, regulatory and political matters that may influence or be influenced by future events or conditions.
Actual results may vary from such forward-looking information for a variety of reasons, including but not limited to risks and uncertainties disclosed in other Alacer filings at www.sedar.com. Forward-looking statements are based upon management’s beliefs, estimate and opinions on the date the statements are made and, other than as required by law, Alacer does not intend, and undertakes no obligation to update any forward-looking information to reflect, among other things, new information or future events.
You should not place undue reliance on forward-looking information and statements. Forward-looking information and statements are only predictions based on our current expectations and our projections about future events. Actual results may vary from such forward-looking information for a variety of reasons, including but not limited to risks and uncertainties disclosed in Alacer’s filings at www.sedar.com and other unforeseen events or circumstances. Other than as required by law, Alacer does not intend, and undertakes no obligation to update any forward-looking information to reflect, among other things, new information or future events.
Çöpler Sulfide Expansion Project Feasibility Study
43-101 Technical Report
Page 2-3
2.3 Main Contributors Scope of Services Alacer 2.3.1
Alacer and its consultants provided input and guidance throughout the Feasibility Study. Alacer provided input on the following sections of the FS report:
• Property Description
• Ownership and Property Rights
• History
• Geological Setting and Mineralization
• Mineral Resource Estimates
• Mineral Reserve Estimates
• Mining Methods
• Owner’s Cost
Jacobs 2.3.2Jacobs was engaged to further develop the engineering design, capital and operating costs and the economic analysis for the detailed design and construction of the Sulfide Expansion Project process facility. Jacobs also compiled the the FS and this Technical Report with input from several other independent consultants engaged by Alacer. Jacobs provided the appropriate Qualified Persons to support their applicable sections of this report.
The basis for the Feasibility Study work performed by Jacobs and the other independent consultantswas the Pre-Feasibility Study produced for Alacer by Samuel Engineering in May 2011 (Samuel, 2011). Process Flow Diagrams and Piping and Instrument Diagrams were developed to reflect the updates and changes from the Pre-Feasibility Study. A Hazard Assessment workshop and a P&ID review session were held with Alacer and their consultants during the FS to support the work performed by Jacobs.
Based on the PFDs and P&IDs, the engineering discipline designs were developed to support the estimate.
Golder 2.3.3Golder was engaged to develop the engineering design and capital costs for the feasibility level design of the TSF for the Sulfide Expansion Project and to provide the appropriate Qualified Persons to support this report. The Golder project support included:
• Geotechnical investigations and laboratory testing to support the Sulfide Plant expansion and development of the TSF
• Integrated water studies including hydrologic and hydrogeological studies in support of this FS and the EIA and with oversight of the installation of groundwater monitoring wells
• A site specific fault hazard study of the Ziyaret Tepe Fault in addition to review and assessment of the seismic parameters used to support the engineering designs for site infrastructure
Çöpler Sulfide Expansion Project Feasibility Study
43-101 Technical Report
Page 2-4
• A TSF trade-off study that evaluated up to twelve potentially viable sites for development of the TSF
• A waste dump facility trade-off study that evaluated two basic options for waste rock disposal
• A haul road trade-off study that evaluated two basic options for delivery of waste rock for use in construction of the TSF embankment
• Stability evaluation of the Waste Rock Dump design prepared by Alacer
• Engineering evaluation and feasibility level designs, including estimation of construction quantities for the TSF and a realignment of a portion of the access road to Sabırlı Village
• Preparation of capital and sustaining costs for the TSF and Sabırlı Village road alignment
AMEC 2.3.4AMEC was engaged to provide Qualified Persons for the Mineral Resource estimate. The scope of work included:
• Audit the database and QAQC data
• Assist in constructing the Mineral Resource model
• High-level review of parameters used in the conceptual resource pit to determine reasonable prospects of eventual economic extractions
• Endorse the Mineral Resource estimate
SRK (US) 2.3.5SRK (US) was engaged by Alacer to provide pit optimization, pit design, production scheduling and reserve estimation oversight with Qualified Persons responsibility (Mine Planning and Mineral Reserves) for the Sulfide Expansion Project Feasibility Study. The scope of work included:
• Review and verification of mine plan design criteria. Including but not limited to cost estimation, recovery, dilution, cut-off grade strategy, geotechnical parameters, mining widths, sequencing, throughput and stockpiling strategy.
• Verification of base inputs and oversight of pit optimization
• Provided assistance to Alacer personnel in construction of pit design, phase design and mine production scheduling
• Verification and Qualified Person (QP) responsibility of Mineral Reserve Statement
SRK Turkey 2.3.6SRK Turkey was engaged to provide Qualified Persons for the environmental and mine closure portions of the Sulfide Expansion Project Feasibility Study and prepare for environmental permitting. SRK Turkey’s scope of work involves the following studies which are complete, in progress, or to be initiated:
• EIA permitting according to the Turkish EIA Regulation
Çöpler Sulfide Expansion Project Feasibility Study
43-101 Technical Report
Page 2-5
• EIA study according to the IFC Environmental Performance Standards.
• Mine closure planning
The EIA study requires several specialist studies to be completed. All the specialist studies will be performed by SRK with the exception of the following:
• Hydrological and hydrogeological baseline study by Golder
• Hydrological and hydrogeological impact assessment study by Golder
• The biodiversity and ecosystem impacts study by Gazi University – Biology Department.
SRK Turkey will conduct the following specialist studies: • Environmental baseline studies
• Geochemical impact assessment involving open pits, waste rock dumps, TSF, and heap leach pads
• Air quality impact assessment
• Noise impact assessment
• Socio-economic baseline and impact assessment.
2.4 Other Contributors Scope of Services Hazen Research Incorporated 2.4.1
Testwork completed by Hazen Research, Inc. (Hazen) in 2012 and 2013 focused on determining operating conditions for the pressure oxidation process and development of design data for the sulfide process flowsheet. This information was utilized by Jacobs to further the design of the Sulfide Expansion process plant.
McClelland Laboratories Incorporated 2.4.2Testwork was completed by McClelland Laboratories, Inc. in 2013, also initiated and directed by Alacer, focused on carbon loading, cyanide destruction and tailings extraction analysis on samples generated from the Hazen test program.
Tetra Tech 2.4.3Information on the foundation and geotechnical conditions for the TSF area is included in Section 18.13 of this report. This information is based on available geologic mapping for the TSF area plus previous investigations in the TSF area performed by Tetra Tech, Fugro-Sial, and others. Also included in Section 18.13 are summaries of Golder’s interpretation of the available data and the TSF design.
2.5 Effective Dates and Declaration This report is in support of the Alacer press release entitled Alacer Gold Announces Positive Definitive Feasibility Study for Çöpler Gold Mine, dated June 16th, 2014. This report is considered effective as of July 29th, 2014. The opinions contained herein are based on information collected and developed by the independent contributing consultants throughout the course of the study. These opinions and interpretations
Çöpler Sulfide Expansion Project Feasibility Study
43-101 Technical Report
Page 2-6
reflect various technical and economic conditions at the time of writing. Due to the nature of the mining business, conditions can change significantly over relatively short periods of time.
2.6 Site Visits Rich Bohling completed a site visit to the Çöpler site from March 24 to 27, 2012. The purpose of the site visit was to view the existing operation and facilities, evaluate the locations for processing and ancillary facilities, view core samples to understand the geology as it relates to metallurgy, meet with Alacer employees and verify other information required for the Technical Report.
Mark Liskowich inspected the Çöpler Project Area from September 21 to 22, 2010. The visit was to perform a site inspection of the environmental management of Phase 1 of the existing Heap Leach project. This site visit was also to gather information to be able to review and qualify the environmental sections of the Pre-Feasibility technical report (Samuel, 2011).
Jeff Parshley did not perform a personal inspection of the Çöpler Project Area. However, SRK Consulting had multiple qualified persons that did visit the site, including a Mine Closure expert that reports to Mr. Parshley.
Bret Swanson inspected the Çöpler Project Area from March 24 to 27, 2012. The visit included detailed review of mining operations, tour of the open pit, heap leach and crushing facilities. Additional time was spent discussing potential operations with technical services staff and mine management.
Dr. Harry Parker visited the project site from May 5 to 11, 2014. During the site visit, Dr. Parker inspected the open pit and selected drill core, reviewed cross sections, and reviewed reconciliation of production to Mineral Resource model depletions. He also inspected the head sampler, reviewed blast hole sampling, reviewed the sample preparation and visited the onsite assay laboratory.
Gordon Seibel visited the project site from May 5 to 11, 2014. During the site visit Mr. Seibel inspected the open pit and selected drill core, reviewed cross sections, and reviewed reconciliation of production to Mineral Resource model depletions. He also inspected the head sampler, reviewed blast hole sampling, reviewed the sample preparation and visited the onsite assay laboratory. In addition, Mr. Seibel verified the locations of selected drill hole collars, visited the ALS laboratory, and collected witness samples.
Richard Kiel visited the site and inspected the Çöpler Project Area from May 8 to 15, 2012 and again from June 6 to 9, 2014 and July 9 to 13, 2014. The visits included a detailed review of the planned Sulfide Plant, Waste Dumps, TSF Haul Road, and TSF areas, as well as review of existing geological, geotechnical, and geophysical information. In addition, the site visit included planning for future geotechnical investigations and preparation of information necessary to obtain permits as required for additional geotechnical site work.
Dale Armstrong visited the site and inspected the Çöpler Project Area from March 24 to March 26, 2012. The visit included a detailed review of the geologic and hydrogeologic setting of the project area, review of existing geological, hydrogeological, and geophysical information. In addition, the site visit included planning for future hydrogeologic field investigations to acquire additional data for use in the groundwater

Çöpler Sulfide Expansion Project Feasibility Study
43-101 Technical Report
Page 2-7
flow modelling phase of the project and preparation of information necessary to obtain permits as required for additional mine expansions.
Lisa Bascombe visited the site multiple times to inspect the Çöpler Project Area. Reviews of the Çöpler Exploration drilling, logging and sampling systems and procedures have been undertaken. The most recent site visit was in March 2014 for 30 days.
Çöpler Sulfide Expansion Project Feasibility Study
43-101 Technical Report
Page 3-1
3.0 RELIANCE ON OTHER EXPERTS
3.1 Çakmak Avukatlik Bürosu In respect to Section 4.0 of this report, the authors have relied on a legal opinion provided by Çakmak Avukatlik Bürosu, a legal firm located in Ankara, Turkey and specializing in natural resources and corporate law in Turkey, dated 22 April 2011 and 29 September 2010. Details about the legal right to mine were provided in a memo from Burhanettin Şahin, Alacer VP Sustainability, responsible for land and permitting to Robert Benbow Alacer Vice President Strategic Projects and former Alacer Country Manager in Turkey dated 3 May 2011 and a memo from Seda Çağatay, Alacer Land Manager, to Robert Benbow dated 10 May 2011. Mr. Şahin and Ms. Çağatay are responsible for land tenure for Alacer holdings in Turkey and are experts on Turkish rules and regulations related to mining land tenure in Turkey.
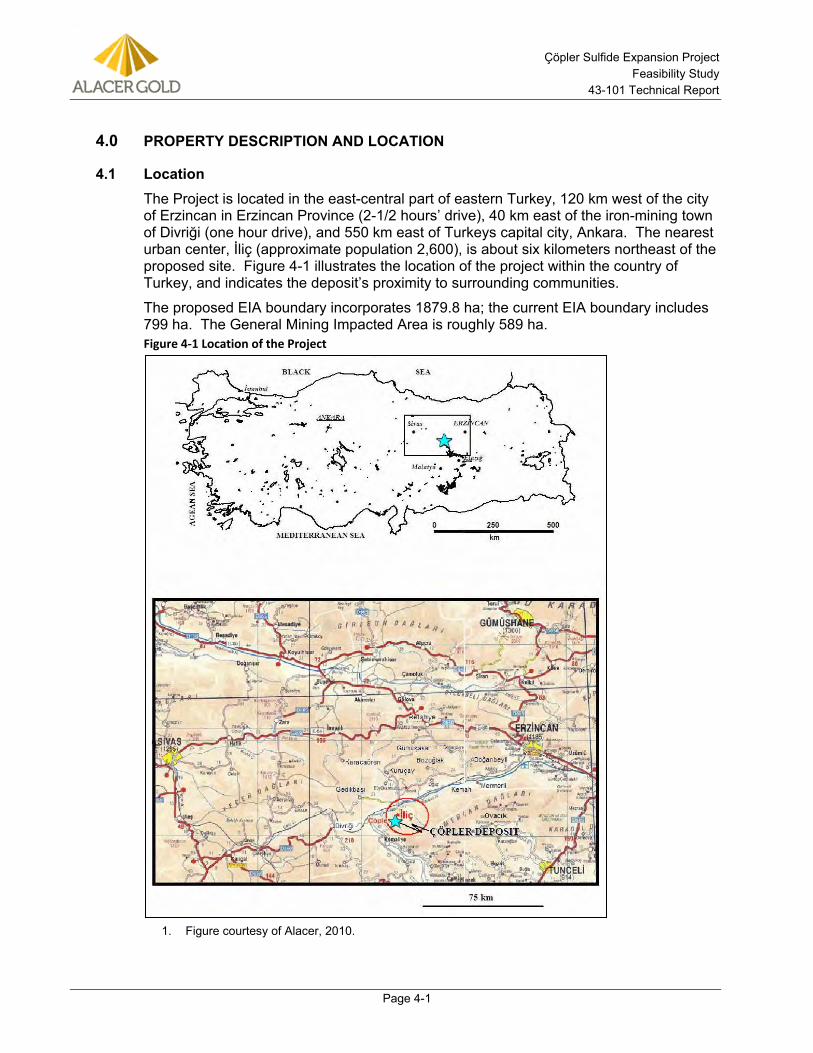
Çöpler Sulfide Expansion Project Feasibility Study
43-101 Technical Report
Page 4-1
4.0 PROPERTY DESCRIPTION AND LOCATION
4.1 Location The Project is located in the east-central part of eastern Turkey, 120 km west of the city of Erzincan in Erzincan Province (2-1/2 hours’ drive), 40 km east of the iron-mining town of Divriği (one hour drive), and 550 km east of Turkeys capital city, Ankara. The nearest urban center, İliç (approximate population 2,600), is about six kilometers northeast of the proposed site. Figure 4-1 illustrates the location of the project within the country of Turkey, and indicates the deposit’s proximity to surrounding communities.
The proposed EIA boundary incorporates 1879.8 ha; the current EIA boundary includes 799 ha. The General Mining Impacted Area is roughly 589 ha. Figure 4-1 Location of the Project
Figure courtesy of Alacer, 2010. 1.
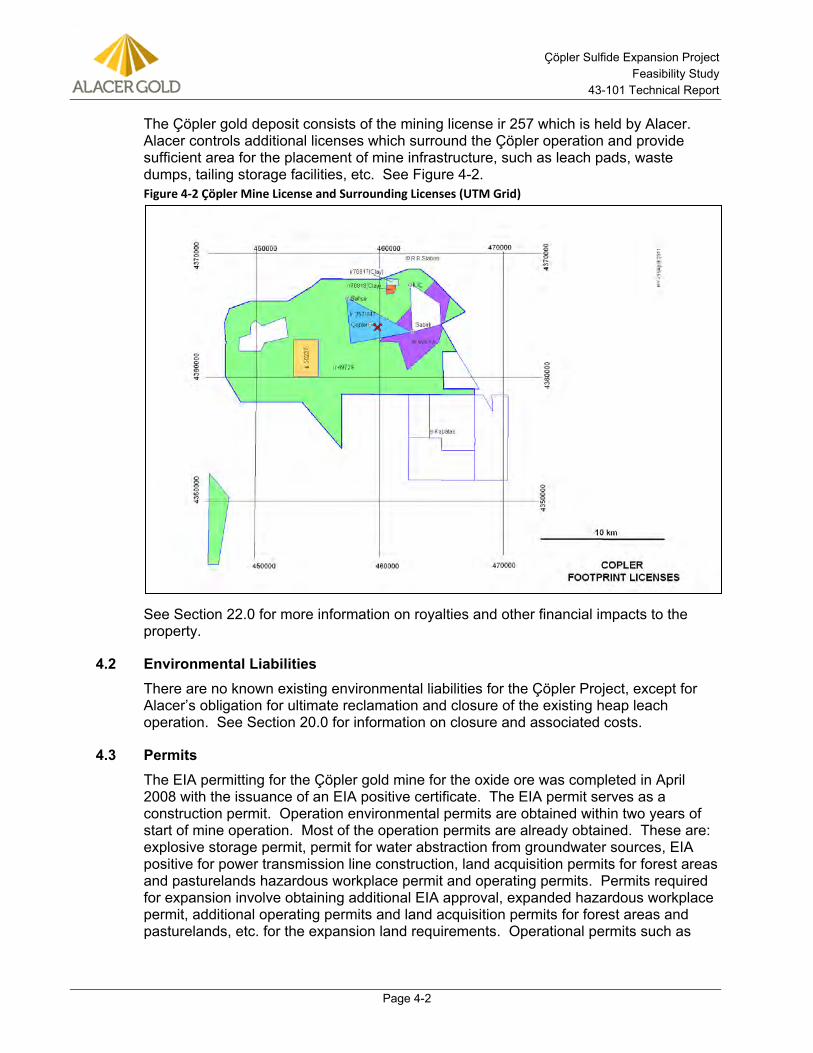
Çöpler Sulfide Expansion Project Feasibility Study
43-101 Technical Report
Page 4-2
The Çöpler gold deposit consists of the mining license ir 257 which is held by Alacer. Alacer controls additional licenses which surround the Çöpler operation and provide sufficient area for the placement of mine infrastructure, such as leach pads, waste dumps, tailing storage facilities, etc. See Figure 4-2. Figure 4-2 Çöpler Mine License and Surrounding Licenses (UTM Grid)
See Section 22.0 for more information on royalties and other financial impacts to the property.
4.2 Environmental Liabilities There are no known existing environmental liabilities for the Çöpler Project, except for Alacer’s obligation for ultimate reclamation and closure of the existing heap leach operation. See Section 20.0 for information on closure and associated costs.
4.3 Permits The EIA permitting for the Çöpler gold mine for the oxide ore was completed in April 2008 with the issuance of an EIA positive certificate. The EIA permit serves as a construction permit. Operation environmental permits are obtained within two years of start of mine operation. Most of the operation permits are already obtained. These are: explosive storage permit, permit for water abstraction from groundwater sources, EIA positive for power transmission line construction, land acquisition permits for forest areas and pasturelands hazardous workplace permit and operating permits. Permits required for expansion involve obtaining additional EIA approval, expanded hazardous workplace permit, additional operating permits and land acquisition permits for forest areas and pasturelands, etc. for the expansion land requirements. Operational permits such as

Çöpler Sulfide Expansion Project Feasibility Study
43-101 Technical Report
Page 4-3
wastewater discharge, air emissions, hazardous waste etc. can only be obtained after the construction phase ends.
Additional EIA studies conducted and environmental permits received for Çöpler Gold Mine since the start of the gold mine operations are as follows:
• EIA permit dated April 10th 2012 for the operation of mobile crushing plant.
• EIA permit dated May 17th 2012 for the capacity expansion involving (i) increasing operation rate to 23,500 tpd; (ii) increasing Çöpler waste rock dump footprint area; (iii) adding SART plant to the process in order to decrease the cyanide consumption due to the high copper content of the ore.
The Çöpler sulfide resources expansion will trigger EIA Regulation Annex-1 requirements which will require preparation of a comprehensive EIA report. The permitting process was initiated with the submission of the Project Description Report (PDR) on April 3, 2014.
Çöpler Sulfide Expansion Project Feasibility Study
43-101 Technical Report
Page 5-1
5.0 ACCESSIBILITY, CLIMATE, LOCAL RESOURCES, INFRASTRUCTURE AND PHYSIOGRAPHY
5.1 Accessibility The Çöpler mining area is accessed from the main paved highway between Erzincan and Kemaliye. The highway passes 3 km north of the nearby village of İliç where it crosses the Karasu River via a bridge. The bridge is a major reinforced concrete and steel structure, capable of handling large Turkish transport vehicles. The bridge is rated with a capacity for 45 tonne vehicles. From İliç there is an additional 4.5 km of graded dirt road to reach the Çöpler mining site. Work has been completed to upgrade sections of road from the bridge to just east of the İliç railway station and to construct a road bypassing İliç to the project site. This roadwork provides improved access for mine and construction equipment.
The Ankara to Erzincan railway line, operated by the Turkish State Railway Company, (TCDD), runs parallel to the south bank of the Karasu River and passes within 2 km south of the site at a point between the train stations at İliç and Bağıştaş. The railway line connects the site with Ankara and the west as well as with sea ports to the north on the Black Sea, and to the south on the Mediterranean Sea. Overnight passenger sleeper cars are available to and from Ankara.
There are ongoing constructions of Bağıştaş I Hydroelectric Power Plant (HEPP). The embankment of Bağıştaş I Dam will cover some portion of the existing highway, railroad, and railroad station. These will be relocated before dam construction is completed. Construction routes for the railroad and highway are projected to be between the new Çöpler village and mine site. The current mine access road will be connected to the relocated road. The bridge on north-east side of İliç was relocated to further east of the embankment.
There are regular commercial airline flights from Istanbul and Ankara to Erzincan, Erzurum, Malatya, Elazığ and Sivas. Driving from these cities to the Project site takes about 2 to 4 hours on paved highways. Driving from Ankara to the site takes about 8 hours.
The process plant area is essentially bounded by longitudinal lines E460,500 to E 460,000 (east to west) and latitude lines N4,366,000 to N4,364,750 (north to south) as depicted on the latest revision of the Plot Plan Drawing included in Çöpler Sulfide Expansion Project Definitive Feasibility Report (Jacobs, 2014a). An overall Site Plan that depicts the proposed Sulfide Project and the associated Tailings Storage Facility, as well as the existing Heap Leach facility, waste disposal areas and pit limits, is also included in Çöpler Sulfide Expansion Project Definitive Feasibility Report (Jacobs, 2014a).
5.2 Local Resources and Infrastructure The town of İliç has a population of approximately 2,600 inhabitants and is located 6 km northeast of the site. The town has a hospital, schools, municipal offices, fire station, a police station and a Gendarmerie post. The primary economic activity in the region is sheep herding for wool, meat and dairy products. Other agricultural activities include bee keeping for honey production and, along the Karasu River, some wheat farming. Additionally, there is some light manufacturing and grain milling performed in İliç.
Çöpler Sulfide Expansion Project Feasibility Study
43-101 Technical Report
Page 5-2
The workforce for the Alacer exploration programs has primarily consisted of residents drawn from the local communities of Çöpler, İliç, and Sabırlı. Unemployment in the region is high. Education through the 8th grade is compulsory in Turkey. Secondary and technical schools are available free of charge to those individuals who choose to continue. There are numerous, government funded universities and private colleges in the country. Consequently, the local and regional population has a sufficiently large workforce with the necessary basic skills and general education level suitable for employment at the project.
See Section 4.0 for information on sufficiency of surface rights for mining operations.
Turkish telecommunications are good and up to European standards. High speed, fiber-optic internet access has been installed at the mine site.
Electrical power at 380V, 50Hz, is available in İliç and at the site, but the line capacity is not sufficient to handle the industrial loads required by the Project. A new, 40 km, 154kV power line from the substation at Divriği to the site has been installed, is currently operational and will provide sufficient electrical supply.
Sufficient water supply exists to support the heap leach operation. Ground water resources have been identified about 2 km north of the Project site near the Karasu River and two production water wells have been constructed. There are ongoing constructions of Bağıştaş I Hydroelectric Power Plant (HEPP) and Dam and Bağıştaş II regulator on Karasu River. Bağıştaş I Dam’s reservoir will be at a distance of 35 m to 50 m to the new Çöpler settlement. Due to the construction of this dam, two of the wells were relocated.
Fresh water is being supplied by three existing wells to the site at a rate of 100 liters per second. The existing wells may not be adequate to support the requirements of the combined existing and new facility. Added wells are not in the Jacobs scope or estimate. This work is part of the Owner’s cost.
5.3 Climate and Environmental Conditions Site climate data was developed during previous studies. No additional climate data was generated for the FS report.
The project area is located in the Eastern Anatolia geographical district of Turkey. The climate is typically continental with wet, cold winters and dry, hot summers. In winter, the night-time temperature can drop to minus 25º C although the average is usually a few degrees below freezing. The July temperature frequently reaches plus 40º C but the climate is usually pleasantly warm outside of these extremes. The average monthly temperature ranges from 3.7 °C for the coldest month of January to 23.9°C for August, the warmest month.
Most precipitation occurs in the winter and spring. The average yearly precipitation in the region was recorded at 366.6 millimeters (mm), with a maximum of 610 mm and a minimum of 210 mm. Snowfall is common during the mid-November to February period, but with little accumulation, if any. Snow depth assessments are based on the Divriği State Meteorological weather station, located 41 km west of the project site, which shows maximum snow pack depths at about 200 mm for 1985.
The frost depth is less than 0.3 m, based on local information from Alacer, with 0.5 m selected as the design frost depth limit.
Çöpler Sulfide Expansion Project Feasibility Study
43-101 Technical Report
Page 5-3
The maximum wind speed recorded at the Divriği station in 2004 ranges from 15 to 25 meters per second (m/s) with variable directions mainly from the north, south and east.
5.4 Physiography The Çöpler Deposit is located in a broad east-west oriented valley at an altitude of 1,100 to 1,300 m. The valley is surrounded by limestone-mountains that rise to more than 2,500 m on the north and south sides of the deposit. These mountains are at the western end of the Munzur range that rises to more than 3,300 m between Ovacık and Kemah. The region is sparsely vegetated with semi-arid brush and scrub trees.
The following are the site data developed during previous studies for the design of the Project:
• Latitude 39º 25’ North
• Longitude 38º 32’ East
• Elevation 1150 meters
• Frost Depth 50 mm
• Snow Load 145 kg/m2
• Wind Load 40 m/sec, Exposure C
• Earthquake zone 2nd Order, Ao = 0.20
• Atmospheric Pressure (average) 880.5 millibar
• Maximum Design Temperature (+) 40ºC
• Minimum Design Temperature (-) 25ºC
• Annual Rainfall 367 mm
• Maximum Snowfall Depth 500 mm (Estimated)
• Design Maximum Rainfall, 24 hours 76 mm
Çöpler Sulfide Expansion Project Feasibility Study
43-101 Technical Report
Page 6-1
6.0 HISTORY
6.1 General History The Çöpler area has seen gold and silver mining that dates back at least to Roman times, and possibly earlier, with historic bullion production estimated at about 50,000 ounces of gold. A copper-rich slag pile of approximately 25,000 tonnes is located at the western edge of the district and is believed to be waste from ancient bullion production. Although the district contains copper mineralization, there appears to have been little production targeting copper. There are several additional minor slag piles scattered around the property thought to be from ancient, small-scale gold and byproduct copper production.
The Turkish Geological Survey (“MTA”) carried out regional exploration work in the early 1960s that was predominately confined to mapping. During 1964, a local Turkish company started manganese mining that produced about 73,000 tonnes of manganese ore until closing in 1973. Unimangan acquired the property in January 1979 and restarted manganese production the same year producing about 1,000 to 5,000 tonnes of ore per year until 1992. Total production from the Manganese Mine Zone, during this period, is estimated to have been 15,000 t of ore at a grade of between 43%and 51% manganese.
The Çöpler prospect was first identified by the predecessor company of Alacer, Anatolia Minerals Development Ltd (Anatolia) in 1998 as part of a literature review of Turkish mineral properties and as a follow-up of a gossan investigation program in the district. In September 1998, Anatolia identified several porphyry style gold-copper prospects in east-central Turkey and applied for an exploration license totaling over 100,000 ha covering these prospects. This work was based upon the earlier work by MTA in the 1960s. During this effort, Anatolia delineated a prospect in the Çöpler basin formed by an altered and mineralized granodiorite, intruded metasediments and limestone. This prospect and the supporting work was the basis for a joint venture agreement for exploration with Rio Tinto.
During the period of the joint venture, Anatolia and Rio Tinto explored and drilled the Çöpler deposits and developed resources in three mineralized zones: the Main, Manganese, and Marble Zones. In January of 2004, Anatolia acquired Rio Tinto’s joint venture interest and the interest of Unimangan. The property was under Anatolia’s sole control until the joint venture with Lydia was executed in August 2009.
Anatolia merged with Avoca Resources Limited, an Australian company, to form Alacer Gold Corporation in February of 2010.
In October 2013, Alacer sold its Australian Business Unit (which included the Higginsville and South Kalgoorlie Operations) to a subsidiary of Metals X Limited, an Australian public company.
In most cases the company will be referred to as Alacer even though it may have been Alacer or Anatolia at the time referenced in the report.
6.2 Exploration and Development History Exploration of the Çöpler property has been conducted by Anatolia and then Alacer since September 1998. The principal exploration technique has been RC and diamond
Çöpler Sulfide Expansion Project Feasibility Study
43-101 Technical Report
Page 6-2
core drilling, conducted in a number of campaigns starting in 2000. Initially, exploration was directed at evaluating the economic potential of the near-surface oxide mineralization for the recovery of gold by either heap leaching or conventional milling techniques. This program was successful in demonstrating that heap leaching was commercially viable, gold production commenced in December 2010 and gold is presently being produced from the property by this method.
Since 2000, when Anatolia acquired the exploration license over the Çöpler area, a number of Canadian National Instrument 43-101 Technical Reports have been filed with the Canadian Securities Administrators. Various Mineral Resource and Mineral Reserve estimates have been completed to support the Technical Reports. A partial listing of the reports is:
• Watts, Griffis and McQuat Limited, Update of the Geology and Mineral Resources of the Çöpler Prospect, May 1, 2003;
• Independent Mining Consultants, Inc., Çöpler Project Resource Estimate Technical Report, October 19, 2005;
• Marek, J M, Pennstrom, W J, Reynolds, T, Technical Report Çöpler Gold Project Feasibility Study, May 30, 2006 (Samuel Engineering, Inc.);
• Marek, J M, Moores, R C, Pennstrom, W J, Reynolds, T, Technical Report Çöpler Gold Project, March 2, 2007 as amended 30 April 2007 (Independent Mining Consultants, Inc.);
• Easton, C L, Pennstrom, W J, Malhotra, D, Moores, R C, Marek, J M, Çöpler Gold Project East Central Turkey Preliminary Assessment Sulfide Ore Processing, February 4, 2008;
• Marek, J M, Benbow, R D, Pennstrom, W J, Technical Report Çöpler Gold Project East Central Turkey, December 5, 2008 (Amended and Restated; supersedes 11.07.2008 version).
• Altman, K, Liskowich, M, Mukhopadhyay, D K, Shoemaker, S J, Çöpler Sulfide Expansion Project Pre-Feasibility Study, March 27 2011.
Altman, K, Bascombe, L, Benbow, R, Mach, L, Shoemaker, SJ, Çöpler Resource Update, Erzincan Province Turkey, March 30 2012.
6.3 Production History Modern gold production at the Ҫӧpler mine commenced in 2010 as a heap leach operation producing an average of 19,500 tonnes per day. As of January 1, 2014 over 22 million tonnes of oxide ore at an average grade of 1.63 g/t has been delivered to the heap leach pad for gold recovery. The Ҫӧpler mine has produced over 500,000 ounces since 2010. Table 6-1 details the annual production figures for the Ҫӧpler mine.
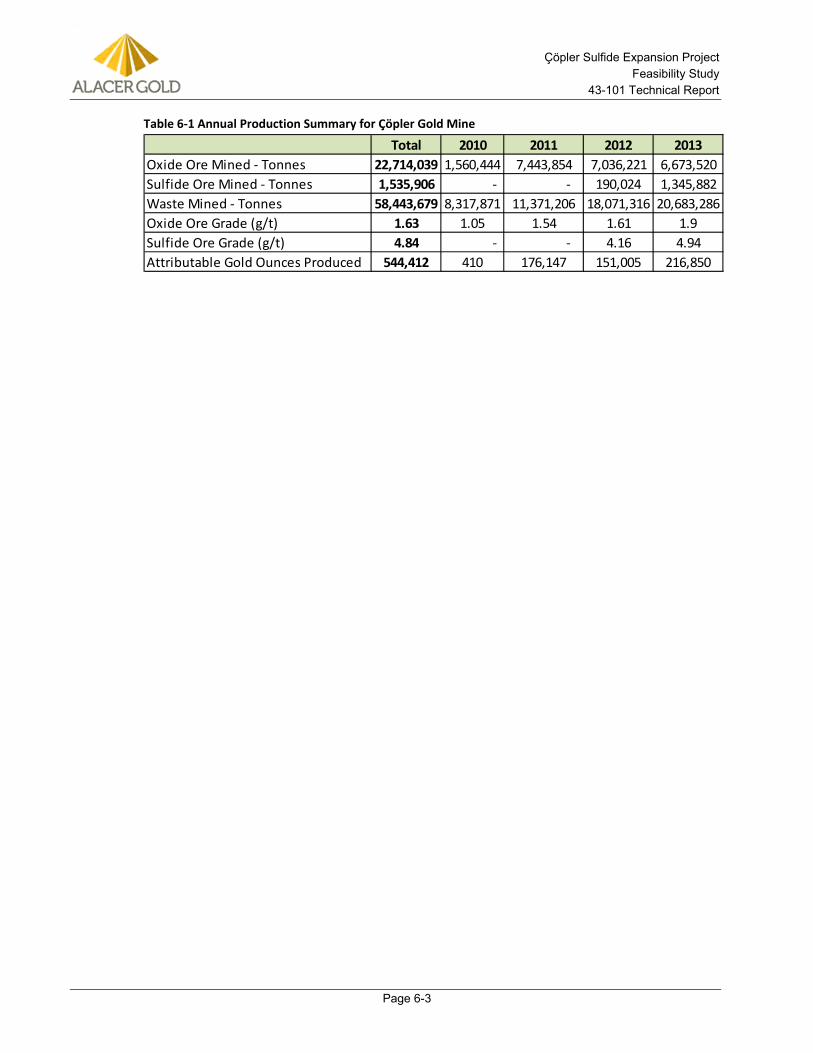
Çöpler Sulfide Expansion Project Feasibility Study
43-101 Technical Report
Page 6-3
Table 6-1 Annual Production Summary for Ҫӧpler Gold Mine
Total 2010 2011 2012 2013Oxide Ore Mined - Tonnes 22,714,039 1,560,444 7,443,854 7,036,221 6,673,520Sulfide Ore Mined - Tonnes 1,535,906 - - 190,024 1,345,882Waste Mined - Tonnes 58,443,679 8,317,871 11,371,206 18,071,316 20,683,286Oxide Ore Grade (g/t) 1.63 1.05 1.54 1.61 1.9Sulfide Ore Grade (g/t) 4.84 - - 4.16 4.94Attributable Gold Ounces Produced 544,412 410 176,147 151,005 216,850
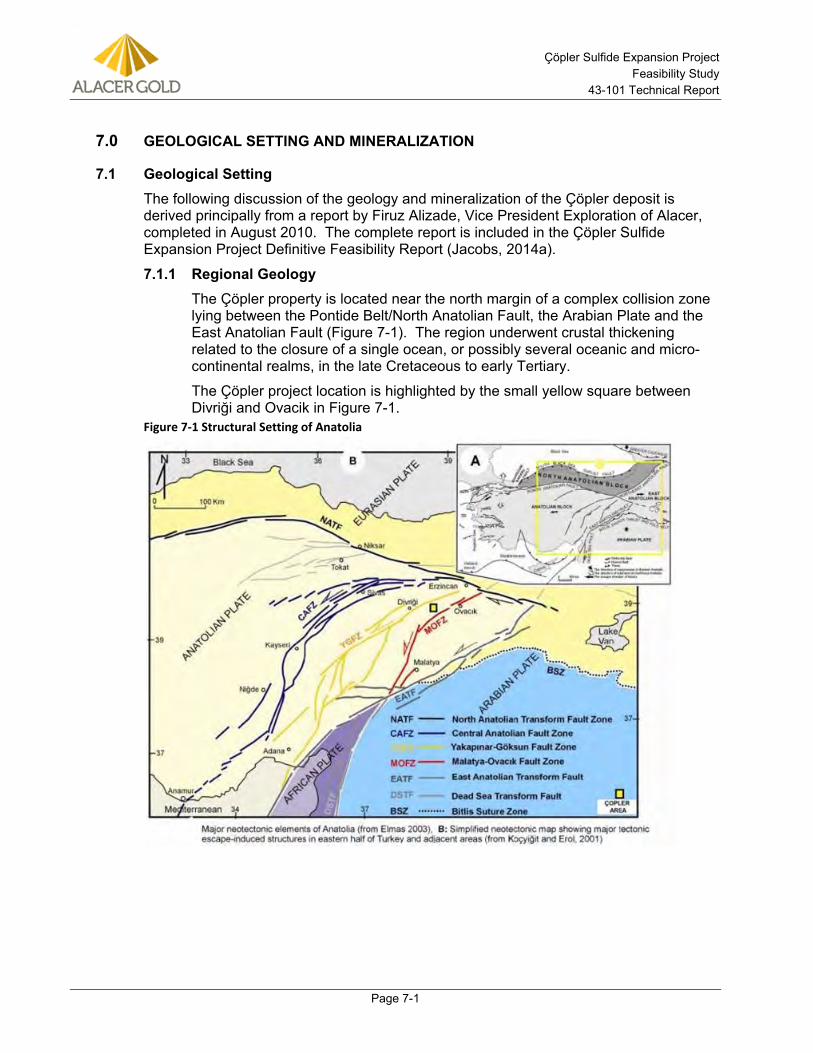
Çöpler Sulfide Expansion Project Feasibility Study
43-101 Technical Report
Page 7-1
7.0 GEOLOGICAL SETTING AND MINERALIZATION
7.1 Geological Setting The following discussion of the geology and mineralization of the Çöpler deposit is derived principally from a report by Firuz Alizade, Vice President Exploration of Alacer, completed in August 2010. The complete report is included in the Çöpler Sulfide Expansion Project Definitive Feasibility Report (Jacobs, 2014a).
Regional Geology 7.1.1The Çöpler property is located near the north margin of a complex collision zone lying between the Pontide Belt/North Anatolian Fault, the Arabian Plate and the East Anatolian Fault (Figure 7-1). The region underwent crustal thickening related to the closure of a single ocean, or possibly several oceanic and micro-continental realms, in the late Cretaceous to early Tertiary.
The Çöpler project location is highlighted by the small yellow square between Divriği and Ovacik in Figure 7-1.
Figure 7-1 Structural Setting of Anatolia
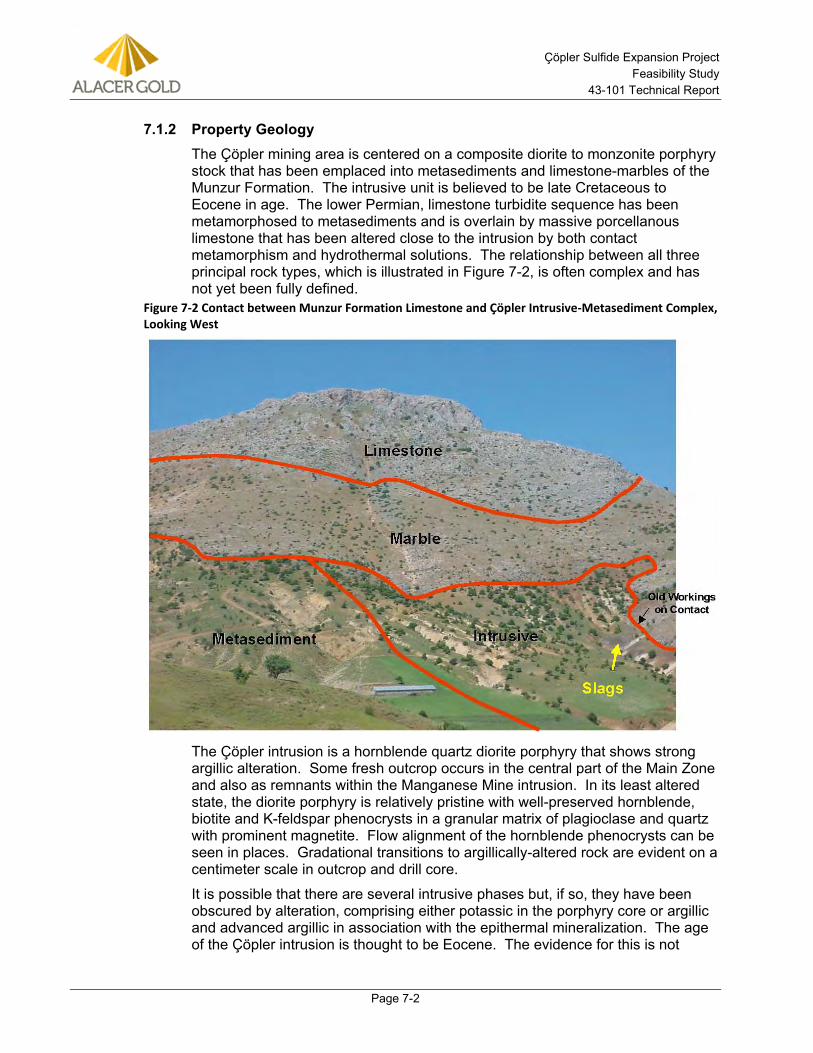
Çöpler Sulfide Expansion Project Feasibility Study
43-101 Technical Report
Page 7-2
Property Geology 7.1.2The Çöpler mining area is centered on a composite diorite to monzonite porphyry stock that has been emplaced into metasediments and limestone-marbles of the Munzur Formation. The intrusive unit is believed to be late Cretaceous to Eocene in age. The lower Permian, limestone turbidite sequence has been metamorphosed to metasediments and is overlain by massive porcellanous limestone that has been altered close to the intrusion by both contact metamorphism and hydrothermal solutions. The relationship between all three principal rock types, which is illustrated in Figure 7-2, is often complex and has not yet been fully defined.
Figure 7-2 Contact between Munzur Formation Limestone and Çöpler Intrusive-Metasediment Complex, Looking West
The Çöpler intrusion is a hornblende quartz diorite porphyry that shows strong argillic alteration. Some fresh outcrop occurs in the central part of the Main Zone and also as remnants within the Manganese Mine intrusion. In its least altered state, the diorite porphyry is relatively pristine with well-preserved hornblende, biotite and K-feldspar phenocrysts in a granular matrix of plagioclase and quartz with prominent magnetite. Flow alignment of the hornblende phenocrysts can be seen in places. Gradational transitions to argillically-altered rock are evident on a centimeter scale in outcrop and drill core.
It is possible that there are several intrusive phases but, if so, they have been obscured by alteration, comprising either potassic in the porphyry core or argillic and advanced argillic in association with the epithermal mineralization. The age of the Çöpler intrusion is thought to be Eocene. The evidence for this is not
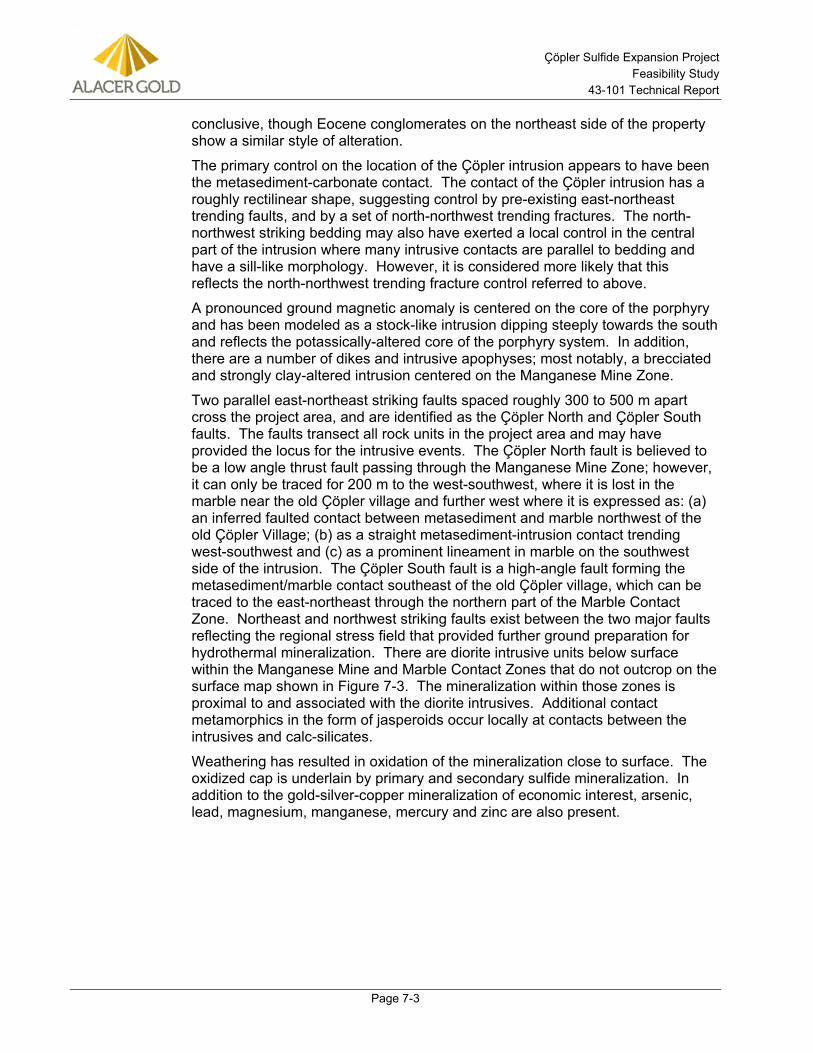
Çöpler Sulfide Expansion Project Feasibility Study
43-101 Technical Report
Page 7-3
conclusive, though Eocene conglomerates on the northeast side of the property show a similar style of alteration.
The primary control on the location of the Çöpler intrusion appears to have been the metasediment-carbonate contact. The contact of the Çöpler intrusion has a roughly rectilinear shape, suggesting control by pre-existing east-northeast trending faults, and by a set of north-northwest trending fractures. The north-northwest striking bedding may also have exerted a local control in the central part of the intrusion where many intrusive contacts are parallel to bedding and have a sill-like morphology. However, it is considered more likely that this reflects the north-northwest trending fracture control referred to above.
A pronounced ground magnetic anomaly is centered on the core of the porphyry and has been modeled as a stock-like intrusion dipping steeply towards the south and reflects the potassically-altered core of the porphyry system. In addition, there are a number of dikes and intrusive apophyses; most notably, a brecciated and strongly clay-altered intrusion centered on the Manganese Mine Zone.
Two parallel east-northeast striking faults spaced roughly 300 to 500 m apart cross the project area, and are identified as the Çöpler North and Çöpler South faults. The faults transect all rock units in the project area and may have provided the locus for the intrusive events. The Çöpler North fault is believed to be a low angle thrust fault passing through the Manganese Mine Zone; however, it can only be traced for 200 m to the west-southwest, where it is lost in the marble near the old Çöpler village and further west where it is expressed as: (a) an inferred faulted contact between metasediment and marble northwest of the old Çöpler Village; (b) as a straight metasediment-intrusion contact trending west-southwest and (c) as a prominent lineament in marble on the southwest side of the intrusion. The Çöpler South fault is a high-angle fault forming the metasediment/marble contact southeast of the old Çöpler village, which can be traced to the east-northeast through the northern part of the Marble Contact Zone. Northeast and northwest striking faults exist between the two major faults reflecting the regional stress field that provided further ground preparation for hydrothermal mineralization. There are diorite intrusive units below surface within the Manganese Mine and Marble Contact Zones that do not outcrop on the surface map shown in Figure 7-3. The mineralization within those zones is proximal to and associated with the diorite intrusives. Additional contact metamorphics in the form of jasperoids occur locally at contacts between the intrusives and calc-silicates.
Weathering has resulted in oxidation of the mineralization close to surface. The oxidized cap is underlain by primary and secondary sulfide mineralization. In addition to the gold-silver-copper mineralization of economic interest, arsenic, lead, magnesium, manganese, mercury and zinc are also present.
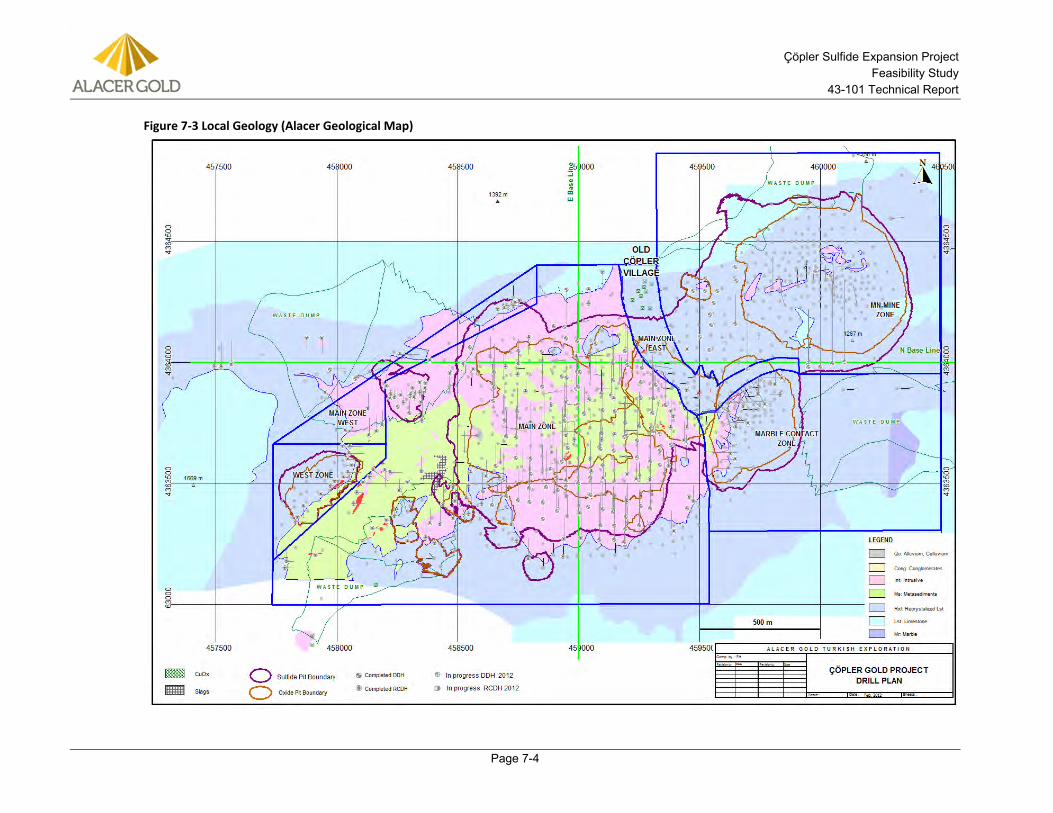
Çöpler Sulfide Expansion Project Feasibility Study
43-101 Technical Report
Page 7-4
Figure 7-3 Local Geology (Alacer Geological Map)
Çöpler Sulfide Expansion Project Feasibility Study
43-101 Technical Report
Page 7-5
7.2 Mineralization Epithermal gold mineralization at Çöpler occurs within structurally-controlled zones of stockwork and sheeted veins hosted by a Tertiary diorite intrusive and an older metasediment complex, and as contact-type mineralization along the intrusive-metasediment fault contact with the Munzur Formation limestones. The epithermal mineralization may be related to porphyry copper-style mineralization intersected by several of the drill holes.
Gold mineralization at Çöpler exhibits five principal styles:
1. Stockwork quartz veined metasedimentary rocks and diorite with disseminated marcasite, pyrite, arsenopyrite and tennantite-tetrahedrite. Oxidation has resulted in the formation of goethitic/jarosite assemblages hosting fine-grained gold (Main Zone).
2. Clay-altered, brecciated and carbonatized diorite with rhodochrosite veinlets and disseminated marcasite, pyrite, realgar, orpiment, tennantite-tetrahedrite, other sulfosalts, sphalerite and galena (Manganese Mine Zone).
3. Massive marcasite-pyrite replacement bodies along marble and faulted contacts (Main Zone, Main Zone East, Main Zone West, Marble Contact Zone, West Zone and Manganese Mine Zone).
4. Massive jarositic gossan (Marble Contact Zone, Main Zone Contacts).
5. Massive manganese oxide (Manganese Mine Zone).
Oxidation of the above mineralization types has resulted in the formation of gossans, massive manganese oxide and goethitic/jarositic assemblages hosting fine-grained free gold.
The Çöpler mining area can be sub-divided into six deposits. The mineralization occurrences within each area are summarized below and the locations are detailed in Figure 7-3 above.
Main Zone 7.2.1The Main Zone lies in the west portion of the project area and occupies a footprint of approximately 750 m north to south by 1000 m east to west. Typical depths of mineralization range from surface to +200 m in depth. Disseminated quartz-pyrite-arsenopyrite epithermal veinlets are primarily hosted in diorite and metasediments with some marble mineralization on the eastern margin of the zone. Oxidation has occurred, and oxide mineralization occurs from near surface to depths of approximately 40 m, with the thickest development over ridges and thinning in the intervening valleys.
Minor volumes of massive sulfide pyrite mineralization occur within the Main Zone.
Manganese Mine Zone 7.2.2The Manganese Mine Zone occupies the eastern end of the Çöpler mining area. The zone is approximately 650 m wide from north to south by approximately 650 m in the east to west direction. The pre-mining surface expression of this area consists predominately of marble. A moderately sized intrusion of diorite
Çöpler Sulfide Expansion Project Feasibility Study
43-101 Technical Report
Page 7-6
occurs sub-surface. A large proportion of the Manganese Mine Zone mineralization is associated with the contact between this diorite and the surrounding marble. Mineralization ranges from surface to approximately 400 m deep.
Free gold mineralization occurs in the marble with minimal associated sulfides. Disseminated quartz-sulfide mineralization occurs in clay-altered and brecciated diorites as well as locally carbonate-altered diorite. Moderate volumes of massive sulfide pyrite mineralization occur within the Manganese Mine Zone. It appears that “leachable” mineralization is a combination of free gold in marble and supergene oxidized mineralization in both marble and diorite. Leachable oxide mineralization occurs to over 200 m in depth.
Main Zone East 7.2.3The Main Zone East represents the portion of the resource which lies between the Manganese Mine Zone and Main Zone. The geology in this area is typified by narrow, weakly to moderately-mineralized gossans located at the contact between the basement metasediments and the overlying marble. It is postulated that the gossan is sourced from the diorite located in the Manganese Mine Zone and has been emplaced along the metasediment marble contact as the diorite has crystallized.
Marble Contact Zone 7.2.4The Marble Contact Zone occurs in the southeastern portion of the project area and is associated with a northeast-striking fault contact between marble on the east and metasediments and intrusives on the west. The geology in this area is typified by large ‘plugs’ of gossan and diorite which have formed at the junctions between large scale faults, where mineralizing fluid flow has been considerable. The width of the Marble Contact Zone is approximately 350 m, and the strike length is 300 m in an east-northeasterly direction. The depth of mineralization ranges from surface to approximately 160 m.
Mineralization occurs as both disseminated sulfides in veinlets and massive sulfide along the marble contact. Oxidation has occurred along the northeast structure resulting in greater depths of oxidized mineralization than in the Main Zone.
West Zone 7.2.5The West Zone occupies the westernmost portion of the project area and is located at the contact between the basement metasediments and the overlying limestone, where a large scale northeast-trending fault is located. Mineralization is present within veinlets containing disseminated sulfides, massive sulfide and oxidized gossan. The West Zone has a strike length of approximately 700 m in a northeasterly direction and is approximately 150 m wide. Multiple narrow ore zones are present sub-parallel to the faulted contact and occur to a depth of approximately 150 m below surface.
Main Zone West 7.2.6Main Zone West is located in the northwest corner of the project area at the contact between diorite, marble and the basement metasediments. The mineralization is hosted within narrow gossans located at the contact and in sub-
Çöpler Sulfide Expansion Project Feasibility Study
43-101 Technical Report
Page 7-7
parallel veinlets containing disseminated sulfides within the marble and metasediments. Main Zone West has a strike length of approximately 750 m and is approximately 75 m wide.
7.3 Structural Geology Northeast to east-trending structures dominate the Çöpler project. The variable northeast-trending Çöpler North and South faults are the most important of the structures crossing the entire property. At least three jasperoid bodies have formed along the Çöpler South Fault, and ground preparation for both the eastern stockwork quartz veinlet zone (in the metasediment) and the western stockwork quartz veinlet zone (in diorite porphyry) is most likely related to the fault.
Numerous small jasperoid bodies are related to an east-west lineament that intersects the Çöpler fault. There is at least one other fault sub-parallel to the Çöpler North Fault that controls manganese mineralization approximately one kilometer northeast of Çöpler.
Copper oxide mineralization in granodiorite porphyry and quartz monzonite porphyry in the northwest corner of the prospect appears to be related to shear zones on this northwesterly trend.
7.4 Hydrogeology The following discussion of the hydrogeology of the Çöpler mine area is based on the hydrogeological report by Golder completed in September 2013 (Golder, 2013b). Golder conducted a hydrogeological investigation of the Çöpler Sulfide Expansion project area in 2012-2013 with the investigation and supporting modeling efforts designed to advance the current understanding of the groundwater system of the mine expansion area. Site selection of additional monitoring wells and piezometers was based on the proposed facility designs and locations in mid-2012, inferred geologic controls (bedrock fracture and fault complexes), and both up-gradient and down-gradient positions for the proposed mining complex. The discussion below provides up to date information from this program.
Existing Data Evaluation, Field Investigation, Hydrogeologic Conceptual 7.4.1Model Update Hydrogeologic investigations for the Çöpler site have been conducted by prior investigators over the past several years. Prior studies were reviewed during Golder’s hydrogeologic investigation. The basis of Golder’s hydrogeologic study was the understanding of the past hydrogeologic investigations. During the field investigation phase of Golder’s program, particular attention was paid to regional and local fault systems, limestone and marble potential karst development, hydrothermal and supergene alteration assemblages derived by the mineralizing systems, and the construction and development of the Bağıştaş I Dam and reservoir.
The regional geology of the site is a complex structural assemblage of fault-bounded blocks including the following stratigraphy:
• Munzur Limestone – Gray to blue-gray, fine-grained to recrystallized marbles. Much of the unit displays various degrees of karst development. Bedding within the unit is indistinct to massive. This limestone group is also named the Çöpler limestone in the vicinity of the Mineral Resource.
Çöpler Sulfide Expansion Project Feasibility Study
43-101 Technical Report
Page 7-8
• Metasediments – Fine-grained argillite sequences consisting of interbedded siltstones, shale units, marls, and sandy siltstones. The thermal and hydrothermal impact to this unit from the intrusions resulted in the creation of the skarns and hornfels.
• Ophiolitic Mélange – Ophiolitic mélange consists of diabase and serpentinite units. Serpentinaztion is non-uniform and is apparently best developed near major fault zones.
• Diabase – The diabase is located within the upper zone of the ophiolitic mélange. The rock mass consists of green to greenish black. In general, joint surfaces are covered with calcite and iron oxide sealing. In places, the rock mass shows blocky-texture embedded in a fine matrix.
• Diorite to Granodiorite intrusions – Beige and light brown, medium to coarse grained plutons. This formation has intruded into the pre-existing argillites and Munzur limestone. This includes fine- to medium-grained quartz, feldspar and biotite and amphibole minerals.
• Skarn – The skarn zone is developed along the granodiorite contact with the limestone and ophiolitic mélange. This zone was developed under elevated pressure and temperature conditions during intrusion of the granodiorite mass. The skarn units are black to dark brown, silicified, moderately weathered and includes frequent solution cavities.
Monitoring Well Installation Program 7.4.2The 2012 monitoring well installation program was designed to provide groundwater level data, aquifer characteristics, and general lithology permeability values. The program consisted of the installation of 13 monitoring wells, as shown in Table 7-1.
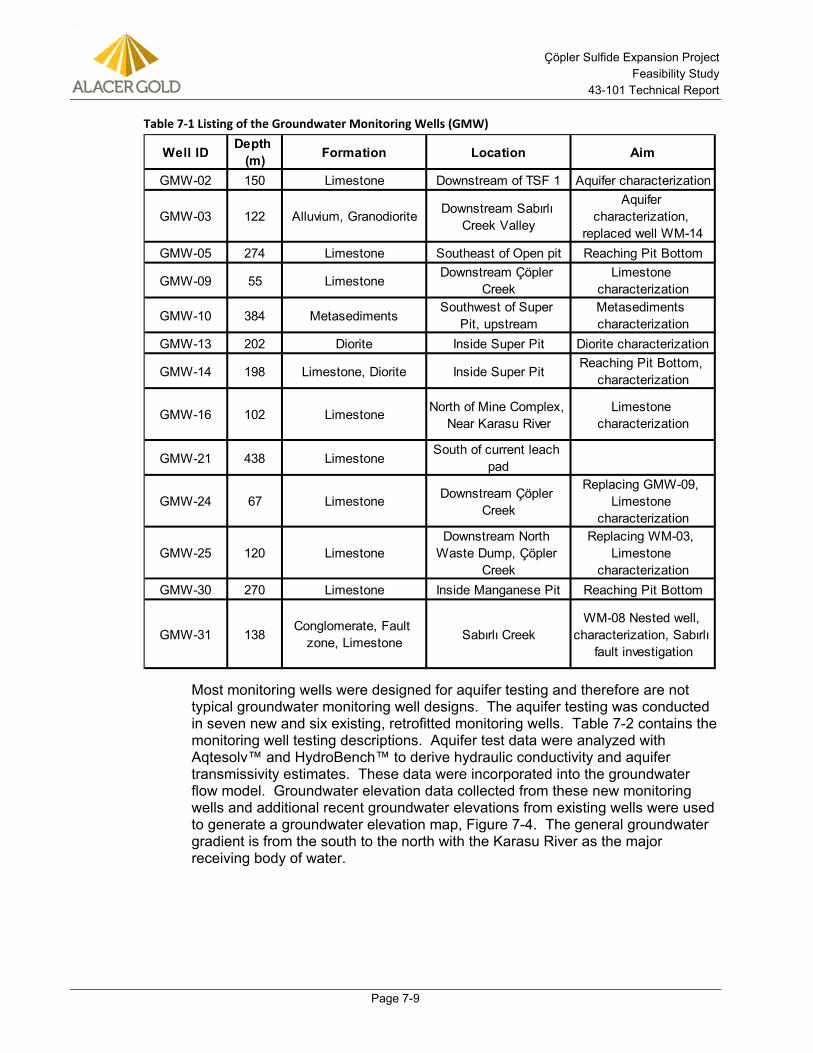
Çöpler Sulfide Expansion Project Feasibility Study
43-101 Technical Report
Page 7-9
Table 7-1 Listing of the Groundwater Monitoring Wells (GMW)
Most monitoring wells were designed for aquifer testing and therefore are not typical groundwater monitoring well designs. The aquifer testing was conducted in seven new and six existing, retrofitted monitoring wells. Table 7-2 contains the monitoring well testing descriptions. Aquifer test data were analyzed with Aqtesolv™ and HydroBench™ to derive hydraulic conductivity and aquifer transmissivity estimates. These data were incorporated into the groundwater flow model. Groundwater elevation data collected from these new monitoring wells and additional recent groundwater elevations from existing wells were used to generate a groundwater elevation map, Figure 7-4. The general groundwater gradient is from the south to the north with the Karasu River as the major receiving body of water.
Well ID Depth (m) Formation Location Aim
GMW-02 150 Limestone Downstream of TSF 1 Aquifer characterization
GMW-03 122 Alluvium, Granodiorite Downstream Sabırlı Creek Valley
Aquifer characterization,
replaced well WM-14GMW-05 274 Limestone Southeast of Open pit Reaching Pit Bottom
GMW-09 55 LimestoneDownstream Çöpler
CreekLimestone
characterization
GMW-10 384 MetasedimentsSouthwest of Super
Pit, upstreamMetasediments characterization
GMW-13 202 Diorite Inside Super Pit Diorite characterization
GMW-14 198 Limestone, Diorite Inside Super PitReaching Pit Bottom,
characterization
GMW-16 102 Limestone North of Mine Complex, Near Karasu River
Limestone characterization
GMW-21 438 LimestoneSouth of current leach
pad
GMW-24 67 Limestone Downstream Çöpler Creek
Replacing GMW-09, Limestone
characterization
GMW-25 120 LimestoneDownstream North
Waste Dump, Çöpler Creek
Replacing WM-03, Limestone
characterizationGMW-30 270 Limestone Inside Manganese Pit Reaching Pit Bottom
GMW-31 138Conglomerate, Fault
zone, Limestone Sabırlı CreekWM-08 Nested well,
characterization, Sabırlı fault investigation
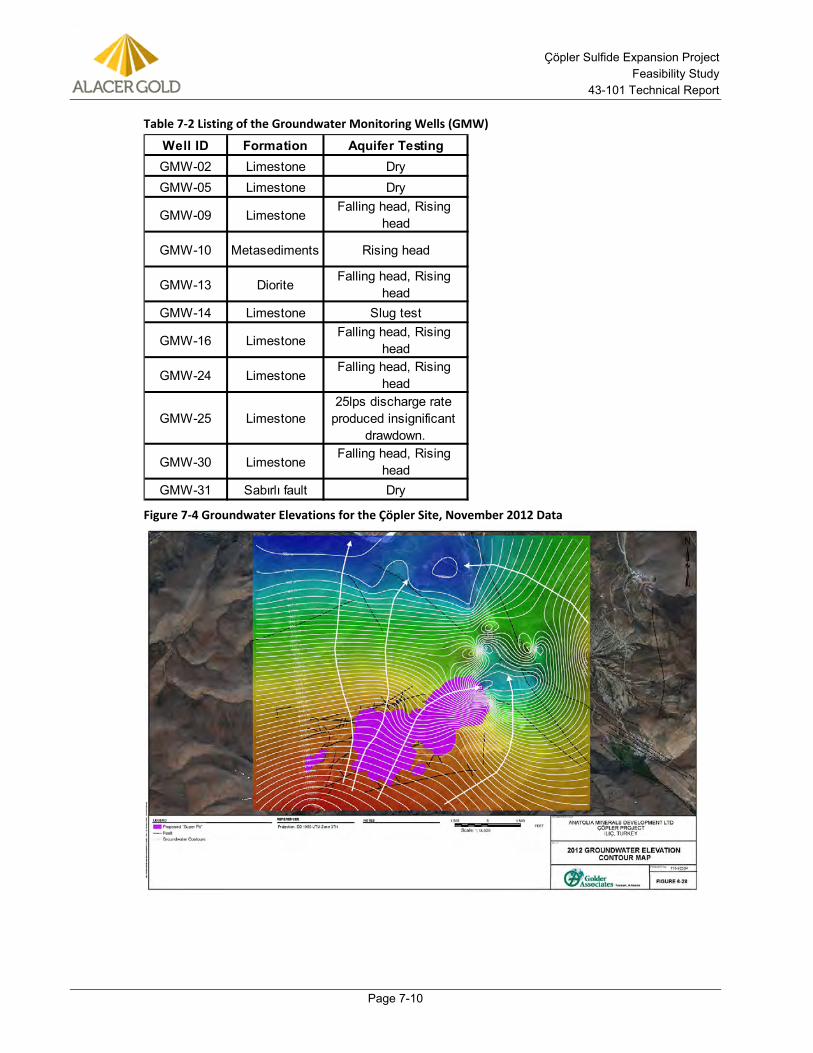
Çöpler Sulfide Expansion Project Feasibility Study
43-101 Technical Report
Page 7-10
Table 7-2 Listing of the Groundwater Monitoring Wells (GMW)
Figure 7-4 Groundwater Elevations for the Çöpler Site, November 2012 Data
Well ID Formation Aquifer TestingGMW-02 Limestone DryGMW-05 Limestone Dry
GMW-09 LimestoneFalling head, Rising
head
GMW-10 Metasediments Rising head
GMW-13 DioriteFalling head, Rising
headGMW-14 Limestone Slug test
GMW-16 LimestoneFalling head, Rising
head
GMW-24 LimestoneFalling head, Rising
head
GMW-25 Limestone25lps discharge rate
produced insignificant drawdown.
GMW-30 LimestoneFalling head, Rising
headGMW-31 Sabırlı fault Dry
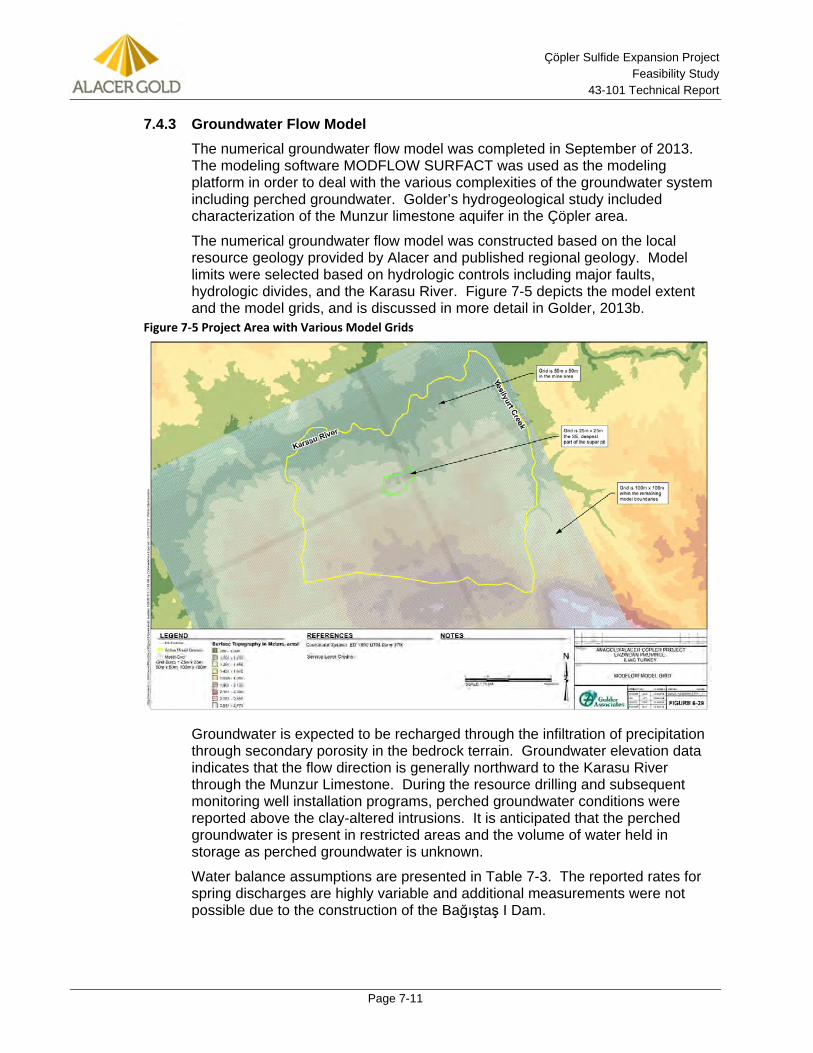
Çöpler Sulfide Expansion Project Feasibility Study
43-101 Technical Report
Page 7-11
Groundwater Flow Model 7.4.3
The numerical groundwater flow model was completed in September of 2013. The modeling software MODFLOW SURFACT was used as the modeling platform in order to deal with the various complexities of the groundwater system including perched groundwater. Golder’s hydrogeological study included characterization of the Munzur limestone aquifer in the Çöpler area.
The numerical groundwater flow model was constructed based on the local resource geology provided by Alacer and published regional geology. Model limits were selected based on hydrologic controls including major faults, hydrologic divides, and the Karasu River. Figure 7-5 depicts the model extent and the model grids, and is discussed in more detail in Golder, 2013b.
Figure 7‐5 Project Area with Various Model Grids
Groundwater is expected to be recharged through the infiltration of precipitation through secondary porosity in the bedrock terrain. Groundwater elevation data indicates that the flow direction is generally northward to the Karasu River through the Munzur Limestone. During the resource drilling and subsequent monitoring well installation programs, perched groundwater conditions were reported above the clay-altered intrusions. It is anticipated that the perched groundwater is present in restricted areas and the volume of water held in storage as perched groundwater is unknown.
Water balance assumptions are presented in Table 7-3. The reported rates for spring discharges are highly variable and additional measurements were not possible due to the construction of the Bağıştaş I Dam.
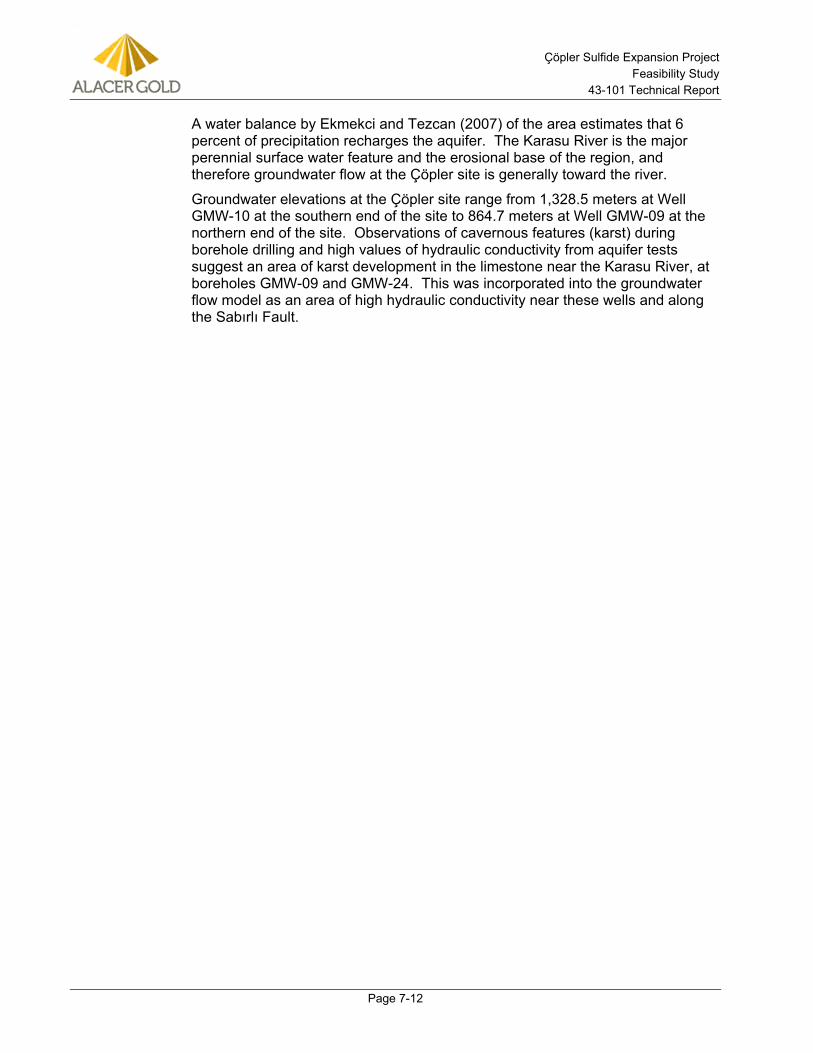
Çöpler Sulfide Expansion Project Feasibility Study
43-101 Technical Report
Page 7-12
A water balance by Ekmekci and Tezcan (2007) of the area estimates that 6 percent of precipitation recharges the aquifer. The Karasu River is the major perennial surface water feature and the erosional base of the region, and therefore groundwater flow at the Çöpler site is generally toward the river.
Groundwater elevations at the Çöpler site range from 1,328.5 meters at Well GMW-10 at the southern end of the site to 864.7 meters at Well GMW-09 at the northern end of the site. Observations of cavernous features (karst) during borehole drilling and high values of hydraulic conductivity from aquifer tests suggest an area of karst development in the limestone near the Karasu River, at boreholes GMW-09 and GMW-24. This was incorporated into the groundwater flow model as an area of high hydraulic conductivity near these wells and along the Sabırlı Fault.
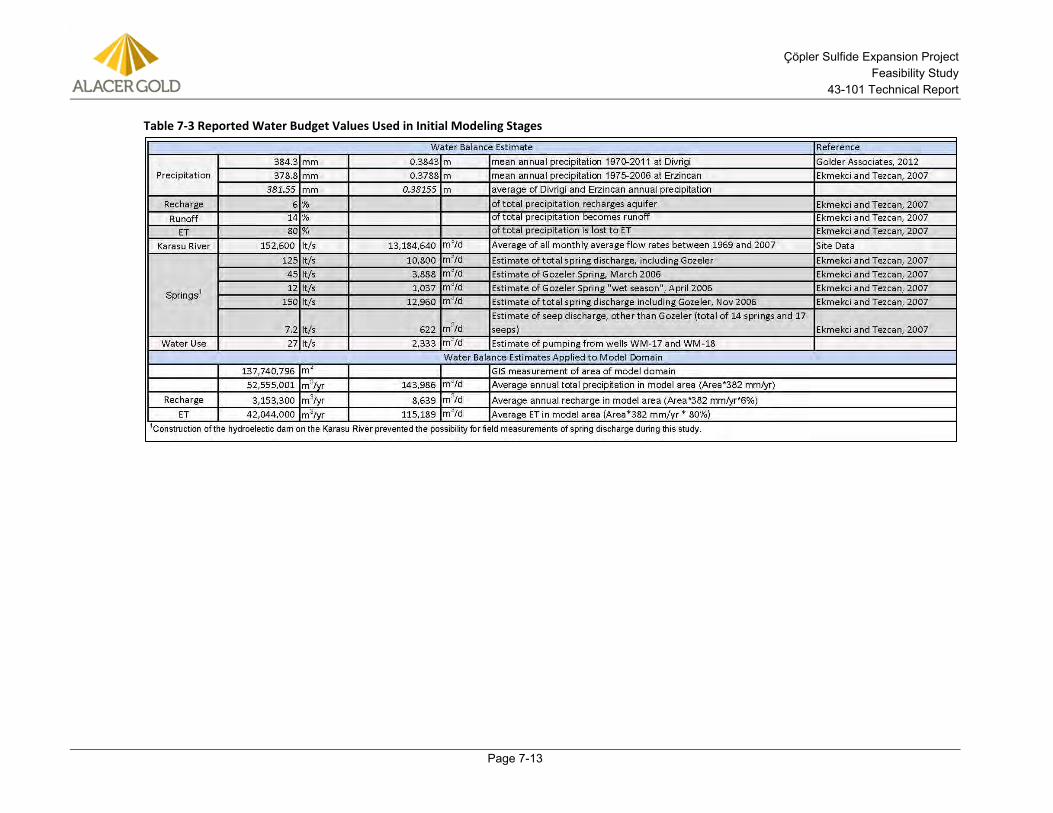
Çöpler Sulfide Expansion Project Feasibility Study
43-101 Technical Report
Page 7-13
Table 7-3 Reported Water Budget Values Used in Initial Modeling Stages
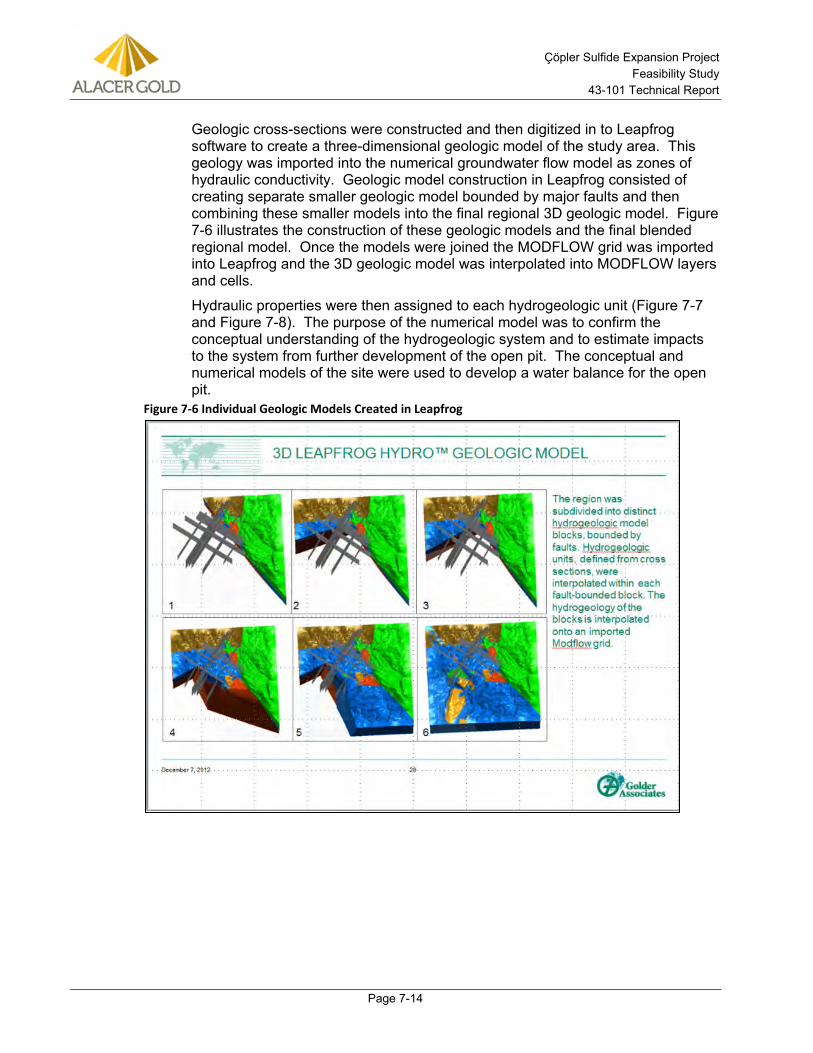
Çöpler Sulfide Expansion Project Feasibility Study
43-101 Technical Report
Page 7-14
Geologic cross-sections were constructed and then digitized in to Leapfrog software to create a three-dimensional geologic model of the study area. This geology was imported into the numerical groundwater flow model as zones of hydraulic conductivity. Geologic model construction in Leapfrog consisted of creating separate smaller geologic model bounded by major faults and then combining these smaller models into the final regional 3D geologic model. Figure 7-6 illustrates the construction of these geologic models and the final blended regional model. Once the models were joined the MODFLOW grid was imported into Leapfrog and the 3D geologic model was interpolated into MODFLOW layers and cells.
Hydraulic properties were then assigned to each hydrogeologic unit (Figure 7-7 and Figure 7-8). The purpose of the numerical model was to confirm the conceptual understanding of the hydrogeologic system and to estimate impacts to the system from further development of the open pit. The conceptual and numerical models of the site were used to develop a water balance for the open pit.
Figure 7-6 Individual Geologic Models Created in Leapfrog
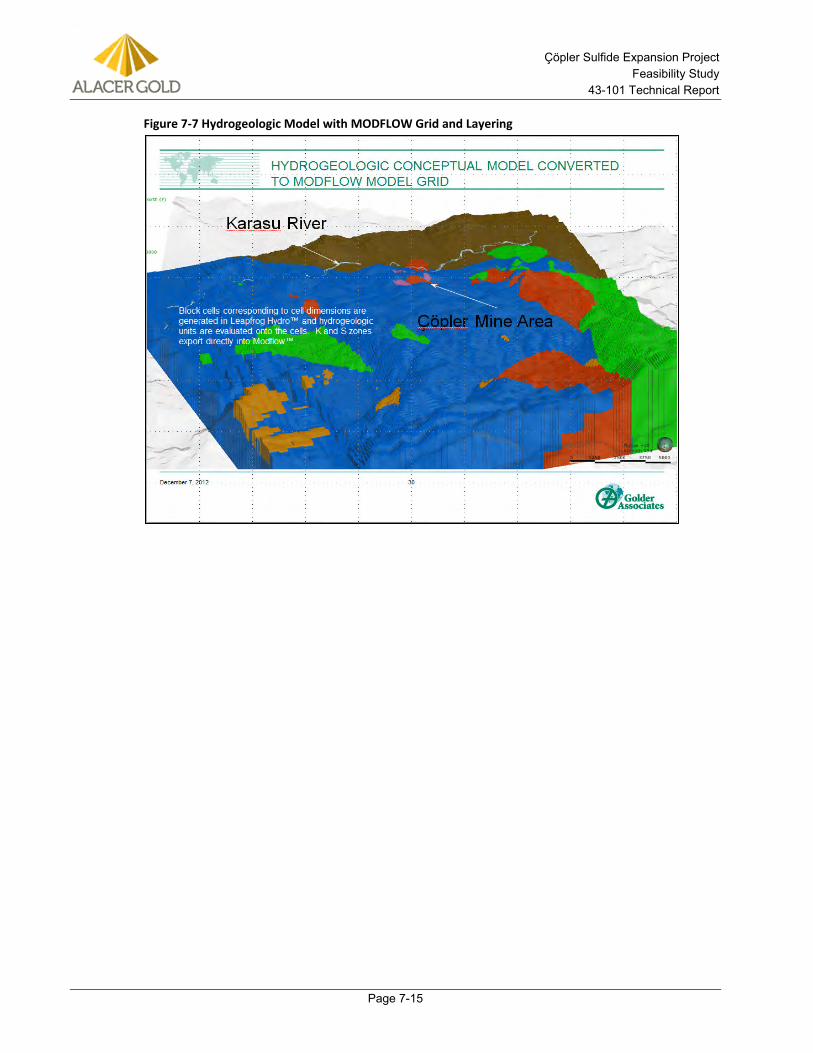
Çöpler Sulfide Expansion Project Feasibility Study
43-101 Technical Report
Page 7-15
Figure 7-7 Hydrogeologic Model with MODFLOW Grid and Layering
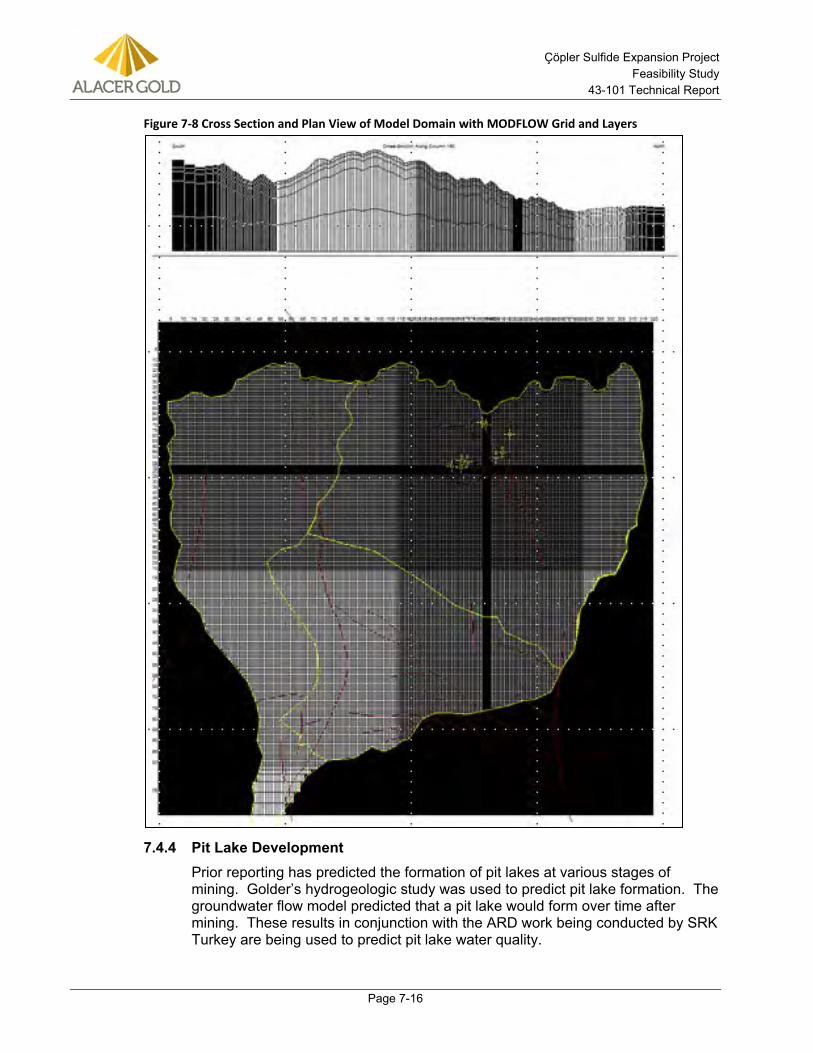
Çöpler Sulfide Expansion Project Feasibility Study
43-101 Technical Report
Page 7-16
Figure 7-8 Cross Section and Plan View of Model Domain with MODFLOW Grid and Layers
Pit Lake Development 7.4.4Prior reporting has predicted the formation of pit lakes at various stages of mining. Golder’s hydrogeologic study was used to predict pit lake formation. The groundwater flow model predicted that a pit lake would form over time after mining. These results in conjunction with the ARD work being conducted by SRK Turkey are being used to predict pit lake water quality.
Çöpler Sulfide Expansion Project Feasibility Study
43-101 Technical Report
Page 8-1
8.0 DEPOSIT TYPES The gold and silver mineralization at Çöpler is epithermal in style and was sourced from a low-grade base metal porphyry intrusive described as a diorite to monzonite stock. The gold mineralization is not a high-sulfidation occurrence as is commonplace in other porphyry copper systems. Two styles of gold mineralization are recognized at Çöpler: 1) quartz-manganese carbonate-barite veinlets; and 2) quartz–pyrite replacements of either limestone or prograde calc-silicate metamorphics, (Alizade, 2010).
The quartz-manganese veinlets represent the majority of mineralized material within the deposit. The gold mineralization is very fine grained and associated with arsenopyrite when in sulfide form (Alizade, 2010).
Çöpler Sulfide Expansion Project Feasibility Study
43-101 Technical Report
Page 9-1
9.0 EXPLORATION The primary exploration effort at Çöpler was conducted by:
• Anatolia during 1998 and 1999 prior to entering into a joint venture with Rio Tinto
• A joint venture between Anatolia and Rio Tinto from 2000 to 2004
• Anatolia from 2004 to 2010, and
• Alacer from Feb 2011 to date
Initial exploration at Çöpler was directed at evaluating the economic potential of the near-surface oxide gold mineralization for recovery by either heap leaching or conventional milling techniques. With the success of this phase and the demonstration that heap leaching was commercially viable, attention turned to evaluating the more refractory underlying sulfide mineralization.
A drilling program specifically designed to investigate the sulfides was commenced late in 2009 and completed early in 2010. Infill resource drilling since then continued in an attempt to define extensions to the current resource and collect additional information within the current resource boundary. Drilling continues to date to better define both the oxide and sulfide portions of the deposit. In 2013, drilling occurred primarily in the western portion of the Main zone and on the northern edge of the Çöpler deposit.
9.1 Surface Mapping and Sampling As outlined within the property history section (Section 6.0), the initial reconnaissance exploration was completed in the early 1960’s by MTA.
Exploration by Anatolia commenced in 1998 and resulted in the discovery of several porphyry style gold-copper deposits in east-central Turkey. Shortly after that time, the joint venture with Rio Tinto resulted in an extensive drill hole exploration program at Çöpler.
Surface mapping and sampling has been undertaken over the life of the property, culminating in a detailed geological map of the Çöpler valley.
9.2 Geophysics Ground and airborne geophysical surveys were conducted at Çöpler from mid-2000 until the end of 2006. Rio Tinto and company geophysicists carried out ground magnetic, complex resistivity/Induced Polarization (IP), time domain IP and Controlled Source Audio-Frequency Magneto-Tellurics (CSAMT) surveys. Fugro Airborne Surveys Ltd. carried out a regional helicopter-borne survey in 2002 which included the Çöpler project area.
Rio Tinto field staff carried out quality control, processing and inversion of most of the data, the exception being the CSAMT data, which was processed by Rio Tinto personnel in Bristol, England. Zonge Engineering, of Tucson, Arizona, USA, also carried out some of the geophysical data inversions.
Physical property measurements were collected regularly on outcrops and diamond core including magnetic susceptibility, resistivity and chargeability. Additionally four samples
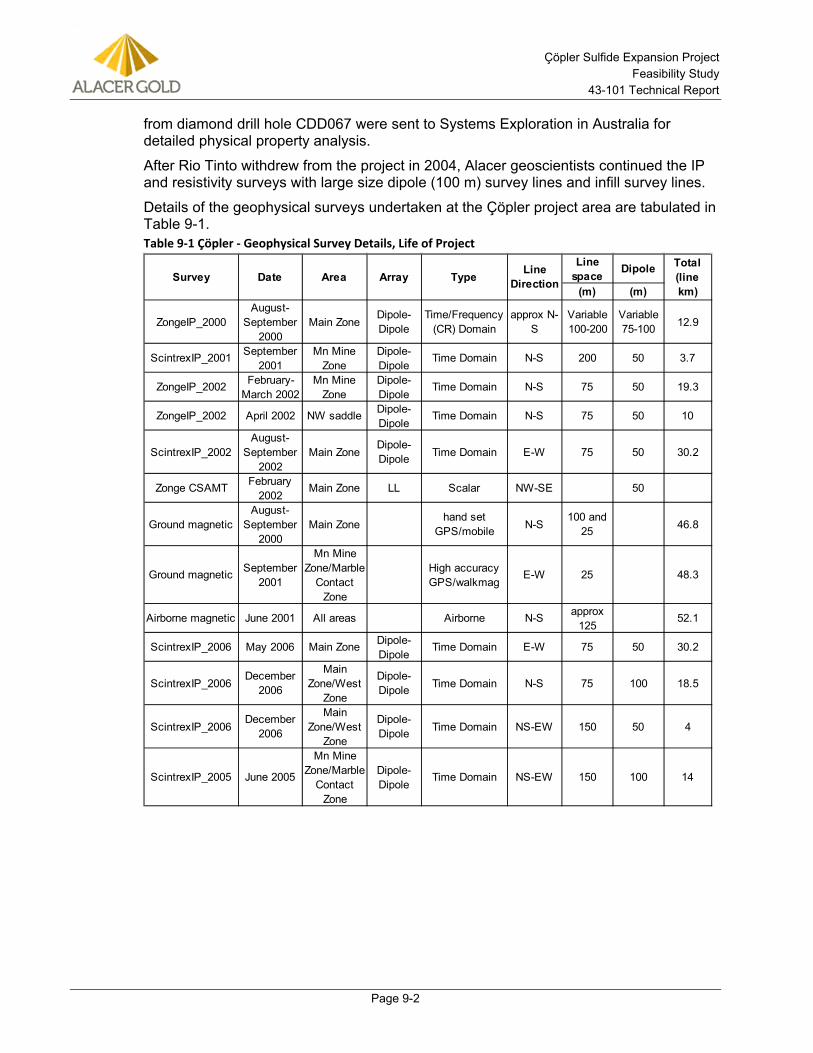
Çöpler Sulfide Expansion Project Feasibility Study
43-101 Technical Report
Page 9-2
from diamond drill hole CDD067 were sent to Systems Exploration in Australia for detailed physical property analysis.
After Rio Tinto withdrew from the project in 2004, Alacer geoscientists continued the IP and resistivity surveys with large size dipole (100 m) survey lines and infill survey lines.
Details of the geophysical surveys undertaken at the Çöpler project area are tabulated in Table 9-1. Table 9-1 Çöpler - Geophysical Survey Details, Life of Project
Line space Dipole
(m) (m)
ZongeIP_2000August-
September 2000
Main ZoneDipole-Dipole
Time/Frequency (CR) Domain
approx N-S
Variable 100-200
Variable 75-100 12.9
ScintrexIP_2001 September 2001
Mn Mine Zone
Dipole-Dipole
Time Domain N-S 200 50 3.7
ZongeIP_2002 February-March 2002
Mn Mine Zone
Dipole-Dipole
Time Domain N-S 75 50 19.3
ZongeIP_2002 April 2002 NW saddle Dipole-Dipole
Time Domain N-S 75 50 10
ScintrexIP_2002August-
September 2002
Main ZoneDipole-Dipole Time Domain E-W 75 50 30.2
Zonge CSAMT February 2002
Main Zone LL Scalar NW-SE 50
Ground magneticAugust-
September 2000
Main Zonehand set
GPS/mobile N-S100 and
25 46.8
Ground magnetic September 2001
Mn Mine Zone/Marble
Contact Zone
High accuracy GPS/walkmag
E-W 25 48.3
Airborne magnetic June 2001 All areas Airborne N-S approx 125
52.1
ScintrexIP_2006 May 2006 Main Zone Dipole-Dipole
Time Domain E-W 75 50 30.2
ScintrexIP_2006December
2006
Main Zone/West
Zone
Dipole-Dipole Time Domain N-S 75 100 18.5
ScintrexIP_2006December
2006
Main Zone/West
Zone
Dipole-Dipole Time Domain NS-EW 150 50 4
ScintrexIP_2005 June 2005
Mn Mine Zone/Marble
Contact Zone
Dipole-Dipole
Time Domain NS-EW 150 100 14
Survey Date Area Array Type Line Direction
Total (line km)
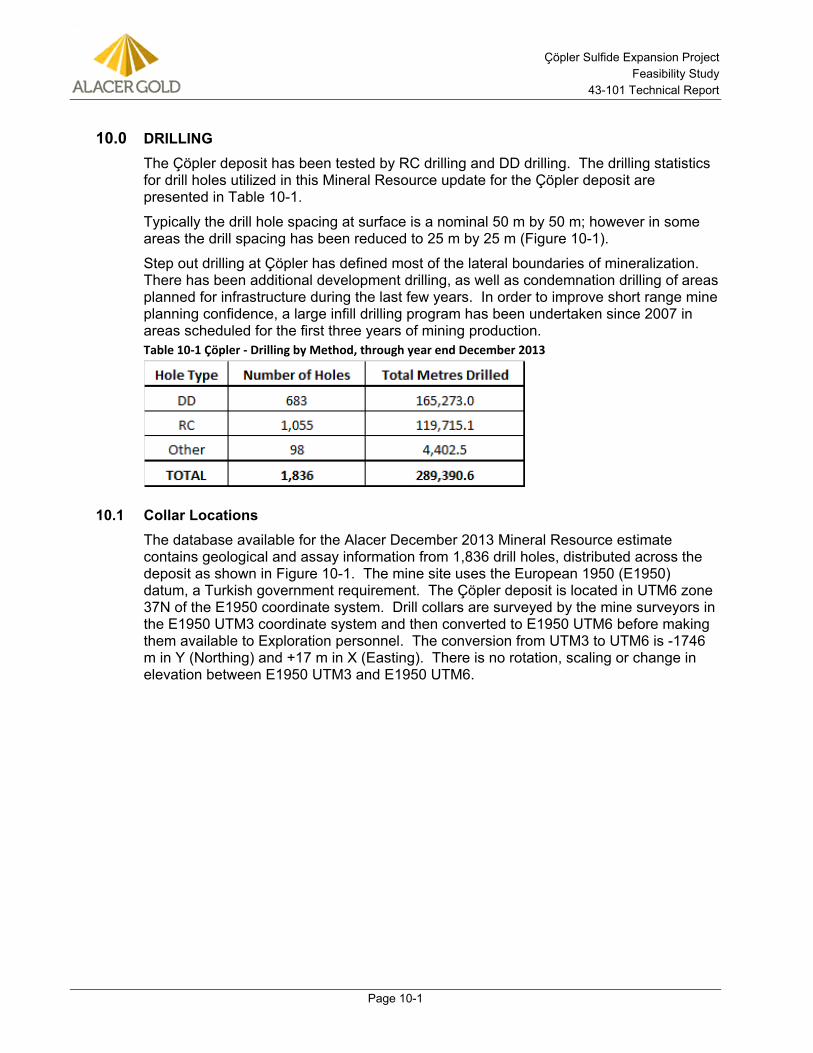
Çöpler Sulfide Expansion Project Feasibility Study
43-101 Technical Report
Page 10-1
10.0 DRILLING The Çöpler deposit has been tested by RC drilling and DD drilling. The drilling statistics for drill holes utilized in this Mineral Resource update for the Çöpler deposit are presented in Table 10-1.
Typically the drill hole spacing at surface is a nominal 50 m by 50 m; however in some areas the drill spacing has been reduced to 25 m by 25 m (Figure 10-1).
Step out drilling at Çöpler has defined most of the lateral boundaries of mineralization. There has been additional development drilling, as well as condemnation drilling of areas planned for infrastructure during the last few years. In order to improve short range mine planning confidence, a large infill drilling program has been undertaken since 2007 in areas scheduled for the first three years of mining production. Table 10-1 Çöpler - Drilling by Method, through year end December 2013
10.1 Collar Locations The database available for the Alacer December 2013 Mineral Resource estimate contains geological and assay information from 1,836 drill holes, distributed across the deposit as shown in Figure 10-1. The mine site uses the European 1950 (E1950) datum, a Turkish government requirement. The Çöpler deposit is located in UTM6 zone 37N of the E1950 coordinate system. Drill collars are surveyed by the mine surveyors in the E1950 UTM3 coordinate system and then converted to E1950 UTM6 before making them available to Exploration personnel. The conversion from UTM3 to UTM6 is -1746 m in Y (Northing) and +17 m in X (Easting). There is no rotation, scaling or change in elevation between E1950 UTM3 and E1950 UTM6.
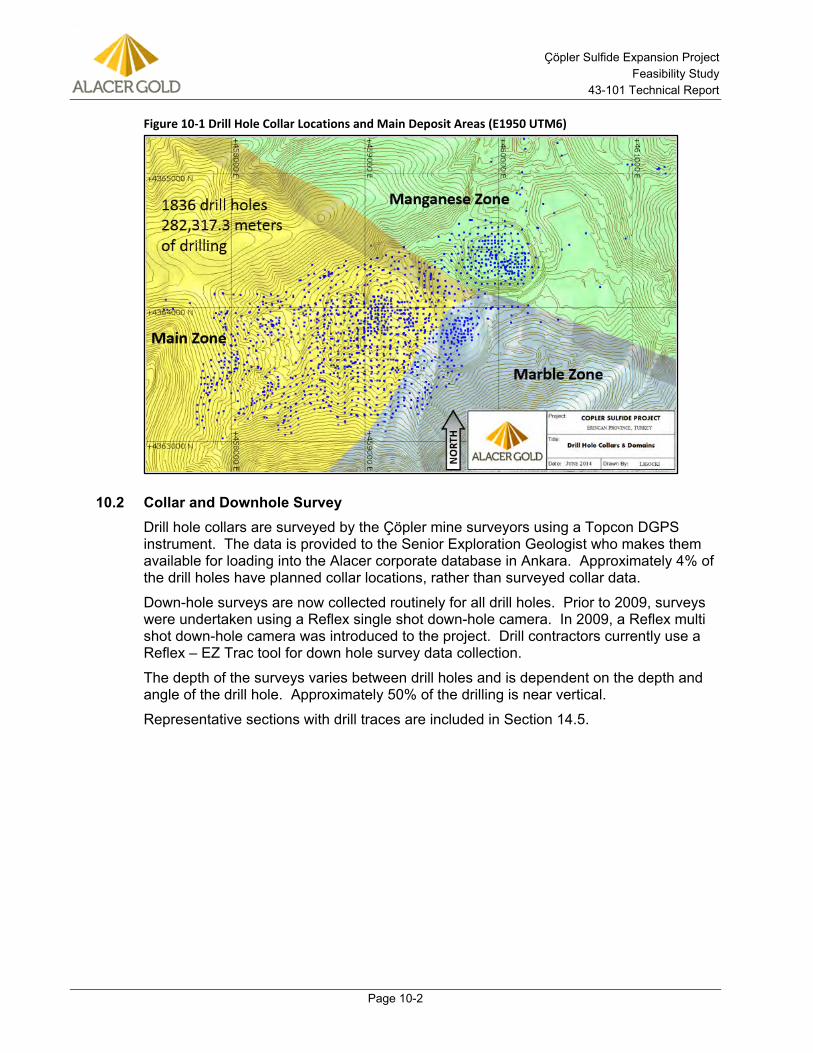
Çöpler Sulfide Expansion Project Feasibility Study
43-101 Technical Report
Page 10-2
Figure 10-1 Drill Hole Collar Locations and Main Deposit Areas (E1950 UTM6)
10.2 Collar and Downhole Survey Drill hole collars are surveyed by the Çöpler mine surveyors using a Topcon DGPS instrument. The data is provided to the Senior Exploration Geologist who makes them available for loading into the Alacer corporate database in Ankara. Approximately 4% of the drill holes have planned collar locations, rather than surveyed collar data.
Down-hole surveys are now collected routinely for all drill holes. Prior to 2009, surveys were undertaken using a Reflex single shot down-hole camera. In 2009, a Reflex multi shot down-hole camera was introduced to the project. Drill contractors currently use a Reflex – EZ Trac tool for down hole survey data collection.
The depth of the surveys varies between drill holes and is dependent on the depth and angle of the drill hole. Approximately 50% of the drilling is near vertical.
Representative sections with drill traces are included in Section 14.5.
Çöpler Sulfide Expansion Project Feasibility Study
43-101 Technical Report
Page 11-1
11.0 SAMPLE PREPARATION, ANALYSIS AND SECURITY From 2004 to late 2012, samples were prepared at ALS Chemex İzmir, Turkey and analyzed at ALS Chemex Vancouver, Canada. From late 2012 to present, samples are prepared and analyzed at ALS Chemex İzmir, Turkey.
ALS Chemex İzmir has ISO 9001:2008 certification and ALS Chemex Vancouver is ISO/IEC 17025:2005 accredited for precious and base metal assay methods.
ALS Chemex is a specialist analytical testing services company which is independent of Alacer.
Rio Tinto operated a drill program from 2000 to 2003. Samples from this program were submitted to OMAC Laboratories Limited in Loughrea, Ireland. ALS Chemex assumed ownership of the OMAC laboratory in 2011.
Rio Tinto instigated detailed sampling and QA/QC procedures for RC and diamond drilling which have been in use since the first drill program and are still the current procedures.
11.1 Sample Collection Reverse Circulation Sample Collection 11.1.1RC drilling has been completed with a 4.5 inch to 4.75 inch (11.4 cm to 12.0 cm) diameter down-the-hole hammer. RC cuttings are passed through a cyclone with a 10 inch (25.4 cm) port for sample collection. RC drill intervals are 1 m in length and cuttings for the entire 1 m sample interval is collected from the cyclone under-flow in large reinforced plastic bags.
At each one meter interval, the driller halts the drilling process while the samplers, two Alacer employees, collect the sample bag, and replace it with a fresh sample bag. Drilling is then continued. Drill holes are cleaned when additional drill rod/ pipe segments are added to the drill string.
The Çöpler drilling is generally above the water table particularly in the Manganese Mine and Marble Contact Zones, thus wet holes are not a particular problem for RC drilling in those areas. The water table is closer to the surface in the northern portion of the Main Zone, and for that reason the preferred drilling method in this zone is diamond core drilling.
The sample passes up the sample hose, into the cyclone where it drops into a large plastic bag. Each bag of sample weighs between 25 kg and 30 kg. This sample is then split to reduce the volume of sample using a Jones splitter. Several stages of splitting are undertaken in order to reduce the sample size down to approximately 1 kg of sample. The 1 kg sample is collected in a calico bag and becomes the sample submitted to the laboratory for analysis. All sample bags are clearly numbered and labeled with the drill hole name and sample number.
The Sampler sieves a small portion of remaining residual sample from the large plastic bag and places it in a plastic tray, in order to generate a sample for logging and record of each sample interval. The chip trays are also photographed.
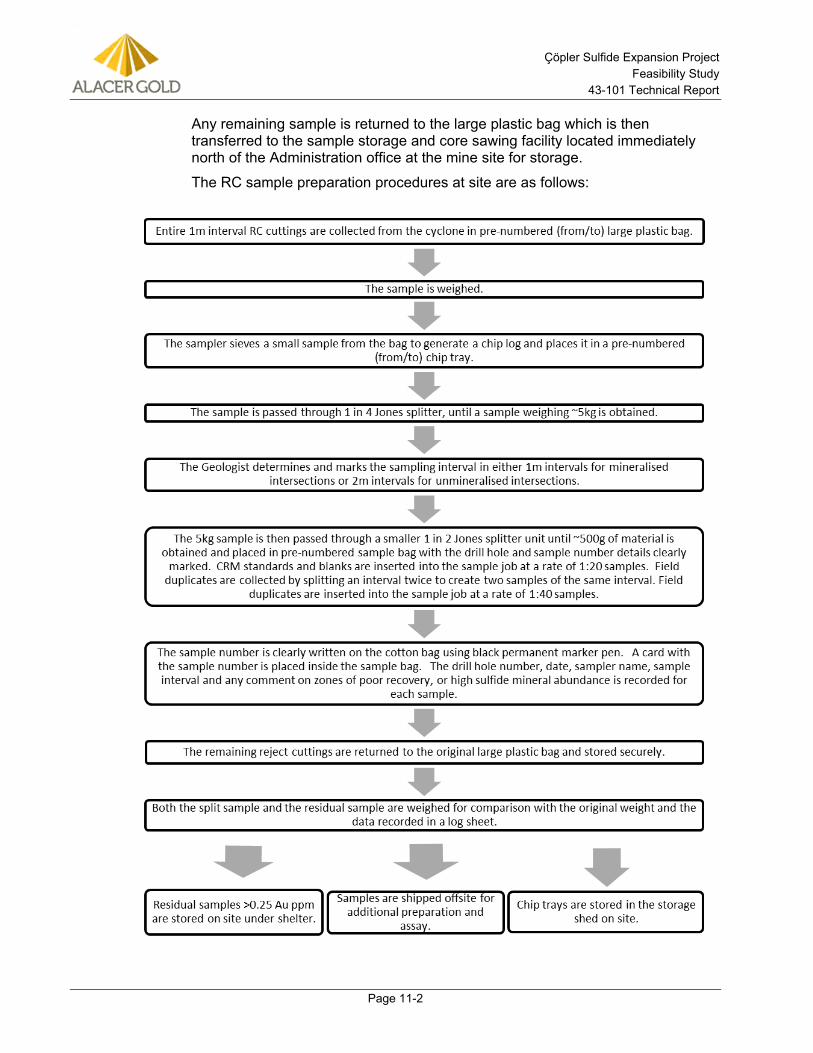
Çöpler Sulfide Expansion Project Feasibility Study
43-101 Technical Report
Page 11-2
Any remaining sample is returned to the large plastic bag which is then transferred to the sample storage and core sawing facility located immediately north of the Administration office at the mine site for storage.
The RC sample preparation procedures at site are as follows:
Çöpler Sulfide Expansion Project Feasibility Study
43-101 Technical Report
Page 11-3
Quality assurance and quality control (QA/QC) samples are collected during the sampling process. Certified Reference Materials (CRM) and blanks are inserted into each sample job at a rate of 1:20 samples. Field duplicate samples are collected by splitting an RC sample twice to collect two independently numbered samples of the same interval. Field duplicates are collected and inserted into the sample job at a rate of 1:40 samples.
Diamond Drilling Core Sample Collection 11.1.2DD has generally utilized NQ or HQ diameter core, as defined by the Diamond Core Drill Manufacturers Association. HQ core has a nominal diameter of 63.5 mm while NQ has a nominal size of 47.6 mm. Approximately 90 percent of the core drilled at Çöpler is HQ. Some drill holes are started with HQ and are reduced in size to NQ later in the hole.
Drill core is boxed at the rig by the driller and transported to the sample preparation facility on site for logging by Alacer staff. All core is digitally photographed and logged at the core shed. Minor geotechnical data, such as rock quality designation (RQD) and the percentage of solid core, is recorded along with core recovery.
Competent drill core is sawn in half longitudinally with a diamond saw at the core yard. Core that is broken or rubbly is sampled using a spatula to take half the sample. Half the core is placed in a sample bag and half is returned to the core tray. Sample numbers are assigned and sample tags are placed in the sample bags and recorded in the master sample list by down-hole interval. Sample intervals are typically one meter down-hole.
Quality assurance and quality control (QA/QC) samples are collected routinely during the sampling process. CRM and blanks are inserted into each sample job at a rate of 1:20 samples. Field duplicate samples are collected by cutting the remaining half core portion into two and selecting one quarter of the remaining sample to be submitted as the field duplicate. Field duplicates are collected and inserted into the sample job at a rate of 1:40 samples.
The DD sampling protocol is as follows:
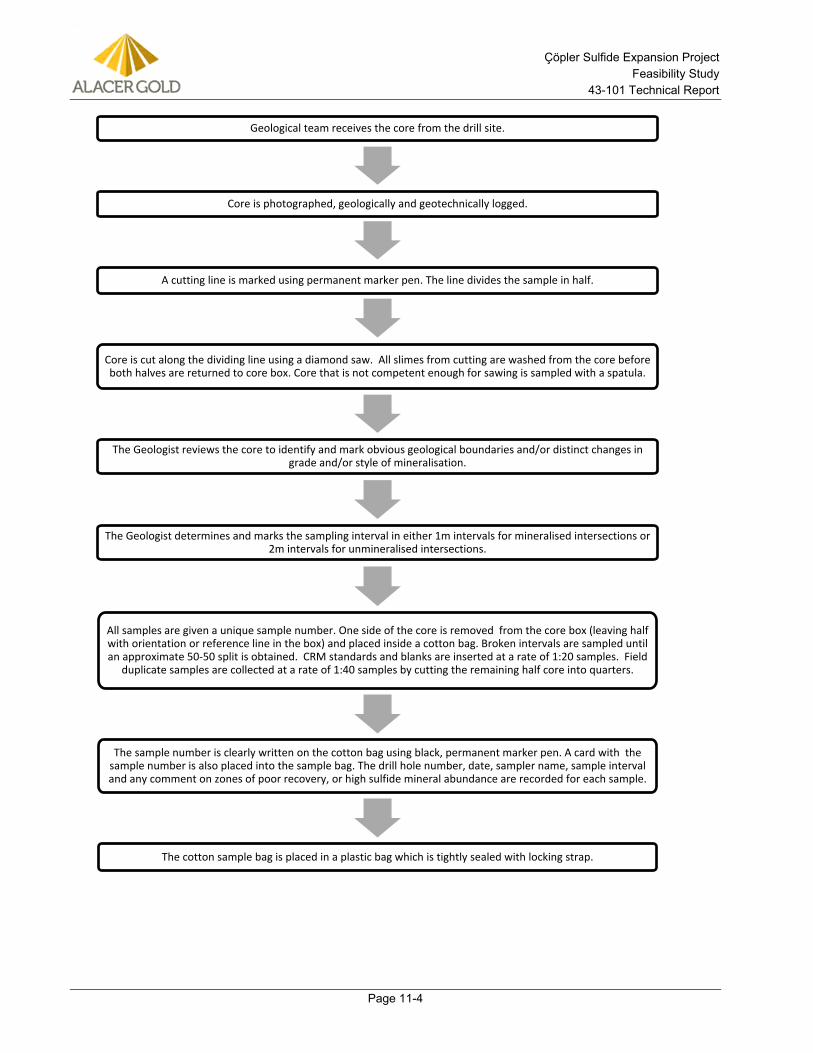
Çöpler Sulfide Expansion Project Feasibility Study
43-101 Technical Report
Page 11-4
Geological team receives the core from the drill site.
Core is photographed, geologically and geotechnically logged.
A cutting line is marked using permanent marker pen. The line divides the sample in half.
Core is cut along the dividing line using a diamond saw. All slimes from cutting are washed from the core before both halves are returned to core box. Core that is not competent enough for sawing is sampled with a spatula.
The Geologist reviews the core to identify and mark obvious geological boundaries and/or distinct changes in grade and/or style of mineralisation.
The Geologist determines and marks the sampling interval in either 1m intervals for mineralised intersections or 2m intervals for unmineralised intersections.
All samples are given a unique sample number. One side of the core is removed from the core box (leaving half with orientation or reference line in the box) and placed inside a cotton bag. Broken intervals are sampled until an approximate 50-50 split is obtained. CRM standards and blanks are inserted at a rate of 1:20 samples. Field
duplicate samples are collected at a rate of 1:40 samples by cutting the remaining half core into quarters.
The sample number is clearly written on the cotton bag using black, permanent marker pen. A card with the sample number is also placed into the sample bag. The drill hole number, date, sampler name, sample interval and any comment on zones of poor recovery, or high sulfide mineral abundance are recorded for each sample.
The cotton sample bag is placed in a plastic bag which is tightly sealed with locking strap.
Çöpler Sulfide Expansion Project Feasibility Study
43-101 Technical Report
Page 11-5
Drill Hole Logging and Data Collection 11.1.3All drill holes are logged for detailed geological information such as rock type, alteration, mineralization, veining and structure using defined Alacer geological codes and logging formats.
RC chip samples are collected in chip trays for each meter drilled by field staff for the logging geologist. Similarly, core samples are meter marked by field staff in preparation for the logging geologist.
All geological data are recorded onto hard-copy logs and then transcribed into text files using data-loading templates, ready for loading into the corporate relational SQL database.
The corporate SQL database is located in the Alacer Corporate office in Ankara, Turkey and is managed by Alacer personnel.
11.2 Sample Preparation RC Sample Preparation 11.2.1Current and historical RC Sample preparation has been completed at the ALS Chemex preparation facilities in İzmir, Turkey. Pulp samples weighing approximately 150 g have historically been sent to ALS Chemex Vancouver, Canada; however since late 2012, pulp samples have been generated and analyzed by ALS Chemex İzmir, Turkey. The procedures used are detailed below in Figure 11-1.
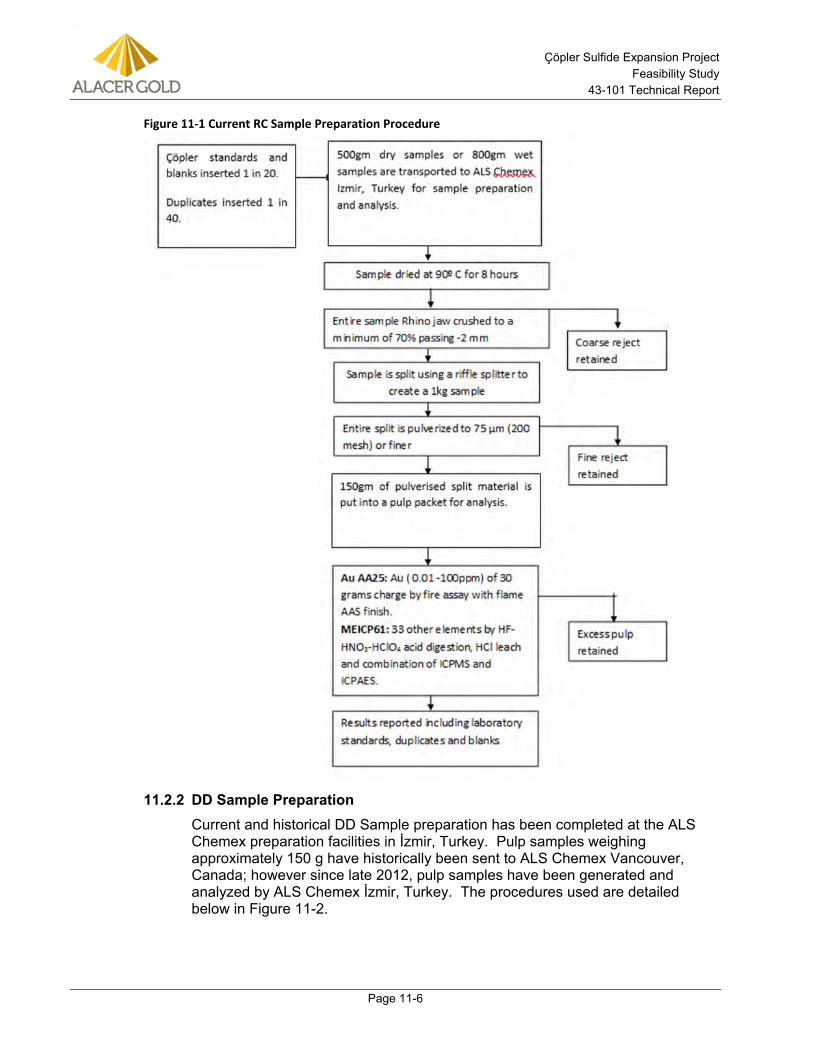
Çöpler Sulfide Expansion Project Feasibility Study
43-101 Technical Report
Page 11-6
Figure 11-1 Current RC Sample Preparation Procedure
DD Sample Preparation 11.2.2Current and historical DD Sample preparation has been completed at the ALS Chemex preparation facilities in İzmir, Turkey. Pulp samples weighing approximately 150 g have historically been sent to ALS Chemex Vancouver, Canada; however since late 2012, pulp samples have been generated and analyzed by ALS Chemex İzmir, Turkey. The procedures used are detailed below in Figure 11-2.
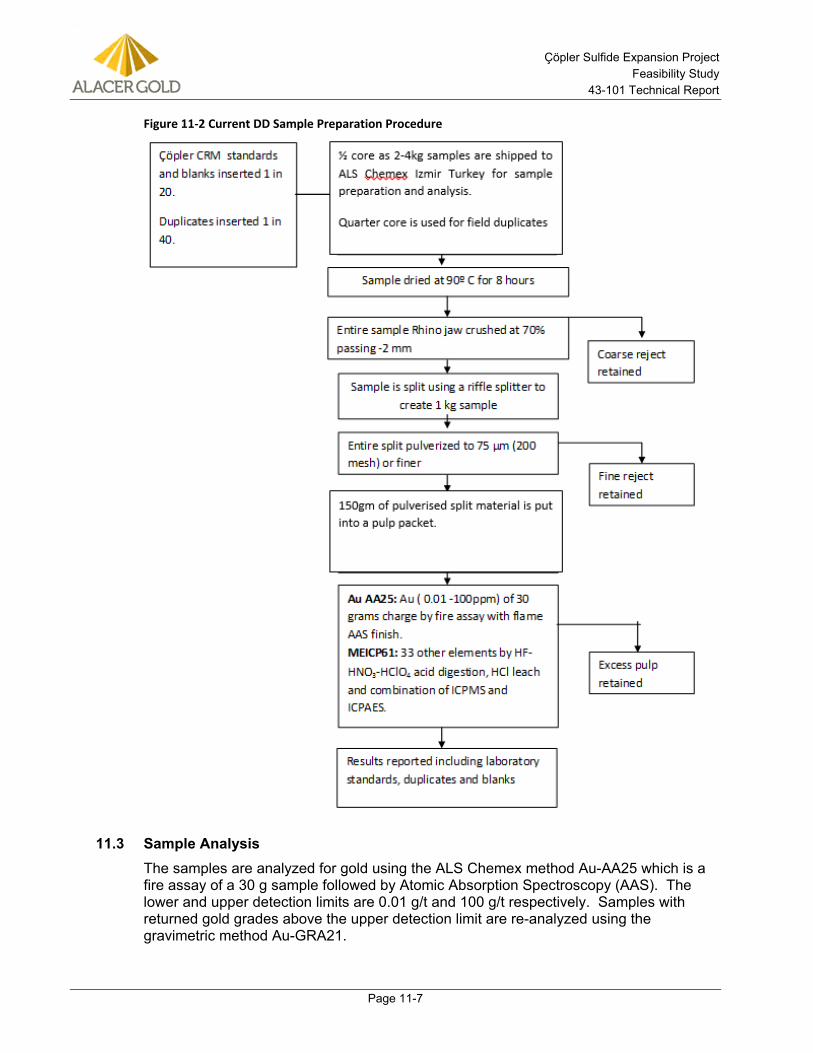
Çöpler Sulfide Expansion Project Feasibility Study
43-101 Technical Report
Page 11-7
Figure 11-2 Current DD Sample Preparation Procedure
11.3 Sample Analysis The samples are analyzed for gold using the ALS Chemex method Au-AA25 which is a fire assay of a 30 g sample followed by Atomic Absorption Spectroscopy (AAS). The lower and upper detection limits are 0.01 g/t and 100 g/t respectively. Samples with returned gold grades above the upper detection limit are re-analyzed using the gravimetric method Au-GRA21.
Çöpler Sulfide Expansion Project Feasibility Study
43-101 Technical Report
Page 11-8
Analysis of 33 other elements is accomplished through the ALS method ME-ICP61 which involves a four acid (perchloric, nitric, hydrofluoric and hydrochloric acid) digestion, followed by Inductively Coupled Plasma –Atomic Emission Spectroscopy (ICP-AES). Silver, copper, lead, zinc and manganese are among the 33 elements analyzed by this method.
11.4 Sample Security The core and RC chips are transported to the core storage facility by either the drilling company personnel or the Alacer geological staff. Once at the facility the samples are kept in a secure location while logging and sampling is being conducted. The core storage facility is enclosed by a fence and gate which is locked at night and when the geology staff is absent. The samples are transported to ALS Chemex in İzmir, Turkey by commercial carrier.
11.5 QA/QC Procedures A detailed QA/QC protocol was implemented by Rio Tinto at Çöpler, which is still currently in use. The Çöpler QA/QC program has historically consisted of a combination of QA/QC sample types which are designed to monitor different portions of the sample preparation and assaying process.
Pulp blanks have been inserted routinely into all sample batches. Typically blanks are comprised of non-mineralized sample which are submitted in order to identify the presence of poor sample preparation practices. If a blank returns an assay grade above an acceptable limit, contamination from a previous mineralized sample has occurred at either the crushing or pulverization stage. Since pulp blanks are not crushed or pulverized they are of limited value. The first sample in a drill hole is typically a pulp blank, after which pulp blanks continue to be inserted into the sample batch at a nominal rate of 1 in 50 samples.
Certified reference materials (CRM) samples are inserted into sample submissions in order to monitor and measure the accuracy of the assay laboratory results. CRMs have been inserted into sample submissions at a nominal rate of 1 in 30 samples at Çöpler. A number of different CRMs have been selected for use at varying gold and copper grades over the life of the project. The pulp blanks utilized by Alacer are capable of determining the accuracy of assay results at very low grade and as such are inserted using the same logic as CRMs. The combined insertion rate of pulp blanks and CRMs is a nominal 1 in 20 samples.
Field duplicates are used as a means of monitoring and assessing sample homogeneity and grade variability. They enable the determination of bias and precision between the sample pairs. Field duplicates have been routinely inserted into both RC and DD sample submissions since drilling began. DD field duplicates are generated by cutting the residual half core sample into quarters and submitting one of the quarters of core as the field duplicate. RC field duplicates are generated by splitting the RC sample twice to create two samples of the same interval. Field duplicates have been historically and continue to be submitted at a nominal rate of 1 in 40 samples.
Rio Tinto undertook a small program of coarse reject duplicate and pulp duplicate analyses on samples from the 2000 to 2003 drilling program; however this has not been undertaken since and is no a longer current procedure.
Çöpler Sulfide Expansion Project Feasibility Study
43-101 Technical Report
Page 11-9
11.6 Opinion on Adequacy Optiro is of the opinion that the sample preparation, sample security and analytical procedures utilized are appropriate for use at Çöpler and are therefore deemed adequate.
Çöpler Sulfide Expansion Project Feasibility Study
43-101 Technical Report
Page 12-1
12.0 DATA VERIFICATION AMEC reviewed the Çöpler Deposit database as of December 31st, 2013 (containing 1,836 drill holes; see Section 10.1) in order to verify the data are of sufficient quality to support Mineral Resource estimation of gold, copper and silver for the Çöpler deposit. AMEC limited the audit to the 1,479 drill holes defined as being within Mineral Resource model area. Holes outside this area were not used in Mineral Resource estimation. AMEC randomly selected 5% of the drill holes within the Mineral Resource estimation area and requested scans of the drill logs for audit purposes. Drill logs for many of the early holes were found to not have been retained.
AMEC compared scans of original drill logs (lithology, RQD and bulk density) to values contained in the database. Assay results from early drill holes (2000 to 2003) assayed by OMAC Laboratories Limited were unable to be verified. Assay results from 2004 to 2013 drilling were provided by ALS and were compared to the database. As well, AMEC evaluated the available QAQC data to ensure the assay data were suitable to support Mineral Resource estimation.
12.1 Collar Location Drill hole collars are surveyed by the Anagold mine surveying staff. The data are collected using a Topcon Differential GPS instrument. Collar coordinates are provided to the geology department for review and compilation into an Excel spreadsheet. Coordinates are then transferred digitally to the database manager in Ankara for upload into the database.
AMEC could not verify the collar location data. Alacer has not retained the original collar survey documentation provided by the mine site survey department. As well, physical collar locations for all drill holes could not be confirmed, as 615 drill hole collars have been destroyed by mining. During the May 2014 site visit, AMEC independently recorded the location of 38 drill hole collar monuments that could be found peripheral to the mining area.
Collar coordinates for these holes were collected in the field using a hand held GPS. The mine site survey crew also collected the same points with the Topcon instrument. Since most of the collars located were not marked with the drill hole identifier, each collected coordinate point was referenced to the nearest coordinate collar in the database. Overall, 37 of the holes were found to be located less than 5m from the position reported in the Alacer database (with an overall average variance of 1.6m), but one hole (CRC490) differed by 13 m. Alacer site staff was urged to revisit the location of this hole and resolve the difference. The collar check does not account for mismatched hole names.
Drill collar elevations were compared to both the original topography and the end of year 2013 topographic surface. Holes with collar variances greater than 5 m were flagged for review. From this list, holes with assay results above both topographies were investigated. A total of four holes showed collar elevation variances greater than the topographic survey tolerance. These holes were submitted to site staff for verification. Typically the differences could be explained by the presence of mine backfill added after the surface topography data were obtained. Figure 12-1 shows a 3D view comparing drill hole collars to the pre-mining topography. In this case, the collars shown above the topography are due to mine backfill.
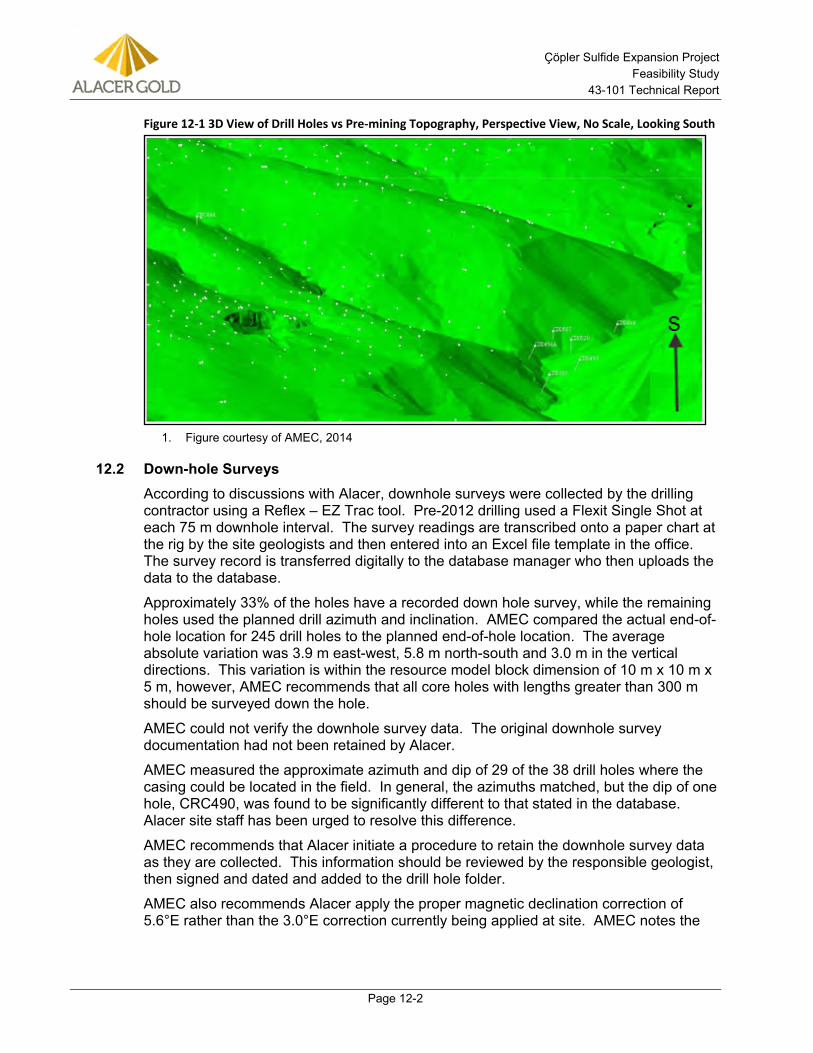
Çöpler Sulfide Expansion Project Feasibility Study
43-101 Technical Report
Page 12-2
Figure 12-1 3D View of Drill Holes vs Pre-mining Topography, Perspective View, No Scale, Looking South
Figure courtesy of AMEC, 2014 1.
12.2 Down-hole Surveys According to discussions with Alacer, downhole surveys were collected by the drilling contractor using a Reflex – EZ Trac tool. Pre-2012 drilling used a Flexit Single Shot at each 75 m downhole interval. The survey readings are transcribed onto a paper chart at the rig by the site geologists and then entered into an Excel file template in the office. The survey record is transferred digitally to the database manager who then uploads the data to the database.
Approximately 33% of the holes have a recorded down hole survey, while the remaining holes used the planned drill azimuth and inclination. AMEC compared the actual end-of-hole location for 245 drill holes to the planned end-of-hole location. The average absolute variation was 3.9 m east-west, 5.8 m north-south and 3.0 m in the vertical directions. This variation is within the resource model block dimension of 10 m x 10 m x 5 m, however, AMEC recommends that all core holes with lengths greater than 300 m should be surveyed down the hole.
AMEC could not verify the downhole survey data. The original downhole survey documentation had not been retained by Alacer.
AMEC measured the approximate azimuth and dip of 29 of the 38 drill holes where the casing could be located in the field. In general, the azimuths matched, but the dip of one hole, CRC490, was found to be significantly different to that stated in the database. Alacer site staff has been urged to resolve this difference.
AMEC recommends that Alacer initiate a procedure to retain the downhole survey data as they are collected. This information should be reviewed by the responsible geologist, then signed and dated and added to the drill hole folder.
AMEC also recommends Alacer apply the proper magnetic declination correction of 5.6°E rather than the 3.0°E correction currently being applied at site. AMEC notes the
Çöpler Sulfide Expansion Project Feasibility Study
43-101 Technical Report
Page 12-3
declination correction has varied from 4.5°E in 2000 to 5.6°E in 2014. The correction applied should be based on the year the data were collected.
AMEC used a proprietary software package, “kinkchk4.exe” to test for excessive down hole deviation. A 5° deviation over 30 m was allowed, and all but three checked intervals were within this tolerance. AMEC recommends the azimuth values of holes CDD238, and CRC198 be reviewed and corrected if necessary. The dip value for hole CDD435 at a depth of 270 m should be reviewed and corrected if necessary.
12.3 Geology Logs, Density Logs and RQD Logs AMEC requested scanned copies of 58 original geology logs selected from the drill database. This represents approximately 5% of the drill holes. Only three of the 58 geology logs were available for comparison. The remaining logs were not located. AMEC did not discover any material issues when auditing the available logs when compared to the database entries. The geology model was constructed based on digital data obtained from the original logs.
AMEC recommends Alacer attempt to locate original logs for the missing holes. For current and future holes, AMEC recommends the Alacer Senior Geologist reviews, signs and dates the final logs.
Twenty-two density logs were requested by AMEC with 11 logs located. AMEC did not discover any material issues when auditing the density portion of the database. AMEC recommends the Alacer Senior Geologist reviews, signs and dates the final density logs.
During the site visit, AMEC conducted a review of Alacer’s procedure used to determine the density values, and did not note any material issues.
Twenty-four RQD logs were requested with 14 logs provided. AMEC did not discover any material issues when auditing the RQD data. AMEC recommends the Alacer Senior Geologist reviews, signs and dates the final RQD and recovery log sheets.
12.4 Assays – 2000 to 2003 Assay laboratory certificates for drilling prior to the year 2004 were not available. Rio Tinto conducted the drilling program, and samples were submitted to the OMAC laboratory in Ireland. ALS assumed ownership of the OMAC laboratory in 2011. At the effective date of this report, efforts are underway to obtain laboratory certificates from ALS.
AMEC used statistical methods to validate these data against the ALS data and found the data to be comparable. Histograms and a QQ plot comparing nearest neighbor (NN) models of the OMAC and ALS 10 m composite data within 25 m of each other are shown in Figure 12-2 through Figure 12-4. The divergence at approximately 4 g/t Au seen in the QQ plot is explained a few higher-grade composites. These composite grades are confirmed by Alacer drilling in the vicinity (Figure 12-5).
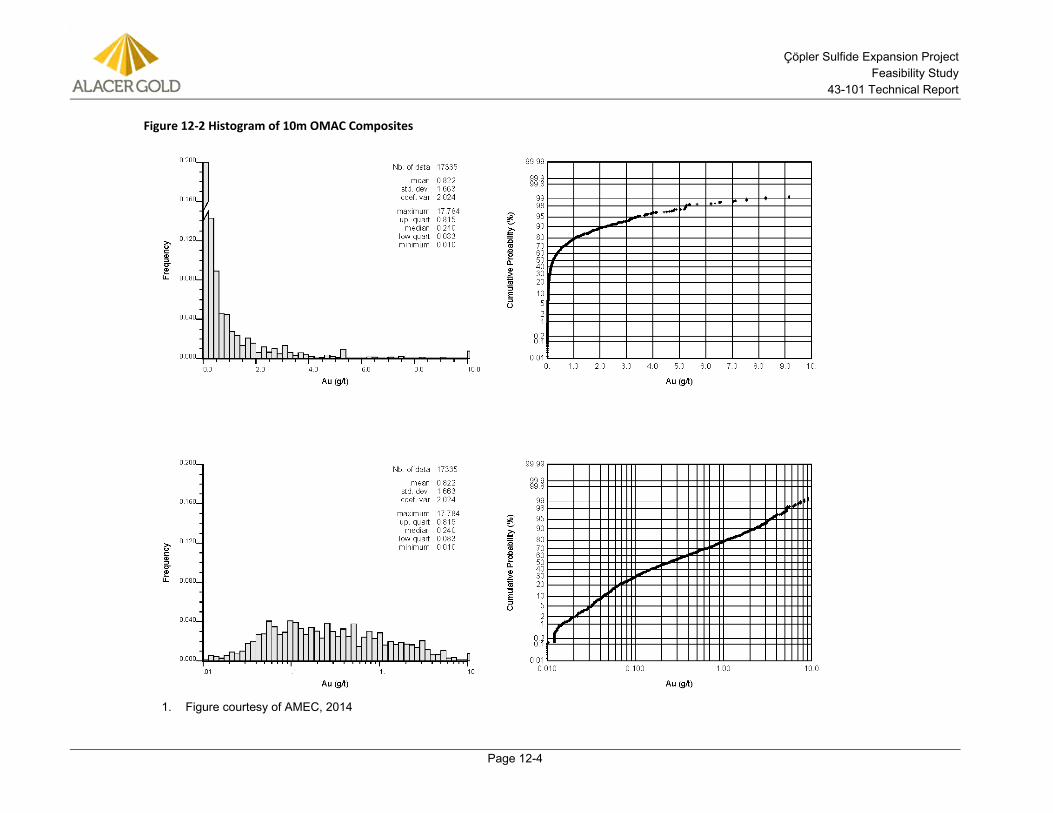
Çöpler Sulfide Expansion Project Feasibility Study
43-101 Technical Report
Page 12-4
Figure 12-2 Histogram of 10m OMAC Composites
Figure courtesy of AMEC, 2014 1.
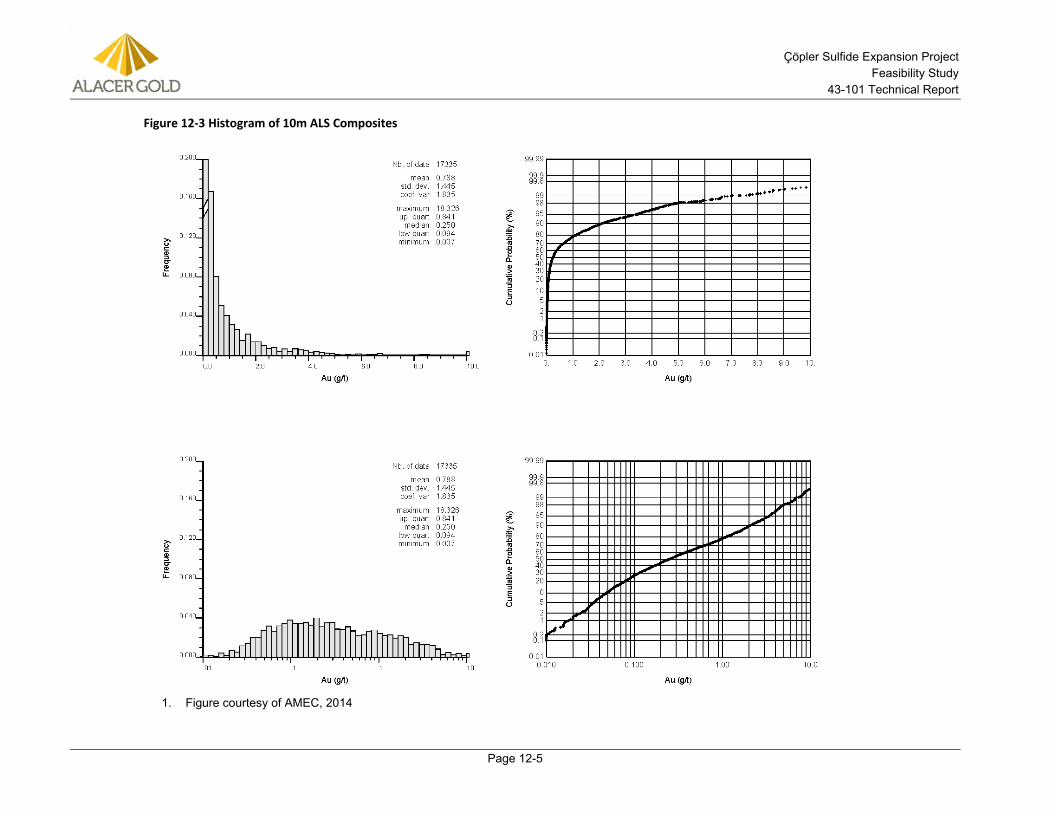
Çöpler Sulfide Expansion Project Feasibility Study
43-101 Technical Report
Page 12-5
Figure 12-3 Histogram of 10m ALS Composites
Figure courtesy of AMEC, 2014 1.
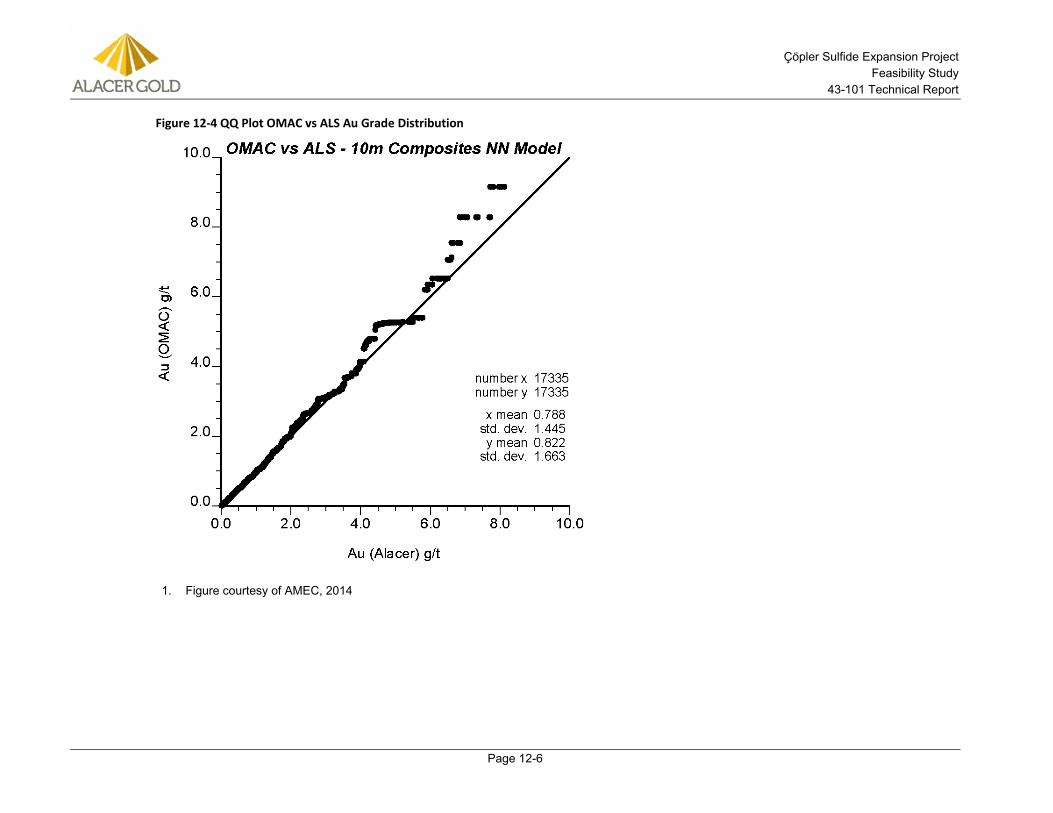
Çöpler Sulfide Expansion Project Feasibility Study
43-101 Technical Report
Page 12-6
Figure 12-4 QQ Plot OMAC vs ALS Au Grade Distribution
Figure courtesy of AMEC, 2014 1.
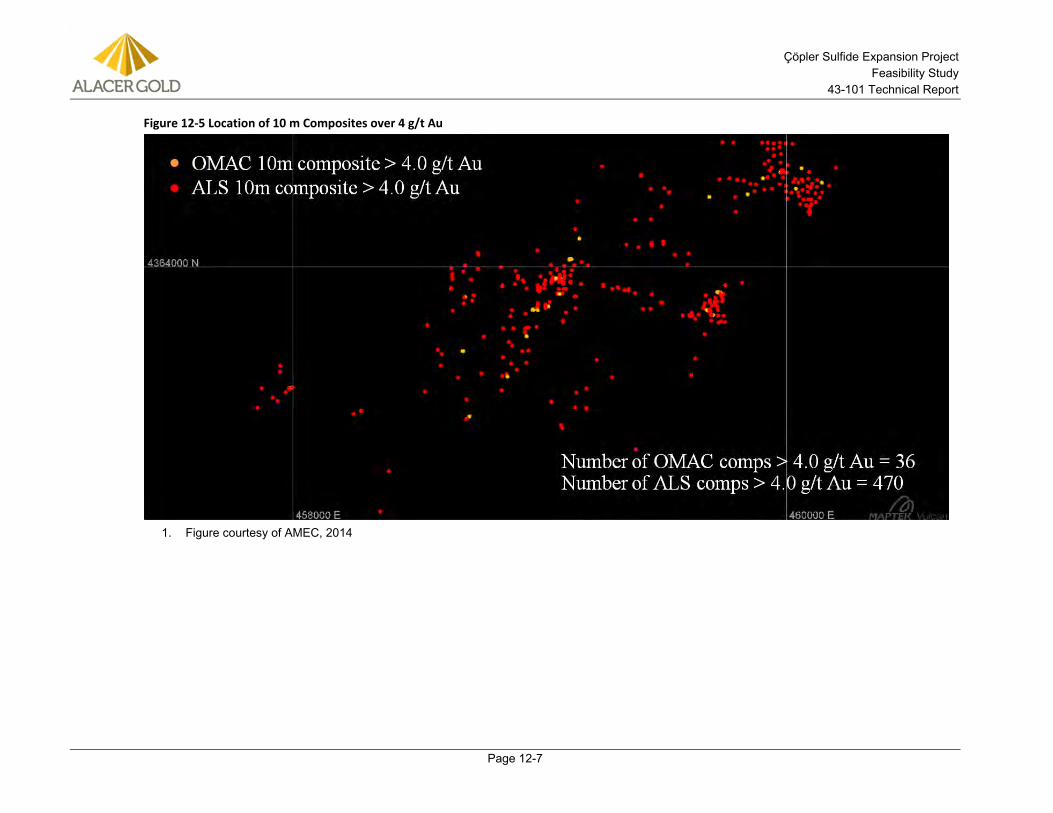
Çöpler Sulfide Expansion Project Feasibility Study
43-101 Technical Report
Page 12-7
Figure 12-5 Location of 10 m Composites over 4 g/t Au
Figure courtesy of AMEC, 2014 1.
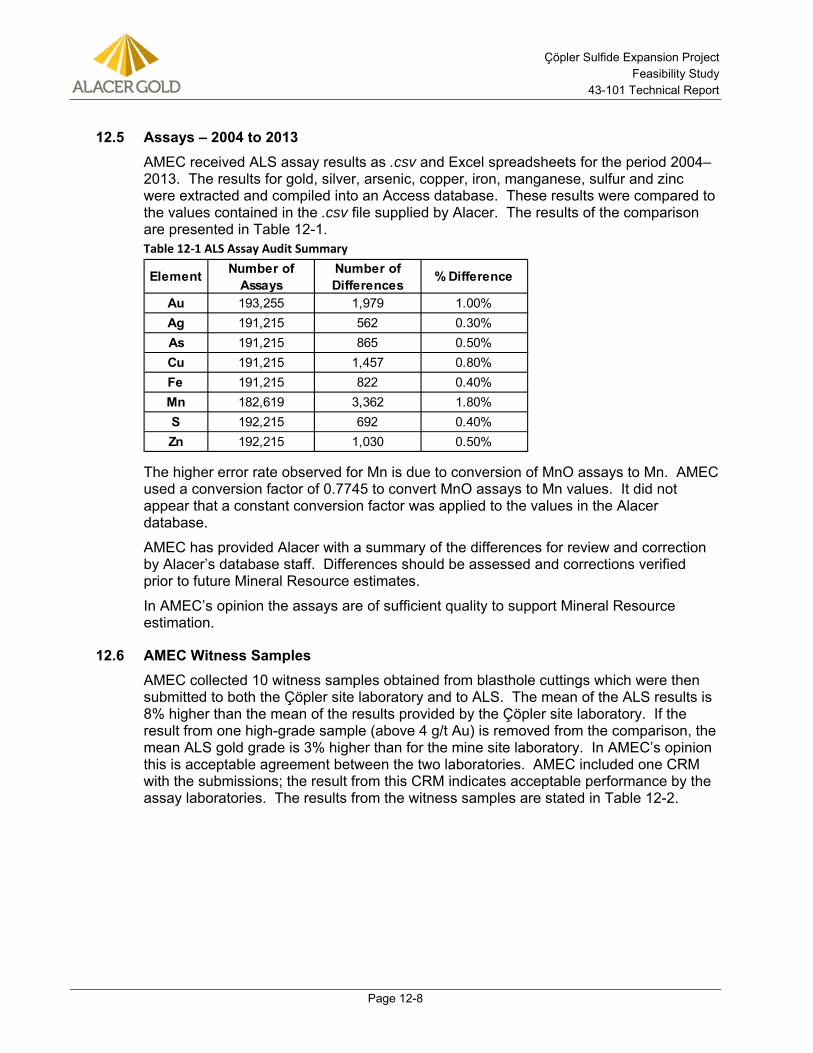
Çöpler Sulfide Expansion Project Feasibility Study
43-101 Technical Report
Page 12-8
12.5 Assays – 2004 to 2013 AMEC received ALS assay results as .csv and Excel spreadsheets for the period 2004–2013. The results for gold, silver, arsenic, copper, iron, manganese, sulfur and zinc were extracted and compiled into an Access database. These results were compared to the values contained in the .csv file supplied by Alacer. The results of the comparison are presented in Table 12-1. Table 12-1 ALS Assay Audit Summary
The higher error rate observed for Mn is due to conversion of MnO assays to Mn. AMEC used a conversion factor of 0.7745 to convert MnO assays to Mn values. It did not appear that a constant conversion factor was applied to the values in the Alacer database.
AMEC has provided Alacer with a summary of the differences for review and correction by Alacer’s database staff. Differences should be assessed and corrections verified prior to future Mineral Resource estimates.
In AMEC’s opinion the assays are of sufficient quality to support Mineral Resource estimation.
12.6 AMEC Witness Samples AMEC collected 10 witness samples obtained from blasthole cuttings which were then submitted to both the Çöpler site laboratory and to ALS. The mean of the ALS results is 8% higher than the mean of the results provided by the Çöpler site laboratory. If the result from one high-grade sample (above 4 g/t Au) is removed from the comparison, the mean ALS gold grade is 3% higher than for the mine site laboratory. In AMEC’s opinion this is acceptable agreement between the two laboratories. AMEC included one CRM with the submissions; the result from this CRM indicates acceptable performance by the assay laboratories. The results from the witness samples are stated in Table 12-2.
Element Number of Assays
Number of Differences % Difference
Au 193,255 1,979 1.00%Ag 191,215 562 0.30%As 191,215 865 0.50%Cu 191,215 1,457 0.80%Fe 191,215 822 0.40%Mn 182,619 3,362 1.80%S 192,215 692 0.40%Zn 192,215 1,030 0.50%
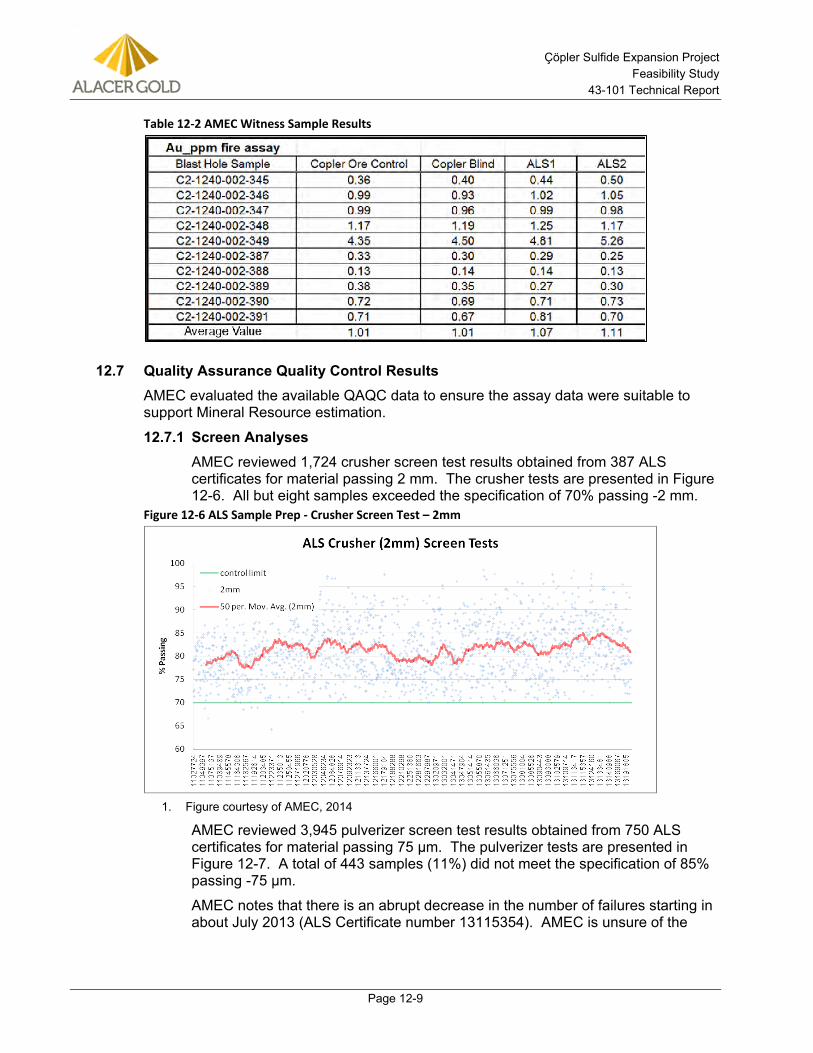
Çöpler Sulfide Expansion Project Feasibility Study
43-101 Technical Report
Page 12-9
Table 12-2 AMEC Witness Sample Results
12.7 Quality Assurance Quality Control Results AMEC evaluated the available QAQC data to ensure the assay data were suitable to support Mineral Resource estimation.
Screen Analyses 12.7.1AMEC reviewed 1,724 crusher screen test results obtained from 387 ALS certificates for material passing 2 mm. The crusher tests are presented in Figure 12-6. All but eight samples exceeded the specification of 70% passing -2 mm.
Figure 12-6 ALS Sample Prep - Crusher Screen Test – 2mm
Figure courtesy of AMEC, 2014 1.
AMEC reviewed 3,945 pulverizer screen test results obtained from 750 ALS certificates for material passing 75 µm. The pulverizer tests are presented in Figure 12-7. A total of 443 samples (11%) did not meet the specification of 85% passing -75 µm.
AMEC notes that there is an abrupt decrease in the number of failures starting in about July 2013 (ALS Certificate number 13115354). AMEC is unsure of the
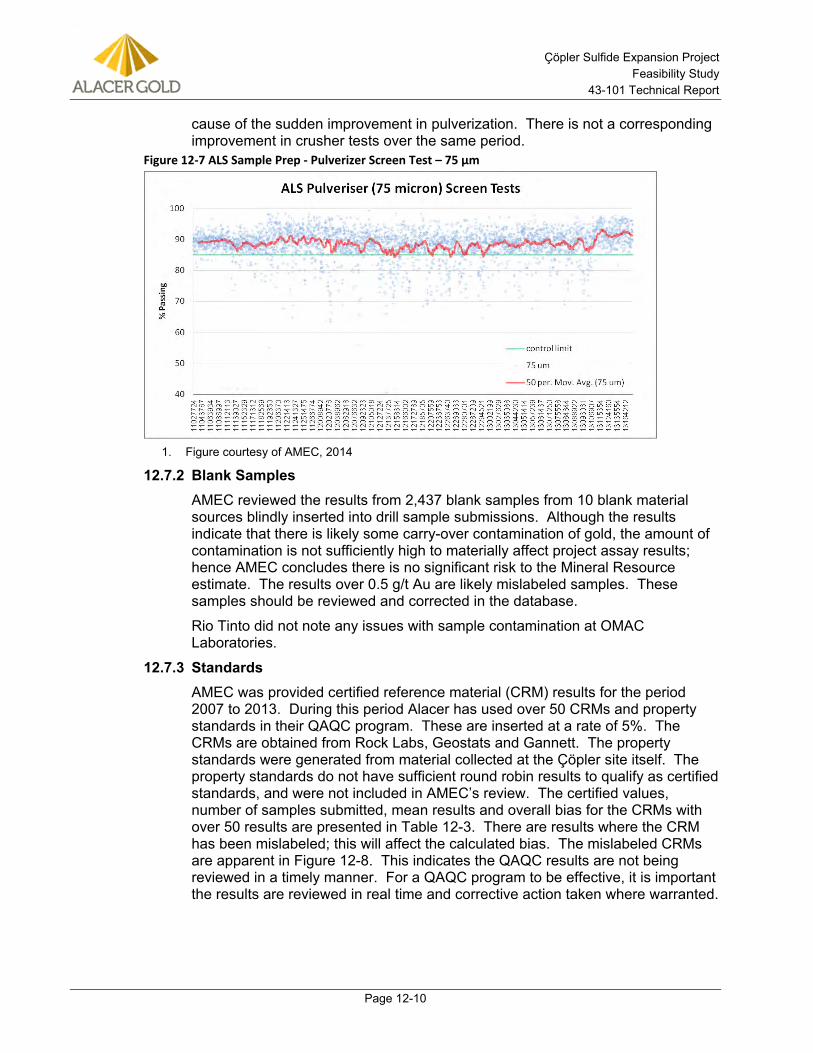
Çöpler Sulfide Expansion Project Feasibility Study
43-101 Technical Report
Page 12-10
cause of the sudden improvement in pulverization. There is not a corresponding improvement in crusher tests over the same period.
Figure 12-7 ALS Sample Prep - Pulverizer Screen Test – 75 µm
Figure courtesy of AMEC, 2014 1.
Blank Samples 12.7.2AMEC reviewed the results from 2,437 blank samples from 10 blank material sources blindly inserted into drill sample submissions. Although the results indicate that there is likely some carry-over contamination of gold, the amount of contamination is not sufficiently high to materially affect project assay results; hence AMEC concludes there is no significant risk to the Mineral Resource estimate. The results over 0.5 g/t Au are likely mislabeled samples. These samples should be reviewed and corrected in the database.
Rio Tinto did not note any issues with sample contamination at OMAC Laboratories.
Standards 12.7.3AMEC was provided certified reference material (CRM) results for the period 2007 to 2013. During this period Alacer has used over 50 CRMs and property standards in their QAQC program. These are inserted at a rate of 5%. The CRMs are obtained from Rock Labs, Geostats and Gannett. The property standards were generated from material collected at the Çöpler site itself. The property standards do not have sufficient round robin results to qualify as certified standards, and were not included in AMEC’s review. The certified values, number of samples submitted, mean results and overall bias for the CRMs with over 50 results are presented in Table 12-3. There are results where the CRM has been mislabeled; this will affect the calculated bias. The mislabeled CRMs are apparent in Figure 12-8. This indicates the QAQC results are not being reviewed in a timely manner. For a QAQC program to be effective, it is important the results are reviewed in real time and corrective action taken where warranted.
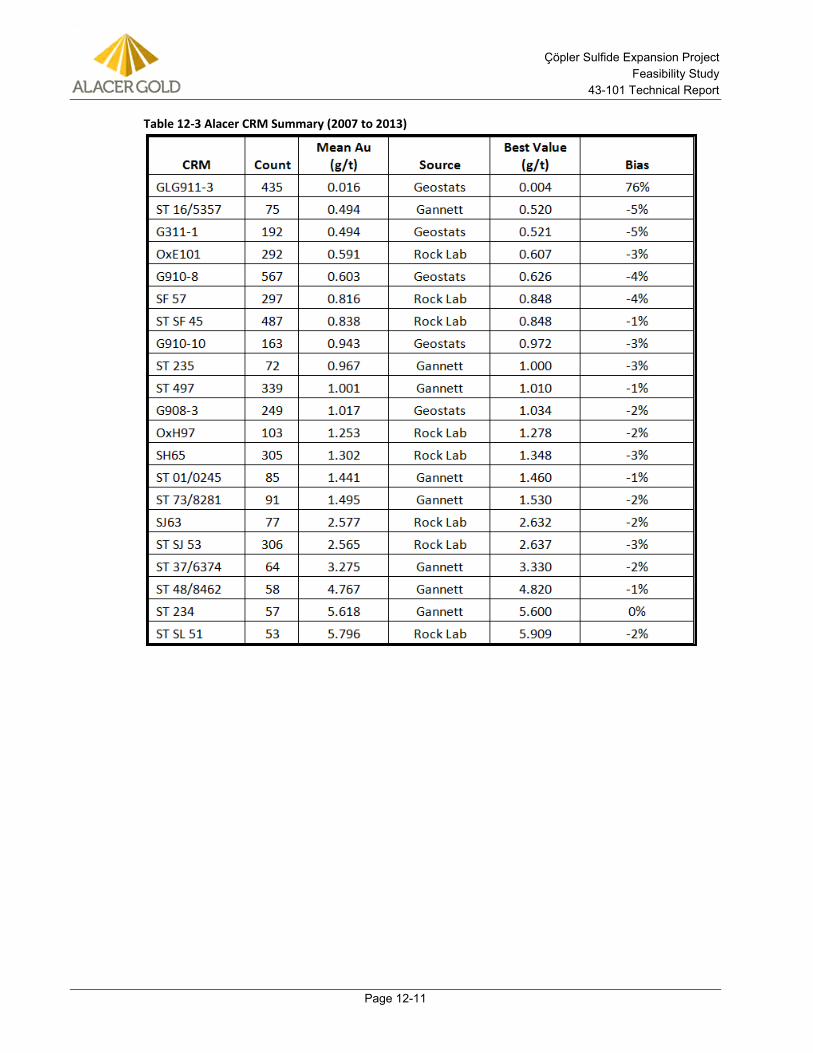
Çöpler Sulfide Expansion Project Feasibility Study
43-101 Technical Report
Page 12-11
Table 12-3 Alacer CRM Summary (2007 to 2013)
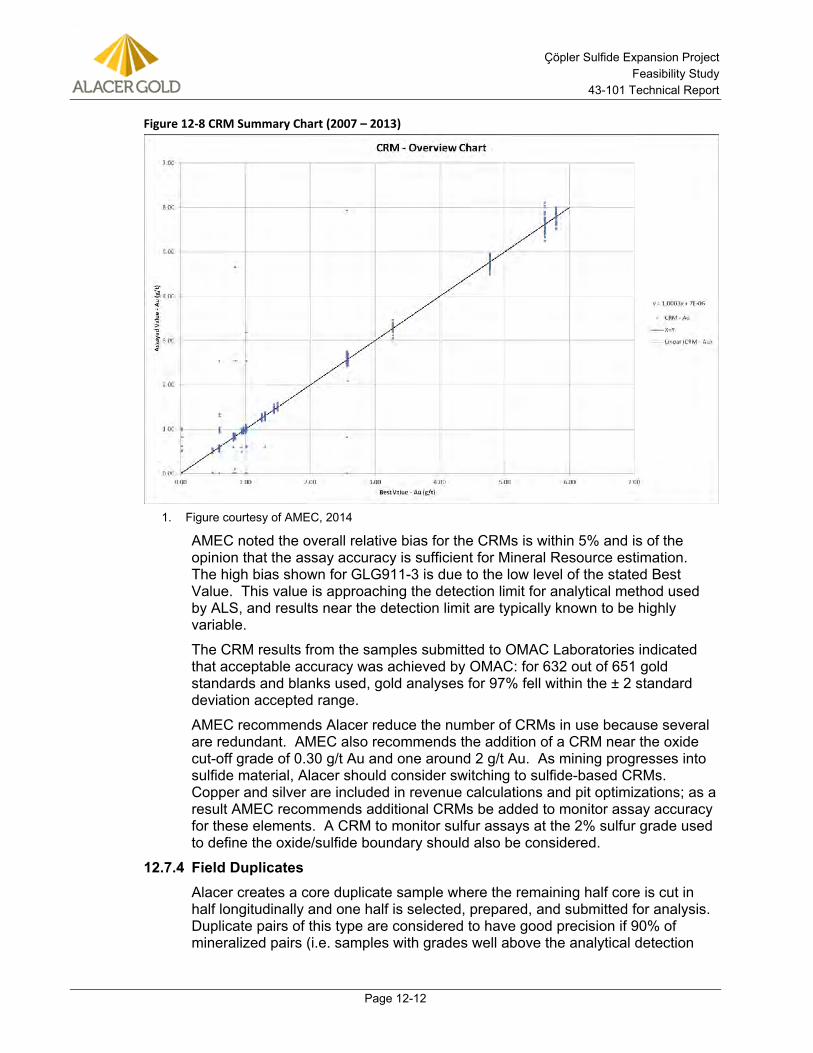
Çöpler Sulfide Expansion Project Feasibility Study
43-101 Technical Report
Page 12-12
Figure 12-8 CRM Summary Chart (2007 – 2013)
Figure courtesy of AMEC, 2014 1.
AMEC noted the overall relative bias for the CRMs is within 5% and is of the opinion that the assay accuracy is sufficient for Mineral Resource estimation. The high bias shown for GLG911-3 is due to the low level of the stated Best Value. This value is approaching the detection limit for analytical method used by ALS, and results near the detection limit are typically known to be highly variable.
The CRM results from the samples submitted to OMAC Laboratories indicated that acceptable accuracy was achieved by OMAC: for 632 out of 651 gold standards and blanks used, gold analyses for 97% fell within the ± 2 standard deviation accepted range.
AMEC recommends Alacer reduce the number of CRMs in use because several are redundant. AMEC also recommends the addition of a CRM near the oxide cut-off grade of 0.30 g/t Au and one around 2 g/t Au. As mining progresses into sulfide material, Alacer should consider switching to sulfide-based CRMs. Copper and silver are included in revenue calculations and pit optimizations; as a result AMEC recommends additional CRMs be added to monitor assay accuracy for these elements. A CRM to monitor sulfur assays at the 2% sulfur grade used to define the oxide/sulfide boundary should also be considered.
Field Duplicates 12.7.4Alacer creates a core duplicate sample where the remaining half core is cut in half longitudinally and one half is selected, prepared, and submitted for analysis. Duplicate pairs of this type are considered to have good precision if 90% of mineralized pairs (i.e. samples with grades well above the analytical detection
Çöpler Sulfide Expansion Project Feasibility Study
43-101 Technical Report
Page 12-13
limit and at or above the lowest probable ore–waste cut-off grade for a mining operation) agree within ± 30% (pair difference divided by pair mean).
AMEC evaluates the duplicate samples by calculating the Absolute Value of the Relative Difference (AVRD), equal to the absolute value of the pair difference divided by the pair mean. The formula is as follows:
AVRD = |pair difference|/[pair mean] AMEC used the oxide cut-off grade of 0.30 g/t Au for assessing the precision of the gold assays. The AVRD for the core duplicates (2009 to 2013) is 55% for gold (Figure 12-9). The precision for gold is below the stated level; in AMEC’s experience gold assays often do not meet this threshold. Improved grinding may help to increase the precision obtained for gold assays.
AMEC used 0.10% sulfur (10 times the sulfur detection limit) to assess the precision for sulfur assays. The AVRD for sulfur is 30%; see Figure 12-10.
Duplicate samples collected by Rio Tinto between 2000 and 2003 and submitted to OMAC Laboratories were described in a report by Rio Tinto. Rio Tinto submitted both coarse reject and pulp reject duplicate samples. They noted an issue possibly due to coarse gold in the coarse rejects. The pulp reject duplicates showed excellent agreement.
AMEC did not receive any duplicate results for the period between 2004 and 2009.
AMEC finds the assay precision is adequate for Mineral Resource estimation.
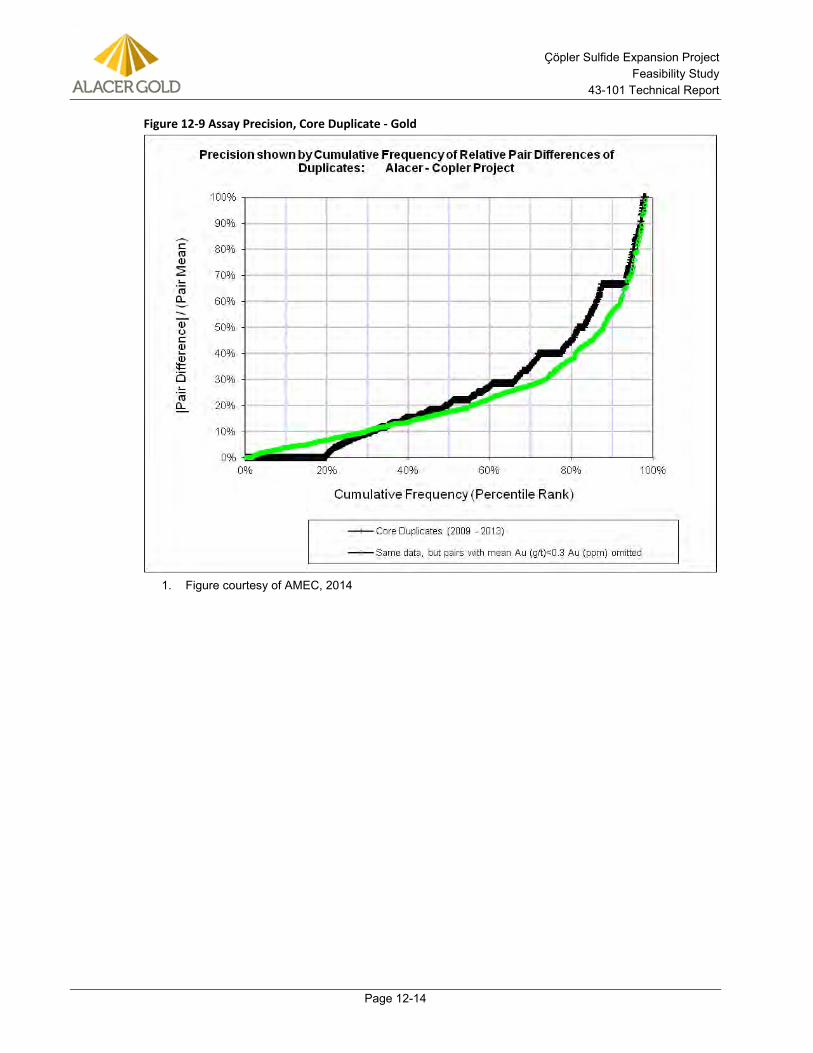
Çöpler Sulfide Expansion Project Feasibility Study
43-101 Technical Report
Page 12-14
Figure 12-9 Assay Precision, Core Duplicate - Gold
Figure courtesy of AMEC, 2014 1.
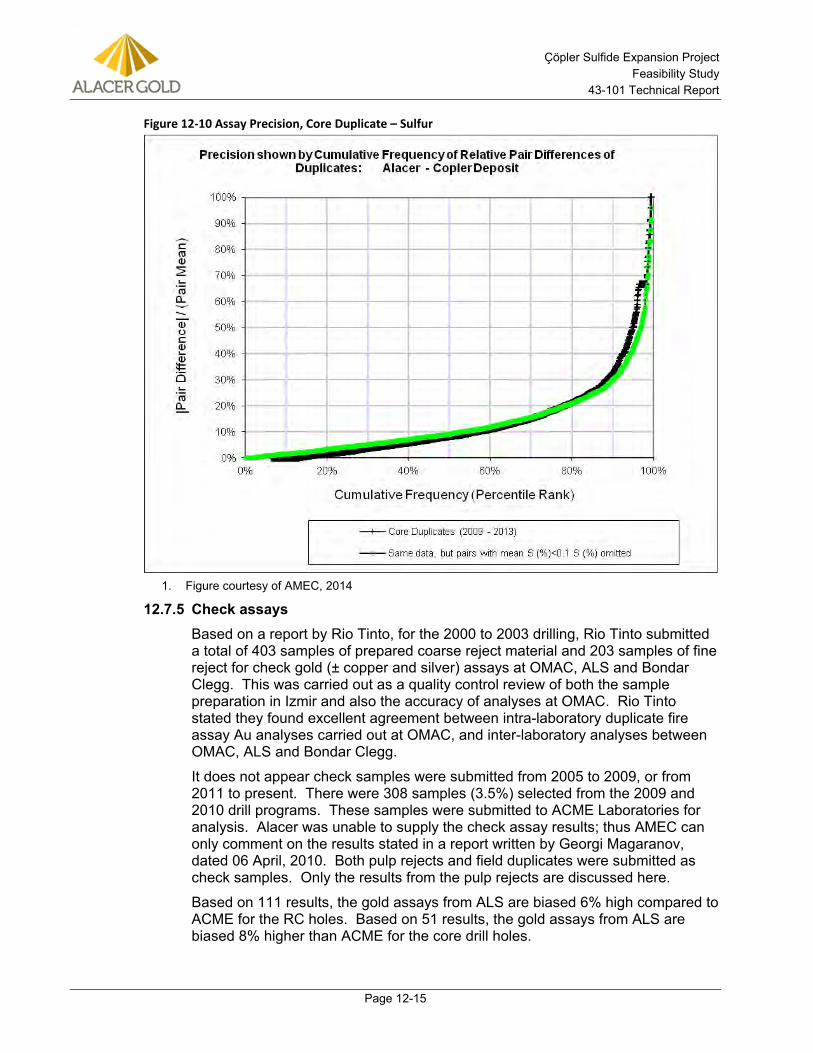
Çöpler Sulfide Expansion Project Feasibility Study
43-101 Technical Report
Page 12-15
Figure 12-10 Assay Precision, Core Duplicate – Sulfur
Figure courtesy of AMEC, 2014 1.
Check assays 12.7.5Based on a report by Rio Tinto, for the 2000 to 2003 drilling, Rio Tinto submitted a total of 403 samples of prepared coarse reject material and 203 samples of fine reject for check gold (± copper and silver) assays at OMAC, ALS and Bondar Clegg. This was carried out as a quality control review of both the sample preparation in Izmir and also the accuracy of analyses at OMAC. Rio Tinto stated they found excellent agreement between intra-laboratory duplicate fire assay Au analyses carried out at OMAC, and inter-laboratory analyses between OMAC, ALS and Bondar Clegg.
It does not appear check samples were submitted from 2005 to 2009, or from 2011 to present. There were 308 samples (3.5%) selected from the 2009 and 2010 drill programs. These samples were submitted to ACME Laboratories for analysis. Alacer was unable to supply the check assay results; thus AMEC can only comment on the results stated in a report written by Georgi Magaranov, dated 06 April, 2010. Both pulp rejects and field duplicates were submitted as check samples. Only the results from the pulp rejects are discussed here.
Based on 111 results, the gold assays from ALS are biased 6% high compared to ACME for the RC holes. Based on 51 results, the gold assays from ALS are biased 8% higher than ACME for the core drill holes.
Çöpler Sulfide Expansion Project Feasibility Study
43-101 Technical Report
Page 12-16
AMEC accepts a difference of 5% between assay laboratories, and these results are close to this difference. The report does not state whether CRMs were included with the samples submitted to ACME; thus AMEC is unable to comment further on the differences noted.
AMEC recommends a random selection of 5% of the samples from 2005 to 2009 and from 2011 to present be collected and submitted for check assaying. Suitable CRMs and blanks should be included with these samples with an insertion rate of 5%.
12.8 Discussion During the validation process, Alacer was unable to provide collar documentation, down hole survey documentation, and a significant number of drill logs were not able to be provided. AMEC recommends that Alacer attempt to obtain as many historical logs as possible and implement procedures to ensure current data are collected and stored in a series of folders. Ideally, data for each drill hole would be stored in an individual folder. For current and future holes, the Alacer Senior Geologist should review, sign and date the final logs.
AMEC located 38 holes during the site visit and compared the collar location and approximate orientation to values contained in the database. A few differences were observed, and these were sent to site staff for review. There were no significant differences noted in the logs Alacer was able to provide.
Assay laboratory certificates for Rio Tinto drilling from 2000 to 2003 were not available. At the report effective date, efforts are underway to obtain laboratory certificates from ALS. AMEC validated these Rio Tinto results against nearby ALS assay results.
ALS provided assay results (2004 to 2013) for gold, silver, arsenic, copper, iron, manganese, sulfur and zinc. These data were compared to the values contained in the Alacer database. AMEC has provided Alacer with a summary of the differences for review and correction by Alacer’s database staff. These should be assessed and corrections verified prior to future Mineral Resource estimates.
AMEC collected 10 witness samples obtained from blast hole cuttings which were submitted to both the Çöpler site laboratory and to ALS. The mean of ALS results is 8% higher than the mean of the results provided by the Çöpler site laboratory. If the results from one high grade sample (above 4 g/t Au) are removed from the comparison, ALS is 3% higher than the mine site laboratory. In AMEC’s opinion this is acceptable agreement between the two laboratories.
AMEC evaluated available QAQC data to ensure the assay data were suitable to support Mineral Resource estimation.
AMEC reviewed 1,724 crusher screen test results obtained from ALS certificates (387 certificates) for material passing -2 mm. All but eight samples exceeded the specification of 70% passing -2 mm.
AMEC reviewed 3,945 pulverizer screen test results obtained from 750 ALS certificates for material passing 75 µm. A total of 443 samples (11%) did not meet the specification of 85% passing -75 µm. For the period from July 2013 to the end of 2013, there is an abrupt improvement in pulverization. AMEC is unaware of the reason for this.
Çöpler Sulfide Expansion Project Feasibility Study
43-101 Technical Report
Page 12-17
The Alacer QAQC program includes CRMs, blanks, preparation duplicates and field duplicates and is acceptable according to industry standards. The following improvements could be made:
• Reduce the amount of gold CRMs used, but consider adding CRMs near the gold cut-off grades at ~ 0.3 g/t for oxide material and ~ 1 g/t for sulfide material.
• As mining progresses into dominantly sulfide material, the CRMs should be changed to sulfide-based CRMs
• Add CRMs to evaluate the quality of the copper and silver assays
• Add CRMs to monitor sulfur assays at the oxide/sulfide boundary (2% S)
• For a QAQC program to be effective, it is important the results are reviewed in real-time and corrective action taken when warranted.
• Send 5 to 10% of the samples to a secondary laboratory for check analysis. The samples should include CRMs to measure the accuracy of the secondary laboratory and samples should be sent on a regular basis, not at the end of the drilling program.
• QAQC results should be monitored on a regular basis during a drilling program, and the laboratory asked to follow up on samples that are outside the acceptable range. The results from the field duplicates indicate that there is high variability within the samples.
• Ensure pulp duplicate data are collected and added to the database. AMEC was unable to review pulp duplicate results.
12.9 Opinion on Adequacy AMEC is of the opinion that the QAQC supports the information in the database, and that the database can be used for Mineral Resource estimation.
Risks and opportunities that may affect the Mineral Resource statement are as follows:
• During the validation process, Alacer was unable to provide collar documentation, down hole survey documentation, and a significant number of drill logs were not able to be provided.
• Site is using a constant 3° magnetic declination correction rather than adjusting annually to account for variations. Currenly the correction should be 5.6.
• Assay certificates to support Rio Tinto drilling should be obtained.
• CRMs to quantify silver and copper assay accuracy should be added.
Çöpler Sulfide Expansion Project Feasibility Study
43-101 Technical Report
Page 13-1
13.0 MINERAL PROCESSING AND METALLURGICAL TESTING
13.1 Historical Testwork Historical testing for Alacer (at the time of testing, Anatolia Minerals Development Ltd.) was conducted on samples from the sulfide resource in several phases. Resource Development Inc. (RDI) performed several sulfide processing scoping level investigations from 2006 to 2009. A two phase program on sulfide resource samples was conducted at SGS Lakefield Research Limited (SGS) in 2009 and 2010 to support a Pre-Feasibility study completed by Samuel Engineering (Samuel, 2011). A QEMSCAN mineralogy study on six (6) oxide and three (3) sulfide resource samples was performed by AMMTEC in December 2008.
The historical work completed at both RDI and SGS concentrated on evaluating sulfide resource processing options including direct cyanidation, flotation, cyanidation of flotation concentrates, pressure oxidation (POX) coupled with cyanidation and roasting coupled with cyanidation. The evaluation of the historical data in the Pre-Feasibility Study resulted in the selection of pressure oxidation coupled with cyanidation as the process to further evaluate with testing and a Feasibility Study.
Initial metallurgical testwork carried out by Resource Development Inc. (RDI) in Denver, Colorado, indicated that 11% to 30% of the gold content in the Çöpler sulfide resource, as demonstrated by diagnostic leaching, may be amenable to whole cyanidation. 60% to 80% of the gold content was associated with sulfide minerals and would require some type of oxidation step to liberate the gold for cyanidation.
The RDI scoping studies indicated that pre-treatment using POX was the most effective treatment and displayed the potential to achieve greater than 90% gold extractions. Flotation tests indicated that gold could be recovered by flotation but the concentrates were low grade with relatively high mass pulls and relatively low gold recovery. Testwork indicated that flotation concentrates and tailings did not leach well using cyanide, even after being finely ground.
The scoping test program on the samples by SGS Canada (SGS) in 2009 was used to evaluate the findings of RDI and to develop the metallurgical flowsheet. Results from the flotation testwork were consistent with the RDI tests, demonstrating that it was not likely that a saleable copper concentrate or other saleable sulfide concentrate could be produced.
Test results also demonstrated the Çöpler sulfide resource was refractory to direct cyanidation without a pre-treatment oxidation step. Pressure oxidation was able to oxidize 90% to 99% of the sulfide content and provide gold extractions consistently in the range of 90% to 96%. Roasting was able to oxidize the contained sulfide minerals; however, gold was not fully liberated for cyanidation, yielding gold cyanidation extractions around 79%.
In 2010, a second phase of metallurgical testing was completed by SGS to support a Pre-Feasibility Study, with the sulfide process focused on pressure oxidation followed by cyanidation.
A master composite (Master Composite B) was constructed for use in the 2010 SGS test program. The batch POX and CIL tests on Master Composite B testing the various POX process variables indicated the following:
Çöpler Sulfide Expansion Project Feasibility Study
43-101 Technical Report
Page 13-2
Grind Variation Sulfide sulfur oxidation rate and extent increased by going from a P80 of 165 µm to a P80 of 101 µm. The 76 micron grind size appeared to have a somewhat faster oxidation rate but had the same overall oxidation at 90 minutes. Gold extraction is slightly affected by grind size improving only by about 1% (97.4% Au extraction versus 96.9% Au extraction) when ground to a P80 of 101 µm versus a P80 of 165 µm and no change with a 76 micron grind. Copper extraction showed a large increase with fine grinding showing 60 minute extractions of 73% at 165 µm, 79% at 79 µm, and 90% at 76 µm. A similar trend was observed for the 90 minute retention times. Silver extraction was not discernibly affected by grinding and was uniformly low ranging from 4.3% to 6.2% for the three tests. Sodium cyanide consumption showed a downward trend with finer grind probably reflecting increased copper removal in the POX with a finer grind.
POX Temperature Variation Operation of the POX process at 220°C resulted in faster sulfide sulfur oxidation kinetics than at 200°C. Copper extraction was faster with the higher temperature which is directly related to the faster sulfide sulfur oxidation rate.
POX O2 Overpressure Variation Operation of the POX process at higher oxygen overpressure results in faster sulfide sulfur oxidation. Copper extraction was faster due to the faster sulfide sulfur oxidation rate.
Effect of Pregnant Leach Solution (PLS) Recycle to POX No discernable effects of recycle of POX PLS to POX were observed.
Bulk POX and CIL Tests Several batch POX tests were performed to generate samples for cyanide destruction testing, solid/liquid separation testing, solution neutralization and copper precipitation tests, and for environmental characterization testing.
The large batch POX test results were consistent with the small batch testing on Master Composite B.
The gold extraction on the large batch CIL was somewhat lower at 92.5%, in comparison to the other small scale batch tests which were consistently in the range of 95% to 96%. Silver extraction at 1.5% was somewhat lower than the other batch tests which ranged from 3 to 7.5%. Cyanide consumption was up significantly at 1.4 kg/t whereas most of the small tests were generally in the range of 0.4 kg/t to 1.0 kg/t. Lime addition was also significantly higher at 11.0 kg/t versus a range of 5.5 to 8.9 kg/t on the other batch tests.
The differences in the large batch test CIL could be due to more sample volume available for assays or other test scale differences.
The main conclusions of the 2010 SGS test program were that pressure oxidation followed by cyanidation of POX residues continued to achieve superior gold extractions as compared to alternative treatment options including ultra-fine grinding followed by direct cyanidation and Albion oxidation followed by cyanidation.
SGS testing demonstrated that the SO2/Air cyanide destruction process could be used following cyanidation of POX residues. Several batch tests indicated that the POX
Çöpler Sulfide Expansion Project Feasibility Study
43-101 Technical Report
Page 13-3
pregnant solution could be neutralized with limestone followed by copper precipitation using NaHS. This is consistent with previous testwork.
Mineralogy 13.1.1In December of 2008, Alacer had QEMSCAN PMS, TMS, and EDS mineralogy analyses performed on three sulfide resource samples by AMMTEC Ltd. Analyses were performed on samples of Diorite, Metasediments (MTS), and Massive Pyrite rock types.
The findings from the 2008 QEMSCAN analyses indicated that the gangue mineralization in the sulfide resource is composed mainly of quartz, micas/clays and feldspars (displaying relative abundances of approximately 30.6%, 26.9%, and 20.8%, respectively). The sulfide mineralization consists of pyrite, arsenopyrite, chalcopyrite and sphalerite.
A gold deportment study was performed by AMTEL Ltd. on a sample of MC4 composite and concluded the gold is primarily carried by sulfide minerals with the overwhelming majority of the gold present in a submicroscopic form. Arsenopyrite is the principal carrier of submicroscopic gold followed by pyrite of secondary importance. Gold mineral grains are a secondary form of gold in the sample with the gold being carried by grains of less than 5 µm in size and would be difficult to recover by flotation. Direct cyanidation at P80 of 90 µm, extracted only 17% of the gold. An additional 10% of the gold was extracted using ultra-fine grinding (P80 of 5 µm) and cyanidation. AMTEL indicated that the gold deportment dictates processing incorporating either whole pre-oxidation or flotation.
Figure 13-1 taken from the AMTEL report graphically shows the gold deportment based on size.
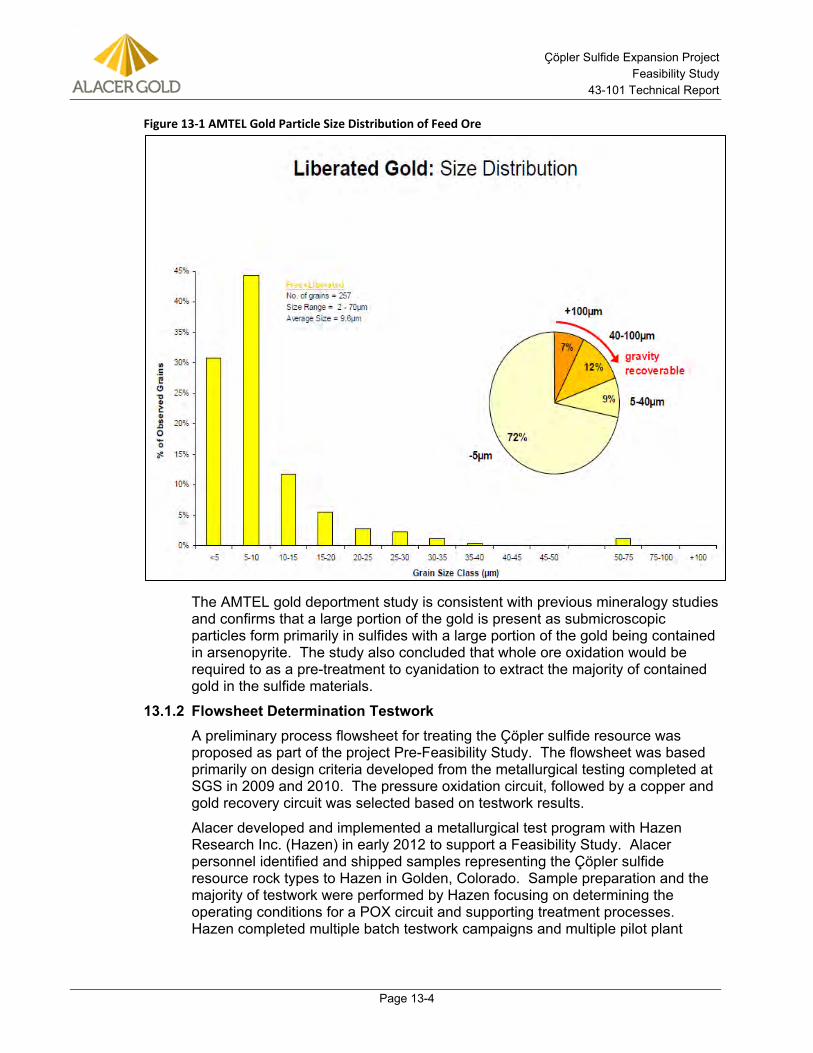
Çöpler Sulfide Expansion Project Feasibility Study
43-101 Technical Report
Page 13-4
Figure 13-1 AMTEL Gold Particle Size Distribution of Feed Ore
The AMTEL gold deportment study is consistent with previous mineralogy studies and confirms that a large portion of the gold is present as submicroscopic particles form primarily in sulfides with a large portion of the gold being contained in arsenopyrite. The study also concluded that whole ore oxidation would be required to as a pre-treatment to cyanidation to extract the majority of contained gold in the sulfide materials.
Flowsheet Determination Testwork 13.1.2A preliminary process flowsheet for treating the Çöpler sulfide resource was proposed as part of the project Pre-Feasibility Study. The flowsheet was based primarily on design criteria developed from the metallurgical testing completed at SGS in 2009 and 2010. The pressure oxidation circuit, followed by a copper and gold recovery circuit was selected based on testwork results.
Alacer developed and implemented a metallurgical test program with Hazen Research Inc. (Hazen) in early 2012 to support a Feasibility Study. Alacer personnel identified and shipped samples representing the Çöpler sulfide resource rock types to Hazen in Golden, Colorado. Sample preparation and the majority of testwork were performed by Hazen focusing on determining the operating conditions for a POX circuit and supporting treatment processes. Hazen completed multiple batch testwork campaigns and multiple pilot plant
Çöpler Sulfide Expansion Project Feasibility Study
43-101 Technical Report
Page 13-5
campaigns. These phases are denoted as Campaigns 1 through 4. Additional testwork was performed by other firms supporting the test program at Hazen.
The first objective of the campaigns 1 through 4 metallurgical test programs was to develop a feasible pressure oxidation process for the Çöpler Sulfide resource coupled with conventional cyanidation of pressure oxidation residues for the recovery of gold and copper values. The second objective was to develop metallurgical data to support completion of a Feasibility Study. This included developing the data to demonstrate on a continuous basis from pilot plant operation that the pressure oxidation process would successfully treat the Çöpler sulfide resource to recover metal values.
The four test campaigns were also designed to determine the metallurgical response variability of the Çöpler sulfide resource to the selected operating parameters using a number of sulfide resource samples representing the depth and breadth of the resource. The tests were also designed to develop data to project metal recoveries, process reagent requirements, and to support process equipment sizing and selection.
Head Characterization 13.1.3Detailed head assays and multi-element assays for each composite used for Hazen Campaigns 1 through 4 were performed. Additionally, detailed head analysis on samples used for batch variability testing programs VSP1 and VSP2 was performed.
Table 13-1 shows the head assays and multi-element assays for the individual rock type composites (Diorite, Metasediments, Massive Pyrite, Gossan, Marble, and Manganese Diorite), the assays for Master Composites 1 and 2 (MC1 and MC2) and for the Manganese Diorite composite used for metallurgical test work in Campaigns 1 to 3.
The analyses shown in Table 13-1 are consistent with the sample analyses noted in the historical metallurgical data.
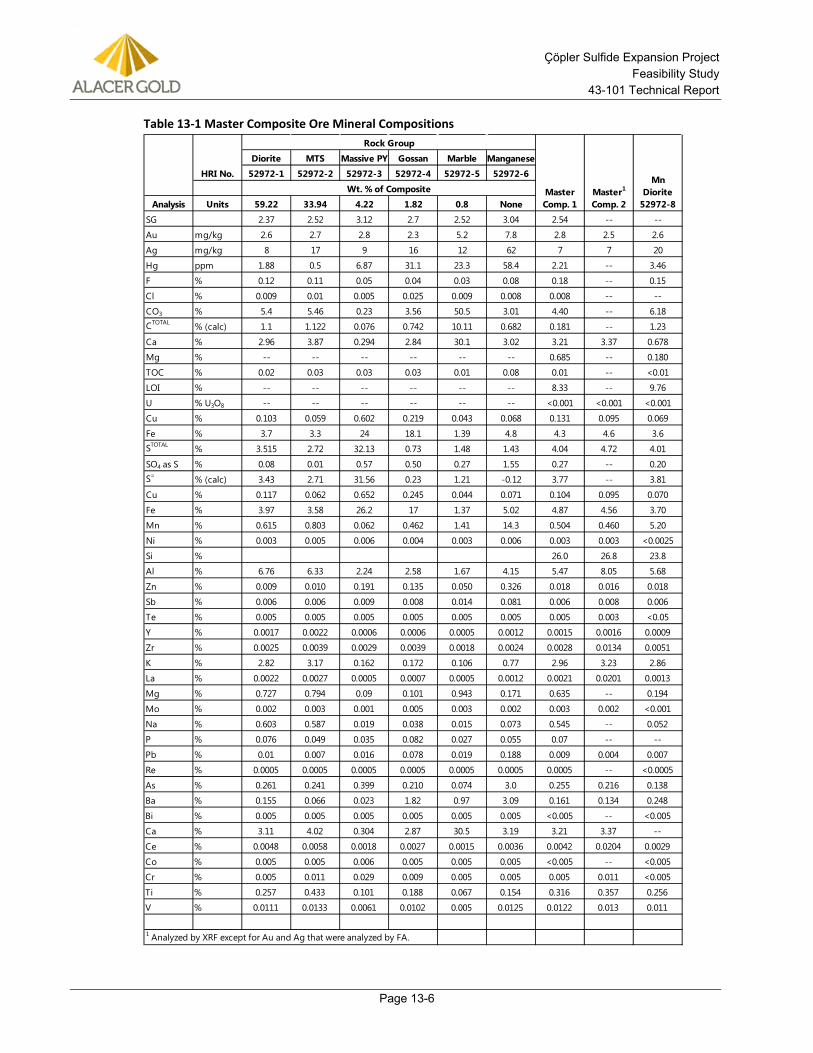
Çöpler Sulfide Expansion Project Feasibility Study
43-101 Technical Report
Page 13-6
Table 13-1 Master Composite Ore Mineral Compositions
Rock Group
Diorite MTS Massive PY Gossan Marble Manganese
52972-1 52972-2 52972-3 52972-4 52972-5 52972-6
Analysis Units 59.22 33.94 4.22 1.82 0.8 None
SG 2.37 2.52 3.12 2.7 2.52 3.04 2.54 -- --
Au mg/kg 2.6 2.7 2.8 2.3 5.2 7.8 2.8 2.5 2.6
Ag mg/kg 8 17 9 16 12 62 7 7 20
Hg ppm 1.88 0.5 6.87 31.1 23.3 58.4 2.21 -- 3.46
F % 0.12 0.11 0.05 0.04 0.03 0.08 0.18 -- 0.15
Cl % 0.009 0.01 0.005 0.025 0.009 0.008 0.008 -- --
CO3 % 5.4 5.46 0.23 3.56 50.5 3.01 4.40 -- 6.18CTOTAL % (calc) 1.1 1.122 0.076 0.742 10.11 0.682 0.181 -- 1.23
Ca % 2.96 3.87 0.294 2.84 30.1 3.02 3.21 3.37 0.678
Mg % -- -- -- -- -- -- 0.685 -- 0.180
TOC % 0.02 0.03 0.03 0.03 0.01 0.08 0.01 -- <0.01
LOI % -- -- -- -- -- -- 8.33 -- 9.76
U % U3O8 -- -- -- -- -- -- <0.001 <0.001 <0.001
Cu % 0.103 0.059 0.602 0.219 0.043 0.068 0.131 0.095 0.069
Fe % 3.7 3.3 24 18.1 1.39 4.8 4.3 4.6 3.6STOTAL % 3.515 2.72 32.13 0.73 1.48 1.43 4.04 4.72 4.01
SO4 as S % 0.08 0.01 0.57 0.50 0.27 1.55 0.27 -- 0.20S= % (calc) 3.43 2.71 31.56 0.23 1.21 -0.12 3.77 -- 3.81
Cu % 0.117 0.062 0.652 0.245 0.044 0.071 0.104 0.095 0.070
Fe % 3.97 3.58 26.2 17 1.37 5.02 4.87 4.56 3.70
Mn % 0.615 0.803 0.062 0.462 1.41 14.3 0.504 0.460 5.20
Ni % 0.003 0.005 0.006 0.004 0.003 0.006 0.003 0.003 <0.0025
Si % 26.0 26.8 23.8
Al % 6.76 6.33 2.24 2.58 1.67 4.15 5.47 8.05 5.68
Zn % 0.009 0.010 0.191 0.135 0.050 0.326 0.018 0.016 0.018
Sb % 0.006 0.006 0.009 0.008 0.014 0.081 0.006 0.008 0.006
Te % 0.005 0.005 0.005 0.005 0.005 0.005 0.005 0.003 <0.05
Y % 0.0017 0.0022 0.0006 0.0006 0.0005 0.0012 0.0015 0.0016 0.0009
Zr % 0.0025 0.0039 0.0029 0.0039 0.0018 0.0024 0.0028 0.0134 0.0051
K % 2.82 3.17 0.162 0.172 0.106 0.77 2.96 3.23 2.86
La % 0.0022 0.0027 0.0005 0.0007 0.0005 0.0012 0.0021 0.0201 0.0013
Mg % 0.727 0.794 0.09 0.101 0.943 0.171 0.635 -- 0.194
Mo % 0.002 0.003 0.001 0.005 0.003 0.002 0.003 0.002 <0.001
Na % 0.603 0.587 0.019 0.038 0.015 0.073 0.545 -- 0.052
P % 0.076 0.049 0.035 0.082 0.027 0.055 0.07 -- --
Pb % 0.01 0.007 0.016 0.078 0.019 0.188 0.009 0.004 0.007
Re % 0.0005 0.0005 0.0005 0.0005 0.0005 0.0005 0.0005 -- <0.0005
As % 0.261 0.241 0.399 0.210 0.074 3.0 0.255 0.216 0.138
Ba % 0.155 0.066 0.023 1.82 0.97 3.09 0.161 0.134 0.248
Bi % 0.005 0.005 0.005 0.005 0.005 0.005 <0.005 -- <0.005
Ca % 3.11 4.02 0.304 2.87 30.5 3.19 3.21 3.37 --
Ce % 0.0048 0.0058 0.0018 0.0027 0.0015 0.0036 0.0042 0.0204 0.0029
Co % 0.005 0.005 0.006 0.005 0.005 0.005 <0.005 -- <0.005
Cr % 0.005 0.011 0.029 0.009 0.005 0.005 0.005 0.011 <0.005
Ti % 0.257 0.433 0.101 0.188 0.067 0.154 0.316 0.357 0.256
V % 0.0111 0.0133 0.0061 0.0102 0.005 0.0125 0.0122 0.013 0.011
1 Analyzed by XRF except for Au and Ag that were analyzed by FA.
HRI No.
Master Comp. 1
Master1
Comp. 2
Mn Diorite
52972-8
Wt. % of Composite
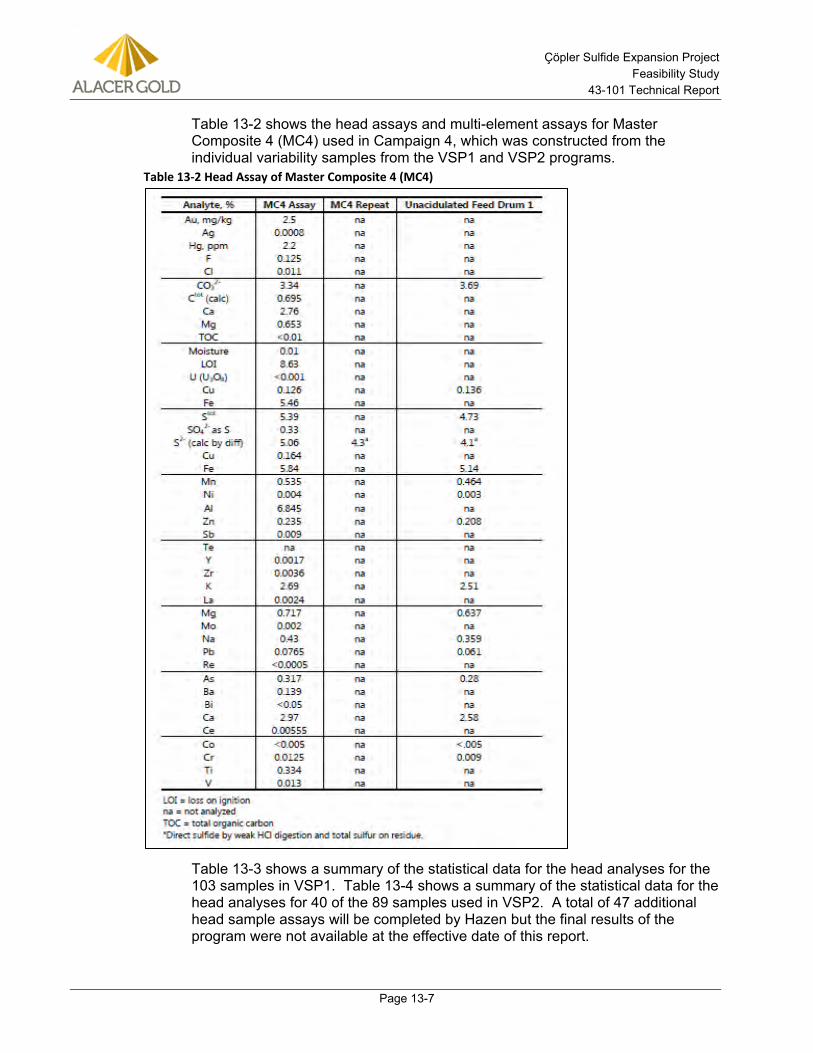
Çöpler Sulfide Expansion Project Feasibility Study
43-101 Technical Report
Page 13-7
Table 13-2 shows the head assays and multi-element assays for Master Composite 4 (MC4) used in Campaign 4, which was constructed from the individual variability samples from the VSP1 and VSP2 programs.
Table 13-2 Head Assay of Master Composite 4 (MC4)
Table 13-3 shows a summary of the statistical data for the head analyses for the 103 samples in VSP1. Table 13-4 shows a summary of the statistical data for the head analyses for 40 of the 89 samples used in VSP2. A total of 47 additional head sample assays will be completed by Hazen but the final results of the program were not available at the effective date of this report.
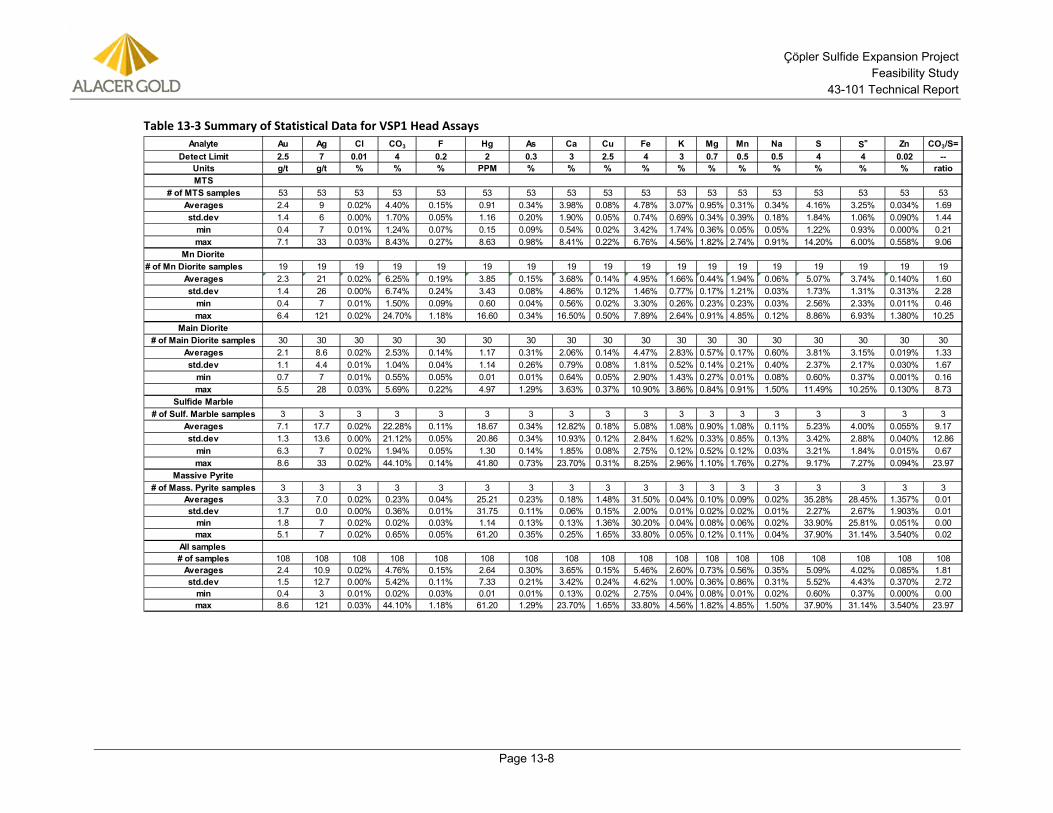
Çöpler Sulfide Expansion Project Feasibility Study
43-101 Technical Report
Page 13-8
Table 13-3 Summary of Statistical Data for VSP1 Head Assays
Analyte Au Ag Cl CO3 F Hg As Ca Cu Fe K Mg Mn Na S S= Zn CO3/S=Detect Limit 2.5 7 0.01 4 0.2 2 0.3 3 2.5 4 3 0.7 0.5 0.5 4 4 0.02 --
Units g/t g/t % % % PPM % % % % % % % % % % % ratioMTS
# of MTS samples 53 53 53 53 53 53 53 53 53 53 53 53 53 53 53 53 53 53Averages 2.4 9 0.02% 4.40% 0.15% 0.91 0.34% 3.98% 0.08% 4.78% 3.07% 0.95% 0.31% 0.34% 4.16% 3.25% 0.034% 1.69std.dev 1.4 6 0.00% 1.70% 0.05% 1.16 0.20% 1.90% 0.05% 0.74% 0.69% 0.34% 0.39% 0.18% 1.84% 1.06% 0.090% 1.44
min 0.4 7 0.01% 1.24% 0.07% 0.15 0.09% 0.54% 0.02% 3.42% 1.74% 0.36% 0.05% 0.05% 1.22% 0.93% 0.000% 0.21max 7.1 33 0.03% 8.43% 0.27% 8.63 0.98% 8.41% 0.22% 6.76% 4.56% 1.82% 2.74% 0.91% 14.20% 6.00% 0.558% 9.06
Mn Diorite# of Mn Diorite samples 19 19 19 19 19 19 19 19 19 19 19 19 19 19 19 19 19 19
Averages 2.3 21 0.02% 6.25% 0.19% 3.85 0.15% 3.68% 0.14% 4.95% 1.66% 0.44% 1.94% 0.06% 5.07% 3.74% 0.140% 1.60std.dev 1.4 26 0.00% 6.74% 0.24% 3.43 0.08% 4.86% 0.12% 1.46% 0.77% 0.17% 1.21% 0.03% 1.73% 1.31% 0.313% 2.28
min 0.4 7 0.01% 1.50% 0.09% 0.60 0.04% 0.56% 0.02% 3.30% 0.26% 0.23% 0.23% 0.03% 2.56% 2.33% 0.011% 0.46max 6.4 121 0.02% 24.70% 1.18% 16.60 0.34% 16.50% 0.50% 7.89% 2.64% 0.91% 4.85% 0.12% 8.86% 6.93% 1.380% 10.25
Main Diorite# of Main Diorite samples 30 30 30 30 30 30 30 30 30 30 30 30 30 30 30 30 30 30
Averages 2.1 8.6 0.02% 2.53% 0.14% 1.17 0.31% 2.06% 0.14% 4.47% 2.83% 0.57% 0.17% 0.60% 3.81% 3.15% 0.019% 1.33std.dev 1.1 4.4 0.01% 1.04% 0.04% 1.14 0.26% 0.79% 0.08% 1.81% 0.52% 0.14% 0.21% 0.40% 2.37% 2.17% 0.030% 1.67
min 0.7 7 0.01% 0.55% 0.05% 0.01 0.01% 0.64% 0.05% 2.90% 1.43% 0.27% 0.01% 0.08% 0.60% 0.37% 0.001% 0.16max 5.5 28 0.03% 5.69% 0.22% 4.97 1.29% 3.63% 0.37% 10.90% 3.86% 0.84% 0.91% 1.50% 11.49% 10.25% 0.130% 8.73
Sulfide Marble# of Sulf. Marble samples 3 3 3 3 3 3 3 3 3 3 3 3 3 3 3 3 3 3
Averages 7.1 17.7 0.02% 22.28% 0.11% 18.67 0.34% 12.82% 0.18% 5.08% 1.08% 0.90% 1.08% 0.11% 5.23% 4.00% 0.055% 9.17std.dev 1.3 13.6 0.00% 21.12% 0.05% 20.86 0.34% 10.93% 0.12% 2.84% 1.62% 0.33% 0.85% 0.13% 3.42% 2.88% 0.040% 12.86
min 6.3 7 0.02% 1.94% 0.05% 1.30 0.14% 1.85% 0.08% 2.75% 0.12% 0.52% 0.12% 0.03% 3.21% 1.84% 0.015% 0.67max 8.6 33 0.02% 44.10% 0.14% 41.80 0.73% 23.70% 0.31% 8.25% 2.96% 1.10% 1.76% 0.27% 9.17% 7.27% 0.094% 23.97
Massive Pyrite# of Mass. Pyrite samples 3 3 3 3 3 3 3 3 3 3 3 3 3 3 3 3 3 3
Averages 3.3 7.0 0.02% 0.23% 0.04% 25.21 0.23% 0.18% 1.48% 31.50% 0.04% 0.10% 0.09% 0.02% 35.28% 28.45% 1.357% 0.01std.dev 1.7 0.0 0.00% 0.36% 0.01% 31.75 0.11% 0.06% 0.15% 2.00% 0.01% 0.02% 0.02% 0.01% 2.27% 2.67% 1.903% 0.01
min 1.8 7 0.02% 0.02% 0.03% 1.14 0.13% 0.13% 1.36% 30.20% 0.04% 0.08% 0.06% 0.02% 33.90% 25.81% 0.051% 0.00max 5.1 7 0.02% 0.65% 0.05% 61.20 0.35% 0.25% 1.65% 33.80% 0.05% 0.12% 0.11% 0.04% 37.90% 31.14% 3.540% 0.02
All samples # of samples 108 108 108 108 108 108 108 108 108 108 108 108 108 108 108 108 108 108
Averages 2.4 10.9 0.02% 4.76% 0.15% 2.64 0.30% 3.65% 0.15% 5.46% 2.60% 0.73% 0.56% 0.35% 5.09% 4.02% 0.085% 1.81std.dev 1.5 12.7 0.00% 5.42% 0.11% 7.33 0.21% 3.42% 0.24% 4.62% 1.00% 0.36% 0.86% 0.31% 5.52% 4.43% 0.370% 2.72
min 0.4 3 0.01% 0.02% 0.03% 0.01 0.01% 0.13% 0.02% 2.75% 0.04% 0.08% 0.01% 0.02% 0.60% 0.37% 0.000% 0.00max 8.6 121 0.03% 44.10% 1.18% 61.20 1.29% 23.70% 1.65% 33.80% 4.56% 1.82% 4.85% 1.50% 37.90% 31.14% 3.540% 23.97
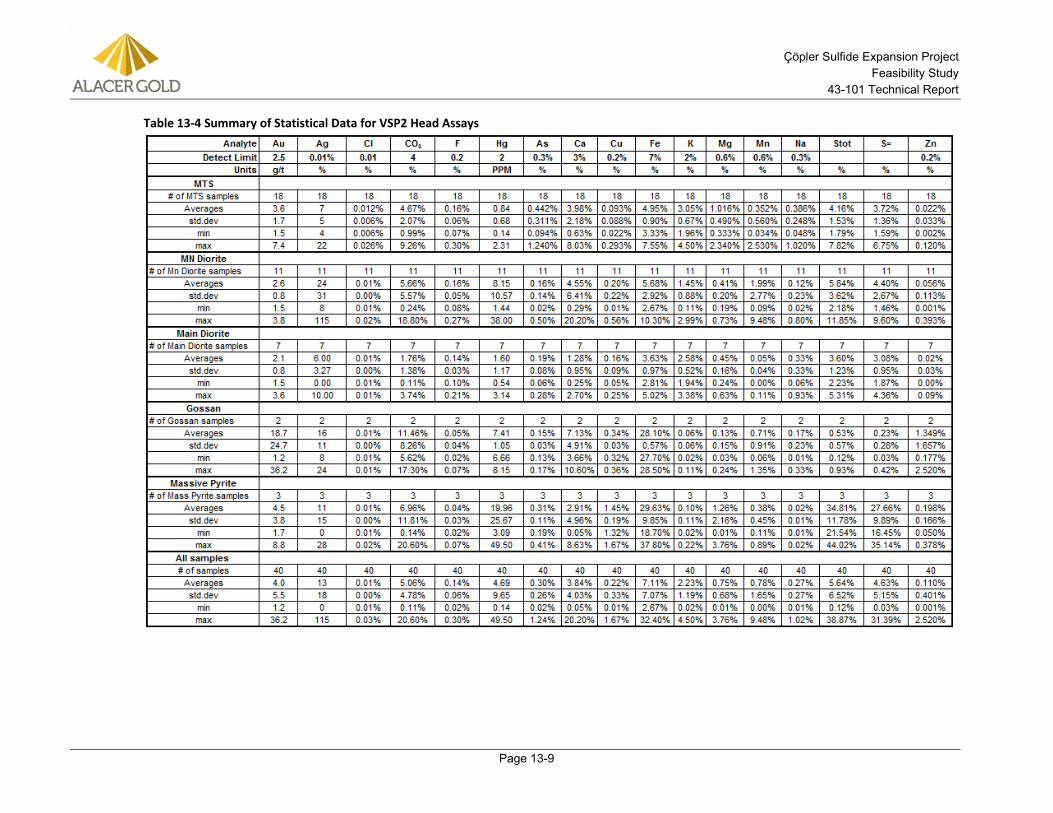
Çöpler Sulfide Expansion Project Feasibility Study
43-101 Technical Report
Page 13-9
Table 13-4 Summary of Statistical Data for VSP2 Head Assays
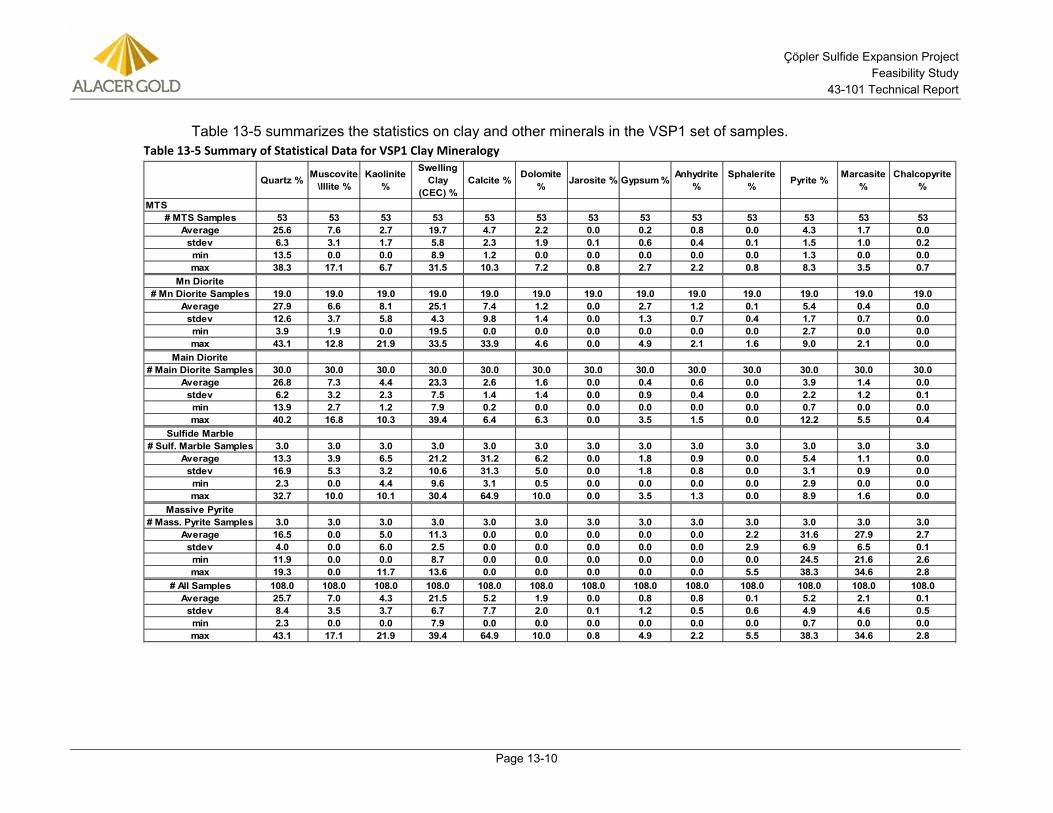
Çöpler Sulfide Expansion Project Feasibility Study
43-101 Technical Report
Page 13-10
Table 13-5 summarizes the statistics on clay and other minerals in the VSP1 set of samples. Table 13-5 Summary of Statistical Data for VSP1 Clay Mineralogy
Quartz % Muscovite\Illite %
Kaolinite %
Swelling Clay
(CEC) %Calcite % Dolomite
% Jarosite % Gypsum % Anhydrite %
Sphalerite % Pyrite % Marcasite
%Chalcopyrite
%
MTS# MTS Samples 53 53 53 53 53 53 53 53 53 53 53 53 53
Average 25.6 7.6 2.7 19.7 4.7 2.2 0.0 0.2 0.8 0.0 4.3 1.7 0.0stdev 6.3 3.1 1.7 5.8 2.3 1.9 0.1 0.6 0.4 0.1 1.5 1.0 0.2min 13.5 0.0 0.0 8.9 1.2 0.0 0.0 0.0 0.0 0.0 1.3 0.0 0.0max 38.3 17.1 6.7 31.5 10.3 7.2 0.8 2.7 2.2 0.8 8.3 3.5 0.7
Mn Diorite# Mn Diorite Samples 19.0 19.0 19.0 19.0 19.0 19.0 19.0 19.0 19.0 19.0 19.0 19.0 19.0
Average 27.9 6.6 8.1 25.1 7.4 1.2 0.0 2.7 1.2 0.1 5.4 0.4 0.0stdev 12.6 3.7 5.8 4.3 9.8 1.4 0.0 1.3 0.7 0.4 1.7 0.7 0.0min 3.9 1.9 0.0 19.5 0.0 0.0 0.0 0.0 0.0 0.0 2.7 0.0 0.0max 43.1 12.8 21.9 33.5 33.9 4.6 0.0 4.9 2.1 1.6 9.0 2.1 0.0
Main Diorite# Main Diorite Samples 30.0 30.0 30.0 30.0 30.0 30.0 30.0 30.0 30.0 30.0 30.0 30.0 30.0
Average 26.8 7.3 4.4 23.3 2.6 1.6 0.0 0.4 0.6 0.0 3.9 1.4 0.0stdev 6.2 3.2 2.3 7.5 1.4 1.4 0.0 0.9 0.4 0.0 2.2 1.2 0.1min 13.9 2.7 1.2 7.9 0.2 0.0 0.0 0.0 0.0 0.0 0.7 0.0 0.0max 40.2 16.8 10.3 39.4 6.4 6.3 0.0 3.5 1.5 0.0 12.2 5.5 0.4
Sulfide Marble# Sulf. Marble Samples 3.0 3.0 3.0 3.0 3.0 3.0 3.0 3.0 3.0 3.0 3.0 3.0 3.0
Average 13.3 3.9 6.5 21.2 31.2 6.2 0.0 1.8 0.9 0.0 5.4 1.1 0.0stdev 16.9 5.3 3.2 10.6 31.3 5.0 0.0 1.8 0.8 0.0 3.1 0.9 0.0min 2.3 0.0 4.4 9.6 3.1 0.5 0.0 0.0 0.0 0.0 2.9 0.0 0.0max 32.7 10.0 10.1 30.4 64.9 10.0 0.0 3.5 1.3 0.0 8.9 1.6 0.0
Massive Pyrite# Mass. Pyrite Samples 3.0 3.0 3.0 3.0 3.0 3.0 3.0 3.0 3.0 3.0 3.0 3.0 3.0
Average 16.5 0.0 5.0 11.3 0.0 0.0 0.0 0.0 0.0 2.2 31.6 27.9 2.7stdev 4.0 0.0 6.0 2.5 0.0 0.0 0.0 0.0 0.0 2.9 6.9 6.5 0.1min 11.9 0.0 0.0 8.7 0.0 0.0 0.0 0.0 0.0 0.0 24.5 21.6 2.6max 19.3 0.0 11.7 13.6 0.0 0.0 0.0 0.0 0.0 5.5 38.3 34.6 2.8
# All Samples 108.0 108.0 108.0 108.0 108.0 108.0 108.0 108.0 108.0 108.0 108.0 108.0 108.0Average 25.7 7.0 4.3 21.5 5.2 1.9 0.0 0.8 0.8 0.1 5.2 2.1 0.1
stdev 8.4 3.5 3.7 6.7 7.7 2.0 0.1 1.2 0.5 0.6 4.9 4.6 0.5min 2.3 0.0 0.0 7.9 0.0 0.0 0.0 0.0 0.0 0.0 0.7 0.0 0.0max 43.1 17.1 21.9 39.4 64.9 10.0 0.8 4.9 2.2 5.5 38.3 34.6 2.8
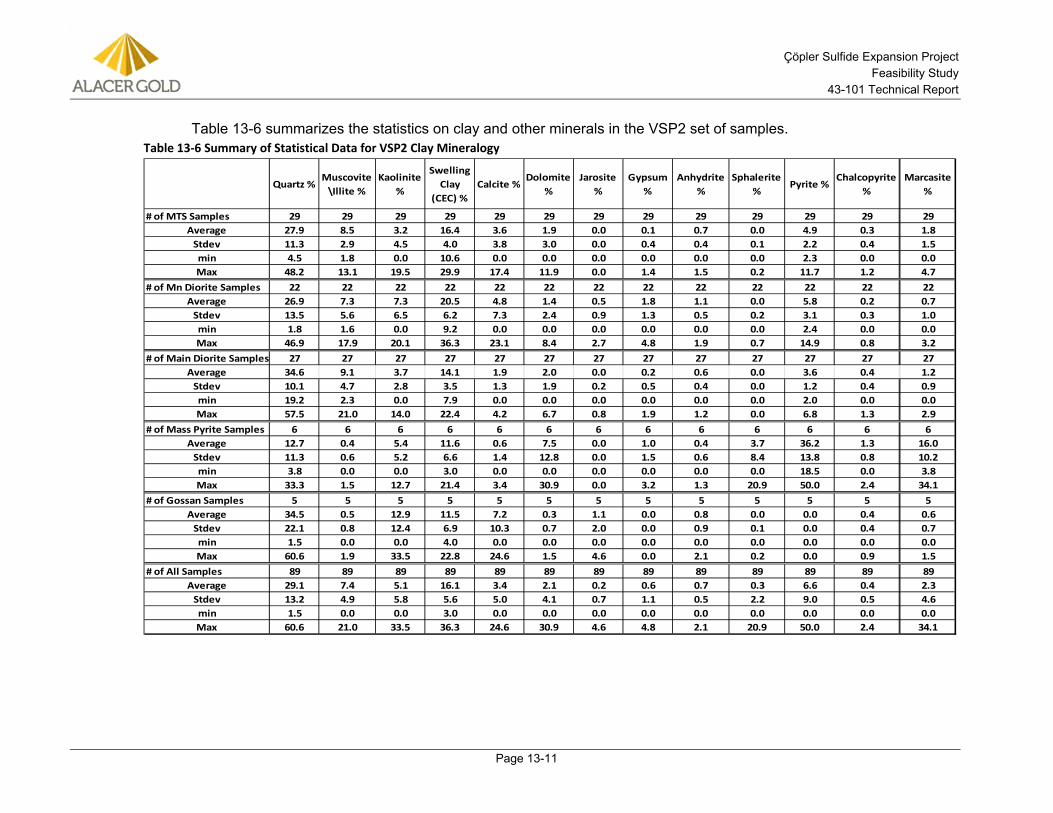
Çöpler Sulfide Expansion Project Feasibility Study
43-101 Technical Report
Page 13-11
Table 13-6 summarizes the statistics on clay and other minerals in the VSP2 set of samples. Table 13-6 Summary of Statistical Data for VSP2 Clay Mineralogy
Quartz %Muscovite
\Illite %Kaolinite
%
Swelling Clay
(CEC) %Calcite %
Dolomite %
Jarosite %
Gypsum %
Anhydrite %
Sphalerite %
Pyrite %Chalcopyrite
%Marcasite
%
# of MTS Samples 29 29 29 29 29 29 29 29 29 29 29 29 29Average 27.9 8.5 3.2 16.4 3.6 1.9 0.0 0.1 0.7 0.0 4.9 0.3 1.8
Stdev 11.3 2.9 4.5 4.0 3.8 3.0 0.0 0.4 0.4 0.1 2.2 0.4 1.5min 4.5 1.8 0.0 10.6 0.0 0.0 0.0 0.0 0.0 0.0 2.3 0.0 0.0Max 48.2 13.1 19.5 29.9 17.4 11.9 0.0 1.4 1.5 0.2 11.7 1.2 4.7
# of Mn Diorite Samples 22 22 22 22 22 22 22 22 22 22 22 22 22Average 26.9 7.3 7.3 20.5 4.8 1.4 0.5 1.8 1.1 0.0 5.8 0.2 0.7
Stdev 13.5 5.6 6.5 6.2 7.3 2.4 0.9 1.3 0.5 0.2 3.1 0.3 1.0min 1.8 1.6 0.0 9.2 0.0 0.0 0.0 0.0 0.0 0.0 2.4 0.0 0.0Max 46.9 17.9 20.1 36.3 23.1 8.4 2.7 4.8 1.9 0.7 14.9 0.8 3.2
# of Main Diorite Samples 27 27 27 27 27 27 27 27 27 27 27 27 27Average 34.6 9.1 3.7 14.1 1.9 2.0 0.0 0.2 0.6 0.0 3.6 0.4 1.2
Stdev 10.1 4.7 2.8 3.5 1.3 1.9 0.2 0.5 0.4 0.0 1.2 0.4 0.9min 19.2 2.3 0.0 7.9 0.0 0.0 0.0 0.0 0.0 0.0 2.0 0.0 0.0Max 57.5 21.0 14.0 22.4 4.2 6.7 0.8 1.9 1.2 0.0 6.8 1.3 2.9
# of Mass Pyrite Samples 6 6 6 6 6 6 6 6 6 6 6 6 6Average 12.7 0.4 5.4 11.6 0.6 7.5 0.0 1.0 0.4 3.7 36.2 1.3 16.0
Stdev 11.3 0.6 5.2 6.6 1.4 12.8 0.0 1.5 0.6 8.4 13.8 0.8 10.2min 3.8 0.0 0.0 3.0 0.0 0.0 0.0 0.0 0.0 0.0 18.5 0.0 3.8Max 33.3 1.5 12.7 21.4 3.4 30.9 0.0 3.2 1.3 20.9 50.0 2.4 34.1
# of Gossan Samples 5 5 5 5 5 5 5 5 5 5 5 5 5Average 34.5 0.5 12.9 11.5 7.2 0.3 1.1 0.0 0.8 0.0 0.0 0.4 0.6
Stdev 22.1 0.8 12.4 6.9 10.3 0.7 2.0 0.0 0.9 0.1 0.0 0.4 0.7min 1.5 0.0 0.0 4.0 0.0 0.0 0.0 0.0 0.0 0.0 0.0 0.0 0.0Max 60.6 1.9 33.5 22.8 24.6 1.5 4.6 0.0 2.1 0.2 0.0 0.9 1.5
# of All Samples 89 89 89 89 89 89 89 89 89 89 89 89 89Average 29.1 7.4 5.1 16.1 3.4 2.1 0.2 0.6 0.7 0.3 6.6 0.4 2.3
Stdev 13.2 4.9 5.8 5.6 5.0 4.1 0.7 1.1 0.5 2.2 9.0 0.5 4.6min 1.5 0.0 0.0 3.0 0.0 0.0 0.0 0.0 0.0 0.0 0.0 0.0 0.0Max 60.6 21.0 33.5 36.3 24.6 30.9 4.6 4.8 2.1 20.9 50.0 2.4 34.1
Çöpler Sulfide Expansion Project Feasibility Study
43-101 Technical Report
Page 13-12
It was noted when comparing the assay data from the variability programs to the composites used for pilot Campaigns 1 to 4, that the gold and silver head grades of the composites are comparable to and consistent with the averages of the variability data. The carbonate and arsenic assays of the composites are also comparable to and consistent with the averages of the variability samples. The manganese content in the Manganese Diorite composite sample is higher than the variability averages but within the variability noted in the variability samples.
The head assaying indicated the following as problematic items: • Swelling Clay Content
• Arsenic Content
• Mercury
Tracking of the response of these items was performed throughout the testing campaigns.
Comminution Tests 13.1.4During the site visit of March 2012, it was discovered that the clay properties of the resource caused severe material handling problems. These started in the existing oxide heap leach crushing plant and continued through the secondary crushing plant. Crushing plant plugging and screen blinding problems were frequent. The site had to blend clay ore with low clay content ore in order to run the existing comminution plant.
The information gathered during the site visit concerning sulfide resource clay feed prompted discarding the Pre-Feasibility conventional crushing and stockpile system for a direct SAG mill feed system from a rotary crusher/sizer unit without any intermediate crushed stockpile.
The core on site was highly broken and not typically intact and competent cylindrical core. The broken nature of the core resulted in several types of comminution test methodologies being employed particularly for the Campaign 4 comminution variability tests in order to develop comminution data for equipment sizing as discussed later in this section.
Thirty of the variability samples were selected for comminution testing. Due to sample size and sample physical characteristics, a varying number of each type of comminution tests were completed, as follows:
• 30 BWi and Ai tests
• 19 SMC drop weight tests (only 19 samples contained enough competent pieces required by the test method)
• 30 SAG Power Index (SPI) and Crusher Index tests
The BWi, Ai and SMC were completed at Hazen, whereas the SPI and Crusher Index were completed at SGS. SPI testing was selected for SAG mill sizing as this was the only type of small sample-size test that uses the whole sample particle-size spectrum to determine SAG mill power requirements. Other methods were deemed not suitable for sizing, due to the highly fragmented nature of the core samples provided.
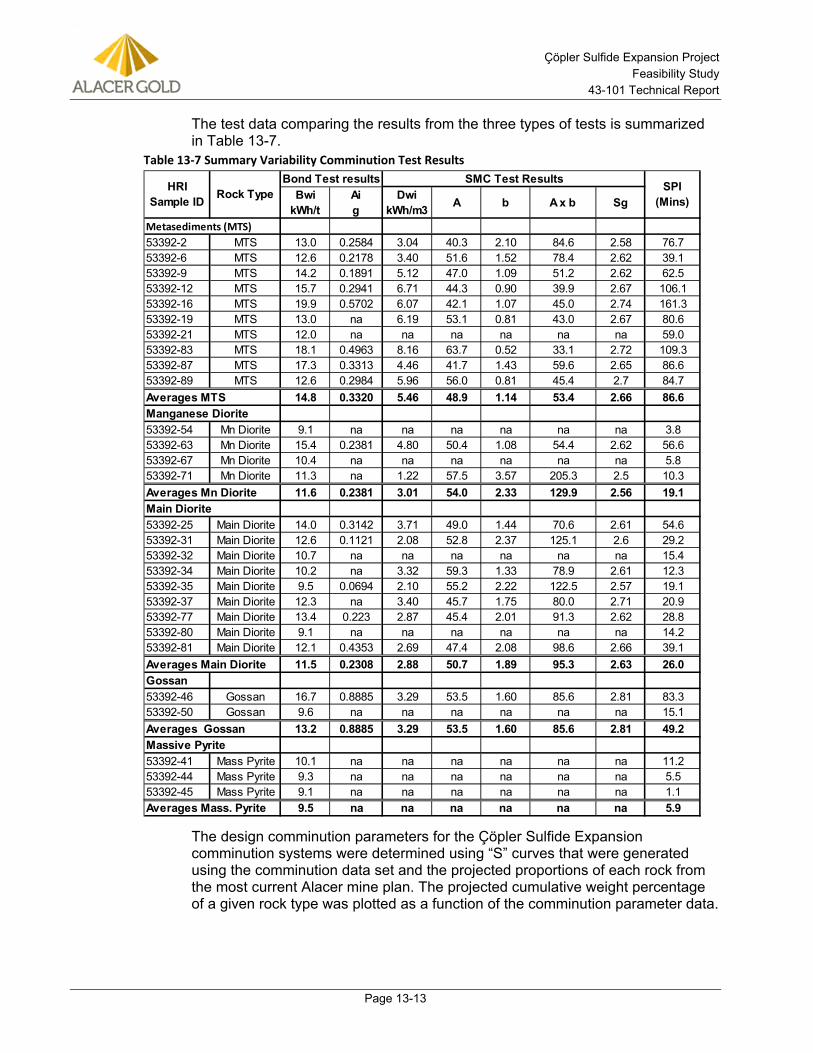
Çöpler Sulfide Expansion Project Feasibility Study
43-101 Technical Report
Page 13-13
The test data comparing the results from the three types of tests is summarized in Table 13-7.
Table 13-7 Summary Variability Comminution Test Results
The design comminution parameters for the Çöpler Sulfide Expansion comminution systems were determined using “S” curves that were generated using the comminution data set and the projected proportions of each rock from the most current Alacer mine plan. The projected cumulative weight percentage of a given rock type was plotted as a function of the comminution parameter data.
BwikWh/t
Aig
Dwi kWh/m3 A b A x b Sg
Metasediments (MTS)53392-2 MTS 13.0 0.2584 3.04 40.3 2.10 84.6 2.58 76.753392-6 MTS 12.6 0.2178 3.40 51.6 1.52 78.4 2.62 39.153392-9 MTS 14.2 0.1891 5.12 47.0 1.09 51.2 2.62 62.553392-12 MTS 15.7 0.2941 6.71 44.3 0.90 39.9 2.67 106.153392-16 MTS 19.9 0.5702 6.07 42.1 1.07 45.0 2.74 161.353392-19 MTS 13.0 na 6.19 53.1 0.81 43.0 2.67 80.653392-21 MTS 12.0 na na na na na na 59.053392-83 MTS 18.1 0.4963 8.16 63.7 0.52 33.1 2.72 109.353392-87 MTS 17.3 0.3313 4.46 41.7 1.43 59.6 2.65 86.653392-89 MTS 12.6 0.2984 5.96 56.0 0.81 45.4 2.7 84.7Averages MTS 14.8 0.3320 5.46 48.9 1.14 53.4 2.66 86.6Manganese Diorite53392-54 Mn Diorite 9.1 na na na na na na 3.853392-63 Mn Diorite 15.4 0.2381 4.80 50.4 1.08 54.4 2.62 56.653392-67 Mn Diorite 10.4 na na na na na na 5.853392-71 Mn Diorite 11.3 na 1.22 57.5 3.57 205.3 2.5 10.3Averages Mn Diorite 11.6 0.2381 3.01 54.0 2.33 129.9 2.56 19.1Main Diorite53392-25 Main Diorite 14.0 0.3142 3.71 49.0 1.44 70.6 2.61 54.653392-31 Main Diorite 12.6 0.1121 2.08 52.8 2.37 125.1 2.6 29.253392-32 Main Diorite 10.7 na na na na na na 15.453392-34 Main Diorite 10.2 na 3.32 59.3 1.33 78.9 2.61 12.353392-35 Main Diorite 9.5 0.0694 2.10 55.2 2.22 122.5 2.57 19.153392-37 Main Diorite 12.3 na 3.40 45.7 1.75 80.0 2.71 20.953392-77 Main Diorite 13.4 0.223 2.87 45.4 2.01 91.3 2.62 28.853392-80 Main Diorite 9.1 na na na na na na 14.253392-81 Main Diorite 12.1 0.4353 2.69 47.4 2.08 98.6 2.66 39.1Averages Main Diorite 11.5 0.2308 2.88 50.7 1.89 95.3 2.63 26.0Gossan53392-46 Gossan 16.7 0.8885 3.29 53.5 1.60 85.6 2.81 83.353392-50 Gossan 9.6 na na na na na na 15.1Averages Gossan 13.2 0.8885 3.29 53.5 1.60 85.6 2.81 49.2Massive Pyrite53392-41 Mass Pyrite 10.1 na na na na na na 11.253392-44 Mass Pyrite 9.3 na na na na na na 5.553392-45 Mass Pyrite 9.1 na na na na na na 1.1Averages Mass. Pyrite 9.5 na na na na na na 5.9
HRI Sample ID
Bond Test resultsRock Type
SMC Test Results SPI(Mins)
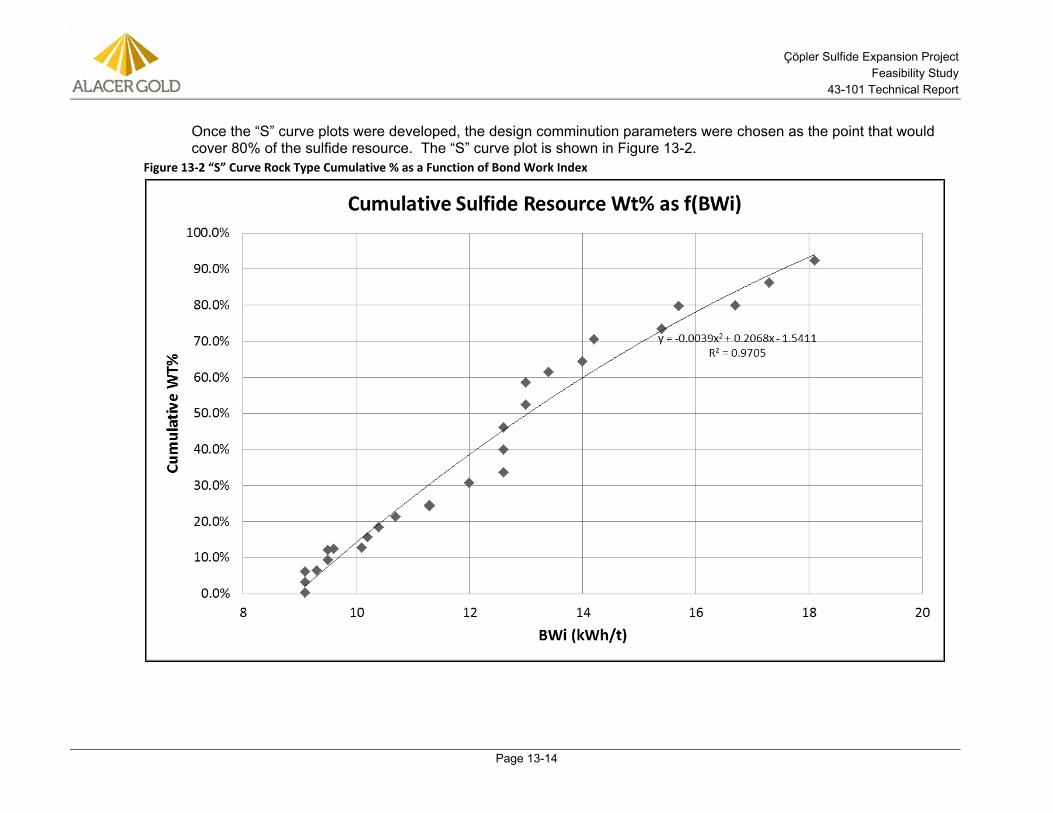
Çöpler Sulfide Expansion Project Feasibility Study
43-101 Technical Report
Page 13-14
Once the “S” curve plots were developed, the design comminution parameters were chosen as the point that would cover 80% of the sulfide resource. The “S” curve plot is shown in Figure 13-2.
Figure 13-2 “S” Curve Rock Type Cumulative % as a Function of Bond Work Index
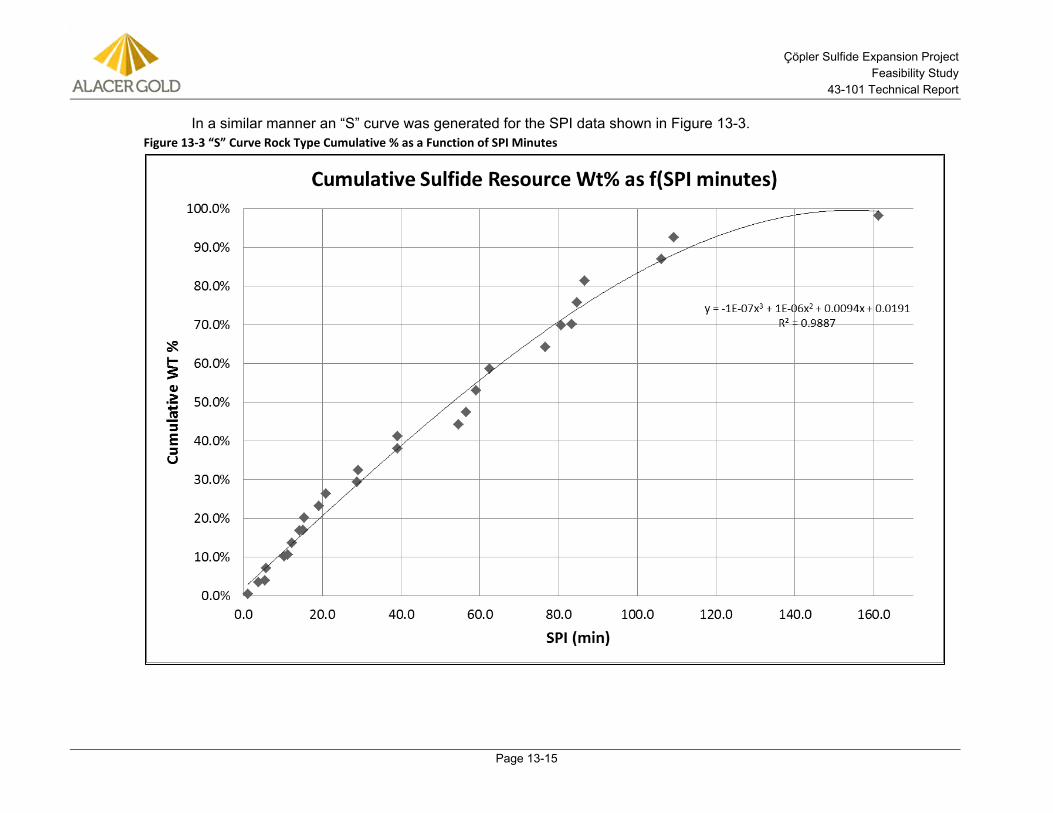
Çöpler Sulfide Expansion Project Feasibility Study
43-101 Technical Report
Page 13-15
In a similar manner an “S” curve was generated for the SPI data shown in Figure 13-3. Figure 13-3 “S” Curve Rock Type Cumulative % as a Function of SPI Minutes
Çöpler Sulfide Expansion Project Feasibility Study
43-101 Technical Report
Page 13-16
Based on the testwork results from Table 13-7 and the “S” curves, the following design parameters were determined for the Feasibility Study:
• BWi of 16.59 kWh/t
• Ai average of 0.3291
• SPI of 94.19 minutes
All design parameters were based on the 80th percentile of test work results. The milling circuit was designed based on the nominal tonnage rate through the plant (245 t/h).
Direct Cyanidation 13.1.5Hazen performed direct cyanidation carbon-in-leach (CIL) tests at various grind sizes with no pretreatment on the individual sulfide rock type composites used in Campaigns 1 to 3 to establish baseline gold extractions. The goal of these tests was to examine gold extraction variability with grind size.
Results are summarized in Table 13-8. The Manganese Composite in the table is for an Oxide Manganese rock type and is not the Manganese Diorite sulfide rock type.
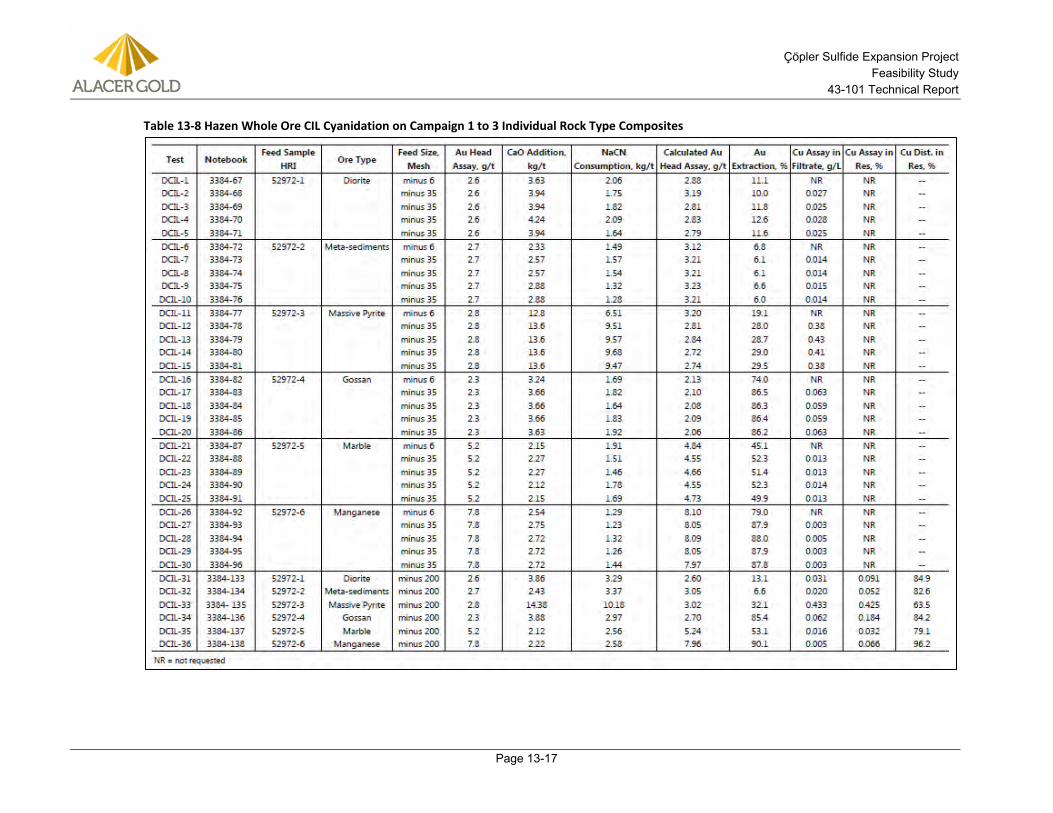
Çöpler Sulfide Expansion Project Feasibility Study
43-101 Technical Report
Page 13-17
Table 13-8 Hazen Whole Ore CIL Cyanidation on Campaign 1 to 3 Individual Rock Type Composites

Çöpler Sulfide Expansion Project Feasibility Study
43-101 Technical Report
Page 13-18
The testwork demonstrated that the bulk of the Çöpler Sulfide samples are refractory to direct cyanidation and extractions do not improve significantly with fine grinding.
Campaign 1 13.1.6Campaign 1 Batch POX and CIL Cyanidation Testing The first portion of the 2012 Campaign 1 metallurgical testing program at Hazen Research consisted of sequential batch POX and batch cyanidation of the POX residues on samples of MC1 to help define initial conditions for the pilot plant testing. The batch tests included acidulation, POX, and CIP testing. A summary of the batch test conditions and results are shown in Table 13-9.
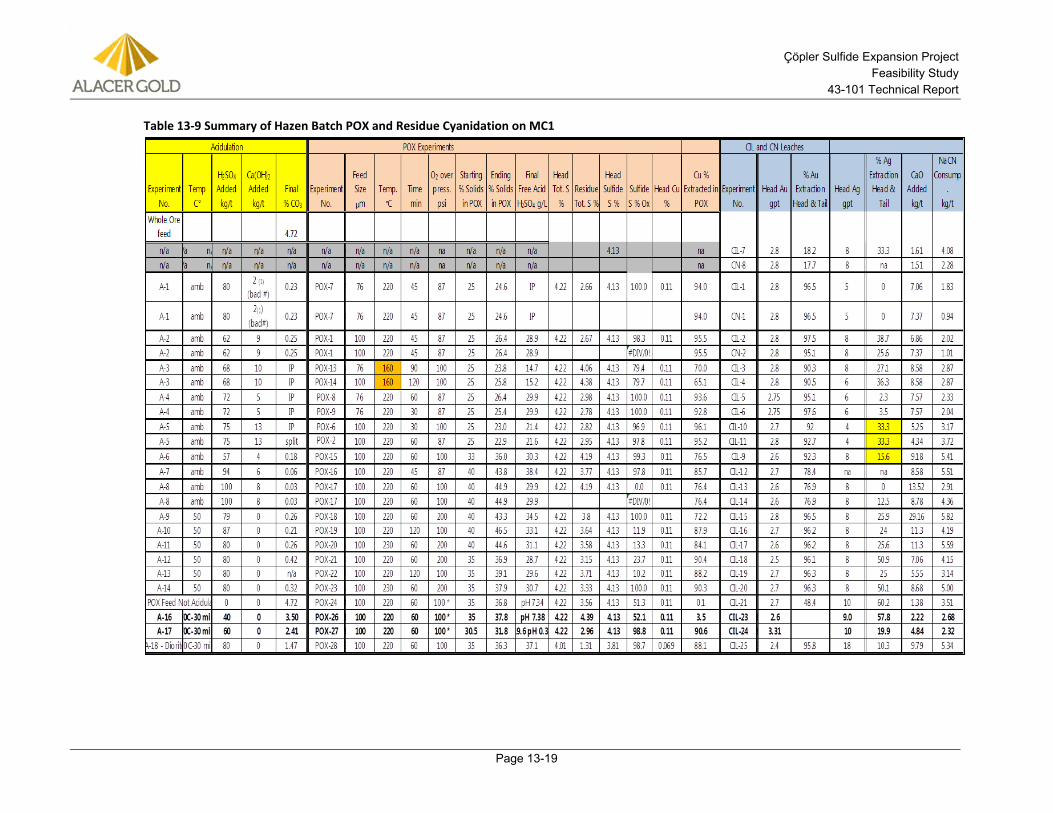
Çöpler Sulfide Expansion Project Feasibility Study
43-101 Technical Report
Page 13-19
Table 13-9 Summary of Hazen Batch POX and Residue Cyanidation on MC1
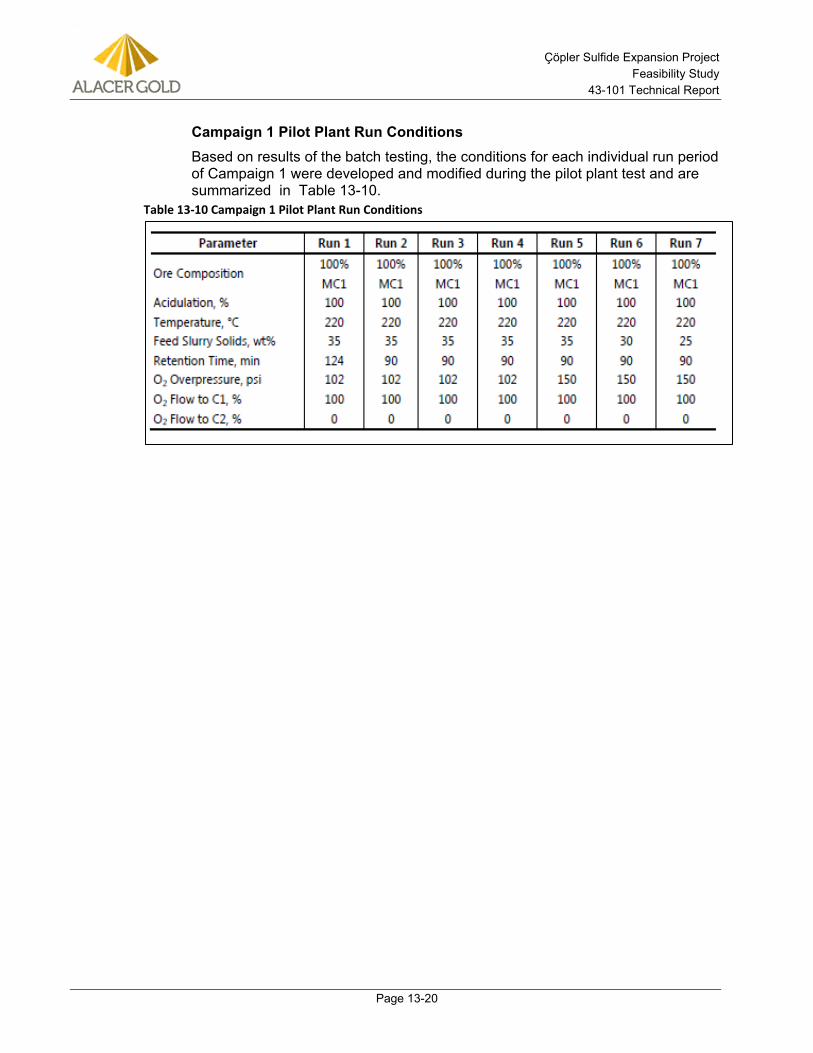
Çöpler Sulfide Expansion Project Feasibility Study
43-101 Technical Report
Page 13-20
Campaign 1 Pilot Plant Run Conditions Based on results of the batch testing, the conditions for each individual run period of Campaign 1 were developed and modified during the pilot plant test and are summarized in Table 13-10.
Table 13-10 Campaign 1 Pilot Plant Run Conditions
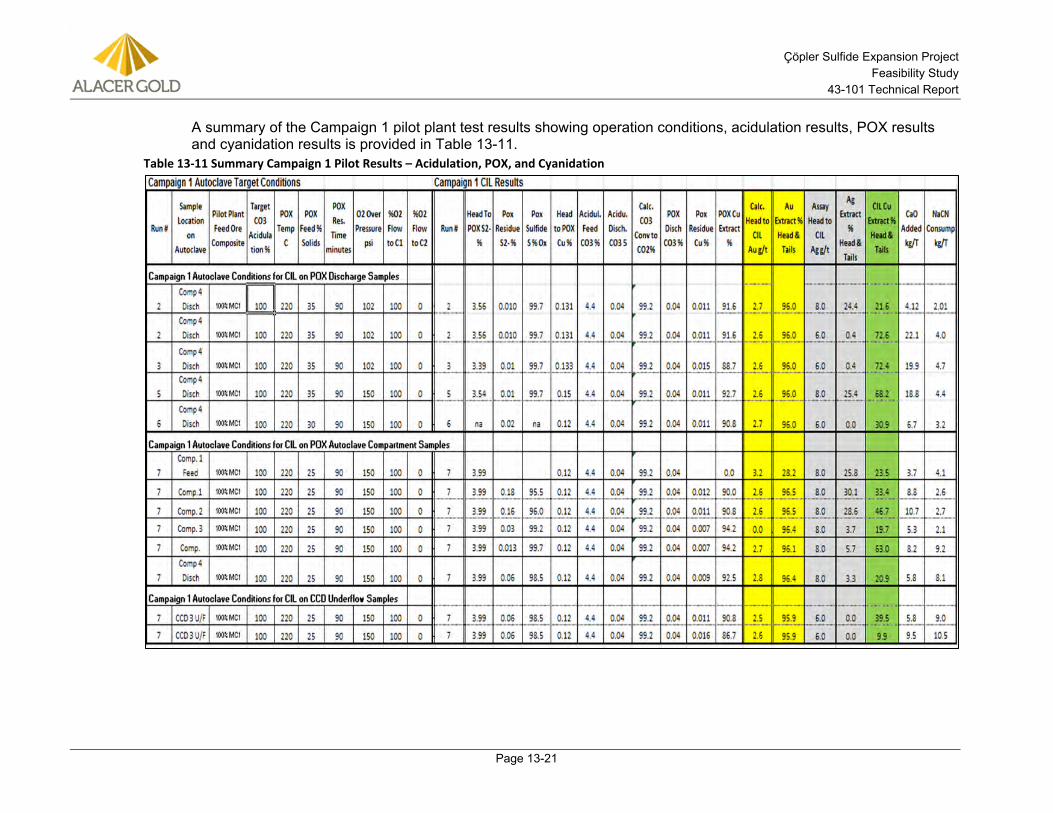
Çöpler Sulfide Expansion Project Feasibility Study
43-101 Technical Report
Page 13-21
A summary of the Campaign 1 pilot plant test results showing operation conditions, acidulation results, POX results and cyanidation results is provided in Table 13-11.
Table 13-11 Summary Campaign 1 Pilot Results – Acidulation, POX, and Cyanidation
Çöpler Sulfide Expansion Project Feasibility Study
43-101 Technical Report
Page 13-22
Following the completion of Campaign 1, and an analysis of the results, it was concluded that sulfide oxidation was very rapid through all run periods with sulfide oxidation in autoclave compartment #1 being approximately 96%.
The major concern with the results was with jarosite formation dominating over hematite formation, and the inability to make a stable POX residue with minimal jarosite content. It was later confirmed that jarosite formation was dominating over hematite formation by mineralogy on two samples of autoclave discharge. It was conjectured that there was is not enough copper to equilibrate with sulfate in solution (i.e. the copper is an acid consumer) which in turn puts sulfate into solution at a rate that is so fast that jarosite precipitation occurs rather than hematite precipitation.
Good gold extractions consistently near 96% were achieved during the runs, coupled with POX Copper extractions consistently between 87 and 93%.Silver extraction was highly variable ranging from a trace extraction to about 30% and likely reflects variable tie-up in jarosites and also a lack of precision in silver assays as a relatively high silver detection limit of 7 g/t was used by Hazen for silver assaying.
Hazen noted some minor scaling in compartment 1 of the pilot autoclave and minimal scaling on the agitators of each compartment. The autoclave compartment assays indicated that essentially all the calcium carbonate in the POX feed had been decomposed in the first compartment.
Following the completion of Campaign 1, a series of POX bench tests were performed to test the concept of controlling jarosite formation to promote hematite formation by slowing and controlling the rate of sulfide oxidation in the autoclave by partial acidulation of the POX feed.
Campaign 2 13.1.7The analysis of the Campaign 1 pilot results resulted in the formation of a set of test objectives and pilot plant operating conditions for the Campaign 2 pilot run. Campaign 2 had two primary objectives:
1. Operate pilot POX system to reduce or eliminate formation of jarosite minerals in the autoclave.
2. Examine the impact of manganese diorite on pressure oxidation performance and downstream operations.
The conditions for each individual run period of Campaign 2 are summarized in Table 13-12 as follows.
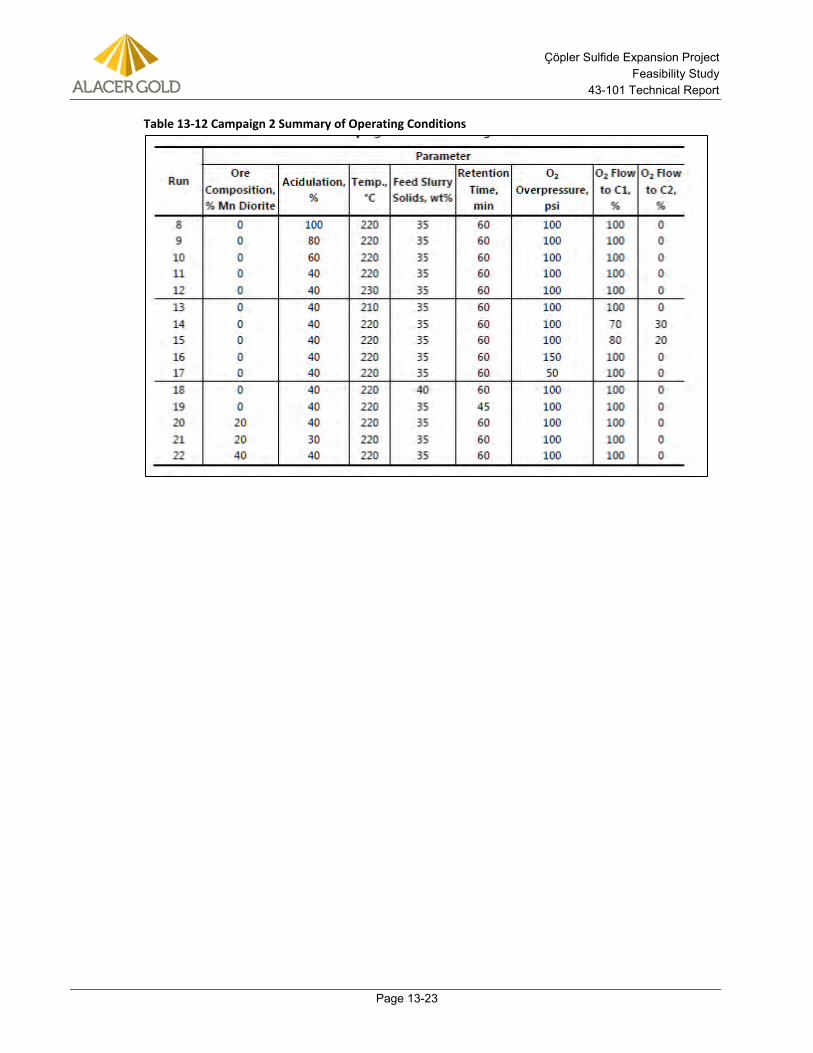
Çöpler Sulfide Expansion Project Feasibility Study
43-101 Technical Report
Page 13-23
Table 13-12 Campaign 2 Summary of Operating Conditions
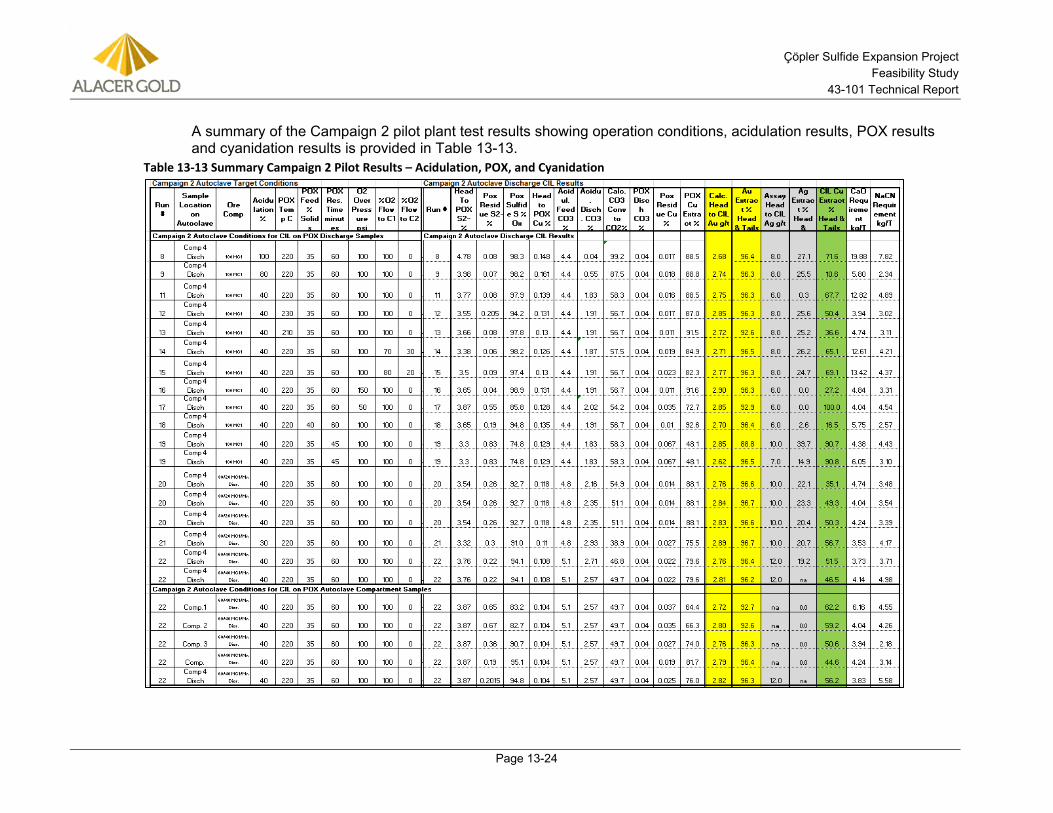
Çöpler Sulfide Expansion Project Feasibility Study
43-101 Technical Report
Page 13-24
A summary of the Campaign 2 pilot plant test results showing operation conditions, acidulation results, POX results and cyanidation results is provided in Table 13-13.
Table 13-13 Summary Campaign 2 Pilot Results – Acidulation, POX, and Cyanidation
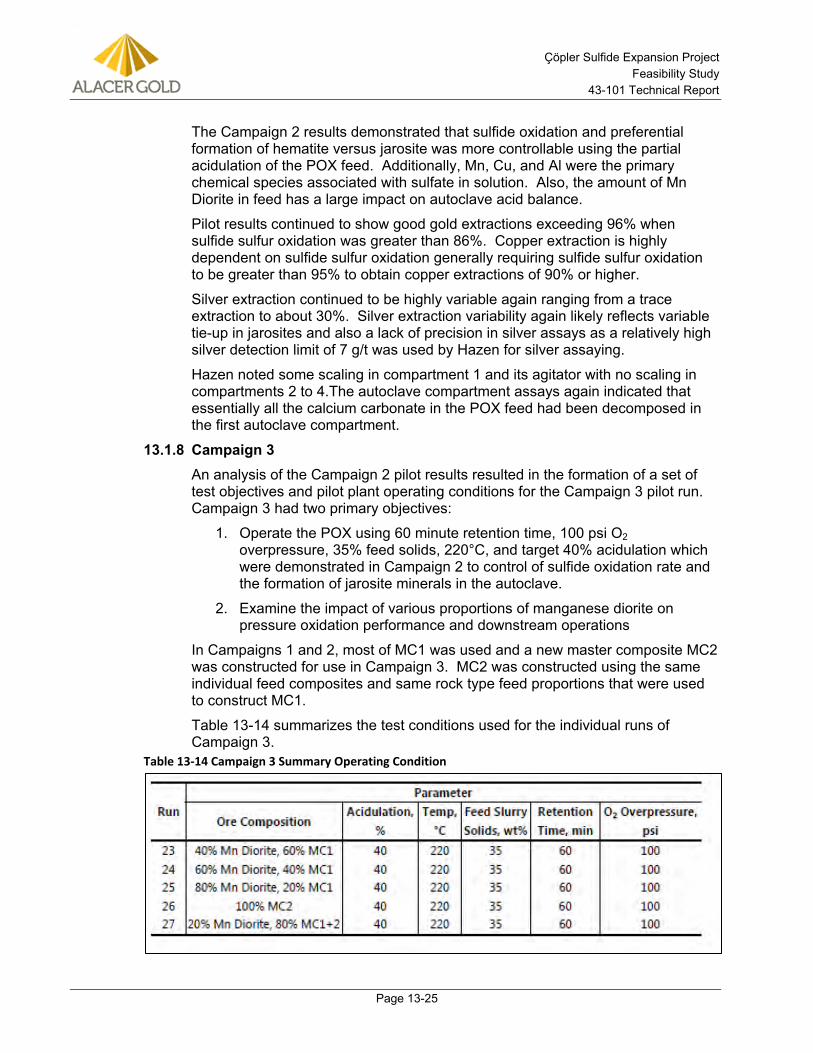
Çöpler Sulfide Expansion Project Feasibility Study
43-101 Technical Report
Page 13-25
The Campaign 2 results demonstrated that sulfide oxidation and preferential formation of hematite versus jarosite was more controllable using the partial acidulation of the POX feed. Additionally, Mn, Cu, and Al were the primary chemical species associated with sulfate in solution. Also, the amount of Mn Diorite in feed has a large impact on autoclave acid balance.
Pilot results continued to show good gold extractions exceeding 96% when sulfide sulfur oxidation was greater than 86%. Copper extraction is highly dependent on sulfide sulfur oxidation generally requiring sulfide sulfur oxidation to be greater than 95% to obtain copper extractions of 90% or higher.
Silver extraction continued to be highly variable again ranging from a trace extraction to about 30%. Silver extraction variability again likely reflects variable tie-up in jarosites and also a lack of precision in silver assays as a relatively high silver detection limit of 7 g/t was used by Hazen for silver assaying.
Hazen noted some scaling in compartment 1 and its agitator with no scaling in compartments 2 to 4.The autoclave compartment assays again indicated that essentially all the calcium carbonate in the POX feed had been decomposed in the first autoclave compartment.
Campaign 3 13.1.8An analysis of the Campaign 2 pilot results resulted in the formation of a set of test objectives and pilot plant operating conditions for the Campaign 3 pilot run. Campaign 3 had two primary objectives:
1. Operate the POX using 60 minute retention time, 100 psi O2 overpressure, 35% feed solids, 220°C, and target 40% acidulation which were demonstrated in Campaign 2 to control of sulfide oxidation rate and the formation of jarosite minerals in the autoclave.
2. Examine the impact of various proportions of manganese diorite on pressure oxidation performance and downstream operations
In Campaigns 1 and 2, most of MC1 was used and a new master composite MC2 was constructed for use in Campaign 3. MC2 was constructed using the same individual feed composites and same rock type feed proportions that were used to construct MC1.
Table 13-14 summarizes the test conditions used for the individual runs of Campaign 3.
Table 13-14 Campaign 3 Summary Operating Condition
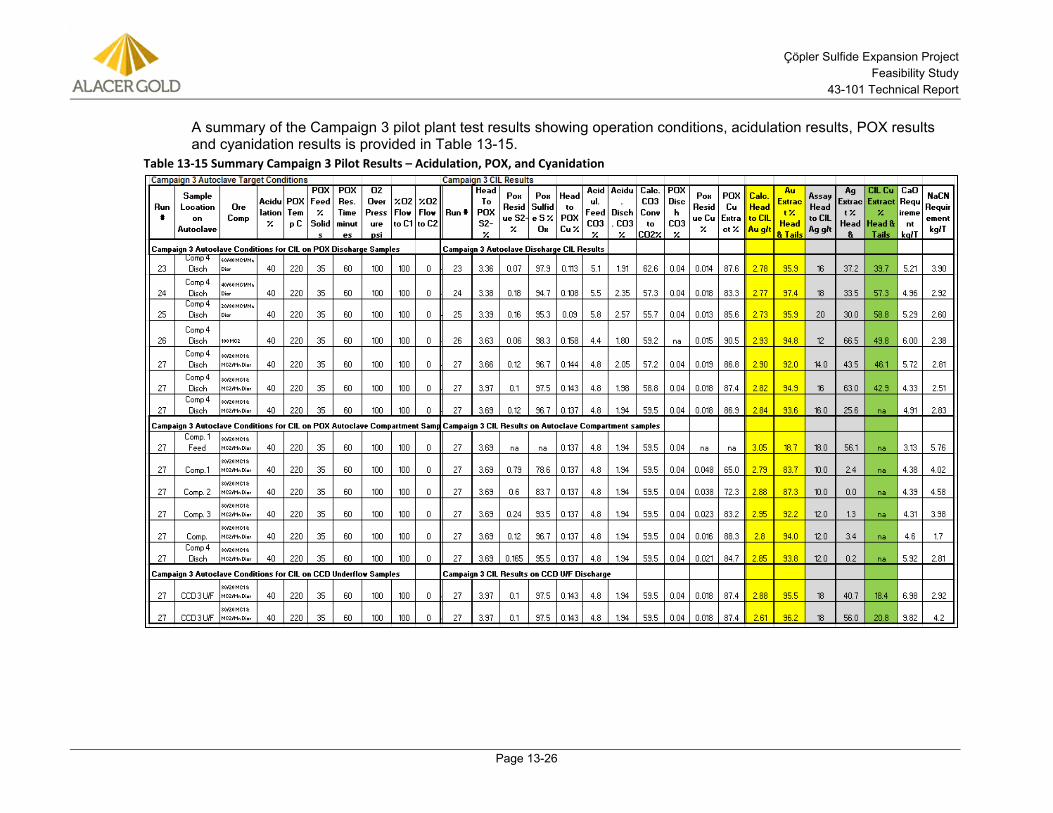
Çöpler Sulfide Expansion Project Feasibility Study
43-101 Technical Report
Page 13-26
A summary of the Campaign 3 pilot plant test results showing operation conditions, acidulation results, POX results and cyanidation results is provided in Table 13-15.
Table 13-15 Summary Campaign 3 Pilot Results – Acidulation, POX, and Cyanidation
Çöpler Sulfide Expansion Project Feasibility Study
43-101 Technical Report
Page 13-27
Campaign 3 results demonstrated that the extent of sulfide sulfur oxidation seemed to be somewhat lower with increasing amounts of Mn Diorite added to MC1 as shown in runs 23 to 25.
Pilot results continued to show good gold extractions. However, gold extractions were somewhat lower than the previous two campaigns ranging from about 94% to 95%, versus the 96% achieved in the earlier campaigns. It is not clear what caused the somewhat lower extractions, possibly the effect of the high Mn Diorite with lower sulfide oxidation extents in runs 23 to 25 and possibly the new MC2 which used in the campaign.
Copper extraction again showed a dependency on sulfide sulfur oxidation showing that higher copper extractions are achieved with higher sulfide sulfur oxidation.
Silver extraction continued to be highly variable again ranging from trace extractions in the autoclave compartment samples and 26% to 66.5% in runs 23 to 27. Again the variability likely reflects variable tie-up in jarosites, as well as a lack of precision in silver assays as a relatively high silver detection limit of 7 g/t was used by Hazen for silver assaying.
The autoclave compartment assays again indicated that essentially all the calcium carbonate in the POX feed had been decomposed in the first autoclave compartment.
The results and conditions from run 27 were chosen as the basis for the POX system design criteria.
Campaign 4 13.1.9The data required for design of several unit processes including solids thickening, the hot cure step, slurry rheology though the process, and copper precipitation were not totally developed in Campaigns 1 to 3. This was due to the focus on determining the best POX operating conditions resulting in non-steady state operation in pilot processes downstream of the autoclaves and in the amount of sample required for solids/liquid separation testing. In order to obtain the required design data a fourth pilot campaign was performed.
Campaign 4 had the following objectives:
1. Confirm pilot plant operation using selected design conditions
2. Develop thickener sizing data
3. Determine effectiveness of hot cure in converting jarosite to hematite
4. Provide samples for tailings slurry rheology
5. Provide samples for testing at McClelland Laboratories
6. Investigate carbon adsorption and tailings cyanide destruction.
7. Prove and optimize MSP to above 95% Cu removal.
8. Examine the effect of 200 psi O2 overpressure on jarosite formation
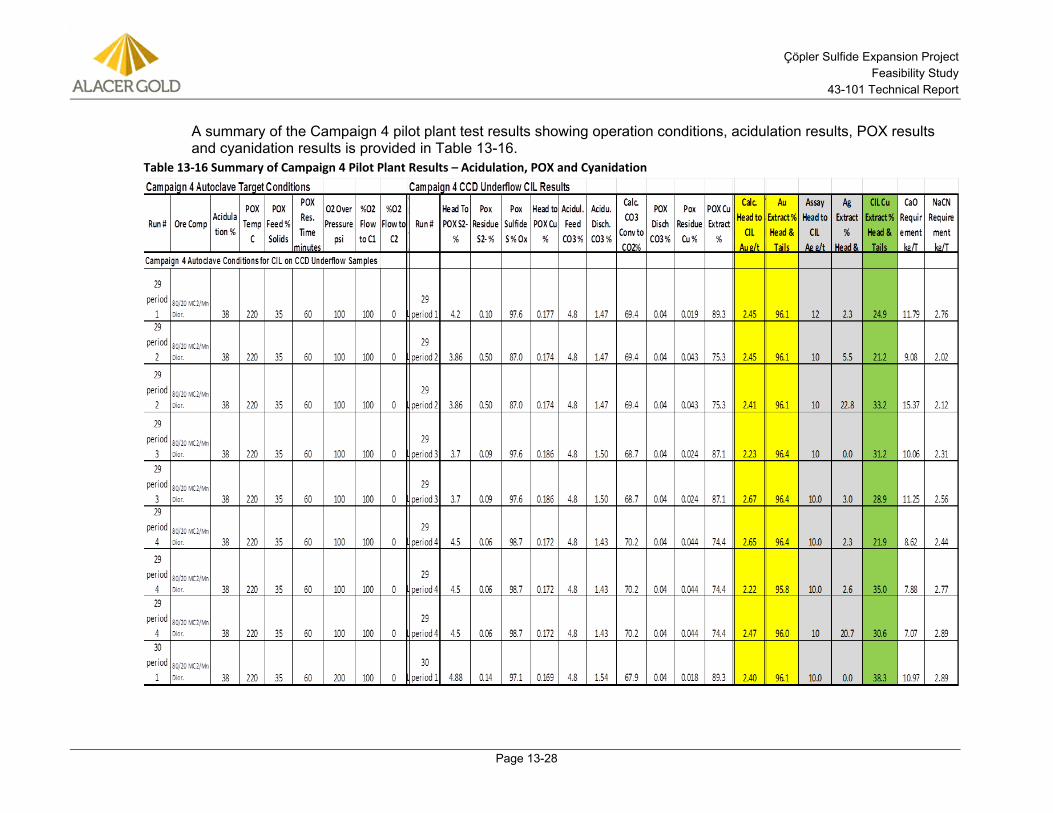
Çöpler Sulfide Expansion Project Feasibility Study
43-101 Technical Report
Page 13-28
A summary of the Campaign 4 pilot plant test results showing operation conditions, acidulation results, POX results and cyanidation results is provided in Table 13-16.
Table 13-16 Summary of Campaign 4 Pilot Plant Results – Acidulation, POX and Cyanidation
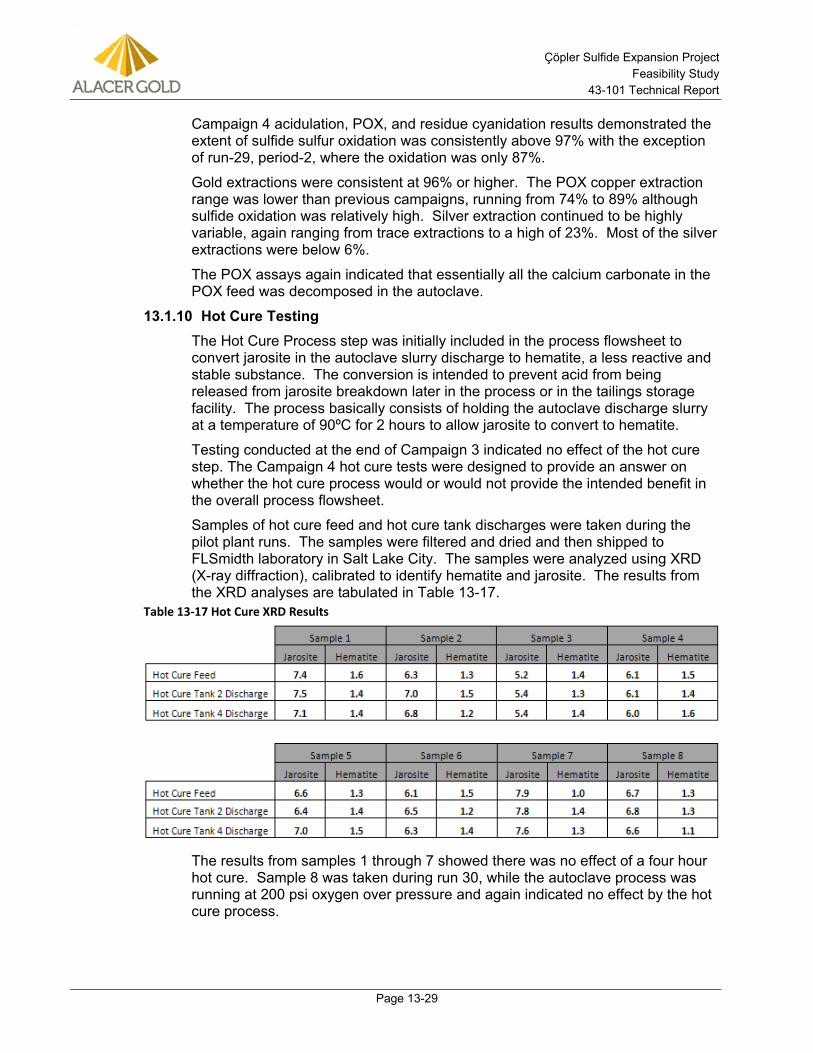
Çöpler Sulfide Expansion Project Feasibility Study
43-101 Technical Report
Page 13-29
Campaign 4 acidulation, POX, and residue cyanidation results demonstrated the extent of sulfide sulfur oxidation was consistently above 97% with the exception of run-29, period-2, where the oxidation was only 87%.
Gold extractions were consistent at 96% or higher. The POX copper extraction range was lower than previous campaigns, running from 74% to 89% although sulfide oxidation was relatively high. Silver extraction continued to be highly variable, again ranging from trace extractions to a high of 23%. Most of the silver extractions were below 6%.
The POX assays again indicated that essentially all the calcium carbonate in the POX feed was decomposed in the autoclave.
Hot Cure Testing 13.1.10The Hot Cure Process step was initially included in the process flowsheet to convert jarosite in the autoclave slurry discharge to hematite, a less reactive and stable substance. The conversion is intended to prevent acid from being released from jarosite breakdown later in the process or in the tailings storage facility. The process basically consists of holding the autoclave discharge slurry at a temperature of 90ºC for 2 hours to allow jarosite to convert to hematite.
Testing conducted at the end of Campaign 3 indicated no effect of the hot cure step. The Campaign 4 hot cure tests were designed to provide an answer on whether the hot cure process would or would not provide the intended benefit in the overall process flowsheet.
Samples of hot cure feed and hot cure tank discharges were taken during the pilot plant runs. The samples were filtered and dried and then shipped to FLSmidth laboratory in Salt Lake City. The samples were analyzed using XRD (X-ray diffraction), calibrated to identify hematite and jarosite. The results from the XRD analyses are tabulated in Table 13-17.
Table 13-17 Hot Cure XRD Results
The results from samples 1 through 7 showed there was no effect of a four hour hot cure. Sample 8 was taken during run 30, while the autoclave process was running at 200 psi oxygen over pressure and again indicated no effect by the hot cure process.
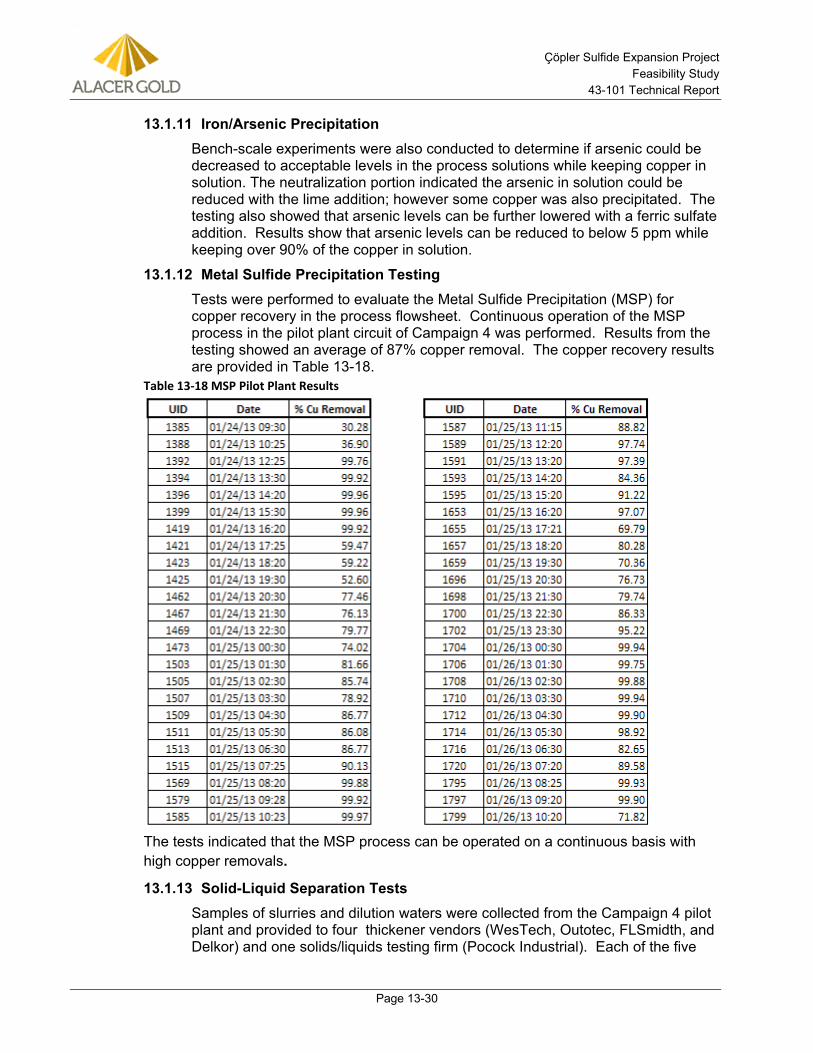
Çöpler Sulfide Expansion Project Feasibility Study
43-101 Technical Report
Page 13-30
Iron/Arsenic Precipitation 13.1.11Bench-scale experiments were also conducted to determine if arsenic could be decreased to acceptable levels in the process solutions while keeping copper in solution. The neutralization portion indicated the arsenic in solution could be reduced with the lime addition; however some copper was also precipitated. The testing also showed that arsenic levels can be further lowered with a ferric sulfate addition. Results show that arsenic levels can be reduced to below 5 ppm while keeping over 90% of the copper in solution.
Metal Sulfide Precipitation Testing 13.1.12Tests were performed to evaluate the Metal Sulfide Precipitation (MSP) for copper recovery in the process flowsheet. Continuous operation of the MSP process in the pilot plant circuit of Campaign 4 was performed. Results from the testing showed an average of 87% copper removal. The copper recovery results are provided in Table 13-18.
Table 13-18 MSP Pilot Plant Results
The tests indicated that the MSP process can be operated on a continuous basis with high copper removals.
Solid-Liquid Separation Tests 13.1.13Samples of slurries and dilution waters were collected from the Campaign 4 pilot plant and provided to four thickener vendors (WesTech, Outotec, FLSmidth, and Delkor) and one solids/liquids testing firm (Pocock Industrial). Each of the five
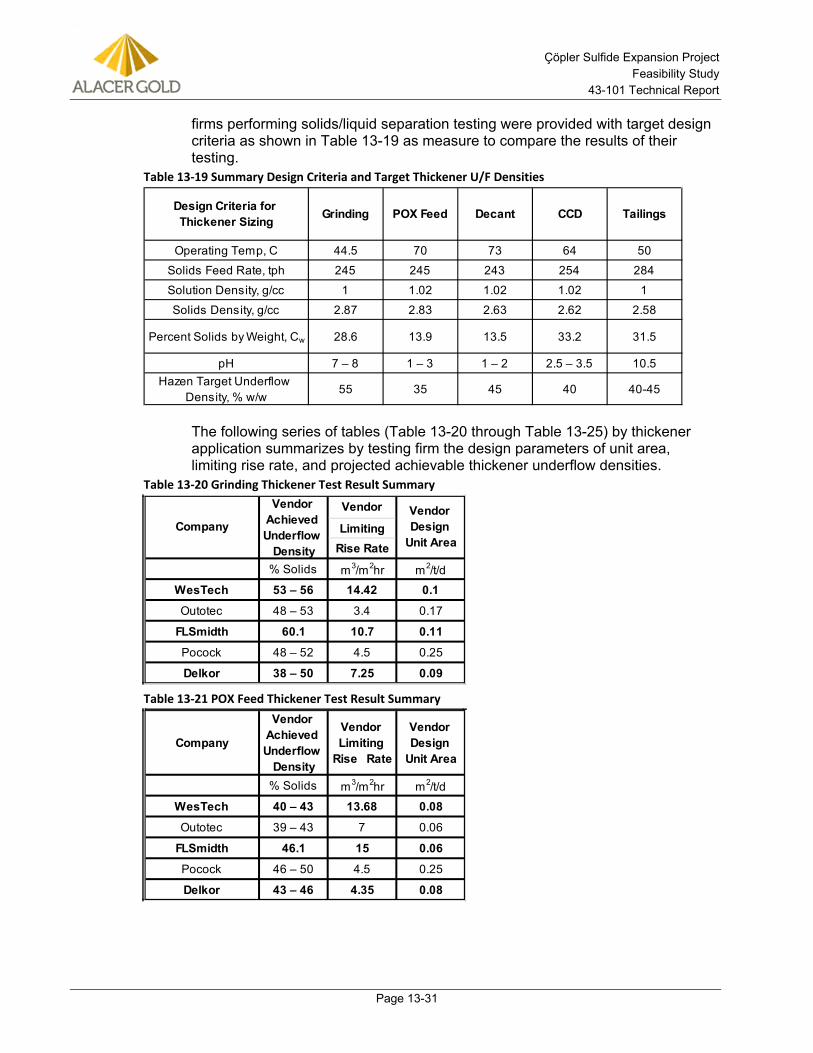
Çöpler Sulfide Expansion Project Feasibility Study
43-101 Technical Report
Page 13-31
firms performing solids/liquid separation testing were provided with target design criteria as shown in Table 13-19 as measure to compare the results of their testing.
Table 13-19 Summary Design Criteria and Target Thickener U/F Densities
The following series of tables (Table 13-20 through Table 13-25) by thickener application summarizes by testing firm the design parameters of unit area, limiting rise rate, and projected achievable thickener underflow densities.
Table 13-20 Grinding Thickener Test Result Summary
Table 13-21 POX Feed Thickener Test Result Summary
Operating Temp, C 44.5 70 73 64 50
Solids Feed Rate, tph 245 245 243 254 284
Solution Density, g/cc 1 1.02 1.02 1.02 1
Solids Density, g/cc 2.87 2.83 2.63 2.62 2.58
Percent Solids by Weight, Cw 28.6 13.9 13.5 33.2 31.5
pH 7 – 8 1 – 3 1 – 2 2.5 – 3.5 10.5Hazen Target Underflow
Density, % w/w55 35 45 40 40-45
Grinding POX Feed Decant CCD TailingsDesign Criteria for Thickener Sizing
Vendor
LimitingRise Rate
% Solids m3/m2hr m2/t/d
WesTech 53 – 56 14.42 0.1
Outotec 48 – 53 3.4 0.17
FLSmidth 60.1 10.7 0.11
Pocock 48 – 52 4.5 0.25
Delkor 38 – 50 7.25 0.09
Company
Vendor Achieved Underflow
Density
Vendor Design
Unit Area
Company
Vendor Achieved Underflow
Density
Vendor Limiting
Rise Rate
Vendor Design
Unit Area
% Solids m3/m2hr m2/t/d
WesTech 40 – 43 13.68 0.08
Outotec 39 – 43 7 0.06
FLSmidth 46.1 15 0.06
Pocock 46 – 50 4.5 0.25
Delkor 43 – 46 4.35 0.08
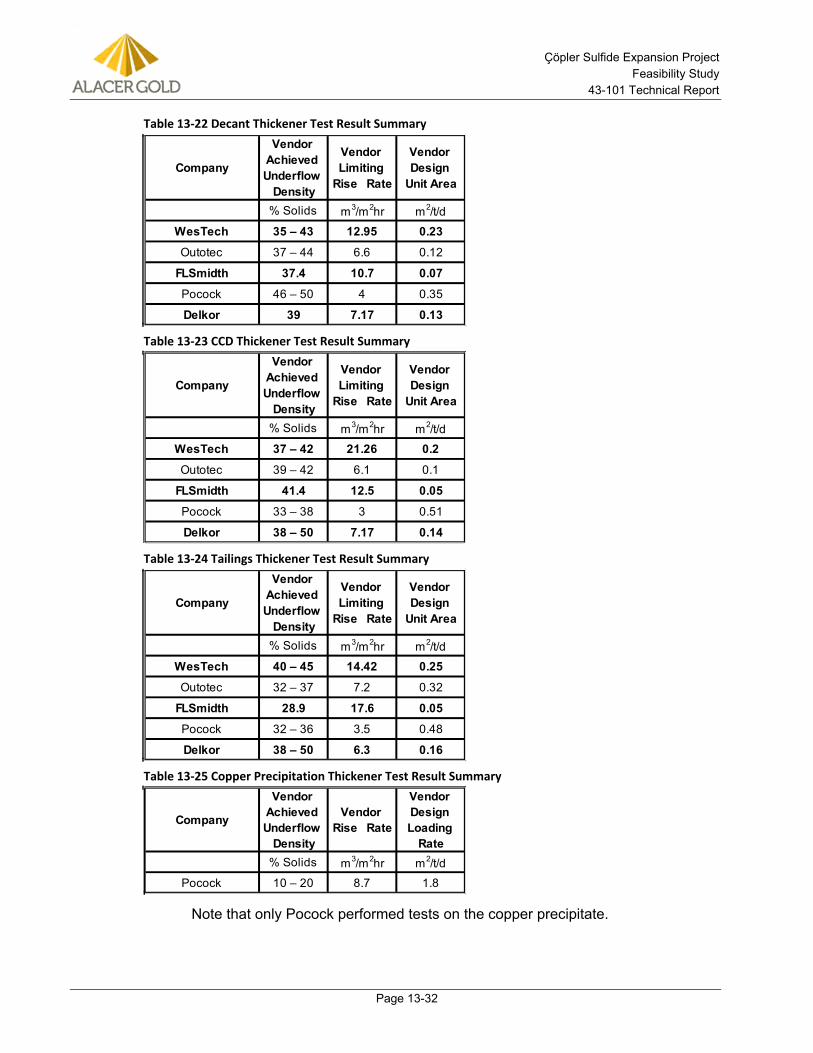
Çöpler Sulfide Expansion Project Feasibility Study
43-101 Technical Report
Page 13-32
Table 13-22 Decant Thickener Test Result Summary
Table 13-23 CCD Thickener Test Result Summary
Table 13-24 Tailings Thickener Test Result Summary
Table 13-25 Copper Precipitation Thickener Test Result Summary
Note that only Pocock performed tests on the copper precipitate.
Company
Vendor Achieved Underflow
Density
Vendor Limiting
Rise Rate
Vendor Design
Unit Area
% Solids m3/m2hr m2/t/d
WesTech 35 – 43 12.95 0.23
Outotec 37 – 44 6.6 0.12
FLSmidth 37.4 10.7 0.07
Pocock 46 – 50 4 0.35
Delkor 39 7.17 0.13
Company
Vendor Achieved Underflow
Density
Vendor Limiting
Rise Rate
Vendor Design
Unit Area
% Solids m3/m2hr m2/t/d
WesTech 37 – 42 21.26 0.2
Outotec 39 – 42 6.1 0.1
FLSmidth 41.4 12.5 0.05
Pocock 33 – 38 3 0.51
Delkor 38 – 50 7.17 0.14
Company
Vendor Achieved Underflow
Density
Vendor Limiting
Rise Rate
Vendor Design
Unit Area
% Solids m3/m2hr m2/t/d
WesTech 40 – 45 14.42 0.25
Outotec 32 – 37 7.2 0.32
FLSmidth 28.9 17.6 0.05
Pocock 32 – 36 3.5 0.48
Delkor 38 – 50 6.3 0.16
Company
Vendor Achieved Underflow
Density
Vendor Rise Rate
Vendor Design Loading
Rate% Solids m3/m2hr m2/t/d
Pocock 10 – 20 8.7 1.8
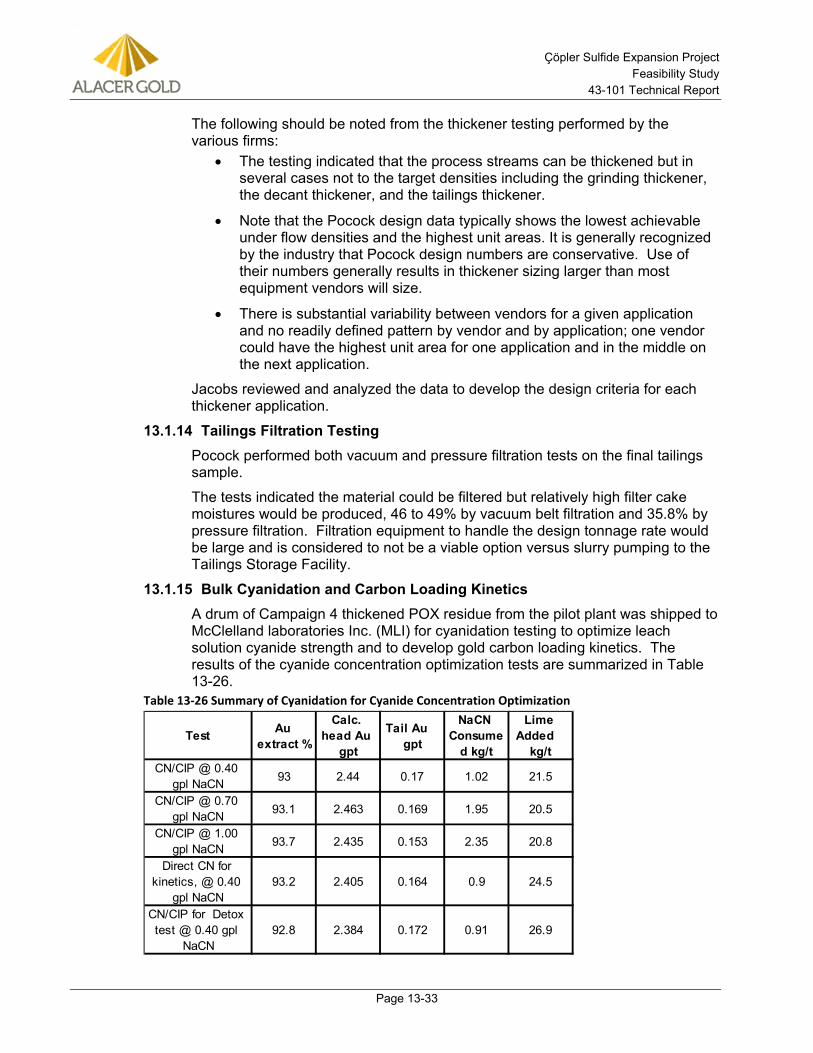
Çöpler Sulfide Expansion Project Feasibility Study
43-101 Technical Report
Page 13-33
The following should be noted from the thickener testing performed by the various firms:
• The testing indicated that the process streams can be thickened but in several cases not to the target densities including the grinding thickener, the decant thickener, and the tailings thickener.
• Note that the Pocock design data typically shows the lowest achievable under flow densities and the highest unit areas. It is generally recognized by the industry that Pocock design numbers are conservative. Use of their numbers generally results in thickener sizing larger than most equipment vendors will size.
• There is substantial variability between vendors for a given application and no readily defined pattern by vendor and by application; one vendor could have the highest unit area for one application and in the middle on the next application.
Jacobs reviewed and analyzed the data to develop the design criteria for each thickener application.
Tailings Filtration Testing 13.1.14Pocock performed both vacuum and pressure filtration tests on the final tailings sample.
The tests indicated the material could be filtered but relatively high filter cake moistures would be produced, 46 to 49% by vacuum belt filtration and 35.8% by pressure filtration. Filtration equipment to handle the design tonnage rate would be large and is considered to not be a viable option versus slurry pumping to the Tailings Storage Facility.
Bulk Cyanidation and Carbon Loading Kinetics 13.1.15A drum of Campaign 4 thickened POX residue from the pilot plant was shipped to McClelland laboratories Inc. (MLI) for cyanidation testing to optimize leach solution cyanide strength and to develop gold carbon loading kinetics. The results of the cyanide concentration optimization tests are summarized in Table 13-26.
Table 13-26 Summary of Cyanidation for Cyanide Concentration Optimization
Test Au extract %
Calc. head Au
gpt
Tail Au gpt
NaCN Consume
d kg/t
Lime Added
kg/tCN/CIP @ 0.40
gpl NaCN 93 2.44 0.17 1.02 21.5
CN/CIP @ 0.70 gpl NaCN 93.1 2.463 0.169 1.95 20.5
CN/CIP @ 1.00 gpl NaCN 93.7 2.435 0.153 2.35 20.8
Direct CN for kinetics, @ 0.40
gpl NaCN93.2 2.405 0.164 0.9 24.5
CN/CIP for Detox test @ 0.40 gpl
NaCN92.8 2.384 0.172 0.91 26.9
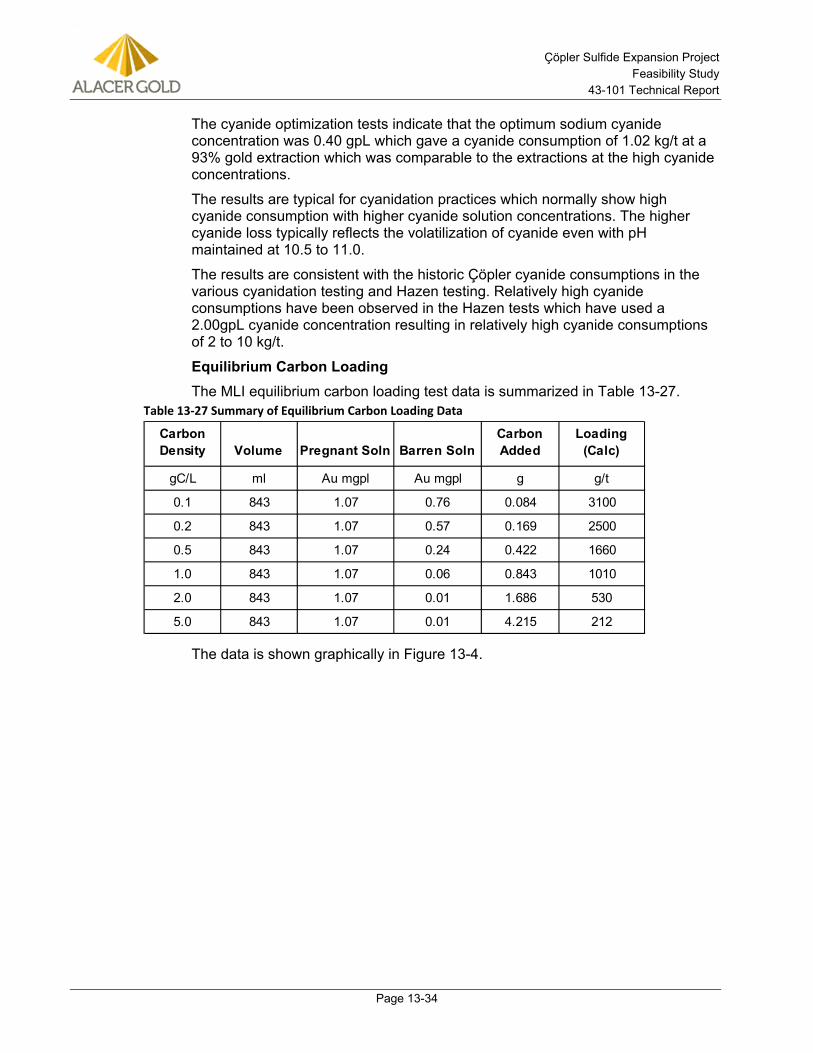
Çöpler Sulfide Expansion Project Feasibility Study
43-101 Technical Report
Page 13-34
The cyanide optimization tests indicate that the optimum sodium cyanide concentration was 0.40 gpL which gave a cyanide consumption of 1.02 kg/t at a 93% gold extraction which was comparable to the extractions at the high cyanide concentrations.
The results are typical for cyanidation practices which normally show high cyanide consumption with higher cyanide solution concentrations. The higher cyanide loss typically reflects the volatilization of cyanide even with pH maintained at 10.5 to 11.0.
The results are consistent with the historic Çöpler cyanide consumptions in the various cyanidation testing and Hazen testing. Relatively high cyanide consumptions have been observed in the Hazen tests which have used a 2.00gpL cyanide concentration resulting in relatively high cyanide consumptions of 2 to 10 kg/t.
Equilibrium Carbon Loading The MLI equilibrium carbon loading test data is summarized in Table 13-27.
Table 13-27 Summary of Equilibrium Carbon Loading Data
The data is shown graphically in Figure 13-4.
Carbon Density Volume Pregnant Soln Barren Soln
Carbon Added
Loading (Calc)
gC/L ml Au mgpl Au mgpl g g/t
0.1 843 1.07 0.76 0.084 3100
0.2 843 1.07 0.57 0.169 2500
0.5 843 1.07 0.24 0.422 1660
1.0 843 1.07 0.06 0.843 1010
2.0 843 1.07 0.01 1.686 530
5.0 843 1.07 0.01 4.215 212
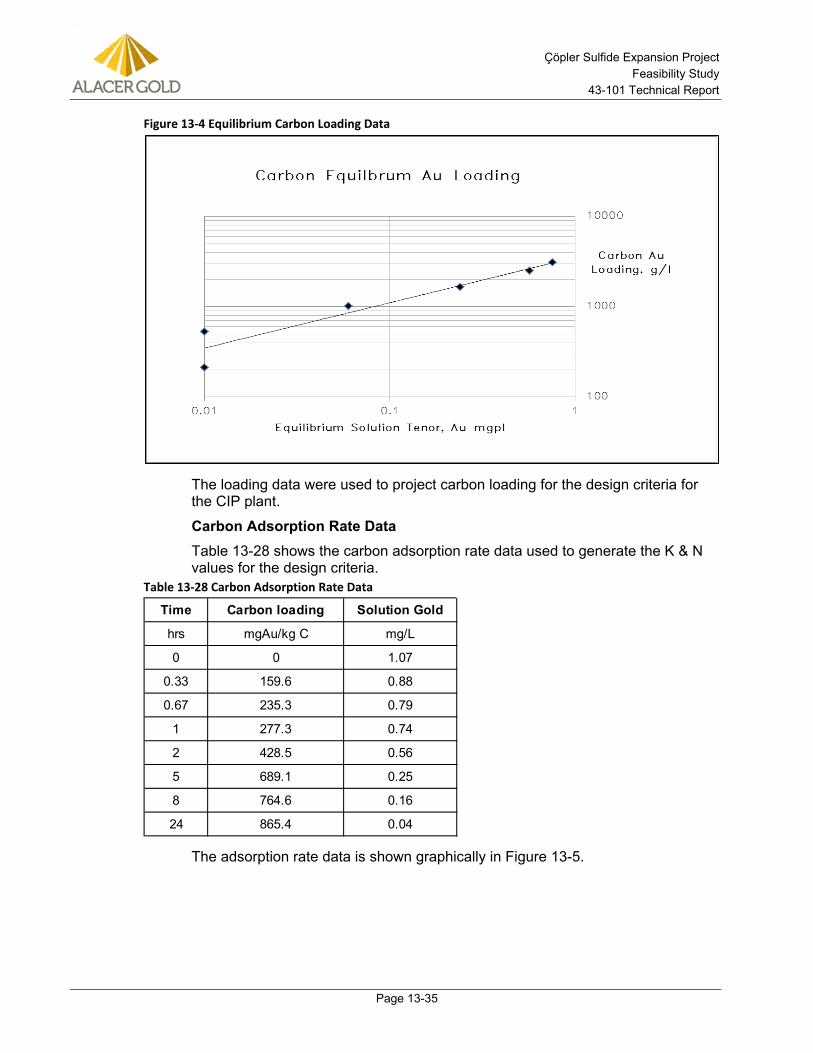
Çöpler Sulfide Expansion Project Feasibility Study
43-101 Technical Report
Page 13-35
Figure 13-4 Equilibrium Carbon Loading Data
The loading data were used to project carbon loading for the design criteria for the CIP plant.
Carbon Adsorption Rate Data Table 13-28 shows the carbon adsorption rate data used to generate the K & N values for the design criteria.
Table 13-28 Carbon Adsorption Rate Data
The adsorption rate data is shown graphically in Figure 13-5.
Time Carbon loading Solution Gold
hrs mgAu/kg C mg/L
0 0 1.07
0.33 159.6 0.88
0.67 235.3 0.79
1 277.3 0.74
2 428.5 0.56
5 689.1 0.25
8 764.6 0.16
24 865.4 0.04
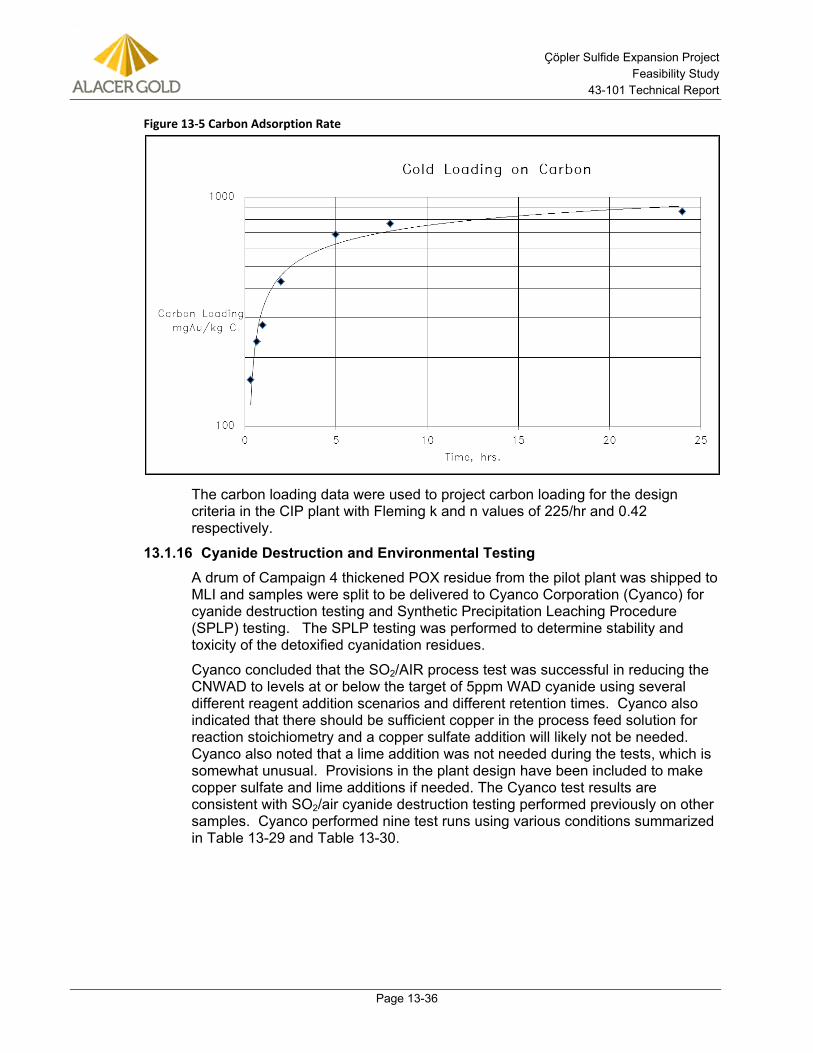
Çöpler Sulfide Expansion Project Feasibility Study
43-101 Technical Report
Page 13-36
Figure 13-5 Carbon Adsorption Rate
The carbon loading data were used to project carbon loading for the design criteria in the CIP plant with Fleming k and n values of 225/hr and 0.42 respectively.
Cyanide Destruction and Environmental Testing 13.1.16A drum of Campaign 4 thickened POX residue from the pilot plant was shipped to MLI and samples were split to be delivered to Cyanco Corporation (Cyanco) for cyanide destruction testing and Synthetic Precipitation Leaching Procedure (SPLP) testing. The SPLP testing was performed to determine stability and toxicity of the detoxified cyanidation residues.
Cyanco concluded that the SO2/AIR process test was successful in reducing the CNWAD to levels at or below the target of 5ppm WAD cyanide using several different reagent addition scenarios and different retention times. Cyanco also indicated that there should be sufficient copper in the process feed solution for reaction stoichiometry and a copper sulfate addition will likely not be needed. Cyanco also noted that a lime addition was not needed during the tests, which is somewhat unusual. Provisions in the plant design have been included to make copper sulfate and lime additions if needed. The Cyanco test results are consistent with SO2/air cyanide destruction testing performed previously on other samples. Cyanco performed nine test runs using various conditions summarized in Table 13-29 and Table 13-30.
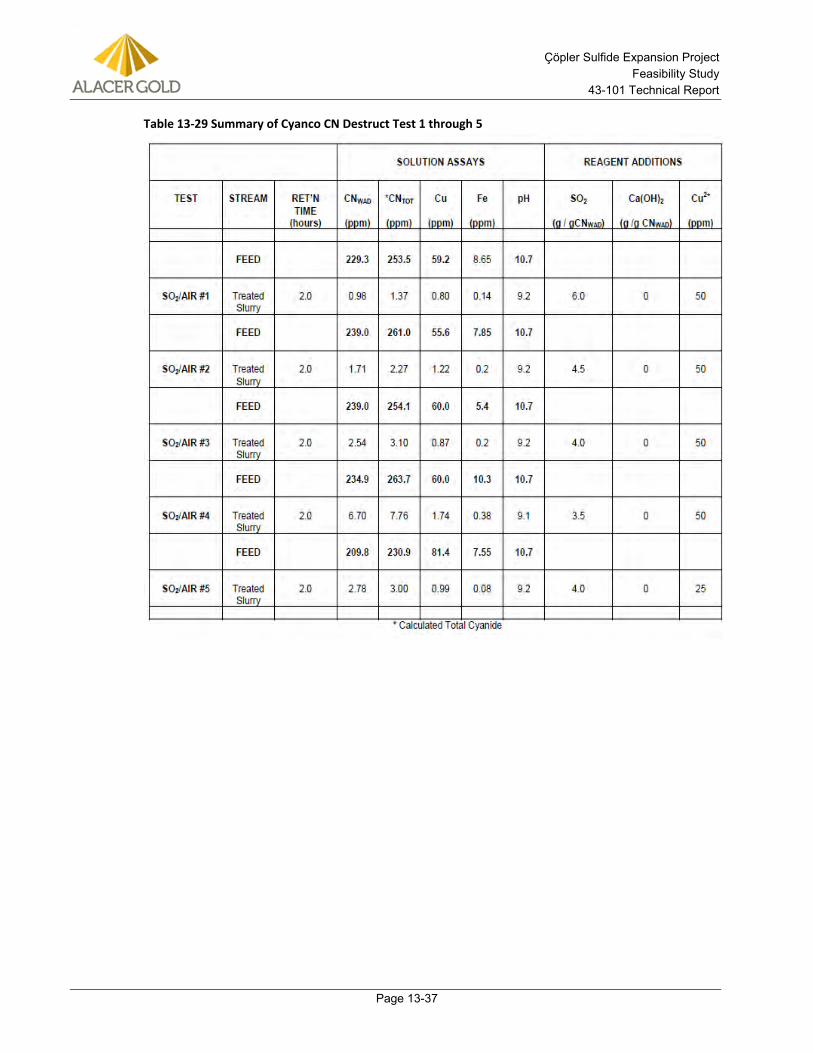
Çöpler Sulfide Expansion Project Feasibility Study
43-101 Technical Report
Page 13-37
Table 13-29 Summary of Cyanco CN Destruct Test 1 through 5
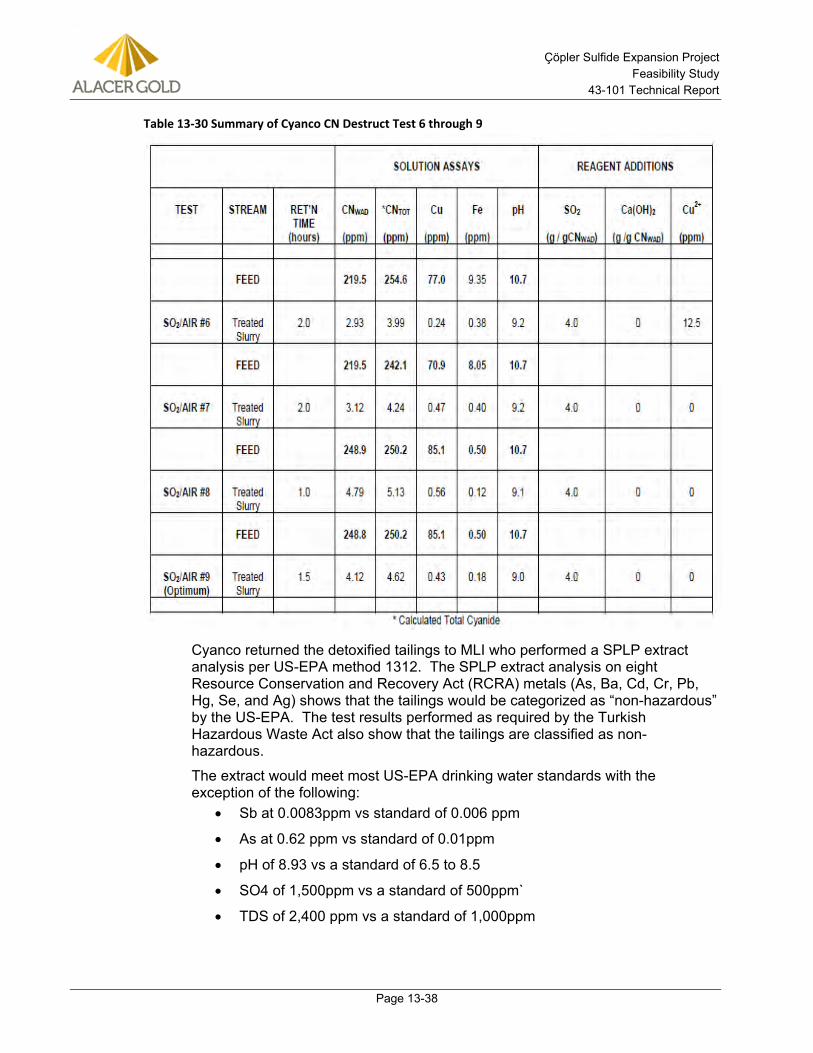
Çöpler Sulfide Expansion Project Feasibility Study
43-101 Technical Report
Page 13-38
Table 13-30 Summary of Cyanco CN Destruct Test 6 through 9
Cyanco returned the detoxified tailings to MLI who performed a SPLP extract analysis per US-EPA method 1312. The SPLP extract analysis on eight Resource Conservation and Recovery Act (RCRA) metals (As, Ba, Cd, Cr, Pb, Hg, Se, and Ag) shows that the tailings would be categorized as “non-hazardous” by the US-EPA. The test results performed as required by the Turkish Hazardous Waste Act also show that the tailings are classified as non-hazardous.
The extract would meet most US-EPA drinking water standards with the exception of the following:
• Sb at 0.0083ppm vs standard of 0.006 ppm
• As at 0.62 ppm vs standard of 0.01ppm
• pH of 8.93 vs a standard of 6.5 to 8.5
• SO4 of 1,500ppm vs a standard of 500ppm`
• TDS of 2,400 ppm vs a standard of 1,000ppm
Çöpler Sulfide Expansion Project Feasibility Study
43-101 Technical Report
Page 13-39
Additionally, samples were tested by Golder for SRK using European Standards, which indicated the tailings would meet European Standards. SRK performed geochemical testing in order to determine the waste classification of the expected tailings stream. The SRK report includes the measured concentrations of various metals and non-metals, as well as other parameters such as pH, total dissolved solids (TDS), total organic carbon, and others. SRK determined that most of the parameters tested were within the limits of “inert” (Class-III) waste, the lowest risk category according to Turkish regulations. However, sulfate and TDS concentrations were higher, resulting in a classification of “non-hazardous” (Class-II).
Variability Testing 13.1.17The variability of the Çöpler sulfide resource metallurgical properties and response to the selected operating parameters using batch pressure oxidation and other batch procedures was investigated in two phases on a number of sulfide resource samples representing the depth and breadth of the various rock types within the sulfide resource. Variability Sample Program 1 (VSP1) Hazen performed batch POX testing followed by cyanidation of the POX residue. This testwork was performed on the VSP1 samples before Campaign 4 in 2012. Testwork was completed in 2012. Tests were performed on 103 samples. However, complete assay sets were only completed on 75 of the samples. Sulfide sulfur assays were not completed on most of the 28 samples with incomplete data sets.
The VSP1 test data are summarized in Table 13-31. All samples gave an average gold extraction of 93.8% with a standard deviation of 6.0%. Sulfide sulfur on samples assayed for sulfide sulfur averaged 97.6% with a standard deviation of 3.9%. Copper extraction in the POX averaged 92.4% with a standard deviation of 7.1%. Silver extraction averaged only 4.0% with a standard deviation of 13.4%.
The variability testing metal (Au, Cu, and Ag) extraction data were used to develop the projected metal extractions for the project. The variability metal extractions were consistent with pilot plant extractions.
Gold extraction was examined by plotting gold extraction as a function of the gold head grade to the cyanidation step, shown as Figure 13-6.
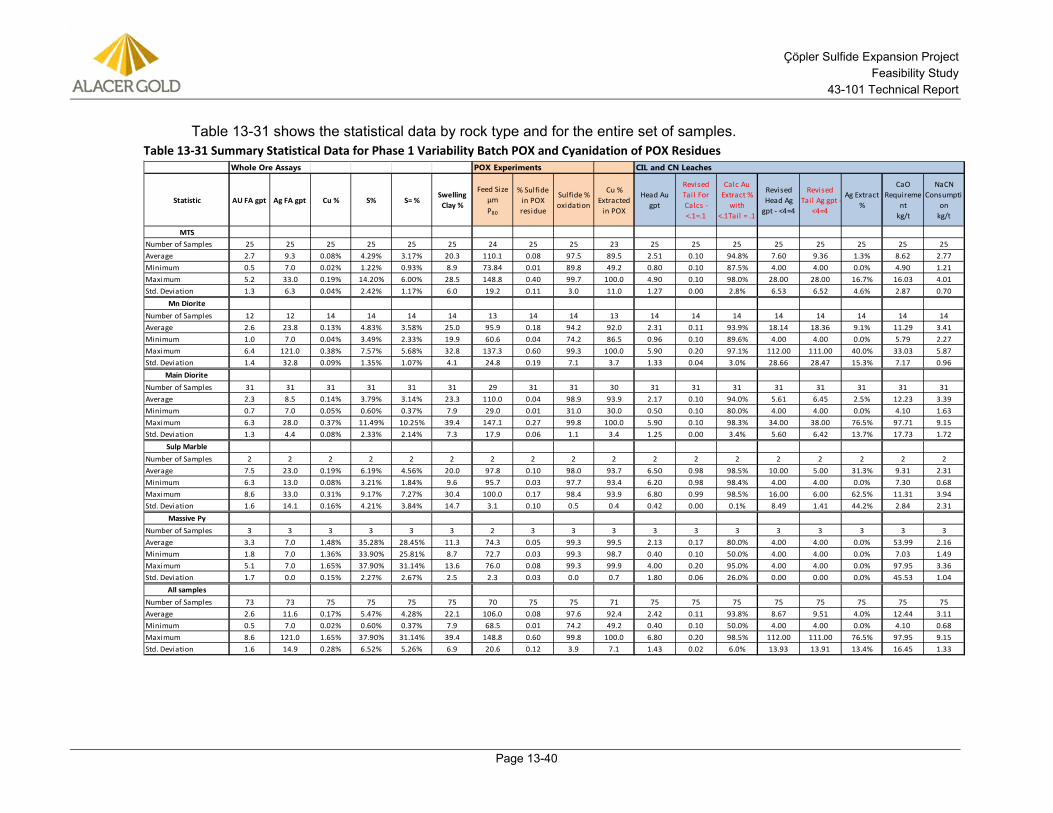
Çöpler Sulfide Expansion Project Feasibility Study
43-101 Technical Report
Page 13-40
Table 13-31 shows the statistical data by rock type and for the entire set of samples. Table 13-31 Summary Statistical Data for Phase 1 Variability Batch POX and Cyanidation of POX Residues
Whole Ore Assays POX Experiments CIL and CN Leaches
Statistic AU FA gpt Ag FA gpt Cu % S% S= %Swelling
Clay %
Feed SizeµmP80
% Sulfide in POX residue
Sulfide % oxidation
Cu %Extracted
in POX
Head Au gpt
Revised Tail For Calcs - <.1=.1
Calc Au Extract %
with <.1Tail = .1
Revised Head Ag
gpt - <4=4
Revised Tail Ag gpt -
<4=4
Ag Extract %
CaORequireme
ntkg/t
NaCN Consumpti
onkg/t
MTSNumber of Samples 25 25 25 25 25 25 24 25 25 23 25 25 25 25 25 25 25 25Average 2.7 9.3 0.08% 4.29% 3.17% 20.3 110.1 0.08 97.5 89.5 2.51 0.10 94.8% 7.60 9.36 1.3% 8.62 2.77Minimum 0.5 7.0 0.02% 1.22% 0.93% 8.9 73.84 0.01 89.8 49.2 0.80 0.10 87.5% 4.00 4.00 0.0% 4.90 1.21Maximum 5.2 33.0 0.19% 14.20% 6.00% 28.5 148.8 0.40 99.7 100.0 4.90 0.10 98.0% 28.00 28.00 16.7% 16.03 4.01Std. Deviation 1.3 6.3 0.04% 2.42% 1.17% 6.0 19.2 0.11 3.0 11.0 1.27 0.00 2.8% 6.53 6.52 4.6% 2.87 0.70
Mn DioriteNumber of Samples 12 12 14 14 14 14 13 14 14 13 14 14 14 14 14 14 14 14Average 2.6 23.8 0.13% 4.83% 3.58% 25.0 95.9 0.18 94.2 92.0 2.31 0.11 93.9% 18.14 18.36 9.1% 11.29 3.41Minimum 1.0 7.0 0.04% 3.49% 2.33% 19.9 60.6 0.04 74.2 86.5 0.96 0.10 89.6% 4.00 4.00 0.0% 5.79 2.27Maximum 6.4 121.0 0.38% 7.57% 5.68% 32.8 137.3 0.60 99.3 100.0 5.90 0.20 97.1% 112.00 111.00 40.0% 33.03 5.87Std. Deviation 1.4 32.8 0.09% 1.35% 1.07% 4.1 24.8 0.19 7.1 3.7 1.33 0.04 3.0% 28.66 28.47 15.3% 7.17 0.96
Main DioriteNumber of Samples 31 31 31 31 31 31 29 31 31 30 31 31 31 31 31 31 31 31Average 2.3 8.5 0.14% 3.79% 3.14% 23.3 110.0 0.04 98.9 93.9 2.17 0.10 94.0% 5.61 6.45 2.5% 12.23 3.39Minimum 0.7 7.0 0.05% 0.60% 0.37% 7.9 29.0 0.01 31.0 30.0 0.50 0.10 80.0% 4.00 4.00 0.0% 4.10 1.63Maximum 6.3 28.0 0.37% 11.49% 10.25% 39.4 147.1 0.27 99.8 100.0 5.90 0.10 98.3% 34.00 38.00 76.5% 97.71 9.15Std. Deviation 1.3 4.4 0.08% 2.33% 2.14% 7.3 17.9 0.06 1.1 3.4 1.25 0.00 3.4% 5.60 6.42 13.7% 17.73 1.72
Sulp MarbleNumber of Samples 2 2 2 2 2 2 2 2 2 2 2 2 2 2 2 2 2 2Average 7.5 23.0 0.19% 6.19% 4.56% 20.0 97.8 0.10 98.0 93.7 6.50 0.98 98.5% 10.00 5.00 31.3% 9.31 2.31Minimum 6.3 13.0 0.08% 3.21% 1.84% 9.6 95.7 0.03 97.7 93.4 6.20 0.98 98.4% 4.00 4.00 0.0% 7.30 0.68Maximum 8.6 33.0 0.31% 9.17% 7.27% 30.4 100.0 0.17 98.4 93.9 6.80 0.99 98.5% 16.00 6.00 62.5% 11.31 3.94Std. Deviation 1.6 14.1 0.16% 4.21% 3.84% 14.7 3.1 0.10 0.5 0.4 0.42 0.00 0.1% 8.49 1.41 44.2% 2.84 2.31
Massive PyNumber of Samples 3 3 3 3 3 3 2 3 3 3 3 3 3 3 3 3 3 3Average 3.3 7.0 1.48% 35.28% 28.45% 11.3 74.3 0.05 99.3 99.5 2.13 0.17 80.0% 4.00 4.00 0.0% 53.99 2.16Minimum 1.8 7.0 1.36% 33.90% 25.81% 8.7 72.7 0.03 99.3 98.7 0.40 0.10 50.0% 4.00 4.00 0.0% 7.03 1.49Maximum 5.1 7.0 1.65% 37.90% 31.14% 13.6 76.0 0.08 99.3 99.9 4.00 0.20 95.0% 4.00 4.00 0.0% 97.95 3.36Std. Deviation 1.7 0.0 0.15% 2.27% 2.67% 2.5 2.3 0.03 0.0 0.7 1.80 0.06 26.0% 0.00 0.00 0.0% 45.53 1.04
All samplesNumber of Samples 73 73 75 75 75 75 70 75 75 71 75 75 75 75 75 75 75 75Average 2.6 11.6 0.17% 5.47% 4.28% 22.1 106.0 0.08 97.6 92.4 2.42 0.11 93.8% 8.67 9.51 4.0% 12.44 3.11Minimum 0.5 7.0 0.02% 0.60% 0.37% 7.9 68.5 0.01 74.2 49.2 0.40 0.10 50.0% 4.00 4.00 0.0% 4.10 0.68Maximum 8.6 121.0 1.65% 37.90% 31.14% 39.4 148.8 0.60 99.8 100.0 6.80 0.20 98.5% 112.00 111.00 76.5% 97.95 9.15Std. Deviation 1.6 14.9 0.28% 6.52% 5.26% 6.9 20.6 0.12 3.9 7.1 1.43 0.02 6.0% 13.93 13.91 13.4% 16.45 1.33
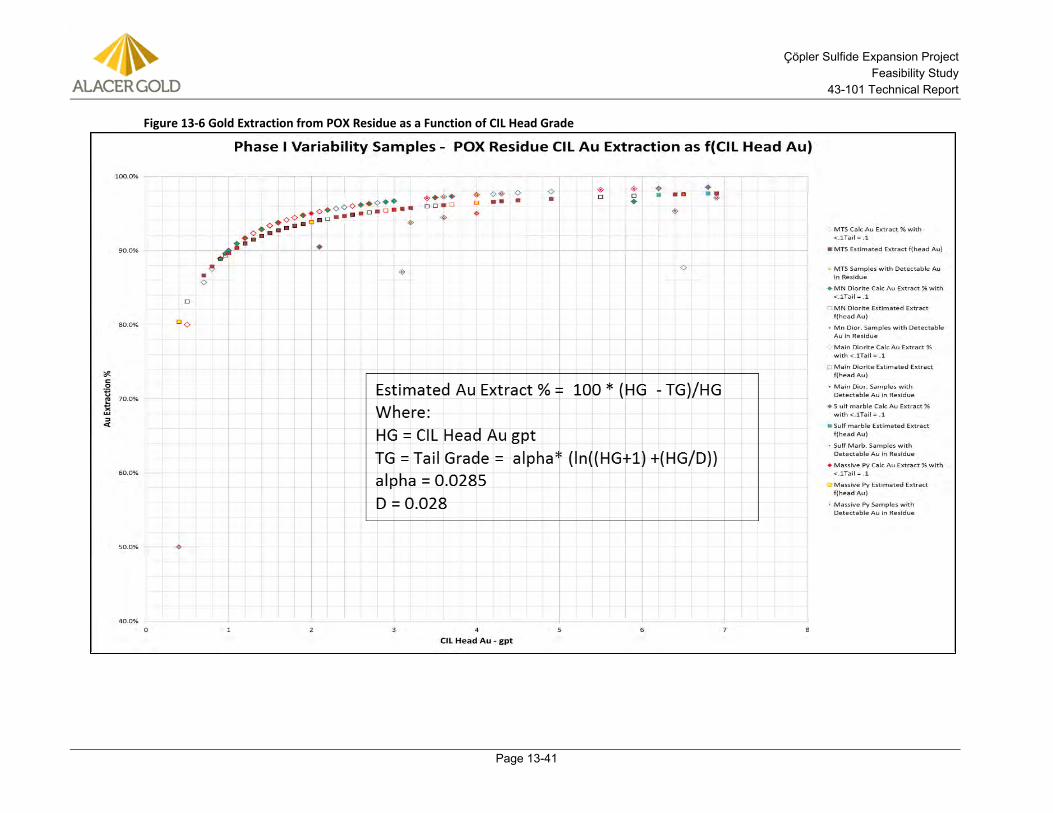
Çöpler Sulfide Expansion Project Feasibility Study
43-101 Technical Report
Page 13-41
Figure 13-6 Gold Extraction from POX Residue as a Function of CIL Head Grade
Çöpler Sulfide Expansion Project Feasibility Study
43-101 Technical Report
Page 13-42
Figure 13-6 shows that the gold extraction increases with increasing head grade, as is typical of most gold bearing mineralization.
Curve fitting of the data was performed yielding an equation as shown on the data plot. The equation can be used to project the gold extraction for all rock types provided the POX sulfide oxidation is 94% or greater. The gold extraction projection equation was used to project extractions by year per the mine model for the sulfide resource. The use of the extraction function is discussed further in the financial section (Section 22.0) of this technical report.
Copper extraction was examined in a similar manner. The plot of copper extraction is shown in Figure 13-7. This shows that the copper extraction for all rock types displays a relatively strong linear dependency on the residual sulfide sulfur content, or extent of sulfide sulfur.
The outliers to the plot generally are either low copper head grades of 0.08% Cu or less or low sulfide head grades. Generally if the POX residue sulfide sulfur grade is below 0.1% (which equates to a sulfide sulfur oxidation percentage of about 97% based on a head sulfide sulfur of 4.28%) the copper extraction should be above 90%. The data plot indicates that a copper extraction equation based on POX residue sulfide sulfur content could be used to project copper extraction.
Copper extraction based on POX residue sulfide sulfur is discussed further in the technical report financial discussion.
Silver extraction was examined in a like manner as gold extraction. Figure 13-8 shows silver extraction as a function of silver head grade. The data plot shows that silver tailings grade is linear as a function of silver head grade and shows no significant variation by rock type.
Silver extraction is expected to be low for all rock types following treatment in the autoclaves. This is consistent with the Campaign 4 pilot plant results. One should note that Hazen used relatively high silver detection limits of 4 to 7 g/t Ag for the variability testing, which results in a lack of precision or discrimination of actual silver extraction versus head grades.
Silver extraction for the project’s financial model was based on the projected silver extraction trend for the autoclave compartment assays previously shown in Figure 13-8.
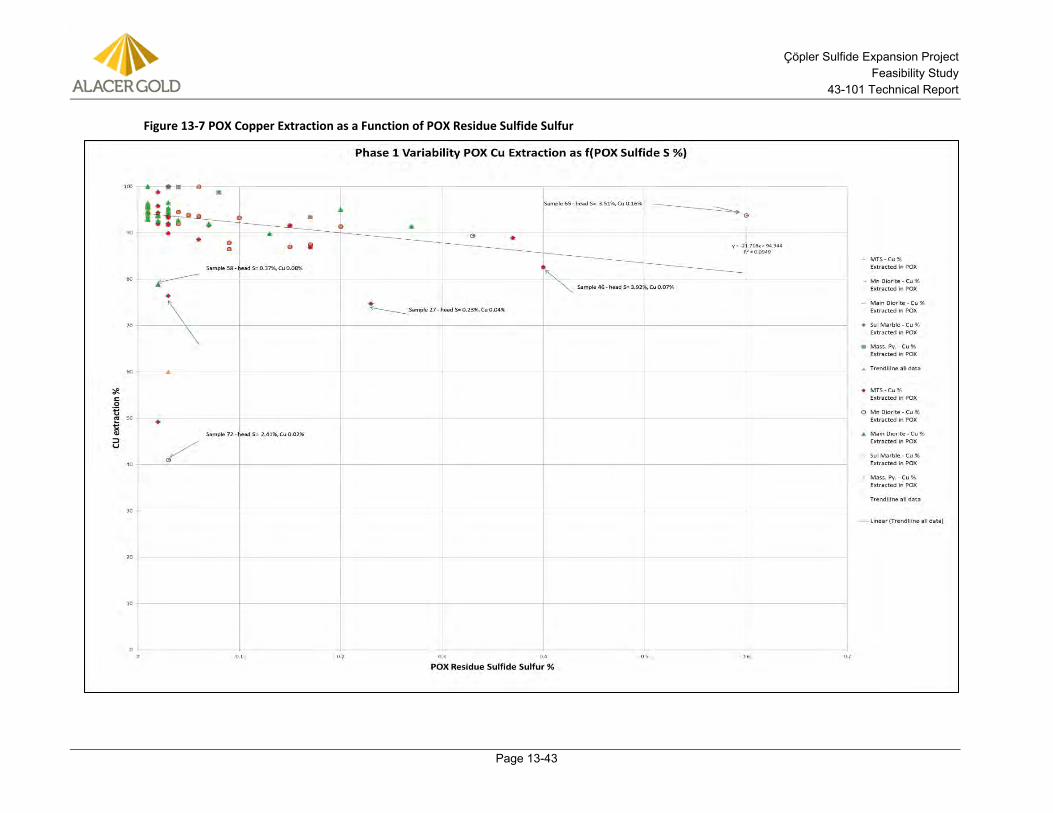
Çöpler Sulfide Expansion Project Feasibility Study
43-101 Technical Report
Page 13-43
Figure 13-7 POX Copper Extraction as a Function of POX Residue Sulfide Sulfur
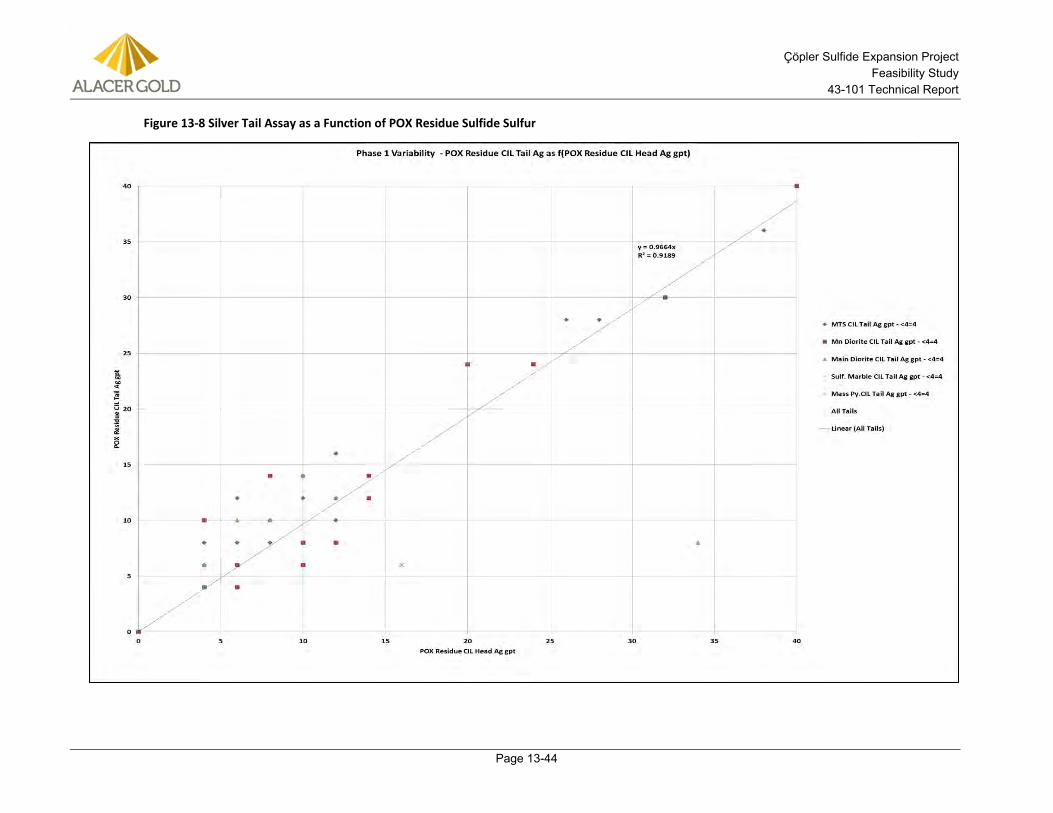
Çöpler Sulfide Expansion Project Feasibility Study
43-101 Technical Report
Page 13-44
Figure 13-8 Silver Tail Assay as a Function of POX Residue Sulfide Sulfur
Çöpler Sulfide Expansion Project Feasibility Study
43-101 Technical Report
Page 13-45
Variability Sample Program 2 (VSP2) Batch POX followed by cyanidation of the POX residue was performed on the VSP2 samples at Hazen in 2013 and continued into 2014. As of the effective date of this report, the complete set of VSP2 test results had not been received and analyzed by Jacobs for inclusion in this technical report.
Flotation Tests Following Campaign 4 13.1.18Alacer conducted a flotation investigation at FLSmidth in 2013 to determine the potential to make a gold bearing sulfide concentrate that could be sold or processed by cyanidation as an alternative to POX. A series of flotation tests using various reagent schemes were performed. Table 13-32 summarizes the results from the various tests.
The results from the flotation program show gold recoveries to flotation concentrate ranged from 55% to about 80% with gold grades ranging from about 9 to 15 g/t. Weight recovery to concentrate was high ranging from 10 to 30% of the flotation feed mass. Consistent with previous flotation testing, the tests indicated that flotation gold recoveries will generally be low even with high weight recovery to the flotation concentrate.
Two cyanidation tests were conducted, one on a flotation concentrate ground to a P80 of 7 µm and the other on flotation tailings. The concentrate leach test gave a gold extraction of only 36.6%. This is consistent with previous testing and confirms that concentrate leaching would not be an attractive process for gold recovery. The tailings leach test gave a gold extraction of only 15.5% and was consistent with previous testing.
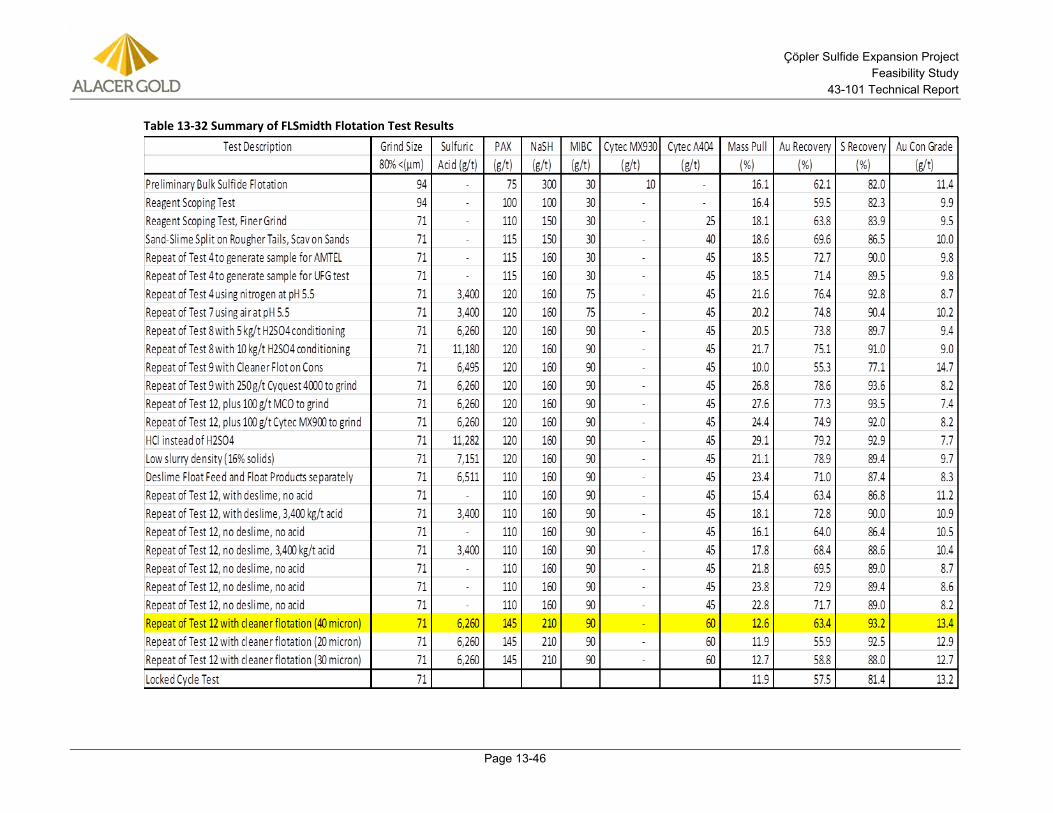
Çöpler Sulfide Expansion Project Feasibility Study
43-101 Technical Report
Page 13-46
Table 13-32 Summary of FLSmidth Flotation Test Results
Çöpler Sulfide Expansion Project Feasibility Study
43-101 Technical Report
Page 14-1
14.0 MINERAL RESOURCE ESTIMATES
14.1 Introduction The Çöpler open pit resource model discussed in this section was constructed by Gordon Seibel, R.M. SME and Principal Geologist with AMEC E&C Services (AMEC), and Loren Ligocki, Alacer Senior Resource Geologist. The Mineral Resource estimate was checked by Dr. Harry Parker, Geology & Geostatistics Consultant for AMEC. Dr. Harry Parker and Gordon Seibel are the QPs for the resource model and Mineral Resource estimate.
The AMEC QPs consider that the Mineral Resource models and Mineral Resource estimates derived from those models are consistent with Canadian Institute of Mining Metallurgy and Petroleum (CIM) Definition Standards (2014) and were performed using the relevant CIM Best Practice Guidelines (2003).
Traditional Mineral Resource modeling methods are commonly undertaken by manually constructing wireframes around the economic mineralization. Such methods are labor intensive, time consuming, and difficult to update with additional drilling or changing cut-off grades. Due to these difficulties, three different methods were evaluated to define the geometry of the gold mineralization and to determine which method would be more practical in terms of modifications due to additional data or parameter changes. The three methods are as follows:
• Construct wireframes using commercially-available Leapfrog software by interpolating Au assay values in the drill holes. This method uses structural trends that can be adjusted to match known geologic features within the deposit, and follows the assay values throughout the Project to produce a 3D solid. Dilution can be controlled by adjusting the nugget and strength of the structural trends. This modeling method is dependent upon adequate drill spacing and representative assays.
• Construct wireframes in Leapfrog using Au indicators. Gold values above a specific threshold are flagged as “high” with those below the threshold denoted as “low”. The resulting high- and low-intervals are treated like lithologic contacts when modeled. Wireframes are constructed based on these indicators, and various input parameters within the software can be changed to control the shape of the wireframes on a dynamic basis. This method tends to be more detailed than constructing wireframes manually, but yields a more cohesive shape. Adjustments to the overall volume can be quickly changed by selecting a higher or lower threshold value.
• Define and estimate the economic mineralization using Probability Assigned Constrained Kriging (PACK) method. PACK was specifically designed to define economic envelopes around mineralized zones that are difficult to define using wireframes. PACK first constructs a probabilistic model or envelope around the limits of the economic mineralization, and then uses the blocks within these envelopes during the Mineral Resource estimation to confine the economic assays to prevent them being smeared into the waste (outside the envelope), and conversely to restrict waste assays from diluting the mineralized material inside the envelope. PACK has the advantage of easily being updated with changing economic parameters, addition of new data, and/or new geological interpretations. When production data are available, a calibration model can be constructed in the mined-out areas, and the size of the envelopes can be
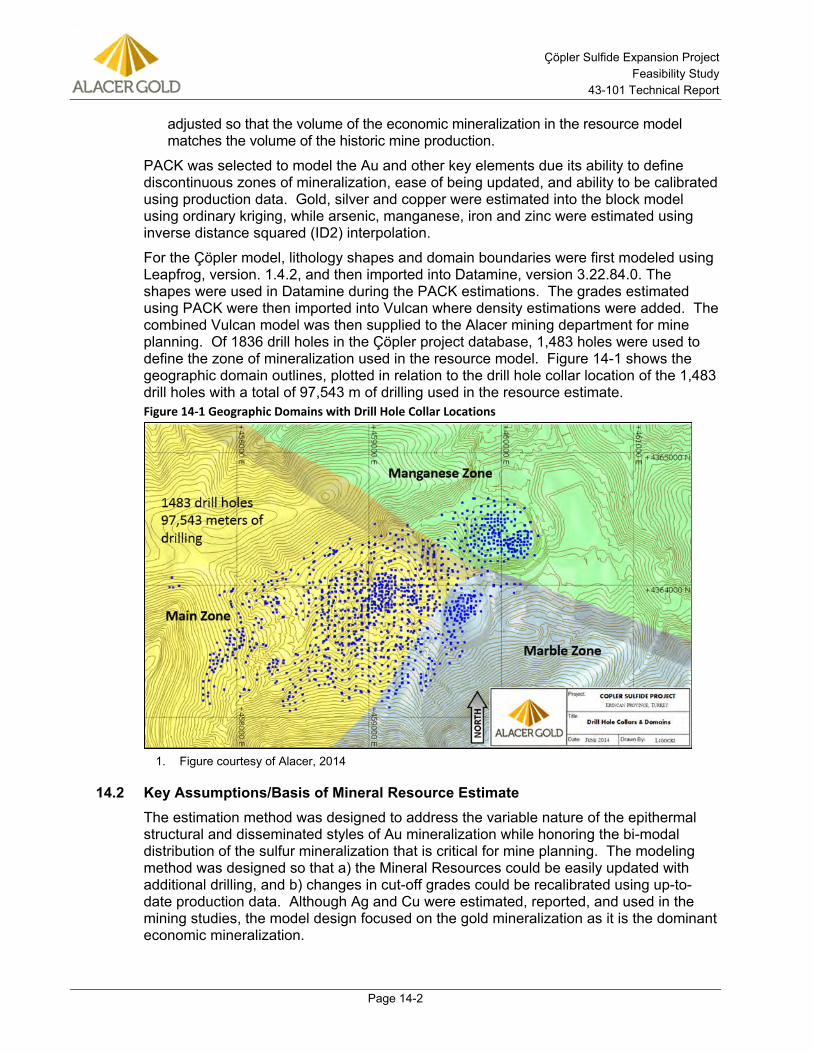
Çöpler Sulfide Expansion Project Feasibility Study
43-101 Technical Report
Page 14-2
adjusted so that the volume of the economic mineralization in the resource model matches the volume of the historic mine production.
PACK was selected to model the Au and other key elements due its ability to define discontinuous zones of mineralization, ease of being updated, and ability to be calibrated using production data. Gold, silver and copper were estimated into the block model using ordinary kriging, while arsenic, manganese, iron and zinc were estimated using inverse distance squared (ID2) interpolation.
For the Çöpler model, lithology shapes and domain boundaries were first modeled using Leapfrog, version. 1.4.2, and then imported into Datamine, version 3.22.84.0. The shapes were used in Datamine during the PACK estimations. The grades estimated using PACK were then imported into Vulcan where density estimations were added. The combined Vulcan model was then supplied to the Alacer mining department for mine planning. Of 1836 drill holes in the Çöpler project database, 1,483 holes were used to define the zone of mineralization used in the resource model. Figure 14-1 shows the geographic domain outlines, plotted in relation to the drill hole collar location of the 1,483 drill holes with a total of 97,543 m of drilling used in the resource estimate. Figure 14-1 Geographic Domains with Drill Hole Collar Locations
Figure courtesy of Alacer, 2014 1.
14.2 Key Assumptions/Basis of Mineral Resource Estimate The estimation method was designed to address the variable nature of the epithermal structural and disseminated styles of Au mineralization while honoring the bi-modal distribution of the sulfur mineralization that is critical for mine planning. The modeling method was designed so that a) the Mineral Resources could be easily updated with additional drilling, and b) changes in cut-off grades could be recalibrated using up-to-date production data. Although Ag and Cu were estimated, reported, and used in the mining studies, the model design focused on the gold mineralization as it is the dominant economic mineralization.
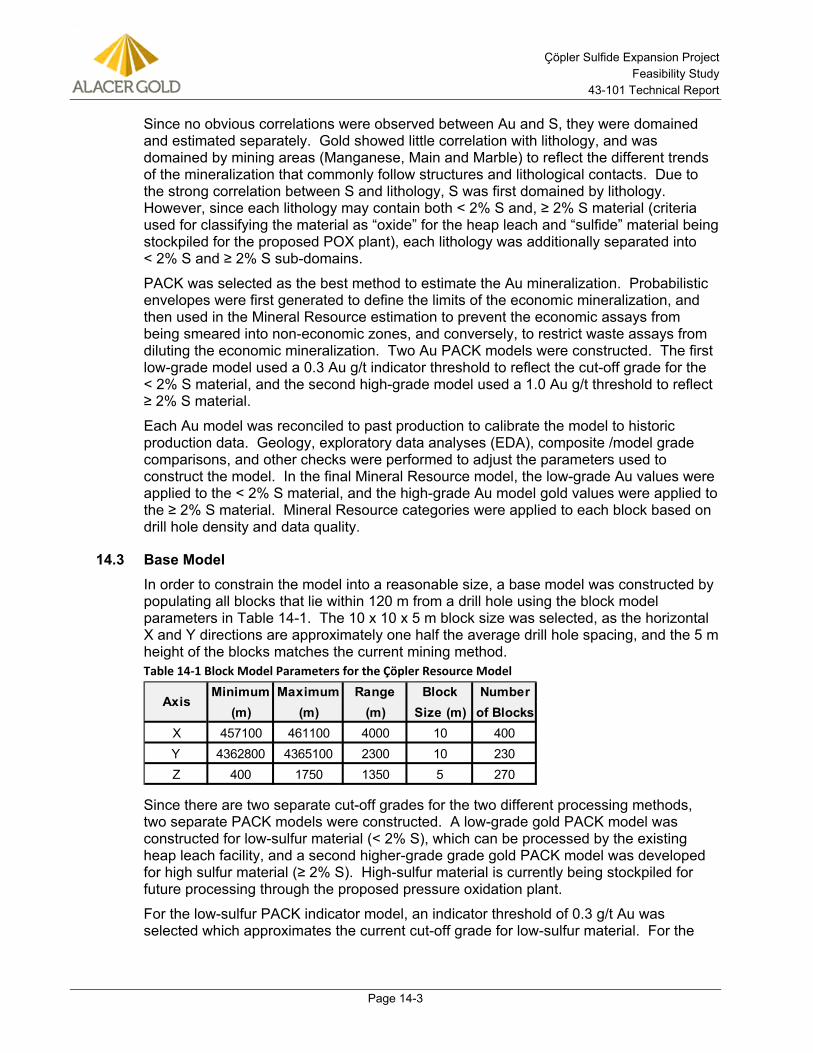
Çöpler Sulfide Expansion Project Feasibility Study
43-101 Technical Report
Page 14-3
Since no obvious correlations were observed between Au and S, they were domained and estimated separately. Gold showed little correlation with lithology, and was domained by mining areas (Manganese, Main and Marble) to reflect the different trends of the mineralization that commonly follow structures and lithological contacts. Due to the strong correlation between S and lithology, S was first domained by lithology. However, since each lithology may contain both < 2% S and, ≥ 2% S material (criteria used for classifying the material as “oxide” for the heap leach and “sulfide” material being stockpiled for the proposed POX plant), each lithology was additionally separated into < 2% S and ≥ 2% S sub-domains.
PACK was selected as the best method to estimate the Au mineralization. Probabilistic envelopes were first generated to define the limits of the economic mineralization, and then used in the Mineral Resource estimation to prevent the economic assays from being smeared into non-economic zones, and conversely, to restrict waste assays from diluting the economic mineralization. Two Au PACK models were constructed. The first low-grade model used a 0.3 Au g/t indicator threshold to reflect the cut-off grade for the < 2% S material, and the second high-grade model used a 1.0 Au g/t threshold to reflect ≥ 2% S material.
Each Au model was reconciled to past production to calibrate the model to historic production data. Geology, exploratory data analyses (EDA), composite /model grade comparisons, and other checks were performed to adjust the parameters used to construct the model. In the final Mineral Resource model, the low-grade Au values were applied to the < 2% S material, and the high-grade Au model gold values were applied to the ≥ 2% S material. Mineral Resource categories were applied to each block based on drill hole density and data quality.
14.3 Base Model In order to constrain the model into a reasonable size, a base model was constructed by populating all blocks that lie within 120 m from a drill hole using the block model parameters in Table 14-1. The 10 x 10 x 5 m block size was selected, as the horizontal X and Y directions are approximately one half the average drill hole spacing, and the 5 m height of the blocks matches the current mining method. Table 14-1 Block Model Parameters for the Çöpler Resource Model
Since there are two separate cut-off grades for the two different processing methods, two separate PACK models were constructed. A low-grade gold PACK model was constructed for low-sulfur material (< 2% S), which can be processed by the existing heap leach facility, and a second higher-grade grade gold PACK model was developed for high sulfur material (≥ 2% S). High-sulfur material is currently being stockpiled for future processing through the proposed pressure oxidation plant.
For the low-sulfur PACK indicator model, an indicator threshold of 0.3 g/t Au was selected which approximates the current cut-off grade for low-sulfur material. For the
Minimum Maximum Range Block Number(m) (m) (m) Size (m) of Blocks
X 457100 461100 4000 10 400Y 4362800 4365100 2300 10 230Z 400 1750 1350 5 270
Axis

Çöpler Sulfide Expansion Project Feasibility Study
43-101 Technical Report
Page 14-4
high sulfur PACK indicator model, a 1.0 g/t Au threshold was selected as it approximates the lower end of the gold cut-off grades being considered for the high-sulfur material.
The indicators were calculated on 1 m composites, and then composited on 10 m down-the-hole to “soften” the indicator boundaries. These values were estimated into the base model using ID2 and using the parameters shown in Table 14-2. An example cross section is shown in Figure 14-2 of the lower-grade indicator model with interpolated block values greater than 0.3 colored red. Exploratory data analyses (EDA) and capping studies were performed on samples within this envelope.
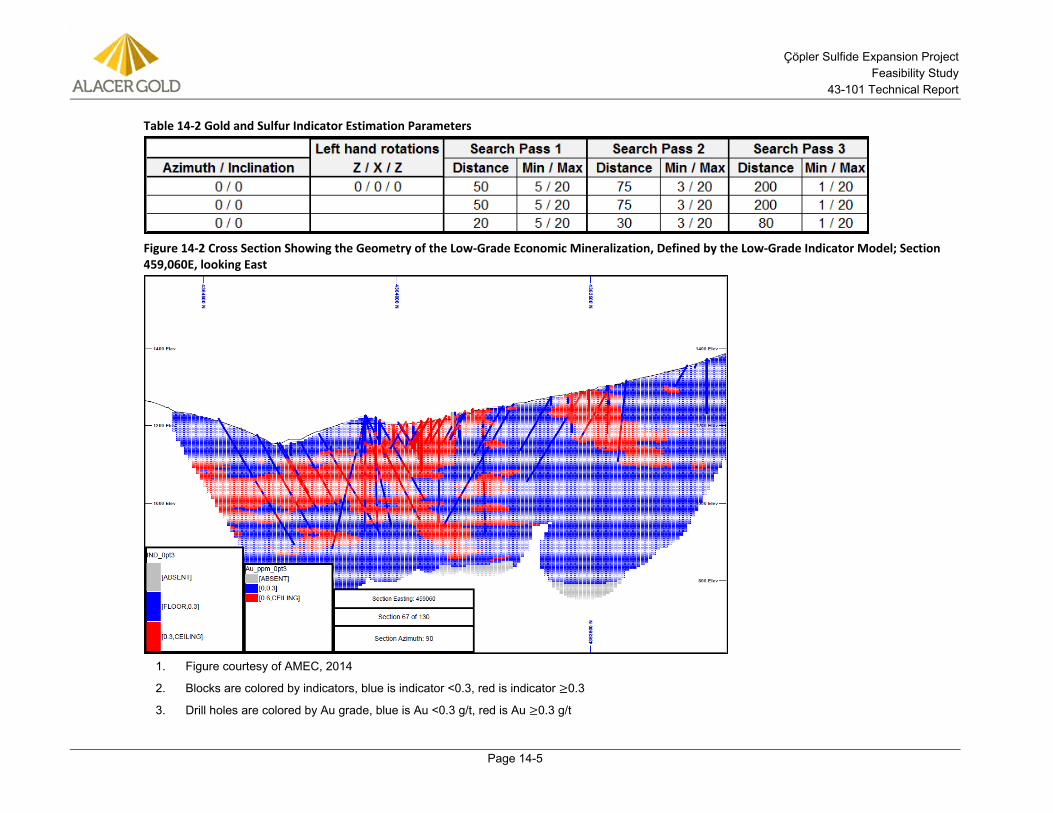
Çöpler Sulfide Expansion Project Feasibility Study
43-101 Technical Report
Page 14-5
Table 14-2 Gold and Sulfur Indicator Estimation Parameters
Figure 14-2 Cross Section Showing the Geometry of the Low-Grade Economic Mineralization, Defined by the Low-Grade Indicator Model; Section 459,060E, looking East
Figure courtesy of AMEC, 2014 1.
Blocks are colored by indicators, blue is indicator <0.3, red is indicator ≥0.3 2.
Drill holes are colored by Au grade, blue is Au <0.3 g/t, red is Au ≥0.3 g/t3.
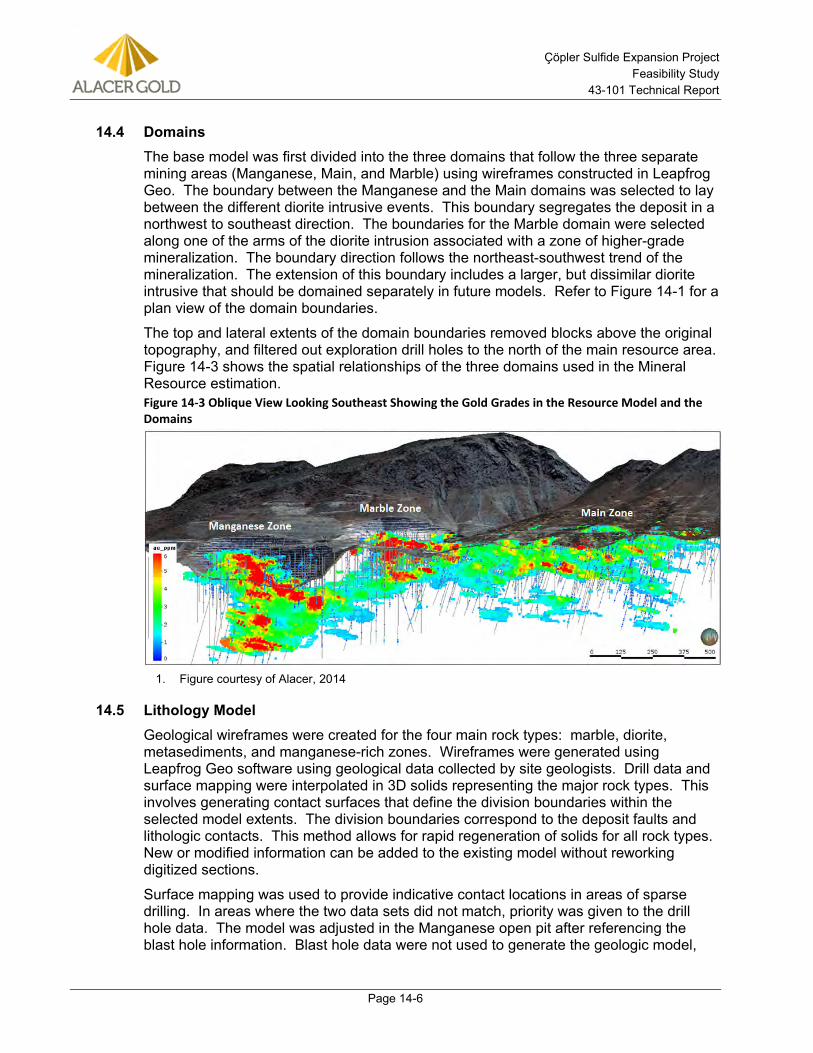
Çöpler Sulfide Expansion Project Feasibility Study
43-101 Technical Report
Page 14-6
14.4 Domains The base model was first divided into the three domains that follow the three separate mining areas (Manganese, Main, and Marble) using wireframes constructed in Leapfrog Geo. The boundary between the Manganese and the Main domains was selected to lay between the different diorite intrusive events. This boundary segregates the deposit in a northwest to southeast direction. The boundaries for the Marble domain were selected along one of the arms of the diorite intrusion associated with a zone of higher-grade mineralization. The boundary direction follows the northeast-southwest trend of the mineralization. The extension of this boundary includes a larger, but dissimilar diorite intrusive that should be domained separately in future models. Refer to Figure 14-1 for a plan view of the domain boundaries.
The top and lateral extents of the domain boundaries removed blocks above the original topography, and filtered out exploration drill holes to the north of the main resource area. Figure 14-3 shows the spatial relationships of the three domains used in the Mineral Resource estimation. Figure 14-3 Oblique View Looking Southeast Showing the Gold Grades in the Resource Model and the Domains
Figure courtesy of Alacer, 2014 1.
14.5 Lithology Model Geological wireframes were created for the four main rock types: marble, diorite, metasediments, and manganese-rich zones. Wireframes were generated using Leapfrog Geo software using geological data collected by site geologists. Drill data and surface mapping were interpolated in 3D solids representing the major rock types. This involves generating contact surfaces that define the division boundaries within the selected model extents. The division boundaries correspond to the deposit faults and lithologic contacts. This method allows for rapid regeneration of solids for all rock types. New or modified information can be added to the existing model without reworking digitized sections.
Surface mapping was used to provide indicative contact locations in areas of sparse drilling. In areas where the two data sets did not match, priority was given to the drill hole data. The model was adjusted in the Manganese open pit after referencing the blast hole information. Blast hole data were not used to generate the geologic model,
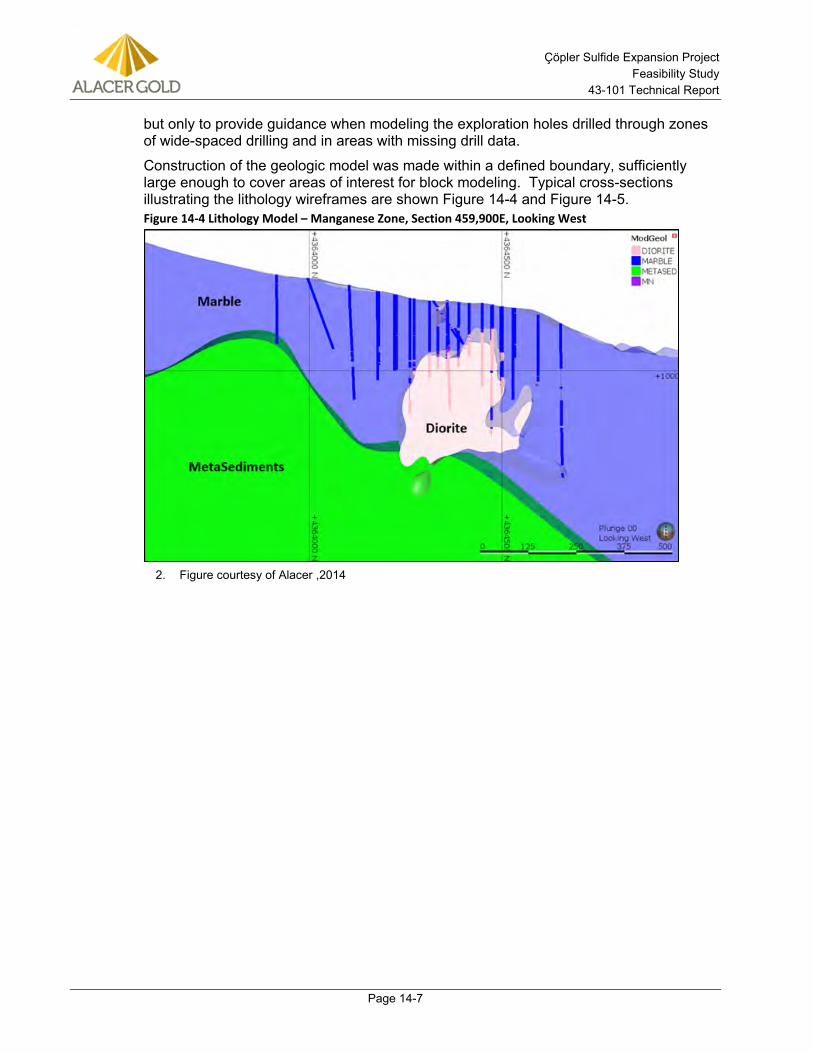
Çöpler Sulfide Expansion Project Feasibility Study
43-101 Technical Report
Page 14-7
but only to provide guidance when modeling the exploration holes drilled through zones of wide-spaced drilling and in areas with missing drill data.
Construction of the geologic model was made within a defined boundary, sufficiently large enough to cover areas of interest for block modeling. Typical cross-sections illustrating the lithology wireframes are shown Figure 14-4 and Figure 14-5. Figure 14-4 Lithology Model – Manganese Zone, Section 459,900E, Looking West
Figure courtesy of Alacer ,2014 2.
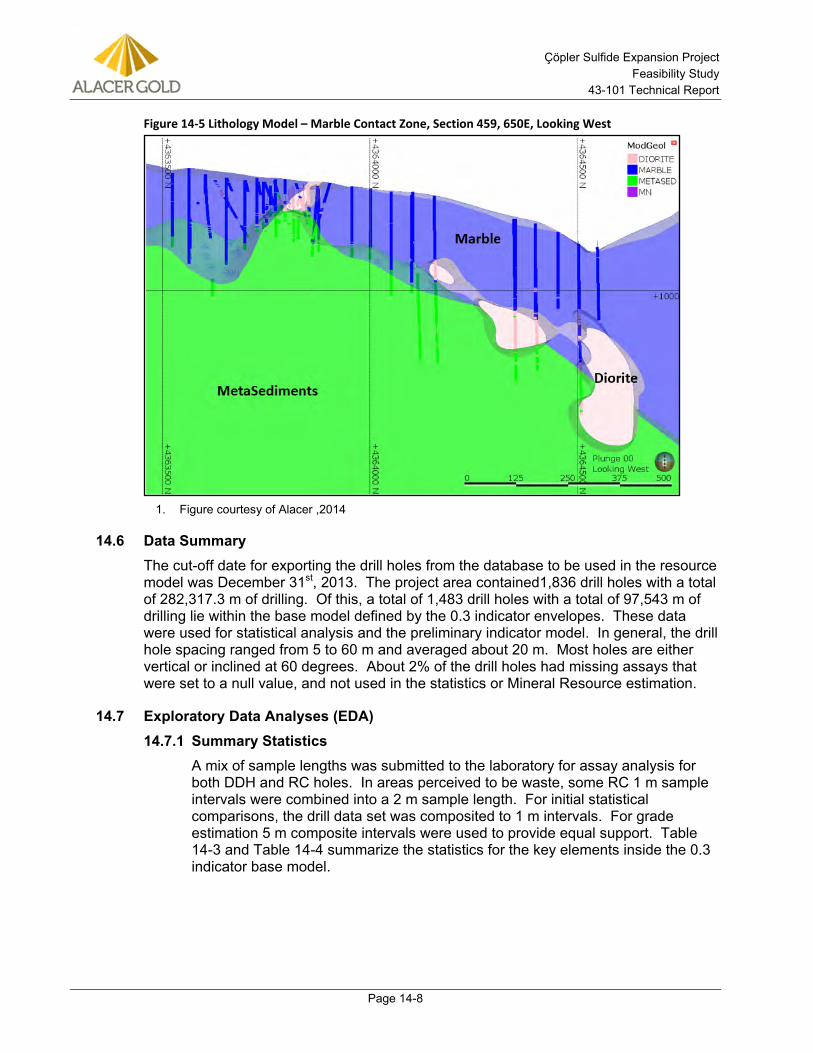
Çöpler Sulfide Expansion Project Feasibility Study
43-101 Technical Report
Page 14-8
Figure 14-5 Lithology Model – Marble Contact Zone, Section 459, 650E, Looking West
Figure courtesy of Alacer ,2014 1.
14.6 Data Summary The cut-off date for exporting the drill holes from the database to be used in the resource model was December 31st, 2013. The project area contained1,836 drill holes with a total of 282,317.3 m of drilling. Of this, a total of 1,483 drill holes with a total of 97,543 m of drilling lie within the base model defined by the 0.3 indicator envelopes. These data were used for statistical analysis and the preliminary indicator model. In general, the drill hole spacing ranged from 5 to 60 m and averaged about 20 m. Most holes are either vertical or inclined at 60 degrees. About 2% of the drill holes had missing assays that were set to a null value, and not used in the statistics or Mineral Resource estimation.
14.7 Exploratory Data Analyses (EDA) Summary Statistics 14.7.1A mix of sample lengths was submitted to the laboratory for assay analysis for both DDH and RC holes. In areas perceived to be waste, some RC 1 m sample intervals were combined into a 2 m sample length. For initial statistical comparisons, the drill data set was composited to 1 m intervals. For grade estimation 5 m composite intervals were used to provide equal support. Table 14-3 and Table 14-4 summarize the statistics for the key elements inside the 0.3 indicator base model.
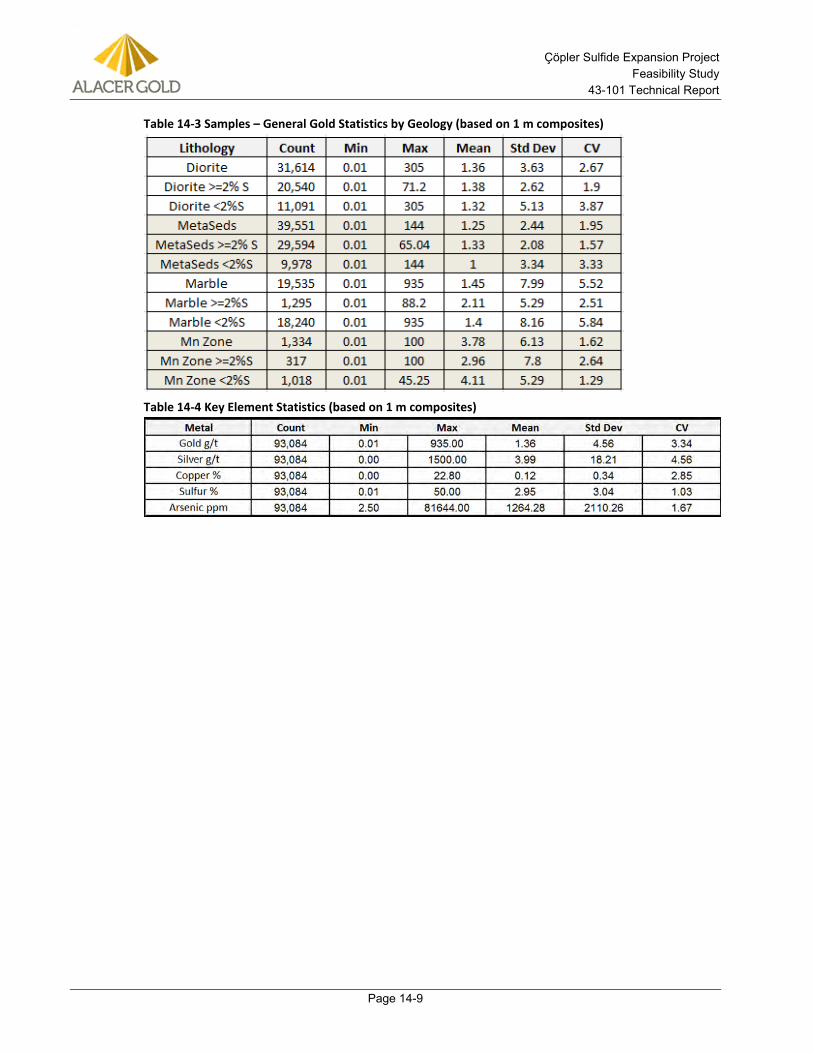
Çöpler Sulfide Expansion Project Feasibility Study
43-101 Technical Report
Page 14-9
Table 14-3 Samples – General Gold Statistics by Geology (based on 1 m composites)
Table 14-4 Key Element Statistics (based on 1 m composites)
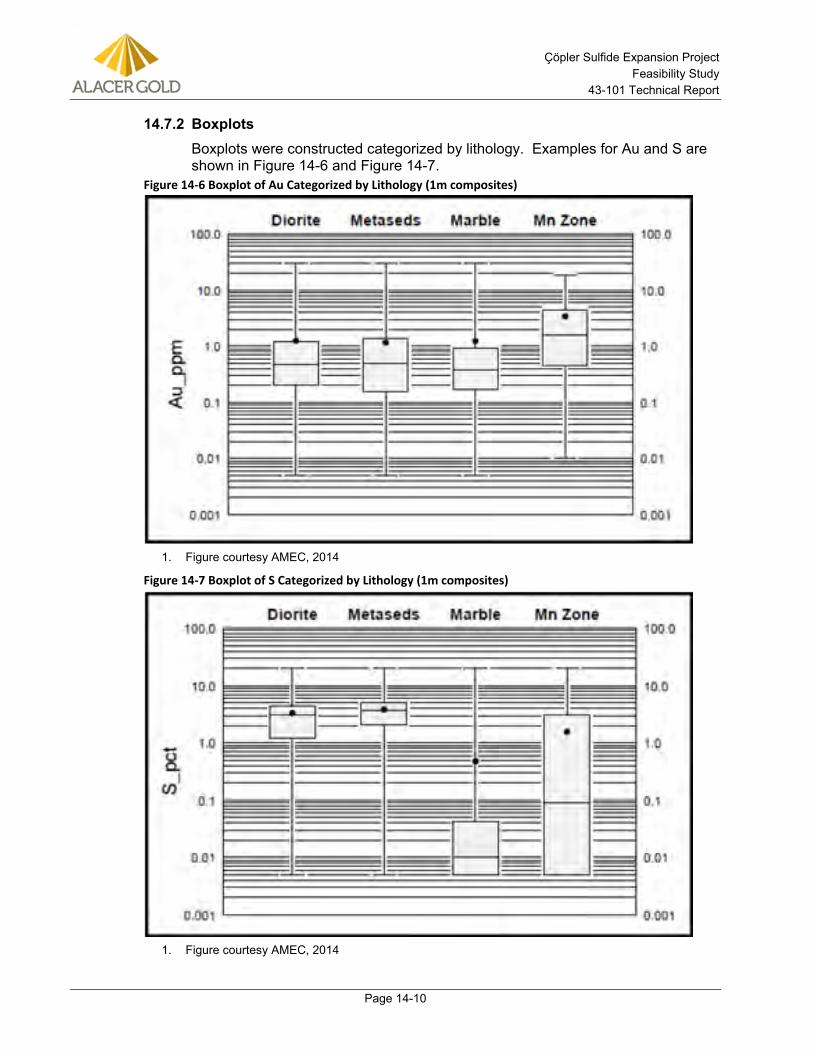
Çöpler Sulfide Expansion Project Feasibility Study
43-101 Technical Report
Page 14-10
Boxplots 14.7.2Boxplots were constructed categorized by lithology. Examples for Au and S are shown in Figure 14-6 and Figure 14-7.
Figure 14-6 Boxplot of Au Categorized by Lithology (1m composites)
Figure courtesy AMEC, 2014 1.
Figure 14-7 Boxplot of S Categorized by Lithology (1m composites)
Figure courtesy AMEC, 2014 1.
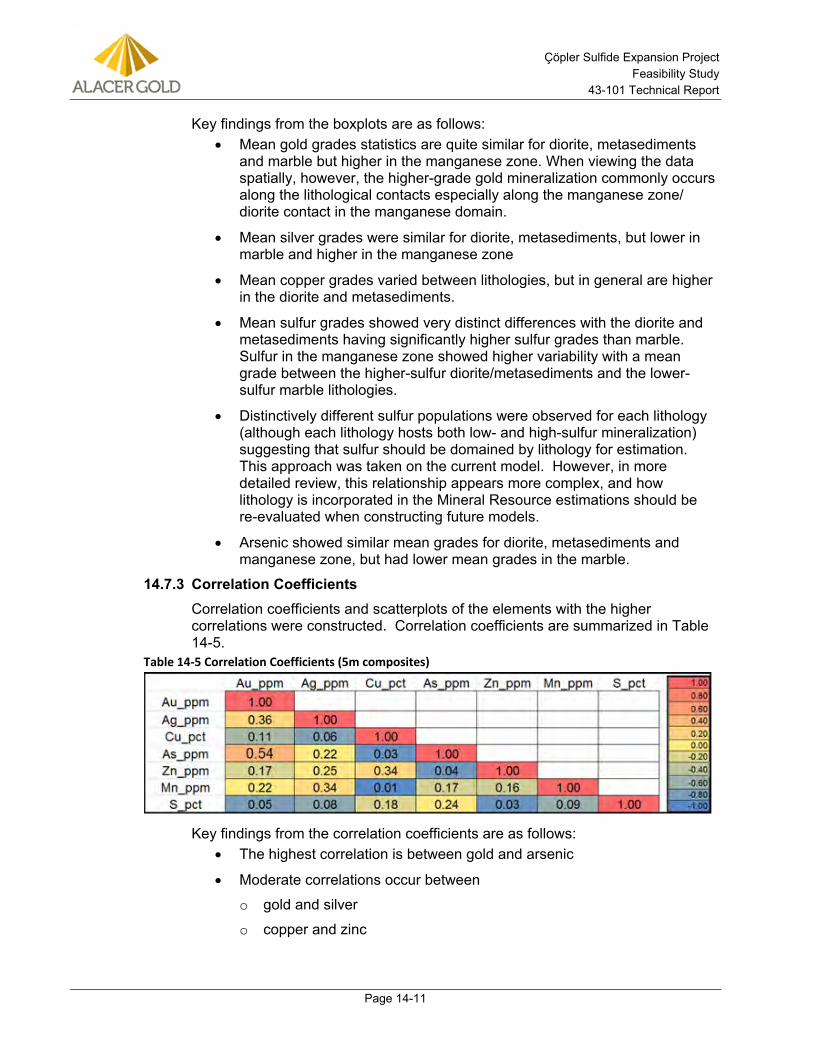
Çöpler Sulfide Expansion Project Feasibility Study
43-101 Technical Report
Page 14-11
Key findings from the boxplots are as follows: • Mean gold grades statistics are quite similar for diorite, metasediments
and marble but higher in the manganese zone. When viewing the data spatially, however, the higher-grade gold mineralization commonly occurs along the lithological contacts especially along the manganese zone/ diorite contact in the manganese domain.
• Mean silver grades were similar for diorite, metasediments, but lower in marble and higher in the manganese zone
• Mean copper grades varied between lithologies, but in general are higher in the diorite and metasediments.
• Mean sulfur grades showed very distinct differences with the diorite and metasediments having significantly higher sulfur grades than marble. Sulfur in the manganese zone showed higher variability with a mean grade between the higher-sulfur diorite/metasediments and the lower-sulfur marble lithologies.
• Distinctively different sulfur populations were observed for each lithology (although each lithology hosts both low- and high-sulfur mineralization) suggesting that sulfur should be domained by lithology for estimation. This approach was taken on the current model. However, in more detailed review, this relationship appears more complex, and how lithology is incorporated in the Mineral Resource estimations should be re-evaluated when constructing future models.
• Arsenic showed similar mean grades for diorite, metasediments and manganese zone, but had lower mean grades in the marble.
Correlation Coefficients 14.7.3Correlation coefficients and scatterplots of the elements with the higher correlations were constructed. Correlation coefficients are summarized in Table 14-5.
Table 14-5 Correlation Coefficients (5m composites)
Key findings from the correlation coefficients are as follows: • The highest correlation is between gold and arsenic
• Moderate correlations occur between
o gold and silver
o copper and zinc
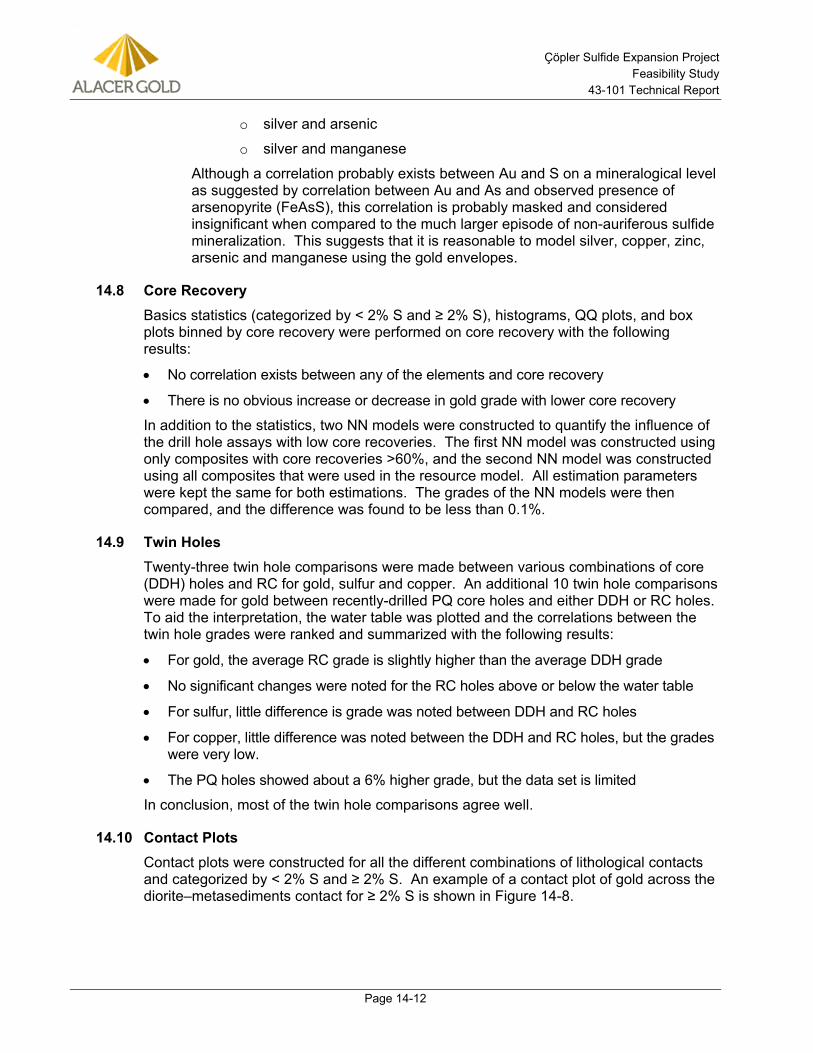
Çöpler Sulfide Expansion Project Feasibility Study
43-101 Technical Report
Page 14-12
o silver and arsenic
o silver and manganese
Although a correlation probably exists between Au and S on a mineralogical level as suggested by correlation between Au and As and observed presence of arsenopyrite (FeAsS), this correlation is probably masked and considered insignificant when compared to the much larger episode of non-auriferous sulfide mineralization. This suggests that it is reasonable to model silver, copper, zinc, arsenic and manganese using the gold envelopes.
14.8 Core Recovery Basics statistics (categorized by < 2% S and ≥ 2% S), histograms, QQ plots, and box plots binned by core recovery were performed on core recovery with the following results:
• No correlation exists between any of the elements and core recovery
• There is no obvious increase or decrease in gold grade with lower core recovery
In addition to the statistics, two NN models were constructed to quantify the influence of the drill hole assays with low core recoveries. The first NN model was constructed using only composites with core recoveries >60%, and the second NN model was constructed using all composites that were used in the resource model. All estimation parameters were kept the same for both estimations. The grades of the NN models were then compared, and the difference was found to be less than 0.1%.
14.9 Twin Holes Twenty-three twin hole comparisons were made between various combinations of core (DDH) holes and RC for gold, sulfur and copper. An additional 10 twin hole comparisons were made for gold between recently-drilled PQ core holes and either DDH or RC holes. To aid the interpretation, the water table was plotted and the correlations between the twin hole grades were ranked and summarized with the following results:
• For gold, the average RC grade is slightly higher than the average DDH grade
• No significant changes were noted for the RC holes above or below the water table
• For sulfur, little difference is grade was noted between DDH and RC holes
• For copper, little difference was noted between the DDH and RC holes, but the grades were very low.
• The PQ holes showed about a 6% higher grade, but the data set is limited
In conclusion, most of the twin hole comparisons agree well.
14.10 Contact Plots Contact plots were constructed for all the different combinations of lithological contacts and categorized by < 2% S and ≥ 2% S. An example of a contact plot of gold across the diorite–metasediments contact for ≥ 2% S is shown in Figure 14-8.
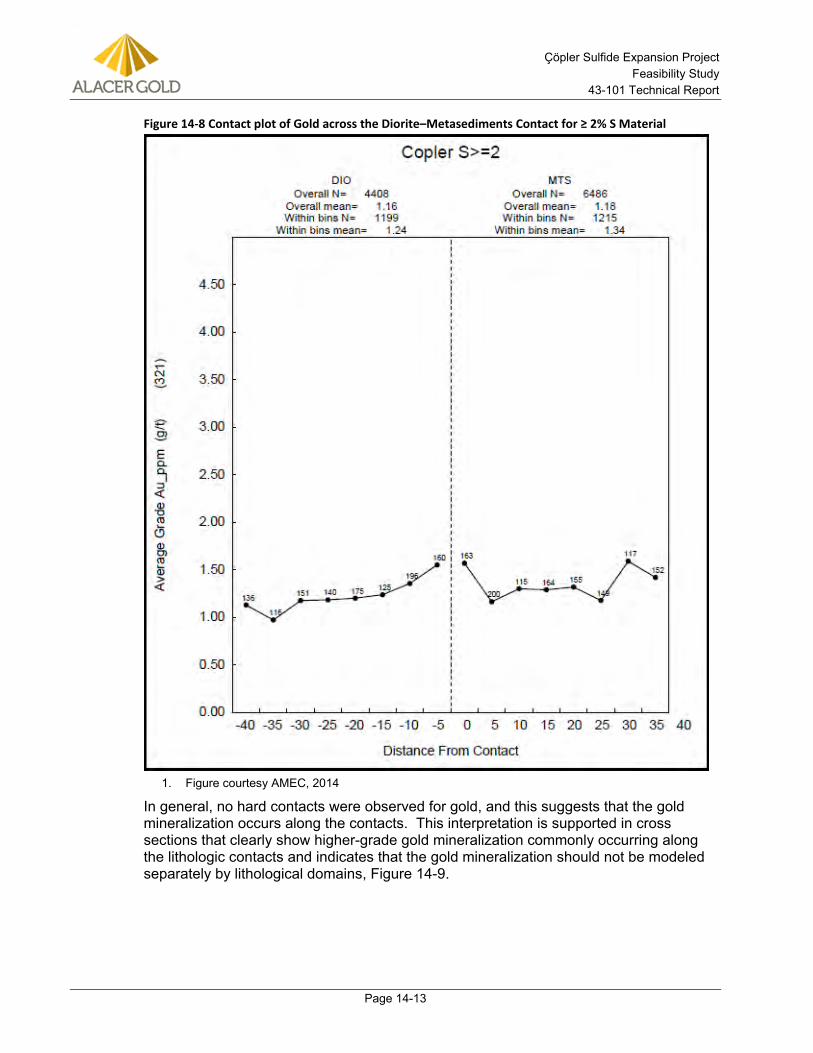
Çöpler Sulfide Expansion Project Feasibility Study
43-101 Technical Report
Page 14-13
Figure 14-8 Contact plot of Gold across the Diorite–Metasediments Contact for ≥ 2% S Material
Figure courtesy AMEC, 2014 1.
In general, no hard contacts were observed for gold, and this suggests that the gold mineralization occurs along the contacts. This interpretation is supported in cross sections that clearly show higher-grade gold mineralization commonly occurring along the lithologic contacts and indicates that the gold mineralization should not be modeled separately by lithological domains, Figure 14-9.
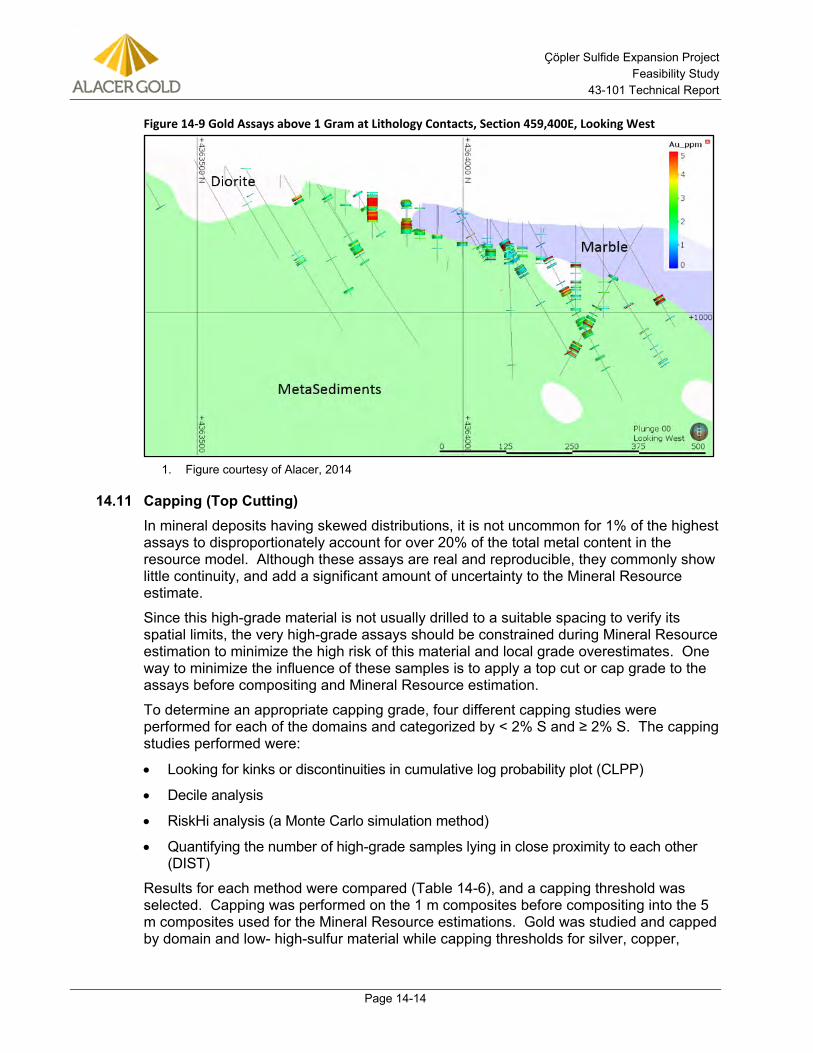
Çöpler Sulfide Expansion Project Feasibility Study
43-101 Technical Report
Page 14-14
Figure 14-9 Gold Assays above 1 Gram at Lithology Contacts, Section 459,400E, Looking West
Figure courtesy of Alacer, 2014 1.
14.11 Capping (Top Cutting) In mineral deposits having skewed distributions, it is not uncommon for 1% of the highest assays to disproportionately account for over 20% of the total metal content in the resource model. Although these assays are real and reproducible, they commonly show little continuity, and add a significant amount of uncertainty to the Mineral Resource estimate.
Since this high-grade material is not usually drilled to a suitable spacing to verify its spatial limits, the very high-grade assays should be constrained during Mineral Resource estimation to minimize the high risk of this material and local grade overestimates. One way to minimize the influence of these samples is to apply a top cut or cap grade to the assays before compositing and Mineral Resource estimation.
To determine an appropriate capping grade, four different capping studies were performed for each of the domains and categorized by < 2% S and ≥ 2% S. The capping studies performed were:
• Looking for kinks or discontinuities in cumulative log probability plot (CLPP)
• Decile analysis
• RiskHi analysis (a Monte Carlo simulation method)
• Quantifying the number of high-grade samples lying in close proximity to each other (DIST)
Results for each method were compared (Table 14-6), and a capping threshold was selected. Capping was performed on the 1 m composites before compositing into the 5 m composites used for the Mineral Resource estimations. Gold was studied and capped by domain and low- high-sulfur material while capping thresholds for silver, copper,
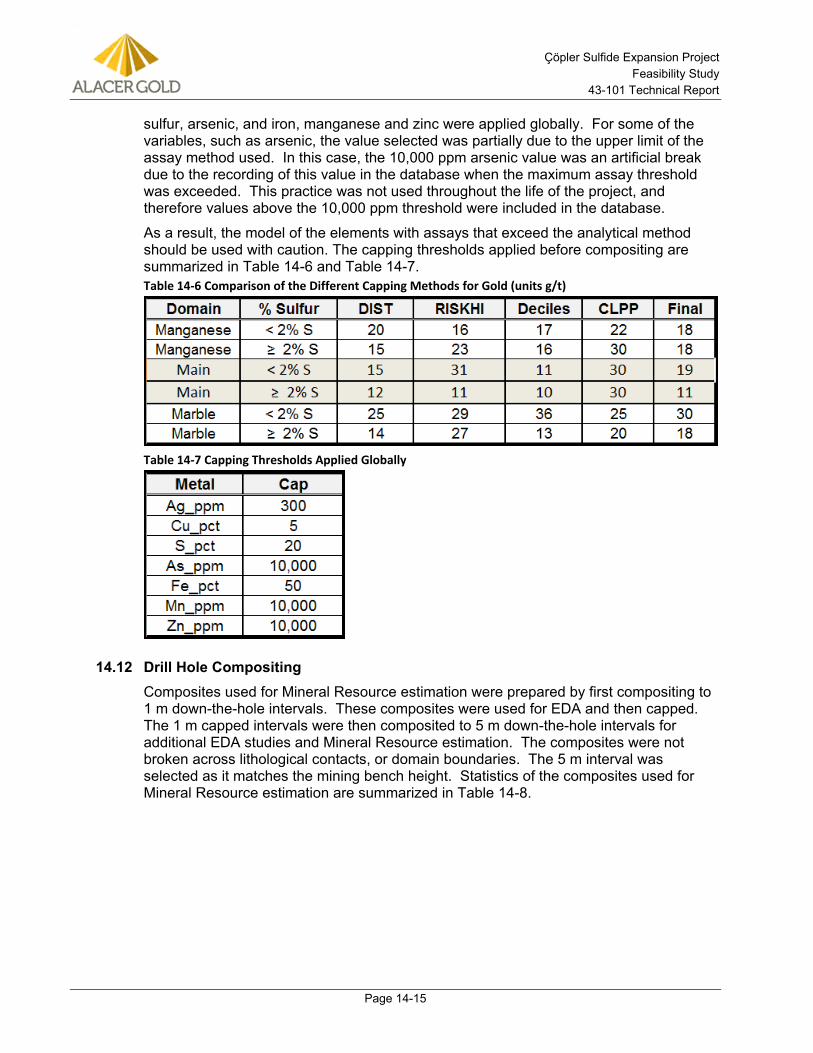
Çöpler Sulfide Expansion Project Feasibility Study
43-101 Technical Report
Page 14-15
sulfur, arsenic, and iron, manganese and zinc were applied globally. For some of the variables, such as arsenic, the value selected was partially due to the upper limit of the assay method used. In this case, the 10,000 ppm arsenic value was an artificial break due to the recording of this value in the database when the maximum assay threshold was exceeded. This practice was not used throughout the life of the project, and therefore values above the 10,000 ppm threshold were included in the database.
As a result, the model of the elements with assays that exceed the analytical method should be used with caution. The capping thresholds applied before compositing are summarized in Table 14-6 and Table 14-7. Table 14-6 Comparison of the Different Capping Methods for Gold (units g/t)
Table 14-7 Capping Thresholds Applied Globally
14.12 Drill Hole Compositing Composites used for Mineral Resource estimation were prepared by first compositing to 1 m down-the-hole intervals. These composites were used for EDA and then capped. The 1 m capped intervals were then composited to 5 m down-the-hole intervals for additional EDA studies and Mineral Resource estimation. The composites were not broken across lithological contacts, or domain boundaries. The 5 m interval was selected as it matches the mining bench height. Statistics of the composites used for Mineral Resource estimation are summarized in Table 14-8.
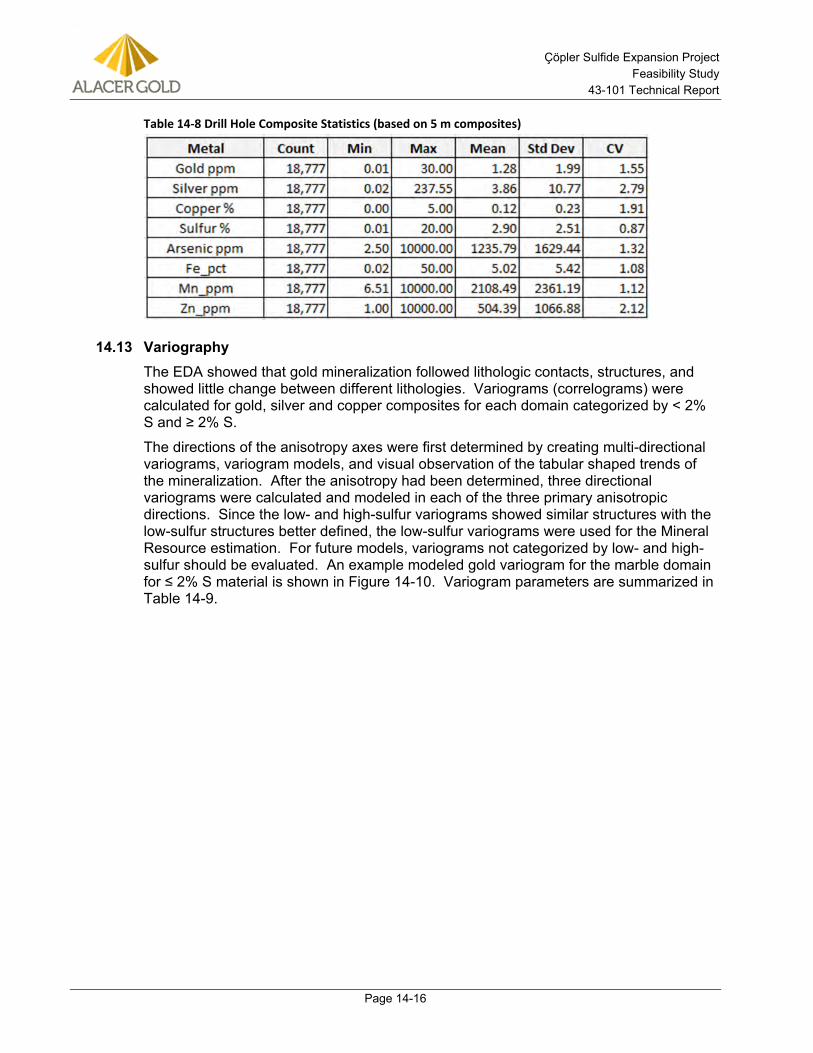
Çöpler Sulfide Expansion Project Feasibility Study
43-101 Technical Report
Page 14-16
Table 14-8 Drill Hole Composite Statistics (based on 5 m composites)
14.13 Variography The EDA showed that gold mineralization followed lithologic contacts, structures, and showed little change between different lithologies. Variograms (correlograms) were calculated for gold, silver and copper composites for each domain categorized by < 2% S and ≥ 2% S.
The directions of the anisotropy axes were first determined by creating multi-directional variograms, variogram models, and visual observation of the tabular shaped trends of the mineralization. After the anisotropy had been determined, three directional variograms were calculated and modeled in each of the three primary anisotropic directions. Since the low- and high-sulfur variograms showed similar structures with the low-sulfur structures better defined, the low-sulfur variograms were used for the Mineral Resource estimation. For future models, variograms not categorized by low- and high-sulfur should be evaluated. An example modeled gold variogram for the marble domain for ≤ 2% S material is shown in Figure 14-10. Variogram parameters are summarized in Table 14-9.
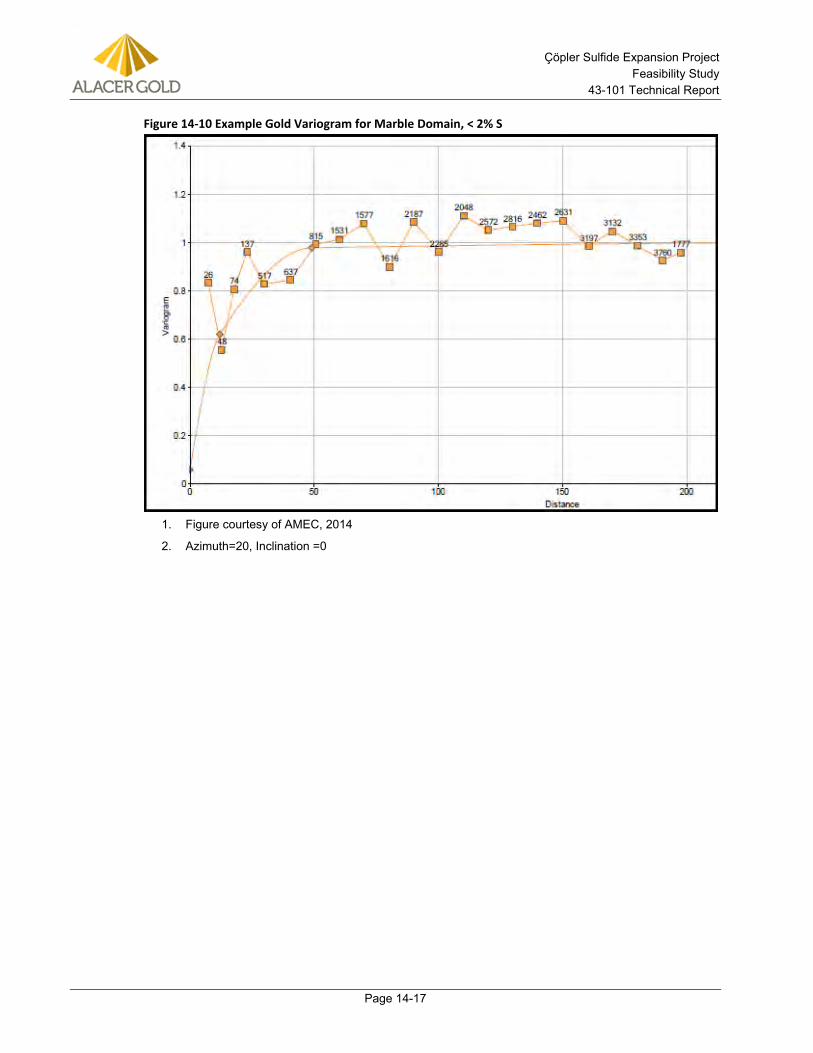
Çöpler Sulfide Expansion Project Feasibility Study
43-101 Technical Report
Page 14-17
Figure 14-10 Example Gold Variogram for Marble Domain, < 2% S
Figure courtesy of AMEC, 2014 1.
Azimuth=20, Inclination =0 2.
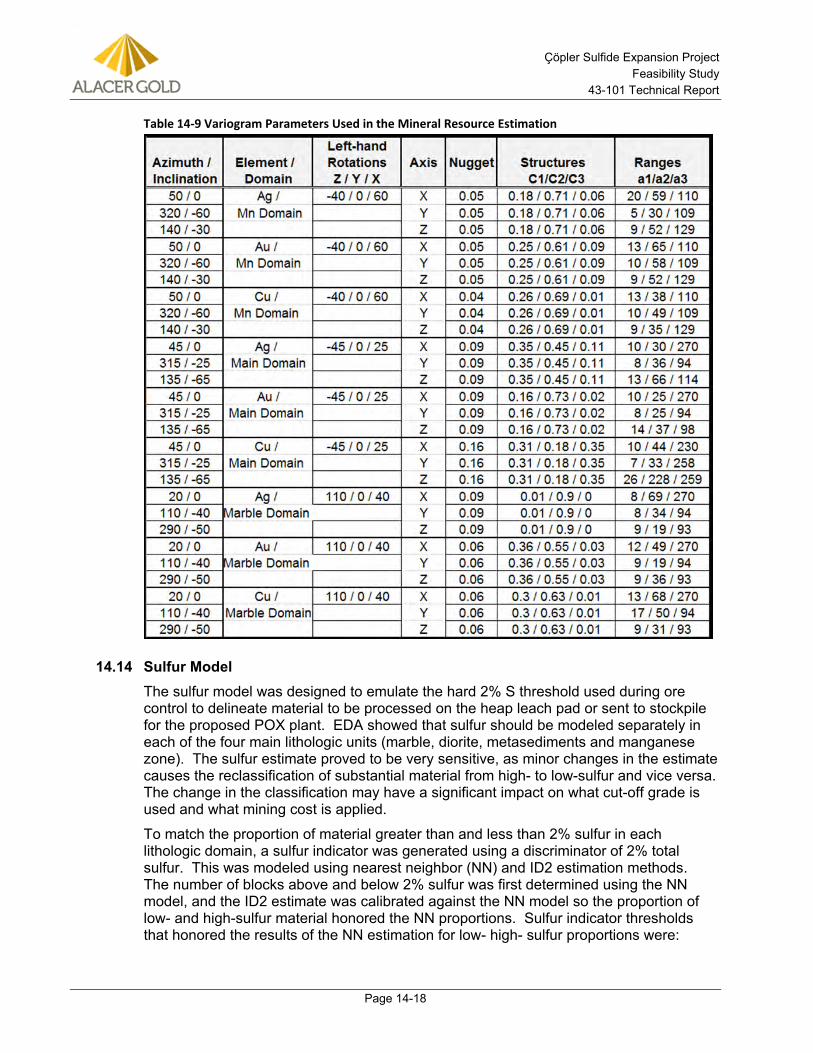
Çöpler Sulfide Expansion Project Feasibility Study
43-101 Technical Report
Page 14-18
Table 14-9 Variogram Parameters Used in the Mineral Resource Estimation
14.14 Sulfur Model The sulfur model was designed to emulate the hard 2% S threshold used during ore control to delineate material to be processed on the heap leach pad or sent to stockpile for the proposed POX plant. EDA showed that sulfur should be modeled separately in each of the four main lithologic units (marble, diorite, metasediments and manganese zone). The sulfur estimate proved to be very sensitive, as minor changes in the estimate causes the reclassification of substantial material from high- to low-sulfur and vice versa. The change in the classification may have a significant impact on what cut-off grade is used and what mining cost is applied.
To match the proportion of material greater than and less than 2% sulfur in each lithologic domain, a sulfur indicator was generated using a discriminator of 2% total sulfur. This was modeled using nearest neighbor (NN) and ID2 estimation methods. The number of blocks above and below 2% sulfur was first determined using the NN model, and the ID2 estimate was calibrated against the NN model so the proportion of low- and high-sulfur material honored the NN proportions. Sulfur indicator thresholds that honored the results of the NN estimation for low- high- sulfur proportions were:
Çöpler Sulfide Expansion Project Feasibility Study
43-101 Technical Report
Page 14-19
• Diorite = 0.56
• Metasediments = 0.60
• Marble = 0.37
• Mn zone = 0.40
The 5 m sulfur composites were then used to interpolate S grades modeled into the low- and high- sulfur domains for each lithology using ID2 and an inverse distance weighted to the fifth power (ID5) method. The sulfur model used the original model that extends 120 m from a drill hole to estimate sulfur in the waste rock for waste rock characterization.
Although the ID2 method was selected for material in the mineralized envelope, the ID5 interpolation method may prove to be a better estimation in the waste rock with sparse drilling. The ID5 estimation method should be evaluated for the next resource model. Estimation parameters for the sulfur model are summarized in Table 14-10, and a typical cross section is shown in Figure 14-11.
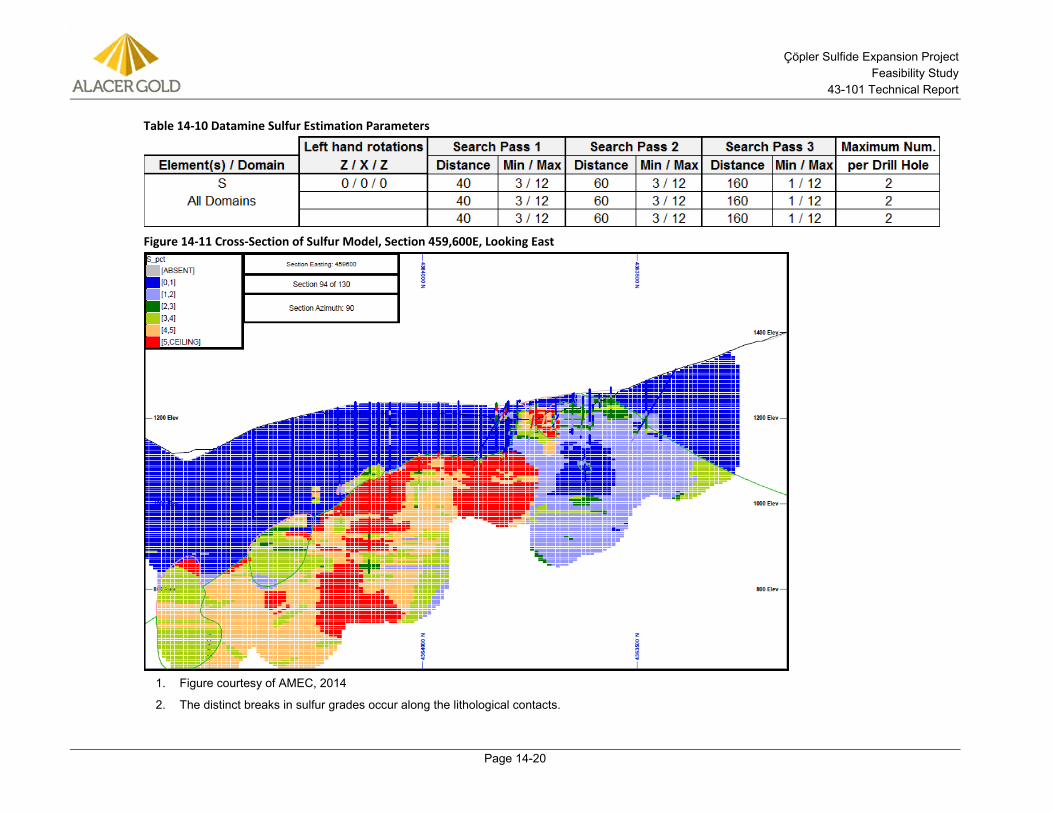
Çöpler Sulfide Expansion Project Feasibility Study
43-101 Technical Report
Page 14-20
Table 14-10 Datamine Sulfur Estimation Parameters
Figure 14-11 Cross-Section of Sulfur Model, Section 459,600E, Looking East
Figure courtesy of AMEC, 2014 1.
The distinct breaks in sulfur grades occur along the lithological contacts.2.
Çöpler Sulfide Expansion Project Feasibility Study
43-101 Technical Report
Page 14-21
14.15 Gold Model Mineral Resources were estimated using PACK using Datamine mining software version 3.22.84.0. A total of eight elements, gold, silver, copper, sulfur, zinc, iron, arsenic and manganese were estimated. Gold, copper and silver were estimated using ordinary kriging (OK); the remaining elements were estimated using the ID2 method. Zinc, iron, arsenic and manganese were restricted to the mineralized gold envelopes as these elements are only used for material-type classification. All blocks were estimated using a block discretisation of 2 x 2 x 2. After the estimations were completed, a smoothing algorithm was applied to remove any scattered or non-continuous blocks.
Since there are two types of economic mineralization, < 2% S and ≥ 2% S, and each has a different cut-off grade and processing method, two separate PACK models were constructed. A lower-grade PACK model was constructed for the low sulfur material to be processed using the existing heap leach facility with a gold cut-off grade of 0.3 g/t, and a second higher-grade PACK model was completed for the ≥ 2% S material scheduled to be processed through the proposed POX plant. The higher-grade material has an approximate cut-off grade of 1 g/t Au.
The indicator values in the base model can be used for block selection. The selection threshold can be adjusted up (less volume) or down (more volume). The volume of the selected blocks in the PACK model was first calibrated against past production by:
• Constructing a 5 x 5 x 5 m block model in the areas that have been mined
• Tag the gold indicators generated in the base model into the 5x5x5 m blocks
• Estimate gold grades into the 5 x 5 x 5 m model using both the blasthole data and the exploration data while keeping all estimation parameters the same
• Estimate sulfur grades into the 5 x 5 x 5 m model using the exploration data while keeping all estimation parameters the same
• Adjust the gold indicator selection threshold so the volume of the test resource model matches the volume of the economic mineralization. The test model is defined by the blast hole model above 0.3 g/t Au cut-off grade for the < 2% S material, and above 1 g/t Au cut-off for the material with ≥ 2% S. The calibration resulted in a selection threshold of 0.36 indicator for the low-grade PACK model and a selection threshold of 0.42 indicator for the high-grade PACK model.
For the gold estimate, the drill hole composites were tagged with the low- and high- indicator values of the blocks that they lie within. The low-grade gold estimate was constructed using only blocks where the low-grade indicator is greater than 0.36, and using only the composites that lie within those blocks. Similarly, a high-grade gold estimate was performed using only the blocks with a high-grade gold indicator greater than 0.42, and using only those composites that lie within those blocks. For blocks with < 2% S the low-grade gold estimate was applied. For blocks with ≥ 2% S, the high-grade gold estimate was applied. An outline of the PACK method is shown in Figure 14-12. Examples of the low and high-grade PACK indicators are shown in Figure 14-13 and Figure 14-14, and the combined low- and high-grade gold model is illustrated in Figure 14-15. A summary of the PACK estimation parameters is provided in Table 14-11.
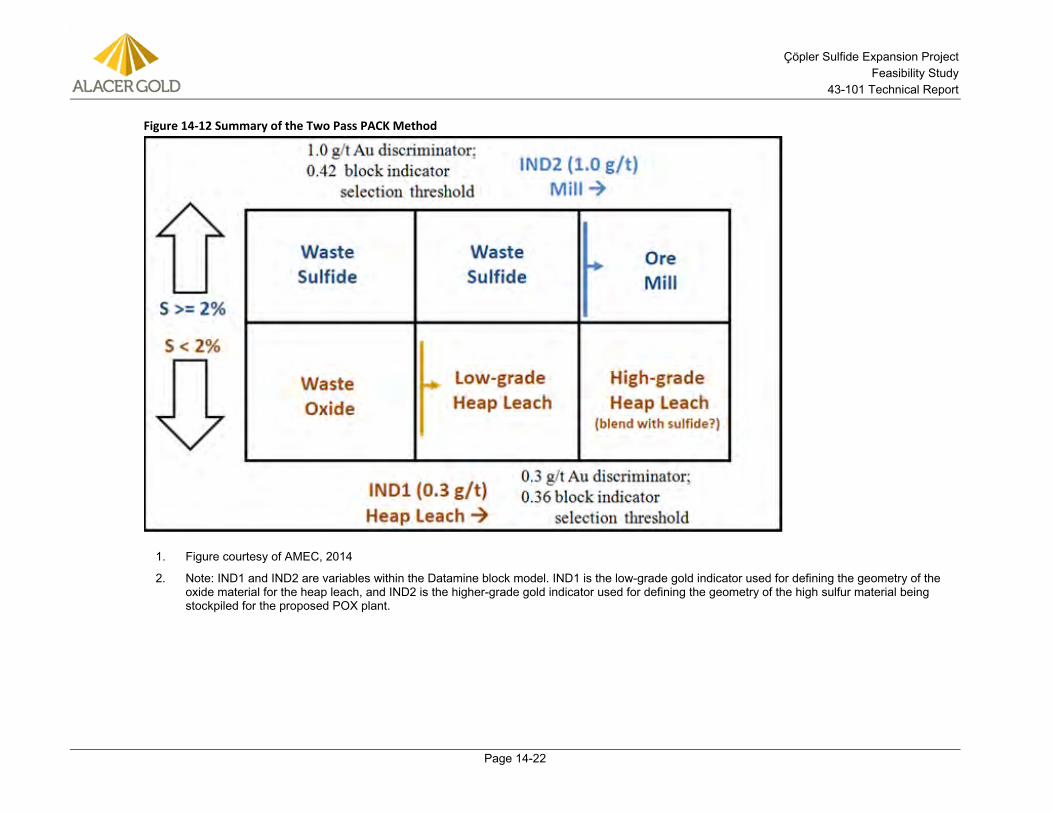
Çöpler Sulfide Expansion Project Feasibility Study
43-101 Technical Report
Page 14-22
Figure 14-12 Summary of the Two Pass PACK Method
Figure courtesy of AMEC, 2014 1.
Note: IND1 and IND2 are variables within the Datamine block model. IND1 is the low-grade gold indicator used for defining the geometry of the 2.oxide material for the heap leach, and IND2 is the higher-grade gold indicator used for defining the geometry of the high sulfur material being stockpiled for the proposed POX plant.
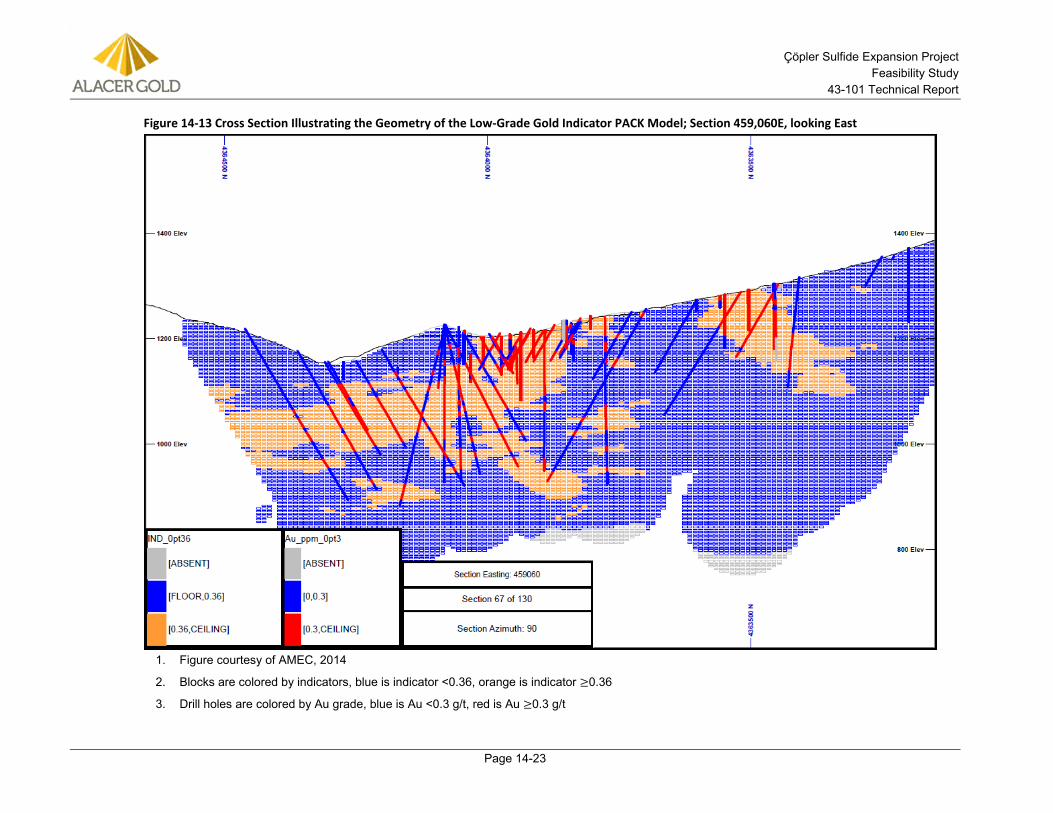
Çöpler Sulfide Expansion Project Feasibility Study
43-101 Technical Report
Page 14-23
Figure 14-13 Cross Section Illustrating the Geometry of the Low-Grade Gold Indicator PACK Model; Section 459,060E, looking East
Figure courtesy of AMEC, 2014 1.
Blocks are colored by indicators, blue is indicator <0.36, orange is indicator ≥0.36 2.
Drill holes are colored by Au grade, blue is Au <0.3 g/t, red is Au ≥0.3 g/t 3.
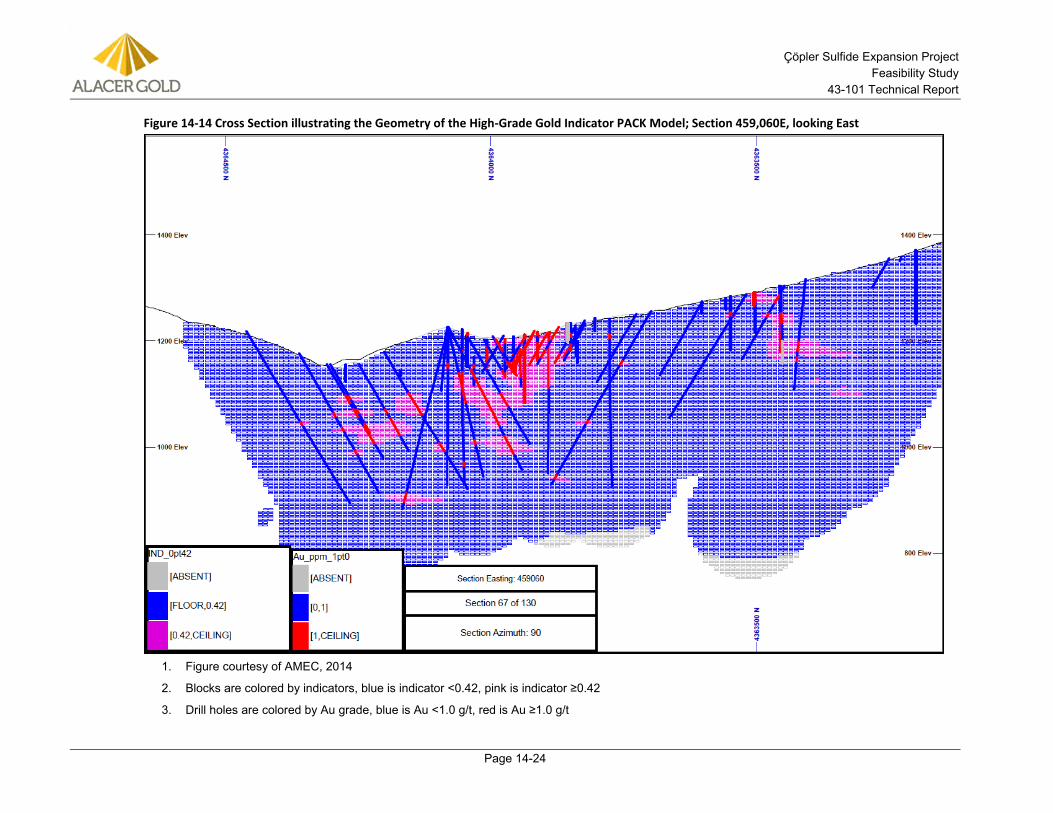
Çöpler Sulfide Expansion Project Feasibility Study
43-101 Technical Report
Page 14-24
Figure 14-14 Cross Section illustrating the Geometry of the High-Grade Gold Indicator PACK Model; Section 459,060E, looking East
Figure courtesy of AMEC, 2014 1.
Blocks are colored by indicators, blue is indicator <0.42, pink is indicator ≥0.42 2.
Drill holes are colored by Au grade, blue is Au <1.0 g/t, red is Au ≥1.0 g/t 3.
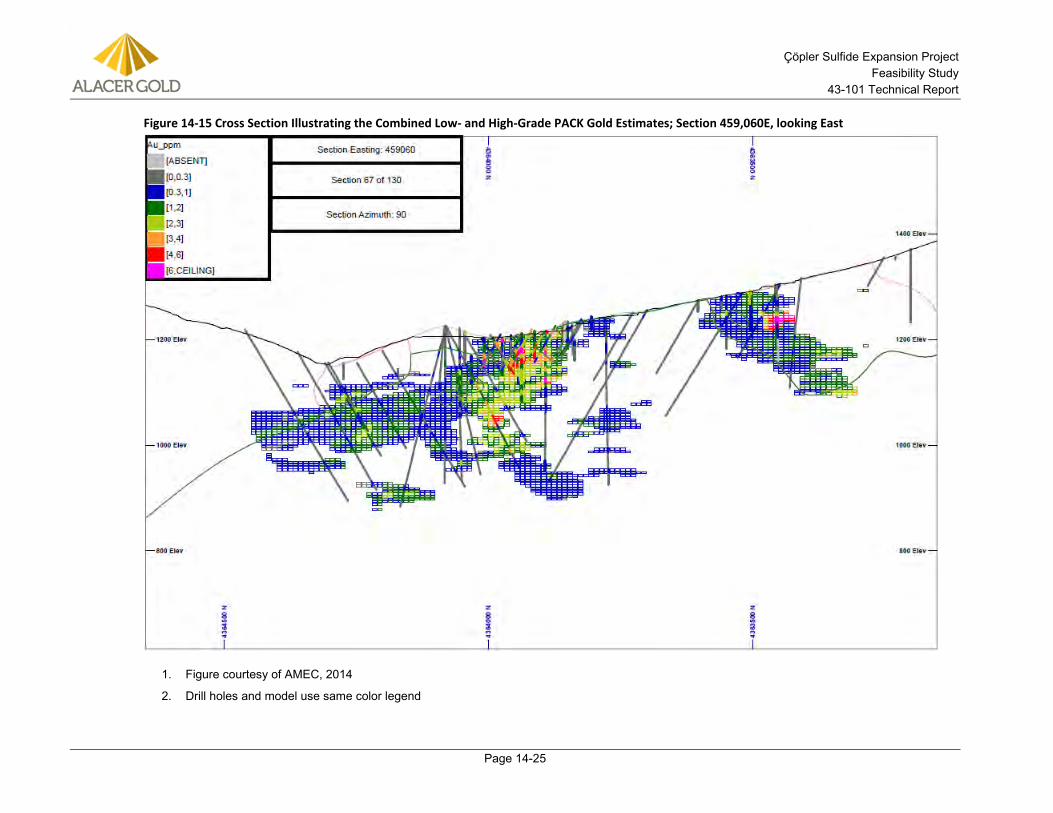
Çöpler Sulfide Expansion Project Feasibility Study
43-101 Technical Report
Page 14-25
Figure 14-15 Cross Section Illustrating the Combined Low- and High-Grade PACK Gold Estimates; Section 459,060E, looking East
Figure courtesy of AMEC, 2014 1.
Drill holes and model use same color legend 2.
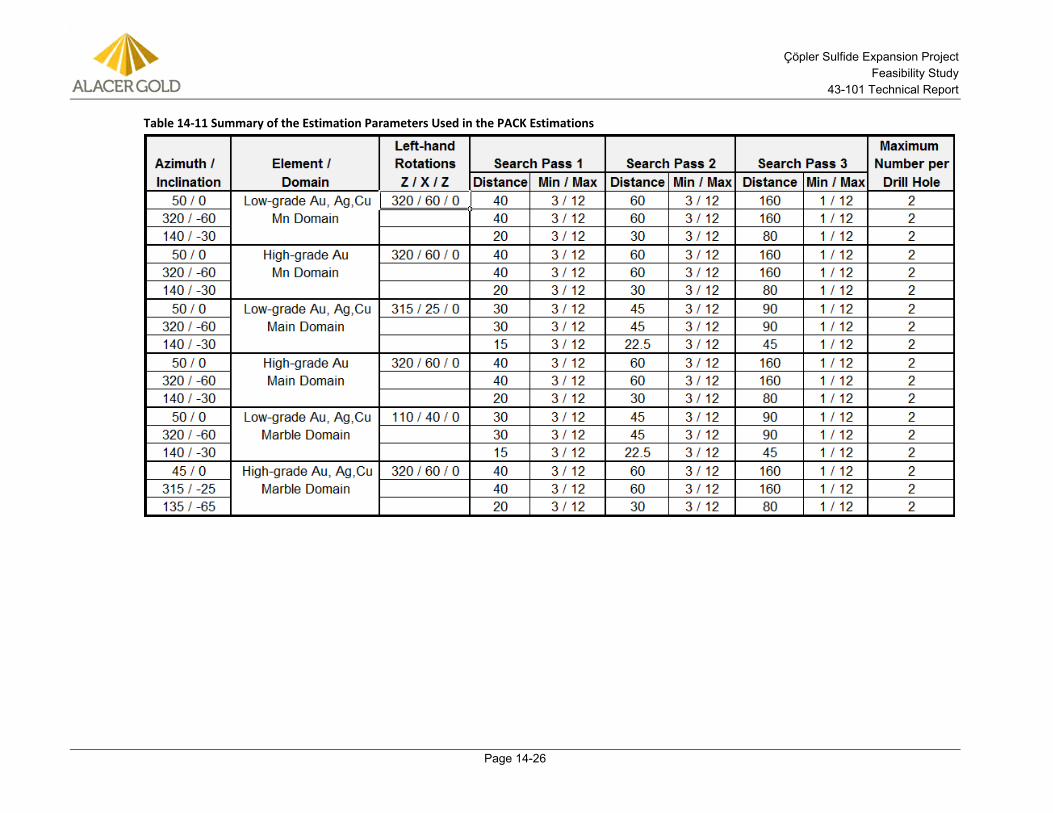
Çöpler Sulfide Expansion Project Feasibility Study
43-101 Technical Report
Page 14-26
Table 14-11 Summary of the Estimation Parameters Used in the PACK Estimations
Çöpler Sulfide Expansion Project Feasibility Study
43-101 Technical Report
Page 14-27
14.16 Resource Classification Resources were classified using an industry practice and AMEC internal guidelines that Indicated Mineral Resources should be quantified within ± 15%with 90% confidence on an annual basis, and Measured Mineral Resources should be known within ± 15% with 90% confidence on a quarterly basis. At this level, the drilling is usually sufficiently close-spaced enough to permit confirmation (Measured) or assumption of continuity (Indicated) between points of observation. For the Çöpler model, a drill hole spacing study was performed to determine the nominal drill hole spacing required to classify material as Indicated.
Confidence limits were calculated on a single block that represents one month’s production (6.2 Mt/yr). The confidence limits, a review of continuity on sections and plans, and an assessment of data quality were used to determine that a minimum drill hole spacing of 50 m by 50 m was required to meet the requirements for Indicated and an 80 m by 80 m spacing was required for Inferred. Blocks with a drill hole spacing that was greater than 80 m were not classified. The classification was then smoothed to remove the isolated blocks with a different classification than the surrounding blocks.
No blocks in the model were classified as Measured Mineral Resources due to the following:
• The quantity and grade were not established well enough to be classified as a Measured Mineral Resource. Reconciliation for sulfide material to date has shown mined to model variances are greater than 15% (positive) over annual periods. To date, the observed variances are not fully understood
• Documentation of the original collar locations and down-hole surveys are not available
• Verification of the blast hole database used to calibrate the model has not been completed and the site laboratory has not been audited
• Additional sampling and assay analysis are needed to obtain stockpile grades for sulfur, copper, silver, and manganese.
Work is in progress to address these deficiencies. The resulting classification shows the majority of the deposit can be classified as Indicated (green) with Inferred blocks (blue) forming a halo around the Indicated mineralization, Figure 14-16.
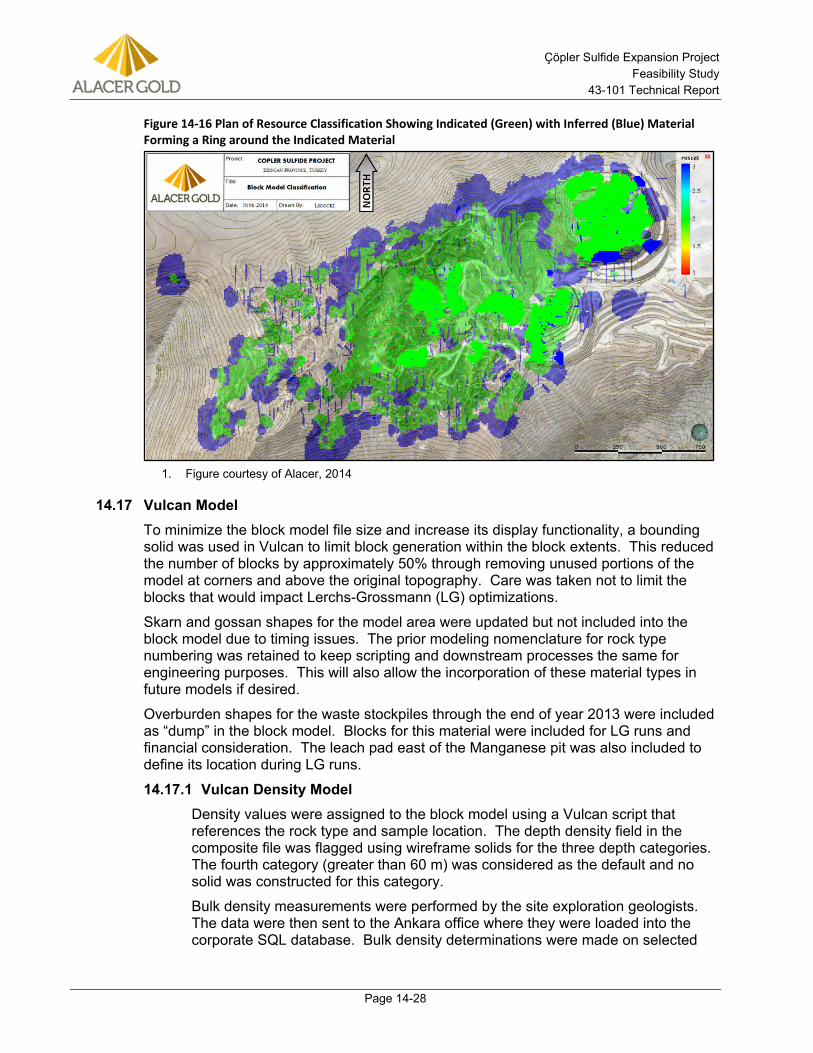
Çöpler Sulfide Expansion Project Feasibility Study
43-101 Technical Report
Page 14-28
Figure 14-16 Plan of Resource Classification Showing Indicated (Green) with Inferred (Blue) Material Forming a Ring around the Indicated Material
Figure courtesy of Alacer, 2014 1.
14.17 Vulcan Model To minimize the block model file size and increase its display functionality, a bounding solid was used in Vulcan to limit block generation within the block extents. This reduced the number of blocks by approximately 50% through removing unused portions of the model at corners and above the original topography. Care was taken not to limit the blocks that would impact Lerchs-Grossmann (LG) optimizations.
Skarn and gossan shapes for the model area were updated but not included into the block model due to timing issues. The prior modeling nomenclature for rock type numbering was retained to keep scripting and downstream processes the same for engineering purposes. This will also allow the incorporation of these material types in future models if desired.
Overburden shapes for the waste stockpiles through the end of year 2013 were included as “dump” in the block model. Blocks for this material were included for LG runs and financial consideration. The leach pad east of the Manganese pit was also included to define its location during LG runs.
Vulcan Density Model 14.17.1Density values were assigned to the block model using a Vulcan script that references the rock type and sample location. The depth density field in the composite file was flagged using wireframe solids for the three depth categories. The fourth category (greater than 60 m) was considered as the default and no solid was constructed for this category.
Bulk density measurements were performed by the site exploration geologists. The data were then sent to the Ankara office where they were loaded into the corporate SQL database. Bulk density determinations were made on selected
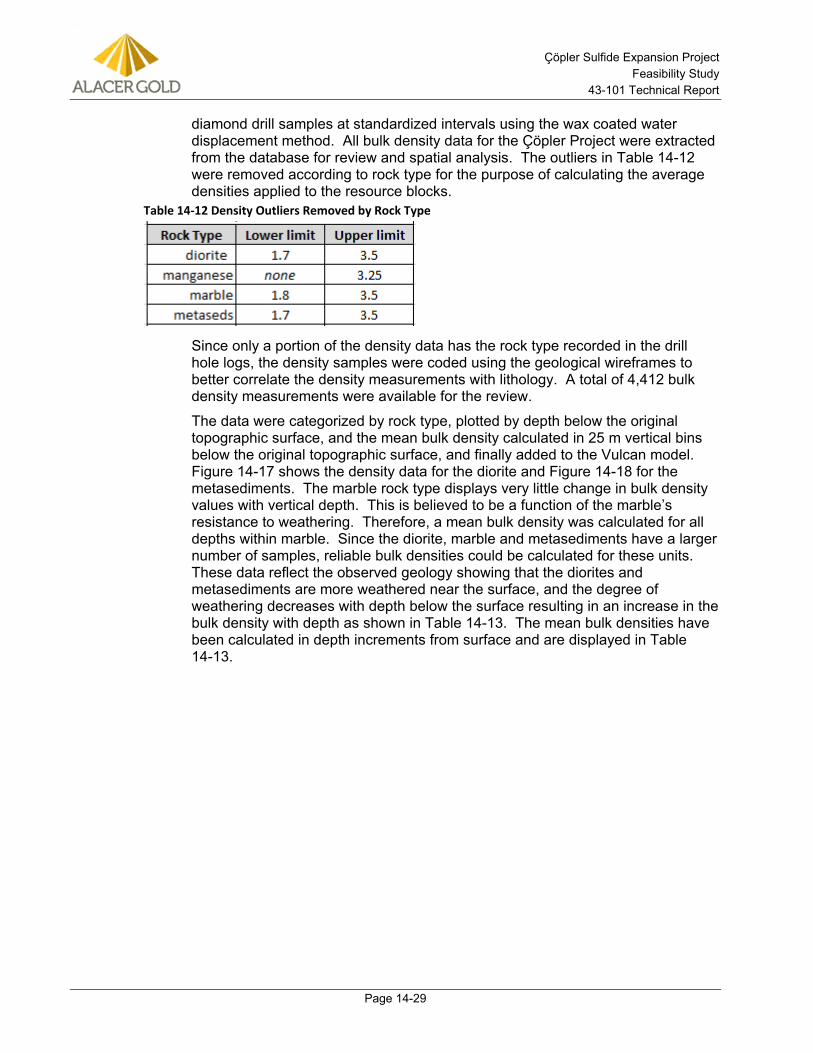
Çöpler Sulfide Expansion Project Feasibility Study
43-101 Technical Report
Page 14-29
diamond drill samples at standardized intervals using the wax coated water displacement method. All bulk density data for the Çöpler Project were extracted from the database for review and spatial analysis. The outliers in Table 14-12 were removed according to rock type for the purpose of calculating the average densities applied to the resource blocks.
Table 14-12 Density Outliers Removed by Rock Type
Since only a portion of the density data has the rock type recorded in the drill hole logs, the density samples were coded using the geological wireframes to better correlate the density measurements with lithology. A total of 4,412 bulk density measurements were available for the review.
The data were categorized by rock type, plotted by depth below the original topographic surface, and the mean bulk density calculated in 25 m vertical bins below the original topographic surface, and finally added to the Vulcan model. Figure 14-17 shows the density data for the diorite and Figure 14-18 for the metasediments. The marble rock type displays very little change in bulk density values with vertical depth. This is believed to be a function of the marble’s resistance to weathering. Therefore, a mean bulk density was calculated for all depths within marble. Since the diorite, marble and metasediments have a larger number of samples, reliable bulk densities could be calculated for these units. These data reflect the observed geology showing that the diorites and metasediments are more weathered near the surface, and the degree of weathering decreases with depth below the surface resulting in an increase in the bulk density with depth as shown in Table 14-13. The mean bulk densities have been calculated in depth increments from surface and are displayed in Table 14-13.
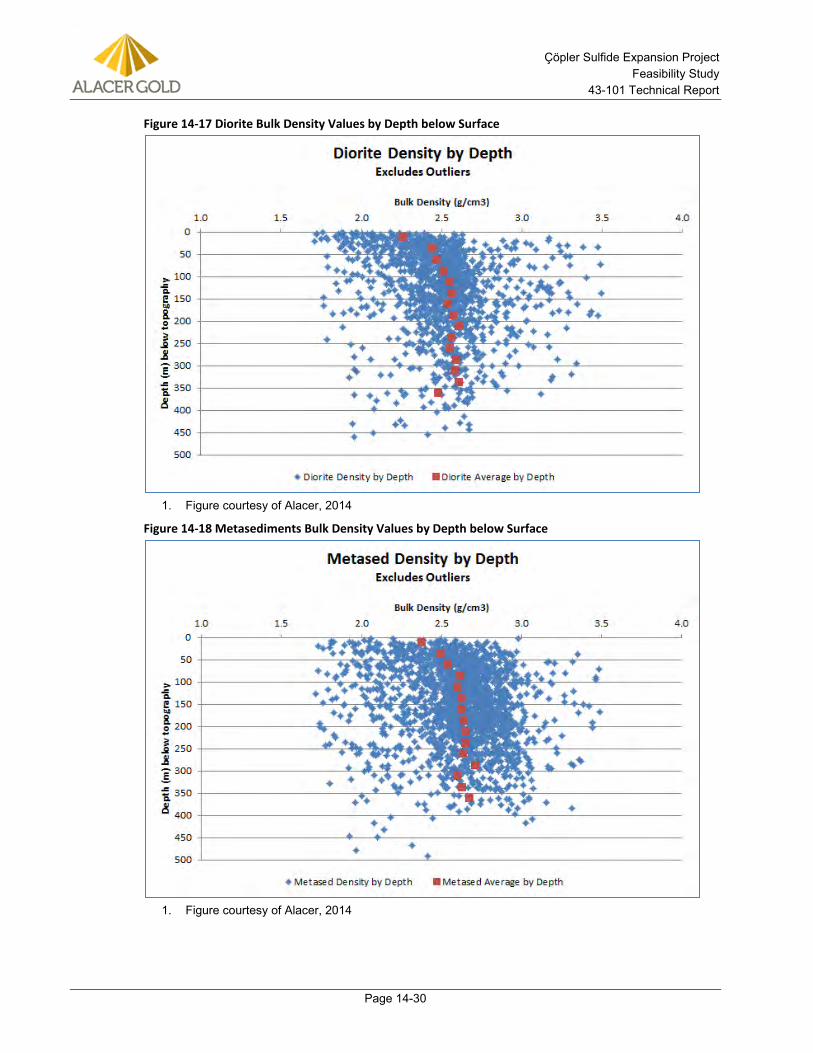
Çöpler Sulfide Expansion Project Feasibility Study
43-101 Technical Report
Page 14-30
Figure 14-17 Diorite Bulk Density Values by Depth below Surface
Figure courtesy of Alacer, 2014 1.
Figure 14-18 Metasediments Bulk Density Values by Depth below Surface
Figure courtesy of Alacer, 2014 1.
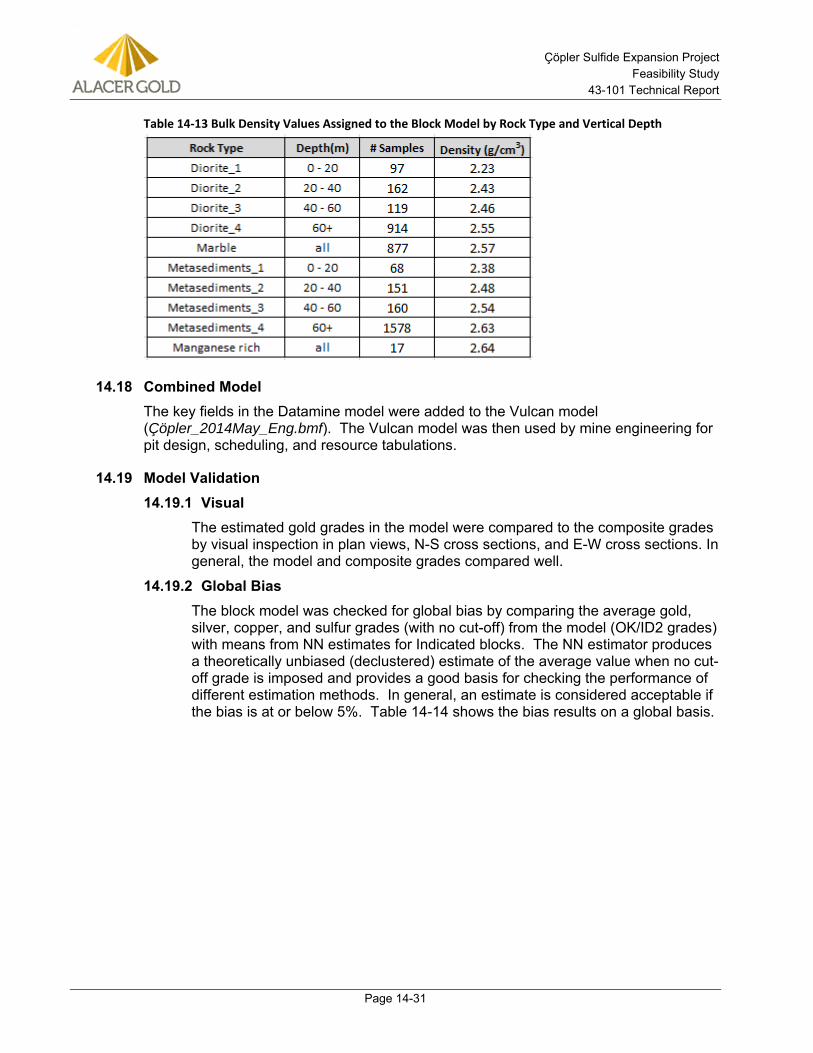
Çöpler Sulfide Expansion Project Feasibility Study
43-101 Technical Report
Page 14-31
Table 14-13 Bulk Density Values Assigned to the Block Model by Rock Type and Vertical Depth
14.18 Combined Model The key fields in the Datamine model were added to the Vulcan model (Çöpler_2014May_Eng.bmf). The Vulcan model was then used by mine engineering for pit design, scheduling, and resource tabulations.
14.19 Model Validation Visual 14.19.1The estimated gold grades in the model were compared to the composite grades by visual inspection in plan views, N-S cross sections, and E-W cross sections. In general, the model and composite grades compared well.
Global Bias 14.19.2The block model was checked for global bias by comparing the average gold, silver, copper, and sulfur grades (with no cut-off) from the model (OK/ID2 grades) with means from NN estimates for Indicated blocks. The NN estimator produces a theoretically unbiased (declustered) estimate of the average value when no cut-off grade is imposed and provides a good basis for checking the performance of different estimation methods. In general, an estimate is considered acceptable if the bias is at or below 5%. Table 14-14 shows the bias results on a global basis.
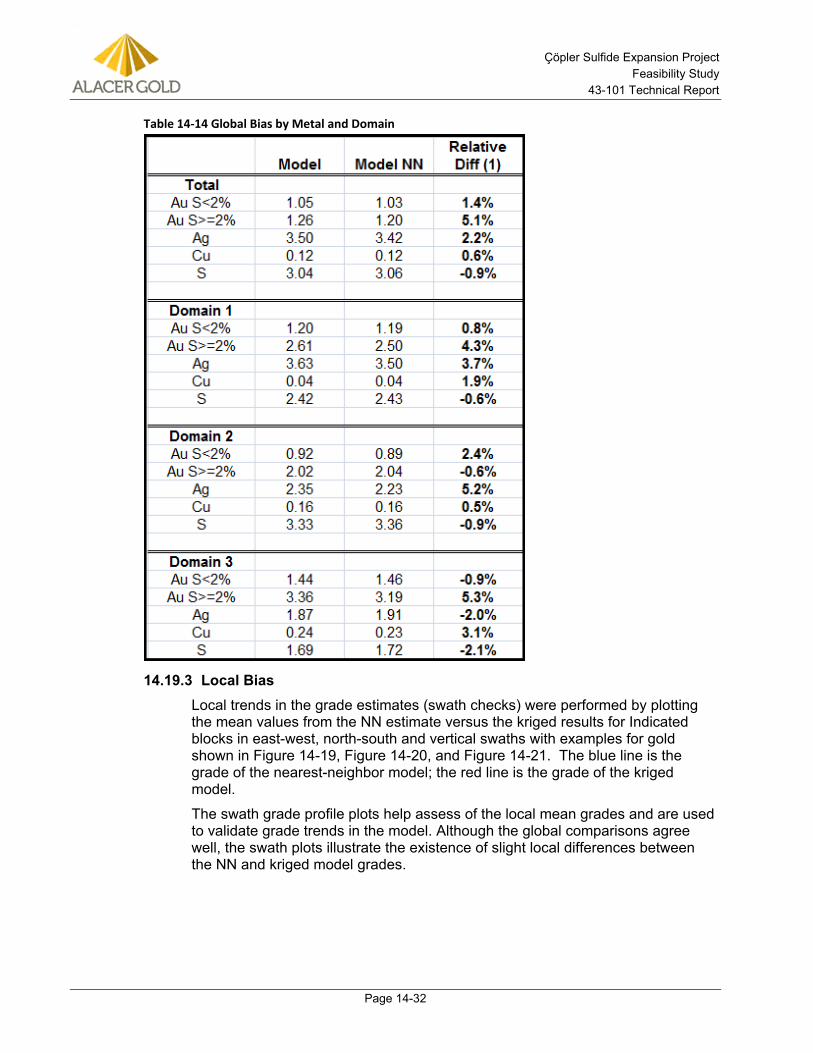
Çöpler Sulfide Expansion Project Feasibility Study
43-101 Technical Report
Page 14-32
Table 14-14 Global Bias by Metal and Domain
Local Bias 14.19.3Local trends in the grade estimates (swath checks) were performed by plotting the mean values from the NN estimate versus the kriged results for Indicated blocks in east-west, north-south and vertical swaths with examples for gold shown in Figure 14-19, Figure 14-20, and Figure 14-21. The blue line is the grade of the nearest-neighbor model; the red line is the grade of the kriged model.
The swath grade profile plots help assess of the local mean grades and are used to validate grade trends in the model. Although the global comparisons agree well, the swath plots illustrate the existence of slight local differences between the NN and kriged model grades.
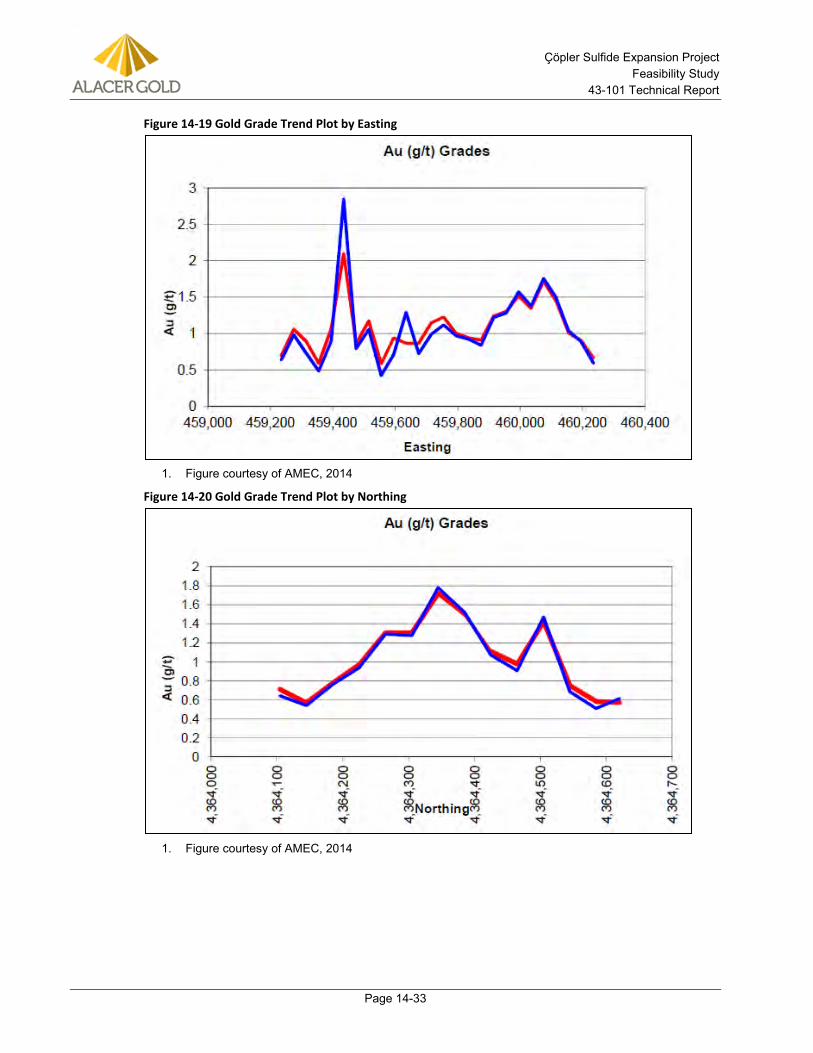
Çöpler Sulfide Expansion Project Feasibility Study
43-101 Technical Report
Page 14-33
Figure 14-19 Gold Grade Trend Plot by Easting
Figure courtesy of AMEC, 2014 1.
Figure 14-20 Gold Grade Trend Plot by Northing
Figure courtesy of AMEC, 2014 1.
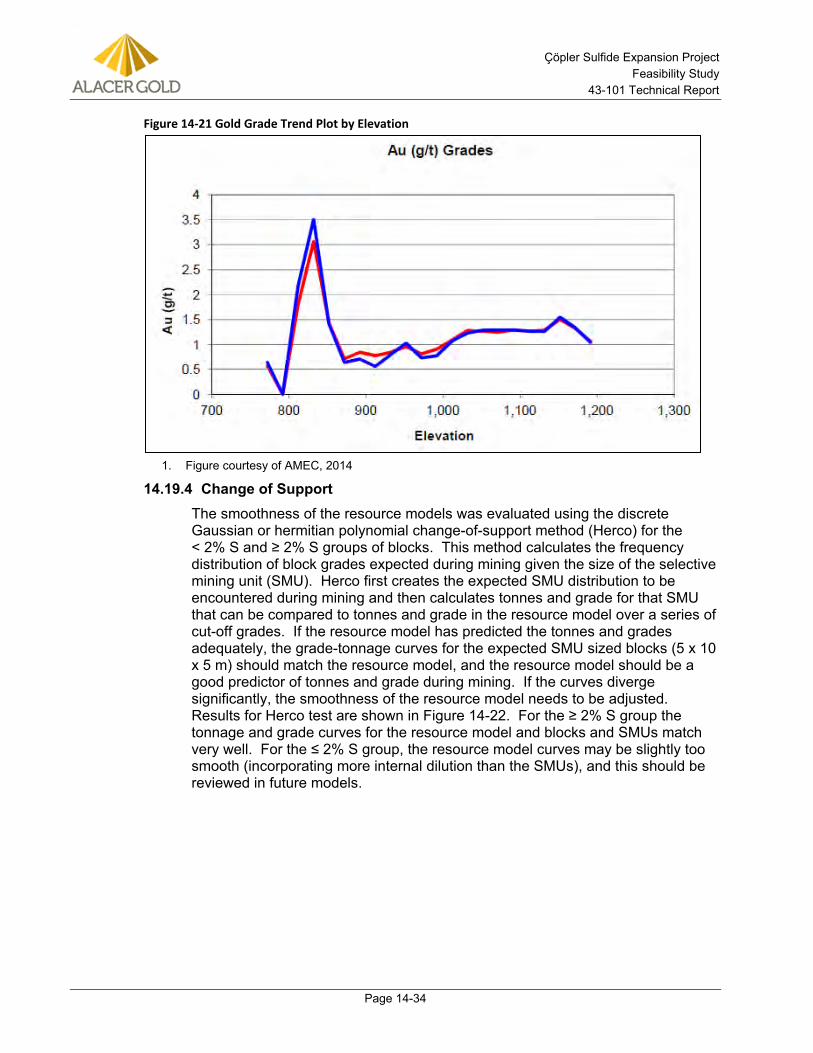
Çöpler Sulfide Expansion Project Feasibility Study
43-101 Technical Report
Page 14-34
Figure 14-21 Gold Grade Trend Plot by Elevation
Figure courtesy of AMEC, 2014 1.
Change of Support 14.19.4The smoothness of the resource models was evaluated using the discrete Gaussian or hermitian polynomial change-of-support method (Herco) for the < 2% S and ≥ 2% S groups of blocks. This method calculates the frequency distribution of block grades expected during mining given the size of the selective mining unit (SMU). Herco first creates the expected SMU distribution to be encountered during mining and then calculates tonnes and grade for that SMU that can be compared to tonnes and grade in the resource model over a series of cut-off grades. If the resource model has predicted the tonnes and grades adequately, the grade-tonnage curves for the expected SMU sized blocks (5 x 10 x 5 m) should match the resource model, and the resource model should be a good predictor of tonnes and grade during mining. If the curves diverge significantly, the smoothness of the resource model needs to be adjusted. Results for Herco test are shown in Figure 14-22. For the ≥ 2% S group the tonnage and grade curves for the resource model and blocks and SMUs match very well. For the ≤ 2% S group, the resource model curves may be slightly too smooth (incorporating more internal dilution than the SMUs), and this should be reviewed in future models.
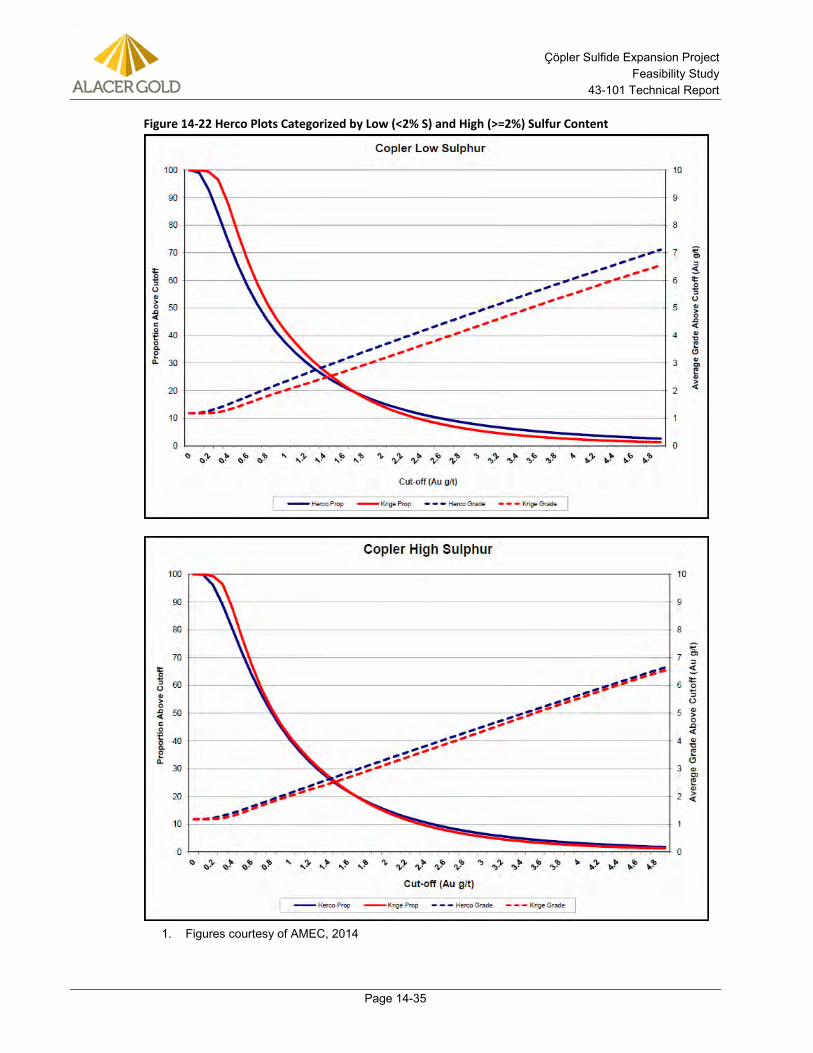
Çöpler Sulfide Expansion Project Feasibility Study
43-101 Technical Report
Page 14-35
Figure 14-22 Herco Plots Categorized by Low (<2% S) and High (>=2%) Sulfur Content
Figures courtesy of AMEC, 2014 1.
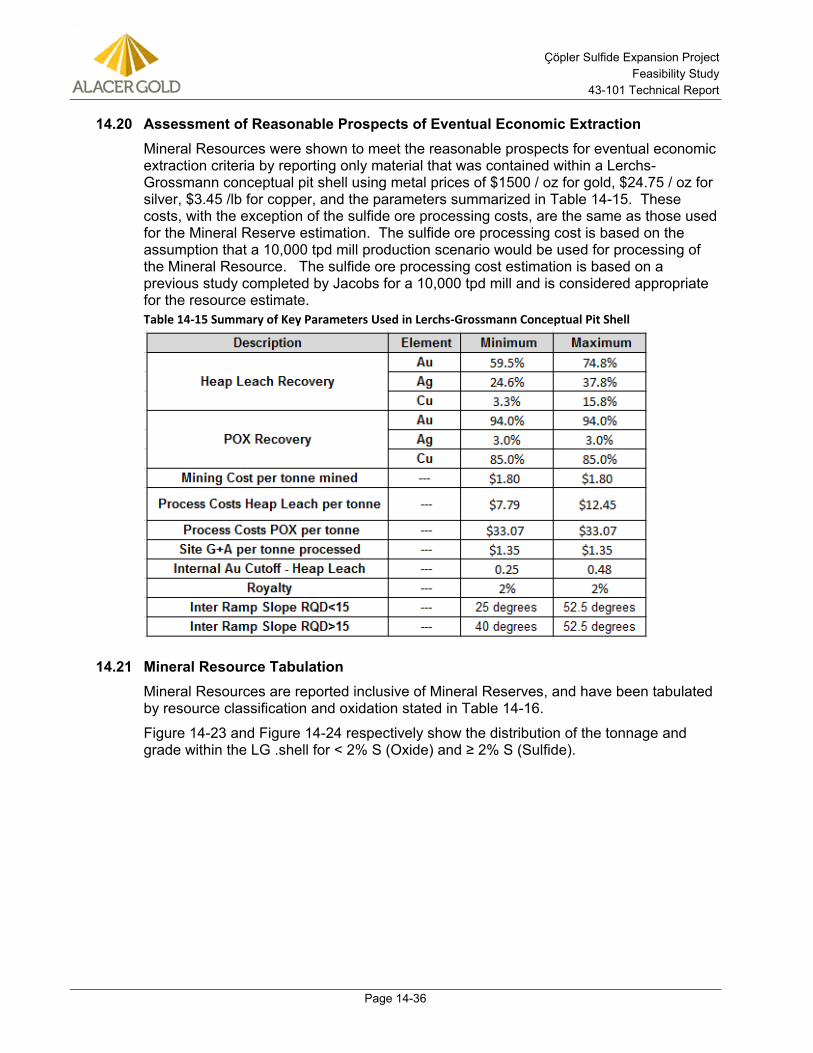
Çöpler Sulfide Expansion Project Feasibility Study
43-101 Technical Report
Page 14-36
14.20 Assessment of Reasonable Prospects of Eventual Economic Extraction Mineral Resources were shown to meet the reasonable prospects for eventual economic extraction criteria by reporting only material that was contained within a Lerchs-Grossmann conceptual pit shell using metal prices of $1500 / oz for gold, $24.75 / oz for silver, $3.45 /lb for copper, and the parameters summarized in Table 14-15. These costs, with the exception of the sulfide ore processing costs, are the same as those used for the Mineral Reserve estimation. The sulfide ore processing cost is based on the assumption that a 10,000 tpd mill production scenario would be used for processing of the Mineral Resource. The sulfide ore processing cost estimation is based on a previous study completed by Jacobs for a 10,000 tpd mill and is considered appropriate for the resource estimate. Table 14-15 Summary of Key Parameters Used in Lerchs-Grossmann Conceptual Pit Shell
14.21 Mineral Resource Tabulation Mineral Resources are reported inclusive of Mineral Reserves, and have been tabulated by resource classification and oxidation stated in Table 14-16.
Figure 14-23 and Figure 14-24 respectively show the distribution of the tonnage and grade within the LG .shell for < 2% S (Oxide) and ≥ 2% S (Sulfide).
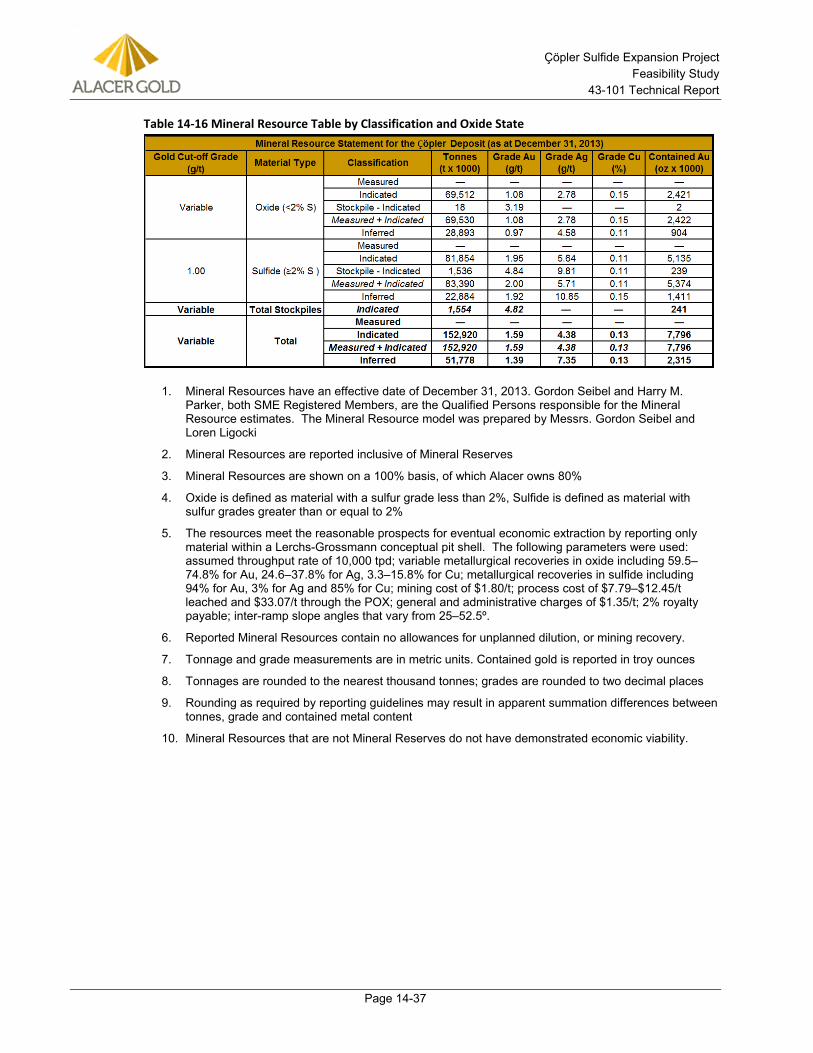
Çöpler Sulfide Expansion Project Feasibility Study
43-101 Technical Report
Page 14-37
Table 14-16 Mineral Resource Table by Classification and Oxide State
Mineral Resources have an effective date of December 31, 2013. Gordon Seibel and Harry M. 1.Parker, both SME Registered Members, are the Qualified Persons responsible for the Mineral Resource estimates. The Mineral Resource model was prepared by Messrs. Gordon Seibel and Loren Ligocki
Mineral Resources are reported inclusive of Mineral Reserves 2.
Mineral Resources are shown on a 100% basis, of which Alacer owns 80% 3.
Oxide is defined as material with a sulfur grade less than 2%, Sulfide is defined as material with 4.sulfur grades greater than or equal to 2%
The resources meet the reasonable prospects for eventual economic extraction by reporting only 5.material within a Lerchs-Grossmann conceptual pit shell. The following parameters were used: assumed throughput rate of 10,000 tpd; variable metallurgical recoveries in oxide including 59.5–74.8% for Au, 24.6–37.8% for Ag, 3.3–15.8% for Cu; metallurgical recoveries in sulfide including 94% for Au, 3% for Ag and 85% for Cu; mining cost of $1.80/t; process cost of $7.79–$12.45/t leached and $33.07/t through the POX; general and administrative charges of $1.35/t; 2% royalty payable; inter-ramp slope angles that vary from 25–52.5º.
Reported Mineral Resources contain no allowances for unplanned dilution, or mining recovery. 6.
Tonnage and grade measurements are in metric units. Contained gold is reported in troy ounces 7.
Tonnages are rounded to the nearest thousand tonnes; grades are rounded to two decimal places 8.
Rounding as required by reporting guidelines may result in apparent summation differences between 9.tonnes, grade and contained metal content
Mineral Resources that are not Mineral Reserves do not have demonstrated economic viability. 10.
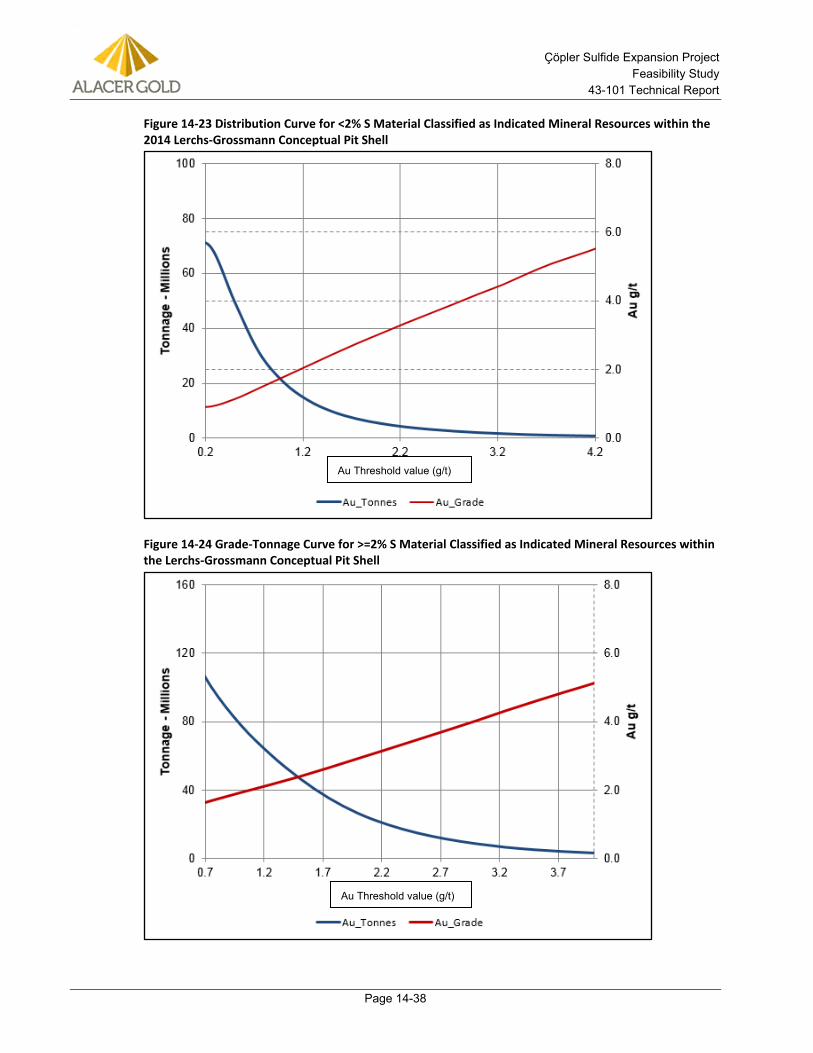
Çöpler Sulfide Expansion Project Feasibility Study
43-101 Technical Report
Page 14-38
Figure 14-23 Distribution Curve for <2% S Material Classified as Indicated Mineral Resources within the 2014 Lerchs-Grossmann Conceptual Pit Shell
Figure 14-24 Grade-Tonnage Curve for >=2% S Material Classified as Indicated Mineral Resources within the Lerchs-Grossmann Conceptual Pit Shell
Au Threshold value (g/t)
Au Threshold value (g/t)
Çöpler Sulfide Expansion Project Feasibility Study
43-101 Technical Report
Page 14-39
The lower cut-off in the grade/tonnage curves represents the lower limit for the mineralization to meet reasonable prospects of eventual economic extraction.
14.22 Risks and Opportunities Risks and opportunities that may affect the Mineral Resource statement are as follows:
• Çöpler is a geologically complex deposit with multiple metals that must be tracked along with oxidation type and lithologies. Studies are in progress to better understand these factors which may result in changes to the current resource estimation method.
• Reported tonnages and grades depend on the cut-off grade that will vary with changing metal prices, costs, metallurgical recoveries, and the sulfur threshold used to delineate oxide and sulfide.
• Since the gold mineralization locally follows the lithological contacts, applying an overall trend to the mineralization may not reflect the local variability of the lithological contacts. Implementing a search ellipse that follows these contacts (dynamic anisotropy) may provide better local estimates.
• The sulfur model is very sensitive to slight changes to the estimation method. Additional studies should be performed including quantifying what percent of the sulfur is derived from sulfate minerals.
• The model was reconciled against past production using the blast hole database, which was not audited.
• Visual comparison between the drill holes and the blast holes have shown that mineralized zones too small to be delineated by the drill holes have been identified by the blast holes.
• All risks associated with the data quality issues reported in Section 12.0 will be risks in the resource model.
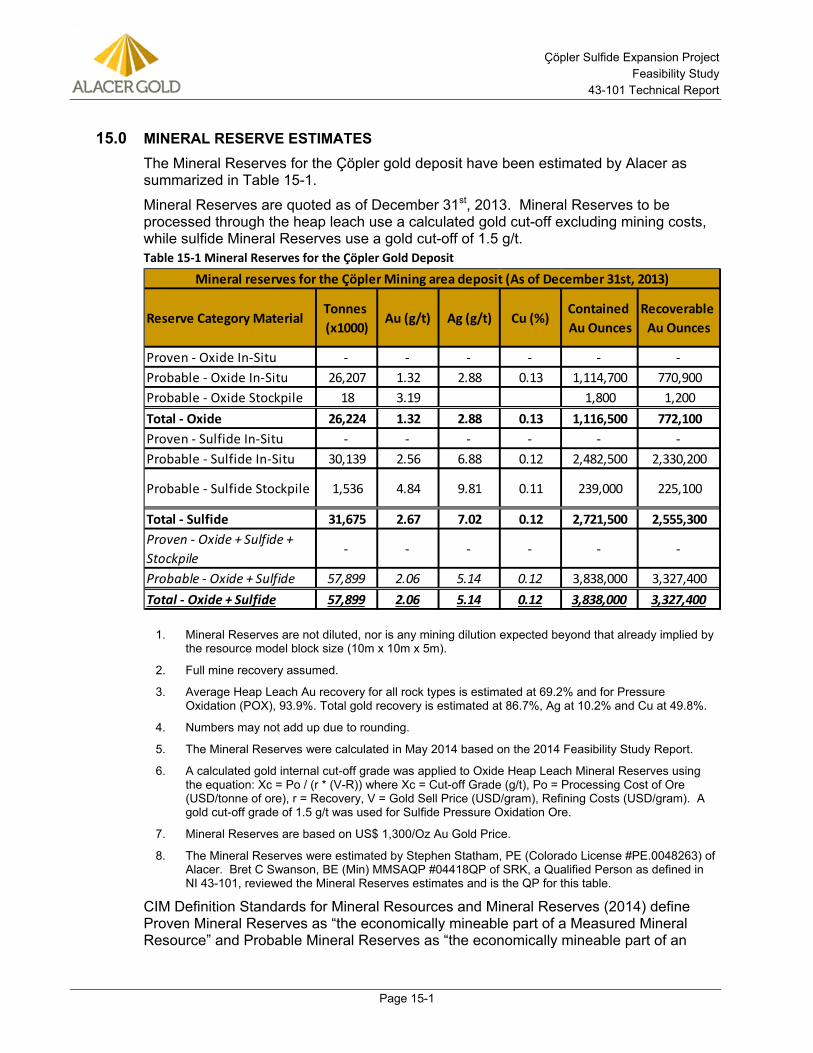
Çöpler Sulfide Expansion Project Feasibility Study
43-101 Technical Report
Page 15-1
15.0 MINERAL RESERVE ESTIMATES The Mineral Reserves for the Çöpler gold deposit have been estimated by Alacer as summarized in Table 15-1.
Mineral Reserves are quoted as of December 31st, 2013. Mineral Reserves to be processed through the heap leach use a calculated gold cut-off excluding mining costs, while sulfide Mineral Reserves use a gold cut-off of 1.5 g/t. Table 15-1 Mineral Reserves for the Çöpler Gold Deposit
Mineral Reserves are not diluted, nor is any mining dilution expected beyond that already implied by 1.the resource model block size (10m x 10m x 5m).
Full mine recovery assumed. 2.
Average Heap Leach Au recovery for all rock types is estimated at 69.2% and for Pressure 3.Oxidation (POX), 93.9%. Total gold recovery is estimated at 86.7%, Ag at 10.2% and Cu at 49.8%.
Numbers may not add up due to rounding. 4.
The Mineral Reserves were calculated in May 2014 based on the 2014 Feasibility Study Report. 5.
A calculated gold internal cut-off grade was applied to Oxide Heap Leach Mineral Reserves using 6.the equation: Xc = Po / (r * (V-R)) where Xc = Cut-off Grade (g/t), Po = Processing Cost of Ore (USD/tonne of ore), r = Recovery, V = Gold Sell Price (USD/gram), Refining Costs (USD/gram). A gold cut-off grade of 1.5 g/t was used for Sulfide Pressure Oxidation Ore.
Mineral Reserves are based on US$ 1,300/Oz Au Gold Price. 7.
The Mineral Reserves were estimated by Stephen Statham, PE (Colorado License #PE.0048263) of 8.Alacer. Bret C Swanson, BE (Min) MMSAQP #04418QP of SRK, a Qualified Person as defined in NI 43-101, reviewed the Mineral Reserves estimates and is the QP for this table.
CIM Definition Standards for Mineral Resources and Mineral Reserves (2014) define Proven Mineral Reserves as “the economically mineable part of a Measured Mineral Resource” and Probable Mineral Reserves as “the economically mineable part of an
Reserve Category MaterialTonnes (x1000)
Au (g/t) Ag (g/t) Cu (%)Contained Au Ounces
Recoverable Au Ounces
Proven - Oxide In-Situ - - - - - - Probable - Oxide In-Situ 26,207 1.32 2.88 0.13 1,114,700 770,900Probable - Oxide Stockpile 18 3.19 1,800 1,200Total - Oxide 26,224 1.32 2.88 0.13 1,116,500 772,100Proven - Sulfide In-Situ - - - - - - Probable - Sulfide In-Situ 30,139 2.56 6.88 0.12 2,482,500 2,330,200
Probable - Sulfide Stockpile 1,536 4.84 9.81 0.11 239,000 225,100
Total - Sulfide 31,675 2.67 7.02 0.12 2,721,500 2,555,300Proven - Oxide + Sulfide + Stockpile
- - - - - -
Probable - Oxide + Sulfide 57,899 2.06 5.14 0.12 3,838,000 3,327,400Total - Oxide + Sulfide 57,899 2.06 5.14 0.12 3,838,000 3,327,400
Mineral reserves for the Ҫӧpler Mining area deposit (As of December 31st, 2013)
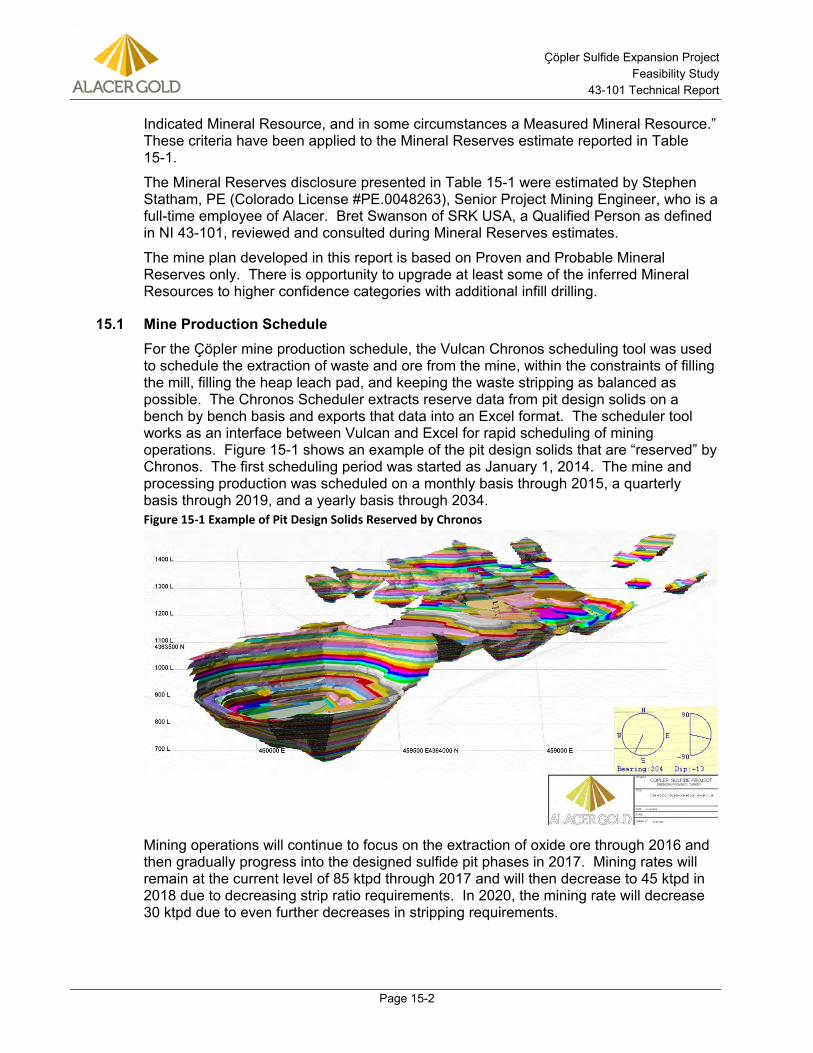
Çöpler Sulfide Expansion Project Feasibility Study
43-101 Technical Report
Page 15-2
Indicated Mineral Resource, and in some circumstances a Measured Mineral Resource.” These criteria have been applied to the Mineral Reserves estimate reported in Table 15-1.
The Mineral Reserves disclosure presented in Table 15-1 were estimated by Stephen Statham, PE (Colorado License #PE.0048263), Senior Project Mining Engineer, who is a full-time employee of Alacer. Bret Swanson of SRK USA, a Qualified Person as defined in NI 43-101, reviewed and consulted during Mineral Reserves estimates.
The mine plan developed in this report is based on Proven and Probable Mineral Reserves only. There is opportunity to upgrade at least some of the inferred Mineral Resources to higher confidence categories with additional infill drilling.
15.1 Mine Production Schedule For the Çöpler mine production schedule, the Vulcan Chronos scheduling tool was used to schedule the extraction of waste and ore from the mine, within the constraints of filling the mill, filling the heap leach pad, and keeping the waste stripping as balanced as possible. The Chronos Scheduler extracts reserve data from pit design solids on a bench by bench basis and exports that data into an Excel format. The scheduler tool works as an interface between Vulcan and Excel for rapid scheduling of mining operations. Figure 15-1 shows an example of the pit design solids that are “reserved” by Chronos. The first scheduling period was started as January 1, 2014. The mine and processing production was scheduled on a monthly basis through 2015, a quarterly basis through 2019, and a yearly basis through 2034. Figure 15-1 Example of Pit Design Solids Reserved by Chronos
Mining operations will continue to focus on the extraction of oxide ore through 2016 and then gradually progress into the designed sulfide pit phases in 2017. Mining rates will remain at the current level of 85 ktpd through 2017 and will then decrease to 45 ktpd in 2018 due to decreasing strip ratio requirements. In 2020, the mining rate will decrease 30 ktpd due to even further decreases in stripping requirements.
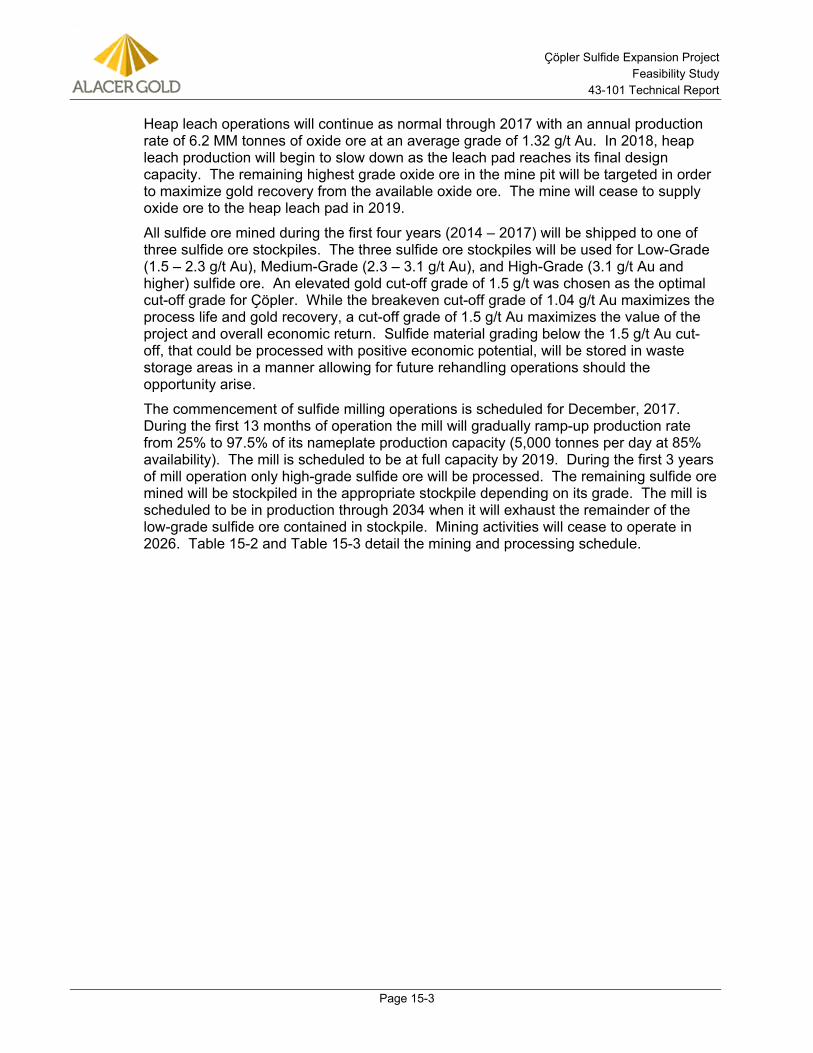
Çöpler Sulfide Expansion Project Feasibility Study
43-101 Technical Report
Page 15-3
Heap leach operations will continue as normal through 2017 with an annual production rate of 6.2 MM tonnes of oxide ore at an average grade of 1.32 g/t Au. In 2018, heap leach production will begin to slow down as the leach pad reaches its final design capacity. The remaining highest grade oxide ore in the mine pit will be targeted in order to maximize gold recovery from the available oxide ore. The mine will cease to supply oxide ore to the heap leach pad in 2019.
All sulfide ore mined during the first four years (2014 – 2017) will be shipped to one of three sulfide ore stockpiles. The three sulfide ore stockpiles will be used for Low-Grade (1.5 – 2.3 g/t Au), Medium-Grade (2.3 – 3.1 g/t Au), and High-Grade (3.1 g/t Au and higher) sulfide ore. An elevated gold cut-off grade of 1.5 g/t was chosen as the optimal cut-off grade for Ҫӧpler. While the breakeven cut-off grade of 1.04 g/t Au maximizes the process life and gold recovery, a cut-off grade of 1.5 g/t Au maximizes the value of the project and overall economic return. Sulfide material grading below the 1.5 g/t Au cut-off, that could be processed with positive economic potential, will be stored in waste storage areas in a manner allowing for future rehandling operations should the opportunity arise.
The commencement of sulfide milling operations is scheduled for December, 2017. During the first 13 months of operation the mill will gradually ramp-up production rate from 25% to 97.5% of its nameplate production capacity (5,000 tonnes per day at 85% availability). The mill is scheduled to be at full capacity by 2019. During the first 3 years of mill operation only high-grade sulfide ore will be processed. The remaining sulfide ore mined will be stockpiled in the appropriate stockpile depending on its grade. The mill is scheduled to be in production through 2034 when it will exhaust the remainder of the low-grade sulfide ore contained in stockpile. Mining activities will cease to operate in 2026. Table 15-2 and Table 15-3 detail the mining and processing schedule.
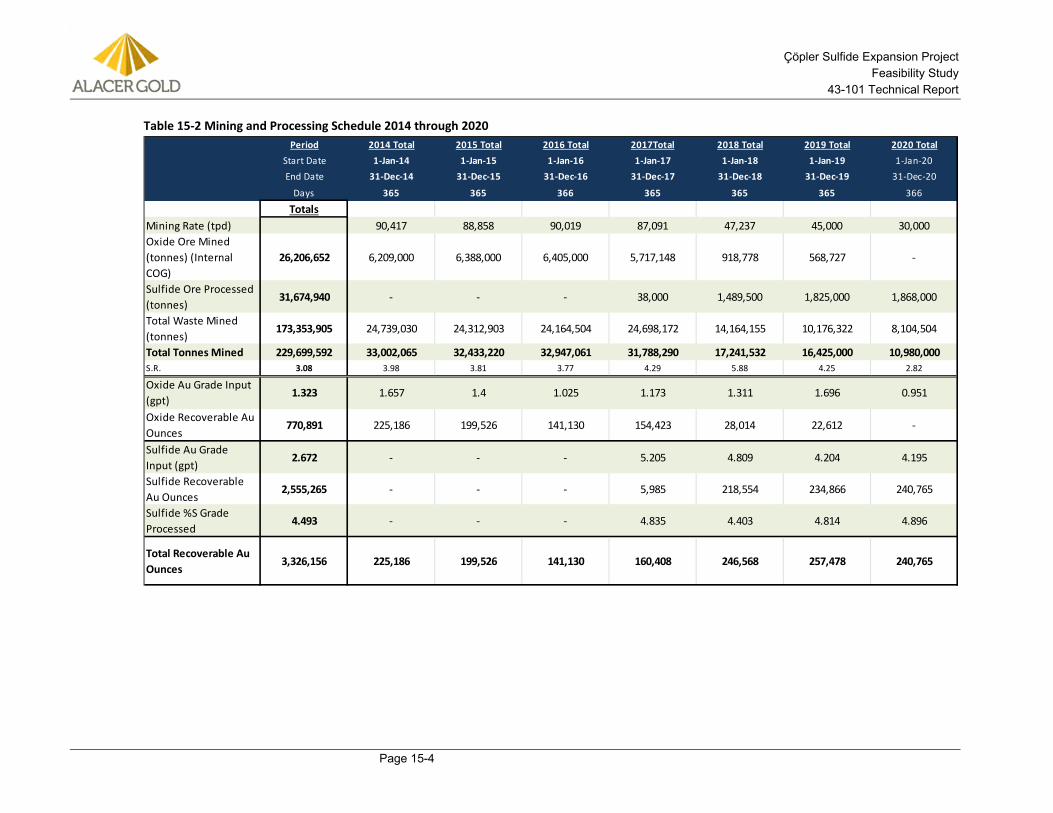
Çöpler Sulfide Expansion Project Feasibility Study
43-101 Technical Report
Page 15-4
Table 15-2 Mining and Processing Schedule 2014 through 2020
Period 2014 Total 2015 Total 2016 Total 2017Total 2018 Total 2019 Total 2020 TotalStart Date 1-Jan-14 1-Jan-15 1-Jan-16 1-Jan-17 1-Jan-18 1-Jan-19 1-Jan-20End Date 31-Dec-14 31-Dec-15 31-Dec-16 31-Dec-17 31-Dec-18 31-Dec-19 31-Dec-20
Days 365 365 366 365 365 365 366
TotalsMining Rate (tpd) 90,417 88,858 90,019 87,091 47,237 45,000 30,000Oxide Ore Mined (tonnes) (Internal COG)
26,206,652 6,209,000 6,388,000 6,405,000 5,717,148 918,778 568,727 -
Sulfide Ore Processed (tonnes)
31,674,940 - - - 38,000 1,489,500 1,825,000 1,868,000
Total Waste Mined (tonnes)
173,353,905 24,739,030 24,312,903 24,164,504 24,698,172 14,164,155 10,176,322 8,104,504
Total Tonnes Mined 229,699,592 33,002,065 32,433,220 32,947,061 31,788,290 17,241,532 16,425,000 10,980,000S.R. 3.08 3.98 3.81 3.77 4.29 5.88 4.25 2.82
Oxide Au Grade Input (gpt)
1.323 1.657 1.4 1.025 1.173 1.311 1.696 0.951
Oxide Recoverable Au Ounces
770,891 225,186 199,526 141,130 154,423 28,014 22,612 -
Sulfide Au Grade Input (gpt)
2.672 - - - 5.205 4.809 4.204 4.195
Sulfide Recoverable Au Ounces
2,555,265 - - - 5,985 218,554 234,866 240,765
Sulfide %S Grade Processed
4.493 - - - 4.835 4.403 4.814 4.896
Total Recoverable Au Ounces
3,326,156 225,186 199,526 141,130 160,408 246,568 257,478 240,765
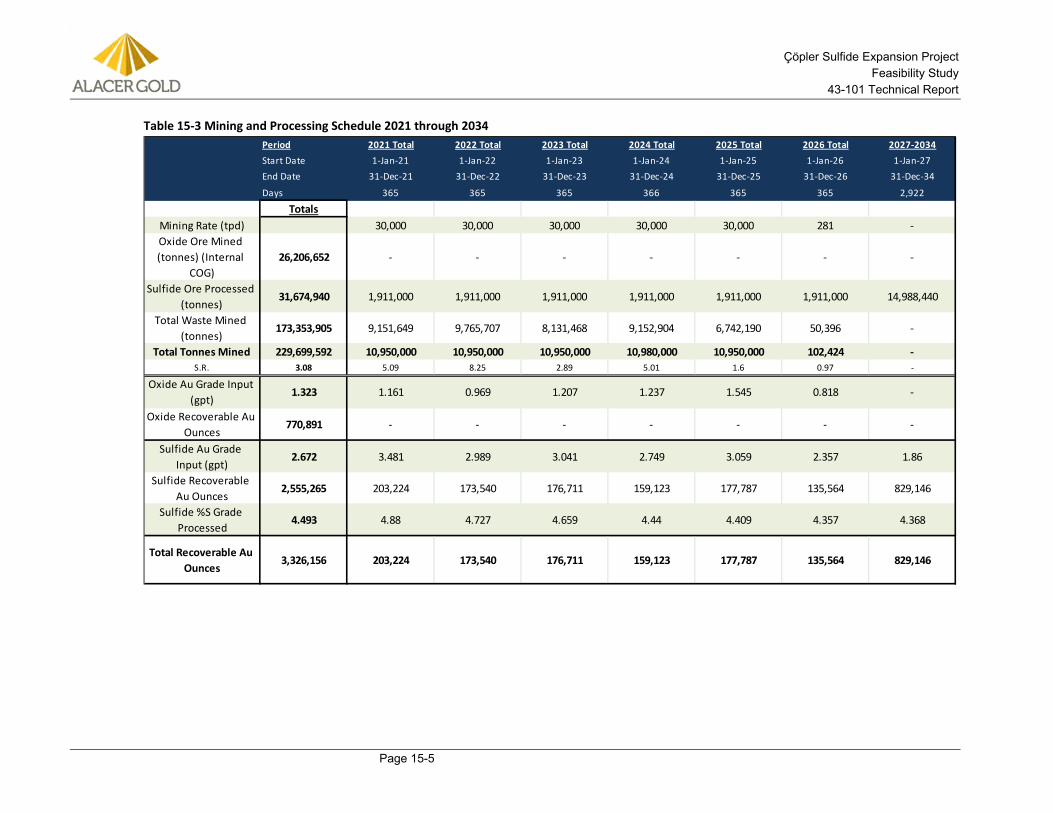
Çöpler Sulfide Expansion Project Feasibility Study
43-101 Technical Report
Page 15-5
Table 15-3 Mining and Processing Schedule 2021 through 2034
Period 2021 Total 2022 Total 2023 Total 2024 Total 2025 Total 2026 Total 2027-2034Start Date 1-Jan-21 1-Jan-22 1-Jan-23 1-Jan-24 1-Jan-25 1-Jan-26 1-Jan-27End Date 31-Dec-21 31-Dec-22 31-Dec-23 31-Dec-24 31-Dec-25 31-Dec-26 31-Dec-34
Days 365 365 365 366 365 365 2,922
TotalsMining Rate (tpd) 30,000 30,000 30,000 30,000 30,000 281 -Oxide Ore Mined (tonnes) (Internal
COG)26,206,652 - - - - - - -
Sulfide Ore Processed (tonnes)
31,674,940 1,911,000 1,911,000 1,911,000 1,911,000 1,911,000 1,911,000 14,988,440
Total Waste Mined (tonnes)
173,353,905 9,151,649 9,765,707 8,131,468 9,152,904 6,742,190 50,396 -
Total Tonnes Mined 229,699,592 10,950,000 10,950,000 10,950,000 10,980,000 10,950,000 102,424 -S.R. 3.08 5.09 8.25 2.89 5.01 1.6 0.97 -
Oxide Au Grade Input (gpt)
1.323 1.161 0.969 1.207 1.237 1.545 0.818 -
Oxide Recoverable Au Ounces
770,891 - - - - - - -
Sulfide Au Grade Input (gpt)
2.672 3.481 2.989 3.041 2.749 3.059 2.357 1.86
Sulfide Recoverable Au Ounces
2,555,265 203,224 173,540 176,711 159,123 177,787 135,564 829,146
Sulfide %S Grade Processed
4.493 4.88 4.727 4.659 4.44 4.409 4.357 4.368
Total Recoverable Au Ounces
3,326,156 203,224 173,540 176,711 159,123 177,787 135,564 829,146
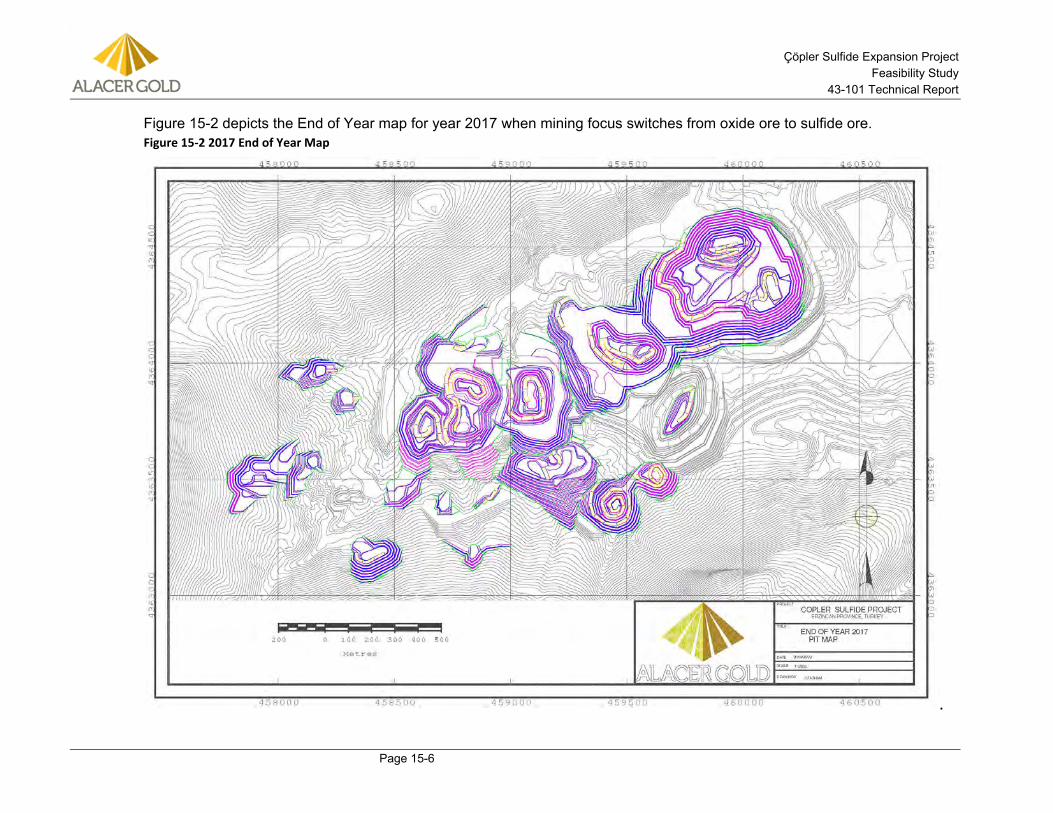
Çöpler Sulfide Expansion Project Feasibility Study
43-101 Technical Report
Page 15-6
Figure 15-2 depicts the End of Year map for year 2017 when mining focus switches from oxide ore to sulfide ore. Figure 15-2 2017 End of Year Map
.
Çöpler Sulfide Expansion Project Feasibility Study
43-101 Technical Report
Page 15-7
15.2 Risks and Opportunities There exist several risks and opportunities that could affect the above Mineral Reserve statement and the viability of the mine plan. The known potential risks to the success of the Ҫӧpler mine are:
• Political Risks – both local and national.
• Social Risks – To have a successful mining operation a company must have a social license to operate.
• Environmental Risks – The Ҫӧpler mine is subject to a changing regulatory environment. The Ҫӧpler mine must also remain within compliance of current environmental regulations.
• Fuel Cost Risk – Turkey is highly dependent on foreign supplied petroleum and fuel cost makes up a large majority of the overhead cost of operating a mine. An increase in fuel costs could have a negative impact on the economic viability of the Ҫӧpler mine.
• Geotechnical Risks – Open pit mines are susceptible to highwall and stockpile failures resulting in injury, equipment loss, and/or the abandonment of all or part of a designed pit. Additionally, Ҫӧpler is located in an area that has a history of significant seismic activity that could negatively impact mining operations.
• Gold Price Risk - Volatility in the price of gold can have an impact on current pit limit economics.
• Contract Mining Cost Risk – A contract will need to be negotiated between Anagold and the mining contractor to secure mining services at the current cost through the end of the anticipated mine life.
• Resource Model – The resource block model is an estimation of the resource at Ҫӧpler. Further refinement of the resource block model could reduce the estimate of contained gold.
• Haulage Distance – As the mine limits expand, waste storage areas will increase in height resulting in increased haulage distance. Additionally, the sulfide ore requires a large amount of stockpile space due to blending requirements. As blending requirements are further refined it may become necessary to develop more space for sulfide ore stockpiles, causing the waste material to be hauled a further distance than anticipated, having a negative impact on economics.
• Ability to selectively blend from ore stockpiles – various elements will require blending from different parts of the pit and stockpiles to meet a required metallurgical threshold for average grade. The ability to selectively mine from the stockpiles will be important to maximize operational performance of the mill and increase gold grade. The ability to do this requires detailed grade control and stockpile management systems that have not been developed at this time.
• Deleterious elements – There is always a risk that deleterious elements can be encountered during operations that were not captured as part of the feasibility and exploration program.
Çöpler Sulfide Expansion Project Feasibility Study
43-101 Technical Report
Page 15-8
In addition to potential risks to the Ҫӧpler Sulfide mine expansion, there also exist opportunities for the mine to increase performance and achieve better than expected results. The opportunities include:
• Mining Rate – The Ҫӧpler mine has achieved past production rates that exceed 100 ktpd. This allows Anagold the opportunity to increase the scheduled mining rate if required or deemed advantageous for increasing cash flow or overall economics of the project.
• Mining Selectivity – The equipment used for the extraction of ore at the Ҫӧpler mine site has been proven to achieve an Operational Selective Mining Unit (SMU) of approximately 3 m x 3 m x 5 m. This SMU is significantly smaller than the 10 m x 10 m x 5 m block size used to estimate the resource block model to determine grade and mine dilution. This allows for a high level of selectivity for material mined as ore, allowing for a potential increases in head grade and/or a decrease in tonnes processed. Additionally, ore control operations are able to sample blast holes that are spaced at 3.75m with 3.25m burden which allows for further selectivity when designing ore control boundaries.
• Geotechnical Opportunity – Improved lithological definition would allow for an increase in slope angles in specific alteration zones. Currently these zones are not well defined and are therefore assigned a minimum slope angle. If the definition of the alteration zones can be improved this would result in improved slope parameters allowing for improved ore extraction with reduced waste stripping ratios.
• Exploration Potential – There exists opportunity at the Ҫӧpler mine site for the conversion of Inferred material to higher confidence categories through additional infill drilling. Also, additional exploration potential exists in surrounding areas that could provide additional ore to the processing streams.
• Heap Leach Pad and Mill Tailings Capacity – The current mine schedule is limited by capacity of both the heap leach pad and TSF for ore processing. If an additional heap leach pad and TSF were to be constructed the mine design would have increased opportunity for optimization. The current pit limits are designed at what would be considered sub-optimal due to capacity constraints.
• Resource Model – The resource block model is an estimation of the resource at Ҫӧpler. Further refinement of the resource block model could increase contained gold.
• Underground Mining – Underground mining has not been considered at this time but there remains the potential that high grade zones beneath the open pit that may be amenable to underground extraction. This would be particularly beneficial as a mill feed source to supplement processing of medium and low grade sulfide ores.
15.3 Conclusions and Recommendations The Feasibility Study suggests that the sulfide resource located at the Ҫӧpler mine can be safely and economically mined using standard open-pit mining practices and proven processing techniques. In regard to the mining portion of this project, it is recommended that the level of work completed to date should allow for progression into the next stage of mine design and planning. Many additional considerations regarding capital expenditure, investment return, and risk must also be evaluated in regards to a decision on how Anagold should proceed with the sulfide expansion at Ҫӧpler.
Çöpler Sulfide Expansion Project Feasibility Study
43-101 Technical Report
Page 15-9
A significant Mineral Reserve exists within the confines of the designed open pit presented within this report. The design is well suited for open-pit mining operations by conventional mining equipment by an outside contractor. With the use of extensive ore stockpiling during the 47 months prior to the POX mill being commissioned, it is possible to obtain very high average POX mill feed grades near 5.0 g/t Au during the first 18 months of POX operations, and 4.0 g/t Au during the next 18 months. The production schedule is readily achievable and the mining operation will continue in the same manner as the existing oxide production at the Çöpler mine site.
The following items are recommended as part of the next phase of engineering and design associated with the project. These recommendations are:
• Detailed scheduling and design of the sulfide ore stockpiles should be completed. Results from ongoing metallurgical test work will assist in determining the optimal stockpiling strategy.
• Carbonate and sulfate grades should be modeled.
• Additional geotechnical oriented core hole drilling should be completed in areas where joint sets may affect overall pit wall stability.
• Further mapping and definition of alteration types and zones should be completed so that improved pit slope angles can be realized and geotechnical risk can be reduced.
• Further mapping and definition of the local and regional fault structures should be completed to reduce or realize geotechnical risk in the areas where these structures intersect the pit.
• Further refinement of the hydrogeologic impacts to geotechnical parameters and estimation on pit dewatering requirements should be completed.
• Pit designs should be further optimized for haulage requirements, blend scheduling, and backfill potential. Conduct limit equilibrium analysis for both static and pseudo-static cases using the feasibility pit design. The purpose of the analysis is to determine a Factor of Safety to quantify the risk of open pit wall failure in various areas of the project.
Çöpler Sulfide Expansion Project Feasibility Study
43-101 Technical Report
Page 16-1
16.0 MINING METHODS Mining operations for the Çöpler sulfide expansion will be conducted using the established conventional open-pit mining techniques already in place for the oxide mining operations. There is no expectation that the mining rate or equipment demands will increase.
The Feasibility Study is based on the continued use of a mining contractor. The contractor supplies all personnel, equipment, and facilities required to perform the entire mining operation at a current average cost of US$1.690 per tonne of total material mined. Alacer will incur additional costs of US$0.106 per tonne associated with the supervisory, engineering, geologic, and ore control functions.
16.1 Whittle Pit Shell Optimization The updated resource block model completed by Anagold in May 2014 was used as the basis for detailed economic pit optimization using GEMCOM Whittle Version 4.4.1 pit optimization software. This software, in conjunction with economic, metallurgical, and geotechnical criteria, was used to develop a series of economic pit shells which formed the basis for design and production scheduling within the Vulcan mine planning software system. On the basis of metallurgical test work and trade-off studies, the following processes were selected for the Feasibility Study:
• Heap Leach of all oxide ore
• Whole Ore Pressure Oxidation (POX) of all sulfide feed
Mining and Processing Economics 16.1.1Mining costs are based on current contract rates that have been agreed upon with the existing on-site contractor. Current contract mine rates are $3.950/m3 of material moved, or $1.570/tonne. Anagold is charged an additional fuel surcharge based on the haulage distance and fuel price over the life of the contract. Anagold has estimated this cost to be an additional $0.120/tonne mined due to extended haulage distances over the life of the project. Alacer expects to incur an additional $0.106/tonne mined for mine administration, engineering, ore control, pit geology, and survey control activities. The total mining cost for operations at Ҫӧpler mine is estimated at $1.796/tonne of material mined.
Oxide ore processing operating costs were estimated by the Alacer metallurgy group based on 2013 actual costs and previous test work. Additionally, $1.350 and $0.401 per tonne of ore was added to total oxide ore processing costs for site G&A and sustaining capital respectively. These costs are shown in Table 16-1.
Sulfide (POX) ore processing operating costs were estimated by Jacobs and were estimated to be $34.780 per tonne of ore. Additionally, $1.350 and $2.618 per tonne of ore was added to total sulfide ore processing costs for site G&A and sustaining capital respectively. Processing costs used for pit optimization are shown in Table 16-1. Costs attributable to gold sales used in the Whittle optimization are shown in Table 16-2. All processing costs are reported as US dollars per tonne of ore processed. All mining related costs are reported as US dollars per tonne mined.
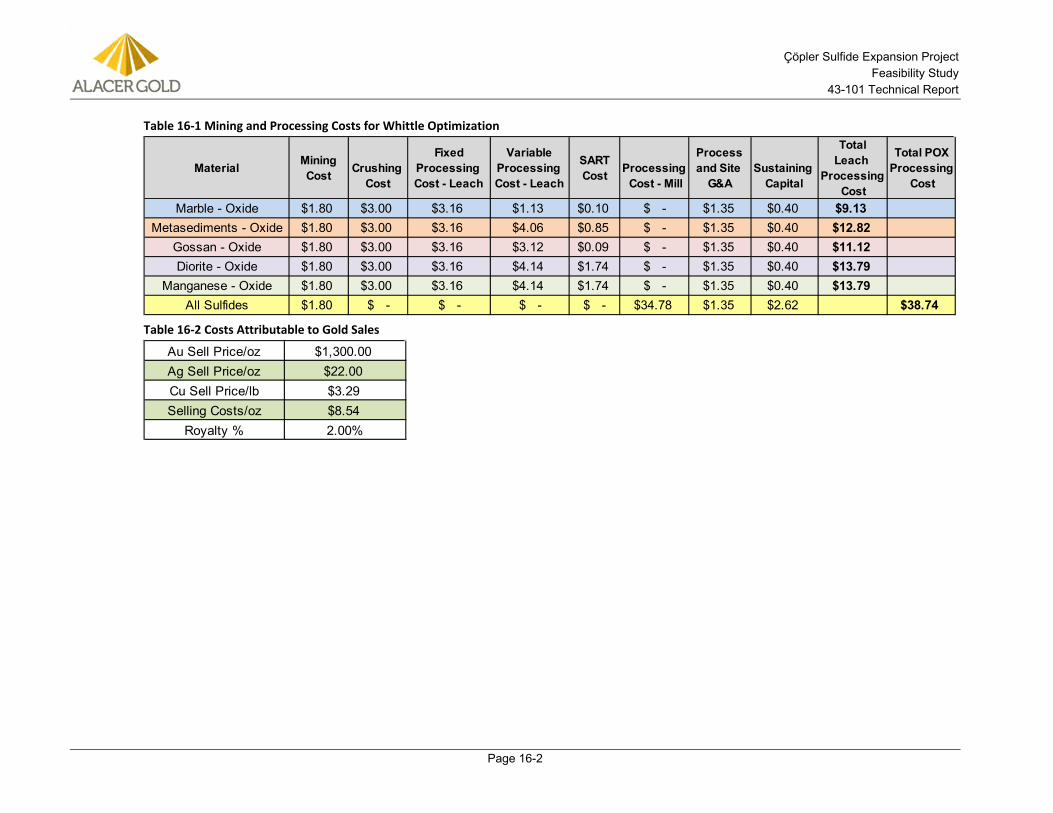
Çöpler Sulfide Expansion Project Feasibility Study
43-101 Technical Report
Page 16-2
Table 16-1 Mining and Processing Costs for Whittle Optimization
Table 16-2 Costs Attributable to Gold Sales
Material Mining Cost
Crushing
Cost
Fixed Processing Cost - Leach
Variable Processing Cost - Leach
SART Cost
Processing Cost - Mill
Process and Site
G&A
Sustaining
Capital
Total Leach
Processing Cost
Total POX Processing
Cost
Marble - Oxide $1.80 $3.00 $3.16 $1.13 $0.10 $ - $1.35 $0.40 $9.13Metasediments - Oxide $1.80 $3.00 $3.16 $4.06 $0.85 $ - $1.35 $0.40 $12.82
Gossan - Oxide $1.80 $3.00 $3.16 $3.12 $0.09 $ - $1.35 $0.40 $11.12Diorite - Oxide $1.80 $3.00 $3.16 $4.14 $1.74 $ - $1.35 $0.40 $13.79
Manganese - Oxide $1.80 $3.00 $3.16 $4.14 $1.74 $ - $1.35 $0.40 $13.79All Sulfides $1.80 $ - $ - $ - $ - $34.78 $1.35 $2.62 $38.74
Au Sell Price/oz $1,300.00Ag Sell Price/oz $22.00Cu Sell Price/lb $3.29Selling Costs/oz $8.54
Royalty % 2.00%
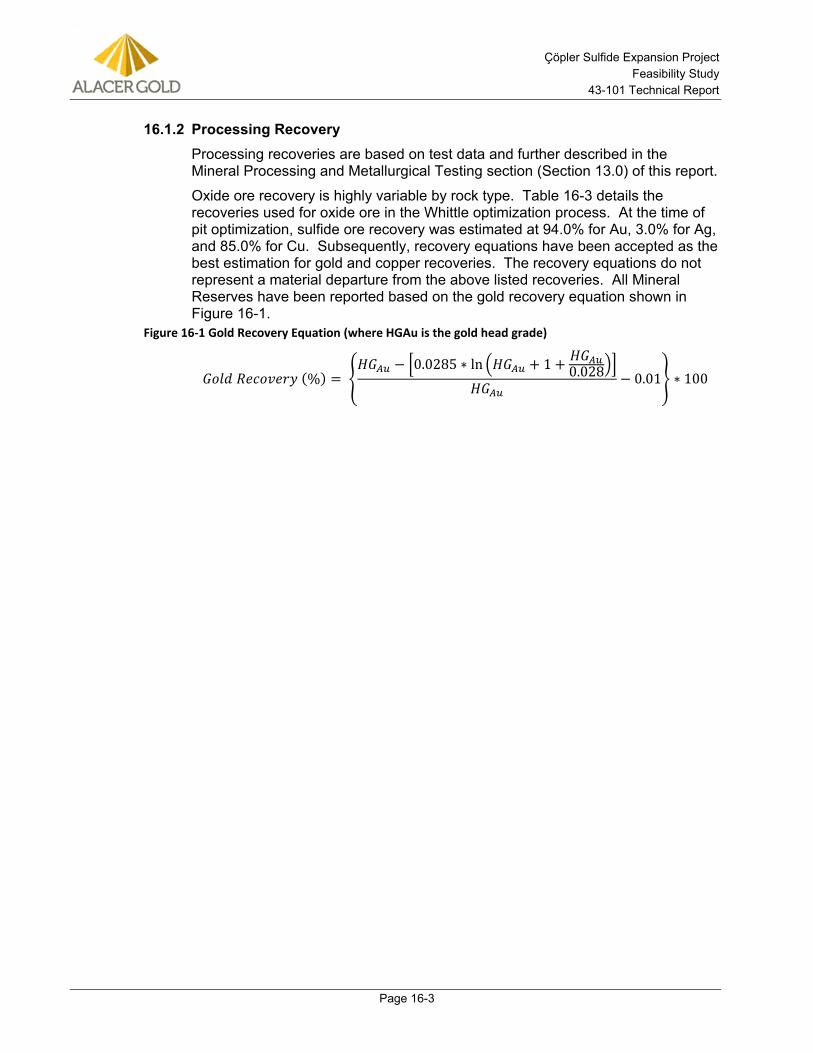
Çöpler Sulfide Expansion Project Feasibility Study
43-101 Technical Report
Page 16-3
Processing Recovery 16.1.2Processing recoveries are based on test data and further described in the Mineral Processing and Metallurgical Testing section (Section 13.0) of this report.
Oxide ore recovery is highly variable by rock type. Table 16-3 details the recoveries used for oxide ore in the Whittle optimization process. At the time of pit optimization, sulfide ore recovery was estimated at 94.0% for Au, 3.0% for Ag, and 85.0% for Cu. Subsequently, recovery equations have been accepted as the best estimation for gold and copper recoveries. The recovery equations do not represent a material departure from the above listed recoveries. All Mineral Reserves have been reported based on the gold recovery equation shown in Figure 16-1.
Figure 16-1 Gold Recovery Equation (where HGAu is the gold head grade)
𝐺𝑜𝑙𝑑 𝑅𝑒𝑐𝑜𝑣𝑒𝑟𝑦 (%) = �𝐻𝐺𝐴𝑢 − �0.0285 ∗ ln �𝐻𝐺𝐴𝑢 + 1 + 𝐻𝐺𝐴𝑢
0.028��𝐻𝐺𝐴𝑢
− 0.01� ∗ 100
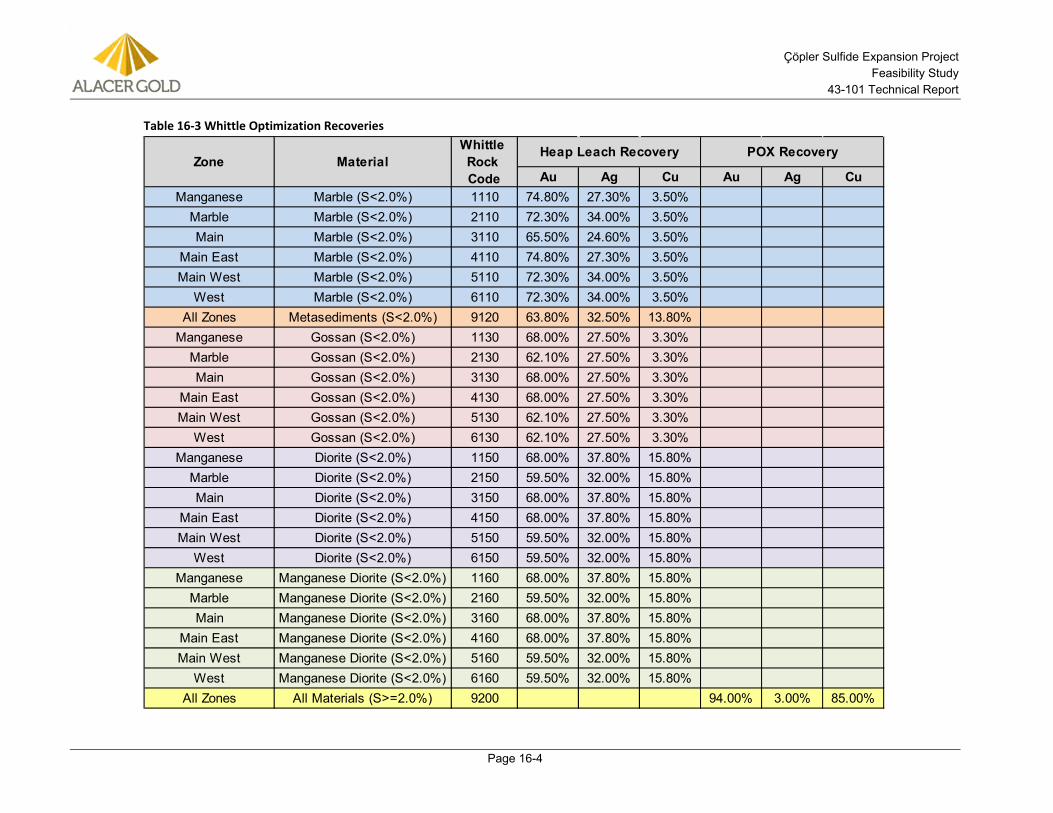
Çöpler Sulfide Expansion Project Feasibility Study
43-101 Technical Report
Page 16-4
Table 16-3 Whittle Optimization Recoveries
Au Ag Cu Au Ag CuManganese Marble (S<2.0%) 1110 74.80% 27.30% 3.50%
Marble Marble (S<2.0%) 2110 72.30% 34.00% 3.50%Main Marble (S<2.0%) 3110 65.50% 24.60% 3.50%
Main East Marble (S<2.0%) 4110 74.80% 27.30% 3.50%Main West Marble (S<2.0%) 5110 72.30% 34.00% 3.50%
West Marble (S<2.0%) 6110 72.30% 34.00% 3.50%All Zones Metasediments (S<2.0%) 9120 63.80% 32.50% 13.80%
Manganese Gossan (S<2.0%) 1130 68.00% 27.50% 3.30%Marble Gossan (S<2.0%) 2130 62.10% 27.50% 3.30%Main Gossan (S<2.0%) 3130 68.00% 27.50% 3.30%
Main East Gossan (S<2.0%) 4130 68.00% 27.50% 3.30%Main West Gossan (S<2.0%) 5130 62.10% 27.50% 3.30%
West Gossan (S<2.0%) 6130 62.10% 27.50% 3.30%Manganese Diorite (S<2.0%) 1150 68.00% 37.80% 15.80%
Marble Diorite (S<2.0%) 2150 59.50% 32.00% 15.80%Main Diorite (S<2.0%) 3150 68.00% 37.80% 15.80%
Main East Diorite (S<2.0%) 4150 68.00% 37.80% 15.80%Main West Diorite (S<2.0%) 5150 59.50% 32.00% 15.80%
West Diorite (S<2.0%) 6150 59.50% 32.00% 15.80%Manganese Manganese Diorite (S<2.0%) 1160 68.00% 37.80% 15.80%
Marble Manganese Diorite (S<2.0%) 2160 59.50% 32.00% 15.80%Main Manganese Diorite (S<2.0%) 3160 68.00% 37.80% 15.80%
Main East Manganese Diorite (S<2.0%) 4160 68.00% 37.80% 15.80%Main West Manganese Diorite (S<2.0%) 5160 59.50% 32.00% 15.80%
West Manganese Diorite (S<2.0%) 6160 59.50% 32.00% 15.80%All Zones All Materials (S>=2.0%) 9200 94.00% 3.00% 85.00%
POX RecoveryZone Material
Whittle Rock Code
Heap Leach Recovery
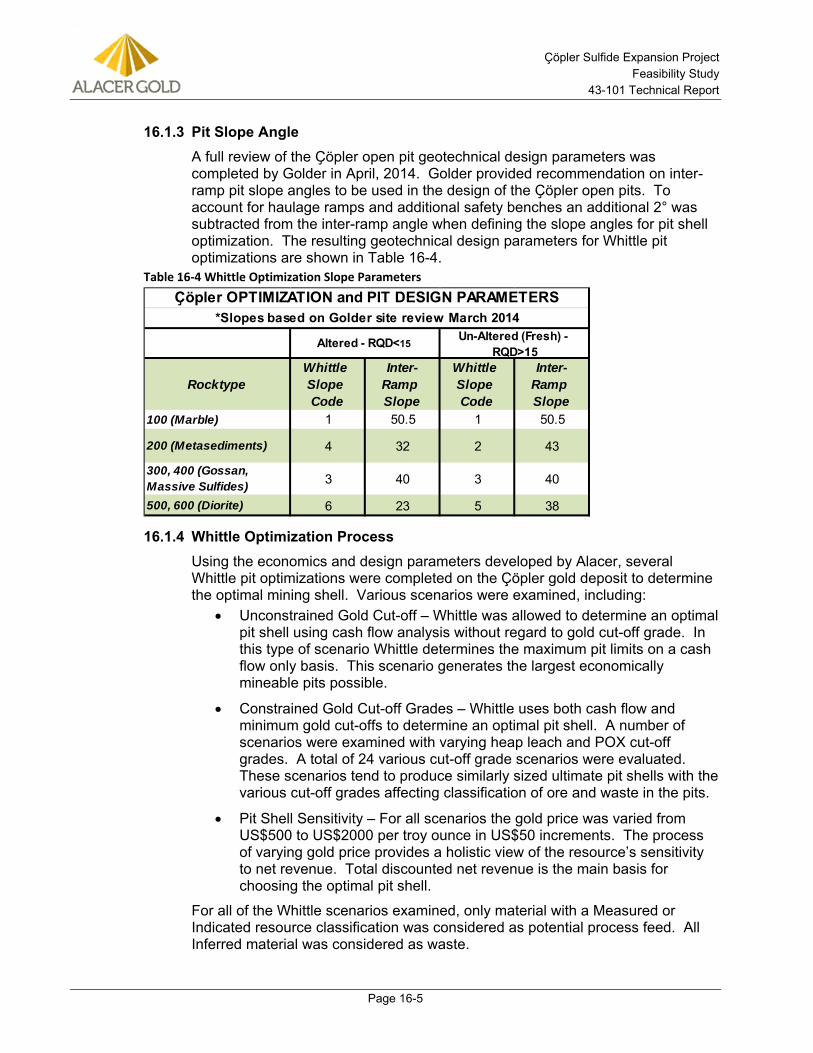
Çöpler Sulfide Expansion Project Feasibility Study
43-101 Technical Report
Page 16-5
Pit Slope Angle 16.1.3A full review of the Ҫӧpler open pit geotechnical design parameters was completed by Golder in April, 2014. Golder provided recommendation on inter-ramp pit slope angles to be used in the design of the Ҫӧpler open pits. To account for haulage ramps and additional safety benches an additional 2° was subtracted from the inter-ramp angle when defining the slope angles for pit shell optimization. The resulting geotechnical design parameters for Whittle pit optimizations are shown in Table 16-4.
Table 16-4 Whittle Optimization Slope Parameters
Whittle Optimization Process 16.1.4Using the economics and design parameters developed by Alacer, several Whittle pit optimizations were completed on the Çöpler gold deposit to determine the optimal mining shell. Various scenarios were examined, including:
• Unconstrained Gold Cut-off – Whittle was allowed to determine an optimal pit shell using cash flow analysis without regard to gold cut-off grade. In this type of scenario Whittle determines the maximum pit limits on a cash flow only basis. This scenario generates the largest economically mineable pits possible.
• Constrained Gold Cut-off Grades – Whittle uses both cash flow and minimum gold cut-offs to determine an optimal pit shell. A number of scenarios were examined with varying heap leach and POX cut-off grades. A total of 24 various cut-off grade scenarios were evaluated. These scenarios tend to produce similarly sized ultimate pit shells with the various cut-off grades affecting classification of ore and waste in the pits.
• Pit Shell Sensitivity – For all scenarios the gold price was varied from US$500 to US$2000 per troy ounce in US$50 increments. The process of varying gold price provides a holistic view of the resource’s sensitivity to net revenue. Total discounted net revenue is the main basis for choosing the optimal pit shell.
For all of the Whittle scenarios examined, only material with a Measured or Indicated resource classification was considered as potential process feed. All Inferred material was considered as waste.
RocktypeWhittle Slope Code
Inter-Ramp Slope
Whittle Slope Code
Inter-Ramp Slope
100 (Marble) 1 50.5 1 50.5
200 (Metasediments) 4 32 2 43
300, 400 (Gossan, Massive Sulfides) 3 40 3 40
500, 600 (Diorite) 6 23 5 38
Ҫӧpler OPTIMIZATION and PIT DESIGN PARAMETERS*Slopes based on Golder site review March 2014
Altered - RQD<15Un-Altered (Fresh) -
RQD>15
Çöpler Sulfide Expansion Project Feasibility Study
43-101 Technical Report
Page 16-6
A large number of scenarios were examined during the pit optimization process. Due to the expected commissioning date of the sulfide ore processing facilities occurring at the same time that the oxide Mineral Reserve is expected to be depleted, an oxide-only pit shell was generated using Whittle. After a comparison of various cut-off grade scenarios, and with the consideration that heap leach pad capacity is limited to 20 million tonnes from 2015 onward, pit shell number 13 ($1,100 Au) with an oxide ore cut-off grade of 0.5 g/t Au above the calculated break-even cut-off grade was selected as the oxide design basis. This oxide pit shell was then used as a starting point for optimizing the sulfide resource below the oxide pit.
After a comparison of various cut-off grade scenarios and with the consideration that the Tailings Storage Facility capacity is limited to 31.5 million tonnes, pit shell number 7 ($800 Au) with a sulfide ore cut-off grade of 1.5 g/t was selected as the sulfide design basis. The total discounted cash flow for each pit shell in all scenarios was calculated and compared against one another. The maximum discounted cash flow for ‘Best Case’ and ‘Worst Case’ mining sequences were identified and the optimal pit was chosen by studying the ‘Specified Case’ mining sequence between those two points. The optimal pit and cut-off grade was then chosen where the maximum value within the above described capacity constrains was achieved.
The Whittle ‘Best Case’ mining sequence calculates pit value by processing each pit shell incrementally from the smallest revenue factor up to the largest revenue factor in order to maximize the number of phases in the pit and to provide the earliest possible cash flow delivery. The Whittle ‘Worst Case’ mining sequence calculates pit value by processing each pit shell as a whole pit with no phasing, maximizing the delay in potential cash flow. The Whittle ‘Specified Case’ mining sequence takes a more realistic approach to the processing of the nested pit shells. In this case two theoretical mining phases were applied at pit shell number 2 ($550 Au) and pit shell number 5 ($700 Au). This approach allows for two phases prior to the ultimate pit in order to bring cash flow forward and represents a more realistic representation of how the pit would be mined. The chart that is commonly used to assist in optimal pit selection is shown in Figure 16-2.
The ultimate sulfide pit shell for the chosen scenario is shown below in Figure 16-3.
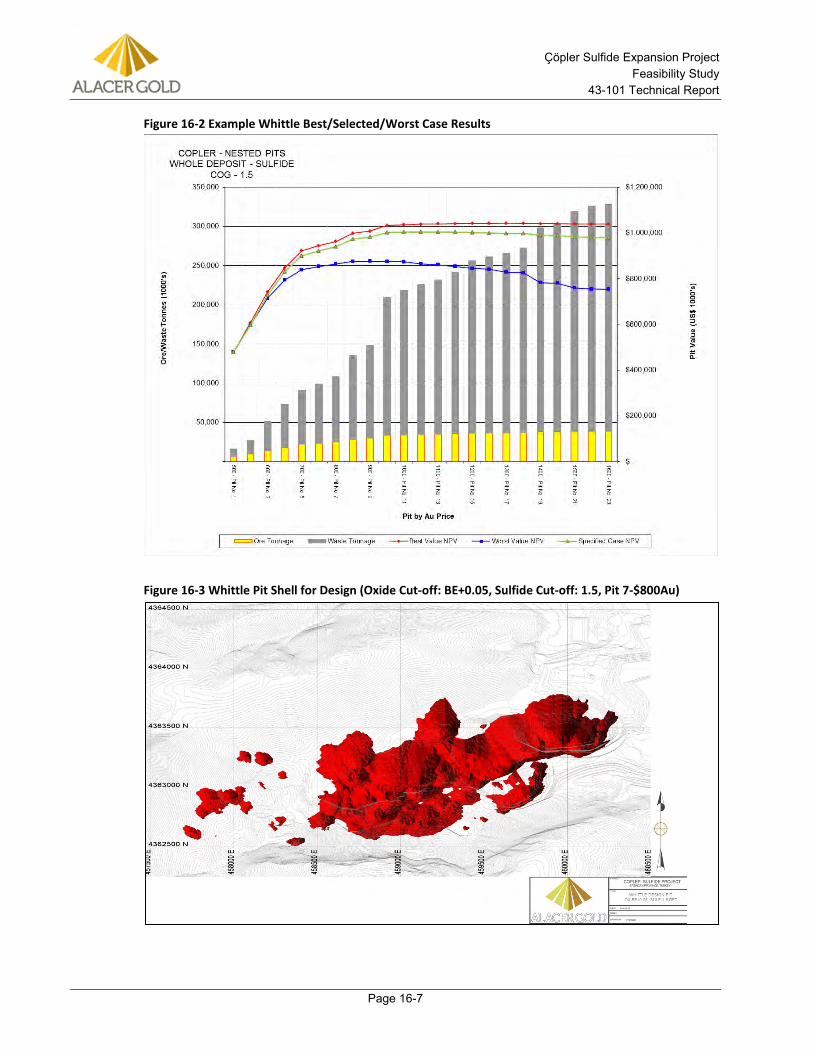
Çöpler Sulfide Expansion Project Feasibility Study
43-101 Technical Report
Page 16-7
Figure 16-2 Example Whittle Best/Selected/Worst Case Results
Figure 16-3 Whittle Pit Shell for Design (Oxide Cut-off: BE+0.05, Sulfide Cut-off: 1.5, Pit 7-$800Au)
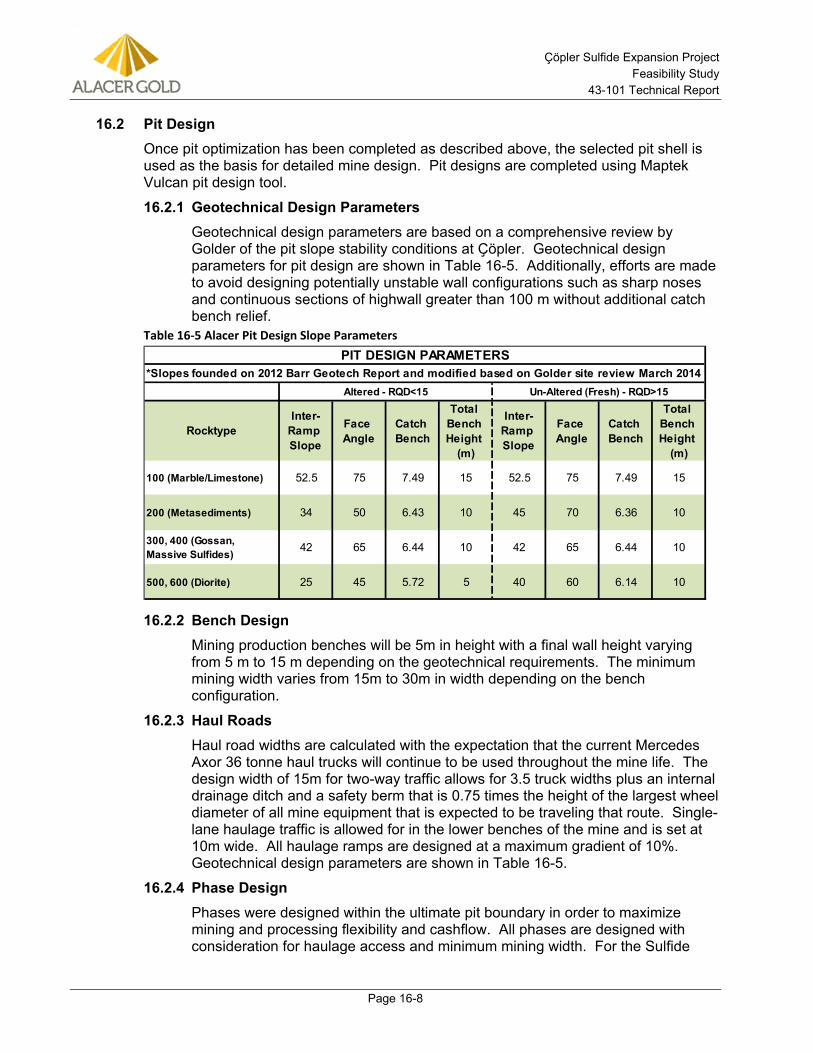
Çöpler Sulfide Expansion Project Feasibility Study
43-101 Technical Report
Page 16-8
16.2 Pit Design Once pit optimization has been completed as described above, the selected pit shell is used as the basis for detailed mine design. Pit designs are completed using Maptek Vulcan pit design tool.
Geotechnical Design Parameters 16.2.1Geotechnical design parameters are based on a comprehensive review by Golder of the pit slope stability conditions at Ҫӧpler. Geotechnical design parameters for pit design are shown in Table 16-5. Additionally, efforts are made to avoid designing potentially unstable wall configurations such as sharp noses and continuous sections of highwall greater than 100 m without additional catch bench relief.
Table 16-5 Alacer Pit Design Slope Parameters
Bench Design 16.2.2Mining production benches will be 5m in height with a final wall height varying from 5 m to 15 m depending on the geotechnical requirements. The minimum mining width varies from 15m to 30m in width depending on the bench configuration.
Haul Roads 16.2.3Haul road widths are calculated with the expectation that the current Mercedes Axor 36 tonne haul trucks will continue to be used throughout the mine life. The design width of 15m for two-way traffic allows for 3.5 truck widths plus an internal drainage ditch and a safety berm that is 0.75 times the height of the largest wheel diameter of all mine equipment that is expected to be traveling that route. Single-lane haulage traffic is allowed for in the lower benches of the mine and is set at 10m wide. All haulage ramps are designed at a maximum gradient of 10%. Geotechnical design parameters are shown in Table 16-5.
Phase Design 16.2.4Phases were designed within the ultimate pit boundary in order to maximize mining and processing flexibility and cashflow. All phases are designed with consideration for haulage access and minimum mining width. For the Sulfide
RocktypeInter-
Ramp Slope
Face Angle
Catch Bench
Total Bench Height
(m)
Inter-Ramp Slope
Face Angle
Catch Bench
Total Bench Height
(m)
100 (Marble/Limestone) 52.5 75 7.49 15 52.5 75 7.49 15
200 (Metasediments) 34 50 6.43 10 45 70 6.36 10
300, 400 (Gossan, Massive Sulfides) 42 65 6.44 10 42 65 6.44 10
500, 600 (Diorite) 25 45 5.72 5 40 60 6.14 10
PIT DESIGN PARAMETERS*Slopes founded on 2012 Barr Geotech Report and modified based on Golder site review March 2014
Altered - RQD<15 Un-Altered (Fresh) - RQD>15
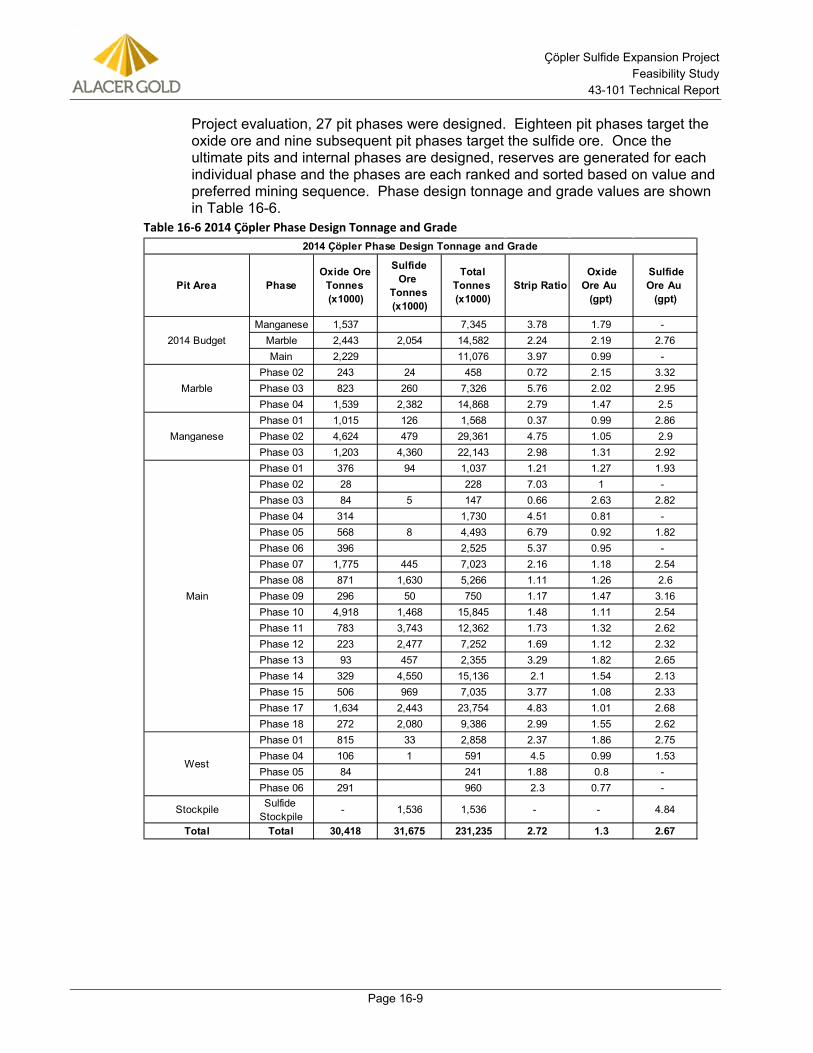
Çöpler Sulfide Expansion Project Feasibility Study
43-101 Technical Report
Page 16-9
Project evaluation, 27 pit phases were designed. Eighteen pit phases target the oxide ore and nine subsequent pit phases target the sulfide ore. Once the ultimate pits and internal phases are designed, reserves are generated for each individual phase and the phases are each ranked and sorted based on value and preferred mining sequence. Phase design tonnage and grade values are shown in Table 16-6.
Table 16-6 2014 Ҫӧpler Phase Design Tonnage and Grade
Pit Area Phase Oxide Ore
Tonnes (x1000)
Sulfide Ore
Tonnes (x1000)
Total Tonnes (x1000)
Strip Ratio Oxide Ore Au
(gpt)
Sulfide Ore Au
(gpt)
Manganese 1,537 7,345 3.78 1.79 - Marble 2,443 2,054 14,582 2.24 2.19 2.76Main 2,229 11,076 3.97 0.99 -
Phase 02 243 24 458 0.72 2.15 3.32Phase 03 823 260 7,326 5.76 2.02 2.95Phase 04 1,539 2,382 14,868 2.79 1.47 2.5Phase 01 1,015 126 1,568 0.37 0.99 2.86Phase 02 4,624 479 29,361 4.75 1.05 2.9Phase 03 1,203 4,360 22,143 2.98 1.31 2.92Phase 01 376 94 1,037 1.21 1.27 1.93Phase 02 28 228 7.03 1 - Phase 03 84 5 147 0.66 2.63 2.82Phase 04 314 1,730 4.51 0.81 - Phase 05 568 8 4,493 6.79 0.92 1.82Phase 06 396 2,525 5.37 0.95 - Phase 07 1,775 445 7,023 2.16 1.18 2.54Phase 08 871 1,630 5,266 1.11 1.26 2.6Phase 09 296 50 750 1.17 1.47 3.16Phase 10 4,918 1,468 15,845 1.48 1.11 2.54Phase 11 783 3,743 12,362 1.73 1.32 2.62Phase 12 223 2,477 7,252 1.69 1.12 2.32Phase 13 93 457 2,355 3.29 1.82 2.65Phase 14 329 4,550 15,136 2.1 1.54 2.13Phase 15 506 969 7,035 3.77 1.08 2.33Phase 17 1,634 2,443 23,754 4.83 1.01 2.68Phase 18 272 2,080 9,386 2.99 1.55 2.62Phase 01 815 33 2,858 2.37 1.86 2.75Phase 04 106 1 591 4.5 0.99 1.53Phase 05 84 241 1.88 0.8 - Phase 06 291 960 2.3 0.77 -
Stockpile Sulfide Stockpile
- 1,536 1,536 - - 4.84
Total Total 30,418 31,675 231,235 2.72 1.3 2.67
West
2014 Ҫӧpler Phase Design Tonnage and Grade
2014 Budget
Marble
Manganese
Main
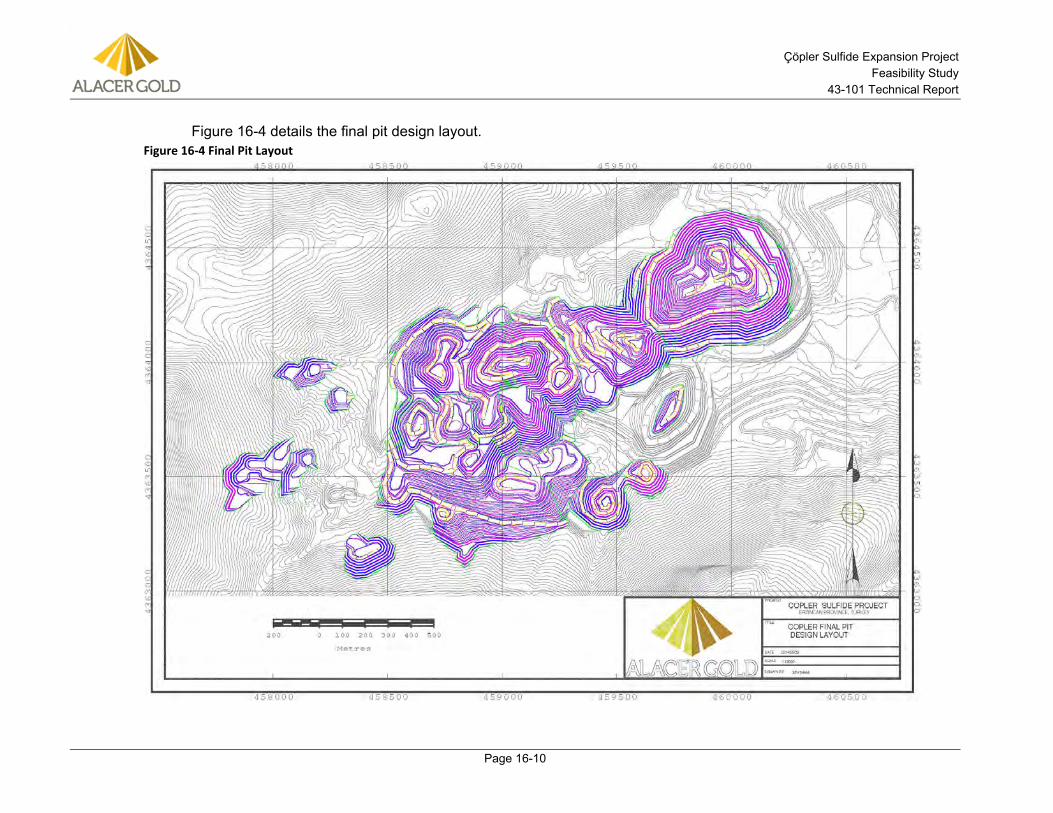
Çöpler Sulfide Expansion Project Feasibility Study
43-101 Technical Report
Page 16-10
Figure 16-4 details the final pit design layout. Figure 16-4 Final Pit Layout
Çöpler Sulfide Expansion Project Feasibility Study
43-101 Technical Report
Page 16-11
16.3 Hydrology and Pit Dewatering Hydrology Background 16.3.1The only perennial surface water in the vicinity of Çöpler Mine Site is the Karasu River flowing in the northern and western part of the area. All other valleys are either ephemeral streams or dry valleys. The average flow rate of the Karasu River measured at the Bağıştaş/Karasu Gauging Station (EIE-2156) in the upper Euphrates Basin, is about 145 cubic meters per second (m³/sec), draining an area of 15,562 square kilometers (km²). The maximum flow rate recorded at this station was 1,320 m³/sec in May of 1969 and the minimum was 43.8 m³/sec in January 1974. Peak flow rates are observed in April and May following snow melt and precipitation (Ekmekci and Tezcan, 2007). At Gauging Station No. 2156, the average flow rate was approximately 275 m³/sec. The maximum flow rate recorded at this station was 338 m³/sec in May of 1969 and the minimum was 55.9 m³/s in September 1986.
On the Karasu River downstream of the mine site, Bağıştaş -1 Dam, a hydroelectric dam, is being built. When the reservoir is at high levels the impoundment will extend into the very lower reaches of both the Çöpler and Sabırlı Creeks and the maximum inundation elevation will be 916.5 m as it is released into the spillway. The dam crest elevation will be 918 m. The operational flow rate is planned to be 330 m³/sec, however if inflow is less than this amount the dam will release 15 m³/sec until they reach capacity to operate at 330 m³/sec.
The Çöpler and Sabırlı streambeds in the study area do not flow perennially. They both discharge into the Karasu River. The drainage area of the Sabırlı Creek is about 35 km²) and that of the Çöpler Creek is about 10 km2. The measurements carried out for the Çöpler Creek in the year 2005 demonstrated that the stream varied flow along the stream bed. The discharges measured in the western part of (Old) Çöpler Village were recorded as 10 liters/second (L/sec). In March 2007, it was measured that the discharge before the old village of Çöpler was 1 L/sec, 15 L/sec in the western part of Çöpler, and 3.9 L/sec at seepage levels before joining the Karasu River. Measurements in the Sabırlı stream were carried out in March and April 2005 and the discharge was measured as 20 L/sec (SRK, 2008).
Rainfall 16.3.2Rainfall data from three weather stations in and around the project area were reviewed as follows:
• Divriği station (approximately 37 km from the site), 41 years of record,
• Erzincan (approximately 90 km from the site), 45 years of record; and,
• WS2 (located on-site), 9 years of record.
Station WS2 had an insufficient length of record to be considered for this analysis. Monthly average and maximum daily rainfall for each month were reported along with IDF curves for storms with return frequencies of 2- to 100-years for a period of record of 1970-2010 for the Divriği station.
Çöpler Sulfide Expansion Project Feasibility Study
43-101 Technical Report
Page 16-12
The Divriği station data was used to perform a detailed analysis using a dataset relatively close to the site. Calculations of 2- to 100-year storm event depths as well as a PMP estimate were performed for this station.
Table 16-7 summarizes the results of the data review and indicates those gauges where sufficient information was available to derive design storm depth estimates.
Table 16-7 Summary of Gauge Records with Sufficient Data for Analysis
A graphical frequency analysis was performed using the daily rainfall data for the Divriği, Sivas, and Erzincan rainfall gauges to develop estimates of storm depths for 2- to 100-year storm events. The maximum daily rainfall for each year of record was analyzed using standard distribution methods (i.e. Gumbel, Generalized Extreme Value, Weibull, Log-Pearson Type III, Lognormal, and Exponential), to determine the best fit trend line.
A Weiss Factor of 1.13 was applied to the calculated storm depth values to account for rainfall measurements that are only recorded once per day. The resulting peak rainfall data determined using the Divriği station data is similar to the values used in previous studies. The 24-hour storm depths determined for the Çöpler site are shown below in Table 16-8. Monthly average rainfall values are shown in Table 16-9. The average annual rainfall for the site is 384.3 millimeters (mm).
Table 16-8 24-hour Storm Depths for Çöpler Project
Table 16-9 Average Rainfall for Çöpler Project
For the Probable Maximum Precipitation (PMP) analysis, the World Meteorological Organization’s (WMO) Statistical Method was used to determine PMP estimates using the daily data from the Divriği, Erzincan, and Sivas gauges.
Gauge Record Period Monthly Average
2- to 100-Year Frequency
AnalysisPMP
Erzincan (monthly) 1975-2010 X
Erzincan (daily) 1963-1968, 1973-2012
X X X
Divriği (monthly) 1970-2010 XDivriği (daily) 1970-2011 X X Xİliç n/aSivas 1929-2004 X X XWS2 2004-2012
Frequency (yrs) 2 5 10 25 50 100Divriği Gauge (mm) 29.6 38.2 44.2 52.1 58.2 64.6
Month Jan Feb Mar Apr May Jun Jul Aug Sep Oct Nov Dec Annual
Average Rainfall
(mm)34 33.1 44.6 57.4 55.6 26.5 7.7 4.5 11.4 36.5 36.4 36.6 384.3
Çöpler Sulfide Expansion Project Feasibility Study
43-101 Technical Report
Page 16-13
Calculated PMP estimates for the Divriği, Erzincan, and Sivas stations are 110.9 mm, 779.6 mm, and 212.8 mm, respectively. Based on the proximity of the Divriği and Erzincan gauges to the Çöpler site, linear interpolation of these PMP estimates based on distance from the project site was performed. The Sivas station was excluded from the interpolation due to the station being a significant distance from the site. This interpolation results in a 24-hour PMP estimate of 302.0 mm for the Çöpler site.
Site-Wide Surface Water Hydrology 16.3.3Existing mine site facilities are located primarily within the Çöpler and Sabırlı Creek watersheds immediately upstream of their confluence with the Karasu River. Site-wide surface management for the mine expansion included an evaluation of the current surface drainage conditions in order to develop the surface water diversion concept. Diversion facilities will consist of a network of diversion channels and retention structures to minimize storm water run-on to the proposed mine site facilities and to prevent mine-impacted storm water run-off from exiting the site and discharging to the Karasu River.
Evaluation of the current surface drainage conditions included development of an existing conditions surface water hydrology model. Available 10 m existing site topography was used to delineate the contributing sub-basin areas upstream and downstream of the site. The surface run-off conditions for each sub-basin have been developed from evaluation of previous soil and vegetation characterizations for the site and review of recent aerial photography. Typical Soil Conservation Service (SCS) curve numbers were applied to the analysis.
The sub-basin areas, characterization of the surface run-off conditions, and design rainfall data were used to construct the existing conditions hydrology model. The hydrology analysis utilized HEC-HMS software to develop estimates of the peak flow rates and volumes generated by the existing watersheds.
Surface Water Management Structures 16.3.4The results of the existing surface water hydrology provided the framework for the site-wide surface water management and the proposed diversion design. Engineered surface water management structures are proposed to minimize effects of storm water run-on to critical mine facilities and to control the release of mine-impacted water to the environment. A combination of interim and permanent diversion channels and retention ponds are utilized to achieve these goals. Interim structures will be reclaimed at closure while permanent structures will remain in place post-closure.
Interim diversion channels are designed to convey the 25-year storm event with 0.5 m of freeboard and the 100-year storm with no freeboard. Permanent diversion channels are designed to convey the 100-year storm with 0.5 m of freeboard. Channel lining material is dependent on design flow velocity. Earth lined channels are allowed for velocities less than 1.5 m/s. Riprap is used for channel velocities between 1.5 m/sec and 3.0 m/sec. Riprap is used on channel banks when the design flow is subcritical and the entire channel perimeter is riprap lined when design flow is supercritical. Articulated concrete block (ACB) mattresses are recommended for design flow velocities greater than 3.0 m/sec. HEC-RAS hydraulic modeling software is used to model permanent diversion
Çöpler Sulfide Expansion Project Feasibility Study
43-101 Technical Report
Page 16-14
channels to ensure capacity and velocity requirements are met. Manning’s equation assuming normal depth is used to model temporary channels for flow depth and velocity.
Contact water is collected in retention ponds designed to mitigate impacts to the downstream environment. Retention ponds for the waste dumps are sized to contain the 100-year run-off volume with an emergency spillway to safely discharge the PMP peak flow. The TSF is designed to contain the volume generated by the 24-hour PMP within the operating freeboard. An emergency spillway or other upstream surface water diversions for this facility will be provided as part of the mine closure design.
In addition to the TSF, the proposed site-wide surface water control structures are as follows:
• Permanent South Diversion Channel located upstream of the southern ultimate pit limit
• Perimeter Berm and Interim Toe Channel located along the western edge of the West Waste Dump
• Perimeter Berm and Interim Toe Channel located along the southern edge of the South Waste Dump
• Retention Ponds north of the Lowe Çöpler West Dump and northwest of the Lower Çöpler East Dump
As noted earlier, part of the surface water management objective is to minimize run-on to the ultimate mine site footprint. The proposed arrangement of mine facilities and the proposed diversions result total contributing drainage area of 5.5 km² reporting to the pit. This includes the footprint of the projected ultimate pit limit (1.7 km²) and the West WRSA (1.4 km²), as this stockpile is graded such that surface run-off will report directly to the pit.
Pit Dewatering 16.3.5Estimations of pit lake formation and groundwater conditions during mining are discussed in the groundwater modeling study conducted by Golder, published in September 2013 (Golder, 2013b).
Sources of groundwater recharge include direct infiltration of precipitation and/or infiltration during storm water run-off events throughout the entire Site. Fractured or karstic openings in the bedrock and alluvial sediments along drainages are considered the predominant pathways for infiltration. The main hydrogeologic units and features considered in the groundwater model were:
• Munzur Limestone (Hydraulic Conductivity = 0.6 m/day)
• Intrusive Diorite (Hydraulic Conductivity = 0.0002 m/day)
• Metasediments (Hydraulic Conductivity = 0.0002 m/day)
• Alluvium (Hydraulic Conductivity = 10 m/day)
• Various Fault Systems (Sabirli, Ҫӧpler, and Other) (Hydraulic Conductivity = 6.1 m/day)
Çöpler Sulfide Expansion Project Feasibility Study
43-101 Technical Report
Page 16-15
The calibrated groundwater model was used to predict pit inflows and pit lake development based on a pit design with a maximum depth of 875 meters. This analysis estimated pit inflow at less than approximately 1,100 m3/day. Estimations on pit lake formation suggest that over a 100 year scenario, based on a pit design with a maximum depth of 875 meters, pit lake water elevations are projected to reach the 906 m (±20 m) elevation. Particle tracking from water that infiltrates the West WRSA suggests that it will take more than 1,000 years for groundwater to flow to a point where it is discharged into the Karasu River. Groundwater located beneath the Lower Ҫӧpler East WRSA is estimated to discharge to the Karasu River within approximately 300 years.
16.4 Geotechnical Pit Slope Stability The Ҫӧpler mine maintains an on-site geotechnical monitoring program that consists of a geotechnical engineer and regular inspections of the mining operations to monitor safety and operational concerns related to geotechnical stability of the pit walls and surrounding areas. It is expected that with the sulfide expansion of the pit extents the geotechnical program on site will also expand to include additional employees, a prism monitoring program, and active dewatering/depressurization efforts if required.
In April of 2014, a full review of the geotechnical conditions at the Ҫӧpler mine site was completed by Golder (Golder, 2014c). The review was made on the basis of an existing Feasibility Level report completed by Barr Engineering in 2012 and was a further refinement of that report to make recommendations on operational considerations that should be implemented in expectation of the sulfide mine expansion. In summary, the following observations and recommendations were made by Golder:
Operational Recommendations: 16.4.1• Perimeter Blasting - Alacer should maintain current best practices in pre-
split operations in the Marble/Limestone rock unit. It is recommended that the bench-face angle should be increased from 65° to 75° and the bench-height increased from 10m to 15m. These increases in angle and height will result in wider catch benches to better manage the safety risk from rock-fall.
• Slope Monitoring - Regular visual inspections of pit slope wall conditions should be performed and documented.
• A prism monitoring system should be installed to identify slope movements over time. - Radar monitoring is only necessary once slope movement has been identified and is considered to be a substantial risk to mining activities below.
• Pit Mapping and Oriented Drilling - Pit Mapping of structures by site geology staff is highly encouraged to provide a reliable structure database. Jointing in the Marble/Limestone lithologies poses minimal risk due to the vertical nature of the joints. Jointing orientation in the fresh Metasediments is largely unknown and should be studied further through an oriented core hole drilling program. Four (4) potential hole locations have been identified and are planned to be drilled in 2014.
• Surface Water and Groundwater Controls - Effective surface water control systems should be implemented to divert all surface water away from the
Çöpler Sulfide Expansion Project Feasibility Study
43-101 Technical Report
Page 16-16
pit slopes. This should be applied with environmental considerations in mind.
• Groundwater depressurization will be required in areas where stability is affected by low permeability structures.
Design Recommendations: 16.4.2• Pit Slope Design Angle Recommendations – Table 16-10 shows the
suggested inter-ramp angles that were provided by Golder. A portion of the geotechnical units are currently poorly defined. In these cases the more conservative pit slope angle is used. Table 16-11 shows the pit slope angles used by Alacer as a basis for pit design.
• South and North Ҫӧpler Faults - The orientation of the South and North Ҫӧpler faults must be evaluated to assess the risks of failure in the pits. Both faults are known to dip to the south at approximately 30° - 35°. The South Ҫӧpler fault poses little risk beyond where it is exposed in the pit wall intersection due to the dip being nearly perpendicular to the pit wall. The North Ҫӧpler fault, however, could pose a significant risk to pit wall stability should the highwall intersect the fault. The North Ҫӧpler fault is dipping nearly parallel the current design pit; however, the current pit is believed to be at least 50m further south and should not intersect the fault. Further evaluation of the fault dip and location should be completed to prove that the risk will not be realized.
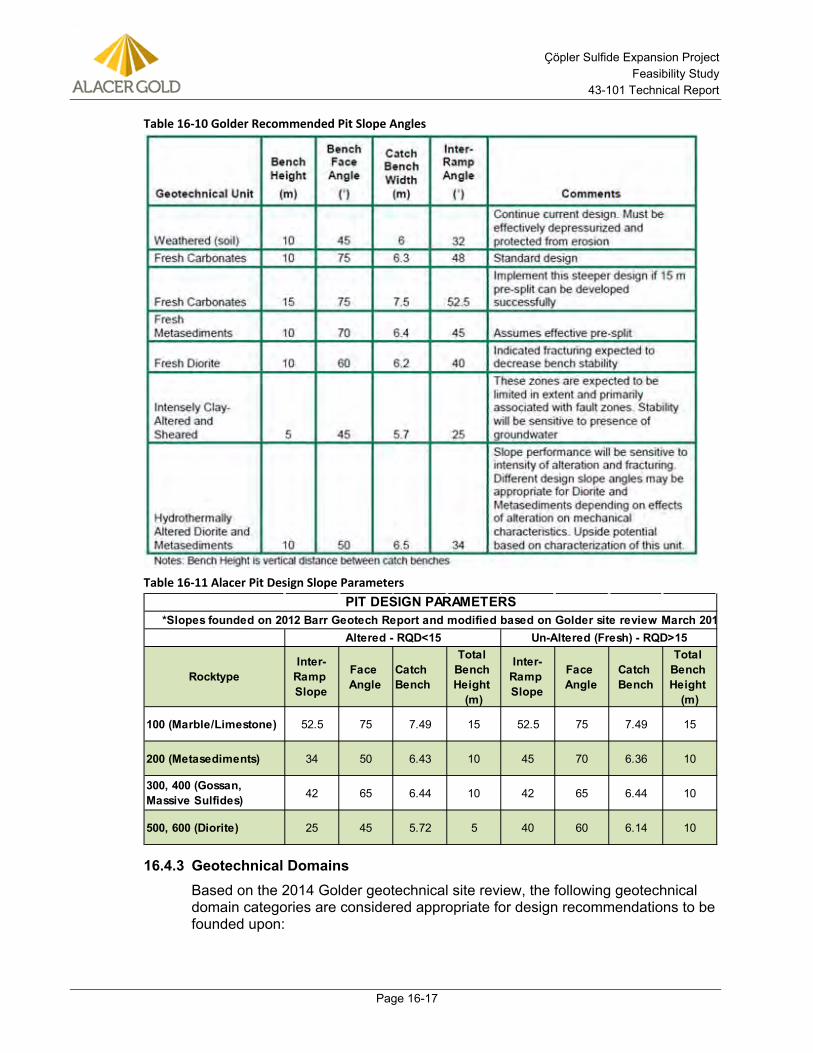
Çöpler Sulfide Expansion Project Feasibility Study
43-101 Technical Report
Page 16-17
Table 16-10 Golder Recommended Pit Slope Angles
Table 16-11 Alacer Pit Design Slope Parameters
Geotechnical Domains 16.4.3Based on the 2014 Golder geotechnical site review, the following geotechnical domain categories are considered appropriate for design recommendations to be founded upon:
RocktypeInter-
Ramp Slope
Face Angle
Catch Bench
Total Bench Height
(m)
Inter-Ramp Slope
Face Angle
Catch Bench
Total Bench Height
(m)
100 (Marble/Limestone) 52.5 75 7.49 15 52.5 75 7.49 15
200 (Metasediments) 34 50 6.43 10 45 70 6.36 10
300, 400 (Gossan, Massive Sulfides) 42 65 6.44 10 42 65 6.44 10
500, 600 (Diorite) 25 45 5.72 5 40 60 6.14 10
*Slopes founded on 2012 Barr Geotech Report and modified based on Golder site review March 201Altered - RQD<15 Un-Altered (Fresh) - RQD>15
PIT DESIGN PARAMETERS
Çöpler Sulfide Expansion Project Feasibility Study
43-101 Technical Report
Page 16-18
• Marble/Limestone – characterized by competent rocks and marbleized near the Ҫӧpler intrusion.
• Fresh Diorite – characterized as a fresh to slightly weathered or altered moderately strong rock.
• Hydrothermally Altered Diorite – alteration sufficient to significantly reduce strength relative to Fresh Diorite, but without the shearing and intense clay alteration of Contact and Fault zones.
• Weathered Diorite and Metasediments – highly weathered, extremely weak rock and soil that occurs in the oxidized zone (depth typically to 30m).
• Fresh Metasediments – fresh to slightly weathered, weak to moderately strong rock consisting of a turbidite sequence that may also be structurally complex near faults.
• Hydrothermally Altered Metasediments – alteration sufficient to significantly reduce strength relative to Fresh Metasediments, but without the shearing and intense clay alteration of Contact and Fault zones.
• Fault Gouge including Intrusive Contact and Intense Sulfide Alteration – slickensided plastic clay with rock fragments that occurs in fault zones including the intrusive contacts.
The character and extent of the hydrothermal alteration beyond the Fault zones is poorly defined. Where data are lacking within the alteration zones the most conservative pit slope angle is assumed, representing up-side potential should the alteration zone be further defined in the geologic model.
The above listed geotechnical domains are mostly well known and modeled in a geologic model. The alteration zones however, vary significantly and have not been modeled to an extent to where variations by alteration type are well defined. It has been recommended by Barr Engineering and Golder that the best way to identify alteration zones is by modeling RQD in the geologic model. For this purpose, RQD values of 15 and less are considered “altered” and RQD values greater than 15 are considered “un-altered”, or “fresh”.
16.5 Waste Rock and Stockpile Storage The Ҫӧpler Sulfide Feasibility Study allows for the use of four Waste Rock Storage Areas (WRSAs) to safely store the resulting waste rock and sulfide ore that is extracted due to the mining operations. These four areas are defined as the Lower Ҫӧpler East, Lower Ҫӧpler West, Upper Ҫӧpler, and West WRSA’s. Current oxide operations already utilize three of these WRSA’s with the exception of the Lower Ҫӧpler West WRSA. The Lower Ҫӧpler East and Upper Ҫӧpler WRSA’s will primarily be utilized as sulfide ore stockpile areas but will likely be used as a waste rock storage area towards the end of the mine life.
Figure 16-5 details the location of the above described WRSA’s in relation to the final pit surface.
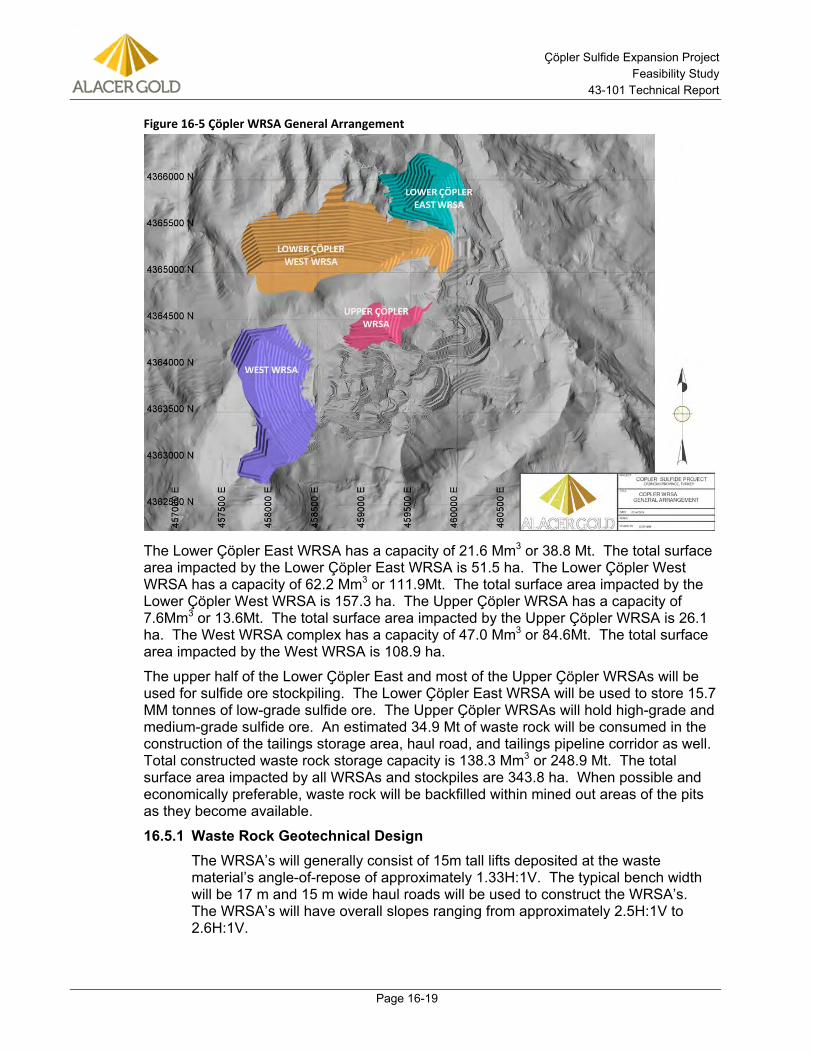
Çöpler Sulfide Expansion Project Feasibility Study
43-101 Technical Report
Page 16-19
Figure 16-5 Ҫӧpler WRSA General Arrangement
The Lower Çöpler East WRSA has a capacity of 21.6 Mm3 or 38.8 Mt. The total surface area impacted by the Lower Çöpler East WRSA is 51.5 ha. The Lower Çöpler West WRSA has a capacity of 62.2 Mm3 or 111.9Mt. The total surface area impacted by the Lower Çöpler West WRSA is 157.3 ha. The Upper Çöpler WRSA has a capacity of 7.6Mm3 or 13.6Mt. The total surface area impacted by the Upper Çöpler WRSA is 26.1 ha. The West WRSA complex has a capacity of 47.0 Mm3 or 84.6Mt. The total surface area impacted by the West WRSA is 108.9 ha.
The upper half of the Lower Ҫӧpler East and most of the Upper Ҫӧpler WRSAs will be used for sulfide ore stockpiling. The Lower Ҫӧpler East WRSA will be used to store 15.7 MM tonnes of low-grade sulfide ore. The Upper Ҫӧpler WRSAs will hold high-grade and medium-grade sulfide ore. An estimated 34.9 Mt of waste rock will be consumed in the construction of the tailings storage area, haul road, and tailings pipeline corridor as well. Total constructed waste rock storage capacity is 138.3 Mm3 or 248.9 Mt. The total surface area impacted by all WRSAs and stockpiles are 343.8 ha. When possible and economically preferable, waste rock will be backfilled within mined out areas of the pits as they become available.
Waste Rock Geotechnical Design 16.5.1The WRSA’s will generally consist of 15m tall lifts deposited at the waste material’s angle-of-repose of approximately 1.33H:1V. The typical bench width will be 17 m and 15 m wide haul roads will be used to construct the WRSA’s. The WRSA’s will have overall slopes ranging from approximately 2.5H:1V to 2.6H:1V.
Çöpler Sulfide Expansion Project Feasibility Study
43-101 Technical Report
Page 16-20
In February 2014, Golder completed an evaluation of the geotechnical stability of the four WRSA designs (Golder, 2014b). Six of the most critical cross sections were evaluated to determine the minimum factor of safety (FOS) for the proposed waste dumps. The sections were aligned to pass through the highest part of the waste piles, the steepest waste pile slopes, and the steepest foundation grades.
In addition to static stability analyses, pseudo-static stability analyses were performed to account for seismic loading conditions for the WRSA’s. The pseudo-static analyses were conducted based on the procedure proposed by Hynes-Griffin and Franklin (1984) in which a horizontal acceleration equal to 50% of the peak ground acceleration at bedrock is applied to the model. The design criteria peak ground acceleration is 0.30g for the Magnitude M7.0 operating basis earthquake (OBE) Therefore, a horizontal pseudo-static acceleration of 0.15g was applied to the WRSA sections in the seismic stability analyses.
The results of the stability analysis are summarized in Table 16-12.
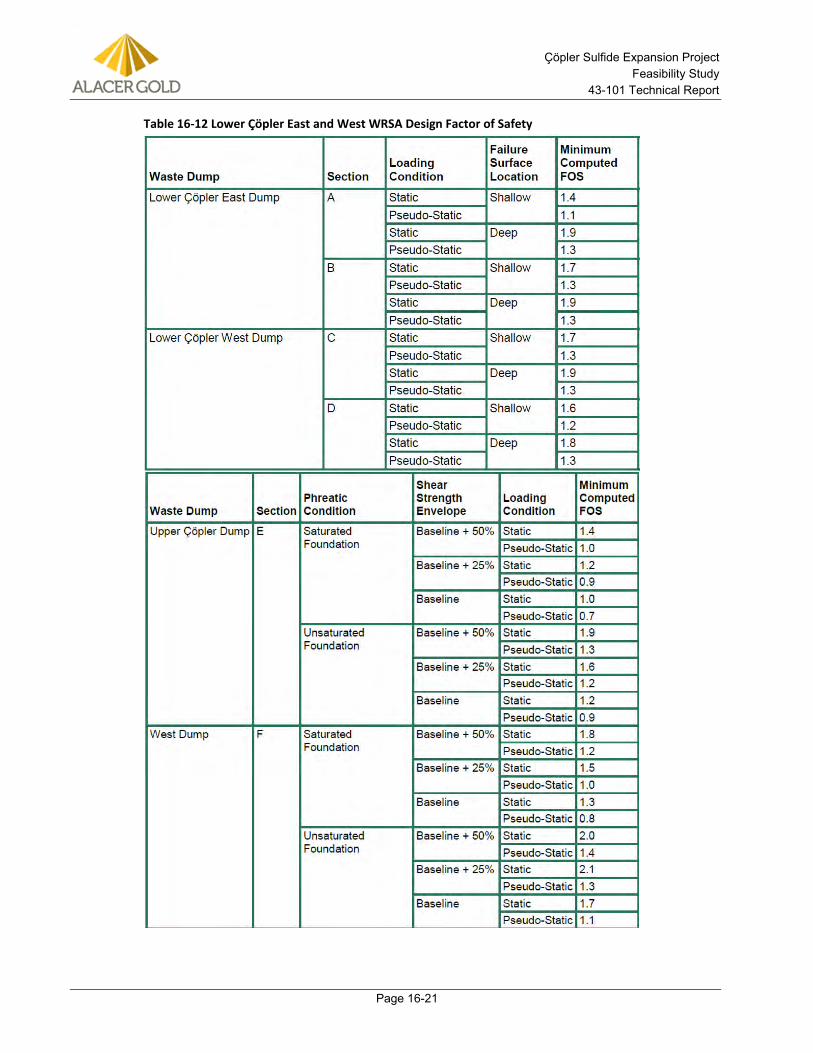
Çöpler Sulfide Expansion Project Feasibility Study
43-101 Technical Report
Page 16-21
Table 16-12 Lower Ҫӧpler East and West WRSA Design Factor of Safety
Çöpler Sulfide Expansion Project Feasibility Study
43-101 Technical Report
Page 16-22
The Lower Ҫӧpler East WRSA facility will be constructed over a portion of the existing Northeast Waste Dump. Foundation conditions underlying the existing Northeast Waste Dump and the proposed Lower Ҫӧpler East (LCE) facility consist of Munzur Limestone. Minimum computed factors of safety for the LCE facility are 1.86 and 1.31 for static and seismic loading conditions, respectively.
The Lower Ҫӧpler West WRSA facility will be founded on Munzur Limestone. Limit equilibrium stability analyses indicate minimum computed factors of safety of 1.83 and 1.28 for static and seismic loading conditions, respectively (Golder, 2014a).
The Upper Ҫӧpler and West WRSA facilities are to be constructed adjacent to the ultimate mine pit boundary. Foundation conditions primarily consist of altered metasediments and altered diorite. Further geotechnical evaluation of the foundation conditions and pit walls in the area of the UC and West WRSA facilities is currently underway or is planned prior to detailed engineering. For these facilities, Golder has performed a parametric study to evaluate the minimum required strength of foundation materials to achieve adequate factors of safety with the proposed facilities and ultimate pit configuration, as designed. The parametric study evaluated a range of material strengths as well as phreatic conditions within the foundation materials (Golder, 2014a).
Further investigation is required to fully evaluate the foundation conditions in the area of the Upper Ҫӧpler and West WRSA facilities. Should these investigations determine foundation material strengths less than those required to achieve adequate factors of safety, redesign of these facilities will be required. Redesign of these facilities may include flattening of overall slopes, partial relocation of the facility or full relocation of the facility.
It is recommended that the foundation in the area of the Upper Ҫӧpler and West WRSA’s meets the requirements of the Unsaturated Foundation Baseline + 25% in the above table. The industry engineering standard minimum acceptable stability factors of safety for non-water impounding waste storage facilities are 1.3 for the long-term steady-state case and 1.0 for short-term (e.g., seismic) loading conditions. The minimum computed factors of safety for the proposed WRSA’s exceeds these minimums.
Waste Rock Geochemical Review 16.5.2SRK (Turkey) has conducted Acid Rock Draining (ARD) analysis on the various lithologies at Ҫӧpler and has designated the rock as Potentially Acid Forming (PAF) or Non Acid Forming (NAF). The criteria by lithology are described in Table 16-13. Based on these criteria, the Ҫӧpler mine plan estimates that PAF waste rock will make up approximately 80.5 million tonnes and NAF waste rock will make up approximately 88.9 million tonnes. PAF waste rock will be identified through the ore control process and will be routed to WRSAs for encapsulation within NAF waste rock. The WRSAs will be reclaimed in a manner that limits the amount of water and air absorption into the WRSA.
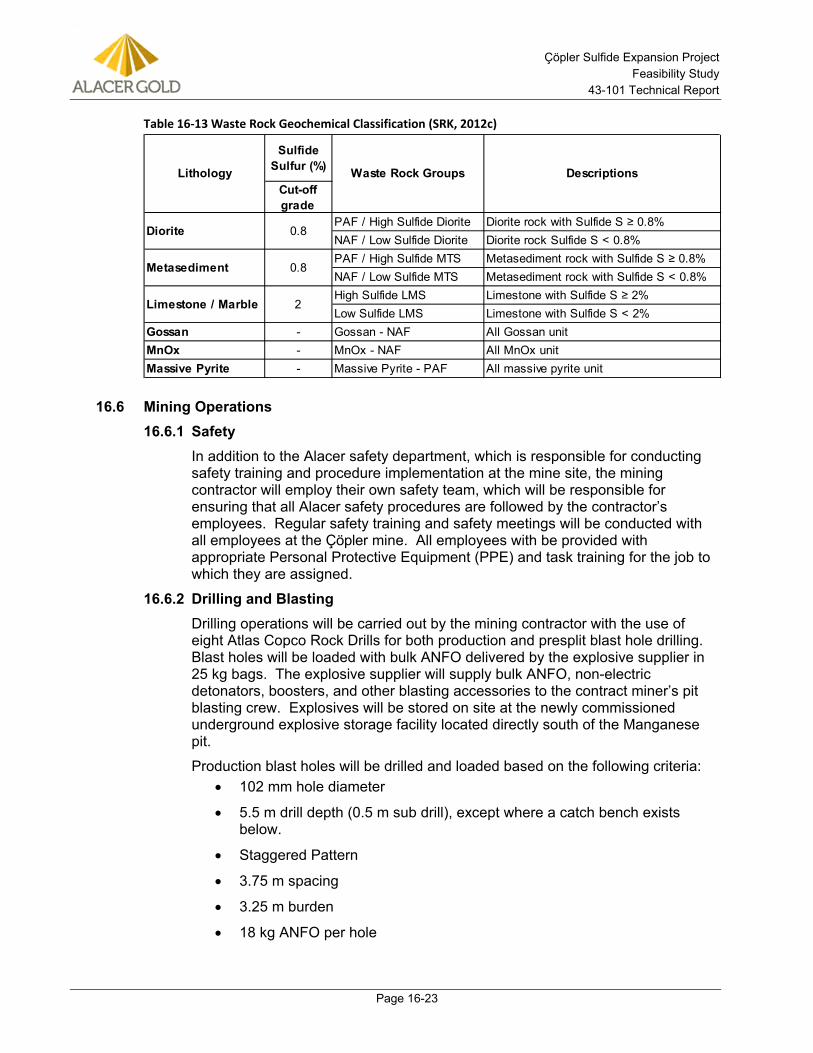
Çöpler Sulfide Expansion Project Feasibility Study
43-101 Technical Report
Page 16-23
Table 16-13 Waste Rock Geochemical Classification (SRK, 2012c)
16.6 Mining Operations Safety 16.6.1In addition to the Alacer safety department, which is responsible for conducting safety training and procedure implementation at the mine site, the mining contractor will employ their own safety team, which will be responsible for ensuring that all Alacer safety procedures are followed by the contractor’s employees. Regular safety training and safety meetings will be conducted with all employees at the Çöpler mine. All employees with be provided with appropriate Personal Protective Equipment (PPE) and task training for the job to which they are assigned.
Drilling and Blasting 16.6.2Drilling operations will be carried out by the mining contractor with the use of eight Atlas Copco Rock Drills for both production and presplit blast hole drilling. Blast holes will be loaded with bulk ANFO delivered by the explosive supplier in 25 kg bags. The explosive supplier will supply bulk ANFO, non-electric detonators, boosters, and other blasting accessories to the contract miner’s pit blasting crew. Explosives will be stored on site at the newly commissioned underground explosive storage facility located directly south of the Manganese pit.
Production blast holes will be drilled and loaded based on the following criteria: • 102 mm hole diameter
• 5.5 m drill depth (0.5 m sub drill), except where a catch bench exists below.
• Staggered Pattern
• 3.75 m spacing
• 3.25 m burden
• 18 kg ANFO per hole
Sulfide Sulfur (%)
Cut-off grade
PAF / High Sulfide Diorite Diorite rock with Sulfide S ≥ 0.8%NAF / Low Sulfide Diorite Diorite rock Sulfide S < 0.8%PAF / High Sulfide MTS Metasediment rock with Sulfide S ≥ 0.8%NAF / Low Sulfide MTS Metasediment rock with Sulfide S < 0.8%High Sulfide LMS Limestone with Sulfide S ≥ 2%Low Sulfide LMS Limestone with Sulfide S < 2%
Gossan - Gossan - NAF All Gossan unitMnOx - MnOx - NAF All MnOx unitMassive Pyrite - Massive Pyrite - PAF All massive pyrite unit
Limestone / Marble 2
Lithology Waste Rock Groups Descriptions
Diorite 0.8
Metasediment 0.8
Çöpler Sulfide Expansion Project Feasibility Study
43-101 Technical Report
Page 16-24
• (1) 0.5 kg booster
• 2.75 m stemming
• Timing varies based on pattern configuration and amount of burden relief.
Pre-split blast holes will be drilled and loaded based on the following criteria: • 89 mm hole diameter
• Inclined at 75°
• 6 – 16 m drill depth depending on design bench height (1 m sub drill)
• 0.8 m spacing along design crest
• (8) 0.5 kg boosters evenly spaced in the hole column
• No stemming
• Fired simultaneously in advance of production blast.
Ore Control 16.6.3All ore control operations will be managed and performed by Alacer employees.
There are two main ore material types which require different processing routes in the sampling process. These two ore types are oxide and sulfide. The identification of these two ore types is completed by the pit geologists by reviewing assay results from the bench above, resource model estimations, and by visual inspection of the blast hole cuttings. For potential oxide ore AuCN (assay of cyanide soluble Au) is completed for 100% of samples taken, AuFA (fire assay of Au) is completed for 20% of samples taken, and carbon and sulfur assays are taken for 5% of samples taken. For potential sulfide ore, AuFA is completed for 100% of samples taken and carbon and sulfur assays are taken for 50% of samples taken.
Sampling of the blast hole drill cuttings will be performed by using a sample scoop to extract a complete cross section of the cutting pile. The sampled cuttings are deposited into a canvas bag which will be labelled with the drill hole ID and with a LIMS bar code tag inserted into the bag with the cuttings. Sample bags are sealed and sent to the on-site laboratory for analysis. The sample scoop is cleaned regularly to avoid contamination between samples. Figure 16-6 details the blast hole sampling procedure.
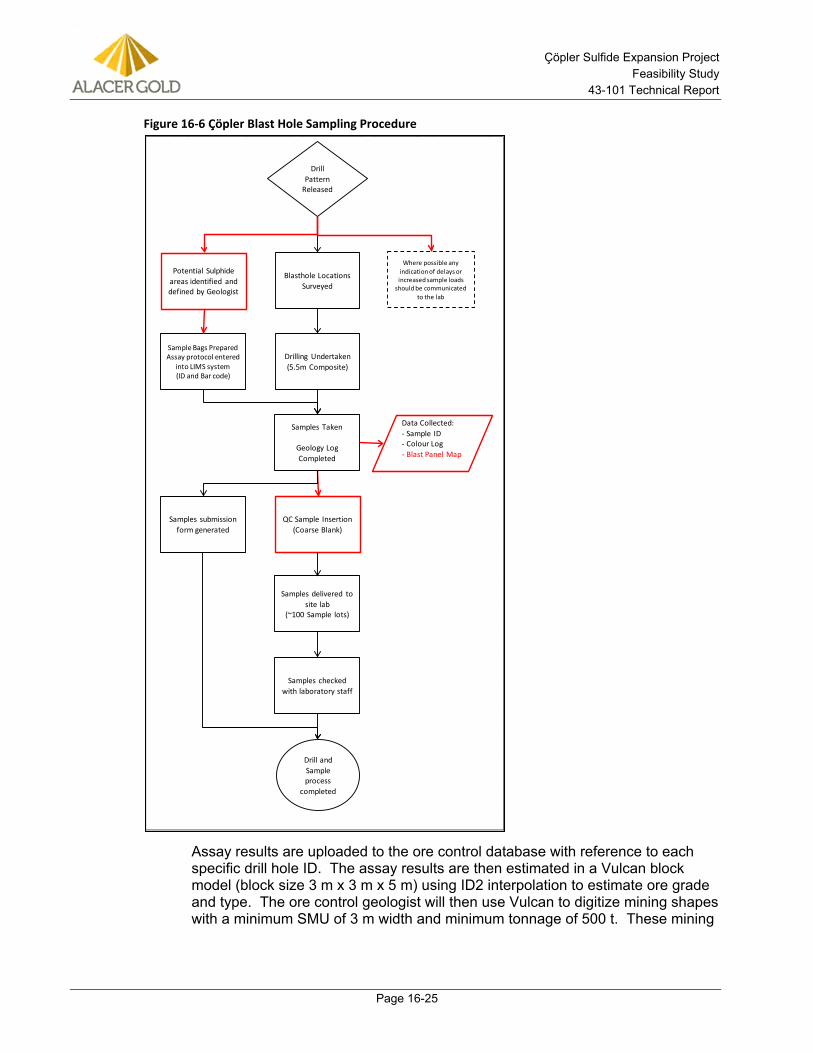
Çöpler Sulfide Expansion Project Feasibility Study
43-101 Technical Report
Page 16-25
Figure 16-6 Ҫӧpler Blast Hole Sampling Procedure
Assay results are uploaded to the ore control database with reference to each specific drill hole ID. The assay results are then estimated in a Vulcan block model (block size 3 m x 3 m x 5 m) using ID2 interpolation to estimate ore grade and type. The ore control geologist will then use Vulcan to digitize mining shapes with a minimum SMU of 3 m width and minimum tonnage of 500 t. These mining
DrillPattern
Released
Blasthole Locations Surveyed
Drilling Undertaken (5.5m Composite)
Sample Bags Prepared Assay protocol entered
into LIMS system(ID and Bar code)
Samples Taken
Geology Log Completed
QC Sample Insertion(Coarse Blank)
Data Collected:- Sample ID- Colour Log- Blast Panel Map
Samples checked with laboratory staff
Drill and Sample process
completed
Samples submission form generated
Potential Sulphide areas identified and defined by Geologist
Where possible any indication of delays or increased sample loads
should be communicated to the lab
Samples delivered to site lab
(~100 Sample lots)
Çöpler Sulfide Expansion Project Feasibility Study
43-101 Technical Report
Page 16-26
shapes are then sent to the survey group for layout in the mine using color coded flagging under the supervision of the ore control geologist.
Loading and Hauling 16.6.4Loading and hauling of ore and waste will be performed by the mining contractor. Primary production loading operations will utilize ten Caterpillar 374D excavator-back hoes with 4.6m3 buckets. A total of 69 Mercedes Axor 36 tonne haul trucks will be used as the primary haulage equipment. Ore and waste material will be routed by color coded flagging set out by ore control technicians and then delivered to the appropriate Waste Rock Storage Area (WRSA), stockpile, or crusher. Waste rock will be stored in one of four areas; the Lower Ҫӧpler East WRSA, Lower Ҫӧpler West WRSA, Upper Ҫӧpler WRSA, and West WRSA. Ore will be either direct dumped into the crushing circuit or placed in the appropriate stockpile.
Ancillary Mine Equipment 16.6.5Ancillary mine equipment is required to support mine operations. This equipment is primarily made up of two vibratory compactors, four Caterpillar 14H graders, four Caterpillar D8 and one Caterpillar D9 dozers, four water trucks, four Caterpillar 980 wheel loaders, and two Volvo 35 tonne articulated haul trucks. Additional equipment includes light plants, fuel trucks, and maintenance vehicles.
Ore Stockpile Rehandle 16.6.6Ore that is unable to be directly dumped into the crushing circuit will be placed in the appropriate stockpile for processing at a later time. Oxide and sulfide ore will use separate crushing circuits for the processing of each ore type.
Oxide ore will be stockpiled directly adjacent to the primary crusher and rehandled with a Caterpillar 980 wheel loader that will directly dump material into either the gyratory cone crusher or sizer. Stockpiling of oxide ore will be generally limited to times when the crushing circuit is not in operation. Every effort is made to pace the mining of oxide ore with the availability of the crushing circuit to reduce the amount of rehandle. Oxide rehandle costs are estimated at an additional US$0.67 per tonne of material rehandled.
Sulfide ore will be stockpiled in one of three designated stockpiles; low-grade (1.5 g/t – 2.3 g/t), medium-grade (2.3 g/t – 3.1 g/t), and high-grade (greater than 3.1 g/t) sulfide ore. Sulfide ore will be rehandled using Caterpillar 980 loaders and Mercedes Axor 36 tonne haul trucks. Rehandled sulfide ore will be hauled and dumped in a MMD sizer that will directly feed the grinding circuit. Sulfide rehandle costs are estimated at an additional US $1.25 per tonne of material rehandled.
Given that only three grade bins have been implemented, it is assumed a certain amount of flexibility is inherent for the blending capability from the stockpiles with regards to gold and sulfur grade. The details and mechanics involved in the stockpiling strategy will be explored during the detailed design portion of the project.
Çöpler Sulfide Expansion Project Feasibility Study
43-101 Technical Report
Page 17-1
17.0 RECOVERY METHODS The Çöpler Sulfide Expansion Project is designed to nominally treat 5,000 tpd of feed from the Çöpler sulfide resource, from which gold-silver doré and a copper sulfide concentrate will be produced. The mill is designed based on an availability of 85% with an average life-of-mine head grade of 2.67 g/t Au and a design grade of 5 g/t Au. These projections include periods of higher-grade feed in the initial years of mining.
The Crusher, Mill, POX, Cyanidation, Tailings and Ancillary facilities will be operated 365 days/year and 24 hours/day using a three shift rotation for process personnel. The mine will operate on one, two, or three shift per day schedules, depending on total material movement requirements necessary to supply a constant feed to the Crusher. Crusher stockpile feed operations will operate on the same schedule as the Crusher.
Life-of-Mine average metal recoveries are projected as follows:
• Gold Recovery – 93.9%
• Silver Recovery – 2.4%
• Copper Recovery – 88.4%
Run-of-Mine (ROM) sulfide process feed stock will be transported from the four mine pits by haul trucks to the sulfide process stockpile. Sulfide process feed stock will be deposited in specified areas in the sulfide process stockpile according to sulfide feed blending parameters. The POX circuit has been designed to run within specific ranges of feed parameters including:
• The sulfide sulfur concentration, which must be above 3.6% to allow the autoclaves to run autogenously and no greater than 4.8% to maintain design sulfide sulfur oxidation levels at the design throughput rate.
• The carbonate content will need to be controlled to minimize sulfuric acid consumption, to minimize CO2 formation and excess autoclave venting, and to control POX residue product chemistry to minimize jarosite formation.
• Head gold and copper grades to maintain economic grades of metals feeding the process.
In order to feed the pressure oxidation system a consistent blend according to design blending parameters, front-end loaders will be used to deliver sulfide process feed stock from the various areas of the process stockpile to the primary crushing system.
A sizer type crusher has been selected as the primary crusher to directly feed the SAG mill, due to the high clay content of the Çöpler Sulfide resource. An intermediate stockpile has not been incorporated in the design due to the high clay content. The sulfide process feed stock is expected to have a swelling clay content of 21% to 40%.
A SAG-Ball mill circuit was chosen for the grinding system and will be designed to produce a ground product with aP80 size of 100 µm. The grinding circuit product from the cyclone cluster overflow will be thickened in the grinding circuit thickener. The thickener underflow slurry will be pumped to the POX system acidulation feed tanks.
Ground slurry will be stored in the acidulation feed tanks which provide slurry storage to buffer the POX system from any short term grinding circuit problems. Slurry will be pumped from the acidulation feed tanks to the acidulation tanks for acidulation, using
Çöpler Sulfide Expansion Project Feasibility Study
43-101 Technical Report
Page 17-2
recycled acid decant thickener overflow, supplemented with fresh sulfuric acid as needed, to partially remove carbonate minerals. The acidulated slurry will be pumped to the POX feed thickener. Most of the thickener overflow will be pumped to the decant thickener as washing medium for the autoclave discharge slurry. Excess thickener overflow will be bled to the iron/arsenic precipitation as needed. This returns acid generated from sulfide oxidation in the autoclaves to the acidulation circuit, minimizing fresh acid addition requirements in the acidulation circuit. The thickened acidulated POX feed slurry will then be pumped to the POX feed surge tank to decouple the thickener system from the autoclaving system.
Thickened acidulated slurry will be pumped from the POX feed surge tank to the low temperature splash tank for initial heating of slurry. The low temperature splash tank heats the slurry using steam generated in the low-temperature flash tank. The heated slurry from the low-temperature splash tank will be pumped to the high temperature splash tank for additional heating using steam from the high pressure flash tank. The heated slurry will be pumped from the high-temperature splash tank by centrifugal pump which feed positive displacement pumps to feed slurry to the autoclaves at the POX system operating pressure.
Due to weight and size limitations plus dimensional restrictions of the Turkish roads, it was determined that it is not feasible to transport a large, heavy multi-compartment conventional horizontal autoclave vessel to the project site. The process has instead been designed to use multiple vertical autoclave vessels. These vertical vessels can be fabricated to meet size and weight transport limits, enabling transport to the site.
A trade-off study was completed during the FS to evaluate the option of fabrication on-site of a horizontal, multi-compartment autoclave on-site. This option was determined to be more costly than the selected multiple vertical vessels design.
The autoclave circuit will incorporate a train of seven vertical autoclave vessels with the first three arranged in parallel. The combined discharge from these three vessels then feeds four vessels in series. This arrangement will mimic the operation of a multi-compartmented horizontal autoclave. Vertical autoclaves (or vertical “pots”) have not been applied on a large scale in refractory gold processing; however, they have been used successfully in other mineral processing applications, most recently in a cobalt/copper process in Zambia. A bench marking study was performed during the Feasibility Study comparing the Anagold POX system design to a number of traditional horizontal POX systems that have been constructed and operated.
The slurry flows by gravity through the autoclave vessels. The autoclave circuit will be designed to oxidize 96% of the sulfide mineralization in the feed slurry. The estimated sulfide oxidation profile through the series of vessels is as follows:
• 70% (three parallel vessels),
• 19%, (1st series vessel)
• 4%,(2nd series vessel)
• 2%, (3rd series vessel)
• 1%, (4th series vessel)
Treated slurry exits the last vertical vessel through a pressure letdown system consisting of a high pressure and a low pressure flash vessel. Generated steam from the
Çöpler Sulfide Expansion Project Feasibility Study
43-101 Technical Report
Page 17-3
respective flash vessels will be directed to the associated splash vessels for slurry heating. A bleed line off the vent from the high pressure flash vessel, along with vent gas from the overhead vent line from the vessels, will be treated in the POX system scrubber. The gas will be scrubbed to comply with Turkish regulations and then vented to the atmosphere.
The depressurized hot slurry will be combined with the POX feed thickener overflow and thickened in the decant thickener. Most of the acid overflow is recycled to the acidulation tanks to minimize fresh acid addition. Excess thickener overflow will be bled to the iron/arsenic precipitation tank as needed. Thickener underflow slurry is pumped to the iron/arsenic precipitation system.
The iron/arsenic precipitation system consists of two agitated tanks in series. The pH in the tanks will be raised by the addition of ground limestone (P80 of 37 µm) to precipitate soluble arsenic as ferric arsenate.
The treated slurry from the iron/arsenic precipitation system will be pumped to the three-stage Counter Current Decantation (CCD) thickener system to remove copper from the slurry as a pregnant solution. This step is required to limit cyanide consumption by copper and to recover soluble copper as a saleable product. The CCD system consists of three thickeners, each equipped with a mix tank to combine slurry and wash liquor prior to feeding the respective thickener. The copper bearing slurry from the iron/arsenic precipitation steps feeds the CCD Thickener 1 mix tank and will be combined with thickener overflow from CCD Thickener 2. The overflow from CCD Thickener 1 is the pregnant copper solution which will be pumped to the copper precipitation system. The slurry from CCD Thickener 1 will be pumped to CCD Thickener 2 mix tank and will be combined with the overflow from CCD Thickener 3. The overflow from CCD Thickener 2 flows to CCD Thickener 1 mix tank by gravity. CCD Thickener 2 underflow will be pumped to CCD Thickener 3 mix tank and combined with barren wash water recycled from the copper precipitation water tank. CCD Thickener 3 overflow flows by gravity to CCD Thickener 2 mix tank. The washed slurry from CDD Thickener 3 underflow will be pumped to the cyanidation system pre-leach tank.
Soluble copper in the CCD pregnant solution will be precipitated as copper sulfide by adding sodium hydrosulfide to the copper precipitation tanks. Copper sulfide sludge from the copper precipitation thickener underflow will also be recycled to the precipitation tanks to promote growth of precipitates and limit scaling in the system. This aids settling of precipitate in the copper precipitate thickener. The overflow from the copper precipitation tanks flows by gravity to the copper precipitate thickener where flocculant will be added to the slurry feed to promote settling. Thickener overflow flows to the copper precipitation water tank for recycle to the CCD thickener system. The majority of the thickened precipitate will be recycled to the copper precipitate tanks as previously stated. Thickened precipitate will also be pumped from the copper precipitation thickener to the copper precipitation filter feed tank by a separate pumping system. Slurry from the filter feed tank will be filtered on a batch basis in a plate and frame filter. Filtrate will be pumped to the copper precipitation water tank for recycle. The filter cake will drop into a concentrate storage bin. It should be noted that the copper sulfide precipitate will be pyrophoric when dried below a certain moisture level (8 to 10% w/w). The storage facility will be equipped with heat and combustion monitoring instrumentation and water spray system to irrigate the stored concentrate while in storage. The concentrate can be shipped by truck and sold to a smelter.
Çöpler Sulfide Expansion Project Feasibility Study
43-101 Technical Report
Page 17-4
The washed slurry from CCD thickener 3 underflow feeds the pre-leach tank where lime will be added raising the slurry pH to about 10.5 prior to cyanide leaching in the three- stage leach tank system. Sodium cyanide will be added to the leach tanks to solubilize gold and a small amount of silver in the feed solids. The leached slurry feeds a six-stage Carbon-in-Pulp (CIP) circuit. In the CIP tanks, the solubilized precious metals load onto carbon that will be mixed with the leached slurry in each tank. Slurry flows continuously from tank to tank through carbon screens which retain the carbon in each tank. Carbon will be advanced counter-current to the slurry flow through the CIP circuit on a batch basis using carbon advance pumps in each tank. Barren carbon will be fed to the last CIP tank. Loaded carbon will be removed from the first CIP tank and pumped to the new ADR plant.
A new ADR facility and refinery will be provided to strip loaded carbon using the AARL strip process to produce a pregnant strip solution feeding an electrowinning system. Electrowinning will be used to recover precious metals from the pregnant strip solution. Electrowinning sludge will be processed in a retort to remove mercury prior to smelting. The new ADR plant and refinery will be equipped with air emissions control equipment to scrub the gas being vented to meet Turkish air emission limits. Stripped carbon will be reactivated using a carbon kiln and reused in the CIP circuit.
CIP tailings will be processed in a cyanide destruction circuit utilizing SO2 /air treatment
technology. The system will reduce the slurry cyanide concentration to meet Turkish discharge regulations. The detoxified slurry will be pumped to the tailings neutralization circuit.
The detoxified CIP tailings will be combined with the copper precipitation solution bleed stream in the neutralization tanks. Milk-of-lime (MOL) will be added to adjust the slurry to a pH of 10.5 and to precipitate manganese and magnesium, stabilizing the slurry. The neutralized slurry flows to the tailings thickener. The thickener underflow will be pumped to the tailings holding tank. The tailings are pumped from the holding tank using positive displacement pumps through the tailings pipeline to the tailings storage facility. Tailings thickener overflow will be pumped to the process water tank for reuse. Any decanted water from the tailings storage facility will be pumped to the process water tank for reuse.
Reagent storage and mixing systems will be provided for the process reagents. Covered reagent storage areas will be provided for reagents requiring protection from the elements.
Utility systems including compressed air, steam generators, and water distribution systems will be provided to service the process systems
A schematic flowsheet of the process is presented in Figure 17-1.
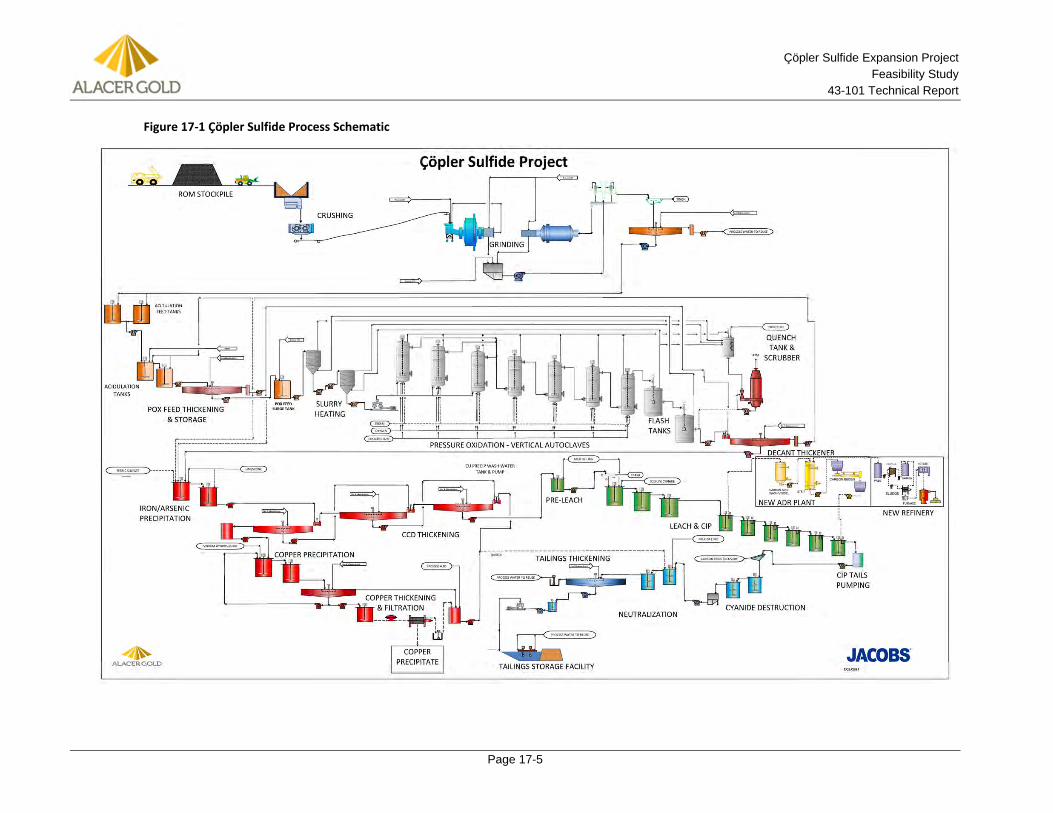
Çöpler Sulfide Expansion Project Feasibility Study
43-101 Technical Report
Page 17-5
Figure 17‐1 Çöpler Sulfide Process Schematic
Çöpler Sulfide Expansion Project Feasibility Study
43-101 Technical Report
Page 18-1
18.0 PROJECT INFRASTRUCTURE
18.1 Introduction The design development of new facilities and/or changes to existing infrastructure in the feasibility phase of the project is discussed in detail in the following sections. The facility infrastructure has been divided into several distinct areas: buildings, water and sewage, bulk fuel storage, power supply, communications, site roads, plant fire protection system, and the plant lighting system.
Structure placement for the process plant facility is based on the best available topographic and geotechnical information provided by Alacer and Golder, respectively. Wherever possible, structures have been placed on native material to minimize the potential of settling. Structures and equipment with low tolerance for settling, such as those associated with crushing, grinding, and pressure oxidation, have been placed entirely on undisturbed ground or in cut areas. Due to layout considerations, buildings with a higher tolerance for settling have been placed in the mine fill areas. These areas will require removal of the mine fill materials and re-compaction to minimize differential settling. While consideration has been made for the existing geotechnical situation, the discovery of other unknown conditions, such as during further geotechnical exploration or construction, could impact the extent of earthwork required in the affected area.
18.2 Plant Site Geotechnical Considerations A geotechnical investigation was completed to support the feasibility level design of the various Sulfide Plant buildings and structures by Golder (Golder, 2014b). Construction of the Sulfide Plant pad for the grinding structures will require the upper portion of the existing laydown area to be excavated to reach proposed grades for the grinding structures. Pads for the oxygen plant, the leach tanks and tailings thickeners will be constructed by cutting and filling to reach finished grade elevations. The western portion of the proposed Sulfide Plant abuts the eastern portion of the Northeast Waste Dump with proposed structures sited over areas where waste rock has been placed. The Northeast Waste Dump has been extended north through Çöpler Creek valley as a valley fill and currently covers the original Çöpler Creek. Mine structures such as the ADR plant, leach tanks, and cyanide neutralization structures encroach on the existing Northeast Waste Dump and will require the excavation of waste rock material. Similarly, the primary crusher structures will encroach on the existing Northeast Waste Dump and will require the excavation of waste rock material.
Native subsurface conditions in the proposed plant site generally consist of conglomerate overlying limestone bedrock. Where the proposed facility layout encroaches upon the existing Northeast Waste Dump, thicknesses of uncontrolled waste rock fill vary up to about 30 m. Proposed facility foundation systems will be constructed to bear on either native conglomerate or limestone bedrock materials or engineered structural fill. The proposed Sulfide Plant and related crushing and grinding facilities are anticipated to be constructed primarily on shallow foundation systems. Where uncontrolled fill materials are encountered, the uncontrolled fill materials will be excavated and removed to native ground and replaced with structural fill. .
Çöpler Sulfide Expansion Project Feasibility Study
43-101 Technical Report
Page 18-2
18.3 Buildings Below is a summary of the existing infrastructure and additional infrastructure to support the Çöpler Sulfide Expansion project.
Existing Infrastructure 18.3.1The existing site infrastructure supporting the existing oxide heap leach operation that may also be used or supplemented to support the Sulfide Expansion project includes the following:
• Site security gate and guard station
• Site administration building
• Site warehouse
• Assay laboratory
• Container or modular type offices
• Cyanide receiving and mixing system
• Site kitchens and eating areas
• Site single living dormitory with adjacent multi-purpose room
• Site family housing
• Contractor (mining) dormitories, kitchens, & offices
• Site potable water treatment and distribution system
• Two sanitary waste water collection and treatment systems
Administration Building 18.3.2No provisions have been made in the Feasibility Study for space or the construction of an administration building. Details on planned office space to support the Sulfide Expansion project are included in Section 18.3.11.
Maintenance Shop (Mechanical and Electrical) 18.3.3A maintenance shop has been included in the POX building. Consideration was given to equipment spacing and some laydowns within the grinding and POX buildings to facilitate equipment maintenance. No additional maintenance facilities to support the rest of the site have been included in the FS scope of work. It is assumed that the existing maintenance facilities are not equipped to support the unique equipment required for the Sulfide facility.
Warehouse 18.3.4The warehouse will be an insulated pre-engineered structure with a size of 70 m long x 42 m wide x 8 m high. The warehouse will also house the change house and lunch rooms. Common to all three areas will be electrical power, lighting (standard and emergency), potable water, plumbing, fire protection and code check. The entire warehouse will have security and will be fenced.
Çöpler Sulfide Expansion Project Feasibility Study
43-101 Technical Report
Page 18-3
Laboratory Facilities 18.3.5Alacer has an existing assay laboratory on site and is currently constructing a new laboratory facility. The new laboratory is designed with space for the additional laboratory equipment that will be required for and purchased through the project for the Sulfide Expansion project. Most major metallurgical samples and composites taken at the sulfide plant will be analyzed or tested in the assay laboratory.
Provisions have been made to include a small laboratory in the POX building (see Section 18.3.8). Metallurgical samples will be prepared and some metallurgical testwork will be completed at this location.
A small laboratory will be placed on top of the leach tanks. This facility will be used to process samples for monitoring and control of the downstream processes and carbon management.
Primary Crushing Control Room 18.3.6The Central Control Room will be housed in the POX Building, but a small remote control room will be located at the primary crusher. The primary crushing control room will be an insulated pre-fabricated building with a size of 2.3 m long x 2 3 m wide x 3 m high. The control room will include the following utilities; HVAC, electrical power, lighting (standard and emergency), and an available communication system. A DCS operator’s station will be located within the primary crushing control room control room.
Grinding Building 18.3.7The grinding building will be an insulated pre-engineered building with a size of 51 m long x 48.5 m wide x 30 m high. The Central Control Room will be housed in the POX Building, but a control room and electrical room will also be located within the grinding building. The grinding building will include the following utilities: electrical power, lighting (standard and emergency), potable water, plumbing, fire protection and an available communication system. A code check will also be performed on the building design during engineering. DCS I/O (Input/Output) cabinets will be located in the control room and electrical room. In addition, a DCS operator station will be included in the control room. The building will be heated and ventilated. HVAC will be provided for the control room and electrical room.
POX Building and Central Control Room 18.3.8The POX building will be an insulated pre-engineered building with a size of 42 m long x 40 m wide x 33.5 m high. A maintenance shop, metallurgical laboratory, electrical room and central control room will be housed within the building. The POX building along with the ancillary rooms will include the following utilities: electrical power, lighting (standard and emergency) and fire protection. A code check will also be performed on the building design during engineering. Ventilation will be provided in the POX building. The maintenance shop will be supplied with heating and ventilation. HVAC will be provided in the metallurgical laboratory, electrical room and central control room. Potable water will be supplied in the main POX building, maintenance shop and metallurgical laboratory. Plumbing will be provided in the maintenance shop and the
Çöpler Sulfide Expansion Project Feasibility Study
43-101 Technical Report
Page 18-4
metallurgical laboratory. Toilet facilities will also be provided in the maintenance shop. DCS I/O cabinets will be installed in the electrical room. DCS engineering station, operator stations and DCS servers will be located in the central control room. The maintenance shop and the metallurgical laboratory will be located on the first floor at the north end of the building. The electrical room will be located on the second floor at the north end of the building. The central control room will be located on the third floor at the north end of the building.
ADR Building 18.3.9The ADR building will be an insulated pre-engineered building with a size of 50 m long x 25 m wide x 15 m high. The ADR building will include the following utilities: heating and ventilation, electrical power, lighting (standard and emergency), potable water, plumbing, toilets, fire protection, an available communication system and furniture. A code check will be performed on the building design during engineering. HVAC will also be provided in the control room.
ADR Refinery 18.3.10The ADR Refinery will be a brick and mortar building with a size of 26 m long x 25 m wide x 15 m high. The building will include a small control room, with CCTV security cameras, metal detector and a guard post. The ADR building will include the following utilities: heating and ventilation, electrical power, lighting (standard and emergency), potable water, plumbing, toilets, fire protection, an available communication system and furniture. A code check will be performed on the building design during engineering.
Office Space 18.3.11Office spaces will be provided in three construction trailers that will become permanent offices for supervisory staff, technical support and for other purposes that are to be determined. Each trailer will be 20 m long x 16 m wide, or 320 m2
each. The office space will include the following utilities: HVAC, electrical power, lighting (standard and emergency), potable water, plumbing, toilets, an available communication system and furniture. A code check will be performed on the building design during engineering.
Electrical Buildings/Power Distribution Centers (PDC) 18.3.12The electrical buildings will be insulated pre-engineered buildings with a size of approximately 30 m long x 10 m wide x 6 m high. The buildings will include the following utilities: HVAC, electrical power (standard and emergency), fire protection, and an available communication system. DCS I/O cabinets will be installed in the building.
Other Buildings 18.3.13Other buildings that are required to support the Sulfide Process Plant facility are listed as follows:
• Additional Gate House
• Reagent Building
• Copper Precipitation Filter Feed Enclosure
Çöpler Sulfide Expansion Project Feasibility Study
43-101 Technical Report
Page 18-5
• POX Steam Boiler Enclosure
• Leach Tank Laboratory Enclosure
• Oxygen Plant Area
• Oxygen Plant Boiler Enclosure
• Limestone Preparation Building
• Limestone Cyclone Enclosure
• Tailings Booster Pumphouse
• Compressor Building
• Water Pumphouse
• Truck Shop
• Explosives Housing
18.4 Water and Sewage Fresh Water Supply 18.4.1Fresh water is being supplied by existing wells to the site at a rate of 100 liters per second supporting the existing oxide heap leach operation. Additional wells will be provided by the Owner to support the requirements of the combined existing oxide heap leach and new sulfide resource processing facility. The site is currently serviced by three fresh water wells. Two of these wells were installed in 2013 to replace a well inundated by the new lake created by the new dam south of the Çöpler site.
A new raw water storage tank will be constructed and tied into the existing raw water tank. The changes to the raw water system will support the demands of the new sulfide process equipment and the fire water requirements. The system will continue to support the existing oxide heap leach operation while protecting the new sulfide processing facilities.
Potable Water Treatment 18.4.2The site is currently serviced by a potable water treatment system and distribution system. The system consists of multi-media filtration, carbon filtration, softening, and a reverse osmosis system which directly feeds the existing site potable water distribution system with no intermediate storage tank.
The existing potable water system will be modified with the addition of a new potable water treatment system, similar to the existing system. The new system will support the demands of the new sulfide processing facilities and have an additional new potable water storage tank. This tank will receive the combined treated water flow from the new and existing treatment systems. The new water tank will deliver treated water to the existing potable water distribution system and to the new distribution system for the new Sulfide Project facilities.
Çöpler Sulfide Expansion Project Feasibility Study
43-101 Technical Report
Page 18-6
Waste Management 18.4.3Waste will be generated from multiple sources; human waste, food spoilage, and process and maintenance wastes.
A new sanitary waste water collection and treatment system will be provided to support the new sulfide processing facilities. The existing sanitary waste water system will not be modified or connected to the new system supporting the sulfide processing facilities.
Hazardous wastes will be contained, packaged and disposed of in accordance with local, regional and national regulations. Non-hazardous wastes will either be buried on site or transported offsite to the appropriate processing site in accordance with local, regional, and national regulations. Any offsite disposal of waste materials will be provided by the Owner.
18.5 Bulk Fuel Storage No provisions have been made in the Feasibility Study for space or the construction of an additional bulk fuel storage area to support light vehicle fueling. The existing light vehicle fueling station will be used to support the Sulfide Plant operations in addition to the existing heap leach operation.
New bulk fuel storage will be provided for the steam generators associated with the new sulfide processing plant. One 500 gallon fuel storage tank will be located at the POX Building and another 500 gallon fuel storage tank will be located at the new oxygen plant to support the associated steam generators.
18.6 Power to Site The existing 154 kV line will provide power to the mine extension and is assumed to have enough capacity for the additional power requirements.
The following structures are associated with site power distribution:
• Main Area Substation
• Oxygen Plant Substation
• CCD Electrical Building
18.7 Emergency Backup Power Motors and loads for certain critical equipment and systems were identified as requiring power in the event of a utility outage. Generator buses were separated and designed with automatic transfer switches to automatically switch to generator power in the event of a utility outage.
Generators are estimated as diesel type with a minimum of 12 hours of diesel storage based on generators being fully loaded.
18.8 Communications The project requires networks for the DCS, the process related CCTV system, security systems (including a dedicated security CCTV system), and communication between the DCS and equipment supplier control systems.
Çöpler Sulfide Expansion Project Feasibility Study
43-101 Technical Report
Page 18-7
The project is providing all networking hardware and cabling for these networks.
Multi-Mode (MM) fiber is dropped at the listed locations. Copper cabling is provided within the following locations:
Single Mode (SM) fiber is provided between the tailing ponds and the main plant area. Drops are provided at the Electrical Building/Power Distribution Center (PDC), at the tailings pipeline drain valves location, and at the tailings pond electrical room.
18.9 Site Roads The Sulfide Expansion Project will have access provided via the existing main access road and newly constructed sulfide plant roads. A site Road Plan will be developed during detailed design and will require detailed information and cooperation from site personnel.
Newly constructed roads for the Sulfide Plant Expansion Project will be integrated into the existing road infrastructure where practical.
Generally, site roads will have an overall width of either 8m or 4m and will provide everyday operational access for large trucks or facility access for site personnel vehicles, respectively. These roads have been classified as either plant roads (i.e. 8 m wide) or personnel roads (i.e. 4 m wide) and are limited to a maximum grade of 8%. All roads are to be surfaced with 300 mm of crushed gravel and cross-sloped to provide positive drainage.
18.10 Plant Fire Protection System A separate plant fire protection system will be provided for the sulfide facility. The fresh water storage tank will serve as the fire water storage as well as fresh water to the process. The fresh water storage tank is currently 22 m diameter x 22.6 m tall.
18.11 Plant Lighting System Lighting levels will be designed to meet IES standards. Estimates included exterior lighting, building lighting, and interior building lighting. Fixtures selected will be of the energy-efficient type.
18.12 Tailings Storage Facility The TSF for the Sulfide Project has been designed to provide capacity for the disposal of 36.7 Mt of mill tailings in a fully lined tailings impoundment over an approximate 18-year mine life. Approximately 5,796 tpd of tailings will be pumped at a slurry density of 37% by weight from the cyanide detoxification and arsenic removal unit to the TSF.
The Sulfide Project has planned nominal ore feed to the mill of 5,000 tpd. The current refining process and tailing deposition methods are expected to yield average end-of-filling tailings density of approximately 1.02t/m3.
Primary Crushing Limestone Preparation Oxygen PlantGrinding Thickener Warehouse CCD ThickenersGrinding Building Compressor Building Tailings ThickenerPOX Building Leach Tank Lab Copper PrecipitationPOX Thickener Reverse Osmosis Unit Electrical BuildingsDecant Thickener ADR Building
Çöpler Sulfide Expansion Project Feasibility Study
43-101 Technical Report
Page 18-8
The current Golder TSF design utilizes the same general design concept as that developed by Tetra Tech in 2007 and which was included in the Pre-Feasibility Study by Samuel Engineering (Samuel, 2011). The TSF design includes an earth and rockfill embankment with downstream raise construction, an impoundment underdrain system, a composite liner system, and an overdrain system. A discussion on the site selection process and descriptions of the design components are included in the following sections.
Site Selection 18.12.1A TSF Siting Study was conducted to determine the optimal location for the TSF. The site selection consisted of a multiple criteria decision evaluation process conducted on 12 sites identified as potentially viable for development the TSF for the Sulfide Project. The Siting Study (Golder, 2013c) was completed by Golder with input from Jacobs and Alacer staff in Denver and Ankara. Potentially viable sites for TSF development were identified, evaluated, and ranked for a number of environmental, social, technical, and economic considerations.
The TSF Siting Study resulted in the selection of TSF Site 1 as the preferred site for TSF development.
TSF Geology 18.12.2The TSF site geology was mapped by Sial in 2005 and 2007 and by Fugro-Sial in 2012. Golder visited the site in September 2012, reviewed the geologic mapping and site conditions and verified and/or modified the geologic contacts identified by previous mapping efforts.
In general, the bedrock units in the Çöpler district range in age from Permian to late Cretaceous (250 to 60 million years ago) and include limestone, basic and ultrabasic rocks associated with abducted ocean floor (ophiolite suite) and other metasedimentary units. During the Late Cretaceous and early Tertiary Periods these basement rocks were intruded by granodiorites and associated volcanic units. The hydrothermal mineralization throughout the district (Marek et al, 2008) probably occurred during this phase of intrusion. Key units within the footprint of the proposed TSF are:
• Munzur Limestone - Gray to blue-gray, very strong and unweathered. Much of the limestone unit shows karstic development. Bedding within the unit is indistinct to massive.
• Ophiolitic mélange - Ophiolitic mélange consists of diabase and serpentinite units.
o Diabase (Dolerite) – Diabase (Dolerite) is located within the upper zone of the ophiolitic mélange sequence. The rock mass consists of green to greenish black, fresh to slightly weathered and strong to very strong rock strength properties. It usually includes very close to close joint spacing. In general, joint surfaces are covered with calcite and iron oxide infill. In places, the rock mass shows a blocky-texture embedded in a fine matrix.
o Serpentinite - This unit is characterized by a bluish green and light green color, is weak to medium strong and is usually argillic. The rock
Çöpler Sulfide Expansion Project Feasibility Study
43-101 Technical Report
Page 18-9
mass consists of very close to closely spaced clay-filled discontinuities.
• Granodiorite - The granodiorite intrusion appears to have followed the thrust zone developed between Munzur limestone and Ophiolitic mélange. The rock mass, in its fresh state, is light brown, orange-brown and gray to pale green granodiorite and consists of closely to widely spaced discontinuities and medium strong to strong rock strength properties. In general, joints display short persistence (1-3 m) and smooth planar surfaces as well as undulating surfaces. Most joint surfaces are filled with calcite and iron oxide sealing (Fugro-Sial, 2012). Much of the unit within the proposed TSF area is moderately to completely weathered (depth of weathering varies), appearing and behaving more like a soil.
• Skarn – The skarn zone is developed along the granodiorite contact with the limestone and ophiolitic mélange. This zone was probably developed under high pressure and temperature conditions during the intrusion of the granodiorite at depth. Skarn rocks are black to dark brown, silicified, very strong, and moderately weathered and locally include solution cavities.
• Based on the field mapping, the embankment footprints for the proposed TSF will be founded predominantly on excavations within the following materials: Primarily Munzur Limestone, granodiorite, and diabase with limited areas of skarn and serpentinite.
The extent, orientation and strength of the serpentinite unit is of special interest, because serpentinite often displays low strength properties that may have a significant impact on embankment stability and deformation under static and earthquake loading conditions.
The character of the foundation conditions outside of the limits of the area initially investigated by Tetra Tech in 2007 was evaluated by Golder using field reconnaissance, geophysical surveys, and geologic mapping performed by Fugro Sial. Additional geotechnical site investigation (i.e., drilling and test pit excavation) was not performed in the expanded footprint of the TSF due to lack of approval for intrusive activity as required by Turkish regulatory authorities. The appropriate permits have now been received by Alacer and the additional geotechnical investigations should be completed as an early task as part of detailed engineering.
The detailed geotechnical site investigation must be completed to confirm assumptions used in the design, as documented in the design criteria. Analyses dependent on these assumptions include stability, seismic deformation, seepage, and settlement of the TSF embankment and foundation. Special attention should be paid to locating and characterizing the geologic materials with the greatest potential to impact stability and deformation of the TSF embankment structures and the impoundment liner system. The units of most concern are the serpentinite unit, which has limited expression at the TSF site and the limestone unit, which must be evaluated for karst openings.
Çöpler Sulfide Expansion Project Feasibility Study
43-101 Technical Report
Page 18-10
Ziyaret Tepe Fault Hazard Evaluation 18.12.3Golder completed office- and field-based investigations along about 20 km of the Ziyaret Tepe fault (ZTF) to the north and south of the proposed TSF site in November 2012 and documented the investigations as part of the TSF Feasibility Design Report (Golder, 2014d). The ZTF is a north-northwest striking fault with a trace located less than 1 km from the proposed TSF site. Golder’s investigations of the ZTF build upon the field studies of the ZTF reported by SIAL in June 2005.
Interpretations of the office and field data provide evidence for the existence of faulted and folded bedrock and basin infill units exposed within the ZTF zone. Extension of the mapped ZTF trace north-northwest across the Karasu River, however, shows that surface traces are absent on the surface of a major Late Pleistocene aggradation terrace surface that is well preserved about 30 m above the active Karasu River channel. Furthermore, the down-valley profile of this Late Pleistocene terrace surface is not deflected where it intersects the northward extension of the ZTF. These observations indicate that there is no evidence for surface rupture along this part of the ZTF during the Holocene Epoch (last 10,000 years) and at least during latest Pleistocene time (last ca 20,000 years). Thus, the ZTF is either seismically inactive or has a very low average slip rate during the Late Quaternary Epoch (last 130,000 years). Accordingly, Golder considers that the ZTF is unlikely to generate large earthquakes and/or surface fault rupture along the 20 km of surface trace examined. Seismic analysis and design of the TSF site need not consider earthquake and related hazards associated with the ZTF.
18.13 Tailings Storage Facility Design TSF Description and Design Criteria 18.13.1Site-specific design criteria for the Çöpler TSF are summarized and were developed based on the following agency publications:
• World Bank Standard Guidelines
• International Committee on large Dams (ICOLD) – Various Bulletins
• Canadian Dam Association – Dam Safety Guidelines, 2007
• The Mining Association of Canada – A Guide to the Management of Tailings Facilities, September 1998.
• Turkish General Directorate of State Hydraulic Works (DSI), Dam Construction and Technical Specification Guidelines, December 2011
The engineering design intent was to assure that the facility design adheres to the design criteria set forth at the onset of the work. General design criteria for the Çöpler TSF are summarized as follows:
• The tailings embankment shall be physically and chemically stable, and shall not impose an unacceptable risk to public health and safety or the environment
• The facility is classified in accordance with ICOLD guidance as Large-High (size and hazard classification) for the operational phase and post-closure phases
Çöpler Sulfide Expansion Project Feasibility Study
43-101 Technical Report
Page 18-11
• The tailings impoundment shall provide sufficient containment of contaminants to result in compliance with environmental standards
• All impoundment effluents will be restricted to the drainage basin in which the TSF resides, and
• Post closure ancillary facilities shall be decommissioned so as to not pose an unacceptable risk to public health and safety or the environment.
Specific engineering design criteria are presented in the TSF Feasibility Design Report (Golder, 2014d). SRK performed geochemical testing in order to determine the waste classification of the expected tailings stream. The SRK report includes the measured concentrations of various metals and non-metals, as well as other parameters such as pH, total dissolved solids (TDS), total organic carbon, and others. SRK determined that most of the parameters tested were within the limits of “inert” (Class-III) waste, the lowest risk category according to Turkish regulations. However, sulfate and TDS concentrations were higher, resulting in a classification of “non-hazardous” (Class-II). The liner system design for the TSF has therefore been developed based on the requirements for Class-II waste.
The planned TSF consists of a fully lined impoundment constructed in phases with a compacted earth and rock fill embankment. Phased development will include a starter facility plus three subsequent phases in the valley defining the TSF area. The TSF design includes the following primary components:
• Phased compacted earth and rock fill tailings embankment
• Composite geomembrane-low permeability soil liner system
• Two-layer granular filter protection system for embankment
• Impoundment gravity flow underdrain system and collection pond
• Impoundment gravity flow overdrain system, collection pond, and seepage return system
• Tailings distribution pipe system
• Liner protection components, including a geocomposite overlying the geomembrane, gravel filled geoweb (select locations), sediment basins, and temporary storm water diversions
• Water pool access road for access to barge pumping station
• Perimeter roads and benches within and around the impoundment area for access and tailings distribution/reclaim water pipes
The earth and rockfill embankment includes a residual freeboard allowance of 1.0 m minimum in addition to storage above each phased tailings impoundment level to contain a PMP event; plus additional storage for the maximum operational pool volume predicted by the probabilistic TSF water balance, assuming no upstream diversion.
The fully-lined tailings impoundment includes an underdrain system, composite geomembrane and low-permeability soil liner, overdrain system, and a water pool access road for reclaim water operations.
Çöpler Sulfide Expansion Project Feasibility Study
43-101 Technical Report
Page 18-12
Embankment Type Selection and Design 18.13.2The tailings facility is designed to contain the deposited tailings within a fully lined impoundment located behind an engineered compacted earth and rockfill embankment. A detailed description of the facility is contained in Golder’s TSF Feasibility Design Report.
The type of embankment chosen for the TSF was based on considerations related to anticipated performance of the system in various areas, including earthquake resistance, environmental performance, ease of closure, ease of construction given the site conditions, and relative cost. For the Çöpler TSF, the earthquake resistance was deemed the most critical factor because the facility is located in a high-seismicity region and failure of the embankment resulting from earthquake loading would likely result in either temporary or permanent mine shutdown.
Accordingly, the design of the TSF includes a rockfill embankment with downstream raises to provide protection from the high seismicity in the region. The TSF design included an assessment of the slope stability under earthquake, or dynamic loading conditions, and assessed the TSF performance under the Operating Basis Earthquake (OBE) and the Maximum Design Earthquake (MDE). The OBE considered an earthquake with magnitude M7.0 or a 10% probability of exceedance in 50 years (e.g., the 475-yr event) and resulted in peak ground acceleration (PGA) of 0.30 g. The MDE considered an earthquake with magnitude M7.5 or a 2% probability of exceedance in 50 years (e.g., the 2,475-yr event) and resulted in a PGA of 0.53 g.
The embankment is designed as an earthfill/rockfill structure with a composite geomembrane-soil lined upstream embankment face, and appropriate filter and transition zones to provide containment integrity. The embankment will be constructed in phases, in the downstream direction, using high strength compacted rock fill materials in the structural zone for embankment slope stability. The geomembrane-low permeability soil liner will be placed in the upstream section for seepage control with two filter zones to provide transition from the upstream low permeability soil fill to the downstream rock fill section. The Phase 1 (starter facility) and ultimate tailings embankment sections and embankment configuration for the TSF, and fill descriptions are provided in the Golder TSF Feasibility Design Report. The Starter (TSF Phase 1) and Ultimate Embankment and TSF Impoundment Grading Plans are shown in Figure 18-1 and Figure 18-2, respectively. Selected cross sections through the embankment and impoundment are shown in Figure 18-3.
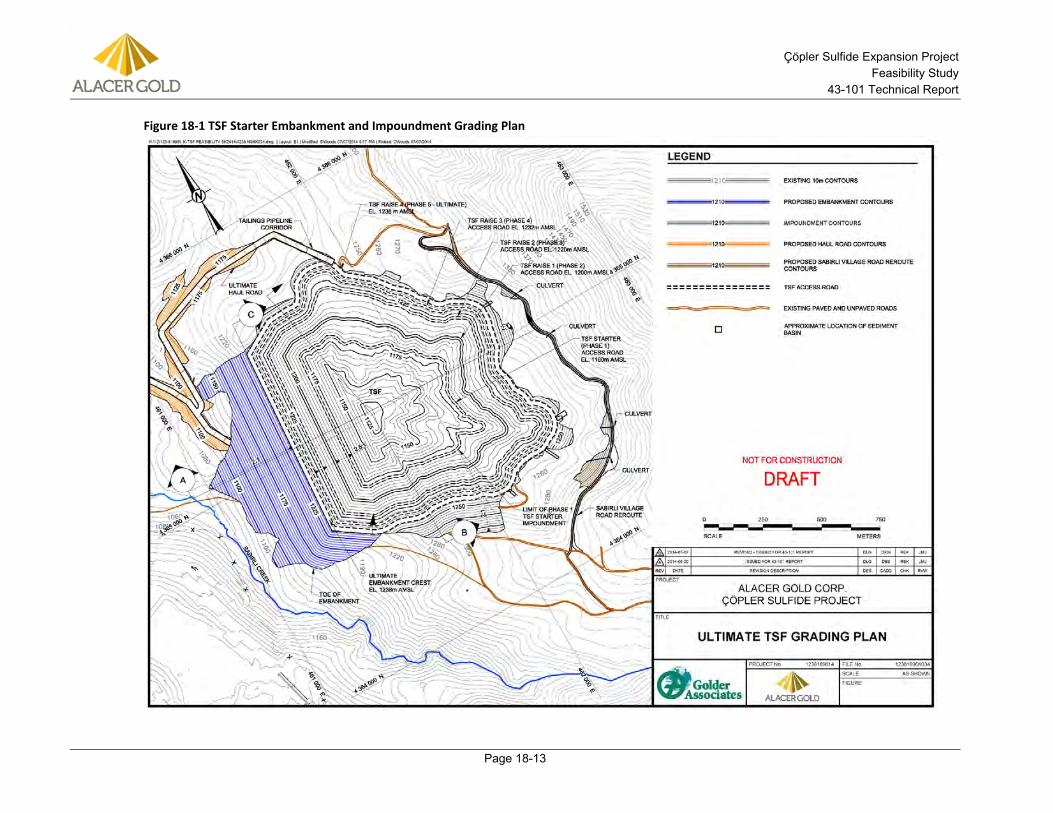
Çöpler Sulfide Expansion Project Feasibility Study
43-101 Technical Report
Page 18-13
Figure 18-1 TSF Starter Embankment and Impoundment Grading Plan
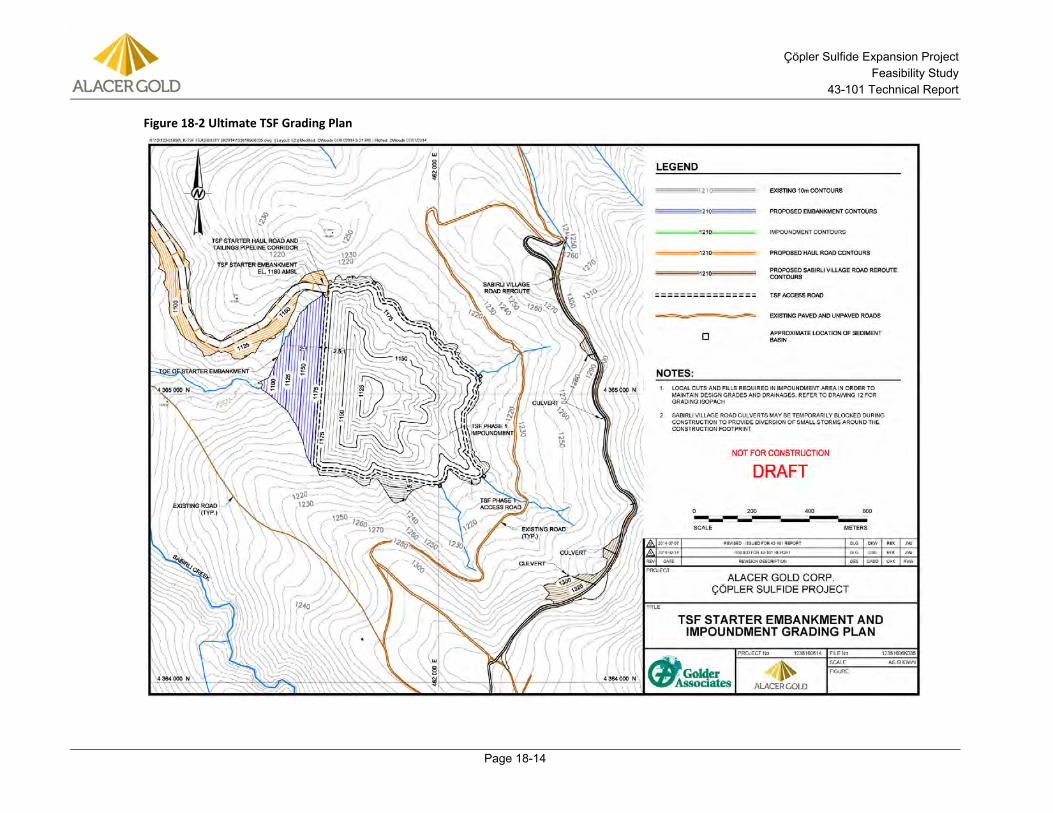
Çöpler Sulfide Expansion Project Feasibility Study
43-101 Technical Report
Page 18-14
Figure 18-2 Ultimate TSF Grading Plan
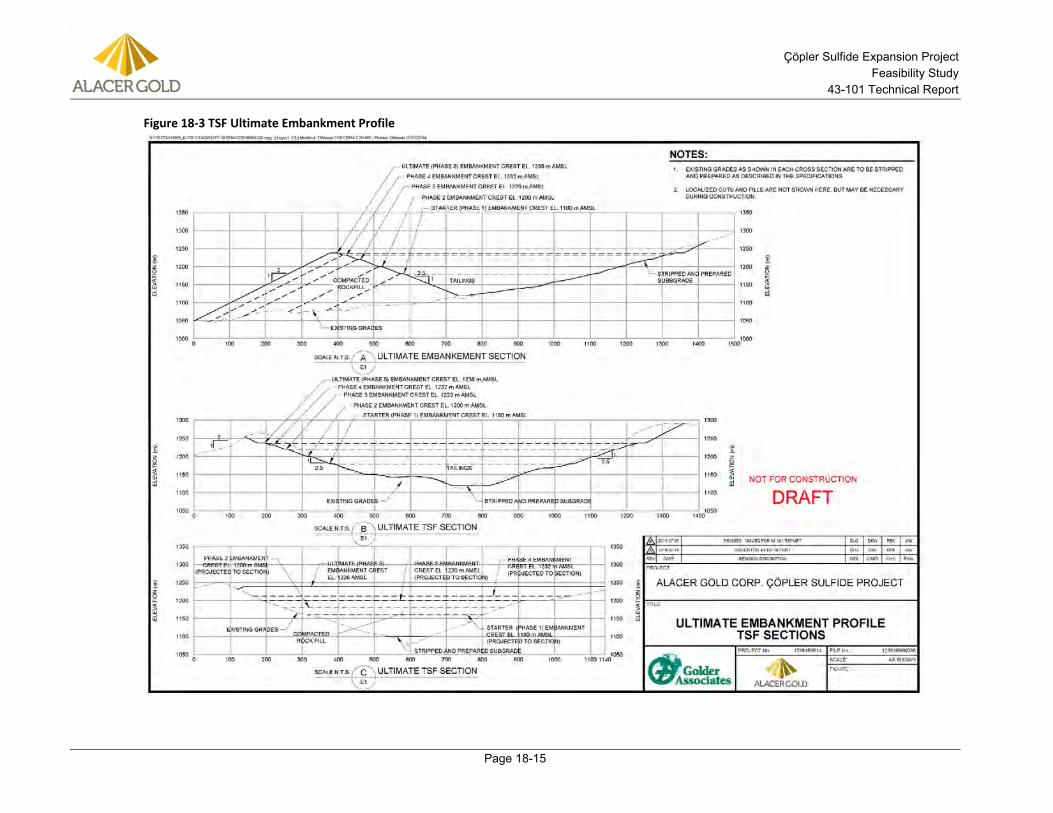
Çöpler Sulfide Expansion Project Feasibility Study
43-101 Technical Report
Page 18-15
Figure 18-3 TSF Ultimate Embankment Profile
Çöpler Sulfide Expansion Project Feasibility Study
43-101 Technical Report
Page 18-16
Impoundment Underdrain System 18.13.3The tailings impoundment underdrains will be constructed in phases and allow natural drainage beneath the lined facility to be routed downstream of the tailings embankment and impoundment limits to a collection pond. The system allows the underdrain flows to be monitored, and then flow by gravity to the downstream natural drainage assuming water quality is acceptable. Once flows reach the seepage collection pond, discharge can be directed downstream to natural drainages, or to a storage tank for reclaim to the impoundment, depending on operational requirements and results of water quality monitoring.
Composite Liner System 18.13.4The selected composite liner system (clay/geomembrane) consists of a minimum 50 cm of low-permeability (1 x 10⁻⁸ m/sec) compacted soil liner and 45mil (1.15 mm) reinforced polypropylene (RPP) geomembrane liner barrier for containment of seepage from the tailings. The selected composite liner system provides for better protection than the regulatory prescribed liner system of at least 1 m of low-permeability (1 x 10⁻⁹ m/sec) soil liner based on a comparison of seepage rates through a composite liner compared to the prescriptive compacted clay liner system.
The soil materials for the low-permeability soil liner component will be obtained from the existing clay borrow source located north of the TSF and from overburden within the Sulfide Pit boundaries. The total amount of clay required for construction of the ultimate TSF is 699,347 m3. Approximately 700,000 m3 had been determined to be available from the existing clay borrow source based on initial site investigations by SIAL (2007) considering a 2 m material depth.
Impoundment Overdrain System 18.13.5The overdrain dewatering system, which is to be operated during active deposition, minimizes hydraulic head on the impoundment liner system and accelerates consolidation of the overlying tailings mass. Accelerating consolidation allows for higher tailings density and storage within the TSF, while lowering hydraulic head will reduce the seepage rate through any potential defects in the liner system. The water collected by the overdrain system is generated by consolidation of the overlying tailings. Initially, water collected by the overdrain system will be primarily from pooled water within the impoundment, then liquids from tailings slurry during startup, followed by a combination of tailings consolidation water from settled tailings and inflow to the drains from the portion of the tailings pool laying directly over the liner system.
The overdrain system above the geomembrane consists of a continuous layer of geocomposite drainage material, which will collect and convey water from the consolidating tailings to perforated pipes located in the base of drainage inverts. The pipes will convey fluids to a collection sump located at the upstream toe of the embankment which then drains by gravity in a geomembrane lined, gravel-filled trench beneath the embankment to a common sump located adjacent to the underdrain sump at the downstream side of the impoundment which then drains by gravity to a seepage collection pond location within the clay borrow area. The seepage collection pond was sized to contain 24-hours of drain-down fluids based on the maximum flow rate of 1500 m3/day and is designed to hold 1500
Çöpler Sulfide Expansion Project Feasibility Study
43-101 Technical Report
Page 18-17
m3. Collected fluids will be pumped back to the process water tank for reuse in the sulfide process plant.
In addition to the protection provided by the geocomposite layer, an aggregate filled geoweb system will be constructed over the liner system along the perimeter road at designated drainage areas to provide protection from run-on flows and potential debris. Sediment basins will be constructed within these designated drainage areas immediately upgradient of the TSF perimeter road. The basins will serve to capture sediment and debris, in addition to providing some energy dissipation of storm water run-on during larger storm events. Riprap or other bank protection will be placed within the sediment basins, which have been designed to manage the 10-year, 24-hour storm event.
Seepage Analyses 18.13.6A steady state seepage analysis was performed to estimate, through finite element computer modeling, the location of the phreatic surface and the magnitude of pore pressures developed through the embankment and foundation materials during Phase 1 and after construction of the ultimate TSF configuration. Results of the model indicate that the composite liner system, granular filters, and drainage systems will effectively reduce seepage through the liner system and provide effective drainage for any seepage through the liner system. The composite liner, filter, and drain systems will effectively limit phreatic water in the embankment’s structural shell, thereby decreasing potential for environmental impacts and increasing the geotechnical stability of the TSF embankments.
Stability Analyses 18.13.7Results of the seismic hazard analyses and seepage analyses were used to develop input to the slope stability analyses performed for the proposed embankment configuration. Limit equilibrium slope stability analyses were performed to ensure that that the embankment will remain stable under both static and dynamic (earthquake) loading conditions during both normal operations and after closure. Static slope stability analyses of the Phase 1 (starter) and ultimate embankments for the TSF indicate adequate factors of safety against slope instability under static conditions.
Pseudo-static analyses were performed using the method proposed by Hynes and Franklin (1984) for evaluating embankment response under seismic loading. The analyses indicate that the embankments will experience only minor displacements when subjected to the operational base earthquake (OBE – 1 in 475-yr event). However, the analyses indicate that some movement or deformation of the embankment may occur under the maximum design earthquake (MDE – 1 in 2,475-yr event). Therefore, in order to more accurately assess the deformation potential, dynamic deformation analyses were performed using a variety of simplified methods (i.e., Makdisi and Seed, Newmark and others) and state-of-the-art finite difference models (i.e., FLAC).
The results from the simplified Makdisi and Seed analysis indicate that the ultimate embankments may experience permanent crest displacements of approximately 1.4 m during the MDE.
Additional dynamic stability of the TSF was evaluated using the following methods: Swaisgood (2003), and SHAKE2000/Newmark displacement analysis.
Çöpler Sulfide Expansion Project Feasibility Study
43-101 Technical Report
Page 18-18
Results from the methods were compared to the results of the Makdisi and Seed analysis. In addition, state-of-the-art finite difference models using the two-dimensional program, FLAC 7.0 were utilized.
Of the various methods used to calculate TSF embankment crest deflections, the FLAC results are considered most accurate due to the increased number of site-specific variables considered and the increased rigor of the methods used. The average FLAC crest displacement, 0.08 m, is considered acceptable, as there will still be 0.92 m of residual freeboard remaining, meaning that no tailings will be released during the MDE seismic event. See Table 18-1 for the displacement results for different dynamic stability methods.
Table 18-1 Displacement results from different methods
Embankment and Foundation Settlement 18.13.8Settlements of the earth and rockfill embankments are expected to be minimal and to occur predominantly during construction. Based on geologic mapping and results of the site investigation and laboratory test results from the original Tetra Tech design report for TSF, the TSF embankment is expected to be founded on primarily hard rock (Munzur limestone, granodiorite, or serpentinite). Due to the lack of significant clay zones, there should be little time-dependent settlement (i.e., consolidation or creep). Therefore, because settlements will occur during construction, there should be no significant impact on embankment crest height.
Tailings Impoundment and Consolidation Settlement 18.13.9Settlement of the tailings within the TSF impoundment was estimated using one-dimensional large-strain consolidation modeling. This analysis was conducted using a series of increasing areas of one dimensional column to simulate the average tailings production rate of 5,796 tpd. Results of column settling and flume deposition testing indicate that the whole tailings behave as a non-segregating material; therefore the tailings consolidation properties remain constant across the entire impoundment.
The results of the consolidation model indicate that the average tailings dry density will increase over time, reaching approximately 1.02 t/m3 at the end of filling. Using the densities calculated using the consolidation model and the top of tailing surfaces developed in the deposition model, the starter TSF (Phase 1) with an embankment crest elevation of 1180 m will have a storage capacity of 4.2 Mt. Phase 2 with a raise to 1200 m will have a storage capacity 11.2 Mt. Phase 3, with a crest elevation of 1220 m will have a storage capacity of 22.6 Mt. The Phase 4 TSF will have a 31.9 Mt storage capacity with a crest elevation of 1232 m. The Phase 5 ultimate TSF will have a 36.7 Mt storage capacity with a crest
Crest Displacement
(m)
Base Displacement
(m)Makdisi and Seed (1978) 1.35 0.13SHAKE2000/Newmark 0.24 -Swaisgood (2003) 0.9 -FLAC 7.0 0.08 0.12
Method
TSF Ultimate Design
Çöpler Sulfide Expansion Project Feasibility Study
43-101 Technical Report
Page 18-19
elevation of 1238 m. Additionally, the model indicates that complete settlement of the tailings will be a slow process with up to 30 years to reach steady state and settlements on the order 19 m realized within the deepest portions of the TSF.
These findings are in sharp contrast with previous studies, i.e. Tetra Tech (2007a, 2007b) which tested a coarser tailings grind from an oxide processing circuit. The oxide tailings had a P80 of 140 µm and classified as SM (silty sand) based on the Unified Soil Classification System (USCS), whereas the sulfide tailings is expected to have a P80 ranging from 35 to 88 µm and classified as ML (silt) or MH (elastic silt) under the USCS. In addition, at solids content of approximately 40%, the POX treated sulfide tailings appear to have a paste consistency rather than the segregating slurry behavior expected from typical hard rock tailings. As a result, the sulfide tailings settle more slowly, release less water and require more time to consolidate than the oxide tailings.
Consideration will need to be given with respect to closure and the time required to construct the closure cover for the TSF considering the length of time required for complete consolidation of the tailings.
18.14 Project Water Balance and Management TSF Water Balance 18.14.1The operational approach to storm run-off management is to maintain adequate storage within the impoundment to store the run-off from the Probable Maximum Precipitation (PMP) event plus maximum operational water volumes as predicted by the probabilistic TSF water balance, and gradually incorporate the accumulated volume into the facility water balance through recycle to the plant. The water balance and design criteria for the TSF have considered the PMP rather than the 100-year, 24-hour storm event due to the higher potential risk of the TSF and the long term permanent nature of tailings storage within the TSF.
The project design criteria require the tailings embankment to be constructed such that a residual freeboard allowance of 1.0 m minimum is maintained at all times. The design criteria also require additional freeboard be maintained as necessary in order to contain the PMP event plus the 95th percentile of the annual maximum operational water volume as predicted by the probabilistic TSF water balance, assuming no upstream diversion without encroaching on the minimum design freeboard. The PMP event was determined to be 302 mm of precipitation within 24 hours. The volume of water reporting to the TSF varies over the life of the facility, ranging from 483,247 m3 to 626,564 m3 of run-on to the TSF for the starter and ultimate TSF configurations, respectively. The 95th percentile of the maximum annual operational pool volume predicted by the TSF water balance is 109,000 m3, resulting in a total required storm water storage volume of 592,247 m3 and 735,564 m3 for the starter and ultimate TSF configurations, respectively (plus design freeboard).
Golder estimates the average beach slope of the tailings will be approximately 1%. Given this slope, the operational pool plus the entire volume of storm water produced by the PMP can be stored within the pool area (i.e., the conical depression in the center or rear of the TSF created by the 1% beach slope) for Phases 2 through 5. For the starter facility, a freeboard of 2.5m (i.e. maximum tailings elevation of 1177.5 m) should be maintained during operations in order to
Çöpler Sulfide Expansion Project Feasibility Study
43-101 Technical Report
Page 18-20
allow sufficient contingency storage for the PMP event. A flatter beach slope is also possible, depending on deposition energy and slope re-adjustments due to static liquefaction induced by the rapid rate-of-rise (ROR) of the tailings surface. In any event, phased development and operational management of the TSF requires that the operator maintain a design freeboard of 1.0 m plus additional volume as required to contain the design event at all times during the life of the TSF.
The tailings supernatant water pool will be maintained away from the crest of the tailings embankment during normal operating conditions. The tailings impoundment water pool, formed on the settled tailings slurry surface away from the peripheral discharge points, will be directed toward the constructed water pool access road locations in the eastern portion of the impoundments.
Access roads will be constructed on the liner to accommodate maintenance and periodic moving of the mobile pump and floating barge intake pumping operations. All roads constructed over lined areas will utilize sufficient thickness of road base material such that traffic loads will not cause damage to the geocomposite drainage layer or liner systems.
Tailings Slurry Delivery and Reclaim Water 18.14.2Tailings will be deposited in the facility via a slurry delivery pipeline system. Slurry deposition will take place throughout the year from multiple points along the embankment crest and around the impoundment perimeter. A rotational deposition plan is required to maintain the supernatant pool in the planned area of the impoundment and will result in thin lift tailings deposition. Tailings solids from the slurry will settle along the beach and free water will drain to the supernatant pool. Additionally, water seeping upwards from the consolidating tailings will flow by gravity to the process water pool. A reclaim water system will consist of a barge pumping station and a return water pipeline discharging at the mill. Slurry discharge from the spigots will be used to create an above water sub-aerial beach from which tailings will drain and consolidate. The discharge points may vary and include additional discharge points, as needed, to establish peripheral deposition and tailings beach development to the water pool in the eastern impoundment areas.
18.15 Construction Schedule A preliminary construction schedule has been developed assuming approval of the EIA and start of construction in the second quarter of 2015. The initial construction effort will include clearing of vegetation, foundation preparation, installation of underdrains, and construction of perimeter access roads and the haul road from the east end of the existing south waste dump. Construction of the initial haul road to the TSF is anticipated to take 4-6 months to complete beginning in the second quarter of 2015. Construction of the embankment for the starter TSF embankment will be initiated in the second quarter of 2015 and is estimated to take approximately 12-16 months to complete including placement and compaction of the embankment rockfill and coarse and fine filter materials. Construction of the composite liner system and overdrain system may occur in two construction seasons in 2016 and 2017, with portions of the low permeable liner within the impoundment constructed in 2016 with the remainder constructed in 2017. The geosynthetic liner system will likely be constructed in 2017. Similarly, construction

Çöpler Sulfide Expansion Project Feasibility Study
43-101 Technical Report
Page 18-21
of the tailings pipeline corridor is expected to occur in 2017. Planned start-up and commissioning of the Sulfide Expansion Project is between 4Q2017 and 1Q2018, Optimization of the construction schedule should be further evaluated during detailed design and discussions with qualified contractors initiated as part of the construction planning and sequencing.
Construction of the Sabırlı Village road realignment may be deferred until Phase 3 in 2022.
Çöpler Sulfide Expansion Project Feasibility Study
43-101 Technical Report
Page 19-1
19.0 MARKET STUDIES AND CONTRACTS The markets for copper precipitate, silver and gold doré are international and generally robust but variable, depending on supply and demand marketing aspects.
Currently 50% of the gold and silver from the Çöpler oxide heap leach operation is delivered to Johnson Matthey in Canada. The other 50% is delivered to the Istanbul Gold refinery. Sales of gold recovered from the sulfide process plant will likely be similar to the current arrangement for gold doré.
The copper product from the Çöpler Project will likely be marketed in Europe or Asia.
19.1 Copper Marketing Study Scope of Work 19.1.1Jacobs performed a copper marketing study in 2012.
The purpose of this study was to evaluate the marketability of copper precipitate produced from the proposed Çöpler Sulfide Project and to develop an understanding of the likely terms of sales for the product. The detailed report for the copper marketing study can be found in the Çöpler Sulfide Expansion Project Definitive Feasibility Report (Jacobs, 2014a).
The study scope of work is summarized as follows: • Review existing data on the Copper Precipitate circuit from the current
Feasibility Study on Sulfide milling.
• Review and analyze the Hazen pilot plant data on the composition of the copper precipitate.
• Determine possible locations where the copper precipitate might possibly be sold or processed.
• Assess the potential to sell the product to a broker or smelter and investigate the likely terms and conditions for product sales.
Copper Precipitate Analysis 19.1.2Hazen completed testwork for the Sulfide project which included copper precipitate production. Highlights of the chemical/elemental analysis for the precipitate are shown in Table 19-1.
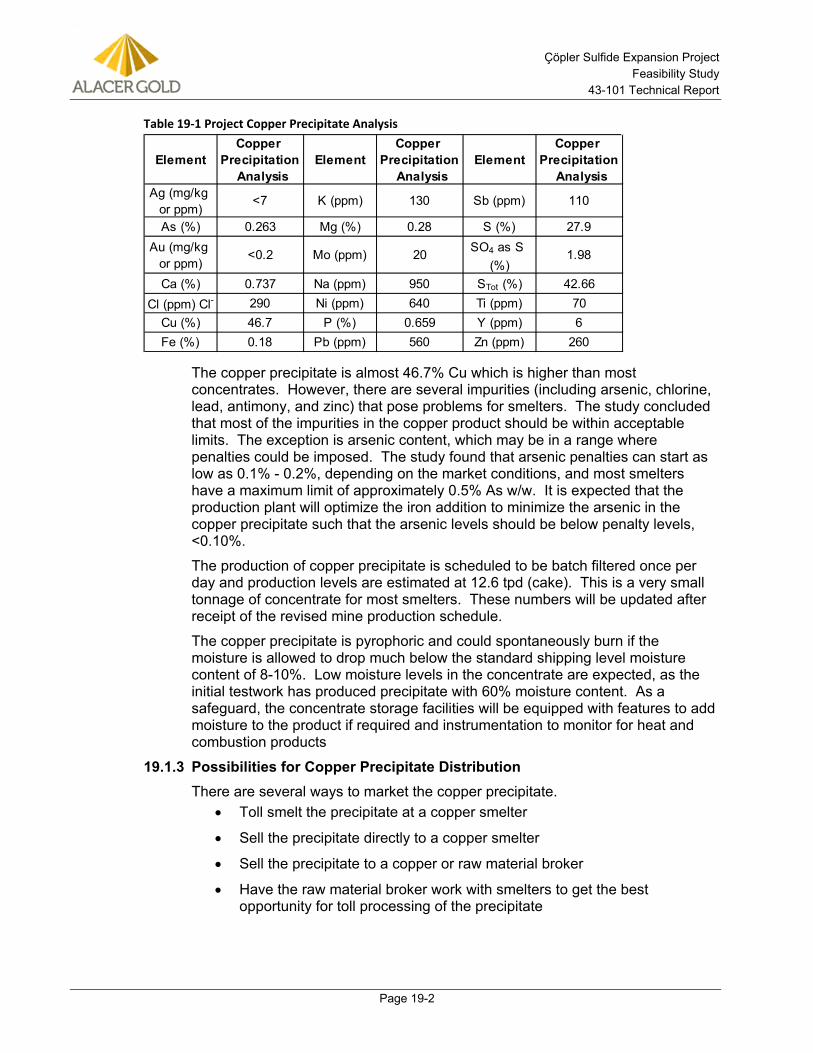
Çöpler Sulfide Expansion Project Feasibility Study
43-101 Technical Report
Page 19-2
Table 19-1 Project Copper Precipitate Analysis
The copper precipitate is almost 46.7% Cu which is higher than most concentrates. However, there are several impurities (including arsenic, chlorine, lead, antimony, and zinc) that pose problems for smelters. The study concluded that most of the impurities in the copper product should be within acceptable limits. The exception is arsenic content, which may be in a range where penalties could be imposed. The study found that arsenic penalties can start as low as 0.1% - 0.2%, depending on the market conditions, and most smelters have a maximum limit of approximately 0.5% As w/w. It is expected that the production plant will optimize the iron addition to minimize the arsenic in the copper precipitate such that the arsenic levels should be below penalty levels, <0.10%.
The production of copper precipitate is scheduled to be batch filtered once per day and production levels are estimated at 12.6 tpd (cake). This is a very small tonnage of concentrate for most smelters. These numbers will be updated after receipt of the revised mine production schedule.
The copper precipitate is pyrophoric and could spontaneously burn if the moisture is allowed to drop much below the standard shipping level moisture content of 8-10%. Low moisture levels in the concentrate are expected, as the initial testwork has produced precipitate with 60% moisture content. As a safeguard, the concentrate storage facilities will be equipped with features to add moisture to the product if required and instrumentation to monitor for heat and combustion products
Possibilities for Copper Precipitate Distribution 19.1.3There are several ways to market the copper precipitate.
• Toll smelt the precipitate at a copper smelter
• Sell the precipitate directly to a copper smelter
• Sell the precipitate to a copper or raw material broker
• Have the raw material broker work with smelters to get the best opportunity for toll processing of the precipitate
ElementCopper
Precipitation Analysis
ElementCopper
Precipitation Analysis
ElementCopper
Precipitation Analysis
Ag (mg/kg or ppm)
<7 K (ppm) 130 Sb (ppm) 110
As (%) 0.263 Mg (%) 0.28 S (%) 27.9Au (mg/kg
or ppm)<0.2 Mo (ppm) 20 SO4 as S
(%)1.98
Ca (%) 0.737 Na (ppm) 950 STot (%) 42.66Cl (ppm) Cl- 290 Ni (ppm) 640 Ti (ppm) 70
Cu (%) 46.7 P (%) 0.659 Y (ppm) 6Fe (%) 0.18 Pb (ppm) 560 Zn (ppm) 260
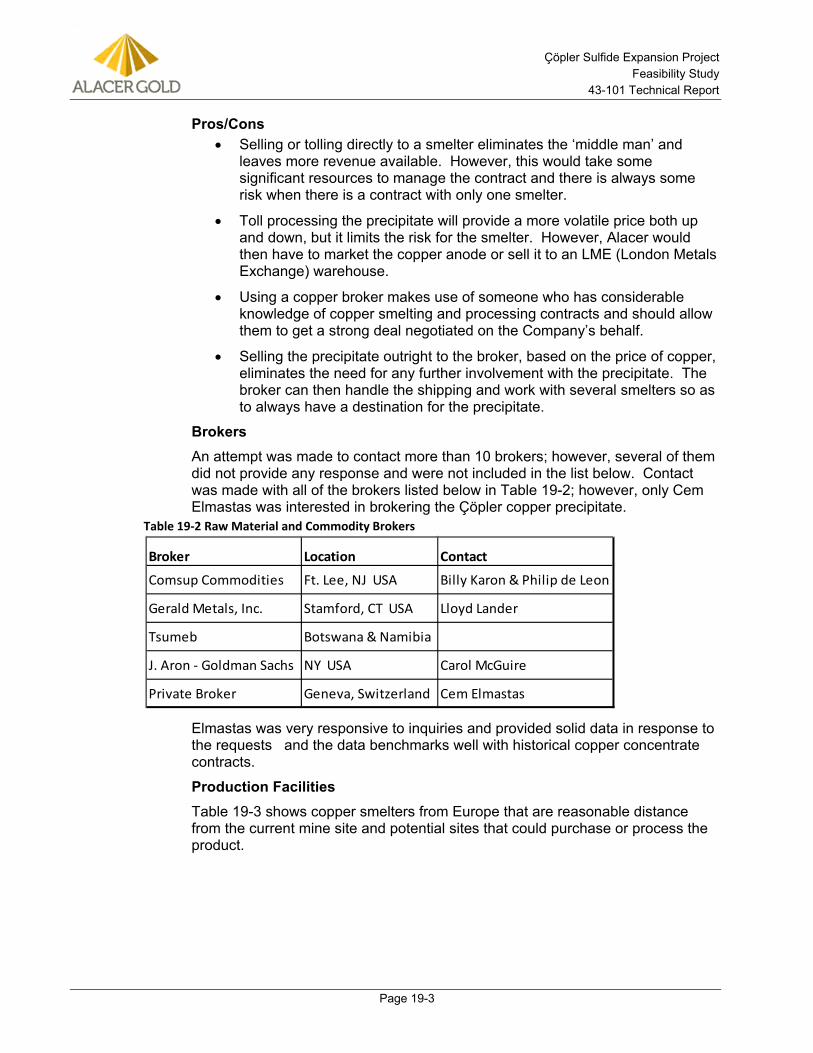
Çöpler Sulfide Expansion Project Feasibility Study
43-101 Technical Report
Page 19-3
Pros/Cons • Selling or tolling directly to a smelter eliminates the ‘middle man’ and
leaves more revenue available. However, this would take some significant resources to manage the contract and there is always some risk when there is a contract with only one smelter.
• Toll processing the precipitate will provide a more volatile price both up and down, but it limits the risk for the smelter. However, Alacer would then have to market the copper anode or sell it to an LME (London Metals Exchange) warehouse.
• Using a copper broker makes use of someone who has considerable knowledge of copper smelting and processing contracts and should allow them to get a strong deal negotiated on the Company’s behalf.
• Selling the precipitate outright to the broker, based on the price of copper, eliminates the need for any further involvement with the precipitate. The broker can then handle the shipping and work with several smelters so as to always have a destination for the precipitate.
Brokers An attempt was made to contact more than 10 brokers; however, several of them did not provide any response and were not included in the list below. Contact was made with all of the brokers listed below in Table 19-2; however, only Cem Elmastas was interested in brokering the Çöpler copper precipitate.
Table 19-2 Raw Material and Commodity Brokers
Elmastas was very responsive to inquiries and provided solid data in response to the requests and the data benchmarks well with historical copper concentrate contracts.
Production Facilities Table 19-3 shows copper smelters from Europe that are reasonable distance from the current mine site and potential sites that could purchase or process the product.
Broker Location Contact
Comsup Commodities Ft. Lee, NJ USA Billy Karon & Philip de Leon
Gerald Metals, Inc. Stamford, CT USA Lloyd Lander
Tsumeb Botswana & Namibia
J. Aron - Goldman Sachs NY USA Carol McGuire
Private Broker Geneva, Switzerland Cem Elmastas
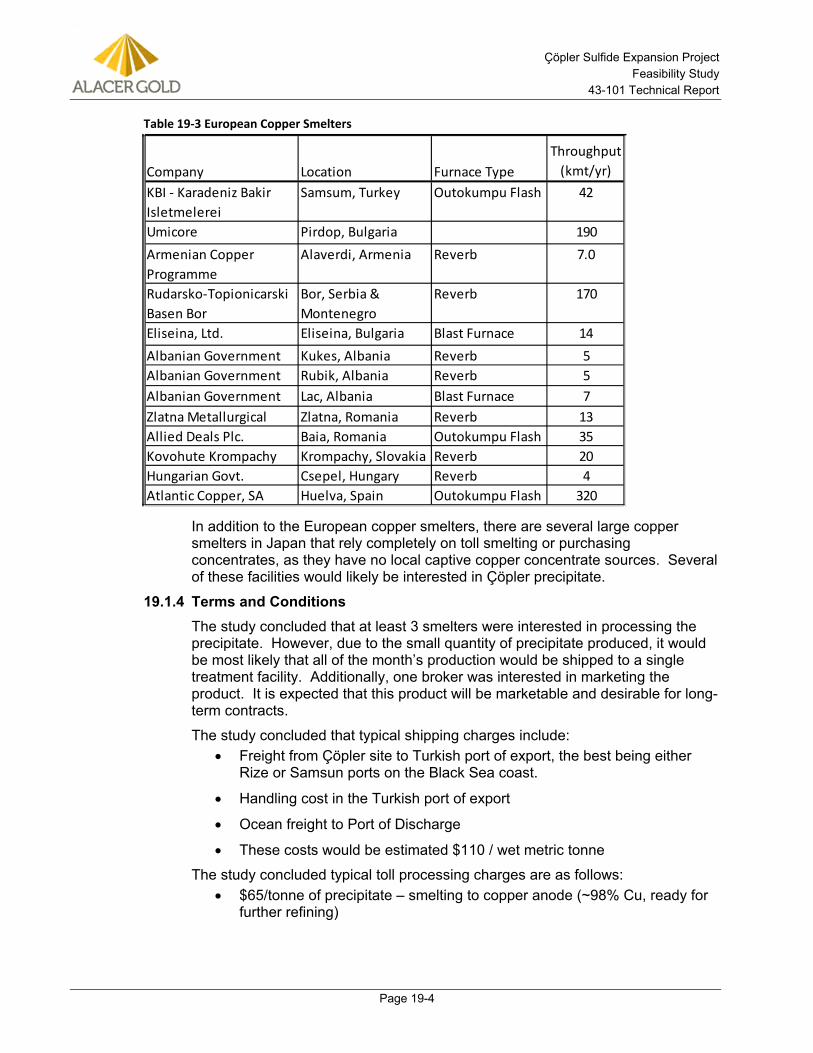
Çöpler Sulfide Expansion Project Feasibility Study
43-101 Technical Report
Page 19-4
Table 19-3 European Copper Smelters
In addition to the European copper smelters, there are several large copper smelters in Japan that rely completely on toll smelting or purchasing concentrates, as they have no local captive copper concentrate sources. Several of these facilities would likely be interested in Çöpler precipitate.
Terms and Conditions 19.1.4The study concluded that at least 3 smelters were interested in processing the precipitate. However, due to the small quantity of precipitate produced, it would be most likely that all of the month’s production would be shipped to a single treatment facility. Additionally, one broker was interested in marketing the product. It is expected that this product will be marketable and desirable for long-term contracts.
The study concluded that typical shipping charges include: • Freight from Çöpler site to Turkish port of export, the best being either
Rize or Samsun ports on the Black Sea coast.
• Handling cost in the Turkish port of export
• Ocean freight to Port of Discharge
• These costs would be estimated $110 / wet metric tonne
The study concluded typical toll processing charges are as follows: • $65/tonne of precipitate – smelting to copper anode (~98% Cu, ready for
further refining)
Company Location Furnace TypeThroughput
(kmt/yr)KBI - Karadeniz Bakir Isletmelerei
Samsum, Turkey Outokumpu Flash 42
Umicore Pirdop, Bulgaria 190Armenian Copper Programme
Alaverdi, Armenia Reverb 7.0
Rudarsko-Topionicarski Basen Bor
Bor, Serbia & Montenegro
Reverb 170
Eliseina, Ltd. Eliseina, Bulgaria Blast Furnace 14Albanian Government Kukes, Albania Reverb 5Albanian Government Rubik, Albania Reverb 5Albanian Government Lac, Albania Blast Furnace 7Zlatna Metallurgical Zlatna, Romania Reverb 13Allied Deals Plc. Baia, Romania Outokumpu Flash 35Kovohute Krompachy Krompachy, Slovakia Reverb 20Hungarian Govt. Csepel, Hungary Reverb 4Atlantic Copper, SA Huelva, Spain Outokumpu Flash 320
Çöpler Sulfide Expansion Project Feasibility Study
43-101 Technical Report
Page 19-5
• 6.5 cents/lb of copper – refining to copper cathode (99.99% Cu, ready for sale to LME)
• Precipitate penalties of $7/ dry metric tonne (This is based on 0.26% arsenic level. If successful in lowering the arsenic below 0.10%, the penalty will be eliminated.)
• Typical return/recovery of total copper of 96%
• Calculated total treatment charges from above ~$137/tonne precipitate
• Calculated total charges, including shipping would be ~$260/tonne precipitate
• Copper value in the precipitate ~$3700/tonne precipitate at $7500/t Cu
The study indicated typical terms through a broker would be as follows: • Typical 2012 terms, not forecast into future years
• Copper price of $7500 / t Copper
• Freight as described above
• Moisture levels of ~10% (the TML, transportable moisture limit, will have to be determined with testing)
• Precipitate penalties of $7/ dry metric tonne (This is based on 0.26% arsenic level. If successful in lowering the arsenic below 0.10%, the penalty will be eliminated).
The projected revenue is for toll smelting as compared to utilizing a broker, may be slightly higher, the projected revenues for both options are close enough to warrant further discussion and finalization prior to plant start-up.
Çöpler Sulfide Expansion Project Feasibility Study
43-101 Technical Report
Page 20-1
20.0 ENVIRONMENTAL STUDIES, PERMITTING AND SOCIAL OR COMMUNITY IMPACT
20.1 Introduction An Environmental Impact Assessment (EIA) study was completed in 2008 for the oxide ores of the Çöpler Gold Mine operating 15,500 tpd heap leach facility. The EIA permit was obtained from the Turkish Ministry of Environment and Urbanization (MEU) on April 16th, 2008. The project description for the 2008 EIA included three main open pits (manganese, marble contact, and main zones), five waste rock dumps, a heap leach pad, a processing plant, and a TSF. The 2008 project description involved only the oxide resources.
The Çöpler mine started its open pit and heap leach operation in 2010 and first gold was poured in December 2010. Additional EIA studies conducted and environmental permits received for Çöpler Gold Mine since the start of the gold mine operations are as follows:
• EIA permit dated April 10th, 2012 for the operation of mobile crushing plant,
• EIA permit dated May 17th, 2012 for capacity expansion involving (i) increasing the operation rate to 23,500 tpd; (ii) increasing the Çöpler waste rock dump footprint area; (iii) adding a SART plant to the process in order to decrease the cyanide consumption due to high copper content in some ores.
The EIA studies were conducted according to the format stipulated by the Turkish EIA Regulation. The scope of the Turkish EIA studies differ from the scope of international Environmental and Social Impact Assessment (ESIA) studies (as established by the IFC’s Environmental and Social Performance Standards), especially in terms of social impacts and public disclosure processes. While the social impact assessment and public disclosure processes are also parts of the Turkish EIA studies, they are treated less rigorously than in IFC standards. In the period following the receipt of the 2008 EIA permit, Alacer conducted further studies to supplement the Turkish EIA study and subsequently meet the IFC requirements. These studies involved a Resettlement Action Plan (RAP) for the Çöpler village, a socio-economic baseline study for Çöpler Village, a human rights assessment study, an Environmental Management Plan (EMP), and a biodiversity study.
SRK Danışmanlık ve Mühendislik A.Ş. (SRK) was retained by Alacer to undertake the Çöpler Sulfide Project Environmental and Social Impact Assessment (ESIA) study for permitting and possible financing purposes.
Much of the content in this section originated from the Çöpler Mine Sulfide Expansion Feasibility Study – Environment and Permitting report prepared by SRK Turkey (SRK, 2012b).
20.2 Comparison of Turkish EIA and International ESIA Studies The Turkish EIA regulation was promulgated in 1993. Since then it has been revised and amended several times, the most recent one being in 2008. The Turkish EIA regulation was transposed from the European Union EIA Directive. Therefore, in many regards the Turkish EIA regulation is similar to those in various European countries. However, the infusion of various Turkish sub laws, conventions, and governmental practices into the EIA process makes the Turkish EIA unique in certain respects.
Çöpler Sulfide Expansion Project Feasibility Study
43-101 Technical Report
Page 20-2
The Turkish EIA regulation classifies projects into categories through a project screening list which is based on project capacity, size, and activity/process criteria. The projects can be classified into three categories:
• Small projects that are exempt from the requirements of the EIA Regulation,
• Minor projects that are subject to EIA Regulation Annex-2 requirements,
• Major projects that are subject to EIA Regulation Annex-1 requirements.
Most mining projects, due to their nature, size, and areal coverage are subject to Annex-1 requirements. The Çöpler Sulfide Expansion Project is subject to Annex-1 requirements. Annex-1 projects are required to conduct a comprehensive EIA study.
An EIA permit is the first step in Turkish environmental permitting system. An EIA permit is needed before construction activities can commence.
The EIA permitting process starts with the project owner submitting a Project Description Report (PDR) to the Ministry of Environment and Urbanization (MEU). A PDR is a brief document that describes the project area and environs, a description of the project elements, and a preliminary impact assessment. It is a public document that is used for informing relevant stakeholders. Following the submittal of the PDR, a public hearing is arranged, whereby the project is introduced to the stakeholders and comments are officially noted. Following the public hearing, an Investigation and Assessment Commission (IAC) consisting of various departments of the MEU and several other governmental agencies is convened where Terms of Reference (ToR) for the project EIA studies are established. The ToR is mandatory and cannot be changed by the project owner.
The EIA regulation allows for a one-year period to complete and submit the EIA report for the project. The project owner can ask for a one-time 6 month extension if the EIA studies cannot be completed on time. Following the filing of the draft EIA report, the IAC reviews the draft report and convenes to reach a decision on the completeness and adequacy of the EIA study. The project owner and the EIA preparers are invited to present and defend their projects. Depending on the project complexity, the IAC may convene more than once to reach a decision. Once a decision is reached and amendments (if any) to the EIA are completed, the final EIA report is posted at relevant official locations for final public comment. With the inclusion of public comments, the EIA permitting process is finalized.
There are certain important differences between the Turkish EIA and international ESIA studies, as listed below:
• Turkish EIAs have social components integrated into the process. However, these are significantly less rigorous than IFC’s requirements. The social baseline data in the Turkish EIA is usually based on published secondary data, whereas, in the international ESIA, primary data collected in the field is utilized. Primary data provides further details and up-to-date information about the socio-economic status of the project area.
• A minimum of one public hearing for stakeholder engagement is mandatory in the Turkish EIA regulation. This is done at the beginning of the EIA permitting process, after the submittal of the PDR to the MEU. Public opinion is sought again at the end of the EIA permitting process after the submittal of the final EIA report. The final EIA report is posted at the offices of the nearest government administrative unit and no public hearing is held. Public opinion is only accepted in written form. While some
Çöpler Sulfide Expansion Project Feasibility Study
43-101 Technical Report
Page 20-3
stakeholder engagement is conducted during the EIA process, these are very limited in scope and the results from these engagements are generally not adequately integrated into the project designs and/or permit decision making process. IFC Environmental and Social Performance standards require a more comprehensive and well documented Stakeholder Engagement process.
• Social and Environmental Management Systems are requirements of the ESIAs prepared under the IFC ESPSs, but not under the Turkish EIA regulation.
• Turkish EIAs are heavily structured according to numerous environmental regulations and circulars in effect. Land use and cadastral restrictions play a major role in a project’s permits and progress.
• Turkish environmental regulations involve a prescriptive approach rather than a risk-based approach.
Certain IFC ESIA performance standards do not have a counterpart in the Turkish EIA. These are:
• Performance Standard 2: Labor and Working Conditions
• Performance Standard 4: Community Health, Safety and Security
• Performance Standard 5: Land Acquisition and Involuntary Resettlement
• Performance Standard 6: Biodiversity Conservation and Sustainable Natural Resource Management
• Performance Standard 8: Cultural Heritage
These standards are generally handled outside of the EIA system, but under other environmental permitting and regulatory processes.
The Turkish EIA regulation requires that EIA documents be prepared in a mandatory format. International ESIA documents are prepared in a flexible format as long as the guidelines and risks are identified and the risks are addressed adequately.
The Turkish EIA regulation requires that the following separate reports be prepared according to a mandatory format and attached to the EIA report:
• Mine Reclamation and Closure Plan,
• Acoustical Report, and
• Agricultural Soil Conservation Report.
20.3 Status of Permitting The EIA permitting for the Çöpler gold mine for the oxide ore was completed in April 2008 with the issuance of an EIA positive certificate. Additionally, the Erzincan Provincial Directorate of Environment and Urbanization has issued a certificate that “No EIA is required” for the project’s clay borrow pits in July and August 2009. The construction of the Çöpler Gold Mine commenced in December 2008 and is still ongoing as a progressive construction process. As a requirement of the Turkish EIA permit, the construction activities are audited bi-annually by an independent third-party with respect to the environmental monitoring and mitigation commitments provided by Alacer in the EIA report. Fourteen audits were completed to date in October 2008, April 2009,
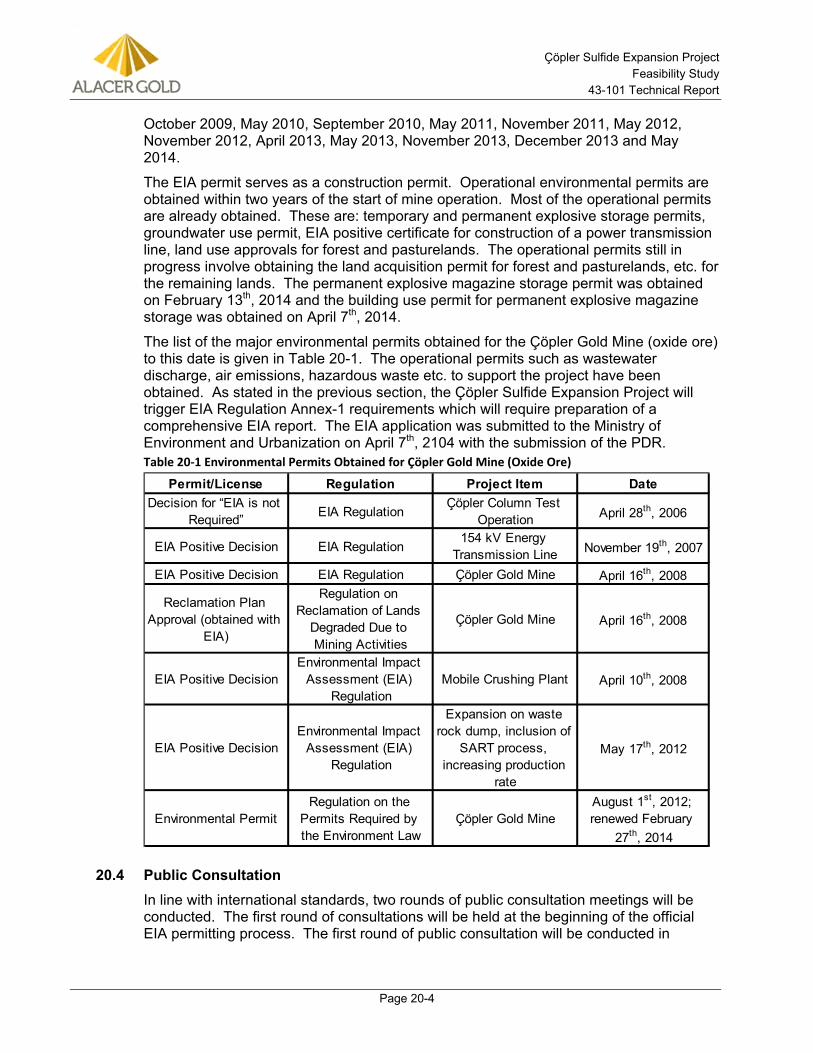
Çöpler Sulfide Expansion Project Feasibility Study
43-101 Technical Report
Page 20-4
October 2009, May 2010, September 2010, May 2011, November 2011, May 2012, November 2012, April 2013, May 2013, November 2013, December 2013 and May 2014.
The EIA permit serves as a construction permit. Operational environmental permits are obtained within two years of the start of mine operation. Most of the operational permits are already obtained. These are: temporary and permanent explosive storage permits, groundwater use permit, EIA positive certificate for construction of a power transmission line, land use approvals for forest and pasturelands. The operational permits still in progress involve obtaining the land acquisition permit for forest and pasturelands, etc. for the remaining lands. The permanent explosive magazine storage permit was obtained on February 13th, 2014 and the building use permit for permanent explosive magazine storage was obtained on April 7th, 2014.
The list of the major environmental permits obtained for the Çöpler Gold Mine (oxide ore) to this date is given in Table 20-1. The operational permits such as wastewater discharge, air emissions, hazardous waste etc. to support the project have been obtained. As stated in the previous section, the Çöpler Sulfide Expansion Project will trigger EIA Regulation Annex-1 requirements which will require preparation of a comprehensive EIA report. The EIA application was submitted to the Ministry of Environment and Urbanization on April 7th, 2104 with the submission of the PDR. Table 20-1 Environmental Permits Obtained for Çöpler Gold Mine (Oxide Ore)
20.4 Public Consultation In line with international standards, two rounds of public consultation meetings will be conducted. The first round of consultations will be held at the beginning of the official EIA permitting process. The first round of public consultation will be conducted in
Permit/License Regulation Project Item DateDecision for “EIA is not
Required” EIA RegulationÇöpler Column Test
Operation April 28th, 2006
EIA Positive Decision EIA Regulation154 kV Energy
Transmission Line November 19th, 2007
EIA Positive Decision EIA Regulation Çöpler Gold Mine April 16th, 2008
Reclamation Plan Approval (obtained with
EIA)
Regulation on Reclamation of Lands
Degraded Due to Mining Activities
Çöpler Gold Mine April 16th, 2008
EIA Positive Decision Environmental Impact
Assessment (EIA) Regulation
Mobile Crushing Plant April 10th, 2008
EIA Positive Decision Environmental Impact
Assessment (EIA) Regulation
Expansion on waste rock dump, inclusion of
SART process, increasing production
rate
May 17th, 2012
Environmental PermitRegulation on the
Permits Required by the Environment Law
Çöpler Gold MineAugust 1st, 2012; renewed February
27th, 2014
Çöpler Sulfide Expansion Project Feasibility Study
43-101 Technical Report
Page 20-5
accordance with the Turkish EIA Regulation requirements and the public hearing will be managed by the Ministry of Environment and Urbanization.
The second round of consultations will be held on completion of the draft EIA to disclose the identified potential project impacts and management measures for their mitigation. This will be done outside of the Turkish EIA permitting system, since the second consultation is not required by the governmental agencies. At this stage, public feedback, in addition to providing useful inputs into management plans will be a reflection of public support or reservations on the proposed project. This is generally taken into account by Turkish regulatory authorities and development financiers in their respective decisions.
20.5 Baseline Observations Environmental baseline studies have the objective of characterizing the existing physical, biological, chemical, and socio-economic resources that may be impacted by the development of the project. Regarding the Çöpler Mine, the existing baseline information available from the 2008 EIA report, construction and operation phase monitoring, and results of the first round of soil and surface water sampling carried out by SRK Turkey staff for the expansion areas have been reviewed and summarized in the following sections.
20.6 Soil Types Main Soil Groups 20.6.1Main soil groups present at the project area were determined from the soil maps produced by the General Directorate of Rural Services of the Ministry of Food, Agriculture and Livestock. The distribution of the main soil groups at the prospect and environs is shown in Figure 20-1. The common soil type in the study area and its vicinity is the Brown Soil (B) and rocky areas (ÇK). Brown soil group exhibit the entire characteristics of A, B and C horizons, with a calcification effect. Due to this calcification effect, a high amount of calcium is observed in the soil profile and the base saturation is high. In the Brown soils, Horizon A1 is 10 to 15 cm thick, distinct, porous with medium organic matter content, neutral, or basic in pH, color gray-brown or brown. Horizon B has a color ranging from light brown to dark brown. It exhibits a coarse sub-angular blocky character. The lower soil gradually passes to pale brown or grayish highly calcareous parent material. In these soils the profile is totally calcareous leading to a caliche zone below Horizon B. Since this zone forms in places where annual precipitation is around 250 mm to 400mm, caliche formation is encountered at very deep levels. The clay minerals observed in the profile are generally illite and smectite. The natural vegetation observed developing in these soils is composed of low or medium height meadow herbs. Parent material is clayey schist, calcite or clay stones intercalated with schist. In addition, in some places the parent materials can be loose alluvial material made up of calcite, clay stones or crystalline rocks. The major problems and constraints related to both of these soils are shallow soil cover, steep slopes, high erosion pressure, and the presence of gravel and cobbles. Depending on topography these problems limit the use of these soil types for grazing.
Çöpler Sulfide Expansion Project Feasibility Study
43-101 Technical Report
Page 20-6
Soil Characterization 20.6.2Soil sampling was conducted to determine the baseline physical and chemical characteristics that are prevalent within the expansion area. The soil samples were collected from the top 30 cm of soils at seven representative locations within the alternative footprints of the mine units proposed by Alacer. The site selection for the soil sampling locations was restricted by poor site accessibility. The sampling locations are shown on Figure 20-1. The soil sampling locations are labeled with the "CPSO" prefix.
The sampling was conducted on August, 2012. All sample collection, preservation, handling, shipping and laboratory testing were performed according to SRK Quality Assurance and Quality Control (QA/QC) protocols and Standard Operating Procedures (SOP). Laboratory analyses were performed at ALS Laboratories in Canada, an accredited international laboratory. The results of the laboratory analyses are summarized in Table 20-2. The measured heavy metal levels are compared with the typical abundance values of heavy metals in the earth crust. The concentrations of Ag, As, Bi, Ca, Cu, Pb, Se, Mn, Mo, Ni, Sb, and Zn in the soil samples are generally found to be elevated with regard to the typical earth crustal abundances. All soil samples have slightly alkaline pH levels.
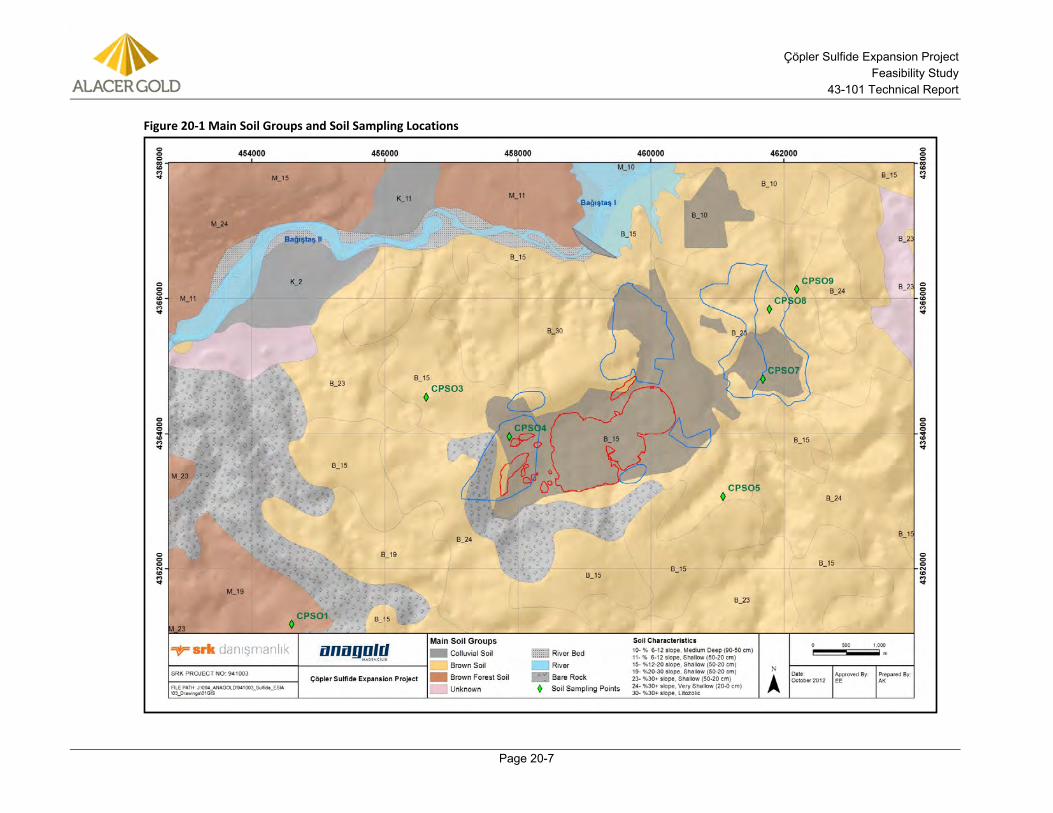
Çöpler Sulfide Expansion Project Feasibility Study
43-101 Technical Report
Page 20-7
Figure 20-1 Main Soil Groups and Soil Sampling Locations
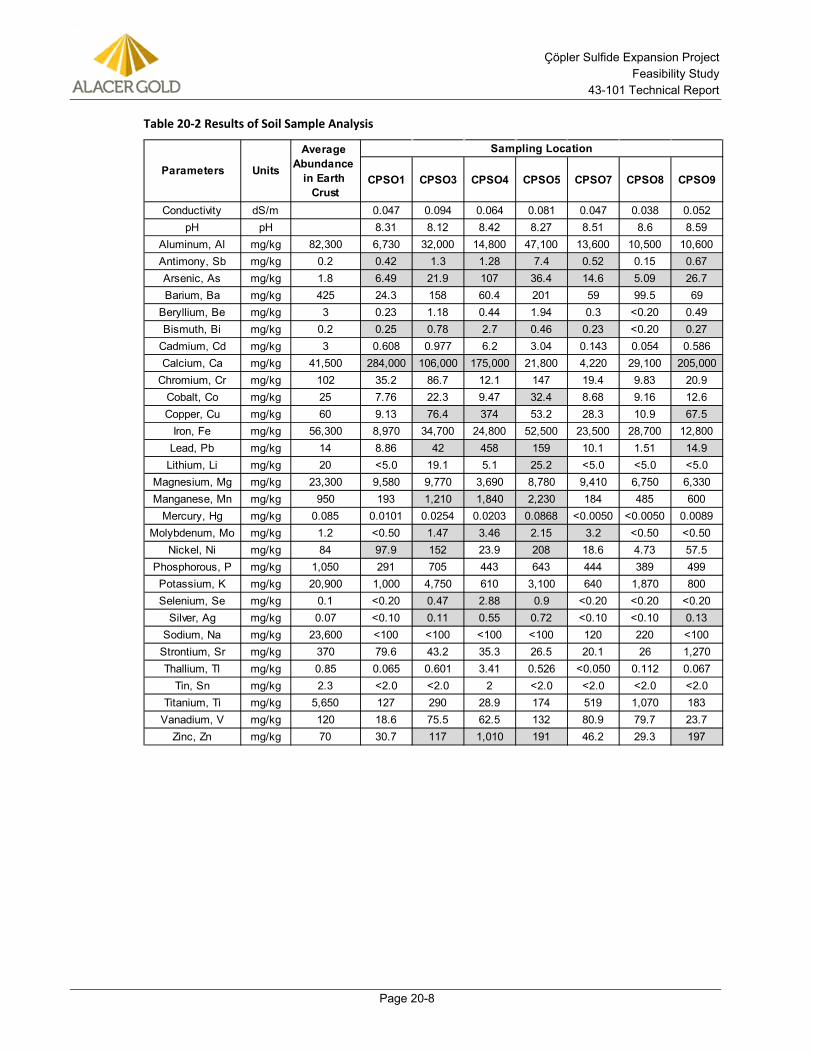
Çöpler Sulfide Expansion Project Feasibility Study
43-101 Technical Report
Page 20-8
Table 20-2 Results of Soil Sample Analysis
CPSO1 CPSO3 CPSO4 CPSO5 CPSO7 CPSO8 CPSO9
Conductivity dS/m 0.047 0.094 0.064 0.081 0.047 0.038 0.052pH pH 8.31 8.12 8.42 8.27 8.51 8.6 8.59
Aluminum, Al mg/kg 82,300 6,730 32,000 14,800 47,100 13,600 10,500 10,600Antimony, Sb mg/kg 0.2 0.42 1.3 1.28 7.4 0.52 0.15 0.67Arsenic, As mg/kg 1.8 6.49 21.9 107 36.4 14.6 5.09 26.7Barium, Ba mg/kg 425 24.3 158 60.4 201 59 99.5 69
Beryllium, Be mg/kg 3 0.23 1.18 0.44 1.94 0.3 <0.20 0.49Bismuth, Bi mg/kg 0.2 0.25 0.78 2.7 0.46 0.23 <0.20 0.27
Cadmium, Cd mg/kg 3 0.608 0.977 6.2 3.04 0.143 0.054 0.586Calcium, Ca mg/kg 41,500 284,000 106,000 175,000 21,800 4,220 29,100 205,000
Chromium, Cr mg/kg 102 35.2 86.7 12.1 147 19.4 9.83 20.9Cobalt, Co mg/kg 25 7.76 22.3 9.47 32.4 8.68 9.16 12.6Copper, Cu mg/kg 60 9.13 76.4 374 53.2 28.3 10.9 67.5
Iron, Fe mg/kg 56,300 8,970 34,700 24,800 52,500 23,500 28,700 12,800Lead, Pb mg/kg 14 8.86 42 458 159 10.1 1.51 14.9
Lithium, Li mg/kg 20 <5.0 19.1 5.1 25.2 <5.0 <5.0 <5.0Magnesium, Mg mg/kg 23,300 9,580 9,770 3,690 8,780 9,410 6,750 6,330Manganese, Mn mg/kg 950 193 1,210 1,840 2,230 184 485 600
Mercury, Hg mg/kg 0.085 0.0101 0.0254 0.0203 0.0868 <0.0050 <0.0050 0.0089Molybdenum, Mo mg/kg 1.2 <0.50 1.47 3.46 2.15 3.2 <0.50 <0.50
Nickel, Ni mg/kg 84 97.9 152 23.9 208 18.6 4.73 57.5Phosphorous, P mg/kg 1,050 291 705 443 643 444 389 499Potassium, K mg/kg 20,900 1,000 4,750 610 3,100 640 1,870 800Selenium, Se mg/kg 0.1 <0.20 0.47 2.88 0.9 <0.20 <0.20 <0.20
Silver, Ag mg/kg 0.07 <0.10 0.11 0.55 0.72 <0.10 <0.10 0.13Sodium, Na mg/kg 23,600 <100 <100 <100 <100 120 220 <100
Strontium, Sr mg/kg 370 79.6 43.2 35.3 26.5 20.1 26 1,270Thallium, Tl mg/kg 0.85 0.065 0.601 3.41 0.526 <0.050 0.112 0.067
Tin, Sn mg/kg 2.3 <2.0 <2.0 2 <2.0 <2.0 <2.0 <2.0Titanium, Ti mg/kg 5,650 127 290 28.9 174 519 1,070 183
Vanadium, V mg/kg 120 18.6 75.5 62.5 132 80.9 79.7 23.7Zinc, Zn mg/kg 70 30.7 117 1,010 191 46.2 29.3 197
Parameters Units
Average Abundance
in Earth Crust
Sampling Location
Çöpler Sulfide Expansion Project Feasibility Study
43-101 Technical Report
Page 20-9
20.7 Physical Features Climate 20.7.1The project site is located in a transition region between Central and Eastern Anatolian climates. The region has a continental climate, where summers are hot and dry, and winters are cold and relatively humid. Owing to the mountain ranges bordering Erzincan Province on all sides, the region has a milder climate than the neighboring provinces.
Annual average temperature is 11.4°C. The hottest month is July with an average temperature of 24.3°C and the coldest month is February with an average of -0.5°C. An extreme maximum temperature of 41.0°C is observed in July and an extreme minimum temperature of -30.0°C is observed in January.
The long-term annual average precipitation for the project site is 383.9 mm. The intensity for 24-hour 100-year storm event is 2.75 mm/hr (66 mm). The annual average snowfall depth is 51 cm, which is approximately equivalent to 75 mm of water. Annual average evaporation is 1,121.5 mm. The highest monthly average evaporation is 241.4 mm and occurs in the months of July and August. The net annual water deficit in the region is 880.1 mm (1,121.5 mm – 241.4 mm). December through March are the months with water surplus.
The annual average wind speed is 2.6 m/s. Maximum wind speeds are observed in spring. The prevailing wind direction is south.
Air Quality and Noise 20.7.2The project site is located in a rural area with no significant commercial or industrial air pollution sources. The closest industrial facilities are stone/marble quarries and iron/copper mines that lie at distances of 50 km or more. Scattered slag piles and ore extraction sites remaining from the former manganese mining operations are the only possible fugitive dust sources within the Çöpler project impact area.
Emission from residential heating in settlement areas of the region (Sabırlı, Çöpler and other nearby villages, and the town of İliç) is the only gaseous air pollution source in the vicinity of the project site.
The ambient air quality monitoring program on site indicated that SO2 and NO2 levels, PM10 and dust deposition levels in ambient air are well below the Limit Values defined in Turkish Air Quality Standards. According to the XRF analysis of the PM10 samples for heavy metals most of the metal concentrations including arsenic, cadmium and other metals were below the method detection limits. All of the concentrations were well below the limit values defined by European Commission (EC), World Health Organization (WHO) and Turkish standards.
The railway and the İliç – Kemaliye road passing near the Euphrates River are the mobile sources of noise in the area. The noise level measured in Sabırlı village is 41.8 dBA during day time and 37.2 dBA during night time. The noise levels at the proposed resettlement area for Çöpler were measured as 59.4 dBA during daytime and 36.2 dBA during night time. The noise levels observed were due to community activities of the villagers.
Çöpler Sulfide Expansion Project Feasibility Study
43-101 Technical Report
Page 20-10
Surface Water Resources 20.7.3The Euphrates-Karasu River is the largest surface water body near the project site; it borders the study area from the north (Figure 20-2). Based on 32-years of records, the average annual flow rate and the maximum flow rate of Euphrates River are 145 m3/s and 1,320 m3/s, respectively. Peak flow rates are observed in April and May following the snow melt and rainfalls (SRK, 2008). All other streams in the vicinity of the project area are intermittent, flowing between March and June. Streams at the project area are the Çöpler stream with 10 km2 catchment area and the Sabırlı stream with 35 km2 catchment area.
There is ongoing construction of the Bağıştaş I Hydroelectric Power Plant (HEPP) and Dam and Bağıştaş II Regulator Dam on the Euphrates-Karasu River. Bağıştaş I Dam’s reservoir will be at a distance of 35 m to 50 m to the new Çöpler settlement.
The surface water quality within the site was investigated through; • Data gathered through the Environmental Baseline Study (EBS) for the
2008-EIA of Çöpler Gold Mine (2005-2007),
• Data gathered through the Çöpler Gold Mine Environmental Monitoring Program (EMP) conducted by Alacer (2008-2011),
• Data gathered through the first campaign of EBS for the Sulfide Expansion Project (August, 2012).
The surface water quality sampling locations for each study is presented in Figure 20-2. Summaries of the analyses results for EBS (2005 – 2007), EMP (2008 – 2011) and EBS (2013 – 2014) are presented in Table 20-3, Table 20-4 and Table 20-5, respectively.
The analysis of the water samples from surface waters indicates calcium-sodium cation and bicarbonate-chloride sulfate anion facies types. None of the surface water is deemed suitable for drinking or irrigation purposes. Significant seasonal fluctuations in water quality are not observed for the surface water monitoring points at the site. The comparison of the average analysis results with the Turkish Water Pollution Control Regulation (WPCR) Inland Water Quality Criteria (IWQC) indicated Class IV water quality for Sabırlı and Çöpler Creeks, and Karabudak Stream. Similarly, the Euphrates-Karasu River is classified as Class IV water resource. The Çaltı Stream which connects to the Euphrates River downstream and outside the project’s impact area was determined to have Class III water quality. The water quality in the Euphrates is observed to improve after the confluence with the Çaltı Stream and at that point it is classified as Class III water resource. For all streams, Aluminum levels are observed to be high. Iron concentration is also high especially in the drainage from Sabırlı and Çöpler Creek catchments. Elevated Al and Fe concentrations in these catchments are attributed to natural metallic enrichment from the surrounding geology. Copper, Manganese, Nickel, and Lead are other parameters that are observed in relatively elevated concentrations in the drainage from Sabırlı and Çöpler catchments with respect to IWQC.
A quarterly water quality sampling program has been developed in order to determine the baseline conditions for the Çöpler Sulfide Expansion Project that

Çöpler Sulfide Expansion Project Feasibility Study
43-101 Technical Report
Page 20-11
included 24 water quality monitoring locations. The first sampling campaign was conducted by SRK in August 2012, representing the summer conditions, however most of the sampling locations were dry due to the season and the measurements could be conducted at only 2 locations. The results of the measurements supported the previous results indicating calcium-sochloride sulfate anion facies types. The water quality in the downstream of Karasu River is found to be Class III.
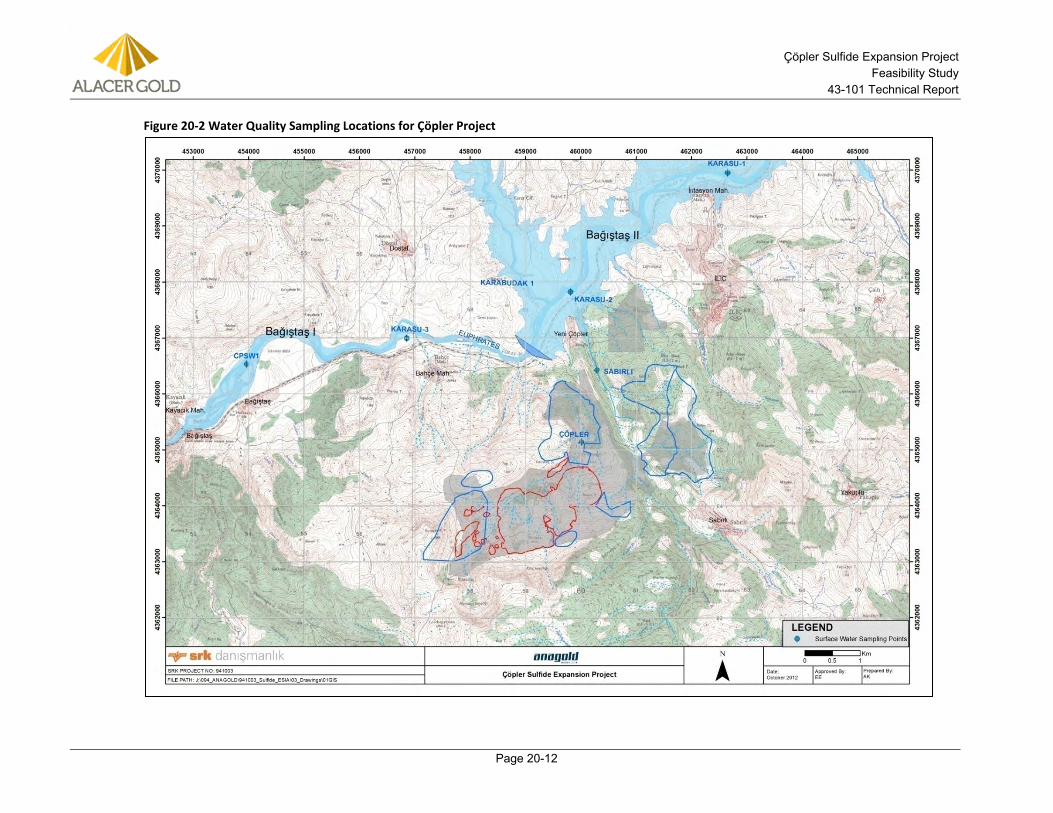
Çöpler Sulfide Expansion Project Feasibility Study
43-101 Technical Report
Page 20-12
Figure 20-2 Water Quality Sampling Locations for Çöpler Project
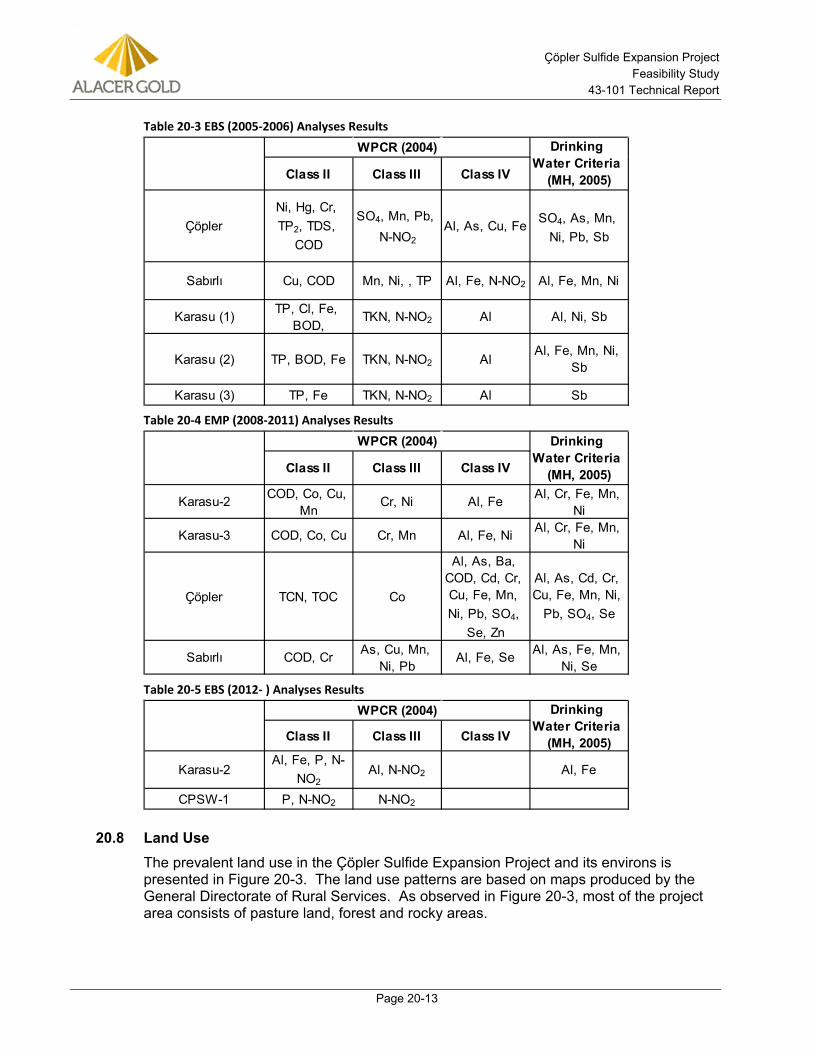
Çöpler Sulfide Expansion Project Feasibility Study
43-101 Technical Report
Page 20-13
Table 20-3 EBS (2005-2006) Analyses Results
Table 20-4 EMP (2008-2011) Analyses Results
Table 20-5 EBS (2012- ) Analyses Results
20.8 Land Use The prevalent land use in the Çöpler Sulfide Expansion Project and its environs is presented in Figure 20-3. The land use patterns are based on maps produced by the General Directorate of Rural Services. As observed in Figure 20-3, most of the project area consists of pasture land, forest and rocky areas.
Class II Class III Class IV
Çöpler Ni, Hg, Cr, TP2, TDS,
COD
SO4, Mn, Pb, N-NO2
Al, As, Cu, Fe SO4, As, Mn, Ni, Pb, Sb
Sabırlı Cu, COD Mn, Ni, , TP Al, Fe, N-NO2 Al, Fe, Mn, Ni
Karasu (1) TP, Cl, Fe, BOD,
TKN, N-NO2 Al Al, Ni, Sb
Karasu (2) TP, BOD, Fe TKN, N-NO2 AlAl, Fe, Mn, Ni,
Sb
Karasu (3) TP, Fe TKN, N-NO2 Al Sb
WPCR (2004) Drinking Water Criteria
(MH, 2005)
Class II Class III Class IV
Karasu-2 COD, Co, Cu, Mn
Cr, Ni Al, Fe Al, Cr, Fe, Mn, Ni
Karasu-3 COD, Co, Cu Cr, Mn Al, Fe, Ni Al, Cr, Fe, Mn, Ni
Çöpler TCN, TOC Co
Al, As, Ba, COD, Cd, Cr, Cu, Fe, Mn, Ni, Pb, SO4,
Se, Zn
Al, As, Cd, Cr, Cu, Fe, Mn, Ni,
Pb, SO4, Se
Sabırlı COD, Cr As, Cu, Mn, Ni, Pb
Al, Fe, Se Al, As, Fe, Mn, Ni, Se
WPCR (2004) Drinking Water Criteria
(MH, 2005)
Class II Class III Class IV
Karasu-2Al, Fe, P, N-
NO2Al, N-NO2 Al, Fe
CPSW-1 P, N-NO2 N-NO2
WPCR (2004) Drinking Water Criteria
(MH, 2005)
Çöpler Sulfide Expansion Project Feasibility Study
43-101 Technical Report
Page 20-14
The Land Use Capability Classes (LUCC) for the project area and environs is given in Figure 20-4. Under the LUCC system, there are three main categories and eight classes (ranging between I and VIII). The first category covers Classes I through IV, and describes lands which are suitable for cultivation and animal husbandry. This category has few limitations, except for Class IV, which requires very careful management because of its greater limitations. The second category covers Classes V through VII, which are unsuitable for cultivation but which can support perennial plants when intensive conservation and development practices are applied. Under controlled conditions, this land may also support grazing and forestry. The soil type included in class VII has severe limitations, preventing the growth of cultivated plants due to characteristics such as the formation of steep slopes (which are exposed to medium to severe erosion) and shallow soil layers, possessing stony, salty and sodic texture. As such their utilization for agricultural purposes is very limited. The third category contains only the Class VIII, which is suitable only for wildlife, sports and tourism-related activities.
As shown in Figure 20-4, the project area has VI, VII and VIII types of LUCC.
The land use types in the project area and its vicinity are:
• Degraded forest lands and coppice
• Barren forest lands
• Agricultural lands
• Settlements
The cadastral information is presented on Figure 20-5.
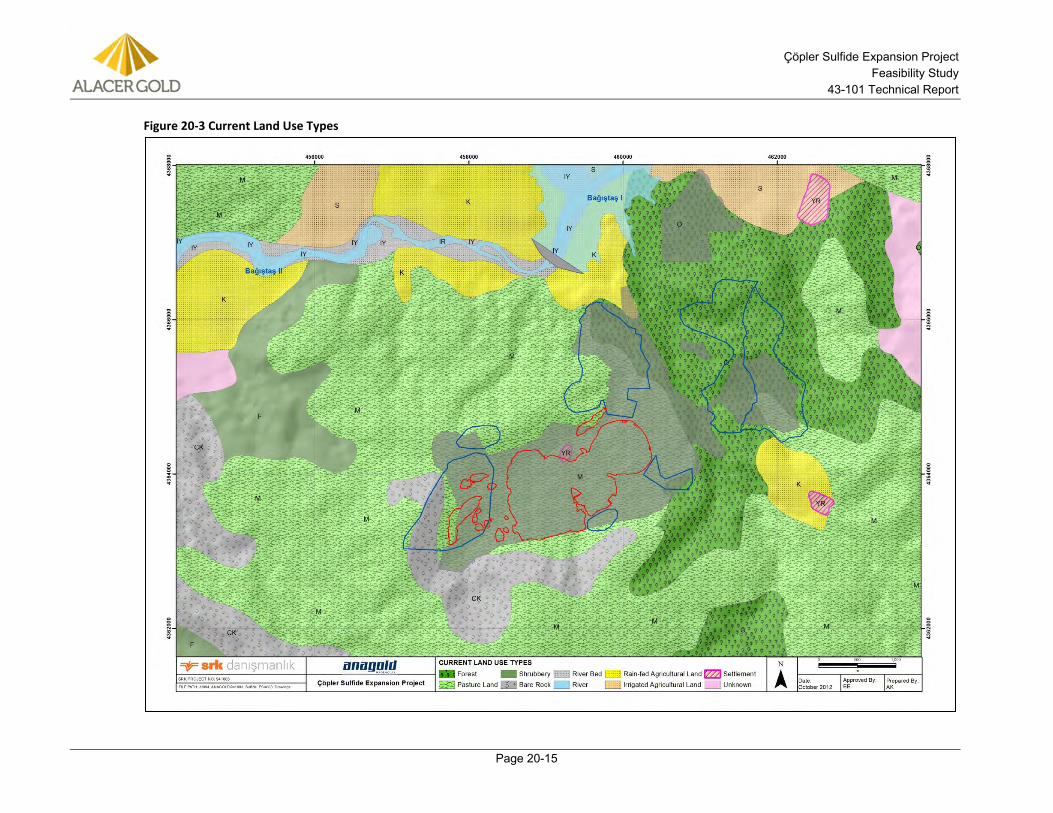
Çöpler Sulfide Expansion Project Feasibility Study
43-101 Technical Report
Page 20-15
Figure 20-3 Current Land Use Types
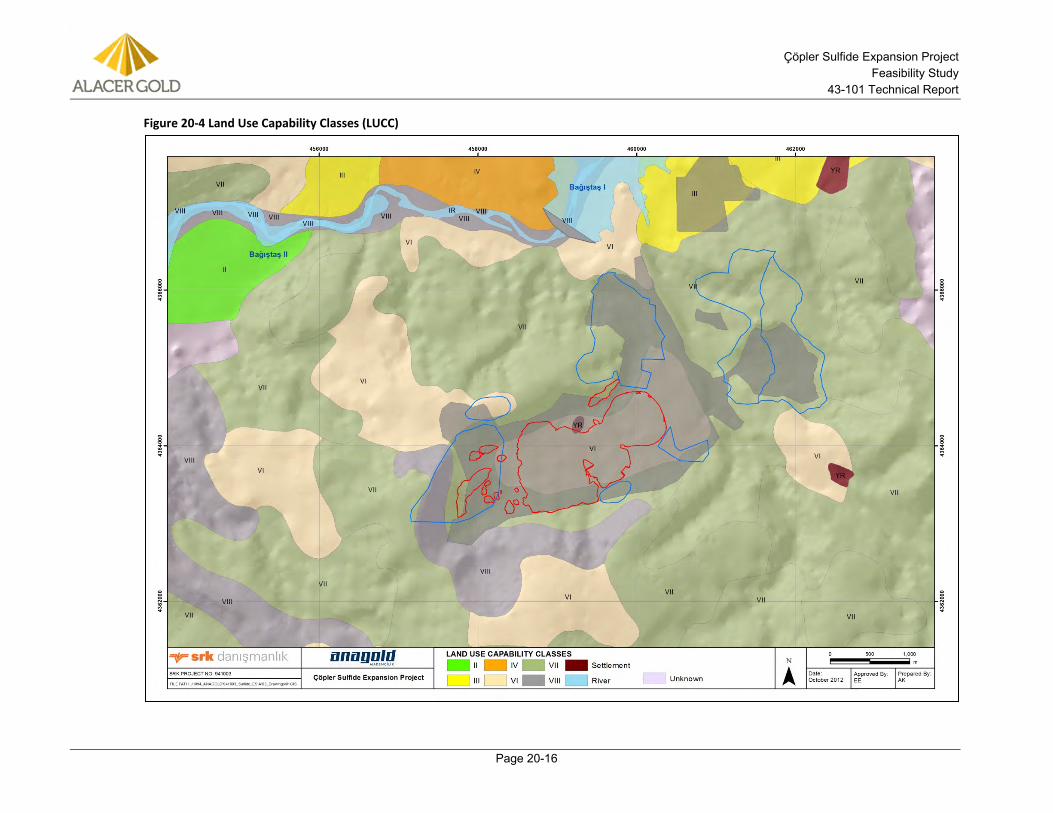
Çöpler Sulfide Expansion Project Feasibility Study
43-101 Technical Report
Page 20-16
Figure 20-4 Land Use Capability Classes (LUCC)
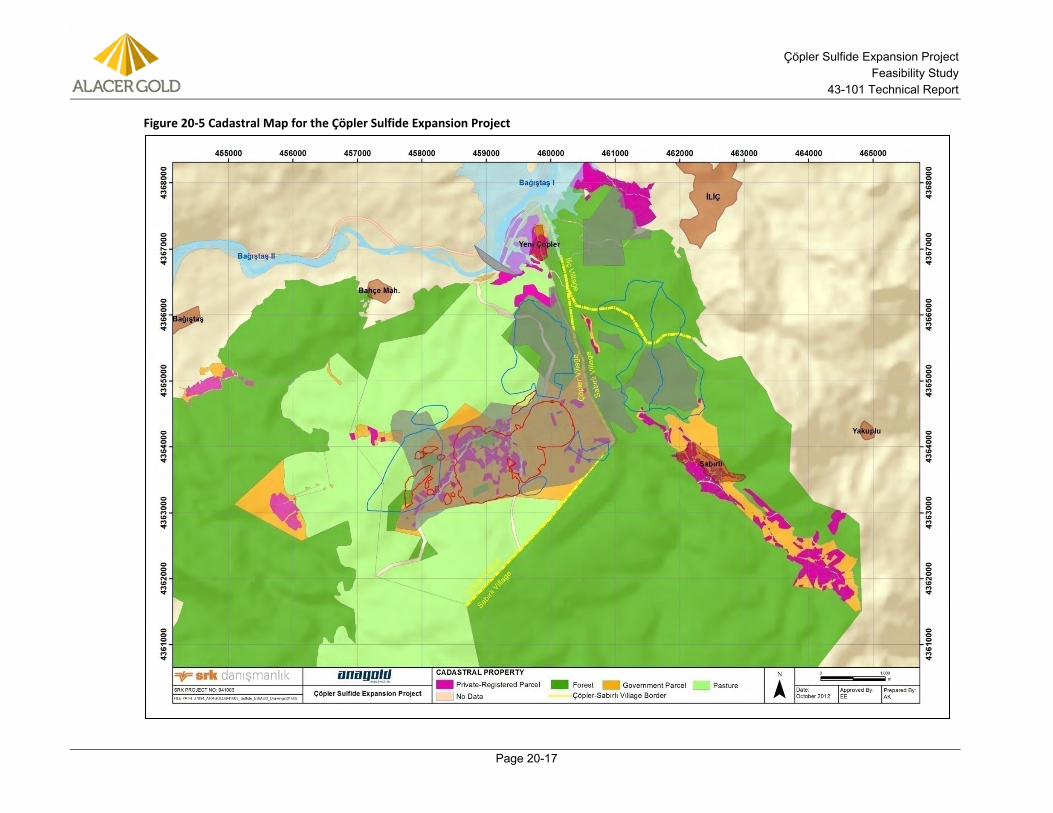
Çöpler Sulfide Expansion Project Feasibility Study
43-101 Technical Report
Page 20-17
Figure 20-5 Cadastral Map for the Çöpler Sulfide Expansion Project
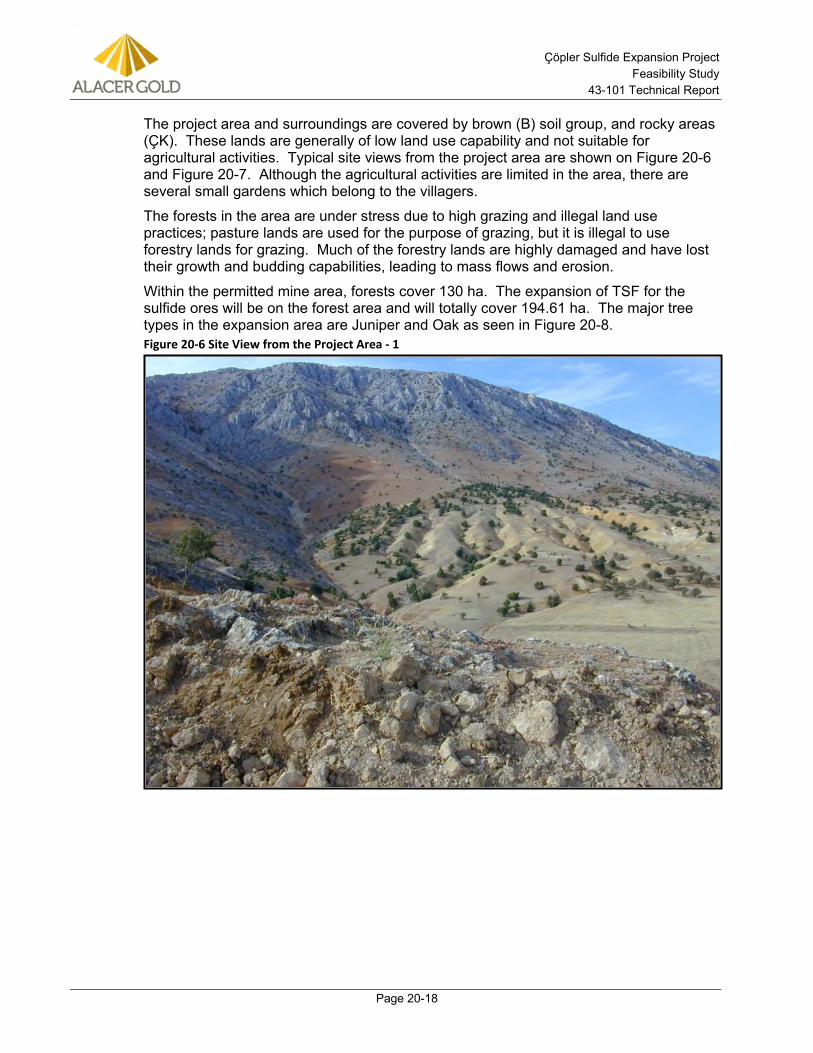
Çöpler Sulfide Expansion Project Feasibility Study
43-101 Technical Report
Page 20-18
The project area and surroundings are covered by brown (B) soil group, and rocky areas (ÇK). These lands are generally of low land use capability and not suitable for agricultural activities. Typical site views from the project area are shown on Figure 20-6 and Figure 20-7. Although the agricultural activities are limited in the area, there are several small gardens which belong to the villagers.
The forests in the area are under stress due to high grazing and illegal land use practices; pasture lands are used for the purpose of grazing, but it is illegal to use forestry lands for grazing. Much of the forestry lands are highly damaged and have lost their growth and budding capabilities, leading to mass flows and erosion.
Within the permitted mine area, forests cover 130 ha. The expansion of TSF for the sulfide ores will be on the forest area and will totally cover 194.61 ha. The major tree types in the expansion area are Juniper and Oak as seen in Figure 20-8. Figure 20-6 Site View from the Project Area - 1
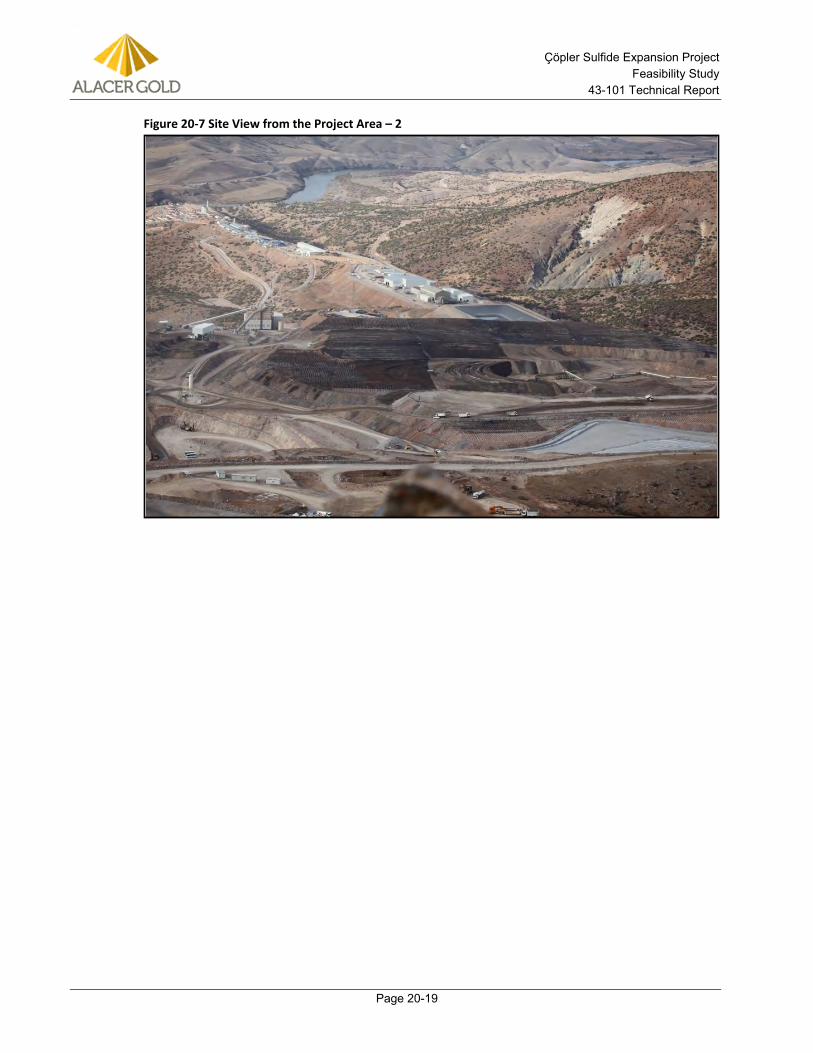
Çöpler Sulfide Expansion Project Feasibility Study
43-101 Technical Report
Page 20-19
Figure 20-7 Site View from the Project Area – 2
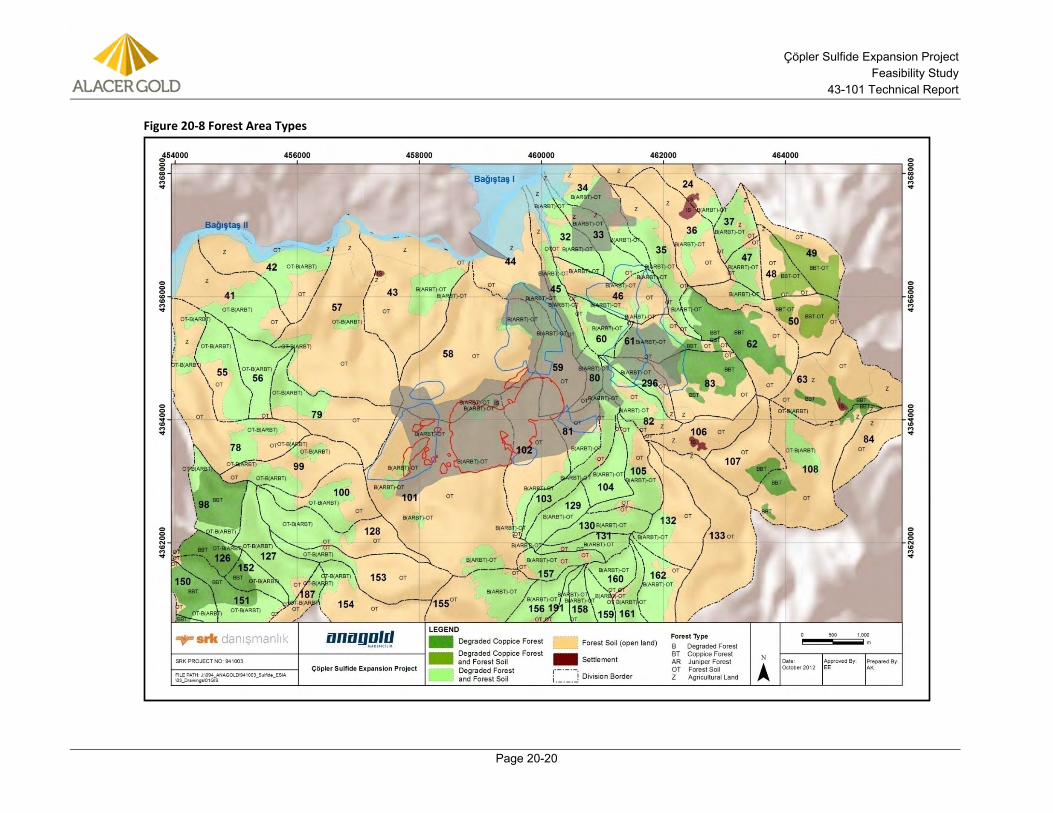
Çöpler Sulfide Expansion Project Feasibility Study
43-101 Technical Report
Page 20-20
Figure 20-8 Forest Area Types
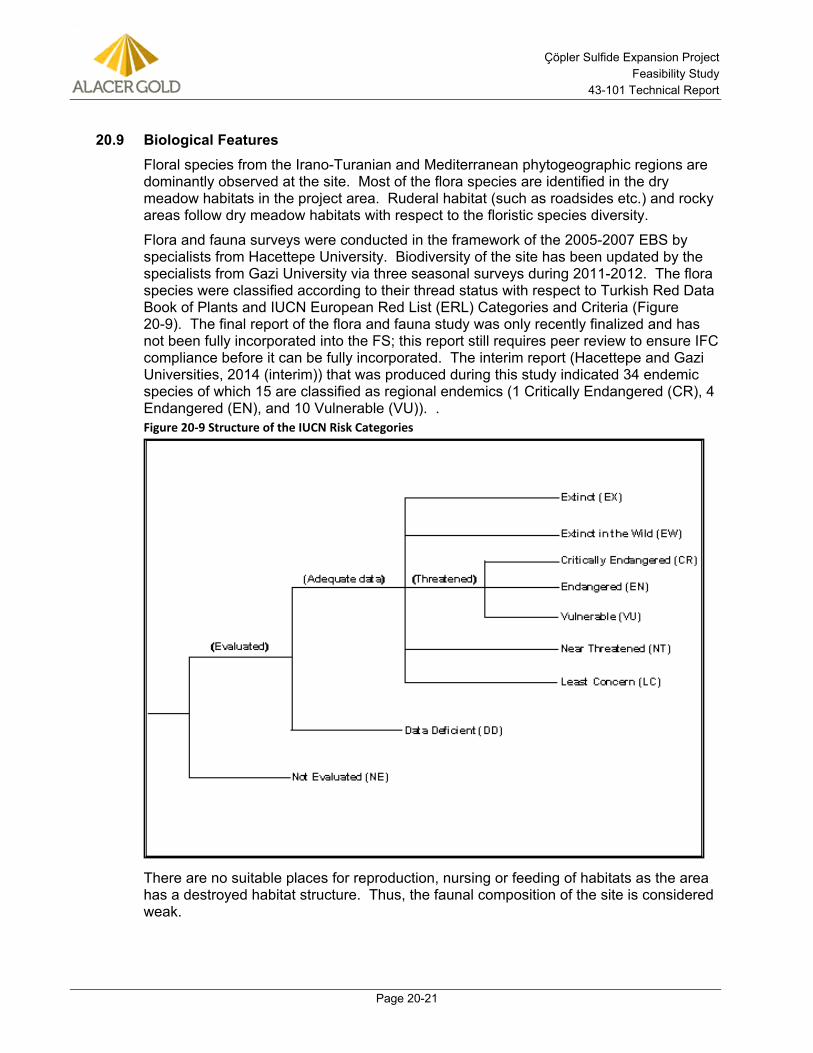
Çöpler Sulfide Expansion Project Feasibility Study
43-101 Technical Report
Page 20-21
20.9 Biological Features Floral species from the Irano-Turanian and Mediterranean phytogeographic regions are dominantly observed at the site. Most of the flora species are identified in the dry meadow habitats in the project area. Ruderal habitat (such as roadsides etc.) and rocky areas follow dry meadow habitats with respect to the floristic species diversity.
Flora and fauna surveys were conducted in the framework of the 2005-2007 EBS by specialists from Hacettepe University. Biodiversity of the site has been updated by the specialists from Gazi University via three seasonal surveys during 2011-2012. The flora species were classified according to their thread status with respect to Turkish Red Data Book of Plants and IUCN European Red List (ERL) Categories and Criteria (Figure 20-9). The final report of the flora and fauna study was only recently finalized and has not been fully incorporated into the FS; this report still requires peer review to ensure IFC compliance before it can be fully incorporated. The interim report (Hacettepe and Gazi Universities, 2014 (interim)) that was produced during this study indicated 34 endemic species of which 15 are classified as regional endemics (1 Critically Endangered (CR), 4 Endangered (EN), and 10 Vulnerable (VU)). . Figure 20-9 Structure of the IUCN Risk Categories
There are no suitable places for reproduction, nursing or feeding of habitats as the area has a destroyed habitat structure. Thus, the faunal composition of the site is considered weak.
Çöpler Sulfide Expansion Project Feasibility Study
43-101 Technical Report
Page 20-22
20.10 Socio-Economic Features This section presents the general socio-demographic and economic characteristics of the settlements to be affected by the Çöpler Sulfide Expansion Project. The project will primarily affect Çöpler, Sabırlı, Bağıştaş, Dostal and Yakuplu villages of İliç district of Erzincan province. The villages are acknowledged as the locally affected communities.
The total population of Erzincan province is 215,277 and its urban population comprises 58.2% of the population (TurkStat, ABPRS 2011). İliç is the third biggest district of Erzincan province by surface area and its population comprises 3.08% of the Erzincan population. The rural population in İliç is more than its urban population. The net migration rate of Erzincan for 2010-2011 is 12.44%. People primarily migrate from Erzincan to İstanbul, Ankara, Erzurum, İzmir and Gümüşhane, respectively.
In general, in the high and mountainous regions of Erzincan the main economic activity is animal husbandry. Orchards and gardens are widespread on the west side of the province. Dry land agriculture becomes a common agricultural activity in the mountain areas. Erzincan is also suitable for animal production; however it is not able to realize its potential due to marketing problems. Wheat and barley production fulfills the needs of the province while other products constitute an important share of domestic production. These include sugar beet, dry bean, potato and feed crop. Apricots, plums, cherry, berries, quince, walnuts, almonds and apples are being grown in Erzincan. Milk production shows an increase in spring and summer seasons. Erzincan is convenient both for ovine and ovine breeding as the amount of meadow and pasture areas are higher than Turkey’s average amounts. Ovine breeding pastures are especially important sources of animal feed. “Caucasus Hybrid” is the most common bee species found in Erzincan. There is a total of 9-17 kg of honey yield is being obtained per beehive from both migratory and stationary apiculture.
İliç is one of the most important districts for apiculture when its annual production is compared to the rest of Erzincan. The main economic activity in the İliç district is ovine breeding and dry agriculture. Wheat, barley, sainfoin and vetch are the main agricultural products grown in the district.
Unemployment rates are higher outlying in districts compared to the city center. The unemployed population in Erzincan is primarily comprised of K-8 education graduates and secondary school graduates. The unemployment rates are higher for the age group of 20-34 and the number of registered unemployed males exceeds the number of registered unemployed females.
Table 20-6 presents the populations and number of households in the villages located within the project impact area. Sabırlı is the most populous village, while Yakuplu is the least populous village according to reported population values. In Bağıştaş and Dostal, the number of households changes in winter and summer; as local people migrates to other cities/provinces during the winter for employment.
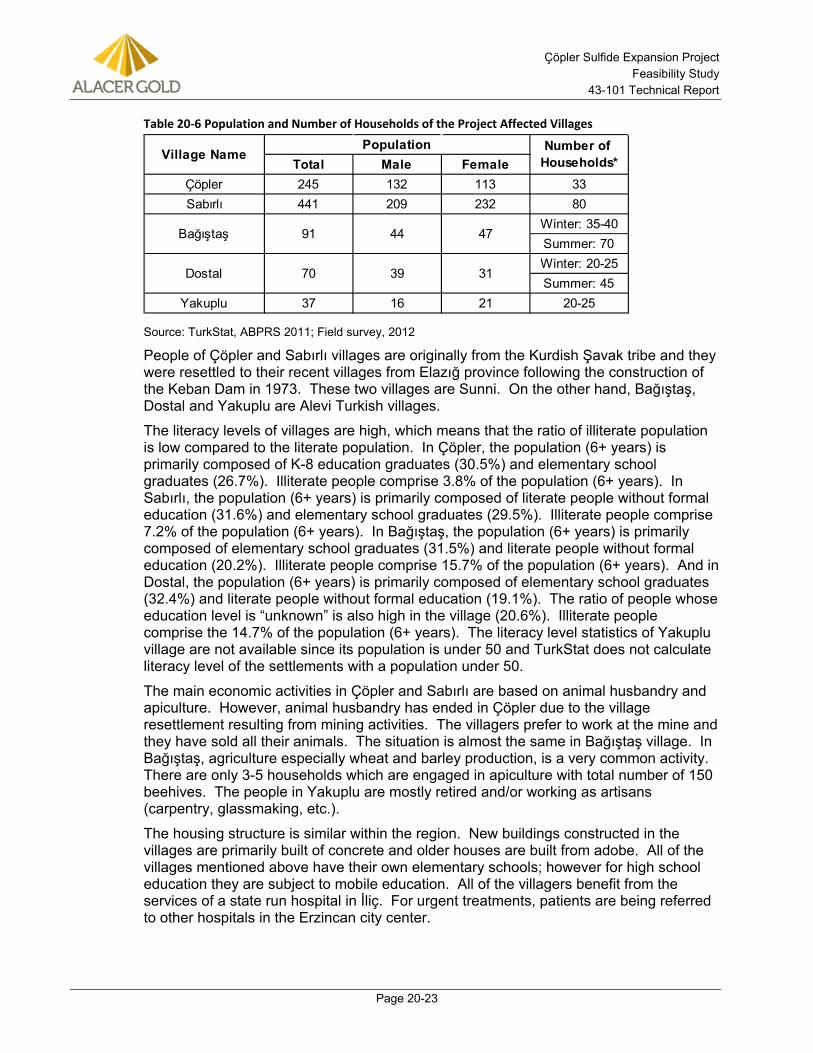
Çöpler Sulfide Expansion Project Feasibility Study
43-101 Technical Report
Page 20-23
Table 20-6 Population and Number of Households of the Project Affected Villages
Source: TurkStat, ABPRS 2011; Field survey, 2012
People of Çöpler and Sabırlı villages are originally from the Kurdish Şavak tribe and they were resettled to their recent villages from Elazığ province following the construction of the Keban Dam in 1973. These two villages are Sunni. On the other hand, Bağıştaş, Dostal and Yakuplu are Alevi Turkish villages.
The literacy levels of villages are high, which means that the ratio of illiterate population is low compared to the literate population. In Çöpler, the population (6+ years) is primarily composed of K-8 education graduates (30.5%) and elementary school graduates (26.7%). Illiterate people comprise 3.8% of the population (6+ years). In Sabırlı, the population (6+ years) is primarily composed of literate people without formal education (31.6%) and elementary school graduates (29.5%). Illiterate people comprise 7.2% of the population (6+ years). In Bağıştaş, the population (6+ years) is primarily composed of elementary school graduates (31.5%) and literate people without formal education (20.2%). Illiterate people comprise 15.7% of the population (6+ years). And in Dostal, the population (6+ years) is primarily composed of elementary school graduates (32.4%) and literate people without formal education (19.1%). The ratio of people whose education level is “unknown” is also high in the village (20.6%). Illiterate people comprise the 14.7% of the population (6+ years). The literacy level statistics of Yakuplu village are not available since its population is under 50 and TurkStat does not calculate literacy level of the settlements with a population under 50.
The main economic activities in Çöpler and Sabırlı are based on animal husbandry and apiculture. However, animal husbandry has ended in Çöpler due to the village resettlement resulting from mining activities. The villagers prefer to work at the mine and they have sold all their animals. The situation is almost the same in Bağıştaş village. In Bağıştaş, agriculture especially wheat and barley production, is a very common activity. There are only 3-5 households which are engaged in apiculture with total number of 150 beehives. The people in Yakuplu are mostly retired and/or working as artisans (carpentry, glassmaking, etc.).
The housing structure is similar within the region. New buildings constructed in the villages are primarily built of concrete and older houses are built from adobe. All of the villages mentioned above have their own elementary schools; however for high school education they are subject to mobile education. All of the villagers benefit from the services of a state run hospital in İliç. For urgent treatments, patients are being referred to other hospitals in the Erzincan city center.
Total Male FemaleÇöpler 245 132 113 33Sabırlı 441 209 232 80
Winter: 35-40Summer: 70Winter: 20-25Summer: 45
Yakuplu 37 16 21 20-25
Dostal 70 39 31
Village NamePopulation Number of
Households*
Bağıştaş 91 44 47
Çöpler Sulfide Expansion Project Feasibility Study
43-101 Technical Report
Page 20-24
Çöpler, Sabırlı, Bağıştaş and Yakuplu villages have sewerage systems; however in Dostal village no sewer system exists. Water supply networks do exist in Çöpler, Sabırlı, Dostal, Bağıştaş and Yakuplu. One of the common infrastructure problems of the settlements is the waste management. The villagers burn or throw their wastes into uncontrolled disposal areas away from their settlements.
All villages have access to electricity for lightning and electronic devices and to land line communications. However it is important to mention that land line subscriptions of the households are frequently cancelled due to high costs and people prefer to use their mobile phones for communication.
20.11 Risks and Opportunities At the time of this report the EIA permitting process was underway and specialist studies are continuing. Therefore, providing a definitive list of the risks and opportunities is not possible at this stage. However, the following general remarks can be made on the risks and opportunities:
• The risks with the EIA permitting process are those that are typically associated with any mining project. The Ministry of Environment and Urbanization has the authority to deny the EIA permit altogether based on unacceptable environmental impacts or ask for revisions to the EIA study that may extend the EIA permitting process beyond the official one-year period.
• The Çöpler mine production from oxide ores was permitted in 2008 and is currently in operation. In terms of permitting, the existing mine provides an opportunity to demonstrate to the regulators the quality of environmental performance of the mine operations.
• The stakeholder engagement process has just begun. Therefore, the public opinion is presently unknown. Negative public opinion due to past mine performance issues may create risk for the project. On the other hand positive public opinion due to new jobs and housing created by the mine can be an opportunity to get further public support for the sulfides expansion during the EIA permitting process.
• The physical, chemical, biological, and socio-economic impacts of the sulfides expansion have not been fully assessed yet. Any significant adverse impact may require expensive mitigation measures.
20.12 Conclusions and Recommendations At the current stage of the project, the E&SIA and related technical studies (hydrogeology, geochemistry, flora and fauna studies etc.) are currently underway or have been completed. The results of these studies will determine the potential impacts of the sulfides expansion project. Further conclusions and recommendations can only be made following the achievement of these results. Furthermore, the Turkish EIA permitting process has just begun. Therefore, the opinions of the permitting agencies and the public are not fully known. As a result of the EIA permitting process, these opinions will be collected and included in the project design.
It is recommended that during the next stage of the Çöpler Sulfides Expansion Project, the environmental and social impacts of the project be reviewed utilizing the information provided in these studies.
Çöpler Sulfide Expansion Project Feasibility Study
43-101 Technical Report
Page 20-25
20.13 Mine Closure and Sustainability This section presents a conceptual closure plan for the proposed project. The closure activities outlined in the following sections are largely based on the requirements set out in the 2008 EIA (SRK, 2008) and a closure plan prepared by Anatolia Minerals in 2009 (Anatolia, 2009). These requirements are applied to the proposed facility arrangements and represent closure of the proposed land disturbances. Completion of the EIA for the Sulfide Expansion Project may include additional commitments and obligations not considered here. The objectives of this closure plan are based on compliance with current regulations and steps outlined in the approved EIA.
Legal Requirements 20.13.1The Turkish “Regulation on Reclamation of Lands Disturbed by Mining Activities,” published in December 2007 and amended in January 2010, requires that the operator abandon the site in a state that is physically, chemically, and biologically stable and which allows beneficial use by the public. The regulation does not prescribe mandatory closure methods, but rather lays the legal foundation for reclamation. At present, the regulation requires reclamation plans be submitted to the agencies in parallel with an environmental impact assessment (EIA) and permitting process. There are no regulatory requirements to submit closure cost estimates, post financial assurance, or conduct community consultation with respect to post-mining land use expectations. However, there are regulatory studies that are aimed to transpose EU directives, such as the Mining Waste Management Directive and the Environmental Liability Directive, into Turkish environmental legislation. The timing for the transposition of these EU directives is currently unknown. Alacer currently has a reclamation plan in the appendices to the approved EIA report prepared in accordance with the Regulation on Environmental Impact Assessment for the Oxide Project and will submit a reclamation plan to include the Sulfide Expansion Project during the preparation of the EIA report addressing the expansion.
Rehabilitation Objectives/Sustainability 20.13.2The proposed sulfide expansion is an expansion of the existing mine facilities. The pits, facility areas, heap leach and waste rock dumps will get larger. The proposed tailings facility will be an expansion of the previously permitted (but not constructed) tailings facility. The operation is described elsewhere in this document. Specific data for the expansion in terms of closure (geochemistry, volumes and geometries) are still being developed. As such closure and rehabilitation objectives will be based largely on the 2008 Environmental Impact Assessment (EIA) and a closure plan developed by Anatolia Minerals in 2009.
The goals of reclamation and closure at the project consider the objectives of sustainable development. These objectives include mitigation of the effects of land disturbances by minimizing or eliminating public safety hazards, providing long-term stable landform configurations, and reclaiming surface disturbances for ongoing beneficial use. The reclamation and closure process will be consistent with local land use objectives, the project’s Environmental Impact Assessment (EIA), World Bank/IFC guidelines pertaining to reclamation and closure, and the Turkish Regulation for Reclamation of Mined Land (Official Gazette No. 26730, 2007).
The criteria listed below will be used to assess the compatibility of the rehabilitation works with the purpose of the Çöpler project.
Çöpler Sulfide Expansion Project Feasibility Study
43-101 Technical Report
Page 20-26
Physical Stability 20.13.3• Long-term stability of engineered structures such as the tailings
impoundment
• Removal and proper disposal of all access roads, structures and equipment not required following the cessation of mining activities
• Long-term stabilization of all exposed erodible materials
Chemical Stability 20.13.4• Acid rock drainage (ARD) prevention, control, and treatment
• Long-term preservation of water quality within and downstream of decommissioned operations
• Human health and safety
Specific objectives for each of the proposed facilities are discussed in the following sections.
Open Pits 20.13.5• Ensuring the safety of local residents and livestock
• Development of stable post-closure pit wall conditions
• Protecting surface water and groundwater resources
Waste Rock Dumps 20.13.6• Development of stable slopes capable of withstanding seismic events
• Placement of the cover and the development of a self-sustaining vegetative cover that supports the identified post-closure land use and controls erosion and sedimentation
• Limiting infiltration of surface water into the waste rock
• Limiting the quantity of drainage from the waste rock and its potential impact on surface water quality
• Limiting seepage to groundwater
Heap Leach Facility (HLF) 20.13.7• Stabilize the HLF to prevent wind and water erosion
• Establish a cover to limit infiltration into the HLF
• Establish surface drainage to limit run-on that is capable of passing the run-off from the design storm event
• Establish self-sustaining vegetation consistent with the proposed post-closure land use
• Maintain physical stability of the fill embankments under static conditions and dynamic loading conditions corresponding to the design earthquake loading
• Maintain chemical stability of the leached ore
Çöpler Sulfide Expansion Project Feasibility Study
43-101 Technical Report
Page 20-27
• Minimize impacts to local water resources as a result of seepage from the tailings
• Manage drain-down within the HLF area
Tailings Storage Facility 20.13.8• Establish a surface configuration that will not impound water or define
activities to remove impounded water from final reclaimed surface
• Waters from a Probable Maximum Flood (PMF) storm can be passed safely off the impoundment surface either through positive drainage or activities designed to remove water from final reclaimed surface
• Establish a cover to limit infiltration into the tailings and migration of metals upwards into the vegetative cover
• Establish surface drainage to limit run-on that is capable of passing the run-off from the design storm event
• Establish self-sustaining vegetation consistent with the proposed post-closure land use
• Maintain physical stability of the fill embankments under static conditions and dynamic loading conditions corresponding to the design earthquake
• Maintain chemical stability of the tailings
• Minimize impacts to local water resources as a result of seepage from the TSF
• Manage surface water within the TSF area
Infrastructure 20.13.9Buildings
• Elimination of physical and chemical hazards;
• Demolition and removal of structures where a post-mining land use has not been identified
• Development of a self-sustaining vegetative cover that supports the identified post-closure land use and controls erosion and sedimentation
• Testing for and removal of any areas of contaminated soils
Yards • Development of a self-sustaining vegetative cover that supports the
identified post-closure land use and controls erosion and sedimentation;
Roads • Removal and reconstruction of the approximate pre-mining contours
where a post-mining land use has not been identified
• Development of a self-sustaining vegetative cover that supports the identified post-closure land use and controls erosion and sedimentation
Çöpler Sulfide Expansion Project Feasibility Study
43-101 Technical Report
Page 20-28
20.14 Long Term Water Management In order to meet the closure objectives to protect surface and groundwater from environmental degradation various strategies for managing water will be employed as discussed below. Geochemistry studies to predict water quality are ongoing but not complete at this time.
Ongoing modeling may prove that discharge of seepage water to the environment will be appropriate; however, for the purposes of this closure cost estimate SRK has assumed treatment will be required. Likewise, pit lake modeling may prove the lake will not require treatment; however for the purposes of this estimate SRK has assumed treatment will be required.
Open Pits 20.14.1As discussed above SRK has assumed a one-time treatment of the pit lake will be required. Based on experience at other sites SRK has assumed that each 1,000 L of pit lake water will be treated with ½ tonne of CaO.
The pit volume at elevation 1050 amsl is 16 Mm3. Hydrogeological studies and pit lake studies are ongoing. SRK assumes that a volume of water equivalent to the volume of the pit at 1050 amsl will require treatment over the period required for lake filling.
Heap Leach 20.14.2Following the completion of cyanide leaching operations an operational rinse will be performed. This will include operating the processing circuit with fresh water without the addition of cyanide. The operational rinse will continue until recovery of gold proves un-economic. Following the operational rinse cycle, the residual drain-down solution will be analyzed and rinsing will continue until the drain-down meets the Regulation of Control of Water Contamination levels (SRK 2008). Based on experience at other sites, the rinsing process will be completed in approximately 18 months. For the purposes of the closure cost estimate, the operational rinse is assumed to last at least 18 months.
Following the rinsing process the solution will be allowed to drain from the heap into the process ponds. Solution from the ponds will be pumped back to the heap surface and evaporated using snowmakers or recirculated through the existing drip system. The heap solutions will be recycled to the snowmakers until the residual drain-down reaches steady state.
When the drain-down reaches a rate that can be handled passively, the process and emergency ponds will be converted to evapo-transpiration (ET) cells, which will passively evaporate the residual drain-down.
Tailings 20.14.3The tailings impoundment will be constructed with an over-drain system and an under-drain system. Collected fluids will report to a sump constructed within the tailings impoundment at the upstream facing toe of the TSF embankment. Fluids will be transferred to a pipe, which will drain by gravity to the downstream facing toe of the TSF embankment and then to a holding pond located north of the TSF facility, within the clay borrow area. During operations, seepage from the tailings
Çöpler Sulfide Expansion Project Feasibility Study
43-101 Technical Report
Page 20-29
will be pumped from the holding pond to the mill, and recycled back to the mill water requirements (Golder 2014d).
Following tailings operations the over-drain seepage will be pumped from the holding pond and actively evaporated through misters or snowmakers with any balance applied to the tailings surface via sprinklers. The snowmakers will be located on the dam crest. A tailings closure water balance has not been completed at this time.
Given the settlement estimates on TSF-1 at the end of deposition (Golder 2014d), and that a strategy to prevent water from ponding on the TSF has not been developed at this time, SRK assumes that precipitation falling on the tailings surface will create a pond during the wet months and require pumping to a nearby drainage for removal. The duration for this requirement is assumed to be in perpetuity.
Waste Rock Dumps 20.14.4Geochemistry studies of the waste rock materials are ongoing and results are not yet available. Seepage from the waste rock dumps in the previous EIA was predicted to be 5% of the rainfall (SRK 2008). For this exercise, SRK has assumed this same amount will be produced from the planned waste rock dumps. Seepage from the waste rock dumps will be directed into the pits and treated as described for pit lake water.
Because the toe of the North WRD is topographically below the pit crest, the seepage will need to be captured in a pond and pumped into the pit. For closure costs a small lined pond is assumed with a 2 kilometer length of HDPE piping.
Surface Water 20.14.5Diversions will be constructed to direct surface water away from the mine facilities. No treatment is contemplated for surface waters.
20.15 Closure Approach and Basis for Closure Cost Estimate Open Pit 20.15.1As discussed in Section 20.14, SRK has assumed a one-time treatment of the pit lake will be required. Based on experience at other sites, SRK has assumed that each 1,000 m3 of pit lake water will be treated with ½ tonne of CaO. The lake level will equilibrate at 1050 amsl in approximately 48 years.
Tailings 20.15.2The closure of the tailings will include the following tasks.
• Active management (evaporation) of over-drain seepage for 20 years.
• The tailings will be allowed to consolidate and dry for two years prior to placement of a traffic layer of waste rock which will be one meter thick. This rock layer will allow the operation of small equipment on the surface and function as a capillary break to prevent tailings water migrating into the surface cover.
• Given the settlement depths on the tailings surface as provided in the TSF Design Report (Golder, 2014d), placement of the cover layer will not
Çöpler Sulfide Expansion Project Feasibility Study
43-101 Technical Report
Page 20-30
be sufficient to provide positive draining of the surface and ponding is expected, requiring an assumption for long-term pumping of water around the wet season to remove the pond. A conceptual closure diversion upstream of the TSF was developed by Golder as part of the Flood Management Plan (Golder, 2013a). The design of this channel has been included in the construction costs for closure developed by SRK.
• One meter of fine-grained cover material will be placed on the surface of the waste rock cover and (if available) will include any topsoil salvaged from the footprint of the facility. If topsoil is available it will be placed at the top of the cover to facilitate re-vegetation. The fine-grained cover will act as a store and release cover to minimize infiltration of surface water into the heap leach pad.
• The surface will be re-vegetated with a seed mix including native grasses and bushes. Trees will not be planted because they might cause damage to the cover.
Heap Leach Pad 20.15.3Closure of the heap leach pad will include the following activities.
• Recirculation of process solutions to recover residual gold and reduction of the inventory will continue for up to 18 months as discussed in Section 20.14.2 (this is assumed to be an operational cost and not applied to closure).
• Active management of the solution drainage from the heap leach through forced evaporation for up to one year.
• Converting the process ponds to an ET cell and passively manage the solution drainage from the heap.
• Re-grading the heap leach pad to a final slope of 2H:1V and construct new liner where required (assumed to be 50% of the perimeter).
• Placing one meter of fine-grained cover material on the surface of the heap leach and (if available) this will include any topsoil salvaged from the footprint of the facility. If topsoil is available it will be placed at the top of the cover to facilitate re-vegetation. The one-meter cover will act as a store and release cover to minimize infiltration of surface water into the heap leach pad.
• Revegetation of the surface with a seed mix including native grasses and bushes. Trees will not be planted because they might cause damage to the cover.
Waste Rock Dumps 20.15.4Closure of the waste rock dumps will include the following activities.
• Grading the slopes to 2.5H:1V.
• Placing one meter of fine-grained cover material on the surface. If available this will include any topsoil salvaged from the footprint of the facility. If topsoil is available it will be placed on top of the cover to facilitate re-vegetation. The one-meter cover will act as a store and
Çöpler Sulfide Expansion Project Feasibility Study
43-101 Technical Report
Page 20-31
release cover to minimize infiltration of surface water into the heap leach pad.
• Diversions will be constructed to direct run-on surface water away from the waste rock facilities. In most cases the water will be directed to the open pits, however, the south waste rock diversion will empty into a settling pond and be directed to Çöpler Creek.
Yards and Roads 20.15.5Closure of other surface facilities like Yards and Roads will include the following activities;
• Roads which do not have an identified post-mining land use will be removed and the ground graded to the approximate pre-mining slopes. Road construction often uses native surface soils which when placed back in the road bed will be sufficient for re-vegetation. No additional cover will be planned for road rehabilitation.
• Flat areas like yards will be graded back to near natural pre-mining conditions. In places where cut and fills were substantial this may include placement of fine-grained cover materials or topsoil if available.
Processing, Administration and Other Infrastructure 20.15.6Process buildings and other infrastructure without a defined post-mining use will be demolished. The mill buildings, tanks and related piping will be decontaminated by rinsing with fresh water prior to demolishment. Sampling and testing will be done for removal of any areas of contaminated soils.
Materials with scrap value will be separated and hauled offsite for recycling. Although recent experience proves there is value in the metal from mill buildings no offset of the closure costs will be assumed. All other materials without scrap value will be hauled to a nearby licensed landfill.
Other Facilities 20.15.7Water Wells Production and monitoring wells will be abandoned after they are not needed for water supply or monitoring purposes. Pumps (if any) will be removed. A drill rig will be used to pump grout into the well to seal it.
Power Lines Power lines without a post-mining land use or which do not serve customers outside the mine area will be removed. Metals will be hauled offsite for recycling. Closure costs have not been offset by scrap value.
Fences The project perimeter fence will be removed at the end of the rehabilitation. Sections of the fence around the tailings will remain in place to prevent access.
Solid Wastes Non-hazardous construction debris will be hauled offsite to a nearby licensed landfill. All solid and hazardous wastes present at the end of mine life will be disposed offsite by licensed handling companies. The autoclave will generate a
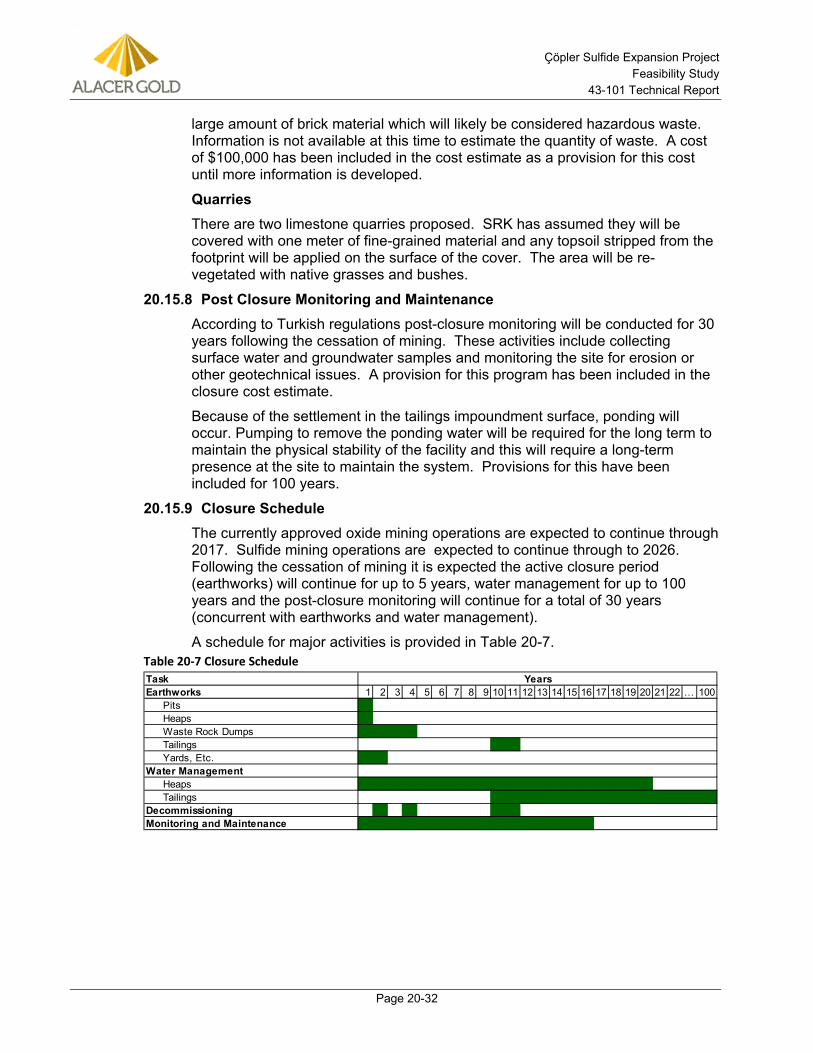
Çöpler Sulfide Expansion Project Feasibility Study
43-101 Technical Report
Page 20-32
large amount of brick material which will likely be considered hazardous waste. Information is not available at this time to estimate the quantity of waste. A cost of $100,000 has been included in the cost estimate as a provision for this cost until more information is developed.
Quarries There are two limestone quarries proposed. SRK has assumed they will be covered with one meter of fine-grained material and any topsoil stripped from the footprint will be applied on the surface of the cover. The area will be re-vegetated with native grasses and bushes.
Post Closure Monitoring and Maintenance 20.15.8According to Turkish regulations post-closure monitoring will be conducted for 30 years following the cessation of mining. These activities include collecting surface water and groundwater samples and monitoring the site for erosion or other geotechnical issues. A provision for this program has been included in the closure cost estimate.
Because of the settlement in the tailings impoundment surface, ponding will occur. Pumping to remove the ponding water will be required for the long term to maintain the physical stability of the facility and this will require a long-term presence at the site to maintain the system. Provisions for this have been included for 100 years.
Closure Schedule 20.15.9The currently approved oxide mining operations are expected to continue through 2017. Sulfide mining operations are expected to continue through to 2026. Following the cessation of mining it is expected the active closure period (earthworks) will continue for up to 5 years, water management for up to 100 years and the post-closure monitoring will continue for a total of 30 years (concurrent with earthworks and water management).
A schedule for major activities is provided in Table 20-7. Table 20-7 Closure Schedule
TaskEarthworks 1 2 3 4 5 6 7 8 9 10 11 12 13 14 15 16 17 18 19 20 21 22 … 100
Pits 21124
Heaps 1125355
Waste Rock Dumps 3652718 3044916 3026934 2176806
Tailings 5734399 4592516
Yards, Etc. 1299711 1299711
Water ManagementHeaps 185468 2188 2188 2188 2188 2188 2188 2188 2188 2188 2188 2188 2188 2188 2188 2188 2188 2188 2188 8
Tailings 279017 48072 48072 48072 1068 39084 39084 39084 39084 39024 34620 34620 34620 302280
Decommissioning 100000 96068 1170357 1170357
Monitoring and Maintenance $574,240 572239.7 572239.7 547845.4 37429.14 37429.14 37429.14 37429.14 7417.815 7417.815 9417.815 7417.815 7417.815 7417.815 7417.815 7417.815
Years
Çöpler Sulfide Expansion Project Feasibility Study
43-101 Technical Report
Page 20-33
20.16 Closure Costs Closure Cost Unit Rates 20.16.1Equipment Equipment costs were based on costs provided by the mining contractor (Ciftay) obtained on October 19, 2012. The costs quoted include the following elements:
• Ownership costs
• Preventative maintenance
• Ground engaging tools
• Fuel
• Tire wear (where applicable)
The Standard Reclamation Cost Estimator (SRCE) model has been used reclamation and closure cost estimation. The SRCE cost model automatically calculates fuel consumption as part of the equipment rates. Therefore fuel consumption costs were backed out of the provided equipment rates based on fuel burn rates provided by Ciftay. The current mining contactor is assumed to be available to conduct earthworks for closure.
For equipment not available in the mining fleet costs were assumed to be equivalent to US rental costs.
The contractor uses 36 tonne capacity over-the-road dump trucks. Because the cost model SRK uses is standardized on Caterpillar equipment we have assumed a Caterpillar 735 for calculations.
Because the closure will be performed by the mining contractor SRK has not included equipment mobilization fees.
Labor Labor rates including benefits, taxes, and insurance were provided by Jacob’s Engineering as used in the Feasibility Study.
Other Material costs for fuel and electricity were provided by Alacer in 2011 and are assumed to be equivalent for this project. For miscellaneous items which are used in small quantities in the cost calculation, rates were obtained from RS Means (2009) or other US sources.
Closure Cost Productivities 20.16.2Productivity data and calculations were based on:
• Caterpillar Handbook, Edition 35 for productivity calculations as incorporated into the BRCE;
• Means Heavy Construction Handbook for productivities/crews was used for demolition; and
• Where first principles methods for calculating productivities were not applicable or adequate information was not available, best professional judgment of local engineers and data from similar projects was used.
Çöpler Sulfide Expansion Project Feasibility Study
43-101 Technical Report
Page 20-34
Key Assumptions 20.16.3Key assumptions used to complete the closure cost estimate are provided below.
• The reclamation slope for heaps and dumps is 2.5H:1V, (Anatolia 2009 and SRK 2008).
• Fifty percent of the perimeter of the heap leach will require additional liner (4 m) to accommodate re-grading the heap leach slope to 2.5H:1V. Costs for liner materials and installation were provided by Golder (2014d) and were inflated by 50% to account for the increased work required for smaller installations.
• A total of 7.4 Mm3 (minus existing stockpiled growth media) of cover soil would be obtained from a developed borrow area and temporarily stored near the foot of the tailings dams. All haul distance calculations are based on this assumption.
• Tailings long-term fluid management will be calculated for 20 years.
• In addition to the one meter of waste rock another one meter average thickness of waste rock will be applied to the tailings surface. The source of this material will be the haul road crossing Sabırlı Creek.
• The placement of cover and growth media material on the tailings impoundment surface will not be sufficient to create a positive drainage surface as the settlement at the surface of the tailings is estimated to continue up to approximately 23 m around the center of the tailings impoundment surface (roughly above the location of the upstream toe of the embankment) by Year 100 after end of deposition. Long-term pumping of water will be required to maintain physical stability of the facility.
Final Closure Costs 20.16.4The closure cost estimate includes both a Closure and Post-Closure period. The Closure cost period includes the physical reclamation activities and is scheduled to last 30 years. The Post-Closure period includes the long-term maintenance, fluid management of heap and tails and monitoring and is scheduled out to 30 years.
The total closure costs estimated for the Sulfide Project is US$67.9 Million. This includes a contingency cost of 20% (US$10.4M) and contractor profit of 10% (US$5.2M). The closure costs are provided in Table 20-8.
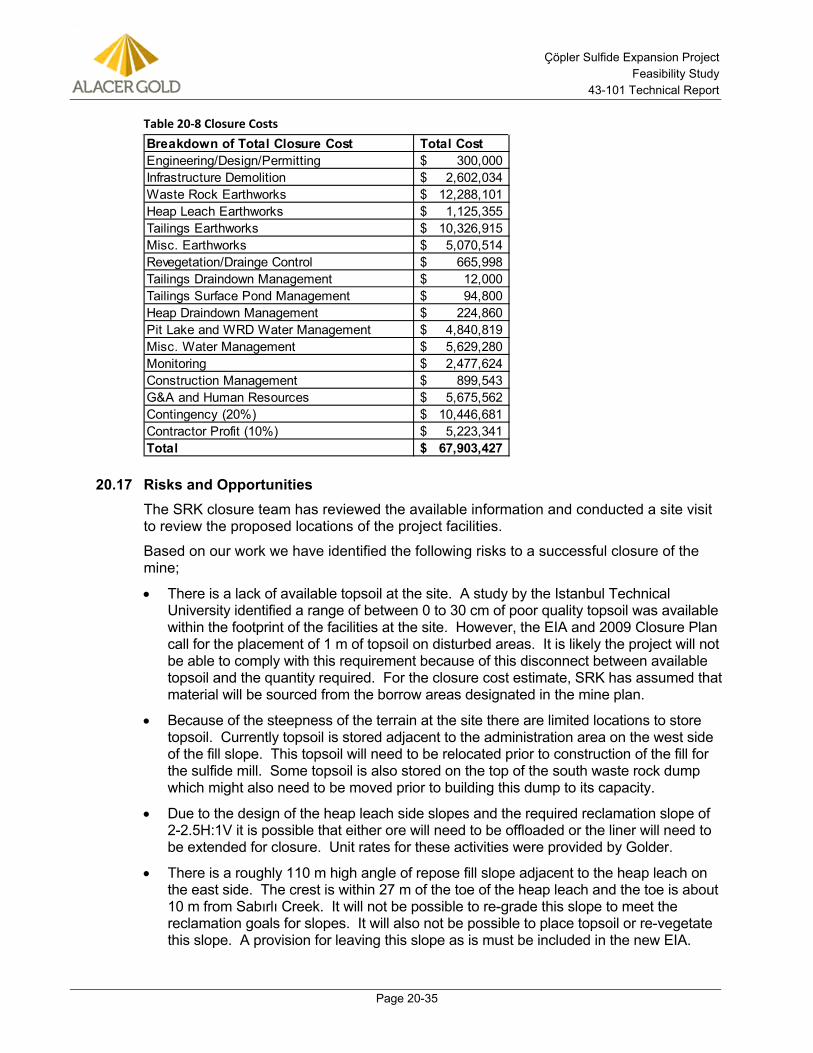
Çöpler Sulfide Expansion Project Feasibility Study
43-101 Technical Report
Page 20-35
Table 20-8 Closure Costs
20.17 Risks and Opportunities The SRK closure team has reviewed the available information and conducted a site visit to review the proposed locations of the project facilities.
Based on our work we have identified the following risks to a successful closure of the mine;
• There is a lack of available topsoil at the site. A study by the Istanbul Technical University identified a range of between 0 to 30 cm of poor quality topsoil was available within the footprint of the facilities at the site. However, the EIA and 2009 Closure Plan call for the placement of 1 m of topsoil on disturbed areas. It is likely the project will not be able to comply with this requirement because of this disconnect between available topsoil and the quantity required. For the closure cost estimate, SRK has assumed that material will be sourced from the borrow areas designated in the mine plan.
• Because of the steepness of the terrain at the site there are limited locations to store topsoil. Currently topsoil is stored adjacent to the administration area on the west side of the fill slope. This topsoil will need to be relocated prior to construction of the fill for the sulfide mill. Some topsoil is also stored on the top of the south waste rock dump which might also need to be moved prior to building this dump to its capacity.
• Due to the design of the heap leach side slopes and the required reclamation slope of 2-2.5H:1V it is possible that either ore will need to be offloaded or the liner will need to be extended for closure. Unit rates for these activities were provided by Golder.
• There is a roughly 110 m high angle of repose fill slope adjacent to the heap leach on the east side. The crest is within 27 m of the toe of the heap leach and the toe is about 10 m from Sabırlı Creek. It will not be possible to re-grade this slope to meet the reclamation goals for slopes. It will also not be possible to place topsoil or re-vegetate this slope. A provision for leaving this slope as is must be included in the new EIA.
Breakdown of Total Closure Cost Total CostEngineering/Design/Permitting 300,000$ Infrastructure Demolition 2,602,034$ Waste Rock Earthworks 12,288,101$ Heap Leach Earthworks 1,125,355$ Tailings Earthworks 10,326,915$ Misc. Earthworks 5,070,514$ Revegetation/Drainge Control 665,998$ Tailings Draindown Management 12,000$ Tailings Surface Pond Management 94,800$ Heap Draindown Management 224,860$ Pit Lake and WRD Water Management 4,840,819$ Misc. Water Management 5,629,280$ Monitoring 2,477,624$ Construction Management 899,543$ G&A and Human Resources 5,675,562$ Contingency (20%) 10,446,681$ Contractor Profit (10%) 5,223,341$ Total 67,903,427$
Çöpler Sulfide Expansion Project Feasibility Study
43-101 Technical Report
Page 20-36
• The tailings impoundment operating design specifies the supernatant pond will be located against the hill on the east side with tailings deposition on beaches to the north, west and south. This design will require additional fill to create a positive draining surface that will not pond water. Since the fill will need to be placed in the supernatant pond area it will also be difficult to predict the amount of fill required to overcome differential settlement in that area.
• Based on discussions with the engineering team designing the process and tailings systems, it is likely the tailings at closure will not support equipment and may not do so for quite some time. This requires the placement of a traffic layer of waste rock and or placement of geosynthetic fabric in order to place the final cover.
Based on SRK’s site visit and discussions with mine staff SRK has identified the following opportunities.
• It may be possible to change the required reclamation slope for the heap to 2H:1V to minimize the amount of offloading and/or liner extension. A geotechnical study should be done to establish whether this steeper slope would meet the reclamation objectives.
• Consideration should be made whether the supernatant pond could be moved across the dam surface to the west as the tailings elevation approaches final design. This would allow the placement of less fill to create a positive draining tailings surface.
20.18 Conclusions and Recommendations Closure of the Çöpler mine will include decommissioning all facilities without an identified post-mining land use, grading of all fill slopes to 2.5H:1V, covering facilities with a reclamation cover and re-vegetating the surface of all disturbed areas. It is anticipated the earthwork and decommissioning work will take 4 years and cost US$32 M. Treatment of waste rock seepage and pit lake water will be conducted on an ongoing basis and will cost an estimated US$4.8 M. Process fluid management of the seepage from heaps and tails will be conducted in a zero-discharge fashion and will cost US$3.5 M. Monitoring is estimated to cost US$2.5 M. These items comprise the majority of the closure costs calculated for Çöpler.
SRK recommends that Alacer review the tailings design to see if it can be modified to provide drainage surface on the tailings storage facility surface after closure and prevent ponding of water where settlement of the surface will be occurring. Alternately, a feasibility study should be undertaken to evaluate closure design without positive drainage from the tailings surface.
A trade-off study should be undertaken to evaluate whether the application of geotextile on the tailing surface might allow a thinner waste rock cover.
SRK also recommends that Alacer conduct studies for growth media material sourcing.
Alacer recognizes its commitment to properly close the Çöpler mine in accordance with the obligations derived from the EIA process and the identified post-mining land use. Alacer also recognizes its obligation to ongoing monitoring and maintenance until the land can be successfully relinquished.
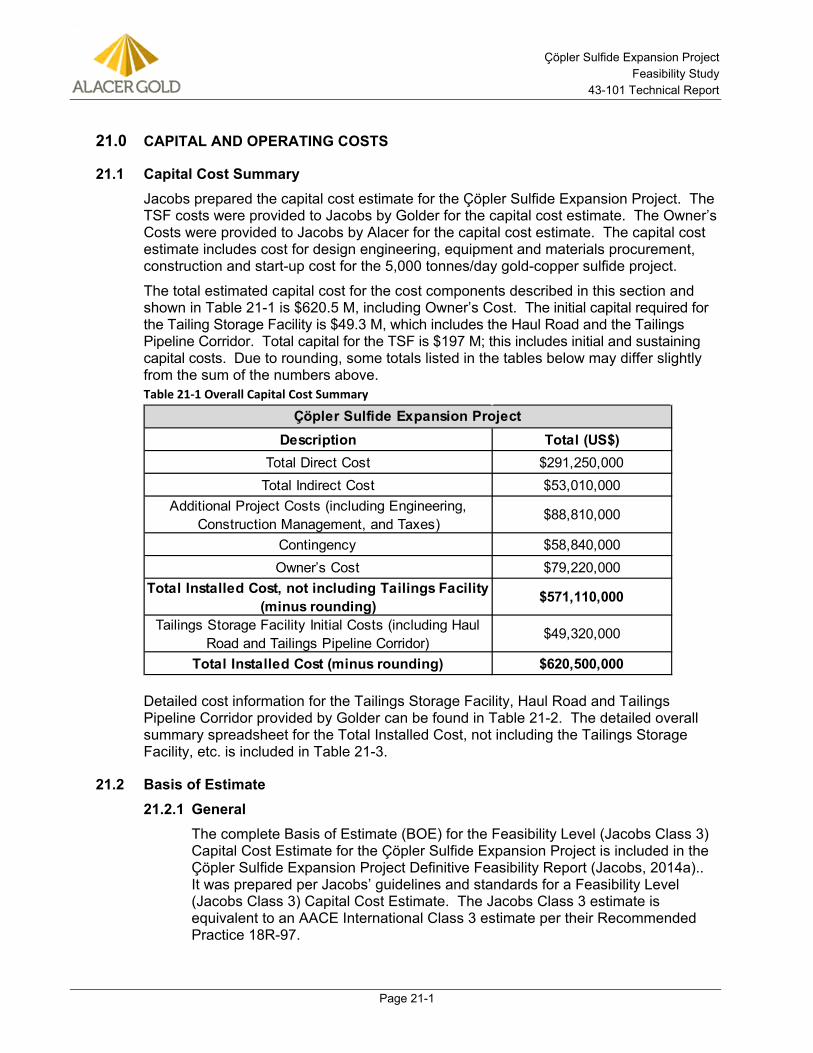
Çöpler Sulfide Expansion Project Feasibility Study
43-101 Technical Report
Page 21-1
21.0 CAPITAL AND OPERATING COSTS
21.1 Capital Cost Summary Jacobs prepared the capital cost estimate for the Çöpler Sulfide Expansion Project. The TSF costs were provided to Jacobs by Golder for the capital cost estimate. The Owner’s Costs were provided to Jacobs by Alacer for the capital cost estimate. The capital cost estimate includes cost for design engineering, equipment and materials procurement, construction and start-up cost for the 5,000 tonnes/day gold-copper sulfide project.
The total estimated capital cost for the cost components described in this section and shown in Table 21-1 is $620.5 M, including Owner’s Cost. The initial capital required for the Tailing Storage Facility is $49.3 M, which includes the Haul Road and the Tailings Pipeline Corridor. Total capital for the TSF is $197 M; this includes initial and sustaining capital costs. Due to rounding, some totals listed in the tables below may differ slightly from the sum of the numbers above. Table 21-1 Overall Capital Cost Summary
Detailed cost information for the Tailings Storage Facility, Haul Road and Tailings Pipeline Corridor provided by Golder can be found in Table 21-2. The detailed overall summary spreadsheet for the Total Installed Cost, not including the Tailings Storage Facility, etc. is included in Table 21-3.
21.2 Basis of Estimate General 21.2.1The complete Basis of Estimate (BOE) for the Feasibility Level (Jacobs Class 3) Capital Cost Estimate for the Çöpler Sulfide Expansion Project is included in the Çöpler Sulfide Expansion Project Definitive Feasibility Report (Jacobs, 2014a).. It was prepared per Jacobs’ guidelines and standards for a Feasibility Level (Jacobs Class 3) Capital Cost Estimate. The Jacobs Class 3 estimate is equivalent to an AACE International Class 3 estimate per their Recommended Practice 18R-97.
Description Total (US$)Total Direct Cost $291,250,000
Total Indirect Cost $53,010,000 Additional Project Costs (including Engineering,
Construction Management, and Taxes)$88,810,000
Contingency $58,840,000 Owner’s Cost $79,220,000
Total Installed Cost, not including Tailings Facility (minus rounding) $571,110,000
Tailings Storage Facility Initial Costs (including Haul Road and Tailings Pipeline Corridor)
$49,320,000
Total Installed Cost (minus rounding) $620,500,000
Çöpler Sulfide Expansion Project
Çöpler Sulfide Expansion Project Feasibility Study
43-101 Technical Report
Page 21-2
This BOE describes the guidelines by which the estimate was prepared, the areas of responsibility, the scope of the estimate, the estimate methodologies, and the significant assumptions/clarifications and exclusions.
Estimate Type / Accuracy 21.2.2The estimate was prepared per Jacobs’ guidelines and standards for a Feasibility Level (Jacobs Class 3) Capital Cost Estimate per Jacobs Standard Operating Procedures. This estimate provides a basis for evaluating the economic viability of the project and for approving the project for advancement into Basic/Detail engineering, as well as providing a basis for advance commitments. The capital cost estimate identifies the capital costs associated with the agreed upon scope of work.
At the completion of the Feasibility Study, the resultant accuracy range (+18%/-10%) of the estimate was determined using a Monte Carlo risk analysis, estimator and project personnel judgment and industry standards. The estimate basis documents represent an average definition of process facility design completion of approximately 10% - 15% of engineering.
21.3 Direct Cost Elements Tailings Storage Facility, Including Sustaining Costs 21.3.1The boundaries for the project scope-of-work include the process plant from the primary crusher to the tailings discharge; support infrastructure such as warehouse/maintenance shop; and utilities including standby power generation and power distribution. The Tailings Storage Facility is designed and estimated by others (Golder).
Initial capital and sustaining capital costs for construction of the TSF were estimated from the feasibility level design drawings provided by Golder for inclusion in the Feasibility Study. Tailings deposition is expected to start during the second half of 2017, assuming the approval of the EIA and start of TSF construction in early 2015.
The costs for construction of the TSF are presented in Table 21-2 on an annual basis and by phase of development. Costs for the construction of the rockfill embankment make up approximately 40% of the total costs and are the largest component of the TSF and have been shown separately.
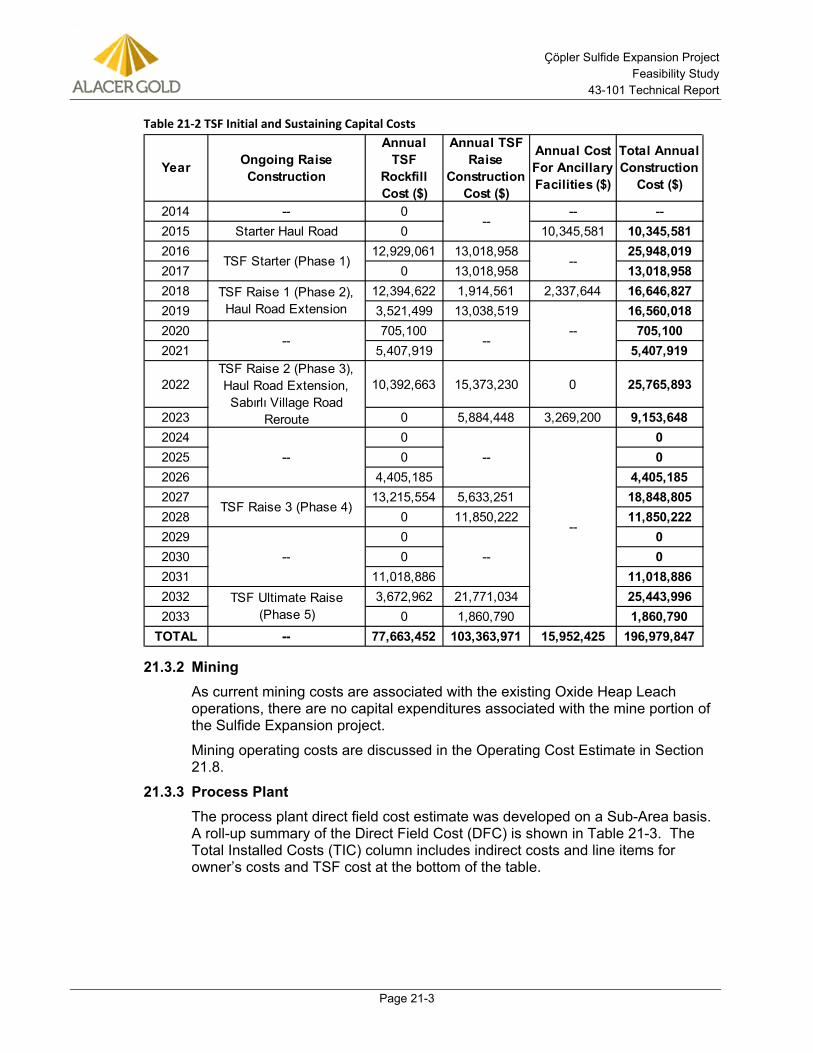
Çöpler Sulfide Expansion Project Feasibility Study
43-101 Technical Report
Page 21-3
Table 21-2 TSF Initial and Sustaining Capital Costs
Mining 21.3.2As current mining costs are associated with the existing Oxide Heap Leach operations, there are no capital expenditures associated with the mine portion of the Sulfide Expansion project.
Mining operating costs are discussed in the Operating Cost Estimate in Section 21.8.
Process Plant 21.3.3The process plant direct field cost estimate was developed on a Sub-Area basis. A roll-up summary of the Direct Field Cost (DFC) is shown in Table 21-3. The Total Installed Costs (TIC) column includes indirect costs and line items for owner’s costs and TSF cost at the bottom of the table.
2014 -- 0 -- --2015 Starter Haul Road 0 10,345,581 10,345,5812016 12,929,061 13,018,958 25,948,0192017 0 13,018,958 13,018,9582018 12,394,622 1,914,561 2,337,644 16,646,8272019 3,521,499 13,038,519 16,560,0182020 705,100 705,1002021 5,407,919 5,407,919
2022 10,392,663 15,373,230 0 25,765,893
2023 0 5,884,448 3,269,200 9,153,6482024 0 02025 0 02026 4,405,185 4,405,1852027 13,215,554 5,633,251 18,848,8052028 0 11,850,222 11,850,2222029 0 02030 0 02031 11,018,886 11,018,8862032 3,672,962 21,771,034 25,443,9962033 0 1,860,790 1,860,790
TOTAL -- 77,663,452 103,363,971 15,952,425 196,979,847
TSF Raise 3 (Phase 4)
TSF Ultimate Raise (Phase 5)
Ongoing Raise Construction
--
--
----
--
--
--
--
--
--
Annual Cost For Ancillary Facilities ($)
Total Annual Construction
Cost ($)
TSF Starter (Phase 1)
TSF Raise 1 (Phase 2), Haul Road Extension
TSF Raise 2 (Phase 3), Haul Road Extension, Sabırlı Village Road
Reroute
Year
Annual TSF
Rockfill Cost ($)
Annual TSF Raise
Construction Cost ($)
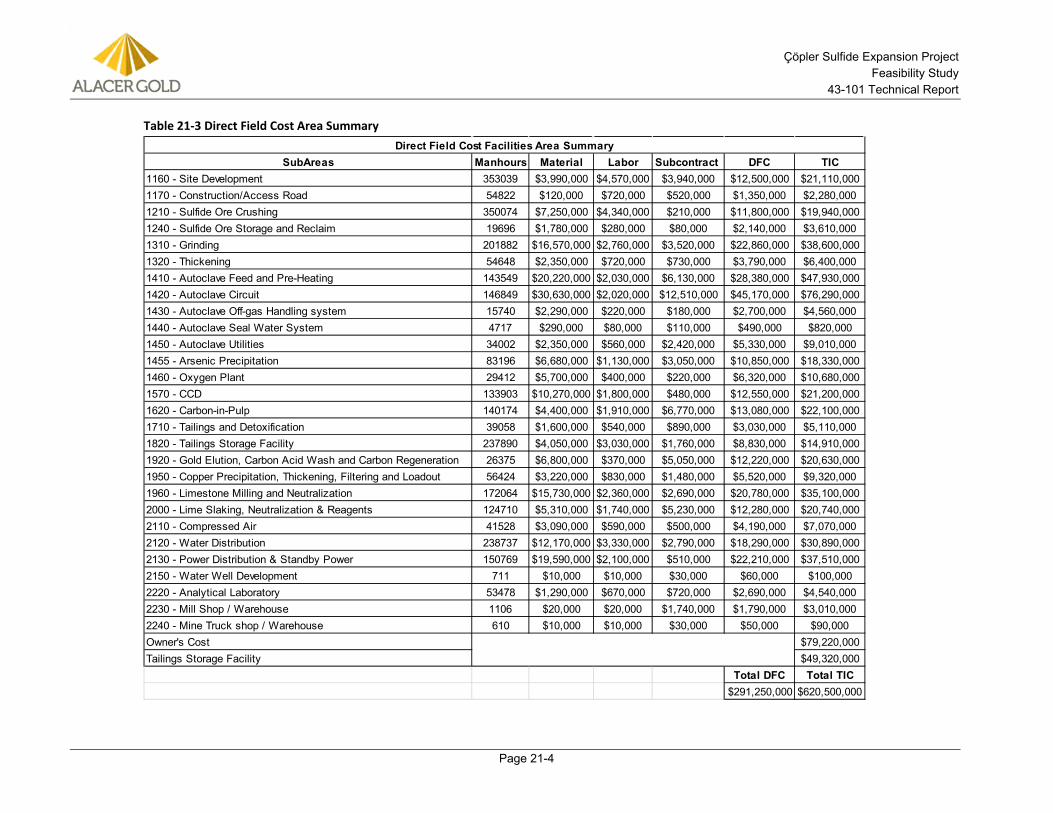
Çöpler Sulfide Expansion Project Feasibility Study
43-101 Technical Report
Page 21-4
Table 21-3 Direct Field Cost Area Summary
SubAreas Manhours Material Labor Subcontract DFC TIC1160 - Site Development 353039 $3,990,000 $4,570,000 $3,940,000 $12,500,000 $21,110,0001170 - Construction/Access Road 54822 $120,000 $720,000 $520,000 $1,350,000 $2,280,0001210 - Sulfide Ore Crushing 350074 $7,250,000 $4,340,000 $210,000 $11,800,000 $19,940,0001240 - Sulfide Ore Storage and Reclaim 19696 $1,780,000 $280,000 $80,000 $2,140,000 $3,610,0001310 - Grinding 201882 $16,570,000 $2,760,000 $3,520,000 $22,860,000 $38,600,0001320 - Thickening 54648 $2,350,000 $720,000 $730,000 $3,790,000 $6,400,0001410 - Autoclave Feed and Pre-Heating 143549 $20,220,000 $2,030,000 $6,130,000 $28,380,000 $47,930,0001420 - Autoclave Circuit 146849 $30,630,000 $2,020,000 $12,510,000 $45,170,000 $76,290,0001430 - Autoclave Off-gas Handling system 15740 $2,290,000 $220,000 $180,000 $2,700,000 $4,560,0001440 - Autoclave Seal Water System 4717 $290,000 $80,000 $110,000 $490,000 $820,0001450 - Autoclave Utilities 34002 $2,350,000 $560,000 $2,420,000 $5,330,000 $9,010,0001455 - Arsenic Precipitation 83196 $6,680,000 $1,130,000 $3,050,000 $10,850,000 $18,330,0001460 - Oxygen Plant 29412 $5,700,000 $400,000 $220,000 $6,320,000 $10,680,0001570 - CCD 133903 $10,270,000 $1,800,000 $480,000 $12,550,000 $21,200,0001620 - Carbon-in-Pulp 140174 $4,400,000 $1,910,000 $6,770,000 $13,080,000 $22,100,0001710 - Tailings and Detoxification 39058 $1,600,000 $540,000 $890,000 $3,030,000 $5,110,0001820 - Tailings Storage Facility 237890 $4,050,000 $3,030,000 $1,760,000 $8,830,000 $14,910,0001920 - Gold Elution, Carbon Acid Wash and Carbon Regeneration 26375 $6,800,000 $370,000 $5,050,000 $12,220,000 $20,630,0001950 - Copper Precipitation, Thickening, Filtering and Loadout 56424 $3,220,000 $830,000 $1,480,000 $5,520,000 $9,320,0001960 - Limestone Milling and Neutralization 172064 $15,730,000 $2,360,000 $2,690,000 $20,780,000 $35,100,0002000 - Lime Slaking, Neutralization & Reagents 124710 $5,310,000 $1,740,000 $5,230,000 $12,280,000 $20,740,0002110 - Compressed Air 41528 $3,090,000 $590,000 $500,000 $4,190,000 $7,070,0002120 - Water Distribution 238737 $12,170,000 $3,330,000 $2,790,000 $18,290,000 $30,890,0002130 - Power Distribution & Standby Power 150769 $19,590,000 $2,100,000 $510,000 $22,210,000 $37,510,0002150 - Water Well Development 711 $10,000 $10,000 $30,000 $60,000 $100,0002220 - Analytical Laboratory 53478 $1,290,000 $670,000 $720,000 $2,690,000 $4,540,0002230 - Mill Shop / Warehouse 1106 $20,000 $20,000 $1,740,000 $1,790,000 $3,010,0002240 - Mine Truck shop / Warehouse 610 $10,000 $10,000 $30,000 $50,000 $90,000Owner's Cost $79,220,000Tailings Storage Facility $49,320,000
Total DFC Total TIC$291,250,000 $620,500,000
Direct Field Cost Facilities Area Summary
Çöpler Sulfide Expansion Project Feasibility Study
43-101 Technical Report
Page 21-5
Power to Site 21.3.4The estimate includes such electrical items as primary power distribution equipment, power distribution overhead cables and poles, motor control centers, interconnecting cables and raceways, and overload protection equipment.
Electrical equipment sizes and quantities have been determined by the discipline engineer and are based on power requirements derived from vendor data, preliminary electrical one-line sketches, and from the distribution routing shown on the preliminary electrical routing sketches.
Sustaining Capital Costs (Life of Mine) 21.3.5The project sustaining capital costs for life of mine includes all equipment that will be required by the Sulfide Expansion project. This includes rebuilds of front end loaders, cranes and forklifts, as well as rental of operations pickup trucks. The sustaining capital also includes the purchase of new Bobcats for sulfide plant operations.
The spreadsheet detailing the sustaining capital costs can be found in the Financial Model Summary included in the Çöpler Sulfide Expansion Project Definitive Feasibility Report (Jacobs, 2014a).
21.4 Indirect Cost Elements EPCM Cost 21.4.1Typical professional services for the detailed design provided by Jacobs are as described in the Project Execution Plan included in Section 24.0 of this document. Pre-Feasibility Study and Feasibility Study Engineering costs are considered sunk costs and have been excluded from this estimate. Costs for Basic/Detailed Engineering have been factored, and are in line with industry standards.
Construction Management (CM) 21.4.2Construction Management (CM) will be by a qualified third party designated by Owner.
CM costs include the following: • Construction Manager
• Construction Site Managers
• Construction personnel involved in leading and overseeing the construction process, including monitoring progress and ensuring the Alacer requirements are being met
• Translators
• Exempt Operations representatives that function as part of the Project Team (PT) performing oversight of construction services
• Material Control
• Overall Site Safety
• Overall Site Security
Çöpler Sulfide Expansion Project Feasibility Study
43-101 Technical Report
Page 21-6
• Quality Assurance/Control
• Coordination of all onsite contractors
• Commissioning and Startup team
• Management of contractor equipment and material billings and payments
• Contract execution and administration
• Project controls including cost reporting and scheduling
• Pre-qualification of bidders
• Verification and certification costs
• Commissioning and Startup (C&SU)
This account includes members of the Project C&SU Team through successful operation of the plant, along with associated expenses. The CM team will be responsible for a majority of the Commissioning activities with some assistance from the Alacer project team. Start-up will be performed by the Alacer Operations team with some assistance from the CM team.
Pre-production costs are included in this account, including such pre-startup costs as pre-operations, pre-commissioning, C&SU. Related CM support services and facilities (office space, vehicles, administrative support, utilities, etc.) are included in the CM Estimate.
Owner’s Cost 21.4.3The Çöpler Sulfide Expansion Project Definitive Feasibility Report (Jacobs, 2014a) contains the Basis of Estimate for the owner’s cost portion of this FS estimate. The owner’s cost estimate was prepared by Alacer.
The Owner’s Cost estimate is included below the line entry on the estimate summary. These numbers are included in the economic analysis. The Owner’s Cost estimate is in constant fourth quarter of 2013 dollars.
This Basis of Estimate describes the guidelines by which each estimate is prepared, the areas of responsibility, the scope of the estimate, the design basis, the project execution strategy, the estimate methodologies, the estimate basis documents, and the key assumptions, clarifications and exclusions.
Temporary Buildings and Facilities 21.4.4Temporary Facilities have been factored as an allowance. The exception will be the trailer office space that is provided during construction for the supervisory staff, engineering staff, etc. These will be retrofitted for permanent use and that cost is included in the building account as a capital cost.
Temporary Construction Utility Services 21.4.5Temporary construction utilities have been factored as an allowance.
Construction Fuel 21.4.6Construction fuel has been factored as an allowance on top of the detailed construction equipment list from construction that will be required for the project.
Çöpler Sulfide Expansion Project Feasibility Study
43-101 Technical Report
Page 21-7
Spare Parts 21.4.7This account has been estimated by process and mechanical engineering disciplines and the needs outlined by the various vendors and Alacer sparing philosophy. Parts have been determined based on typical percentages of equipment costs, and the remoteness of the facility has been taken into account. Two (2) years of capital spares have been accounted for.
Initial Fills 21.4.8Initial fills includes grinding media, flocculent, water treatment chemicals, lubricants and other reagents. These quantity requirements have been identified by process and mechanical engineering disciplines and the needs outlined by the various vendors and Alacer first fills requirements that are not considered operating expenses.
Freight 21.4.9In-country Turkish transport was assumed to be 6% of equipment, subcontracts and bulk commodity value.
Scope includes ocean freight, special freight and ex-country transportation cost. Costs include freight and handling for all equipment, bulk materials and indirect materials that are purchased outside of Turkey and shipped to Samsun then trucked to site.
Ocean freight rates were assumed to be applicable to the portion of the mechanical equipment not sourced in Turkey based on historical factors related to ocean freight in the region. The remoteness of the site necessitated a transportation study; the results of that study have been incorporated into the estimate to handle inland logistics/obstacles and transportation. Logistic input by the transportation consultant indicated that during transport of the autoclave vessels two heavy load trailers will be required for corners that are too sharp for the primary trailer Both trailers will have hydraulic lift capability and two additional lowboys will be required so autoclaves can move in convoys of three to match autoclave fabricators shipping schedule. Transit time from Samsun to site is estimated to be 8 days for autoclaves. Allowances for dock fees, equipment staging areas, dock rental, warehousing/storage rental, demurrage, as well as the fees for a Duties broker are accounted for in this section. Final estimated costs will need to be updated after the logistics company completes their assessment of shipping requirements.
It is assumed that 50% of the material (70% of equipment) will be shipped from overseas; the remainder of mechanical equipment will be provided from within Turkey as well as most of the bulk materials. Ocean freight is included at 10% of shipment value.
Vendor’s Representatives – Construction/Commissioning 21.4.10Vendor representatives and subcontract support costs were factored based on Jacobs’ historical and in-house data, or based on actual written vendor quotes where available. A separate request for these costs was issued on the material requisitions sent out for budgetary quotes. Vendor representatives will be present for receipt of major equipment. An itemized list of vendor representatives and expected durations has been developed by the project team to produce a
Çöpler Sulfide Expansion Project Feasibility Study
43-101 Technical Report
Page 21-8
cost for assistance with construction and commissioning. These costs include an assumed vendor daily rate and travel cost.
Taxes and Duties 21.4.11Value Added Taxes (VAT) for this project is 18%. This project complies with Turkey’s mineral exemptions for mining projects; some effort and cost will go into obtaining the reimbursements (cost for employing government certified tax accountants) which has been estimated at 0.86% of the non-exempt direct and indirect costs. Investment incentives are available for imported process equipment and materials which are listed as exempt items from VAT as well as other duties. For specifically designated provinces of Turkey (e.g. Erzincan), a reduced corporate tax practice covers earnings derived from investment under an incentive certificate issued by the Under Secretary of the Treasury. There are no restrictions on equipment sourcing location with regards to the incentive. Location does determine how the incentive is credited. If sourced in Turkey, VAT is paid then recovered through application to the government. If sourced, outside of Turkey, no VAT is paid. Final estimate of tax percentages will be determined by the Owner.
Customs/Duties/Fees were not included as an allowance/placeholder in the estimate on either equipment or bulk materials. These exemptions will be in parallel to the VAT exemptions. The final supply location of equipment and material will determine whether these duties are applicable. The final estimate customs/duties/fees percentages will be determined by the Owner.
No import duties are included in the capital costs for mining related imported goods because an incentive certificate will be provided. The final supply location of equipment and material will determine whether these taxes are applicable. The Owner will conduct this evaluation. Customs and duties fees are not included in the price of equipment in this estimate. An allowance has been included for a customs broker.
Commissioning and Start-up 21.4.12Commissioning and start-up costs in the estimate were factored based on Jacobs’ historical and in-house data as a percentage of direct field man-hours.
21.5 Escalation Normalization - Estimated costs in the body of the estimate represent 4Q2013 constant U.S. dollars. If base estimated costs were from previous dates, the costs have been escalated to represent 4Q2013 constant US dollars.
Escalation from 4Q2013 to project midpoint of expenditure has been excluded from the estimate. Consequently the estimated costs represent 4Q2013 constant U.S. dollars.
21.6 Contingency Estimate contingency was based on the following definition:
Contingency is a specific provision added to the base estimate to cover items that have historically been required but cannot be specifically identified in advance. It is expected to be spent in accomplishing the project scope as defined; it is not intended to cover scope changes. It is based on actual project experience and intended to cover:
Çöpler Sulfide Expansion Project Feasibility Study
43-101 Technical Report
Page 21-9
• As yet undefined items needed to complete the current project scope.
• Variability in market conditions, material prices, wage rates, labor units, productivity assessments, allowances and project execution parameters.
• Estimating errors and omissions.
Contingency does not cover the cost of additional work or scope changes after the scope of the project has been defined for the estimate. It is also not intended to cover acts of God, unusual economic situations, potential currency fluctuations, strikes, and work stoppages for items like alternative location of tailings, community relocation issues, acute material shortages or catastrophes.
Note: Potential currency fluctuation impacts are not addressed in the project contingency.
Contingency should not be confused with design development allowance, which is an allowance applied to the defined preliminary scope items, such as equipment, and materials that have been physically quantified to certain level of accuracy. In general contingency is utilized for those items that have not been quantified, and for design development that is beyond what is covered by the design development allowances.
Application of Contingency 21.6.1As indicated in the definition above, contingency is a monetary allowance for items/considerations that were not defined at the time of estimate preparation, and that experience has demonstrated must be added to the base estimate to produce the total final cost. The level of contingency must be aligned with the desired probability of overrun / under run.
A contingency analysis for this project estimate was calculated using a Monte Carlo risk analysis simulation program. The program quantifies the range of possible project cost outcomes and their relative likelihood of occurrence. This contingency analysis was developed to determine a recommended contingency and to provide the accuracy range of the estimate between the probabilities of P10 and P90.
Contingency was then calculated by the program over the spectrum of various levels of probability of under run. A P50 was used to select the amount of recommended contingency.
Monte Carlo Simulation / Probabilities of Under-Run 21.6.2For a comprehensive risk analysis, most Monte Carlo simulation software packages require:
1. Dividing the estimate into elements and categories that will allow a quantitative analysis.
The contingency analysis was grouped into the following categories by area to account for the similar nature of those grouped areas when collecting ranger input on the accuracy bands.
Group 1
1100 - Plant General
2000 – Reagents
Çöpler Sulfide Expansion Project Feasibility Study
43-101 Technical Report
Page 21-10
2100 – Utilities
2200 - Ancillary Facilities
Group 2
1200 - Crushing and Ore Handling
1300 – Grinding
Group 3
1400 - Pressure Oxidation
Group 4
1500 - CCD Thickening
1600 - Carbon Absorption
1900 - Refining, Neutralization and Metals
Group 5
1700 - Tailings Handling
1800 - Tailings Storage Facility 2. Working with key estimate participants to determine the best case (the most
that an individual category could under run the estimate) and the worst case (the most that an individual category could overrun the estimate), typically expressed as a percentage of the base estimate without contingency.
3. Creating a series of project estimate iterations (or cases) based on varying selections of element values over the ranges specified in item 2 above. This is done within the simulation software and normally results in thousands of iterations, which cluster in certain ways that indicate the statistical probability of overrunning or under running the overall estimate at various levels of contingency.
21.7 Capital Cost Qualifications and Exclusions See the Basis of Estimate in the Çöpler Sulfide Expansion Project Definitive Feasibility Report (Jacobs, 2014a) for the estimate assumptions and clarifications, as well as exclusions.
21.8 Operating Costs (OPEX) Introduction 21.8.1Life-Of-Mine (LOM) operating costs were calculated based on mining, processing and support costs. The summary of LOM operating costs is shown in Table 21-4; the costs are expressed in Q42013 U.S. dollars. The summary includes the Heap Leach operation and the Çöpler Sulfide Expansion Project.
Site costs are included as $/tonne or total tonnes processed (heap leach and sulfide), $/oz of total gold recovered, and the average total operating in million $/year. Due to rounding, some totals listed in the tables below may differ slightly from the sum of the numbers above.
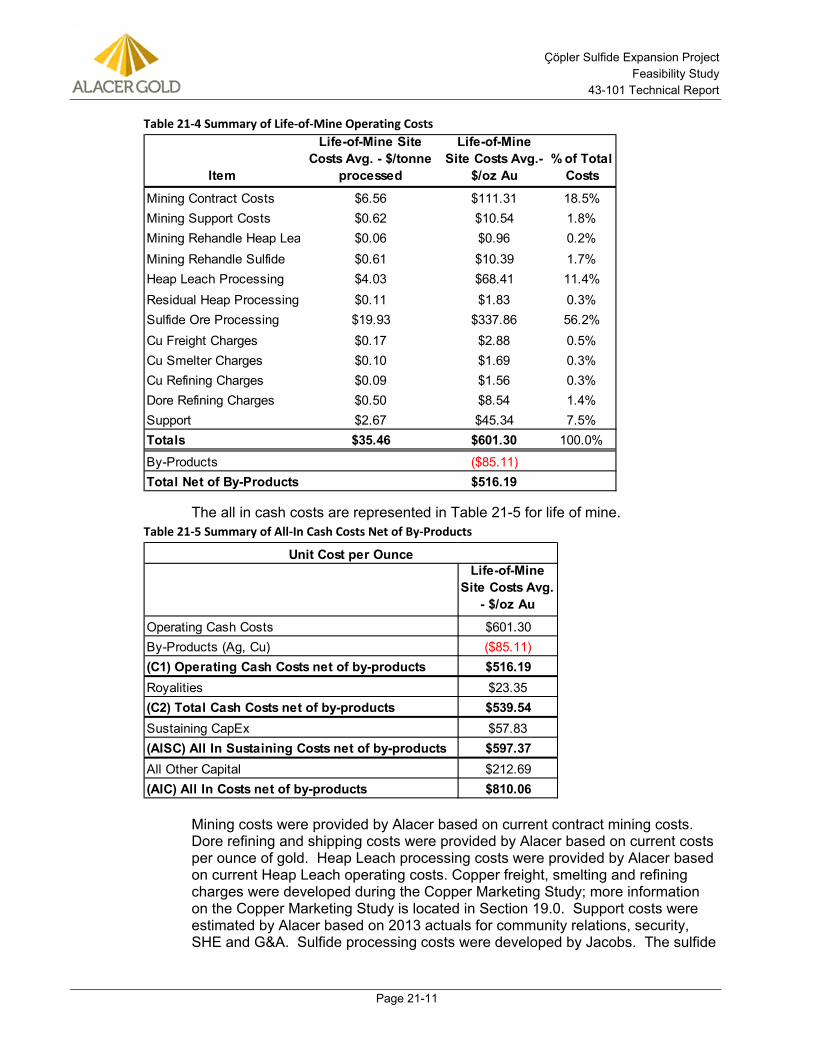
Çöpler Sulfide Expansion Project Feasibility Study
43-101 Technical Report
Page 21-11
Table 21-4 Summary of Life-of-Mine Operating Costs
The all in cash costs are represented in Table 21-5 for life of mine. Table 21-5 Summary of All-In Cash Costs Net of By-Products
Mining costs were provided by Alacer based on current contract mining costs. Dore refining and shipping costs were provided by Alacer based on current costs per ounce of gold. Heap Leach processing costs were provided by Alacer based on current Heap Leach operating costs. Copper freight, smelting and refining charges were developed during the Copper Marketing Study; more information on the Copper Marketing Study is located in Section 19.0. Support costs were estimated by Alacer based on 2013 actuals for community relations, security, SHE and G&A. Sulfide processing costs were developed by Jacobs. The sulfide
Item
Life-of-Mine Site Costs Avg. - $/tonne
processed
Life-of-Mine Site Costs Avg.-
$/oz Au% of Total
Costs
Mining Contract Costs $6.56 $111.31 18.5%Mining Support Costs $0.62 $10.54 1.8%Mining Rehandle Heap Lea $0.06 $0.96 0.2%Mining Rehandle Sulfide $0.61 $10.39 1.7%Heap Leach Processing $4.03 $68.41 11.4%Residual Heap Processing $0.11 $1.83 0.3%Sulfide Ore Processing $19.93 $337.86 56.2%Cu Freight Charges $0.17 $2.88 0.5%Cu Smelter Charges $0.10 $1.69 0.3%Cu Refining Charges $0.09 $1.56 0.3%Dore Refining Charges $0.50 $8.54 1.4%Support $2.67 $45.34 7.5%Totals $35.46 $601.30 100.0%
By-Products ($85.11)Total Net of By-Products $516.19
Life-of-Mine Site Costs Avg.
- $/oz Au
Operating Cash Costs $601.30By-Products (Ag, Cu) ($85.11)(C1) Operating Cash Costs net of by-products $516.19Royalities $23.35(C2) Total Cash Costs net of by-products $539.54Sustaining CapEx $57.83(AISC) All In Sustaining Costs net of by-products $597.37All Other Capital $212.69(AIC) All In Costs net of by-products $810.06
Unit Cost per Ounce
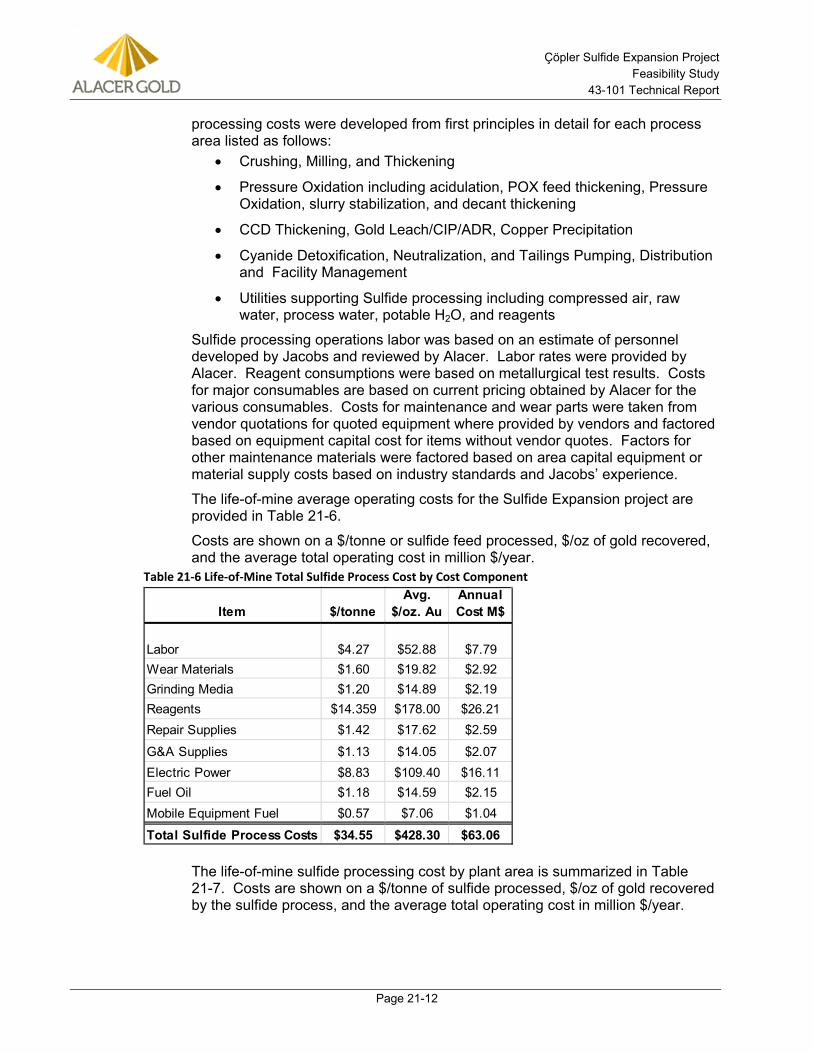
Çöpler Sulfide Expansion Project Feasibility Study
43-101 Technical Report
Page 21-12
processing costs were developed from first principles in detail for each process area listed as follows:
• Crushing, Milling, and Thickening
• Pressure Oxidation including acidulation, POX feed thickening, Pressure Oxidation, slurry stabilization, and decant thickening
• CCD Thickening, Gold Leach/CIP/ADR, Copper Precipitation
• Cyanide Detoxification, Neutralization, and Tailings Pumping, Distribution and Facility Management
• Utilities supporting Sulfide processing including compressed air, raw water, process water, potable H2O, and reagents
Sulfide processing operations labor was based on an estimate of personnel developed by Jacobs and reviewed by Alacer. Labor rates were provided by Alacer. Reagent consumptions were based on metallurgical test results. Costs for major consumables are based on current pricing obtained by Alacer for the various consumables. Costs for maintenance and wear parts were taken from vendor quotations for quoted equipment where provided by vendors and factored based on equipment capital cost for items without vendor quotes. Factors for other maintenance materials were factored based on area capital equipment or material supply costs based on industry standards and Jacobs’ experience.
The life-of-mine average operating costs for the Sulfide Expansion project are provided in Table 21-6.
Costs are shown on a $/tonne or sulfide feed processed, $/oz of gold recovered, and the average total operating cost in million $/year.
Table 21-6 Life-of-Mine Total Sulfide Process Cost by Cost Component
The life-of-mine sulfide processing cost by plant area is summarized in Table 21-7. Costs are shown on a $/tonne of sulfide processed, $/oz of gold recovered by the sulfide process, and the average total operating cost in million $/year.
Item $/tonneAvg.
$/oz. AuAnnual Cost M$
Labor $4.27 $52.88 $7.79Wear Materials $1.60 $19.82 $2.92Grinding Media $1.20 $14.89 $2.19Reagents $14.359 $178.00 $26.21Repair Supplies $1.42 $17.62 $2.59
G&A Supplies $1.13 $14.05 $2.07Electric Power $8.83 $109.40 $16.11Fuel Oil $1.18 $14.59 $2.15Mobile Equipment Fuel $0.57 $7.06 $1.04
Total Sulfide Process Costs $34.55 $428.30 $63.06
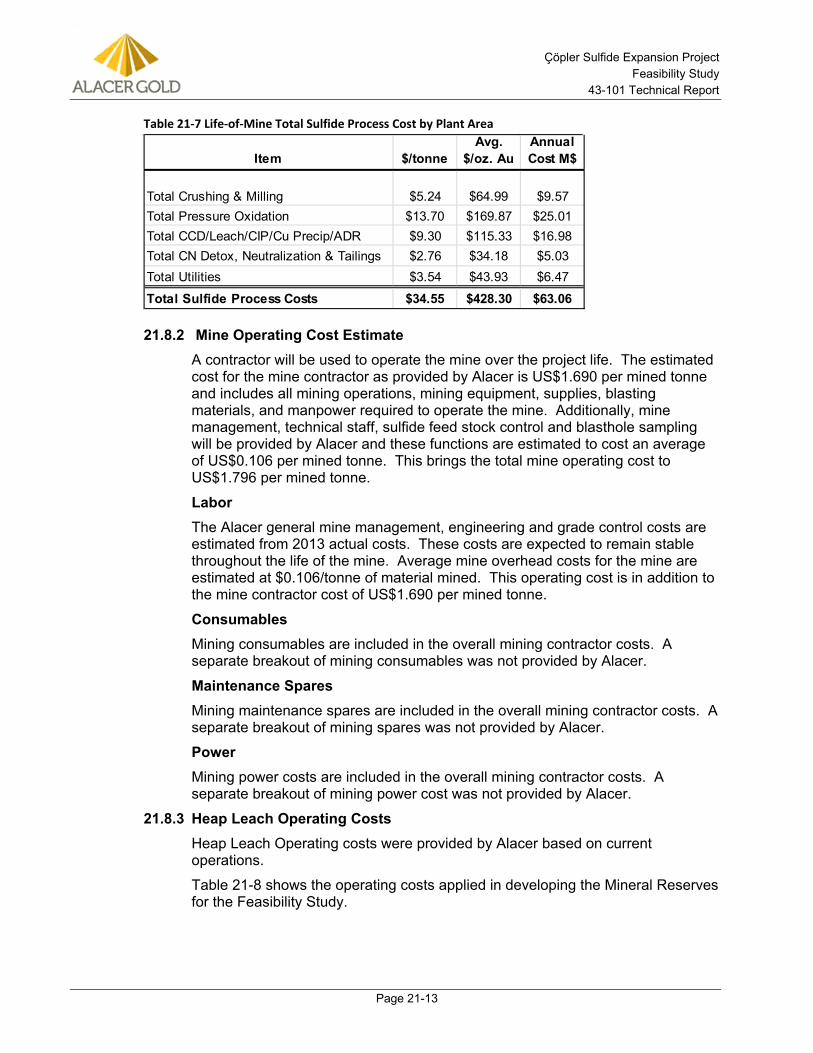
Çöpler Sulfide Expansion Project Feasibility Study
43-101 Technical Report
Page 21-13
Table 21-7 Life-of-Mine Total Sulfide Process Cost by Plant Area
Mine Operating Cost Estimate 21.8.2A contractor will be used to operate the mine over the project life. The estimated cost for the mine contractor as provided by Alacer is US$1.690 per mined tonne and includes all mining operations, mining equipment, supplies, blasting materials, and manpower required to operate the mine. Additionally, mine management, technical staff, sulfide feed stock control and blasthole sampling will be provided by Alacer and these functions are estimated to cost an average of US$0.106 per mined tonne. This brings the total mine operating cost to US$1.796 per mined tonne.
Labor The Alacer general mine management, engineering and grade control costs are estimated from 2013 actual costs. These costs are expected to remain stable throughout the life of the mine. Average mine overhead costs for the mine are estimated at $0.106/tonne of material mined. This operating cost is in addition to the mine contractor cost of US$1.690 per mined tonne.
Consumables Mining consumables are included in the overall mining contractor costs. A separate breakout of mining consumables was not provided by Alacer.
Maintenance Spares Mining maintenance spares are included in the overall mining contractor costs. A separate breakout of mining spares was not provided by Alacer.
Power Mining power costs are included in the overall mining contractor costs. A separate breakout of mining power cost was not provided by Alacer.
Heap Leach Operating Costs 21.8.3Heap Leach Operating costs were provided by Alacer based on current operations.
Table 21-8 shows the operating costs applied in developing the Mineral Reserves for the Feasibility Study.
Item $/tonneAvg.
$/oz. AuAnnual Cost M$
Total Crushing & Milling $5.24 $64.99 $9.57Total Pressure Oxidation $13.70 $169.87 $25.01Total CCD/Leach/CIP/Cu Precip/ADR $9.30 $115.33 $16.98Total CN Detox, Neutralization & Tailings $2.76 $34.18 $5.03Total Utilities $3.54 $43.93 $6.47
Total Sulfide Process Costs $34.55 $428.30 $63.06
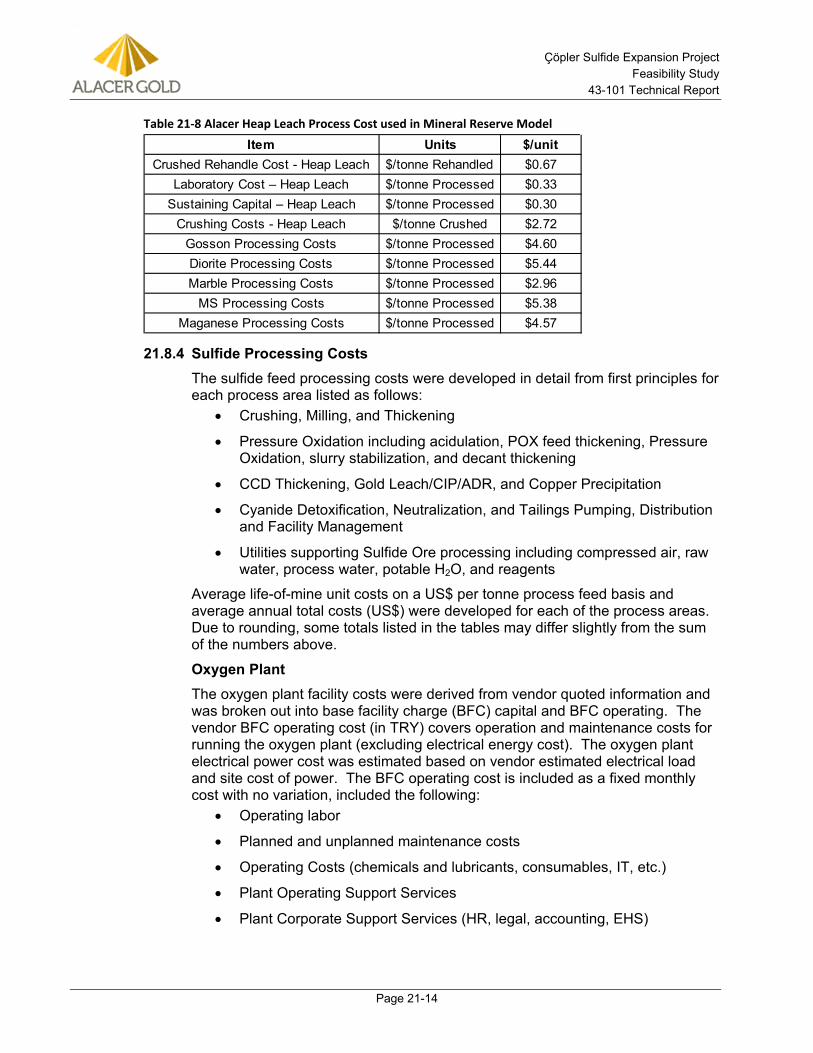
Çöpler Sulfide Expansion Project Feasibility Study
43-101 Technical Report
Page 21-14
Table 21-8 Alacer Heap Leach Process Cost used in Mineral Reserve Model
Sulfide Processing Costs 21.8.4The sulfide feed processing costs were developed in detail from first principles for each process area listed as follows:
• Crushing, Milling, and Thickening
• Pressure Oxidation including acidulation, POX feed thickening, Pressure Oxidation, slurry stabilization, and decant thickening
• CCD Thickening, Gold Leach/CIP/ADR, and Copper Precipitation
• Cyanide Detoxification, Neutralization, and Tailings Pumping, Distribution and Facility Management
• Utilities supporting Sulfide Ore processing including compressed air, raw water, process water, potable H2O, and reagents
Average life-of-mine unit costs on a US$ per tonne process feed basis and average annual total costs (US$) were developed for each of the process areas. Due to rounding, some totals listed in the tables may differ slightly from the sum of the numbers above.
Oxygen Plant The oxygen plant facility costs were derived from vendor quoted information and was broken out into base facility charge (BFC) capital and BFC operating. The vendor BFC operating cost (in TRY) covers operation and maintenance costs for running the oxygen plant (excluding electrical energy cost). The oxygen plant electrical power cost was estimated based on vendor estimated electrical load and site cost of power. The BFC operating cost is included as a fixed monthly cost with no variation, included the following:
• Operating labor
• Planned and unplanned maintenance costs
• Operating Costs (chemicals and lubricants, consumables, IT, etc.)
• Plant Operating Support Services
• Plant Corporate Support Services (HR, legal, accounting, EHS)
Item Units $/unitCrushed Rehandle Cost - Heap Leach $/tonne Rehandled $0.67
Laboratory Cost – Heap Leach $/tonne Processed $0.33 Sustaining Capital – Heap Leach $/tonne Processed $0.30
Crushing Costs - Heap Leach $/tonne Crushed $2.72 Gosson Processing Costs $/tonne Processed $4.60 Diorite Processing Costs $/tonne Processed $5.44 Marble Processing Costs $/tonne Processed $2.96
MS Processing Costs $/tonne Processed $5.38 Maganese Processing Costs $/tonne Processed $4.57
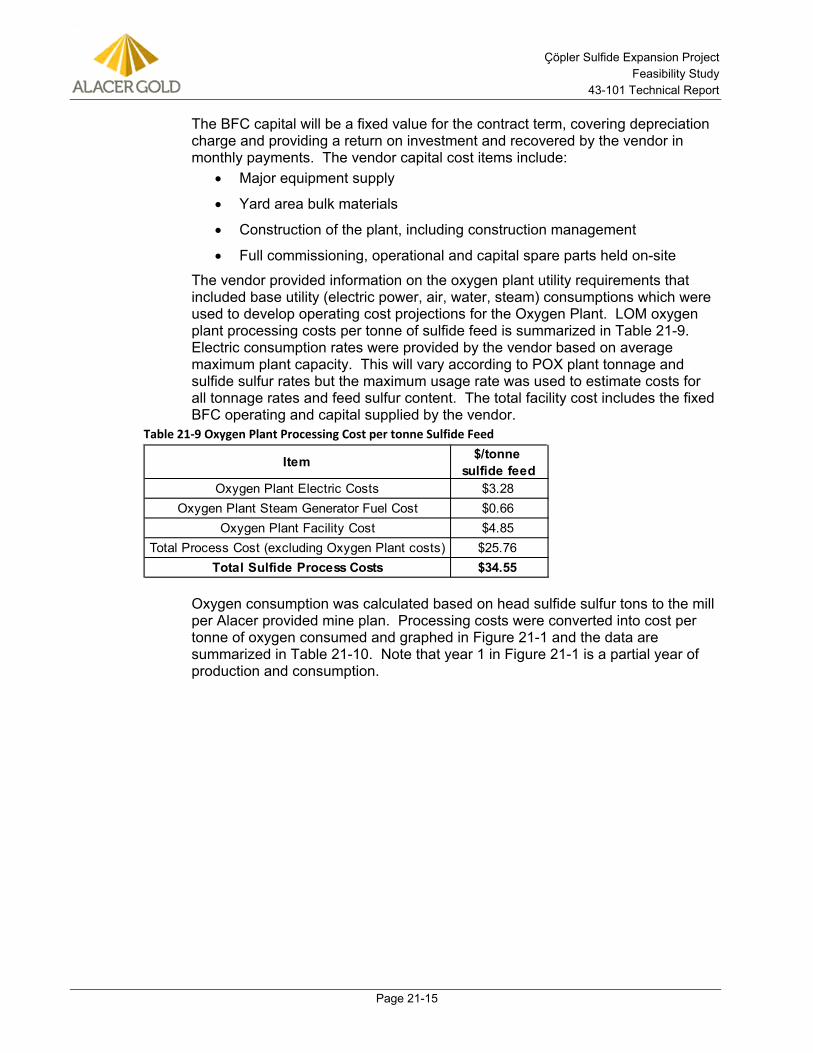
Çöpler Sulfide Expansion Project Feasibility Study
43-101 Technical Report
Page 21-15
The BFC capital will be a fixed value for the contract term, covering depreciation charge and providing a return on investment and recovered by the vendor in monthly payments. The vendor capital cost items include:
• Major equipment supply
• Yard area bulk materials
• Construction of the plant, including construction management
• Full commissioning, operational and capital spare parts held on-site
The vendor provided information on the oxygen plant utility requirements that included base utility (electric power, air, water, steam) consumptions which were used to develop operating cost projections for the Oxygen Plant. LOM oxygen plant processing costs per tonne of sulfide feed is summarized in Table 21-9. Electric consumption rates were provided by the vendor based on average maximum plant capacity. This will vary according to POX plant tonnage and sulfide sulfur rates but the maximum usage rate was used to estimate costs for all tonnage rates and feed sulfur content. The total facility cost includes the fixed BFC operating and capital supplied by the vendor.
Table 21-9 Oxygen Plant Processing Cost per tonne Sulfide Feed
Oxygen consumption was calculated based on head sulfide sulfur tons to the mill per Alacer provided mine plan. Processing costs were converted into cost per tonne of oxygen consumed and graphed in Figure 21-1 and the data are summarized in Table 21-10. Note that year 1 in Figure 21-1 is a partial year of production and consumption.
Item $/tonne sulfide feed
Oxygen Plant Electric Costs $3.28Oxygen Plant Steam Generator Fuel Cost $0.66
Oxygen Plant Facility Cost $4.85Total Process Cost (excluding Oxygen Plant costs) $25.76
Total Sulfide Process Costs $34.55
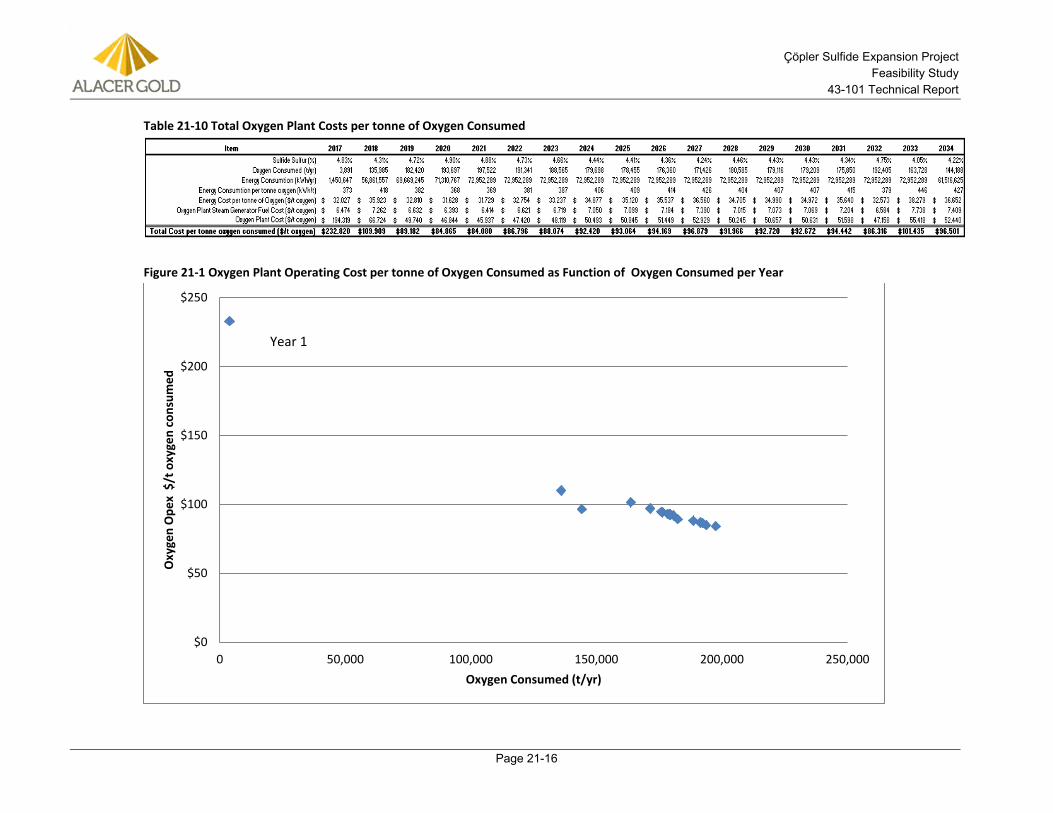
Çöpler Sulfide Expansion Project Feasibility Study
43-101 Technical Report
Page 21-16
Table 21-10 Total Oxygen Plant Costs per tonne of Oxygen Consumed
Figure 21-1 Oxygen Plant Operating Cost per tonne of Oxygen Consumed as Function of Oxygen Consumed per Year
$0
$50
$100
$150
$200
$250
0 50,000 100,000 150,000 200,000 250,000
Oxy
gen
Ope
x $
/t o
xyge
n co
nsum
ed
Oxygen Consumed (t/yr)
Year 1
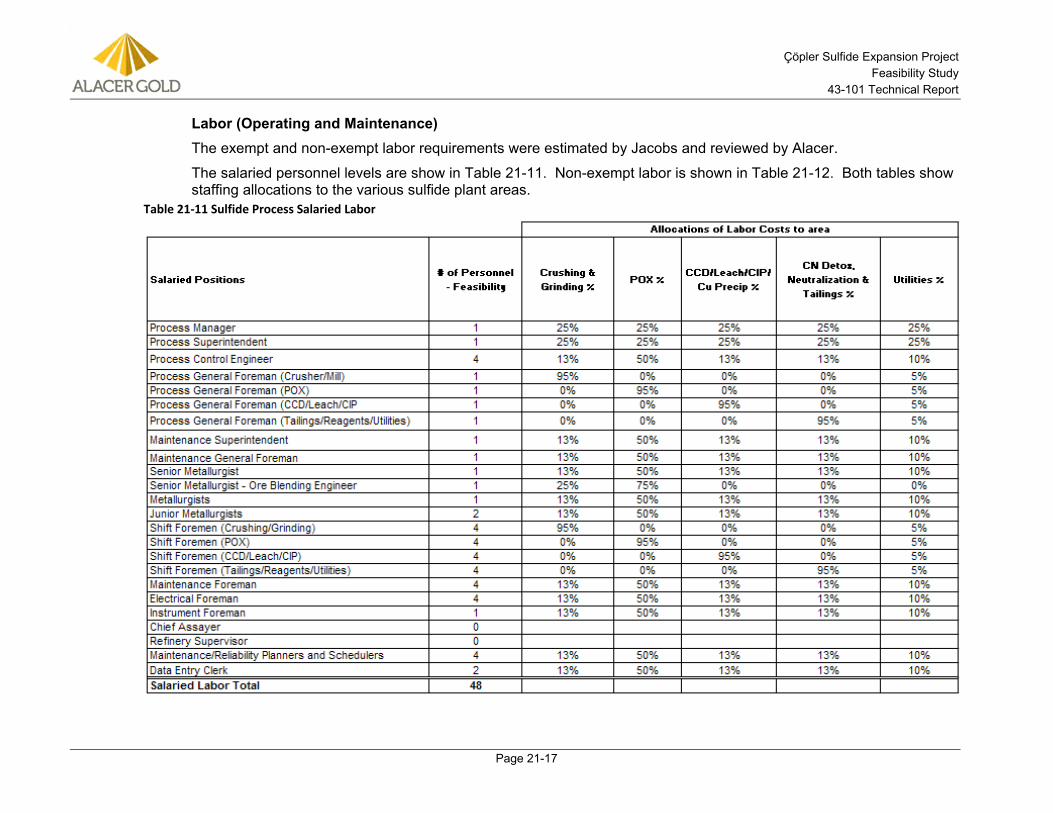
Çöpler Sulfide Expansion Project Feasibility Study
43-101 Technical Report
Page 21-17
Labor (Operating and Maintenance) The exempt and non-exempt labor requirements were estimated by Jacobs and reviewed by Alacer.
The salaried personnel levels are show in Table 21-11. Non-exempt labor is shown in Table 21-12. Both tables show staffing allocations to the various sulfide plant areas.
Table 21-11 Sulfide Process Salaried Labor
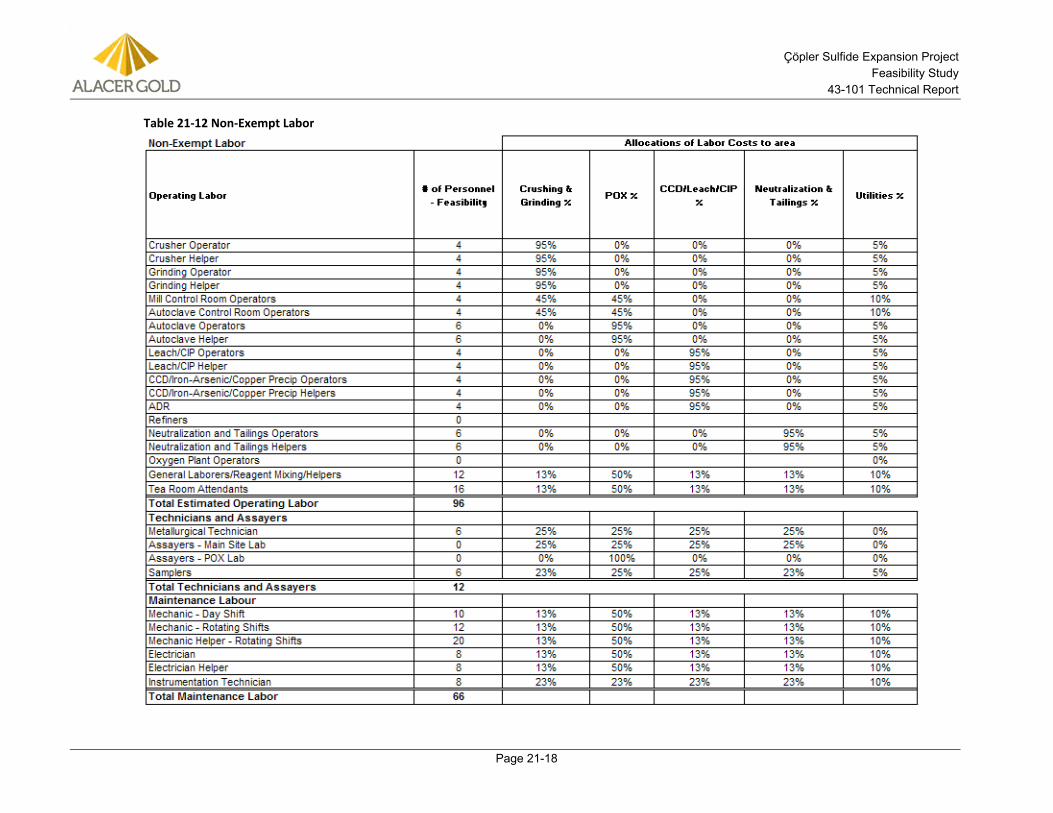
Çöpler Sulfide Expansion Project Feasibility Study
43-101 Technical Report
Page 21-18
Table 21-12 Non-Exempt Labor
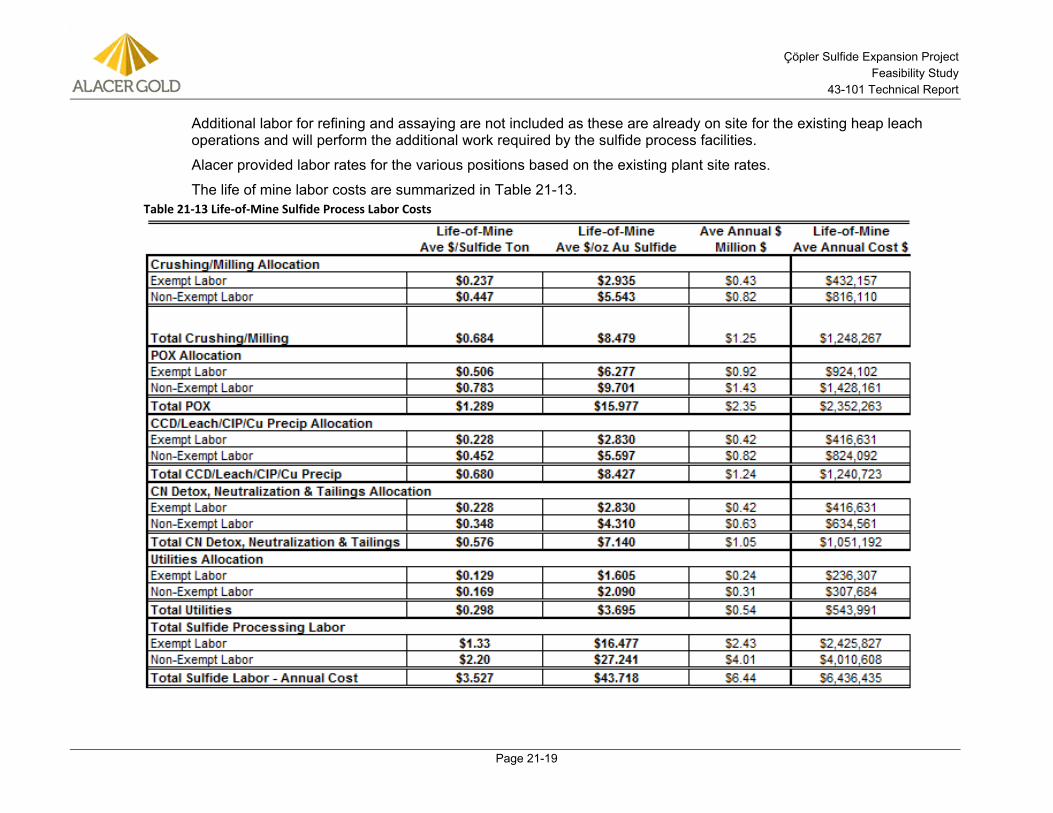
Çöpler Sulfide Expansion Project Feasibility Study
43-101 Technical Report
Page 21-19
Additional labor for refining and assaying are not included as these are already on site for the existing heap leach operations and will perform the additional work required by the sulfide process facilities.
Alacer provided labor rates for the various positions based on the existing plant site rates.
The life of mine labor costs are summarized in Table 21-13. Table 21-13 Life-of-Mine Sulfide Process Labor Costs
Çöpler Sulfide Expansion Project Feasibility Study
43-101 Technical Report
Page 21-20
Consumables Unit costs for consumables were provided by Alacer or taken from vendor equipment quotations or based on historical data or experience.
Reagent and fuel pricing costs were obtained by Alacer.
The electric power cost is the current rate paid by the site.
Annual wear part consumption for major equipment were taken from vendor recommendations where provided. Where vendor information was not obtained, a percentage of the equipment purchase price was applied to estimate the parts costs.
General maintenance supplies were estimated by applying a percentage of the total equipment purchase cost for a given area.
Pipeline, electrical, and Instrument and Control System (I&C) maintenance costs were estimated by applying a percentage of the capital cost for the materials for the respective items as the annual supply costs.
Fuel (diesel oil) use is related to process heating requirements and to estimated vehicle use to support the sulfide processing operation.
Process heating will be required continually for the oxygen plant. A prospective oxygen plant supplier provided a typical steam load from which fuel consumption was estimated.
The heat up of the autoclaves following a shutdown will also be required. An estimate of 3% of the scheduled operating days was included as the amount of time boiler steam will be required for autoclave heat up. Boiler fuel consumption was based on a vendor quotation.
Diesel fuel will also be used by a fleet of vehicles servicing the sulfide process plant. A hypothetical equipment fleet and operating hours were developed as the basis of the mobile equipment fuel use.
An allowance for building heating was included based on a previous projects and factored down for a milder climate plus consideration that when the grinding and pressure oxidation processes are operating building heating will be minimal. Most of the building heating will be during periods when the process plants are not operating
The operating and maintenance unit supplies costs are summarized in Table 21-14.
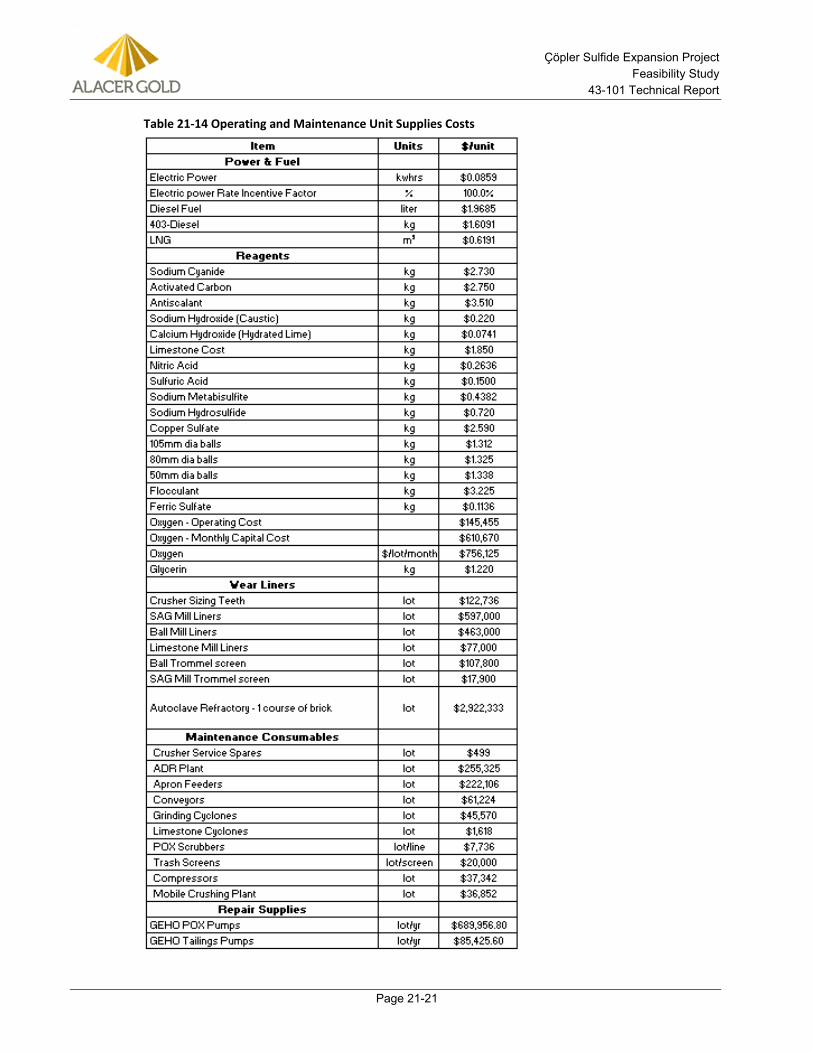
Çöpler Sulfide Expansion Project Feasibility Study
43-101 Technical Report
Page 21-21
Table 21-14 Operating and Maintenance Unit Supplies Costs
Çöpler Sulfide Expansion Project Feasibility Study
43-101 Technical Report
Page 21-22
Consumables usage rates were estimated based on metallurgical tests and Jacobs experience.
Most consumable costs are fixed on a per-tonne of sulfide process feed basis or number of lots of repair parts on annual basis.
Sulfuric acid consumption is variable based on sulfide process feed annual average sulfur content and projected carbonate mineral content. METSIM modeling benchmarking with the Hazen pilot plant data was the basis for the sulfuric acid consumption calculations.
The sodium hydrosulfide addition rate is variable based on copper head grade and stoichiometric reagent requirements.
Oxygen BFC costs for the autoclaves are fixed annual costs based on a vendor quotation and are not dependent on actual oxygen consumption.
It is assumed that crusher and mill liners will be as follows: • Crusher – One complete change per year
• SAG Mill – Trommels and Shell Liners: Two Liner changes per year; Full Re-Line every other year
• Ball Mill – ½ liner change per year
• Limestone ball Mill – One liner change every other year
Based on industry standards, autoclave refractory changes consist of the replacement of the first course of brick every 5 years. The refractory replacements are considered small Capital Expenditure projects, are included in the Sustaining Capital estimate, and are not included in the operating costs.
Annual G&A allowance of US$200,000 was included for general process office supplies such as paper, printer supplies, software, conference attendance, consultants, etc.
The operating and maintenance unit supplies usage rates and basis for usage rates are summarized by plant area in Table 21-15. Due to rounding, some totals listed in the tables may differ slightly from the sum of the numbers above.
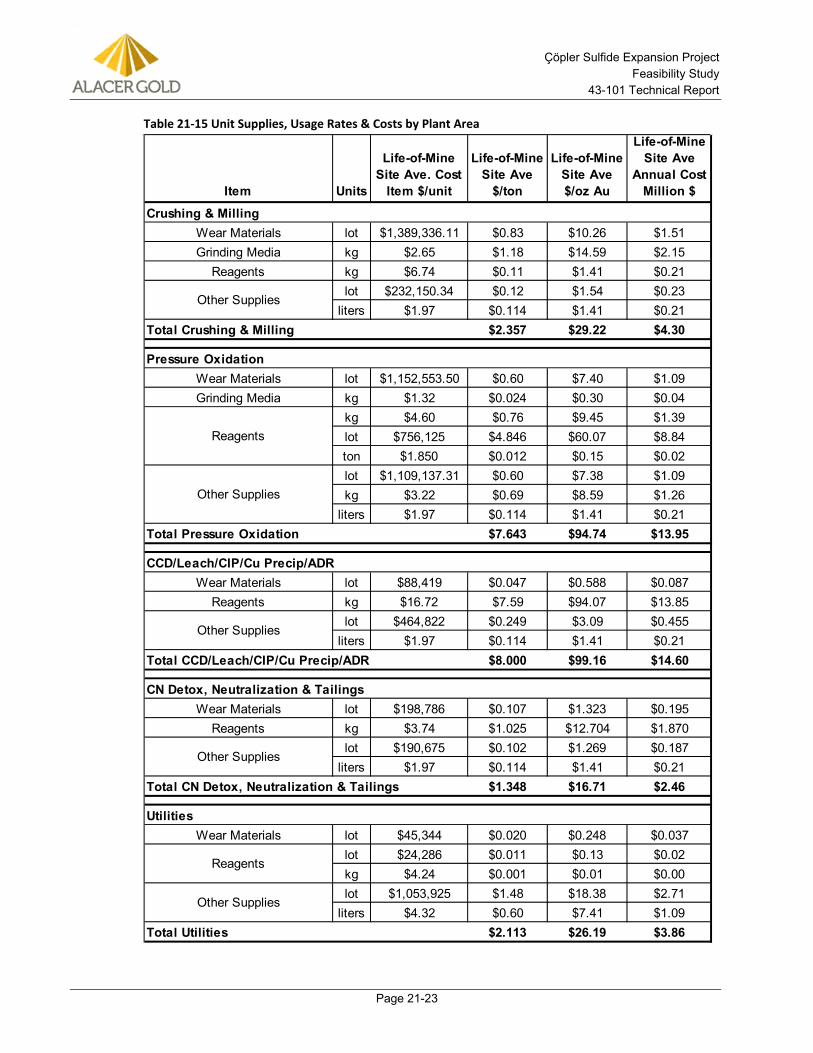
Çöpler Sulfide Expansion Project Feasibility Study
43-101 Technical Report
Page 21-23
Table 21-15 Unit Supplies, Usage Rates & Costs by Plant Area
Item Units
Life-of-Mine Site Ave. Cost
Item $/unit
Life-of-Mine Site Ave
$/ton
Life-of-Mine Site Ave $/oz Au
Life-of-Mine Site Ave
Annual Cost Million $
Crushing & MillingWear Materials lot $1,389,336.11 $0.83 $10.26 $1.51Grinding Media kg $2.65 $1.18 $14.59 $2.15
Reagents kg $6.74 $0.11 $1.41 $0.21lot $232,150.34 $0.12 $1.54 $0.23
liters $1.97 $0.114 $1.41 $0.21Total Crushing & Milling $2.357 $29.22 $4.30
Pressure OxidationWear Materials lot $1,152,553.50 $0.60 $7.40 $1.09Grinding Media kg $1.32 $0.024 $0.30 $0.04
kg $4.60 $0.76 $9.45 $1.39lot $756,125 $4.846 $60.07 $8.84ton $1.850 $0.012 $0.15 $0.02lot $1,109,137.31 $0.60 $7.38 $1.09kg $3.22 $0.69 $8.59 $1.26
liters $1.97 $0.114 $1.41 $0.21Total Pressure Oxidation $7.643 $94.74 $13.95
CCD/Leach/CIP/Cu Precip/ADRWear Materials lot $88,419 $0.047 $0.588 $0.087
Reagents kg $16.72 $7.59 $94.07 $13.85lot $464,822 $0.249 $3.09 $0.455
liters $1.97 $0.114 $1.41 $0.21Total CCD/Leach/CIP/Cu Precip/ADR $8.000 $99.16 $14.60
CN Detox, Neutralization & TailingsWear Materials lot $198,786 $0.107 $1.323 $0.195
Reagents kg $3.74 $1.025 $12.704 $1.870lot $190,675 $0.102 $1.269 $0.187
liters $1.97 $0.114 $1.41 $0.21Total CN Detox, Neutralization & Tailings $1.348 $16.71 $2.46
UtilitiesWear Materials lot $45,344 $0.020 $0.248 $0.037
lot $24,286 $0.011 $0.13 $0.02kg $4.24 $0.001 $0.01 $0.00lot $1,053,925 $1.48 $18.38 $2.71
liters $4.32 $0.60 $7.41 $1.09Total Utilities $2.113 $26.19 $3.86
Reagents
Other Supplies
Other Supplies
Reagents
Other Supplies
Other Supplies
Other Supplies
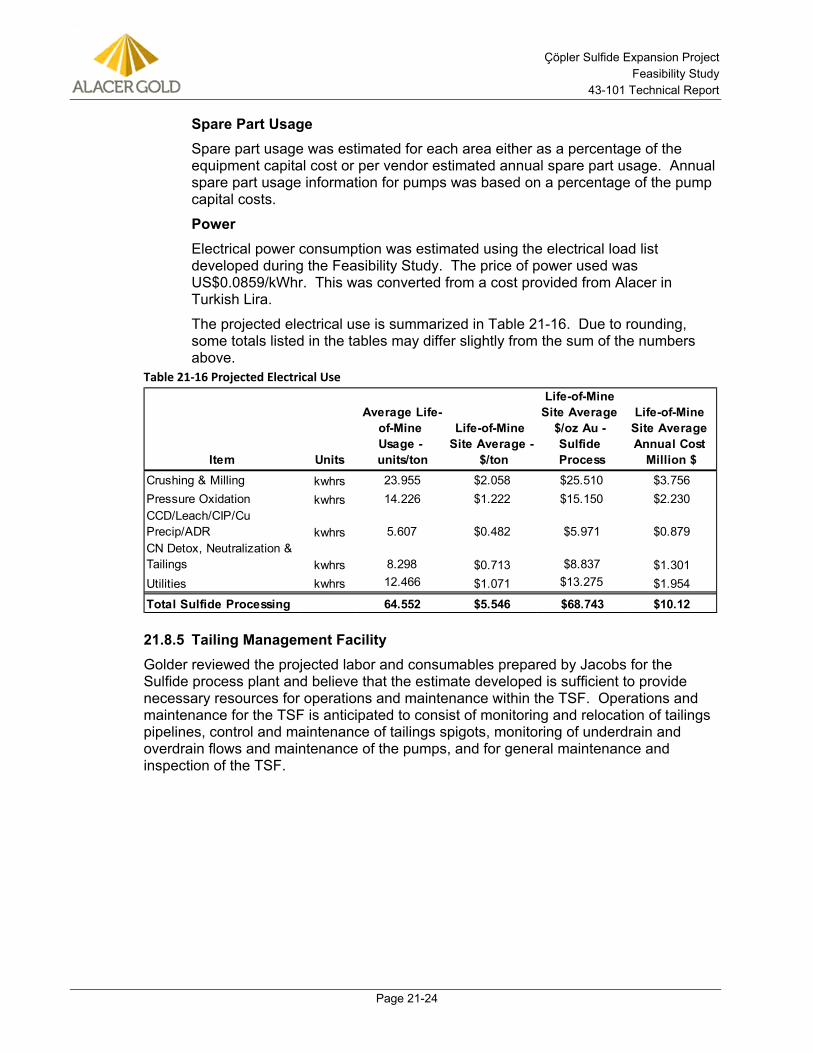
Çöpler Sulfide Expansion Project Feasibility Study
43-101 Technical Report
Page 21-24
Spare Part Usage Spare part usage was estimated for each area either as a percentage of the equipment capital cost or per vendor estimated annual spare part usage. Annual spare part usage information for pumps was based on a percentage of the pump capital costs.
Power Electrical power consumption was estimated using the electrical load list developed during the Feasibility Study. The price of power used was US$0.0859/kWhr. This was converted from a cost provided from Alacer in Turkish Lira.
The projected electrical use is summarized in Table 21-16. Due to rounding, some totals listed in the tables may differ slightly from the sum of the numbers above.
Table 21-16 Projected Electrical Use
Tailing Management Facility 21.8.5Golder reviewed the projected labor and consumables prepared by Jacobs for the Sulfide process plant and believe that the estimate developed is sufficient to provide necessary resources for operations and maintenance within the TSF. Operations and maintenance for the TSF is anticipated to consist of monitoring and relocation of tailings pipelines, control and maintenance of tailings spigots, monitoring of underdrain and overdrain flows and maintenance of the pumps, and for general maintenance and inspection of the TSF.
Item Units
Average Life-of-Mine Usage - units/ton
Life-of-Mine Site Average -
$/ton
Life-of-Mine Site Average
$/oz Au - Sulfide Process
Life-of-Mine Site Average Annual Cost
Million $Crushing & Milling kwhrs 23.955 $2.058 $25.510 $3.756Pressure Oxidation kwhrs 14.226 $1.222 $15.150 $2.230CCD/Leach/CIP/Cu Precip/ADR kwhrs 5.607 $0.482 $5.971 $0.879CN Detox, Neutralization & Tailings kwhrs 8.298 $0.713 $8.837 $1.301Utilities kwhrs 12.466 $1.071 $13.275 $1.954
Total Sulfide Processing 64.552 $5.546 $68.743 $10.12
Çöpler Sulfide Expansion Project Feasibility Study
43-101 Technical Report
Page 22-1
22.0 ECONOMIC ANALYSIS
22.1 Introduction A financial analysis for the Çöpler Sulfide Expansion Project was carried out using an incremental or differential cash flow approach. The Internal Rate or Return (IRR) on total investment was calculated based on the incremental cash flow of the differential of a combined sulfide process and heap leach operation versus continuation of the heap leach operation only. The Net Present Value (NPV) was calculated from the incremental cash flow based on a discount rate of 5%.
Cash flow models were developed for both the combination of the Sulfide Project with the continuation of the Oxide Heap leach and for the Oxide Heap Leach continuing without the Sulfide Project. A differential was calculated between the two cash flows to determine the financial benefit of the of the sulfide project.
Payback periods were based on the incremental cash flows, from the start of sulfide CAPEX outlay and the other from the start of sulfide production on both the cash flow differential and the sulfide project cash flow.
The results of the economic analysis summarized below represent forward–looking information as defined under Canadian securities law. Actual results may differ materially from those expressed or implied by forward-looking information. The reader should refer to Section 2.2 for more information regarding forward-looking statements, including material assumptions (in addition to those discussed in this section and elsewhere in the Report) and risks, uncertainties and other factors that could cause actual results to differ material from those expressed or implied in this section (and elsewhere in the Report).
22.2 Methods, Assumptions, and Basis The Financial Analysis was performed using the following basis and assumptions:
• The base case gold, copper and silver prices are USD $1,300/oz, $3.29/lb, and USD $22/oz. respectively.
• Start of cash flows to start in Half-Year 2014
• Sulfide Processing Costs derived from Section 21.8.4
• The cash flows take into account depreciation, cash taxes, delta working capital, and tax credits.
• Commercial production will begin in Q4 2017.
• The U.S. Dollar to Turkish Lira exchange rate is projected to be 2.2.
• The U.S. Dollar to Euro exchange rate is projected to be 0.77.
• The U.S. Dollar to Canadian Dollar exchange rate is projected to be 1.04.
• The U.S. Dollar to Australian Dollar exchange rate is projected to be 1.06.
• All cost and sales estimates are in constant Q4 2013 U.S. Dollars with no inflation or escalation factors taken into account.
Çöpler Sulfide Expansion Project Feasibility Study
43-101 Technical Report
Page 22-2
• Royalty information supplied by Alacer (refer to Section 22.3)
• Metal extractions were determined by metallurgical testing on VSP1 samples, this was comparable to pilot plant results on LOM sulfide feed stock blends. Gold extractions were discounted 1.5% to account for solution losses. Copper extractions were discounted 3% and silver was discounted 1%.
• All gold and silver is sold in the same year of production.
• All project related payments and disbursements incurred prior to the effective date of this Study are considered as sunk costs. Disbursements projected after the effective date of this Study but before the start of construction are considered to take place in the preproduction period and as periodic sustaining capital over the life of the project (i.e. refractory replacement, tailings dam raises, etc.)
• All values shown are post payment of royalties. Total royalty payments over the LOM are $75.6M (at 2.6% of NSR).
• Unleveraged 100% equity basis (no Project financing or debt)
• Stand-alone project basis
• After-tax determination of project economics
• Turkish tax regime
• Annual cash flows discounted on end of year basis
• All dollars are in U.S. Dollars, unless specifically noted.
The general assumptions used for this financial model are summarized in Table 22-1.
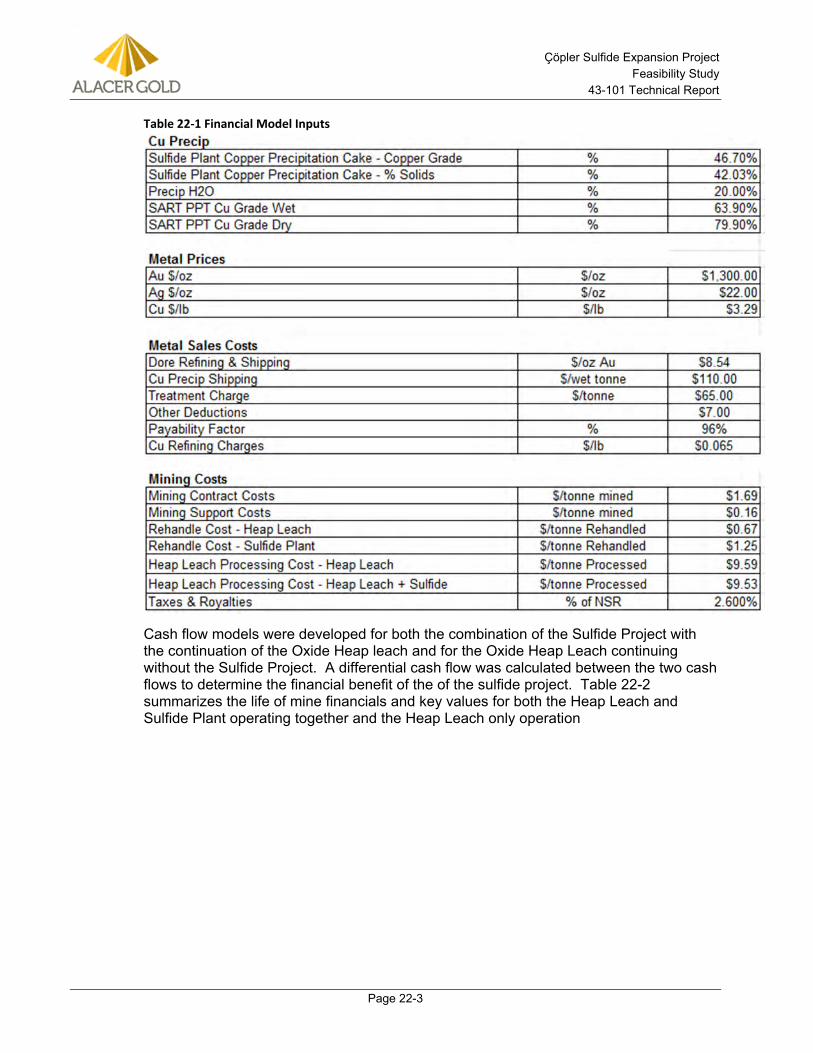
Çöpler Sulfide Expansion Project Feasibility Study
43-101 Technical Report
Page 22-3
Table 22-1 Financial Model Inputs
Cash flow models were developed for both the combination of the Sulfide Project with the continuation of the Oxide Heap leach and for the Oxide Heap Leach continuing without the Sulfide Project. A differential cash flow was calculated between the two cash flows to determine the financial benefit of the of the sulfide project. Table 22-2 summarizes the life of mine financials and key values for both the Heap Leach and Sulfide Plant operating together and the Heap Leach only operation
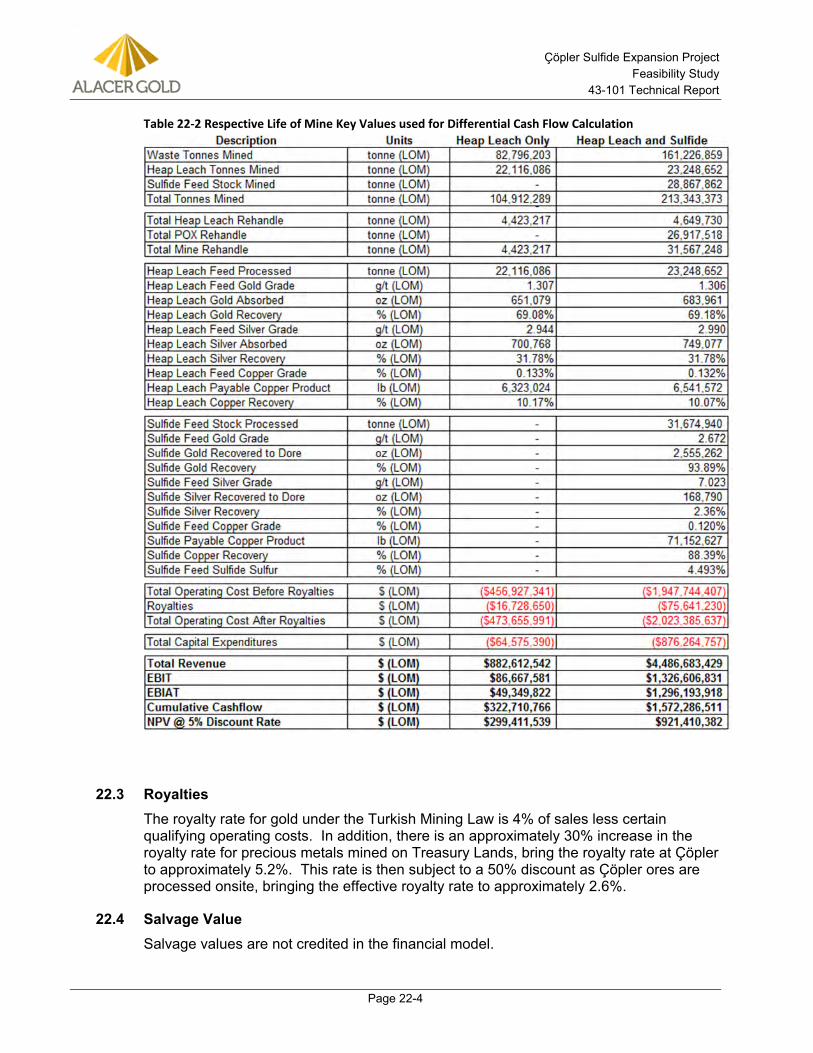
Çöpler Sulfide Expansion Project Feasibility Study
43-101 Technical Report
Page 22-4
Table 22-2 Respective Life of Mine Key Values used for Differential Cash Flow Calculation
22.3 Royalties The royalty rate for gold under the Turkish Mining Law is 4% of sales less certain qualifying operating costs. In addition, there is an approximately 30% increase in the royalty rate for precious metals mined on Treasury Lands, bring the royalty rate at Çöpler to approximately 5.2%. This rate is then subject to a 50% discount as Çöpler ores are processed onsite, bringing the effective royalty rate to approximately 2.6%.
22.4 Salvage Value Salvage values are not credited in the financial model.
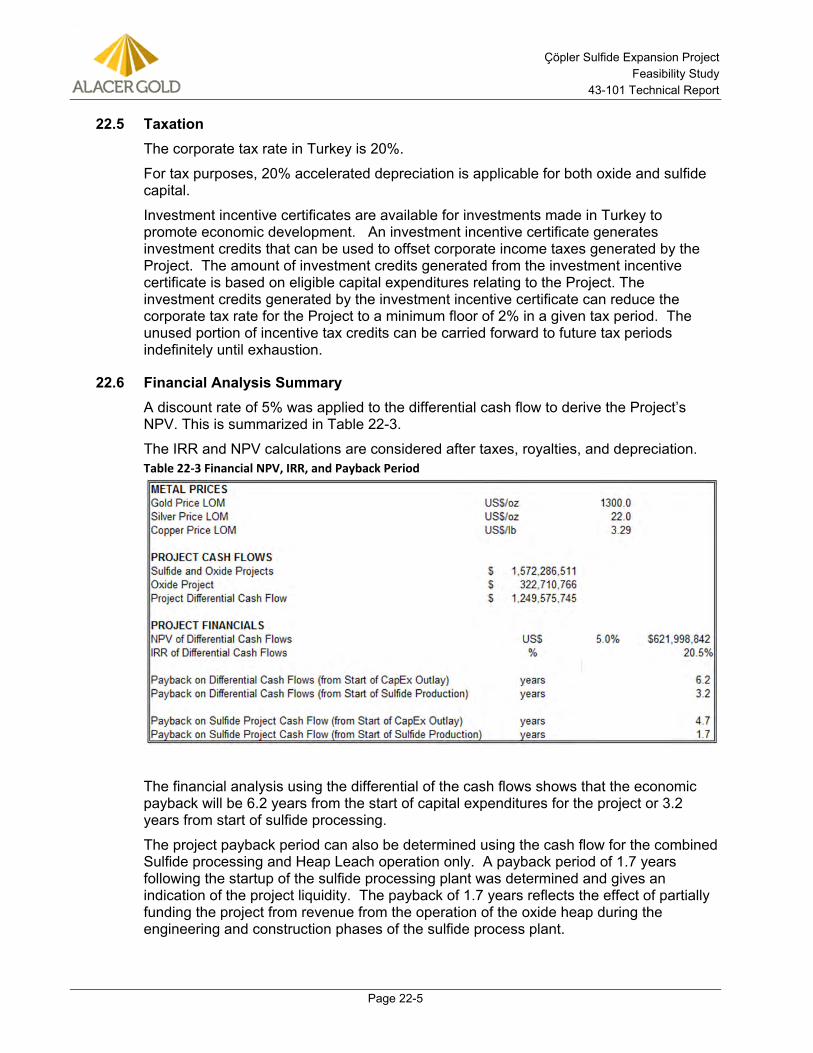
Çöpler Sulfide Expansion Project Feasibility Study
43-101 Technical Report
Page 22-5
22.5 Taxation The corporate tax rate in Turkey is 20%.
For tax purposes, 20% accelerated depreciation is applicable for both oxide and sulfide capital.
Investment incentive certificates are available for investments made in Turkey to promote economic development. An investment incentive certificate generates investment credits that can be used to offset corporate income taxes generated by the Project. The amount of investment credits generated from the investment incentive certificate is based on eligible capital expenditures relating to the Project. The investment credits generated by the investment incentive certificate can reduce the corporate tax rate for the Project to a minimum floor of 2% in a given tax period. The unused portion of incentive tax credits can be carried forward to future tax periods indefinitely until exhaustion.
22.6 Financial Analysis Summary A discount rate of 5% was applied to the differential cash flow to derive the Project’s NPV. This is summarized in Table 22-3.
The IRR and NPV calculations are considered after taxes, royalties, and depreciation. Table 22-3 Financial NPV, IRR, and Payback Period
The financial analysis using the differential of the cash flows shows that the economic payback will be 6.2 years from the start of capital expenditures for the project or 3.2 years from start of sulfide processing.
The project payback period can also be determined using the cash flow for the combined Sulfide processing and Heap Leach operation only. A payback period of 1.7 years following the startup of the sulfide processing plant was determined and gives an indication of the project liquidity. The payback of 1.7 years reflects the effect of partially funding the project from revenue from the operation of the oxide heap during the engineering and construction phases of the sulfide process plant.
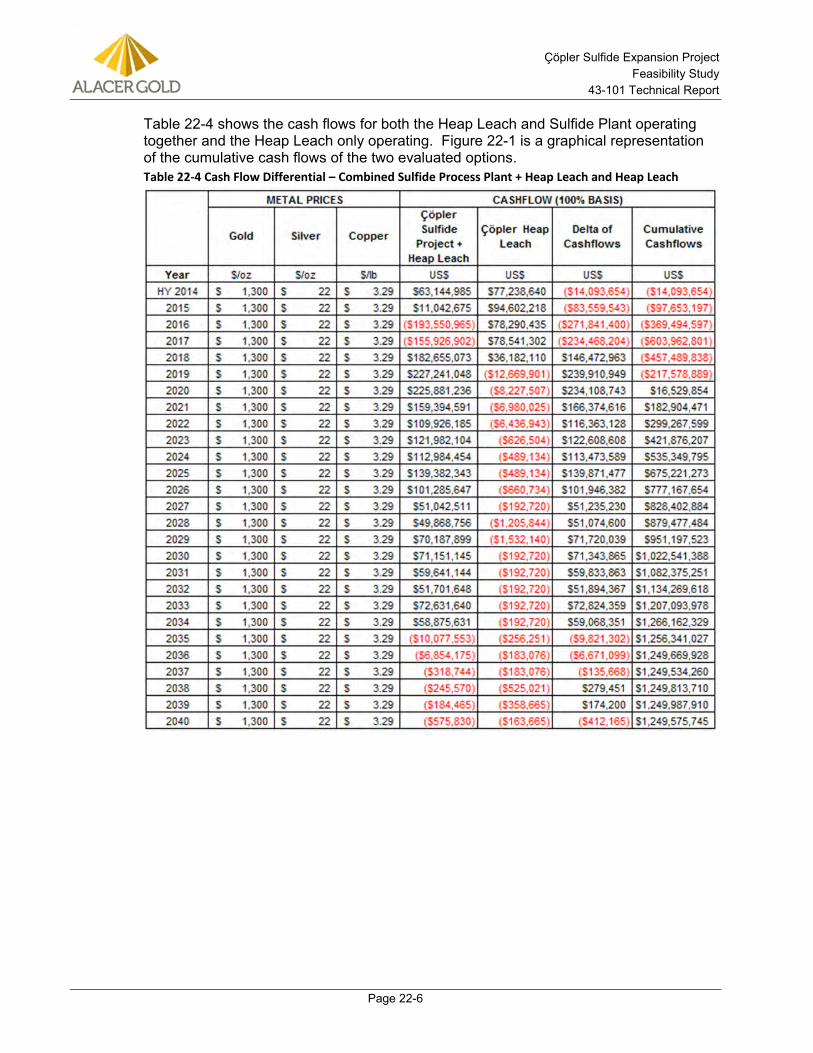
Çöpler Sulfide Expansion Project Feasibility Study
43-101 Technical Report
Page 22-6
Table 22-4 shows the cash flows for both the Heap Leach and Sulfide Plant operating together and the Heap Leach only operating. Figure 22-1 is a graphical representation of the cumulative cash flows of the two evaluated options. Table 22-4 Cash Flow Differential – Combined Sulfide Process Plant + Heap Leach and Heap Leach
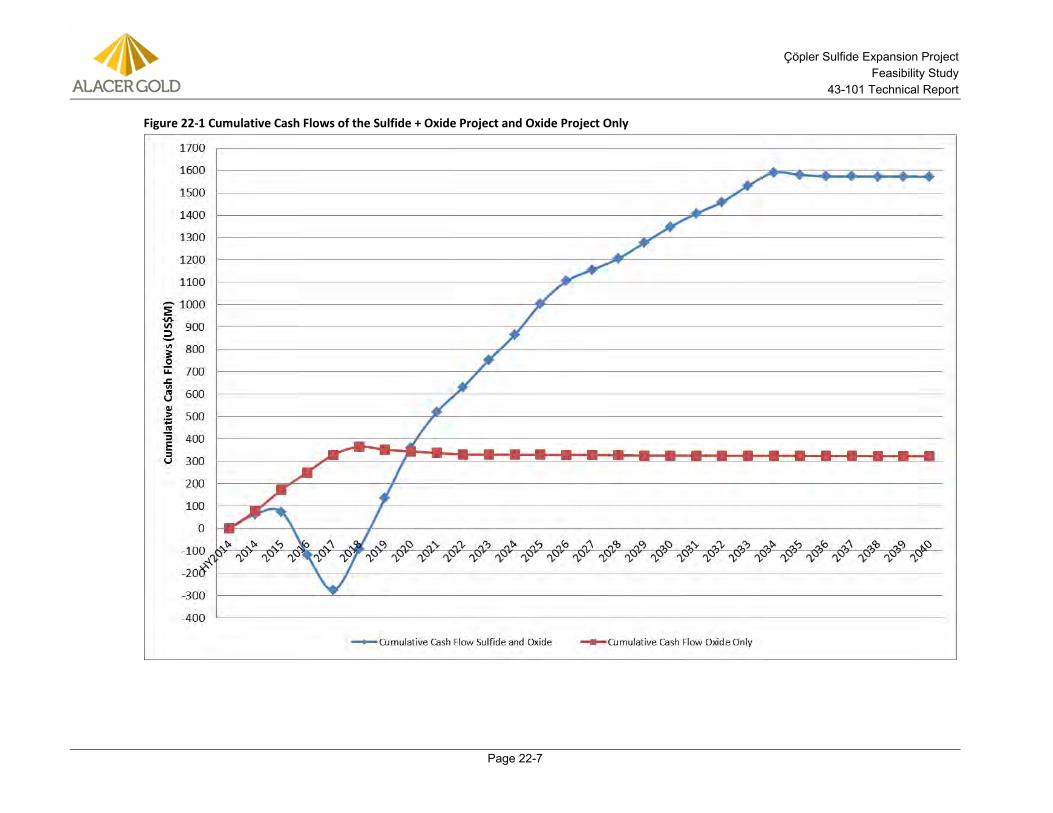
Çöpler Sulfide Expansion Project Feasibility Study
43-101 Technical Report
Page 22-7
Figure 22-1 Cumulative Cash Flows of the Sulfide + Oxide Project and Oxide Project Only
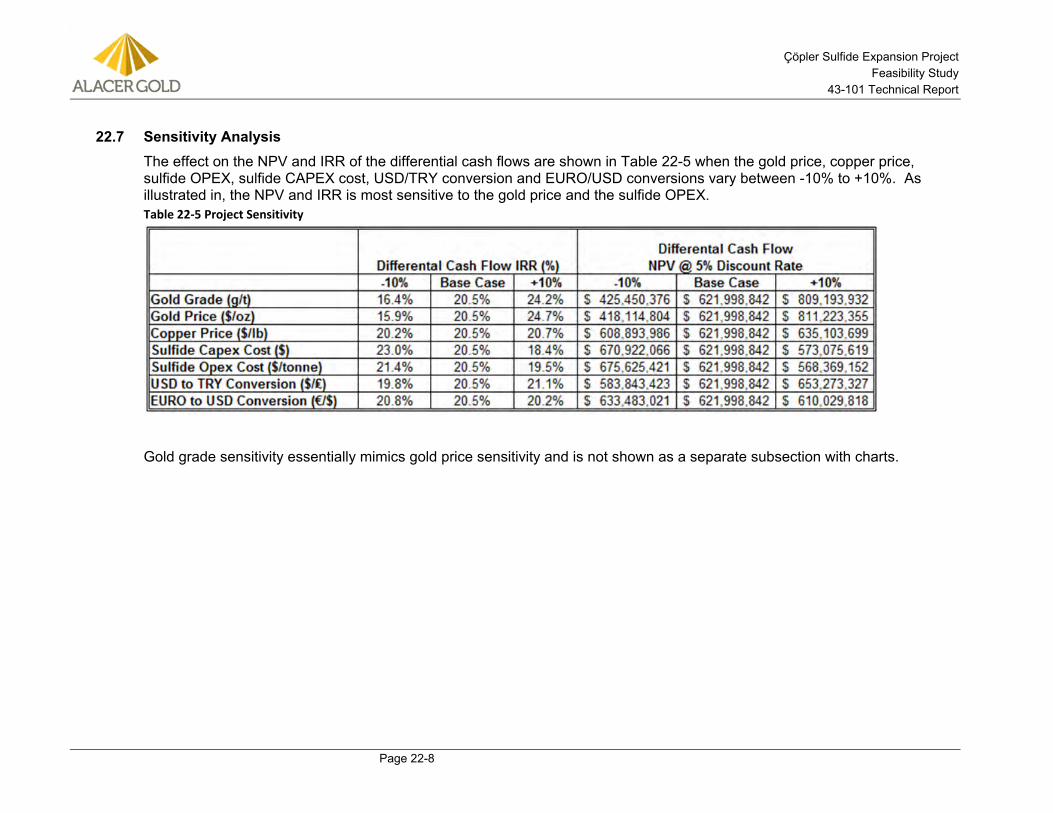
Çöpler Sulfide Expansion Project Feasibility Study
43-101 Technical Report
Page 22-8
22.7 Sensitivity Analysis The effect on the NPV and IRR of the differential cash flows are shown in Table 22-5 when the gold price, copper price, sulfide OPEX, sulfide CAPEX cost, USD/TRY conversion and EURO/USD conversions vary between -10% to +10%. As illustrated in, the NPV and IRR is most sensitive to the gold price and the sulfide OPEX. Table 22-5 Project Sensitivity
Gold grade sensitivity essentially mimics gold price sensitivity and is not shown as a separate subsection with charts.
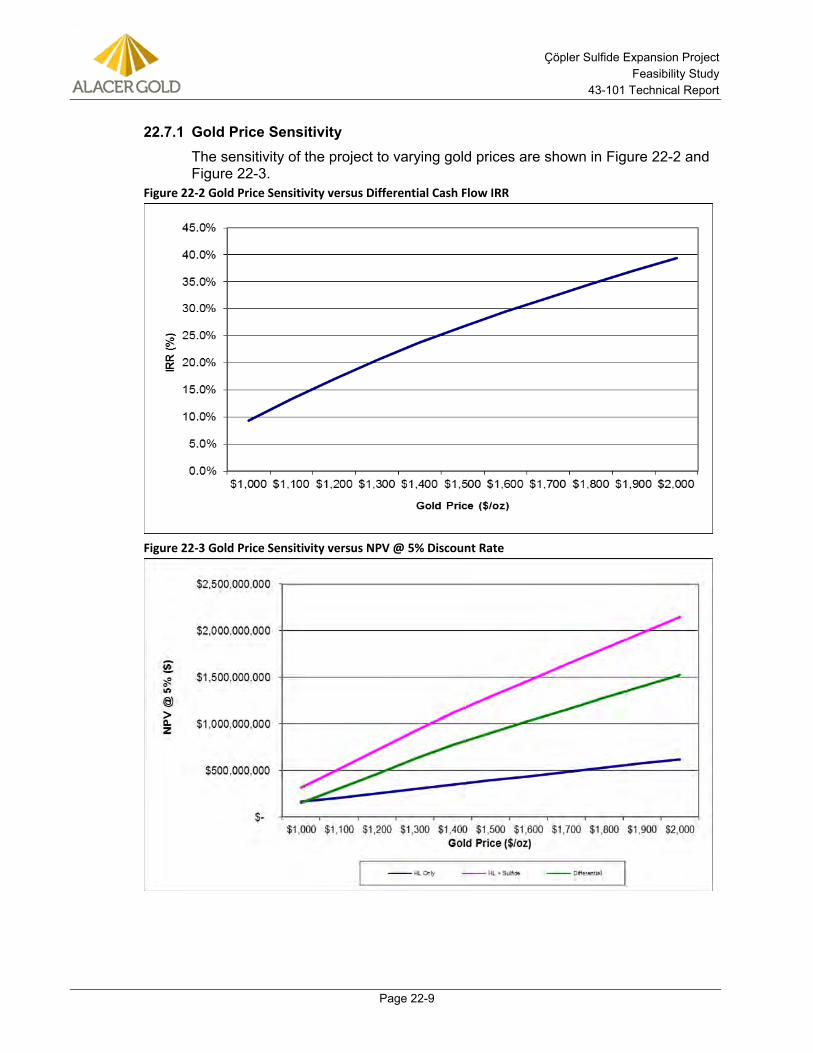
Çöpler Sulfide Expansion Project Feasibility Study
43-101 Technical Report
Page 22-9
Gold Price Sensitivity 22.7.1The sensitivity of the project to varying gold prices are shown in Figure 22-2 and Figure 22-3.
Figure 22-2 Gold Price Sensitivity versus Differential Cash Flow IRR
Figure 22-3 Gold Price Sensitivity versus NPV @ 5% Discount Rate
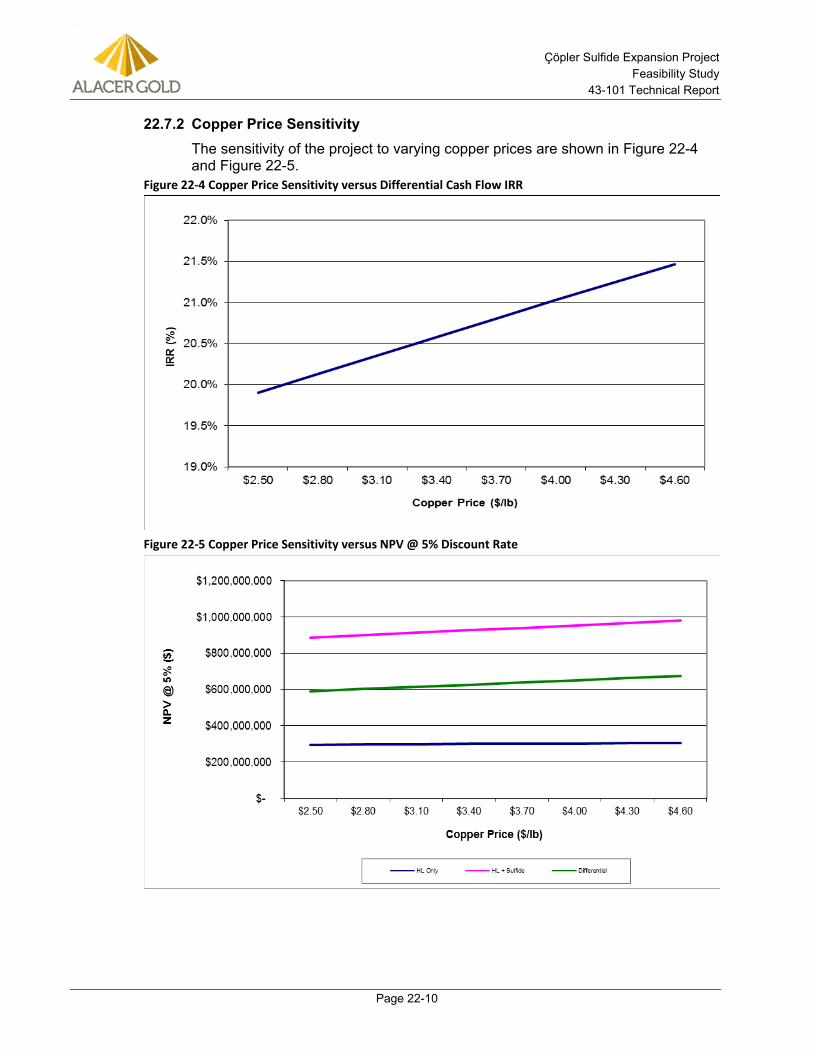
Çöpler Sulfide Expansion Project Feasibility Study
43-101 Technical Report
Page 22-10
Copper Price Sensitivity 22.7.2The sensitivity of the project to varying copper prices are shown in Figure 22-4 and Figure 22-5.
Figure 22-4 Copper Price Sensitivity versus Differential Cash Flow IRR
Figure 22-5 Copper Price Sensitivity versus NPV @ 5% Discount Rate
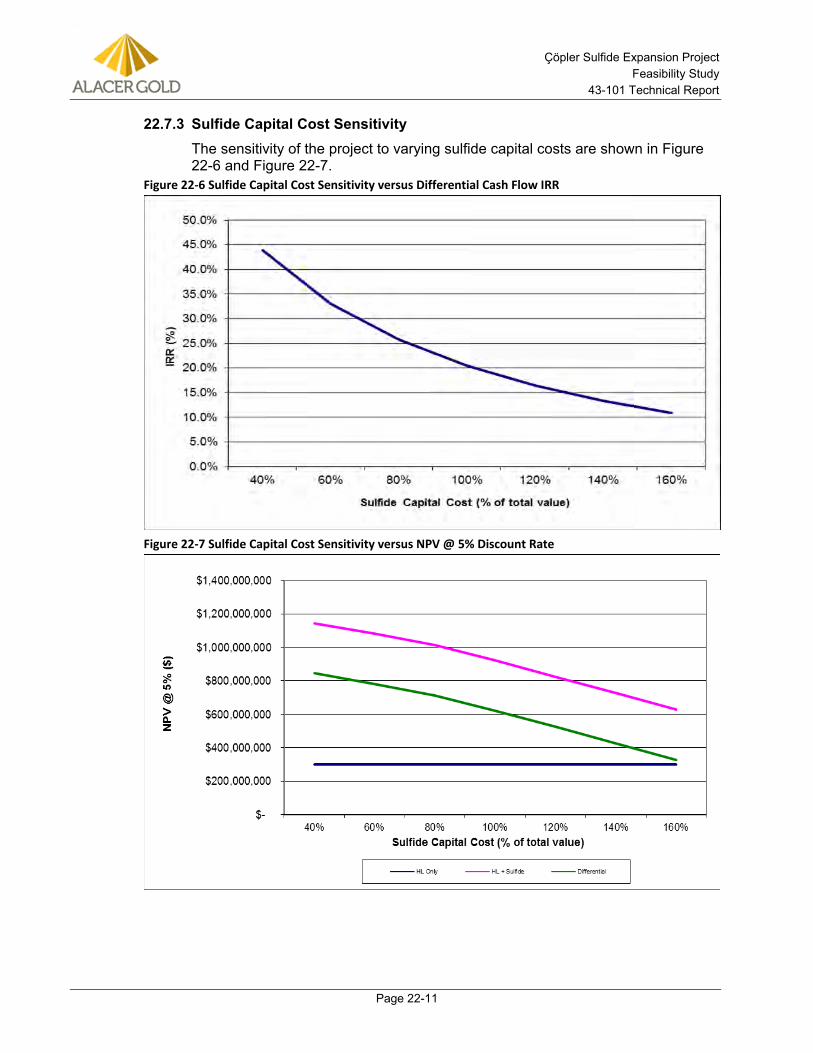
Çöpler Sulfide Expansion Project Feasibility Study
43-101 Technical Report
Page 22-11
Sulfide Capital Cost Sensitivity 22.7.3The sensitivity of the project to varying sulfide capital costs are shown in Figure 22-6 and Figure 22-7.
Figure 22-6 Sulfide Capital Cost Sensitivity versus Differential Cash Flow IRR
Figure 22-7 Sulfide Capital Cost Sensitivity versus NPV @ 5% Discount Rate
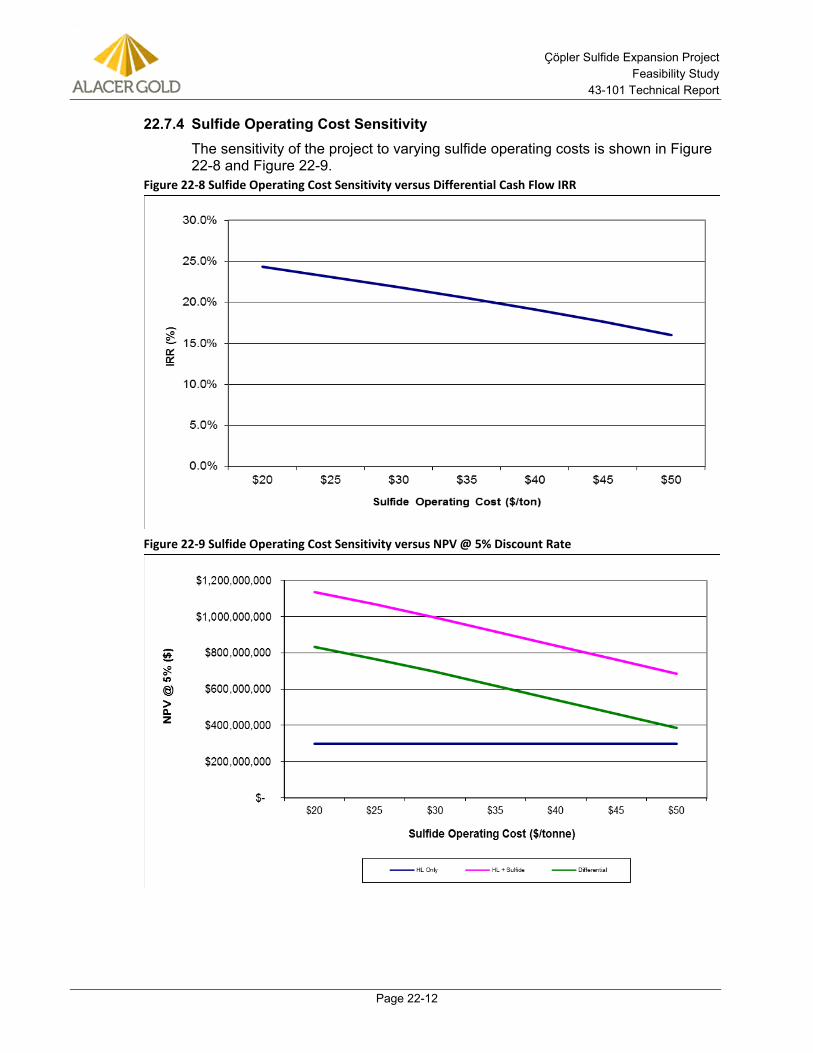
Çöpler Sulfide Expansion Project Feasibility Study
43-101 Technical Report
Page 22-12
Sulfide Operating Cost Sensitivity 22.7.4The sensitivity of the project to varying sulfide operating costs is shown in Figure 22-8 and Figure 22-9.
Figure 22-8 Sulfide Operating Cost Sensitivity versus Differential Cash Flow IRR
Figure 22-9 Sulfide Operating Cost Sensitivity versus NPV @ 5% Discount Rate
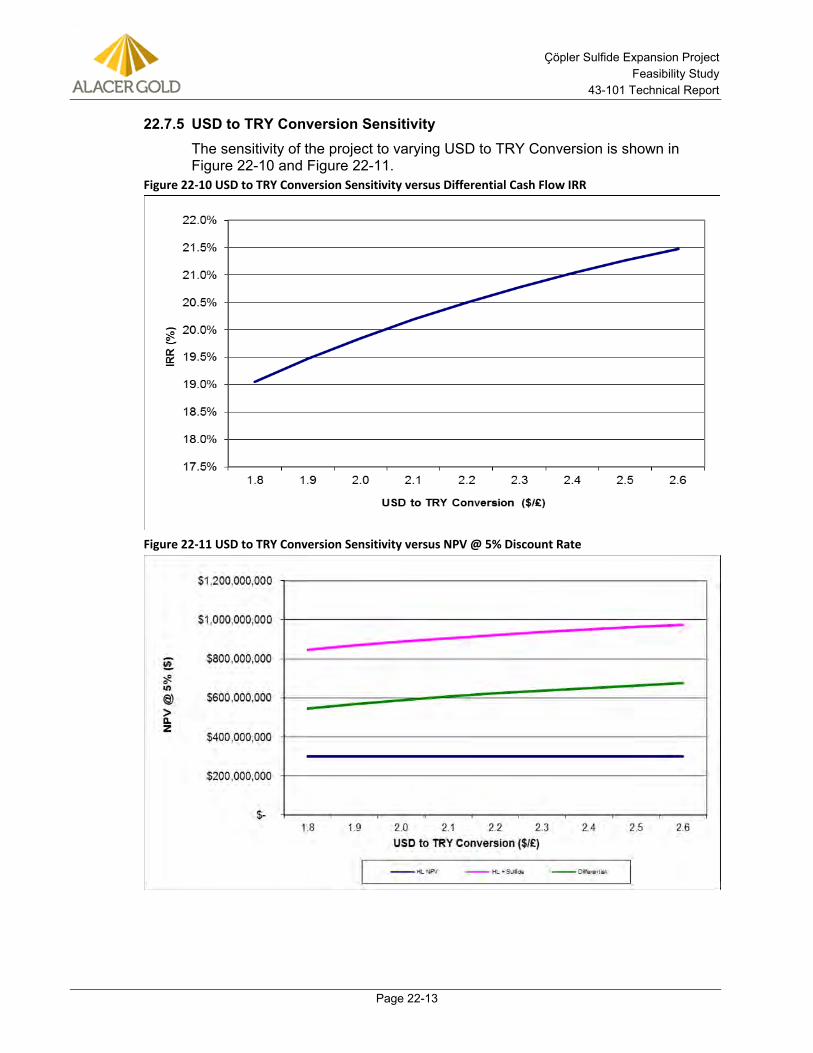
Çöpler Sulfide Expansion Project Feasibility Study
43-101 Technical Report
Page 22-13
USD to TRY Conversion Sensitivity 22.7.5The sensitivity of the project to varying USD to TRY Conversion is shown in Figure 22-10 and Figure 22-11.
Figure 22-10 USD to TRY Conversion Sensitivity versus Differential Cash Flow IRR
Figure 22-11 USD to TRY Conversion Sensitivity versus NPV @ 5% Discount Rate
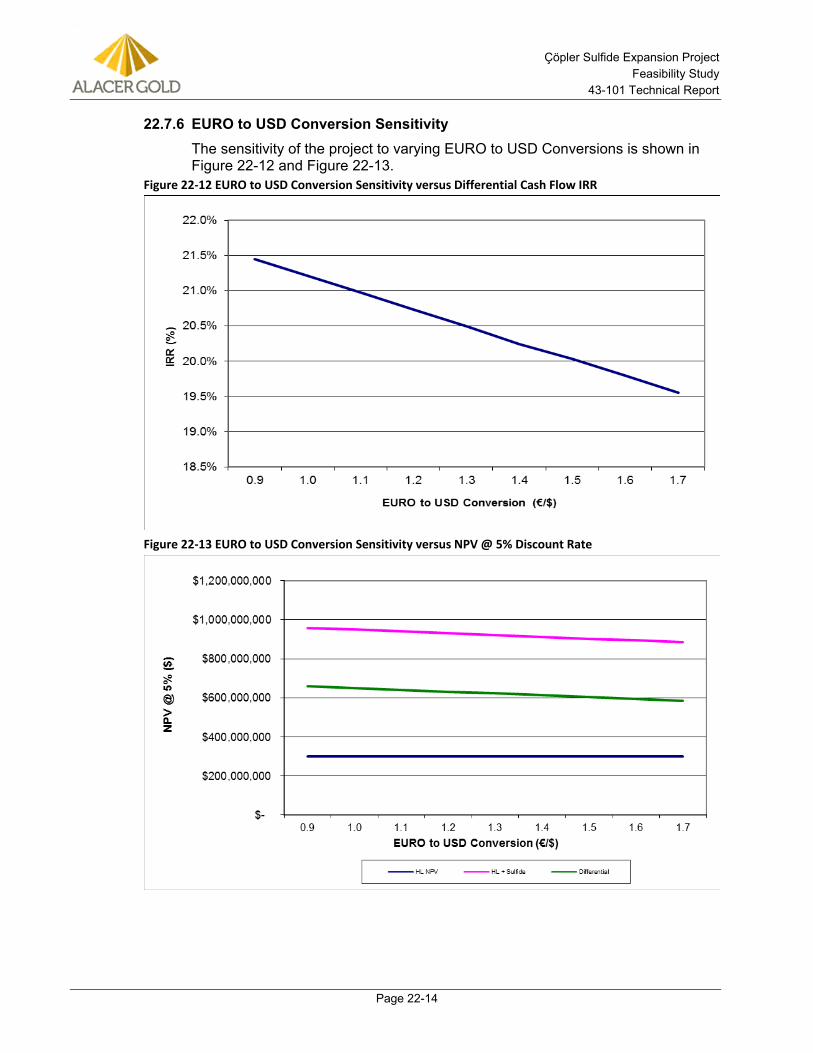
Çöpler Sulfide Expansion Project Feasibility Study
43-101 Technical Report
Page 22-14
EURO to USD Conversion Sensitivity 22.7.6The sensitivity of the project to varying EURO to USD Conversions is shown in Figure 22-12 and Figure 22-13.
Figure 22-12 EURO to USD Conversion Sensitivity versus Differential Cash Flow IRR
Figure 22-13 EURO to USD Conversion Sensitivity versus NPV @ 5% Discount Rate

Çöpler Sulfide Expansion Project Feasibility Study
43-101 Technical Report
Page 23-1
23.0 ADJACENT PROPERTIES There are no adjacent properties that are relevant to the development of the Ҫӧpler Project.
Çöpler Sulfide Expansion Project Feasibility Study
43-101 Technical Report
Page 24-1
24.0 OTHER RELEVENT DATA AND INFORMATION
24.1 Project Execution and Schedule Introduction 24.1.1A stand-alone preliminary Project Execution Plan (PEP) was developed for the detail design phases of the Sulfide Expansion Project. It is included in the Çöpler Sulfide Expansion Project Definitive Feasibility Report (Jacobs, 2014a).
The PEP is the principle planning and management document developed and maintained by the individual disciplines. When assembled, the discipline sections will collectively form the comprehensive PEP.
Detailed discipline execution procedures are contained in individual sections of the comprehensive PEP. The PEP contains discipline plans for execution functions during the engineering and construction phases of the project.
A detailed project construction execution approach will be a separate document not included in this PEP.
Key components of the PEP are as follows: • The safety goal is “Zero Incidents.” A joint safety manual shall be
prepared for the project incorporating the requirements of the Çöpler Mine and corporate safety programs. The construction management contractor will lead the safety effort for the project, with all parties responsible for working toward a zero incident rate. Contractors shall submit a site specific safety plan for approval by Alacer and the EPCM contractor.
• The project work breakdown structure (WBS) is the primary mechanism for management of data and work.
• The EPCM contractors project controls team is responsible for accurate and timely reporting of the cost and schedule status of the project and management of change to scopes of work, schedule and cost.
• Quality assurance is an ongoing process during all stages of the project, from engineering through purchase and delivery of equipment, supplies and materials, contract administration, construction and erection, start-up and commissioning. QA/QC procedures are established for each phase of the project and contractors and vendors shall be required to adhere to project standards.
• Various reviews and audits are to be conducted during the various stages of the project. A calendar of reviews shall be developed, these will include but not be limited to the following:
o Design reviews
o Estimate reviews
o Schedule reviews
o Constructability reviews
Çöpler Sulfide Expansion Project Feasibility Study
43-101 Technical Report
Page 24-2
o Risk reviews
o Health, Safety and Environment (HSE) reviews
o Quality audit reviews
o Process Safety Management, Hazard and Operability Analysis (HAZOP) and Hazard Evaluation and Risk Assessment (HERA) reviews
Schedule 24.1.2An interactive planning session (IAP) attended by Jacobs and Alacer personnel was held during the FS to develop a preliminary schedule for basic and detail engineering. The intention of the IAP and the subsequent schedule was to identify key activities and milestones during detail design and construction, not to develop a fully detailed engineering and construction schedule. This schedule allowed for the development of project costs that were included in the estimate. The preliminary Sulfide Expansion Project Schedule is included in Figure 24-1.
A full project schedule will be developed in early basic engineering.
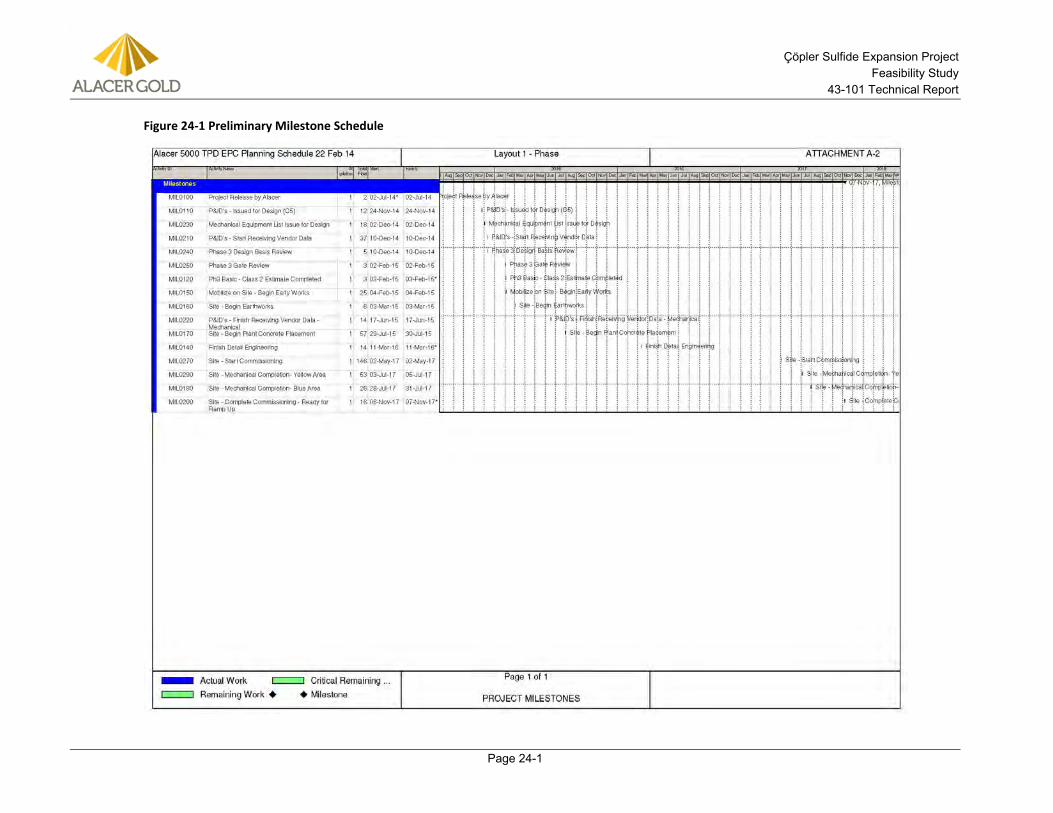
Çöpler Sulfide Expansion Project Feasibility Study
43-101 Technical Report
Page 24-1
Figure 24-1 Preliminary Milestone Schedule
Çöpler Sulfide Expansion Project Feasibility Study
43-101 Technical Report
Page 25-1
25.0 INTERPRETATION AND CONCLUSIONS Interpretation and conclusions for the Sulfide Expansion Project were identified by the various report contributors and are included below.
25.1 Mineral Resources The Çöpler open-pit Mineral Resource estimation method was designed to address the variable nature of the epithermal structural and disseminated styles of Au mineralization while honoring the bi-modal distribution of the sulfur mineralization that is critical for mine planning. The modeling method was designed so that a) the Mineral Resources could be easily updated with additional drilling, and b) changes in cut-off grades could be recalibrated using up-to-date production data.
Since no obvious correlations were observed between Au and S, they were domained and estimated separately. Gold showed little correlation with lithology, and was domained by mining areas (Manganese, Main and Marble) to reflect the different trends of the mineralization that commonly follow structures and lithological contacts. Due to the strong correlation between S and lithology, S was first domained by lithology. However, since each lithology may contain both < 2% S and, ≥ 2% S material (criteria used for classify the material as “oxide” for the heap leach and “sulfide” material being stockpiled for the proposed POX plant), each lithology was additionally separated into < 2% S and ≥ 2% S sub-domains.
PACK was selected as the best method to estimate the Au mineralization. Probabilistic envelopes were first generated to define the limits of the economic mineralization, and then used in the Mineral Resource estimation to prevent the economic assays from being smeared into non-economic zones, and conversely, to restrict waste assays from diluting the economic mineralization. Two Au PACK models were constructed. The first low-grade gold model used a 0.3 Au g/t indicator threshold to reflect the cut-off grade for the < 2% S material, and the second, high-grade, gold model used a 1.0 Au g/t threshold to reflect ≥ 2% S material.
Each Au model was reconciled to past production to calibrate the model to historic production data. Geology, exploratory data analyses (EDA), composite / model grade comparisons, and other checks were performed to adjust the parameters used to construct the model. In the final Mineral Resource model, the low-grade gold values were applied to the < 2% S material, and the high-grade Au model gold grades were applied to the ≥ 2% S material. The Mineral Resource Model has an implicit SMU of 5 x 10 m x 5 m.
The Mineral Resource model was validated by comparison with a nearest neighbor (NN) model on a local and global basis. The selectivity implicit in the Mineral Resource model was validated using a hermetian change of support algorithm applied to the NN model.
Mineral Resource categories of Indicated and Inferred classification were applied to each block based on drill hole density and data quality. No blocks in the model were classified as Measured Mineral Resources due to the following:
• The quantity and grade were not established well enough to be classified as a Measured Mineral Resource. Reconciliation to date has shown mined to model variances for sulfide material are greater than 15% (positive) over annual periods. To date, the observed variances are not fully understood
Çöpler Sulfide Expansion Project Feasibility Study
43-101 Technical Report
Page 25-2
• Documentation of the original collar locations and down-hole surveys are not available
• Verification of the blast hole database used to calibrate the model has not been completed, and the site laboratory has not been audited
Additional sampling and assay analysis are needed to obtain stockpile grades for sulfur, copper, silver, and manganese.
With additional drilling in selected areas, and completion of reconciliation studies involving re-establishment of the blast hole assay database and on-site laboratory audits, there is potential to convert some of the Indicated Mineral Resources to Measured Mineral Resources.
It is AMEC’s opinion that the resource model has been constructed according to industry best practices and conforms to the requirements of the 2014 CIM Definition Standards that are incorporated by reference in NI 43-101.
25.2 Mining and Mineral Reserves The following conclusions have been determined for the Mining and Mineral Reserves:
• Mineral Reserves estimate has been performed to industry best practices and conforms to the requirements of the NI 43-101 Technical Report.
• Factors which may affect the Mineral Reserves estimate are described in Section 15.2 “Risks and Opportunities”.
• The mine limits and throughput rates are based on an optimization study focused on maximizing the discounted value of the Mineral Reserve.
• The Mineral Reserves estimated is supported by a detailed mine design and schedule that is achievable under the assumed circumstances.
• The mining method used is appropriate to the deposit style and location. The mining method used employs conventional mining tools and equipment.
25.3 Waste Dump Facility Golder developed the following conclusions for the Waste Dump Facility:
• Some risk exists relative to the stability of the West and Upper Çöpler Dump due to some uncertainty in the characterization and strength of the metasediment and diorite foundation materials. Specifically, understanding the extent, orientation and strength of the bedrock beneath each of these waste dumps must be determined to confirm the feasibility of the design as currently planned.
25.4 Metallurgy and Mineral Processing While reviewing and interpreting the prior and current testwork and developing the process design for the Sulfide Expansion project, Jacobs developed the following conclusions:
• Extensive metallurgical testing (batch and pilot plant) has been conducted on representative samples from the Çöpler Sulfide Resource indicating that the gold is refractory to direct cyanidation and that an oxidation pre-treatment is required to liberate gold prior to cyanidation
Çöpler Sulfide Expansion Project Feasibility Study
43-101 Technical Report
Page 25-3
• The risks of supplying sulfide process feed not complying with the specified blending parameters include:
• Inability to process feed with sulfide sulfur levels too low for autoclave autogenous operation.
• Inability to process material with too high of sulfide sulfur content due to too much heat generated in the autoclaves.
• High acid consumption due to too high of carbonate levels
• Too high metal grades for metal recovery processes.
• The Çöpler Sulfide Resource contains a high amount of clay mineralization (average of 16% swelling clays in variability tests) that could present problems in processing the material.
• Testing demonstrated that copper extraction is more highly dependent on the extent of sulfide sulfur oxidation than is gold extraction. If target sulfide sulfur oxidation is not achieved, the recovery of copper may be lower than project affecting project economics slightly. The project economics do not totally depend on maximum copper recovery for positive economics.
• Drill hole interval assaying for carbonate has not been completed or integrated into the Çöpler Sulfide Resource model. The carbonate content in the feed to sulfide processing system must be blended to within the specified limits of 2.5% to 8.0%. Delivering material from the sulfide resource outside of the specified blending limits may result in process chemistry upset and in increased sulfuric acid consumptions resulting in the risk of higher operating costs.
• The Manganese Diorite rock type was demonstrated to have some negative impacts on the metallurgical performance of the pressure oxidation system if present in the process feed at a proportion greater than 40% w/w.
• The sulfide process plant comminution circuits were designed based on thirty samples from the variability testing. The number of samples permits the design of the comminution circuits but is very minimal for projecting the sulfide plant feed hardness in the resource model. There is the risk that the sulfide plant feed hardness may not be predictable possibly resulting in too high of hardness in the plant feed causing low plant throughput or high feed hardness variability causing excessive wear or downtime in the comminution circuits.
• Due to the high clay content of the sulfide process feed, the use of a direct SAG mill feed system is less common than systems using intermediate stockpiles but has been employed in many application as documented in the Crushing and Grinding Systems for Handling Clayey Ore Trade-Off Study (Jacobs, 2104b).
• The use of vertical autoclaves presents an economic opportunity described as follows; Vertical autoclaves should be capable of more rapid cool down than the large horizontal autoclaves. It is expected that vertical autoclaves can be cooled approximately 12 hours faster than horizontal autoclaves. Approximately six shutdowns per year requiring entry into the autoclaves are projected for the first two years of operation. After the first two years approximately two shutdowns per year will be needed. For the first two years the use of vertical autoclaves could result in 144 hours less downtime and 24 hours per year thereafter. At a head grade of 2.41gm/tonne Au, each 12 hours of reduced
Çöpler Sulfide Expansion Project Feasibility Study
43-101 Technical Report
Page 25-4
downtime could result in 184 (5,000 tpd) to 221 (6,000 tpd) ounces of increased gold production.
• Vertical autoclaves are a departure from the traditional horizontal autoclaves in the gold industry but there are plants in other mineral industries where the vertical autoclaves have been used successfully. There may be design or operational issues with the vertical autoclaves that may have to be corrected upon start-up due to a lower amount of operational experience with the vertical claves.
• Autoclave dimensions needs to be optimized and coordinated with Turkish road system size limitations to the project site. Without coordination of the autoclave design with transport limitations, autoclaves could be fabricated that cannot be transported to the project site. There is a risk that if transport size limitations have decreased for any reason since the completion of the FS transport study that an increased number of smaller autoclaves may have to be considered for the project.
• The final plant tailings exhibit relatively poor settling and solids consolidation characteristics which pose a risk to timely closure and reclamation of the Tailings Storage Facility. Early in the next phase of the project, study of the optimization of the proposed slurry tailings disposal method versus tailings filtration producing “dry” tailings presents an opportunity to review and implement a tailings disposal system design that will minimize risks in closure and reclamation while optimizing the trade-off of operating and capital costs.
• The process flowsheet incorporates cyanide destruction using the SO2/air process which testing indicated that should be able to produce plant tailings with a WAD cyanide level of less than 5ppm. There is some minor risk that that the process may not function as required in the full scale plant as was demonstrated by the small scale tests. The opportunity exists to evaluate alternative processes for cyanide destruction prior to final design to ensure there is an alternative to the SO2/air process.
• The opportunity exists to upgrade the Çöpler sulfide resource model based on the required sulfide process feed blending parameters. The opportunity exists to develop a coordinated blending program between Alacer mine planning and process operations staff prior to project implementation. Coordination of feed blending limits needs to include a reevaluation of blending requirements by engineering and Alacer process personnel.
• Slurry rheology test results from pilot plant Campaign 4 were used in the design of pumping and piping systems for the FS. The data needs to be reexamined in the next project design phase to reevaluate pumping and pipeline designs to optimize the systems and to ensure gravity slurry flow particularly between autoclave vessels is confirmed. There may be an opportunity to optimize the pumping and pipeline designs to reduce capital costs.
• The metallurgical test work indicates that the copper precipitate formed in the circuit should contain 0.16% to 0.27% arsenic. The copper precipitate marketing study indicates that the precipitate with a 0.16% to 0.27% arsenic content should be marketable; however, there is the risk of triggering penalties for the projected copper precipitate as typical arsenic penalties start at levels of about 0.1% to 0.2%. Concentrates with arsenic levels above 0.5% typically are considered as “unmarketable”. The marketing study indicates that the precipitate can likely be marketed directly to a number of smelters or through brokers. Alacer has neither
Çöpler Sulfide Expansion Project Feasibility Study
43-101 Technical Report
Page 25-5
finalized a contract with a smelter or a broker for concentrate sales therefore the risk of uncertain sales terms and transport costs is present. The opportunities to reduce risk associated with copper precipitate arsenic levels are twofold as follows:
• Review the copper precipitation circuit to ensure the process design has incorporated features to consistently produce precipitate with minimum of arsenic content.
• Alacer should finalize a concentrate sales contract with a smelter or a broker defining concentrate sales terms and shipping destination.
• There may be an opportunity to decrease the number of tanks in the neutralization circuit. The pH increase may only need to be completed over the course of one tank rather than multiple tanks.
• The process plant and equipment layout has been designed to take advantage of the existing terrain of the project site utilizing gravity flow of fluids where possible. The plant layout and gravity flow cases have not been fully optimized as of the end of the FS phase. The opportunity exists to optimize the plant layout to take advantage of gravity flow between unit operations, which could potentially remove some pumps from the process reducing capital and operating costs of the project.
• The leach and CIP unit process inlet temperatures are expected to range from 55-65ºC. The cyanidation and carbon-in-leach tests performed in Campaigns 1 to 4 were conducted at essentially ambient temperatures. An opportunity exists for slightly higher gold extractions in the leach circuit due to higher temperatures than were tested. There is a slight risk for lower carbon loadings due to higher temperatures that could result in higher carbon movement through the adsorption circuit and ADR plant. The increased carbon movement could result in higher carbon wear, higher solution losses, and increased carbon fines generation.
• Solids/liquids separation testing performed by representatives of four thickener vendors and by Pocock Industrial indicates that the final plant tailings may be difficult to settle and thicken to a density greater than 37% solids w/w. The process has been designed based on a low tailings thickener underflow density and projected low water reclaim from the tailings storage facility. There is the opportunity, once the plant is in operation, to test and optimize the tailings thickener performance to achieve higher underflow densities and to increase the amount of water recycled directly from the tailings thickener and as reclaim from the tailings storage facility.
• The materials of construction for plant equipment and piping were reviewed by project team members and consultants as part of the P&ID review in August of 2012. There may be an opportunity to review and optimize the plant materials of construction early in the next phase of the project.
25.5 Infrastructure Based on the experience of the personnel supporting the feasibility design and estimate for similar work, major unknown risks to the cost of the project have been minimized. It is anticipated that the basic and detailed design effort will produce an optimized design with capital and operating cost saving features. In addition, lessons learned from prior construction of the existing facility will be invaluable in the scheduling of delivery, storage and erection of the new facility.
Çöpler Sulfide Expansion Project Feasibility Study
43-101 Technical Report
Page 25-6
• The design will be enhanced in basic design by the lessons learned from the ongoing operations. Difficulties encountered during the construction of the original site should be reviewed and avoided during construction of the Sulfide Process Plant. In addition, the benefits of the existing operation will carry over into the new operation in the form of an efficient process, schedule, equipment that will incorporate an optimized infrastructure. Site location, operating conditions and the historical weather data will be taken into account supporting the design of the new facility.
• Optimizing the building sizes will be based on firm equipment sizing. Detailed equipment layout may result in reduced building sizes.
• The elimination of a finish painting coat on structural steel may be a consideration due to the relatively short expected life of the mine.
• In some instances, it may be possible to substitute concrete tunnel construction around the thickeners with corrugated pipe.
• Civil costs are conservative based on the latest Geotechnical Report. Savings in detail design may be identified for retaining walls and sloping surfaces.
• Determine if there is an economic benefit of working with the construction company constructing the nearby hydroelectric dam to obtain concrete from their current source.
• Matching of existing spares with new equipment to fit into the size of the existing warehouse.
• A detailed determination of how disposal of raw sewage will be handled (separate septic systems located near each building versus into a central on-site septic system or by being trucked off site) needs to be finalized.
• Disposal of sewage and waste from the oxygen plant has not been considered.
• Construction of an additional pumping facility to provide the additional raw water requirements to the plant if required has not been included.
• The current design accounts for some road upgrades to the site to accommodate the large and heavy equipment such as the POX vessels and mills that will be delivered to site. If road upgrades required are more extensive than anticipated, costs could increase.
• A small maintenance shop has been included as part of the POX building. Any additional maintenance facilities to support the rest of the site have not been included in the scope of work. Although a facility currently exists on site, it is unknown if the existing facility has the space to support the unique equipment that will be installed.
• Change rooms in the warehouse building have not been researched in detail and the size may increase.
• Potential changes to the 2009 IBC (2012 IBC) may impact costs for pre-engineered buildings due to new seismic design criteria.
• All fireproofing has been excluded and is considered to not be required for the project. The assumption is that adequate egress planning will alleviate this issue.
25.6 Tailings Storage Facility Golder developed the following conclusions for the Tailings Storage Facility:
Çöpler Sulfide Expansion Project Feasibility Study
43-101 Technical Report
Page 25-7
• There may be an opportunity in the detailed design to phase the TSF starter construction into two phases of construction in order to plan liner system installation in 2015 and 2016 and avoid the potential for working in adverse winter conditions. Close communication and coordination with local contractors during the detailed engineering process will be important in developing opportunities to improve efficiency of the final design and construction process.
• Some risk exists relative to potentially varying geologic and geotechnical conditions within the TSF foundation due to the lack of detailed geotechnical information due to the delay in approval from the Turkish regulatory agencies in gaining approval for geotechnical drilling activities. Specifically, understanding the extent, orientation and strength of the serpentinite and other bedrock and the extended TSF footprint must be determined to confirm the feasibility of the design as currently planned.
• Some risk also exists with respect to schedule and ability of local contractors to coordinate construction of the embankment with installation of the liner system.
25.7 Marketing There is little risk with marketing the copper precipitate and the market appears to be fairly stable at present. The following conclusions resulted from the Copper Marketing Study performed during the FS:
• Optimization of the product arsenic content should lower the risk of penalties being imposed or triggered. This should raise the value of the material as well as open up the largest number of processing options.
• If Alacer chooses to manage the sale and transportation of the precipitate, there are options that could be explored to maximize the revenue.
• If Alacer elects to have a broker market the precipitate, the necessity of having internal resources focused on efforts that are not core to the gold business is eliminated.
25.8 Environmental/Permitting At the time of this report the EIA permitting process is underway and specialist studies are continuing. Therefore, providing definitive conclusions is not possible at this stage. However, the following general remarks can be made on the risks and opportunities.
• The Çöpler mine production from oxide ores was permitted in 2008 and is currently in operation. In terms of permitting, the existing mine provides an opportunity to demonstrate to the regulators the quality of environmental performance of the mine operations.
• The stakeholder engagement process has just begun. Positive public opinion due to new jobs and housing created by the mine can be an opportunity to get further public support for the sulfides expansion during the EIA permitting process.
• The risks with the EIA permitting process are those that are typically associated with any mining project. The Ministry of Environment and Urbanization has the authority to deny the EIA permit altogether based on unacceptable environmental impacts or ask for revisions to the EIA study that may extend the EIA permitting process beyond the official one-year period.
Çöpler Sulfide Expansion Project Feasibility Study
43-101 Technical Report
Page 25-8
• The stakeholder engagement process has just begun. Therefore, the public opinion is presently unknown. Negative public opinion due to past mine performance issues may create risk for the project.
• The physical, chemical, biological, and socio-economic impacts of the sulfides expansion have not been fully assessed yet. Any significant adverse impact may require expensive mitigation measures.
25.9 Mine Closure and Sustainability The SRK closure team has reviewed the available information and conducted a site visit to review the proposed locations of the project facilities. They have developed the following conclusions:
• It may be possible to change the required reclamation slope for the heap to 2H:1V to minimize the amount of offloading and/or liner extension. A geotechnical study should be done to establish whether this steeper slope would meet the reclamation objectives.
• Consideration should be made to if alternatives can be determined to provide positive surface drainage to overcome the ponding as a result of the settlement of the tailings.
• A study should be prepared to evaluate the feasibility and consequences of allowing long-term closure of the tailings impoundment with a depression that will capture run-on.
• There is a lack of available topsoil at the site. A study by the Istanbul Technical University identified a range of between 0 to 30 cm of poor quality topsoil was available within the footprint of the facilities at the site. However, the EIA and 2009 Closure Plan call for the placement of 1-meter of topsoil on disturbed areas. It is likely the project will not be able to comply with this requirement because of this disconnect between available topsoil and the quantity required.
• Because of the steepness of the terrain at the site there are limited locations to store topsoil. Currently topsoil is stored adjacent to the administration area on the west side of the fill slope. This topsoil will need to be relocated prior to construction of the fill for the sulfide mill. Some topsoil is also stored on the top of the south waste rock dump which might also need to be moved prior to building this dump to its capacity.
• Due to the design of the heap leach side slopes and the required reclamation slope of 2-2.5H:1V it is possible that either ore will need to be offloaded or the liner will need to be extended for closure. Unit rates for these activities were provided by Golder Associates.
• There is a roughly 110 meter high angle of repose fill slope adjacent to the heap leach on the east side. The crest is within 27 meters of the toe of the heap leach and the toe is about 10 meters from Sabırlı Creek. It will not be possible to re-grade this slope to meet the reclamation goals for slopes. It will also not be possible to place topsoil or re-vegetate this slope. A provision for leaving this slope as is must be included in the new EIA.
• The tailings impoundment operating design specifies the supernatant pond will be located against the hill on the east side with tailings deposition on beaches to the north, west and south. This design will require additional fill to create a positive draining surface that will not pond water. Since the fill will need to be placed in the supernatant
Çöpler Sulfide Expansion Project Feasibility Study
43-101 Technical Report
Page 25-9
pond area it will also be difficult to predict the amount of fill required to overcome differential settlement in that area.
• Based on discussions with the engineering team designing the process and tailings systems, it is likely the tailings at closure will not support equipment and may not do so for quite some time. This requires the placement of a traffic layer of waste rock and or placement of geosynthetic fabric in order to place the final cover.
25.10 Capital Cost Estimate Jacobs prepared the capital cost estimate for the Çöpler Sulfide Expansion Project. The estimate was prepared per Jacobs’ guidelines and standards for a Feasibility Level (Jacobs Class 3) Capital Cost Estimate per Jacobs Standard Operating Procedures. This estimate provides a basis for evaluating the economic viability of the project and for approving the project for advancement into Basic/Detail engineering, as well as providing a basis for advance commitments. While preparing the capital cost estimate, Jacobs developed the following conclusions:
• The geotechnical report from Golder was utilized by the project. However, the lack of specific area geotechnical reports resulted in the need to make some assumptions on rock excavation as well as foundation requirements for earthquake zones. Jacobs chose to be conservative when taking these items into account; further investigation and study could result in a savings to the project.
• It was assumed that either U.S. or EU expats would be utilized when required. Labor from other countries of origin with a lower expat compensation rate may be utilized to bring the costs down for the mechanical equipment account.
• The pricing that was used for alloy piping and tanks in the estimate came from several vendors as well as historical costs. Some of the costs had to be extrapolated for larger diameter piping, fittings and valves due to lack of available pricing. In addition the question remains if these items will be readily available and if they can be procured in Turkey. No Turkish vendor pricing was obtained for piping and especially not on alloy. Alloy tank pricing was obtained but the volatility associated with alloy pricing presents a risk to the project.
• The geotechnical report from Golder was utilized by the project. However, the lack of specific area geotechnical reports resulted in the need to make some assumptions on rock excavation as well as foundation requirements for earthquake zones.
• Local labor issues and labor availability presents a risk to the project primarily due to the fact that skilled labor may be difficult to obtain and retain in the area.
• A preliminary logistics report was completed for the Autoclaves during the FS. However, the final logistics study has not been conducted. The results of the updated study could cause additional transport costs to be realized.
• Jacobs utilized Turkish and EU standards to the greatest degree possible during the FS. However, there is a possibility that some of the standards may be more rigorous that previously thought and this could result in additional costs.
• VAT recovery was taken in to account if there were pieces of equipment that are not subject to the mineral exemption in Turkey. If VAT applies to other equipment not accounted for, there could be increased costs.
Çöpler Sulfide Expansion Project Feasibility Study
43-101 Technical Report
Page 25-10
25.11 Operating Cost Estimate Life-Of-Mine (LOM) operating costs were developed by Jacobs based on mining, processing and support costs. During the development of the operating costs, the following conclusions were made:
• Sulfuric acid pricing is based on an email quotation from a local supplier. This will be subject to price fluctuations based on availability of local vendors to supply acid.
• There is currently a lack of ore carbonate content data from Alacer over the life of mine. Alacer has started to assay carbonate content in the geologic models and the data will be available for ore blending planning once operations begin. The possible impact is on ore control and acid additions. The risk is increased reagent consumptions, resulting in higher costs.
• Unit supply costs for consumables from 2015 to end of mine life have not taken into account escalation in price increases
25.12 Economic Analysis The results of the economic analysis represent forward–looking information as defined under Canadian securities law. Actual results may differ materially from those expressed or implied by forward-looking information. The reader should refer to the Cautionary Note with respect to forward-looking Information at the front of this Report for more information regarding forward-looking statements, including material assumptions (in addition to those discussed in this section and elsewhere in the Report) and risks, uncertainties and other factors that could cause actual results to differ material from those expressed or implied in this section (and elsewhere in the Report).
A financial analysis for the Çöpler Sulfide Expansion Project was carried out using an incremental or differential cash flow approach. As part of the financial analysis, the following conclusions were made.
• Fluctuation in gold pricing is expected in the future. Risks include the decrease in the price of gold, causing a drop in IRR and NPV over the life of the project. However there is an opportunity that if the gold price increases, IRR could be increased and the payback period shortened.
• Fluctuation in copper pricing is expected in the future. Risks include the decrease in the price of copper causing a drop in IRR and NPV over the life of the project. However there is an opportunity that if the copper price increases, IRR could be increased and the payback period shortened.
• There is a lack of ore carbonate content data from Alacer over life of mine. The possible impacts are on ore control and acid additions. The risk is increased reagent consumptions, resulting in higher costs.
• There is a risk that metal grades could decrease over LOM, causing decreases in the cash flow differential.
• There is a risk that the capital cost can increase due to: • Commodity price volatility
• Global inflation / deflation
• Decrease in supplier production capacity
Çöpler Sulfide Expansion Project Feasibility Study
43-101 Technical Report
Page 25-11
• Shortage in skilled labor
• Currency exchange changes
25.13 Project Execution Plan A stand-alone preliminary Project Execution Plan (PEP) was developed for the detail design phases of the Sulfide Expansion Project. It is included in the Çöpler Sulfide Expansion Project Definitive Feasibility Report (Jacobs, 2014a). During the development of this document, it was concluded that there are no project execution issues identified at this time that could jeopardize the success of the Çöpler Sulfide Expansion Project.
Çöpler Sulfide Expansion Project Feasibility Study
43-101 Technical Report
Page 26-1
26.0 RECOMMENDATIONS It was concluded that the Çöpler Sulfide Expansion Project is economically and technically feasible. It is recommended that the project move forward into the Basic Engineering at an estimated cost of $11.3M. Upon completion of the Basic Engineering phase, it is recommended that the project proceed directly into the Detail Design phase. The total cost of engineering for these two phases is estimated at $35.4M.
Additional recommendations for the project were compiled by the various report contributors and are included below. These recommendations should be evaluated in the Basic Engineering phase and action taken where necessary to support a successful project.
26.1 Database, QAQC and Mineral Resource Estimation The following recommendations were made by AMEC:
• Alacer should initiate a procedure to retain original collar survey documentation and downhole survey data as they are collected. The information should be reviewed by the responsible geologist, then signed, dated and added to the drill hole folder.
• AMEC recommends Alacer attempt to obtain as many historical logs as possible and implement procedures to ensure current data are collected and stored in a series of folders. Ideally each drill hole would be stored in an individual folder. For current and future holes, the Alacer Senior Geologist should review, sign and date the final log.
• AMEC recommends Alacer apply the proper magnetic declination correction of 5.6°E rather than the 3.0°E correction currently being applied at site. AMEC notes the declination correction has varied from 4.5°E in 2000 to 5.6°E in 2014. The correction applied should be based on the year the data were collected.
• Differences noted in the ALS assays should be corrected, and the updated database should be verified prior to future resource estimation.
• Alacer should follow QAQC protocol by sending 5% of the samples to a secondary laboratory for check analysis. Samples should be sent on a regular basis, and not at the end of the drilling program.
• QAQC results should be monitored on a regular basis during a drilling program and the laboratory asked to follow up on samples that are outside the acceptable range.
• Add additional CRMs to monitor copper and silver assays.
• Add additional CRMs to monitor sulfur assays near the current oxide/sulfide cutoff of 2% sulfur.
• All original assay data from the Çöpler property should be acquired. Drill samples from when the property was managed by Rio Tinto were sent to the OMAC laboratory in Ireland. Alacer should obtain the assay data certificates and compare to database values.
• Since the mineralization locally follows the lithological contacts, using a search ellipse that follows these contacts (dynamic anisotropy) should be evaluated in future models
Çöpler Sulfide Expansion Project Feasibility Study
43-101 Technical Report
Page 26-2
• The distinctively different sulfur populations for each lithology (although each lithology hosts both low- and high-sulfur mineralization) suggests that sulfur should be domained by lithology for estimation which was done in the current model. This relationship, however, may be more complex and should be studied again for future models
• Although ID2 estimation works well estimating sulfur where the drilling is closer spaced, an ID5 estimate may provide a better sulfur estimation in the waste rock with drill spacing is lower and should be considered for the next resource model.
• Çöpler is a geologically complex deposit with multiple metals that must be tracked along with oxidation type and lithologies. Further work should be done to verify and adjust resource model domains and parameters used. This would allow for an improved resource estimate and a greater understanding of the deposit.
• The quantity and distribution of the total carbon and sulfate sulfur should be studied to better quantify any potential impacts of these elements in the POX circuit, and for implications for acid rock drainage.
Depending on the requirement to utilize third-party consultants in the above work, AMEC considers all of the work can be completed concurrently in a single work phase and is budgeted at between $100,000 and $200,000.
26.2 Mining and Mineral Reserves The Feasibility Study suggests that the sulfide resource located at the Ҫӧpler mine can be safely and economically mined using standard open-pit mining practices and proven processing techniques. In regard to the mining portion of this project, it is recommended that the level of work completed to date should allow for progression into the next stage of mine design and planning. Many additional considerations regarding capital expenditure, investment return, and risk must also be evaluated in regards to a decision on how Alacer should proceed with the sulfide expansion at Ҫӧpler.
A significant Mineral Reserve exists within the confines of the designed open pit presented within this report. The design is well suited for open-pit mining operations by conventional mining equipment by an outside contractor. With the use of extensive ore stockpiling during the 47 months prior to the POX mill being commissioned, it is possible to obtain very high average POX mill feed grades near 5.0 g/t during the first 18 months of POX operations, and 4.0 g/t during the next 18 months. The production schedule is readily achievable and the mining operation will continue in the same manner as the existing oxide production at the Çöpler mine site.
The following items are recommended as part of the next phase of engineering and design associated with the project. These recommendations are:
• Detailed scheduling and design of the sulfide ore stockpiles should be completed. Results from ongoing metallurgical test work will assist in determining the optimal stockpiling strategy.
• Carbonate and Sulfide grades should be modeled.
• Additional geotechnical oriented core hole drilling should be completed in areas where joint sets may affect overall pit wall stability.
• Further mapping and definition of alteration types and zones should be completed so that improved pit slope angles can be realized and geotechnical risk can be reduced.
Çöpler Sulfide Expansion Project Feasibility Study
43-101 Technical Report
Page 26-3
• Further mapping and definition of the local and regional fault structures should be completed to reduce or realize geotechnical risk in the areas where these structures intersect the pit.
• Further refinement on the hydrogeologic impacts to geotechnical parameters and estimation on pit dewatering requirements should be completed.
• Pit designs should be further optimized for haulage requirements, blend scheduling, and backfill potential.
• Conduct limit equilibrium analysis for both static and pseudo-static cases using the feasibility pit design. The purpose of the analysis is to determine a Factor of Safety to quantify the risk of open pit wall failure in various areas of the project.
26.3 Waste Dump Facilities It is recommended that additional site specific geotechnical investigations of foundation materials in the West and Upper Çöpler waste dump footprints be initiated in the second quarter of 2014 in order to confirm material parameters included in the parametric study performed as part of the feasibility level stability evaluation and to support detailed engineering in the latter half of 2014.
26.4 Metallurgy and Mineral Processing The following are recommendations for Metallurgy and Mineral Processing identified during the FS engineering. These should be examined and resolved during the next phase of the project.
• Alacer should begin development of all aspects of the sulfide process feeding blending program including:
• Perform assaying on drill-hole samples for any parameters not in the data base but required for the blending program.
• Perform complete assays on material going in or currently in the sulfide stockpile per the list of blending parameters.
• Develop a plan to incorporate all blending parameters in the sulfide resource model.
• Develop plans for coordination of the mine and process personnel who will be in charge of the sulfide process feed blending program.
• Develop the basics and details for the blending program defining personnel, responsibilities, and methodologies.
• It is critical that assaying of carbonate be initiated and completed on drill hole samples supporting the resource model and that the resource model be modified to include carbonate data to support the sulfide plant feed blending program.
• The Manganese Diorite rock type was demonstrated to have some negative impacts on the metallurgical performance of the pressure oxidation system if present in the process feed at a proportion greater than 40% w/w. It is imperative that the Manganese Diorite be differentiated from the Main diorite in the sulfide resource model and be part of the sulfide plant feed blending program.
Çöpler Sulfide Expansion Project Feasibility Study
43-101 Technical Report
Page 26-4
• It is recommended that comminution variability testing be performed on an additional 50 to 100 drill hole interval samples to develop enough data to allow incorporation into the resource model to predict sulfide plant feed hardness over the life of the mine..
• It is recommended that a review of the plant materials of construction be conducted early in the next phase of the project to ensure that the proper materials have been selected for the respective applications and to optimize the materials of construction with the goal of capital cost savings without sacrificing the integrity of the plant or causing an increase in operating costs..
• Perform a study of tailings disposal optimizing slurry disposal and examine slurry disposal versus dry tailings to meet project closure and reclamation requirements.
• Review the copper precipitate process design to ensure features have been incorporated to ensure production of a concentrate with minimal arsenic and other impurity levels.
• Alacer should finalize a copper sales contract defining exact copper concentrate sales terms and shipping destination.
• Perform a scoping evaluation during second phase of variability testing comparing SO2/air process to an alternative cyanide detoxification process such as Caro’s acid.
• Review the design and optimize the design of the neutralization system (i.e. elimination of one of the two neutralization tanks) in the next phase of the project.
• Review and optimize the plant layout to take full advantage of fluid flow by gravity.
• Review the CIP plant and ADR plant design parameters in the next project phase to ensure adequate carbon adsorption, carbon handling equipment, and ADR plant capacities are provided to address any concerns with CIP operation at temperatures ranging from 55°C to 65°C.
26.5 Infrastructure The infrastructure design developed during the FS is adequate to support the project facility.
Discussion with Alacer of lessons learned from the construction of the heap leach facility and SART Plant should be planned during early basic engineering. This information will greatly benefit the infrastructure engineering.
These reviews may include the following:
• Scheduling construction time of year (winter versus summer) and to optimize transportation of heavy and large equipment to site and critical lifts during favorable weather.
• Review size and requirements of maintenance and warehouse facilities for the new facility.
• Eliminating a finish paint coat on structural steel.
• Perform a time and motion analysis to optimize the process and the equipment. In turn, the facility infrastructure can then be optimized.
Çöpler Sulfide Expansion Project Feasibility Study
43-101 Technical Report
Page 26-5
26.6 Tailings Storage Facility The TSF as planned for the Sulfide Project is feasible and can be constructed in accordance with the current mine plan and project schedule. The TSF provides for 36.7 Mt of tailings capacity in a fully lined tailings impoundment over an approximate 18-year mine life assuming an average ore feed to the mill of 5,000 tpd and average tailings delivery of 5,796 tpd at a slurry density of 37% by weight. The additional site specific geotechnical investigations required for the larger TSF footprint should be initiated in the second quarter of 2014 in order to confirm design assumptions included in the feasibility level design and to support detailed engineering in the latter half of 2014.
26.7 Marketing It is recommended that Alacer utilize the services of a broker, since the expected revenue is similar to that if it is marketed in-house. However, this decision should be re-examined closer to the time of start-up to determine if any of the market conditions have changed.
26.8 Environmental/Permitting At the current stage of the project, the E&SIA and related technical studies (hydrogeology, geochemistry, flora and fauna studies etc.) are currently underway or have been completed. The results of these studies will determine the potential impacts of the sulfides expansion project. Further conclusions and recommendations can only be made following the achievement of these results. Furthermore, the Turkish EIA permitting process is currently underway. Therefore, the opinions of the permitting agencies and the public are not fully known. As a result of the EIA permitting process, these opinions will be collected and included in the project design.
It is recommended that during the next stage of the Çöpler Sulfides Expansion Project, the environmental and social impacts of the project be reviewed utilizing the information provided in these studies.
26.9 Mine Closure and Sustainability Closure of the Çöpler mine will include decommissioning all facilities without an identified post-mining land use, grading of all fill slopes to 2.5H:1V, covering facilities with a reclamation cover and re-vegetating the surface of all disturbed areas. It is anticipated the earthwork and decommissioning work will take 4 years and cost US$32M. Treatment of waste rock seepage and pit lake water will be conducted on an ongoing basis and will cost an estimated US$4.8M. Process fluid management of the seepage from heaps and tails will be conducted in a zero-discharge fashion and will cost US$3.5M. Monitoring is estimated to cost US$2.5M. These items comprise the majority of the closure costs calculated for Çöpler.
SRK recommends that Alacer review the tailings design to see if it can be modified to provide drainage surface on the tailings storage facility surface after closure and prevent ponding of water where settlement of the surface will be occurring. Alternately, a feasibility study should be undertaken to evaluate closure design without positive drainage from the tailings surface.
A trade-off study should be undertaken to evaluate whether the application of geotextile on the tailing surface might allow a thinner waste rock cover.
Çöpler Sulfide Expansion Project Feasibility Study
43-101 Technical Report
Page 26-6
SRK also recommends that Alacer conduct studies for growth media material sourcing.
26.10 Capital Cost Estimate The capital cost estimate prepared for Alacer meets or exceeds the requirements for a Class 3 estimate and represented a high percentage of budgetary pricing and 10-15% of process facility engineering completed. At the completion of the Feasibility Study, the resultant accuracy range (+18%/-10%) of the estimate has been determined using a Monte Carlo risk analysis, estimator and project personnel judgment and industry standards. Costs for this project with current capacity were higher than the Pre-Feasibility Estimate due to capacity increases and design revisions based on laboratory data received.
The total estimated cost to design, procure, construct and start-up the facilities described in this section is $620.5M, including Owner’s Cost.
26.11 Operating Cost Estimate The following are recommendations pertaining to the operating costs identified during the FS engineering. They should be clarified and resolved as the project progresses.
• It is Jacobs’ recommendation that Alacer continue to investigate the possibility of discounted power. This will lower the overall cost per tonne significantly.
• It is Jacobs’ recommendation that additional LECO carbonate analysis be performed on the ore body and incorporated into the mine plan to validate the acid consumption rates.
26.12 Economic Analysis It was concluded that the Çöpler Sulfide Expansion Project is economically feasible and that the project should move forward with engineering and subsequent construction.
Çöpler Sulfide Expansion Project Feasibility Study
43-101 Technical Report
Page 27-1
27.0 REFERENCES Altman, K, Liskowich, M, Mukhopadhyay, D K, Shoemaker, S J, Çöpler Sulphide Expansion Project Prefeasibility Study, March 27 2011.
Altman, K, Bascombe, L, Benbow, R, Mach, L, Shoemaker, SJ, Çöpler Resource Update, Erzincan Province Turkey, March 30 2012.
Altman, K, Bair, D, Bascombe, L, Benbow, R, Mach, L, Swanson, B, Çöpler Resource Update, Erzincan Province Turkey, March 28 2013.
Anatolia (2009) Çöpler Project, East Central Turkey Preliminary Mine Reclamation & Closure Plan, 2009, Anatolia Minerals Development, Limited
Bloom, L., Analytical Services and QA/QC, for Society of Exploration Geologists, April 2002.Project Documents
Easton, C L, Pennstrom, W J, Malhotra, D, Moores, R C, Marek, J M, Çöpler Gold Project East Central Turkey Preliminary Assessment Sulphide Ore Processing, February 4, 2008
Golder (2013a), Çöpler Mine Sulfide Expansion Project, Flood Management Plan, May 2013 Golder Associates
Golder (2013b), Çöpler Mine Sulfide Expansion Project, Groundwater Modeling Report, September 2013 Golder Associates
Golder (2013c) Çöpler Sulfide Project Tailings Storage Facility Siting Study, December 17, 2013, Golder Associates
Golder (2014a), Çöpler Sulfide Project – Stability Evaluation of Planned Waste Dump Facilities, Technical Memorandum, February 28, 2014, Golder Associates
Golder (2014b), Geotechnical Report, Sulfide Plant Facilities – Updated Report Çöpler Sulfide Project, March 10, 2014, Golder Associates
Golder (2014c), Çöpler Mine – Pit Slope Design Review, April 2014, Golder Associates
Golder (2014d) Çöpler Sulfide Project – Tailings Storage Facility Analysis and Design, May 1, 2014, Golder Associates
Hacettepe University, Gazi University (Hacettepe and Gazi Universities, 2014 (Interim), İliç (Erzincan) Çöpler Complex Mine Capacity Increase Project – Report on Biological Diversity, 2014 (Interim)
Independent Mining Consultants, Inc., Çöpler Project Resource Estimate Technical Report, October 19, 2005
Jacobs (2012) Çöpler Sulfide Project Feasibility Study, Site Conditions, May 30, 2012, Jacobs
Jacobs (2014a), Çöpler Sulfide Expansion Project Definitive Feasibility Report, June 15, 2014, Jacobs
Jacobs (2014b), Crushing and Grinding Systems for Handling Clayey Ore Trade-Off Study, January 21, 2014, Jacobs
Marek, J M, Pennstrom, W J, Reynolds, T, Technical Report Çöpler Gold Project Feasibility Study, May 30, 2006 (Samuel Engineering, Inc.)
Çöpler Sulfide Expansion Project Feasibility Study
43-101 Technical Report
Page 27-2
Marek, J M, Moores, R C, Pennstrom, W J, Reynolds, T, Technical Report Çöpler Gold Project, March 2, 2007 as amended 30 April 2007 (Independent Mining Consultants, Inc.)
Marek, J M, Benbow, R D, Pennstrom, W J, Technical Report Çöpler Gold Project East Central Turkey, December 5, 2008 (Amended and Restated; supersedes 11.07.2008 version).
Samuel Engineering (2011) Çöpler Sulfide Expansion Project Prefeasibility Study, March 27, 2011, Samuel Engineering.
SRK (2008) Çöpler Complex (Manganese, Gold, Silver, Copper) Mining Project EIA Report, 2008, SRK Consulting.
SRK (2012a) Assessment of Çöpler Sulfide Tailings According to Waste Acceptance Criteria, August 17, 2012 (Memorandum) SRK Consulting
SRK (2012b), Çöpler Mine Sulfide Expansion Feasibility Study – Environment and Permitting, November 2012, SRK Consulting (Turkey)
SRK (2012c), Çöpler Gold Mine-Sulfide Project Waste Geochemical Assessment,, September 2012, SRK Consulting (Turkey)
Watts, Griffis and McQuat Limited, Update of the Geology and Mineral Resources of the Çöpler Prospect, May 1, 2003


![[Study] The Definitive Organic Click Through Rate Study](https://img.pdfslide.us/doc/110x75/58ad166f1a28ab50728b4925/study-the-definitive-organic-click-through-rate-study.jpg)