Embed Size (px)
Citation preview

This paper reviews the state of knowledge resulting from laboratory research into the phenomenological characterization of fatigue behavior. In particular, it considers the influence of various factors that affect the fatigue performance of asphalt mixes. The definition of laboratory service life and the values obtained depend on the method of testing; controlled stress loading appears to be applicable for materials used in thick asphalt construction, and controlled strain loading is more appropriate for thin layers. Fatigue performance can best be characterized by a strain € and life N. relation of the form N, = C(1/€)". The factors C and m depend on the composition and properties of the mix and are also affected by the testing method. Under controlled stress conditions, mixes having maximum stiffness will give longer lives; and, therefore, the choice of mix composition should be such that under compaction maximum tensile stiffness asso-ciated with minimum voids is obtained. Under controlled strain condition, longer lives are likely to be obtained from more flexible, less stiff materials. Ideally, general strain-life relations can be established for various mixes by laboratory testing and used for design purposes. Alternatively, use may be made of empirical relations relating fatigue performance to mix properties.
'
P. S. Pell University of Nottingham, England
The term "fatigue" implies a mode of distress in an asphalt con-crete pavement resulting from the repeated application of traffic-induced stresses. In particular, this symposium was concerned with fatigue fracture, and the purpose of this paper is to consider the influence of various factors that affect the fatigue performance of asphalt mixes. A considerable amount of laboratory research has been carried out and documented (1, 2) 3, 4, 5, 6) on the phenom-enological characterization of fatigue and enables certain overall conclusions to be drawn. As well as providing useful information for optimum mix design against fatigue cracking and a means of comparing the performance of different mixes, the current state of the art can be used to predict that cracking will occur after the application of a particular traffic volume.
However, a considerable amount of crack propagation will have to occur over a wide area before any serious deterioration of the pavement structure results from the possible penetration of water or from increase in stresses in the underlying layers or from both. Pavement performance under traffic depends not solely on the char-acteristics of the materials in the individual layers but rather on the interaction of the various layers, and that aspect of the problem is discussed in other papers (30,31).
Besides the phenomenological approach to the problem of fa-tigue of asphaltic concrete pavements with which this paper is con-cerned, a more recent development is the mechanistic approach based on fracture mechanics (7), and that is discussed in another paper (33). Although the primary object of this present paper is to emphasize the existing state of knowledge that can be applied, certain areas requiring further research in order to improve the accuracy of fatigue life predictions will be mentioned.
49

50
DEFINITIONS
Fatigue has been defined (2) as "the phenomenon of fracture under repeated or fluc-tuating stress having a maximum value generally less than the tensile strength of the material.'t However, in practice and in the laboratory, fatigue failure is often loosely considered to be the point at which the material or specimen is unable to continue to perform in a satisfactory manner. The failure or the end point of a fatigue test has been defined by investigators in many ways. It may be the point corresponding to com-plete fracture of the test specimen, the point at which a crack is first observed or de-tected, or the point at which the stiffness or some other property of the specimen has been reduced by a specific amount from its initial value. The choice is often arbitrary depending on the method of testing being used, and hence an intelligent interpretation of fatigue results requires that the point of failure be explicitly defined.
Service life N8 is the accumulated number of load applications necessary to cause failure in the test specimen. In general, the service life as defined here has often been called the fatigue life, but it is a function of the manner in which failure is defined. Fracture life N is the accumulated number of load applications necessary to completely fracture a specimen. When the failure point is complete fracture, then the service and fracture lives are identical.
The fatigue behavior of a specimen subjected to repeated loading depends primarily on the load, environmental, and specimen variables. Load condition refers to the par-ticular set of values that the appropriate load and environmental variables assume for a particular load application. Simple loading occurs when the load condition remains unchanged throughout the fatigue test. Compound loading results from the repeated application of loads in which the load condition changes during the fatigue test. In practice, asphalt pavements are subjected to a form of compound loading with a suc-cession of load pulses of varying sizes and durations and with varying time intervals between pulses depending on the details of the traffic. Changes, such as ambient tem-perature and moisture conditions, are also taking place in the environment. Few at-tempts have yet been made in the laboratory to study cumulative damage by compound loading, and most laboratory fatigue tests have been of the simple loading type with the load-time curve being sinusoidal, triangular, square, or some other regular wave form.
TYPE OF FATIGUE TEST
Generally, testing methods are either controlled stress mode when the loading is in the nature of an alternating stress of constant amplitude or controlled strain mode when the loading is in the form of an applied alternating strain or deflection of constant am-plitude (Fig. 1). In controlled stress loading, if the stiffness of the specimen reduces during the test, then the strain will gradually increase; in controlled strain, the re-sulting stress on the specimen will fall with decreasing stiffness. In many cases, the service life of the specimens greatly depends on which of the 2 modes of testing is used.
Because the method of testing influences the results of fatigue tests, the question arises as to which method is preferable. Monismith and Deacon (2) have proposed a more quantitative basis for differentiation between the 2 modes of loading by introduc-ing the mode factor, a parameter defined as
Mode factor = Al - IBI Al + IBI
(1)
where IAI and IBI are the percentage changes in stress and strain respectively for an arbitrary but fixed percentage reduction in stiffness. The mode factor has a value of -1 for controlled stress loading and +1 for controlled strain conditions. For inter-mediate modes, where both stress and strain are changing during the test, the mode factor lies between the limits of -1 and +1.
The applicability of types of fatigue tests to actual road conditions has been con-sidered in various types of pavement construction analysis using layered elastic theory to investigate the effect of variations in asphalt stiffness on the stresses and strains
51
occurring in the asphalt layer. Figure 2 (2) shows a typical example of a 3-layer struc-ture where E2 = 20,000 psi, E3 = 6,000 psi, and h1 + h2 = 26 in. As the thickness and stiffness of the asphalt layer increase, the mode factor decreases and a controlled stress condition is approached. It is, therefore, suggested that controlled stress test-ing conditions are appropriate for thicker asphalt layers, say, 6 in. or more, and controlled strain tests are suitable for thin asphalt layers of 2 in. or less, for under those conditions the strain is little affected by the mixture stiffness.
For the intermediate thicknesses, some form of testing between those 2 extreme modes would strictly be appropriate; but for an engineering design approach, con-trolled stress tests would seem sensible because they give a conservative estimate of fatigue life.
The method of performing simple loading fatigue tests is to test specimens in con-trolled stress loading at different stress levels (or in controlled strain loading at dif-ferent strain levels) and to determine the corresponding service life. A variety of testing equipment has been used; each type of apparatus and its associated specimen size and shape has certain advantages and disadvantages. To date, most results have been obtained from bending or flexure tests on rectangular specimens tested as simply supported beams (1, 5, 8, 9, 10), trape zoidal- shaped specimens tested as cantilevers (11, 12), or specimens having a circular cross section with varying diameter tested as rotating cantilevers (4,6,13). Cylindrical and rectangular specimens are increasingly being used both under direct uniaxial (tension-compression) loading (13, 14) and under triaxial states of stress (15). Plate specimens (16) and torsional specimens (17) have been used to obtain biaxial stress conditions, and the indirect tensile test has also recently been adapted for repetitive loading (18).
Most laboratory fatigue tests have been carried out under uniaxial stress conditions either in flexure or in direct loading, but in the pavement the material is subjected to complex, 3-dimensional stressing (13). In the case of bituminous-bound materials, it is not expected that the effect of confining stress and shear reversal will be as signifi-cant as with unbound materials; but nevertheless fatigue tests under more realistic stress conditions need to be carried out to confirm that expectation (12).
PRESENTATION OF FATIGUE TEST RESULTS
There is always considerable scatter of results in any fatigue testing of nominally identical specimens, and that is particularly so in the case of asphaltic mixtures be-cause of the inherent inhomogeneity of the material and the unavoidable variation in specimen preparation. That means that fatigue life must be considered in a statistical manner and strictly as only a distribution of individual values. It is usually assumed that there is a logarithmic normal distribution of fatigue lives at a particular loading condition, and a histogram (Fig. 3) constructed from the results of tests on 100 nom-inally identical specimens tested under the same loading conditions supports that as-suniption (4).
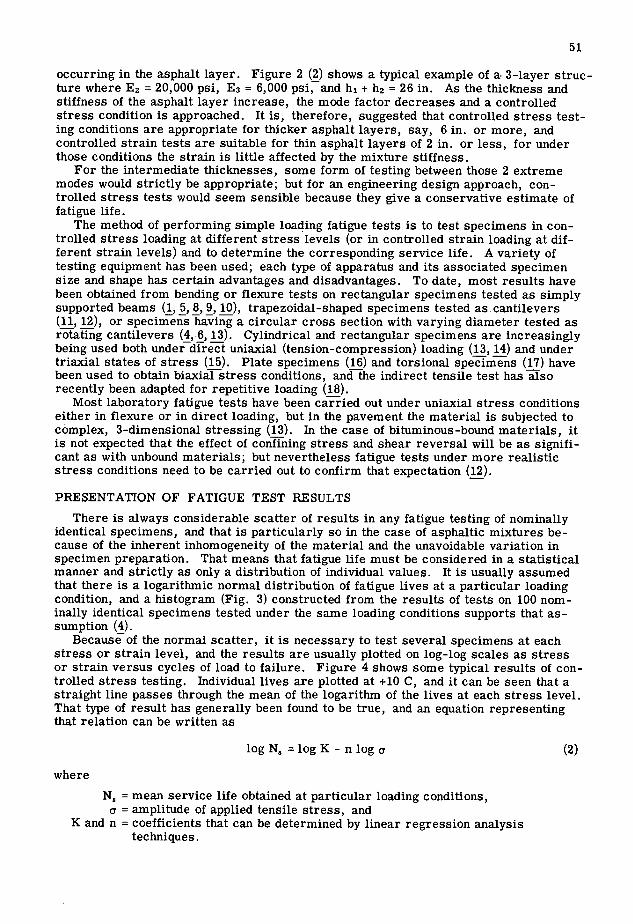
Because of the normal scatter, it is necessary to test several specimens at each stress or strain level, and the results are usually plotted on log-log scales as stress or strain versus cycles of load to failure. Figure 4 shows some typical results of con-trolled stress testing. Individual lives are plotted at +10 C, and it can be seen that a straight line passes through the mean of the logarithm of the lives at each stress level. That type of result has generally been found to be true, and an equation representing that relation can be written as
logN8 =logK-nloga (2)
where
N. = mean service life obtained at particular loading conditions, a = amplitude of applied tensile stress, and
K and n = coefficients that can be determined by linear regression analysis techniques.

0
0 0
52
Figure 1. Types of fatigue tests.
__________________________ sireisoidal loading
Ii Ii 11 Fi square wove loading
TYPICAL 1ODIfG CONFIGURATUN USED IN FATIGUE TESTING
NON5 Noel bad q,plsations N No. of appi
CONTROLLED-STRESS MODE MF-1
Thj No. of load apØcdb
_
ns NN. rNt lb.of load opØIcatcr N
Ns orNf
CONIRI1LED-STR4IN MODE MF1
uc *I:
!Ns INs .of loodpkCts N No.of load opotions N
INTERI4EOIATE MODE -1< MF< I
Figure 2. Variation of mode factor with surface thickness.
contrdledf strain
\ \_ N II___
E1 150.000 psi
1.4
1-6 - E1r75O,OIXlpsi
1 2.5O0L00 psi
ccntrolkd stress \
in 2 4 6 B 10
Sirface thickness inches

53
Equation 2 may be expressed as
N, =K() (3)
The exponent n defines the slope of the fatigue line; lower values of n denote a steeper line.
A similar type of relation but one in terms of applied tensile strain e is obtained from controlled strain tests.
There is no evidence of an endurance limit up to lives of 107 applications of load, but the slope of the fatigue line is such that a small change in stress level can result in a considerable change in life.
EFFECT OF STIFFNESS AND CRITERION OF FAILURE
Possibly the greatest difficulty in interpreting fatigue test results arises from the fact that they are influenced by the method of testing. That is well illustrated by the effect of stiffness on the service life of identical specimens tested in both controlled stress and controlled strain.
If specimens are tested in controlled stress, such as in a rotating bending type of machine producing a .sinusoidally varying bending stress of constant amplitude, then 4 different stiffness results, such as those shown in Figure 5a, are obtained. At a particular stiffness S, the mean fatigue lives can be represented by a straight line on a log-log plot of stress a against number of cycles of load N, to cause failure. Dif-ferent stiffnesses are represented by parallel lines showing that, with this type of test-ing, the fatigue life is highly dependent on stiffness; the stiffer the mix is, the longer the life is.
The stiffness, defined as the ratio of stress amplitude to strain amplitude, is de-pendent on the temperature and speed of loading. If the results of the fatigue tests under controlled stress are replotted in terms of strain E, as shown in Figure Sb, it has been found that for a wide temperature range all the results from different stiff-nesses coincide, indicating that strain is a major criterion of failure and that the effects of temperature and speed of loading can be accounted for by their effect on stiffness. There is some evidence that at higher temperatures, above about 25 C, longer lives are obtained that cannot be explained in this manner.
If identical specimens are tested in a controlled strain machine, which applies an alternating strain of constant amplitude, results such as those shown in Figure 5c are obtained. Although the lines at high stiffnesses, S1 and S2, say, coincide, those at lower stiffnesses show an effect of stiffness that is the reverse of that found from con-trolled stress tests.
The reason is that the mode of failure is different in the 2 types of test. In the con-trolled stress test, the formation of a crack results in an increase in actual stress at the tip of the crack due to the stress concentration effect, and that leads to rapid prop-agation and complete fracture of the specimen and termination of the test. In the con-stant strain test, on the other hand, cracking results in a decrease in stress and hence a slow rate of propagation. At low stiffnesses and, hence, low stresses, the measured fatigue life includes a considerable length of time necessary to propagate a crack or cracks sufficiently to reach an arbitrary state when the specimen is considered to have failed (service life).
If measurements of stiffness are taken during a controlled strain test, the stiffness reduces with increasing number of load applications at low stiffnesses, i.e., high tem-peratures; and that, no doubt, is partially due to formation of small cracks. At high stiffnesses, coincident with lines for S and S2 (Fig. 5c), there is negligible fall in stiff-ness during a. fatigue test.
In some types of controlled stress tests, there is little increase in deflection and hence strain during the test even at low stiffnesses, but other types of controlled stress tests show a decrease in stiffness. Therefore, when the results are plotted in terms of strain, it is usual to take the value of stiffness of the specimen at the start of the test and quote the initial strain.

54
Figure 3. Results of 100 fatigue tests under 1 loading condition.
18
normal cur I
2
c7n
- LOG. CYCLES TO FJWRE (LOG N5 )
Figure 4. Results of fatigue tests under controlled stress at various
temperatures.
' EiiI;II!!!I!!I!IuuIIIIIIIIIIIIIIIIuI 111111111-81!;!!!IIIIuIIIIIIIIII
.IIiiI!!IIIOIIIii!i!!!ll!!!IIIll!I 1
• IIhi!IUIIIh1IIIIIIUIIIIIIhI
iiiuiiiiii•iiuiiiauuiuiiii•i
Olin IIIIUIill!II]Iill!!IUIIIllhIII
• IIIIIIIllhIIIOIflhIIIIIII 11111111111 1O 1U 1W IU- Jul
Cycles to foilurc N 5
Figure 5. Effect of stiffness on fatigue life under different modes of loading.
(a)
of
CortmUed stress fatigue tests at
Sl &fferent stiff nesses
>S264 S4
s1 , etc.
Lg cycles N5 Log ov. Log N5
Controlled stress CotholIed strain fatigue tests (c) fatigue tests
(b) Log c v. Log N5 Log E v. Log N5
IS1>52>53>54 15SfSfS , 4 Si S2
Log cates Ns Log cycles Ns

55
Thus, it can be seen that the measurement of fatigue life is complicated by changes in stiffness that take place during a test and that are due to either the particular strain pattern or the propagation of small cracks or both. If the service life contains a lot of crack propagation time, then the simple criterion shown in Figure Sb, which applies essentially to crack initiation, no longer holds.
That criterion of fatigue crack initiation is one of applied tensile strain, and a gen-eral relation defining the fatigue life is as follows:
N8 = C (.:)0
(4)
where
N8 = number of applications of load to initiate a fatigue crack, = amplitude of applied tensile strain, and
C and m = factors depending on the composition and properties of the mix.
For many dense mixes, the slope factor m has a value of approximately 5 or 6; but certain mixes, particularly those containing softer grades of bitumen, give steeper lines even under controlled stress testing that includes very littie crack propagation time. Some typical results for different mixes are shown in Figure 6; the details of the composition of the mixes are given in Table 1.
The slope of the fatigue line appears to depend on the stiffness characteristics of the mix and the nature of the binder; mixes having high stiffnesses and linear behavior give a flatter line. That type of behavior is characteristic of dense surface-course mixes having a relatively high binder content of a harder bitumen. The leaner base-course mixes made with softer grades of binder show considerable nonlinearity, par-ticularly at higher stress levels, and those mixes have a steeper fatigue line.
Although the logarithmic strain-life relation is usually shown as a straight line, it is probably curvilinear, particularly at high strains where nonlinearity is apparent.
If the method or conditions of testing are such that considerable crack propagation takes place during the test, then the line representing the service lives of specimens will be steeper as shown in Figure7 because the rate of crack propagation depends on the stress level. That is likely to occur at higher temperatures (lower stiffnesses), particularly under controlled strain testing. However, a relation similar to Eq. 4 will still define the fatigue characteristics of the mix, but the values of factors C and m will be different.
EFFECT OF MIX VARIABLES
From the foregoing it will be realized that stiffness plays a predominant role in de-termining the fatigue behavior of bituminous mixes. It appears that maximum principal strain is a good criterion of crack initiation; and, therefore, in controlled stress tests, the stiffness will determine the strain level and hence the fatigue life. In controlled strain tests, which include crack propagation time in the measured life, stiffness again is important for it controls the stress level that determines the rate of crack propagation.
In general, increased stiffness results in longer lives at a given stress level in controlled stress testing and shorter lives in controlled strain testing at a given strain level.
It, therefore, follows that any mix variables that affect the stiffness are also going to affect the fatigue life of asphalt mixes. Those variables are aggregate type and grading, including filler, binder type, hardness (viscosity) and content, degree of mix compaction, and resulting air void content. The 2 factors that appear to be of primary importance are binder content and voids content.
Increasing voids reduces the fatigue life markedly (Fig. 8). The effect of increasing voids is twofold: reduced stiffness and increased stress concentrations die to the pres-ence of voids in the material. Therefore, the detrimental effect of voids is likely to be more apparent in controlled stress testing or controlled strain testing at low tempera-tures. If increasing the bitumen content reduces the voids, then the fatigue life will be

Figure 6. Strain-life fatigue results for various mixes from controlled stress testing.
_Ykaring course mixes -- Rasecourse mixes
For details of mixes see table I
1 - Mi: - - - . 0 - - -
Pers)
-S
-'S
105 FATIaE LEE - CYOES TO FAIWRE (Na)
Table 1. Typical mixes tested in controlled stress.
Coarse Fine Binder Aggregate' Aggregate Filler Mean (percent (percent (percent Percent Penetra- Voids Slope
Description of Mix by wt) by wt) by wt) by Wt tion (percent) C Factor
Mastic asphalt wearing 42 23' 20' 15 70/30 0 1.13 a 10" 5.5 course TLA/20
Rolled asphalt wearing 30 52.2' 8.9' 7.9 45 2.9 8.8 a 10 5.1 course, BS 594, gap graded
Asphaltic concrete wear- 42 46.8' 4.7' 6.5 70 3.6 2.2 5 10" 6.1 leg course, continuously graded
Rolled asphalt base course 65 29.3' - 5.7 45 4.0 6.7 5 10_12 4.2 BS 594, gap graded
Dense bitumen macadam 62 28.6' 4.7' 4.7 100 6.8 1.9 a 10" 3.8 base course, MOT spec., continuously graded
Dense bitumen macadam 62.3 28.7 4.7' 4.3 200 6.9 1.8 5 10" 4.0 base course, MOT spec., continuously graded
Dense tar macadam base 61.7 28.4 4.7' 5.2 B 54 7.5 2.7 5 10 3.0 course, MOT spec., con- tinuously graded
'Crushed rock. 'Limestone 'Sand.
U
z cc
7
Figure 7. Effect of crack propagation on the slope of Figure 8. Effect of void content on fatigue life in the strain-life fatigue relation. controlled stress testing.
11
9
Fatigusline for scimens 1 8 irdu ding crockVQ
gagotion
m<m atinsofl 2 1
sociated with crack .0 Fatigue linehr propagation. 5, 5
specimens edon crack ' nitiotiori.
' 2
10
___•Iik_ _iiiiiii ___•uiii•iiiuii ___•iI]IIIUIU!iIiI ___•iUhiIIIUilli ___•iiiii:iiuuuo
lIilhIIiIIIII uunuuiiunii
roU Cycles to failure N5 (logsmle) 1
Cycles to failure

57
increased; but if the mix already has negligible voids, then further binder will reduce the stiffness and result in increased strain and hence reduced lives under controlled stress testing (Fig. 9).
The general effect on the strain-life relation of altering the binder and filler con-tent of a particular mix is shown schematically in Figure 10. For a lean mix, in-creasing the binder and filler will result in a stiffer material and hence smaller strains and longer life. However, if too much binder is added, the stiffness is reduced and hence an optimum fatigue life exists.
Although other mix variables such as aggregate type and grading do affect the fa-tigue performance of asphaltic mixes, they can be largely accounted for by their effect on the 3 main factors: stiffness, binder content, and voids content. Figure 11 shows the results of 13 similar gap-graded, rolled-asphalt, base-course mixes made with different aggregates and binders as given in Table 2. The plotted points give the mean lives obtained at different stress levels and represent more than 400 individual fatigue tests. The general conclusion is that for mixes with similar binder contents aggregate type has. little effect on the strain-life relation.
Figure 12 shows the strain-life lines for some continuously graded asphaltic con-crete mixes made with different aggregates and binders. The important effect of binder content and void content is evident. Similar overall conclusions on the effect of mix factors on fatigue life have been presented by Epps and Monismith (5). There is some evidence that asphalt type does affect the strain-life relation; harder grades give slightly improved performance under controlled stress conditions. The importance of asphalt viscosity on controlled strain fatigue results has been shown by Santucci and Schmidt (!)•
In conclusion, it may be stated that for good fatigue performance for thick asphalt construction a mix of maximum stiffness should be the objective and the quantities of filler and binder should be such that a condition of maximum tensile stiffness associated with minimum voids is produced.
EFFECT OF REST PERIODS
The fatigue characteristics discussed above have been obtained from tests carried out under simple loading conditions that mainly apply continuous cycles of loading of particular magnitudes. In practice, the material is subjected to a succession of load pulses of varying sizes and at varying time intervals between pulses depending on the details of the traffic. The question, therefore, arises as to the possible beneficial effect of periods of rest during a fatigue test.
Some workers (4, 17) have reported crack-initiation life did not increase in as-phaltic mixes as a result of periods of rest that were at different temperatures and injected after varying portions of the expected life but did significantly increase in specimens made from bitumen alone under similar testing conditions. Bazin and Saunier (11), on the other hand, report that asphaltic concrete made with a very soft binder (200-penetration bitumen) had increased lives because of healing following rest periods under compressive stress.
More recent work reported by Ralthby and Sterling (14,20) and by Van Dijk et al. (12) show considerable beneficial effects of strain recovery if periods of rest are injected between each load pulse. Those findings mean that laboratory tests using continuous cycling load pulses may well underestimate the fatigue life to cause initiation of cracks in practice.
CUMULATWE DAMAGE
In practice, asphalt pavements are subjected to a form of compound loading, and changes take place in the loading conditions during the life. In a recent review of some general cumulative damage theories, O'Neill (21) concludes that none of the hypotheses considered shows a clear general superiority to the rule of linear summation of cycle ratios. When satisfactory, constant-amplitude, simple load test data can be provided, the application of the linear rule, generally referred to as Miner's rule, is extremely simple.

. hcreostng birder and filler contsntsofo mix.
V5 18%
V0 = 16% VB V0 12%
V5 10%
Cydes to failure ( tog so]IQ)
27, 0 a >'
58
Figure 9. Effect of binder content on fatigue life in
Figure 10. Effect of increasing binder and filler controlled stress testing of continuously graded asphaltic
contents on fatigue life (strain criteria). mix using 200-penetration binder.
Cydes to failure N5
Figure 11. Effect of mix variables on fatigue performance of rolled asphalt.
vo+ • RDR IDENI1FICA11 ON OF POIN1S
A&_1 SEE TABLE 2
A
U 0•
10 4 ic 106 107
FATIGUE LIFE - CYCLES TO FAIWRE
Table 2. Rolled asphalt base-course mixes.
Coarse Aggregate
Type Percent by Wt
Fine Aggregate
Type Percent by Wt
Filer (percent by wt)
Binder
Percent by Wt
Penetra- tion
Mean Voids (percent)
Symbol on Figure 11
Crushed rock 60 Sand 34 0 6 45 5.0 Crushed rock 60 Crushed rock 34 0 6 45 5.6 0
Crushed rock 60 Sand 34 0 6 35 4.2 a Crushed rock 65 Sand 29.3 0 5.7 45 4.0 + Crushed rock 60 Sand 34 0 6 100 4.8 o Quartz gravel 60 Sand 34 0 6 45 5.3 Quartz gravel 60 Crushed rock 34 0 6 45 6.0 a Quartz gravel 65 Sand 27.4 -. 5.6 45 3.5 + Flint gravel 60 Sand 34 0 6 45 4.8 £ Flint gravel 60 Crushed rock 34 0 6 45 6.9 A
Slag 60 Sand 33.7 0 6.3 45 5.0 Slag 60 Crushed rock 33.7 0 6.3 45 5.6 Slag 55 Sand 38.2 0 6.8 45 5.4 x
1O-w -J
2 percent cement

59
Miner's rule for evaluating cumulative damage states that the condition at failure is given by
(5)
where
n, = number of cycles of stress o applied to the test specimen, and N = number of cycles to failure at constant stress amplitude o from simple loading;
If N is the predicted fatigue life under variable amplitude conditions and f1, f2, ... f, are the relative proportions at each of the stress levels for which the fatigue lives are Ni., N2, • .. N, respectively, then by Miner's rule,
N= - = - (6) f1 fz f r
1=1
The application of this rule to the fatigue life of asphaltic mixes under compound loading conditions was considered by Monismith et al. (22), who suggested strain rather than stress to be the appropriate criterion. Although widely used in such design meth-ods as employ load equivalency concepts, no experimantal justification of its use was available until 1965 when Deacon (23) published the results of an investigation into the behavior of asphaltic concrete under compound loading conditions. He concluded that the linear summation of cycle ratios governs the fatigue behavior of bituminous mix-tures that are subjected to multiple strains of variable magnitude. That conclusion is supported by the results of a recent experimental investigation at Nottingham University (24). Variations in the level of strain during the course of a test were achieved either by changing the temperature of the specimen or altering the stress level.
In the application of Miner's rule, no allowance is made for intervals of "no-load" or rest periods. It may be assumed that the effect of such intervals will be beneficial or at worst of no consequence. If the effect is beneficial, then the rule, as it stands, is conservative for design purposes.
PREDICTION OF FATIGUE CHARACTERISTICS
To establish the fatigue characteristics of a particular asphaltic mix necessitates long and somewhat involved testing techniques using specially designed and expensive equipment. It would clearly be extremely useful if fatigue performance could be re-lated to a test using more standard equipment, and the approach of Epps and Moni-smith (25) to try and correlate fatigue with a simple, tensile test seems valuable.
To date, there is littie convincing evidence that a simple nonrepetitive, loading test will be able to predict fatigue performance over the wide range of conditions and ma-terials necessary, particularly in view of the difficulty of defining service life. How-ever, a simple test may possibly be used to investigate stiffness characteristics for a number, of mix variables, and further research in this direction is warranted.
As more and more fatigue tests are carried out by various research workers in dif-ferent parts of the world, the fund of results that may be used for design purposes grows. But unfortunately, different test methods and criteria of failure make it ex-tremely difficult to correlate that fund of information in a quantitative manner.
The most promising approach at present appears to be for each agency to produce general laboratory relations for the more common mixes that are used in its location and correlate those with pavement performance in its environment. For example, Epps and Monismith (5) have suggested that the fatigue characteristics C and m in the basic strain-life relation shown in Eq. 4 should be 6.28 x and 3.01 respectively for dense-graded aggregate mixes in California. These values give the expression

60
I '3.01 N = 6.28 x 10⁷(!
(7) \E)
Similarly, values of the characteristics C amd m obtained by Pell and Brown (13) and given in Table 1 are appropriate for some British mixes tested under particular conditions.
A recent development by several research workers is the production of empirical relations between mix-design variables and fatigue properties of asphalt mixes. That involves the identification of the most important parameters and establishing the in-fluence of these on the fatigue relationship.
Kirk (26) states that the primary parameter is the stiffness of the binder and that the fatigue life under controlled stress flexure at a particular stiffness depends on the strain per binder volume. A factor is then applied that indicates improved performance with maximum size of aggregate, and another correction factor is applied that reflects the effect of binder and voids content.
Verstraeten (27) has produced a general expression based on controlled stress bend-ing tests on 34 different mixes:
C(N) = V6
x C x v8 + v. x N °22 (8)
where
c(N) = initial strain to produce failure after N cycles; = coefficient depending on the asphaltene content in the bitumen;
C = coefficient that correlated with VA /(VB + Vu); VA = volume of aggregate, percent; V6 = volume of bitumen, percent; and V = volume of voids, percent.
Equation 8 implies that the characteristic m, which defines the slope of the strain-life line, has a constant value of 4.5 for all mixes. Verstraeten applied his expression to selected results obtained by Pell and Taylor (4) for 22 further mixes and shows good agreement in all but a few cases.
It is doubtful whether in general a relation developed from the data of one researcher can be accurately applied to that of another. This is mainly because of the differences in apparatus and testing techniques, but an important fact that emerges from all fatigue investigations is that basically the general qualitative conclusions are similar.
The fatigue performance of a mix is generally expressed by the strain-life relation, and many workers have shown that over the practical range of fatigue life and tensile strain that relation is linear when plotted on a log-log basis and can be expressed as
log N = log C - m log c (9)
Therefore, factors m and C characterize the fatigue performance of a particular mix. At Nottingham University, when 1 particular type of controlled stress testing was used, values of m and C were obtained for a wide variety of mixes having a com-paratively large range of fatigue performances. It was found that there is a linear relation between m and log C (Fig. 13), which may be expressed in the form
m = A log C + B
(10)
That general relation only becomes apparent when mixes having a wide range of fatigue performances are considered and is probably not revealed by small changes in mix variables on a particular type of mix because of the normal scatter. Values of m and C obtained by other investigators show similar trends.
The relation between m and C indicates that the log strain-log life lines tend to radiate from a common intersection point, and, if either factor can be related to mix properties, then a simple method of fatigue performance prediction would result.

61
Multiple regression analyses on the mix variables involved showed that the most significant factors were binder viscosity, binder content, and void content. However, because the basic strain-life relations obtained from the controlled stress tests were found to be independent of temperature, an equiviscous measure, such as Ring and Ball temperature, was chosen to characterize the binder viscosity. Dobson (28) states that the temperature dependence of the viscoelastic properties of a bitumen may be de-scribed by one parameter, which Brodnyan (29) suggests is similar to the softening point.
Binder content and void content are, of course, closely related, and aggregate grading and state of compaction affect that relationship, so binder content by volume V8 and void content V, were combined in a single factor V8 /(V8 + Vu), i.e., ratio of binder volume to voids in the dry compacted aggregate.
Service life at a strain of 10 was used as a measure of fatigue performance, i.e., N,(e = iO- ), in a simple regression analysis that was performed on the results of 54 mixes and that gave the following relation:
log N(c = iø) = -16.34 + 6.03 lag( x 100'+ , )
+ 5.99 log(T 88)
the multiple correlation coefficient was 0.953, and the standard error of the estimate was 0.274. Values of measured fatigue life plotted against predicted values using Eq. 11 are shown in Figure 14. The service life at a strain of 10 was chosen for that analysis because in view of the inevitable scatter the results were considered more accurate at that strain level. However, either of the fatigue characteristic factors m or C could be related directly to the mix properties parameter by a similar approach, and further work is proceeding along those lines at the present time. In that case, the mix properties parameter consists of easily obtainable factors, namely, percentage volumes of binder and voids in the mix and the Ring and Ball temperature of the binder.
SUMMARY AND CONCLUSIONS
The definition of laboratory fatigue service life depends on the method of testing; therefore, it is not possible to produce unique relations characterizing fatigue per-formance.
Service life of specimens greatly depends on the mode of testing. Controlled stress loading appears to be applicable for materials used in thick asphalt construction, i.e., 6 in. or more, but controlled strain loading is more appropriate for thin asphalt layers, i.e., approximately 2 in. or less. Results from controlled stress mode of loading will generally give shorter lives and, hence, are conservative.
Whichever method of testing is used, the fatigue performance can best be char-acterized by a strain-life relation of the form
N5 = C(:
where N5 is the number of applications of tensile strain E to cause failure with the particular method of testing used. Factors C and m depend on the composition and properties of the mix and will also be affected by the testing method.
Mixes having maximum stiffness characteristics will give longer lives under controlled stress conditions. Therefore, for thick asphalt construction the choice of mix composition, namely, aggregate type and grading, filler content, and binder type and content, should be such that under compaction a mix of maximum tensile stiffness associated with minimum voids is obtained.
For thin asphalt construction maximum lives are likely to be obtained from more flexible, less stiff materials. Thus, mixes having high binder contents of softer bitu-mens should be used.

uutu•iii MMMMMORIMMMMM MMMMMMEROMMM uusiuuuuu• MMMMMMMMOMME MMMMMMMMMMMM uuuiii•uumu
Figure 13. Relation between mix
6.(
characteristic factors C and M.
5.
4
m
3
2
/ 0
0
IIIITII 0
4 GAP GRNO WEARING COURSE IULEO V
ASPHALTS —04TiM.OJGY GRADED ODGE Bm)484 NMCAQAM 6- - -n----
/ cOTNJOI.SLY GRADEO cENSE ThRMACAD D
4 5 b Log predicted life at £ r 104
Figure 14. Measured versus predicted 7
fatigue life.
3 3
6
I
w 5
0
Figure 12. Fatigue lines for continuously graded dense asphalt mixes.
2'
10-s 10
ATI(I LIFF - CYflFS TO FALURE
-14 -12 -10 -8 -6 -4 log C
63
A simple standard test probably using a single application of tensile load could usefully be developed to investigate, in a particular situation, the available mix com-positions to give optimum stiffness characteristics.
General relations that have the form shown above in paragraph 3 and different values of mix characteristics C and m should be established by various agencies using their particular method of testing. Those relations can then be correlated with per-formance under the appropriate conditions of environment and traffic for design purposes.
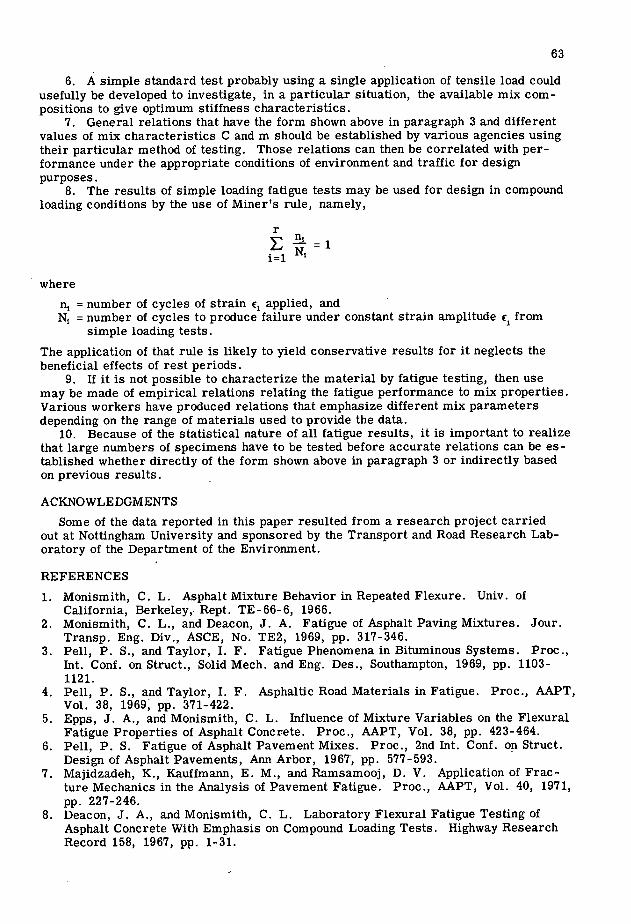
The results of simple loading fatigue tests may be used for design in compound loading conditions by the use of Miner's rule, namely,
where
n1 = number of cycles of strain e applied, and N1 = number of cycles to produce failure under constant strain amplitude ç from
simple loading tests.
The application of that rule is likely to yield conservative results for it neglects the beneficial effects of rest periods.
If it is not possible to characterize the material by fatigue testing, then use may be made of empirical relations relating the fatigue performance to mix properties. Various workers have produced relations that emphasize different mix parameters depending on the range of materials used to provide the data.
Because of the statistical nature of all fatigue results, it is important to realize that large numbers of specimens have to be tested before accurate relations can be es-tablished whether directly of the form shown above in paragraph 3 or indirectly based on previous results. -
ACKNOWLE DGMENTS
Some of the data reported in this paper resulted from a research project carried out at Nottingham University and sponsored by the Transport and Road Research Lab-oratory of the Department of the Environment.
REFERENCES
Monismith, C. L. Asphalt Mixture Behavior in Repeated Flexure. Univ. of California, Berkeley, Rept. TE-66-6, 1966. Monismith, C. L., and Deacon, J. A. Fatigue of Asphalt Paving Mixtures. Jour. Transp. Eng. Div., ASCE, No. TE2, 1969, pp. 317-346. Pell, P. 5., and Taylor, I. F. Fatigue Phenomena in Bituminous Systems. Proc., Tnt. Conf. on Struct., Solid Mech. and Eng. Des., Southampton, 1969, pp. 1103-1121. Pell, P. S., and Taylor, I. F. Asphaltic Road Materials in Fatigue. Proc., AAPT, Vol. 38, 1969, pp. 371-422. Epps, J. A., and Monismith, C. L. Influence of Mixture Variables on the Flexural Fatigue Properties of Asphalt Concrete. Proc., AAPT, Vol. 38, pp. 423-464. Pell, P. S. Fatigue of Asphalt Pavement Mixes. Proc., 2nd Tnt. Conf. on Struct. Design of Asphalt Pavements, Ann Arbor, 1967, pp. 577-593. Majidzadeh, K., Kauffmann, E. M., and Ramsamooj, D. V. Application of Frac-ture Mechanics in the Analysis of Pavement Fatigue. Proc., AAPT, Vol. 40, 1971, pp. 227-246. Deacon, J. A., and Monismith, C. L. Laboratory Flexural Fatigue Testing of Asphalt Concrete With Emphasis on Compound Loading Tests. Highway Research Record 158, 1967, pp. 1-31.

64
Kallas, B. F., and Puzinauskas, V. P. Flexural Fatigue Tests on Asphalt Paving Mixtures. ASTM Symp. on Fatigue of Compacted Bitumin. Aggregate Mixes, 1971. Kirk, J. M. Results of Fatigue Tests on Different Types of Bituminous Mixes. Proc., 2nd Tnt. Conf. on Struct. Design of Asphalt Pavements, Ann Arbor, 1967, pp. 571-575. Bazin, P., and Saunier, J. Deformability, Fatigue, and Healing Properties of Asphalt Mixes. Proc., 2nd Tnt. Conf. on Struct. Design of Asphalt Pavements, Ann Arbor, 1967, pp. 553-569. Van Dijk, W., Moreaud, H., Quedeville, A., and Uge, P. The Fatigue of Bitumen and Bituminous Mixes. Proc., 3rd Tnt. Conf. on Struct. Design of Asphalt Pave-mants, London, 1972, pp. 354-366. Pell, P. S., and Brown, S. F. The Characteristics of Materials for the Design of Flexible Pavement Structures. Proc., 3rd Tnt. Conf. on Struct. Design of Asphalt Pavements., London, 1972, pp. 326-342. Raithby, K. D., and Sterling, A. B. The Effect of Rest Periods on the Fatigue Performance of a Hot-Rolled Asphalt Under Reversed Axial Loading. Proc., AAPT, Vol. 39, 1970, pp. 134-147. Dehlen, G. L. The Effect of Nonlinear Material on the Behavior of Pavements Subjected to Traffic Loads. Univ. of California, Berkeley, PhD thesis, 1969. Jiminez, R. A., and Gallaway, B. H. Behavior of Asphaltic Concrete Diaphragms to Repetitive Loadings. Proc., Tnt. Conf. on Struct. Design of Asphalt Pavements, Ann Arbor, 1962, pp. 339-344. Pell, P. S. Fatigue Characteristics of Bitumen and Bituminous Mixes. Proc., Tnt. Conf. on Struct. Design of Asphalt Pavements, Ann Arbor, 1962, pp. 310-323. Moore, R. K., and Kennedy, T. W. Tensile Behavior of Asphalt-Treated Ma-terials Under Repetitive Loading. Proc., 3rd Tnt. Conf. on Struct. Design of Asphalt Pavements, London, 1972, pp. 263-276. Santucci, L. E., and Schmidt, R. J. Effect of Asphalt Properties on the Fatigue Resistance of Asphalt Paving Mixtures. Proc., AAPT, Vol. 38, 1969, pp. 65-94. Raithby, K. D., and Sterling, A. B. Some Effects of Loading History on Fatigue Performance of Rolled Asphalt. Gt. Brit. Transp. and Road Res. Lab., Crow-thorne, Berkshire, Rept. LR496, 1972. O'Neill, M. J. A Review of Some Cumulative Damage Theories. Australian Def. Sci. Serv. Aeronaut. Res. Lab., Struct. and Mater. Rept. 326, June 1970. Monismith, C. L., Secor, K. E., and Blackmer, E. W. Asphalt Mixture Be-havior in Repeated Flexure. Proc., AAPT, Vol. 30, 1961, pp. 188-222. Deacon, J. A. Fatigue of Asphalt Concrete. Univ. of California, D Eng disser-tation, 1965. McElvaney, J. Fatigue of a Bituminous Mixture Under Compound Loading. Univ. of Nottingham, PhD thesis, 1972. Epps, J. A., and Monismith, C. L. Influence of Mixture Variables on the Direct Tensile Properties of Asphalt Concrete. Proc., AAPT, Vol. 39, 1970, pp. 207-236. Kirk, J. M. Relations Between Mix Design and Fatigue Properties of Asphaltic Concrete. Proc., 3rd Tnt. Conf. on Struct. Design of Asphalt Pavements, London, 1972, pp. 241-247. Verstraeten, J. Moduli and Critical Strains in Repeated Bending of Bituminous Mixes: Application to Pavement Design. Proc., 3rd Tnt. Conf. on Struct. Design of Asphalt Pavements, London, 1972, pp. 729-738. Dobson, G. R. The Dynamic Mechanical Properties of Bitumen. Proc., AAPT, Vol. 38, 1969, pp. 123-135. Brodnyan, J. G., Gaskins, F. H., Philippoff, W., and Thelen, E. Trans., Soc. Rheology, Vol. 4, 1960, p. 279. Deacon, J. A. Fatigue Life Prediction. Paper in this Special Report. Finn, F. N. Relation Between Cracking and Performance. Paper in this Special Report. Majidzadeh, K., and Ramsamooj, D. V. Mechanistic Approach to the Solution of Cracking in Pavements. Paper in this Special Report.