Embed Size (px)
Citation preview
Definitions of Social Isolation:
A Pilot Study Using CLSA
Verena Menec, PhD and Nancy Newall, PhD
And:
Oksana Harasemiw, MSc
Corey Mackenzie, PhD
Shahin Shooshtari, PhD
Defining social isolation
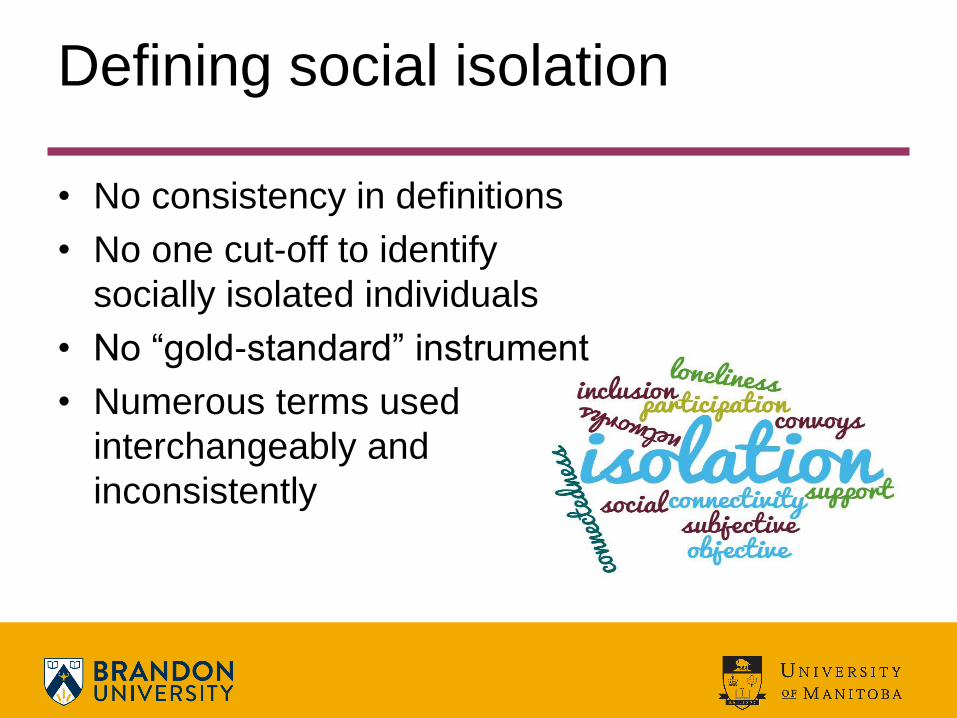
Defining social isolation
• No consistency in definitions
• No one cut-off to identify
socially isolated individuals
• No “gold-standard” instrument
• Numerous terms used
interchangeably and
inconsistently
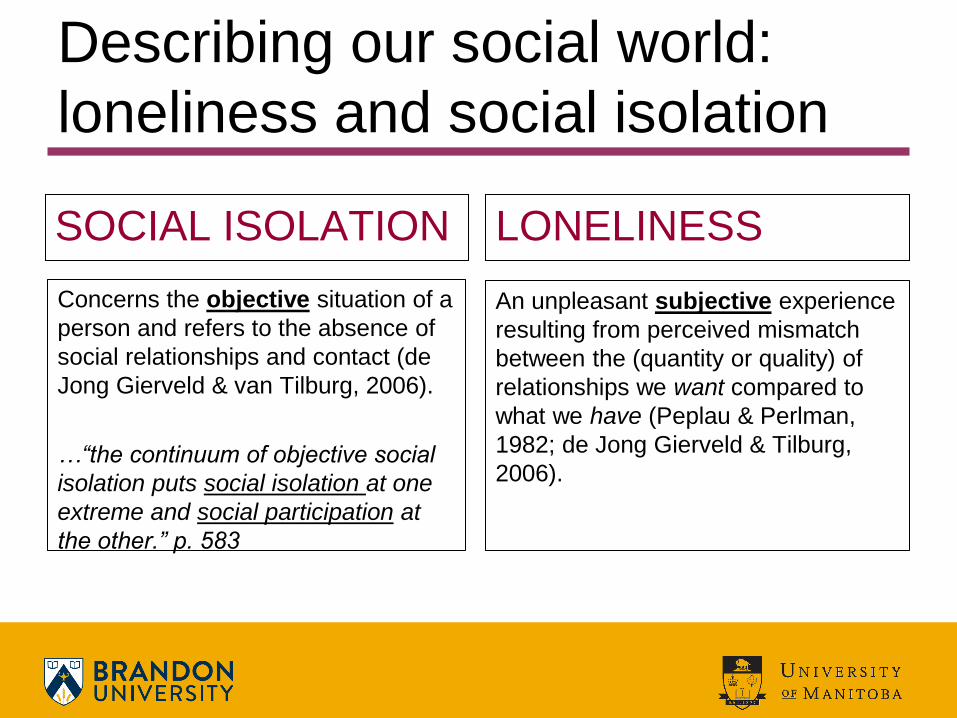
Describing our social world:
loneliness and social isolation
SOCIAL ISOLATION
Concerns the objective situation of a
person and refers to the absence of
social relationships and contact (de
Jong Gierveld & van Tilburg, 2006).
…“the continuum of objective social
isolation puts social isolation at one
extreme and social participation at
the other.” p. 583
LONELINESS
An unpleasant subjective experience
resulting from perceived mismatch
between the (quantity or quality) of
relationships we want compared to
what we have (Peplau & Perlman,
1982; de Jong Gierveld & Tilburg,
2006).
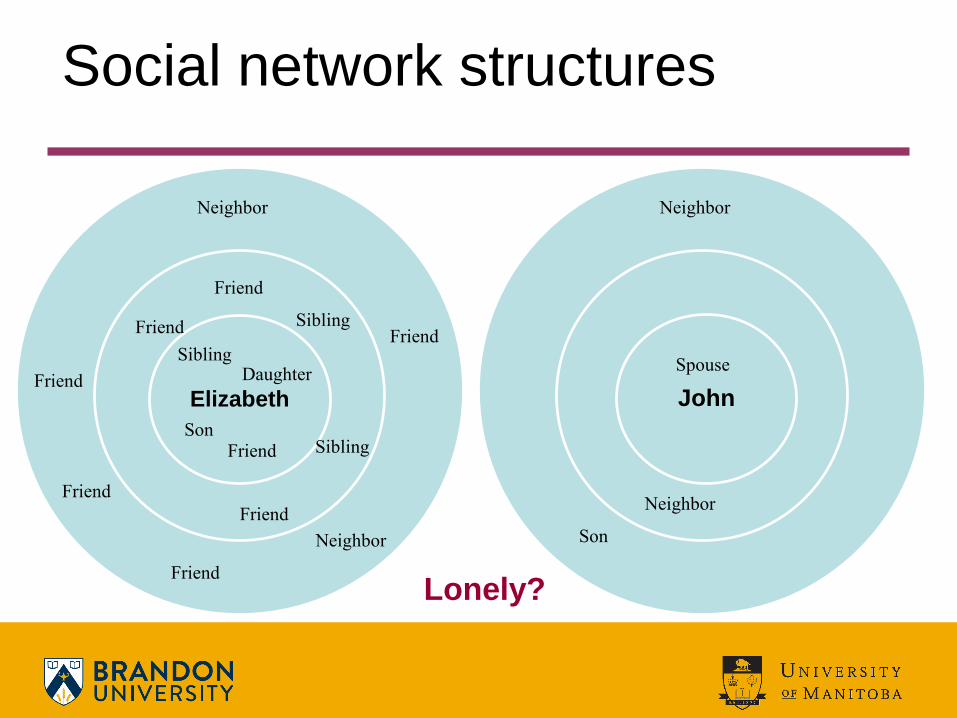
Elizabeth Daughter
Friend Son
Sibling
Friend
Sibling
Sibling
Friend
Friend
Neighbor
Friend
Friend
Neighbor
Friend
John
Spouse
Son
Neighbor
Neighbor
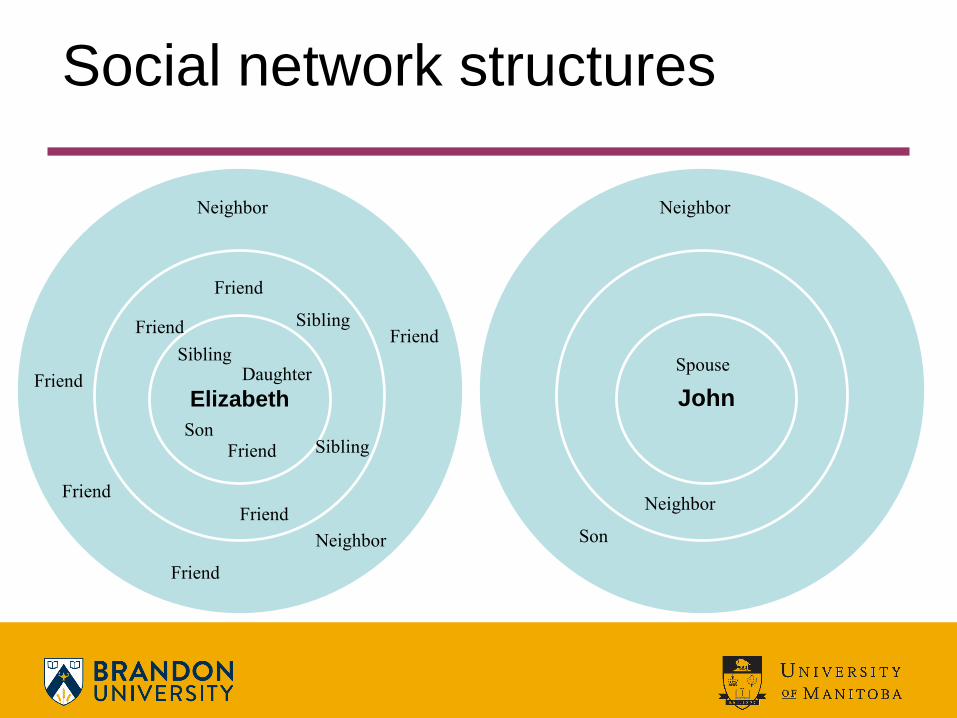
Social network structures
Friend
Lonely?
This means a person could have lots of
relationships and be lonely.
This also means a person could have
few relationships and NOT be lonely.
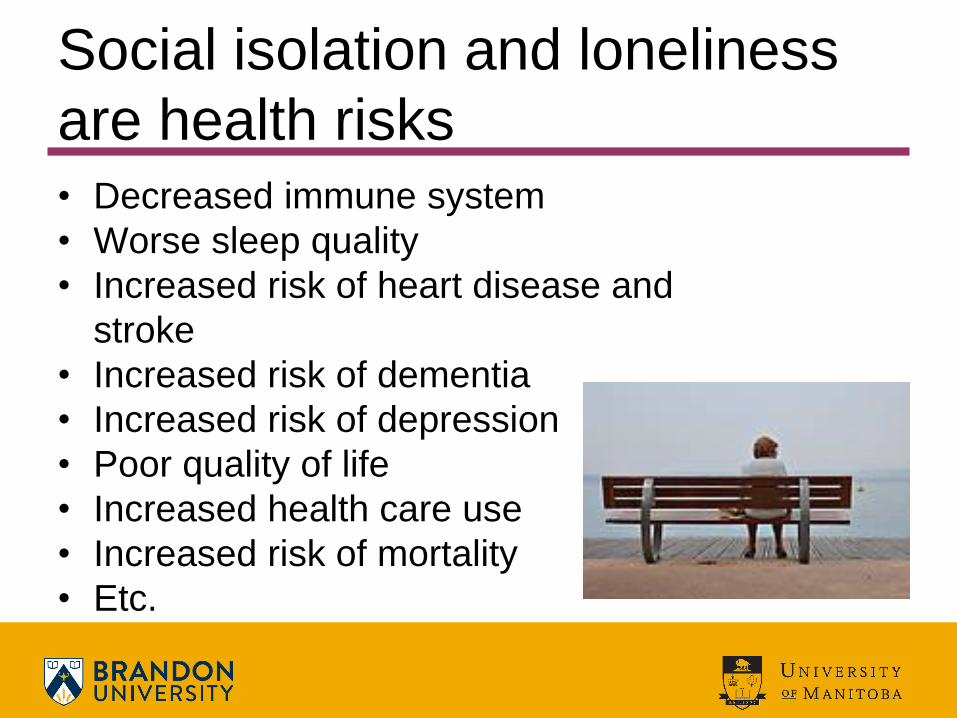
Social isolation and loneliness
are health risks • Decreased immune system
• Worse sleep quality
• Increased risk of heart disease and
stroke
• Increased risk of dementia
• Increased risk of depression
• Poor quality of life
• Increased health care use
• Increased risk of mortality
• Etc.
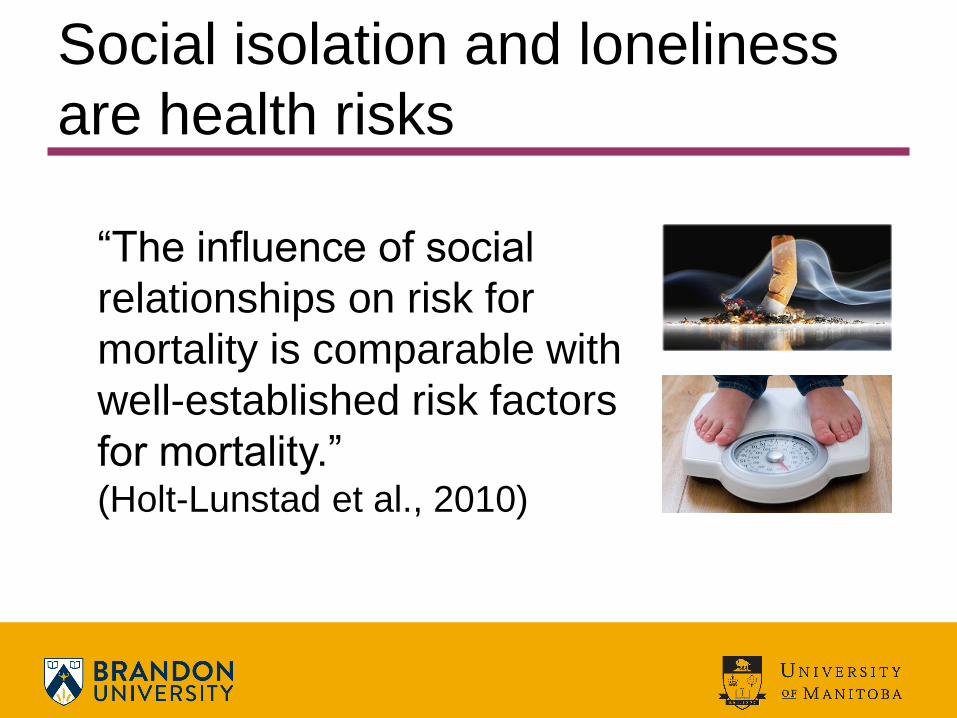
Social isolation and loneliness
are health risks
“The influence of social
relationships on risk for
mortality is comparable with
well-established risk factors
for mortality.” (Holt-Lunstad et al., 2010)
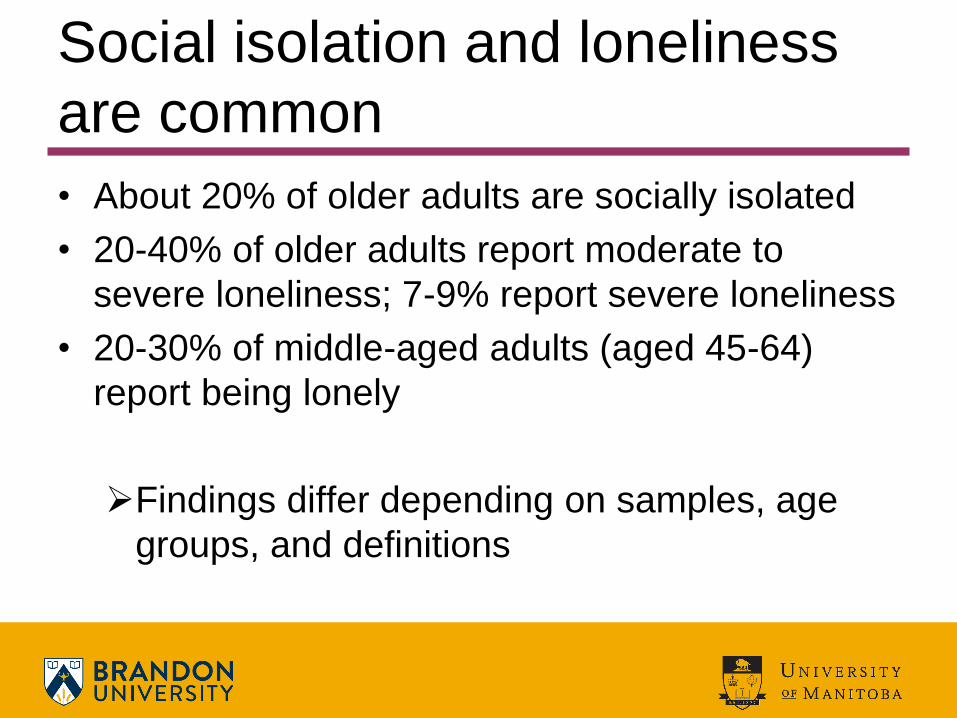
Social isolation and loneliness
are common
• About 20% of older adults are socially isolated
• 20-40% of older adults report moderate to
severe loneliness; 7-9% report severe loneliness
• 20-30% of middle-aged adults (aged 45-64)
report being lonely
Findings differ depending on samples, age
groups, and definitions
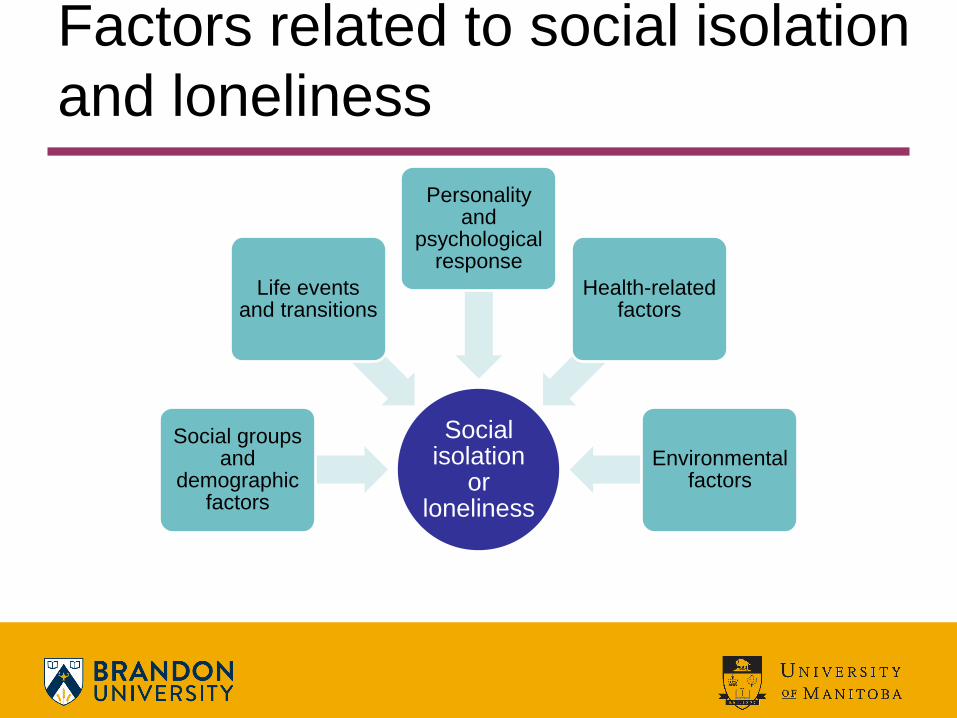
Factors related to social isolation
and loneliness
Social isolation
or loneliness
Social groups and
demographic factors
Life events and transitions
Personality and
psychological response
Health-related factors
Environmental factors
At this point we know more about what
puts people at risk of social isolation or
loneliness than we know about what
reduces social isolation or allows
people to overcome loneliness.
The problem
• How do we identify socially isolated (or
lonely) people, the “hidden citizens”?
• How do we target interventions at people
at risk of, or who are already experiencing,
social isolation or loneliness?
• What interventions work best for which
groups of people?

Defining social isolation
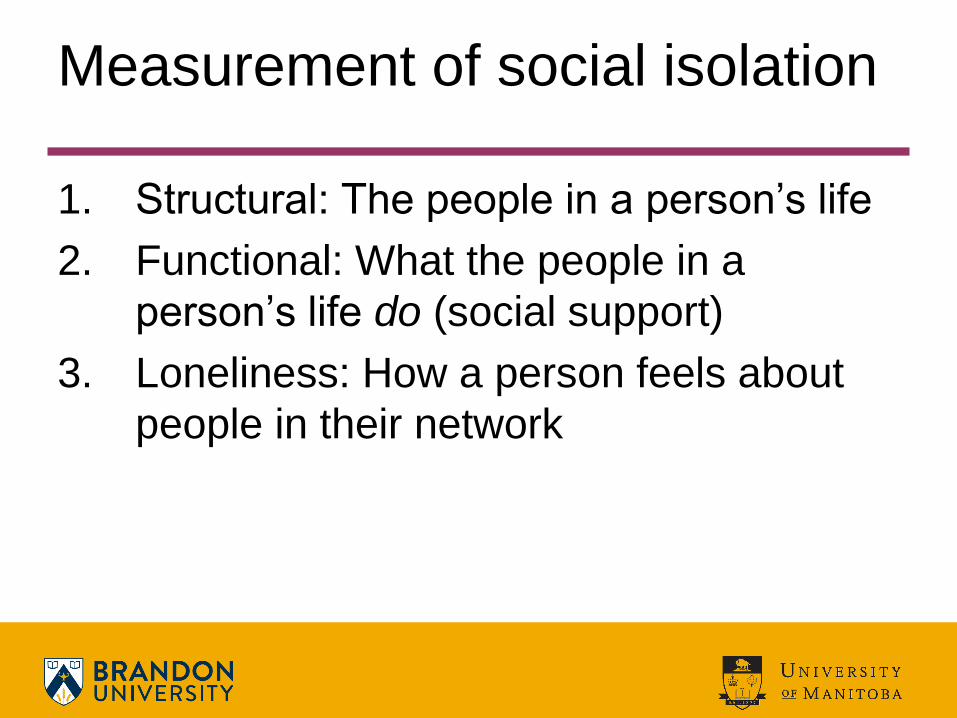
Measurement of social isolation
1. Structural: The people in a person’s life
2. Functional: What the people in a
person’s life do (social support)
3. Loneliness: How a person feels about
people in their network
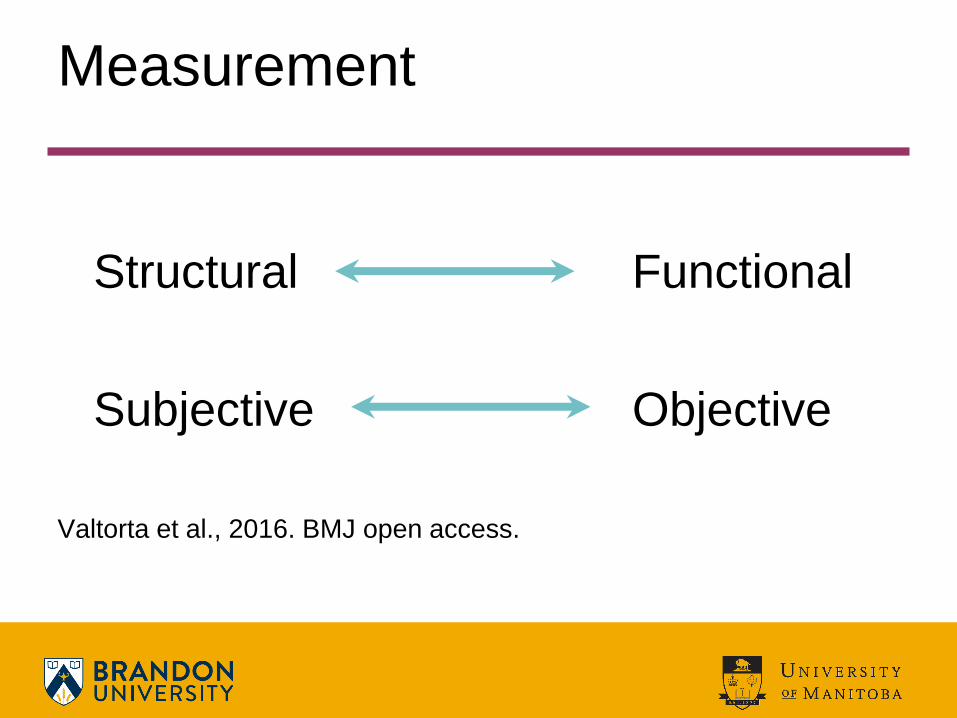
Measurement
Structural Functional
Subjective Objective
Valtorta et al., 2016. BMJ open access.
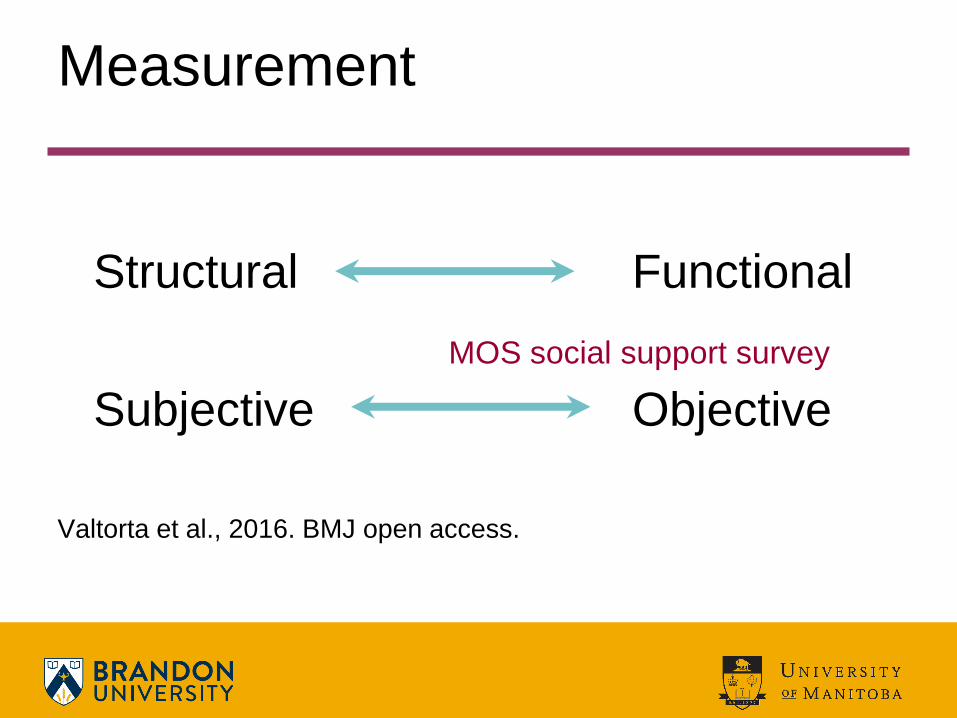
Measurement
Structural Functional
Subjective Objective
Valtorta et al., 2016. BMJ open access.
MOS social support survey
Elizabeth Daughter
Friend Son
Sibling
Friend
Sibling
Sibling
Friend
Friend
Neighbor
Friend
Friend
Neighbor
Friend
John
Spouse
Son
Neighbor
Neighbor
Social network structures
Friend
Our pilot study
• CLSA Tracking Cohort – Ages 45-85
– N=21,241 (8,782 aged 65-85)
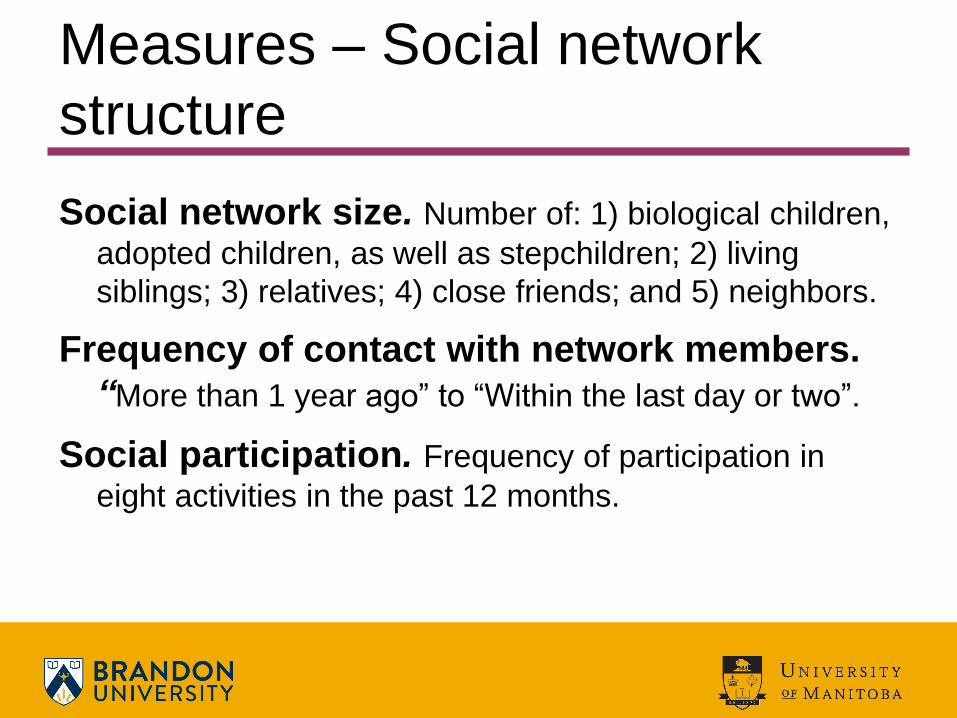
Measures – Social network
structure
Social network size. Number of: 1) biological children,
adopted children, as well as stepchildren; 2) living
siblings; 3) relatives; 4) close friends; and 5) neighbors.
Frequency of contact with network members.
“More than 1 year ago” to “Within the last day or two”.
Social participation. Frequency of participation in
eight activities in the past 12 months.
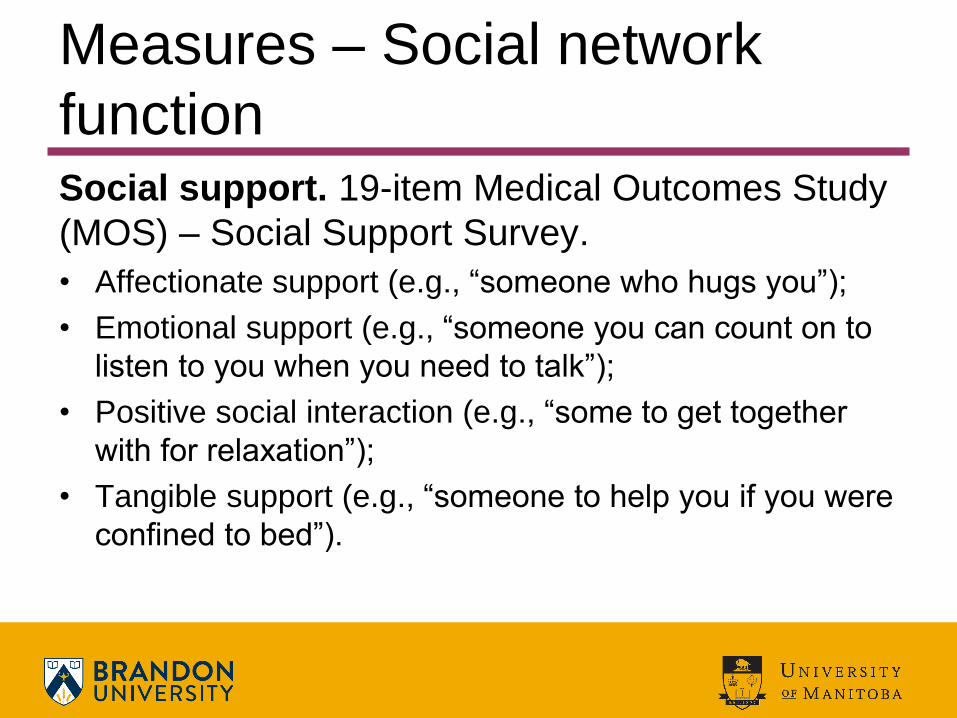
Measures – Social network
function Social support. 19-item Medical Outcomes Study
(MOS) – Social Support Survey.
• Affectionate support (e.g., “someone who hugs you”);
• Emotional support (e.g., “someone you can count on to
listen to you when you need to talk”);
• Positive social interaction (e.g., “some to get together
with for relaxation”);
• Tangible support (e.g., “someone to help you if you were
confined to bed”).
Some results
1. A comparison of the prevalence of social
isolation using different definitions.
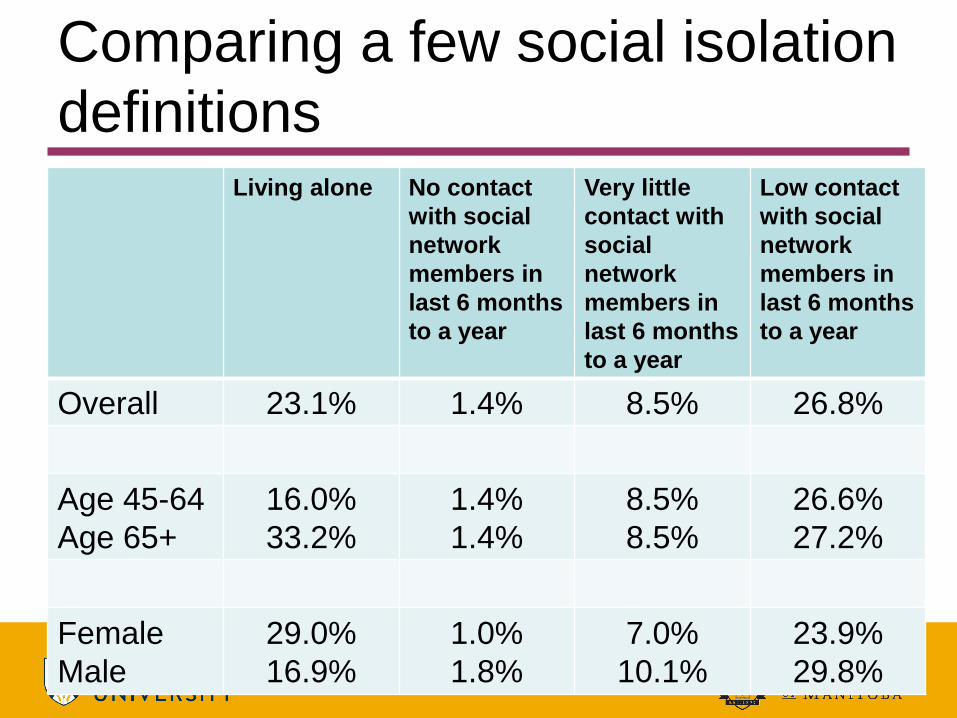
Comparing a few social isolation
definitions Living alone No contact
with social
network
members in
last 6 months
to a year
Very little
contact with
social
network
members in
last 6 months
to a year
Low contact
with social
network
members in
last 6 months
to a year
Overall 23.1% 1.4% 8.5% 26.8%
Age 45-64
Age 65+
16.0%
33.2%
1.4%
1.4%
8.5%
8.5%
26.6%
27.2%
Female
Male
29.0%
16.9%
1.0%
1.8%
7.0%
10.1%
23.9%
29.8%
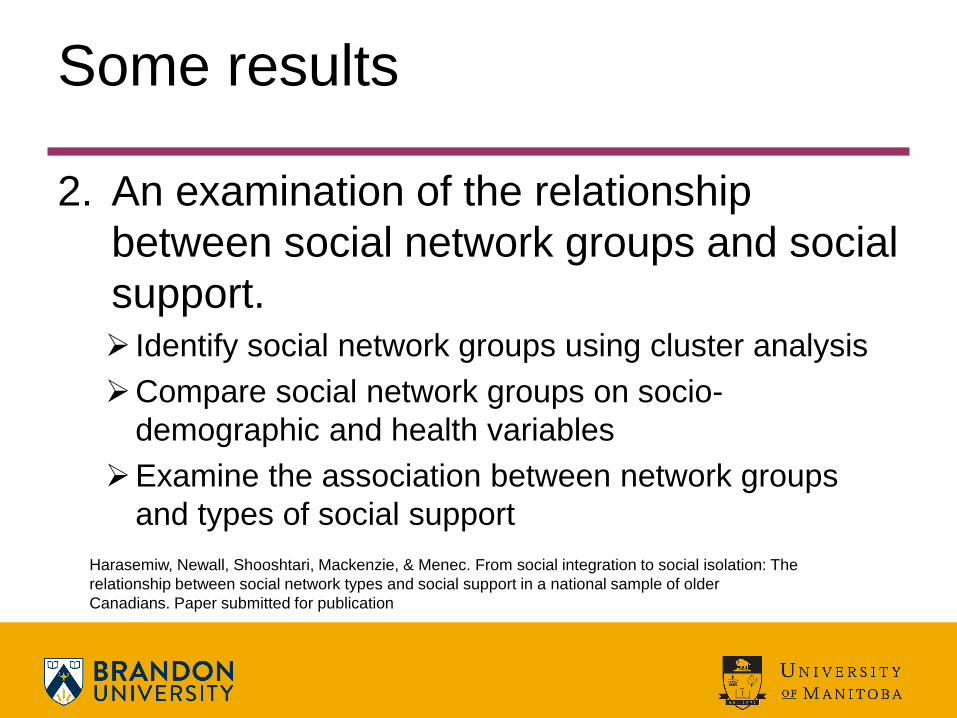
Some results
2. An examination of the relationship
between social network groups and social
support. Identify social network groups using cluster analysis
Compare social network groups on socio-
demographic and health variables
Examine the association between network groups
and types of social support
Harasemiw, Newall, Shooshtari, Mackenzie, & Menec. From social integration to social isolation: The
relationship between social network types and social support in a national sample of older
Canadians. Paper submitted for publication
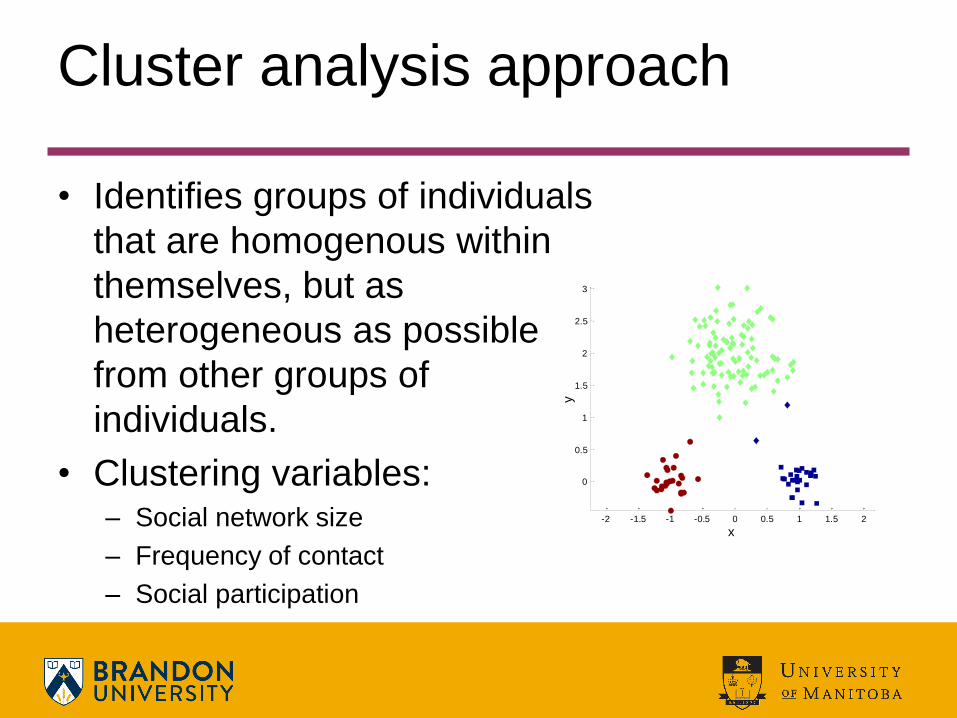
Cluster analysis approach
• Identifies groups of individuals
that are homogenous within
themselves, but as
heterogeneous as possible
from other groups of
individuals.
• Clustering variables: – Social network size
– Frequency of contact
– Social participation
-2 -1.5 -1 -0.5 0 0.5 1 1.5 2
0
0.5
1
1.5
2
2.5
3
x
y
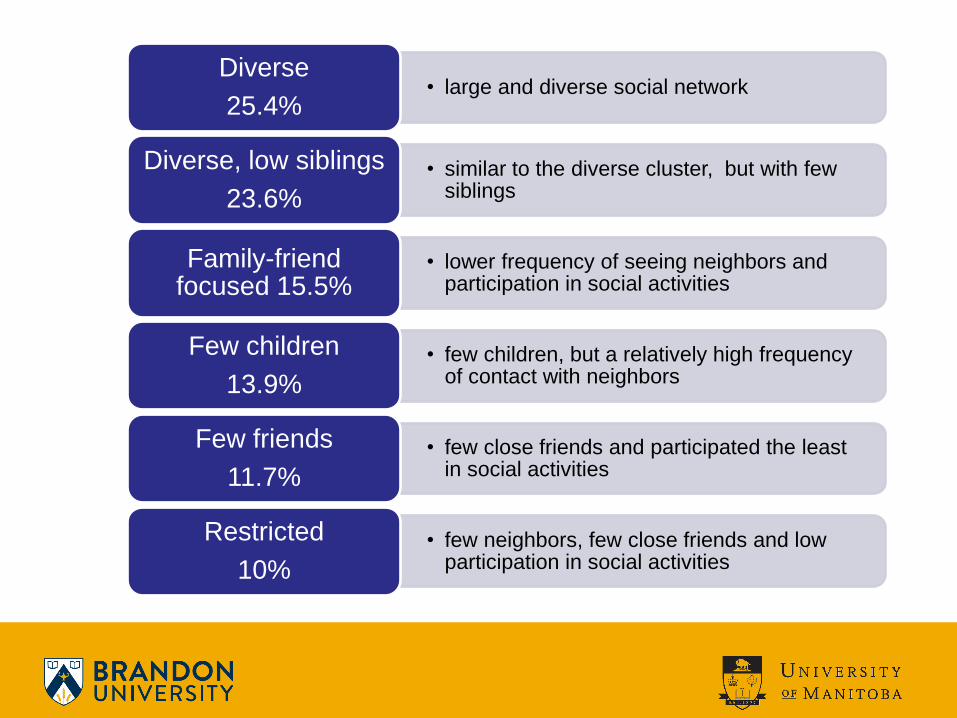
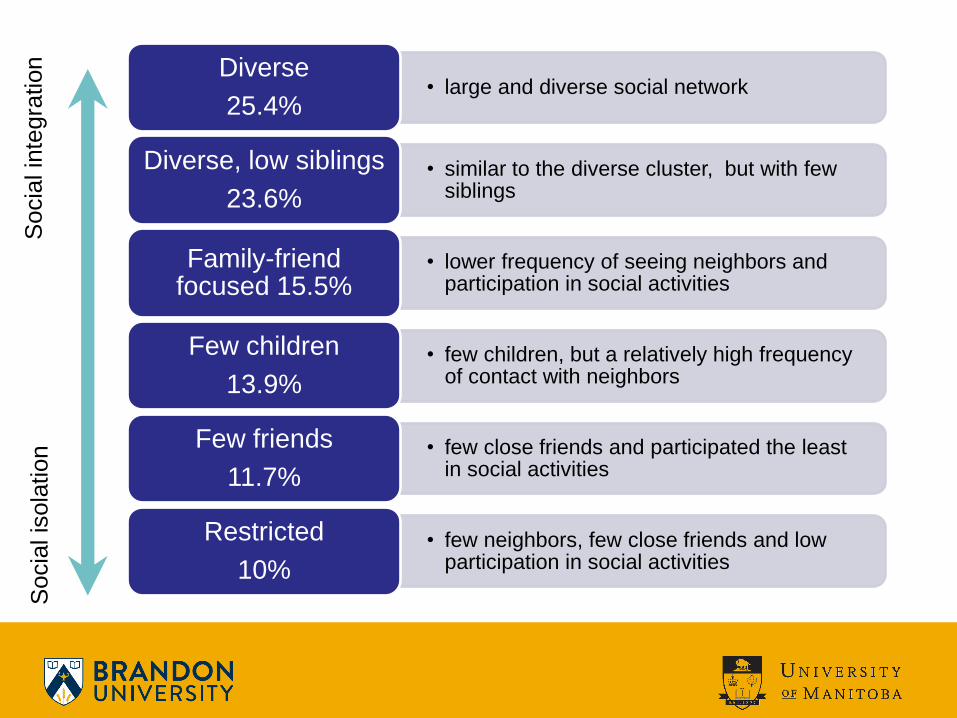
• large and diverse social network Diverse
25.4%
• similar to the diverse cluster, but with few siblings
Diverse, low siblings
23.6%
• lower frequency of seeing neighbors and participation in social activities
Family-friend focused 15.5%
• few children, but a relatively high frequency of contact with neighbors
Few children
13.9%
• few close friends and participated the least in social activities
Few friends
11.7%
• few neighbors, few close friends and low participation in social activities
Restricted
10%
Socia
l in
tegra
tion
Socia
l is
ola
tion
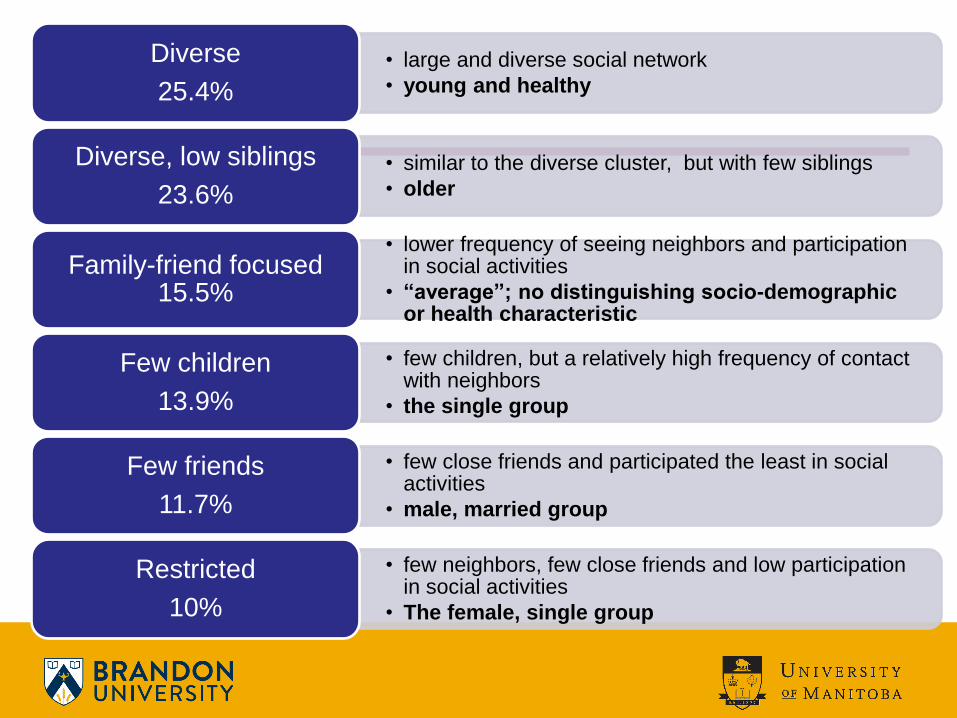
• large and diverse social network
• young and healthy
Diverse
25.4%
• similar to the diverse cluster, but with few siblings
• older
Diverse, low siblings
23.6%
• lower frequency of seeing neighbors and participation in social activities
• “average”; no distinguishing socio-demographic or health characteristic
Family-friend focused 15.5%
• few children, but a relatively high frequency of contact with neighbors
• the single group
Few children
13.9%
• few close friends and participated the least in social activities
• male, married group
Few friends
11.7%
• few neighbors, few close friends and low participation in social activities
• The female, single group
Restricted
10%
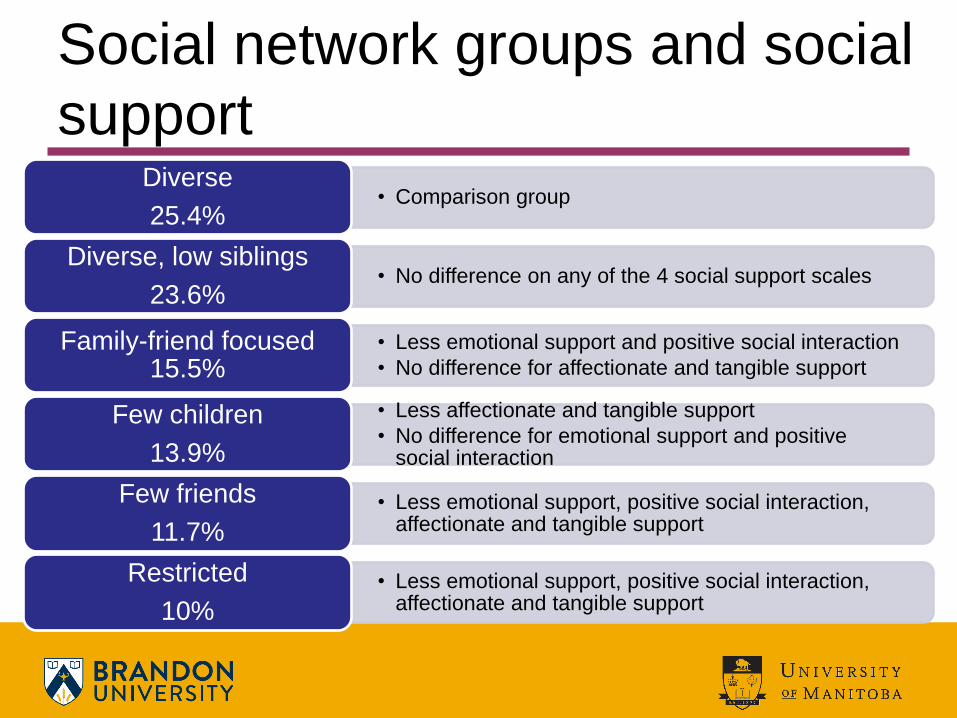
• Comparison group Diverse
25.4%
• No difference on any of the 4 social support scales Diverse, low siblings
23.6%
• Less emotional support and positive social interaction
• No difference for affectionate and tangible support
Family-friend focused 15.5%
• Less affectionate and tangible support
• No difference for emotional support and positive social interaction
Few children
13.9%
• Less emotional support, positive social interaction, affectionate and tangible support
Few friends
11.7%
• Less emotional support, positive social interaction, affectionate and tangible support
Restricted
10%
Social network groups and social
support
Conclusions
• There is a continuum from social
integration to social isolation. – The more socially isolated individuals (those
with more restricted social networks) are at
risk of not having any social support needs
met (even in the presence of a spouse).
– People with moderately restricted social
networks may also not have specific social
support needs met.
Conclusions
• Examining people’s network
structures may help to identify social
support gaps. – Targeted interventions are needed for people
with different network structures.

Defining social isolation
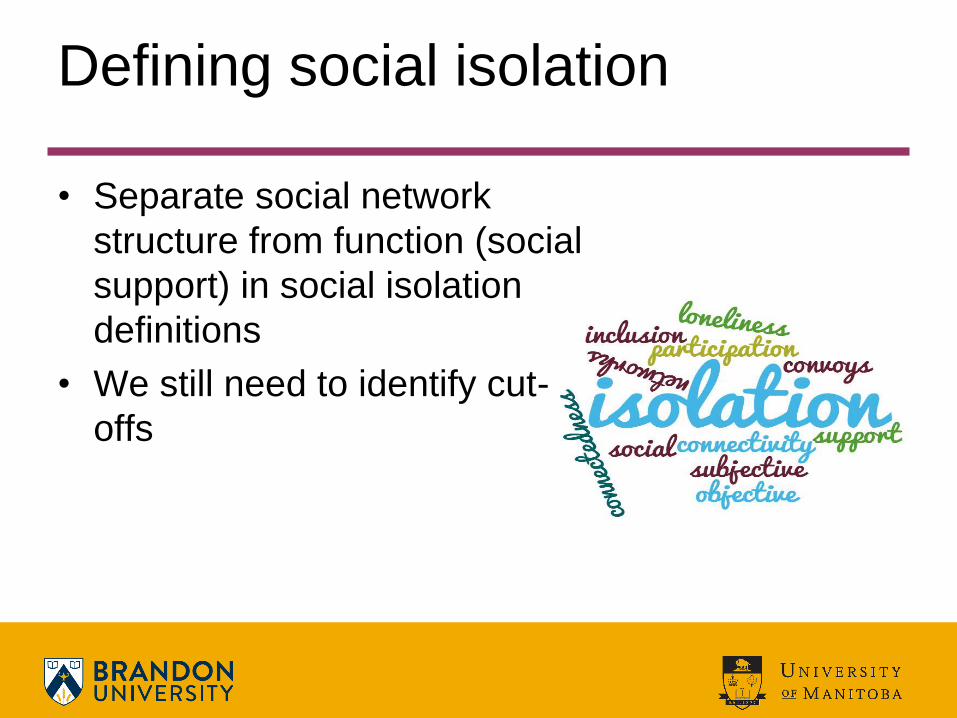
Defining social isolation
• Separate social network
structure from function (social
support) in social isolation
definitions
• We still need to identify cut-
offs