Embed Size (px)
Citation preview
Definition and digital algorithms of dielectric lossfactor for condition monitoring of high-voltagepower equipment with harmonics emphasis
Q. Li, T. Zhao and W.H. Siew
Abstract: Experience and applications of currently available methods for online monitoring anddiagnostics of high-voltage power apparatus are briefly reviewed. Based on dielectric physics, a newdefinition of dielectric loss factor with harmonics emphasis is proposed to evaluate the operationalconditions of power apparatus on a more reasonable basis, along with corresponding digitisedalgorithms. Two approaches, namely the decoupling algorithm and the approximating algorithm,are presented to implement the methodologies with the new definition of dielectric loss factor. Theimpact of background noise and power-frequency fluctuation on estimation accuracy are analysedby computer simulations, showing better application qualities of the approximating algorithm thanthe decoupling algorithm. A comprehensive strategy of simultaneous monitoring of sum current,dielectric loss factor, resistive current and capacitive current is recommended to give an effectiveassessment and diagnosis.
1 Introduction
Condition-based maintenance, as a substitute for and anatural development from the traditional scheduled main-tenance, provides unquestionable and irrefutable advan-tages for secure, reliable and economical operation of high-voltage equipment in power systems today. Conditionmonitoring and diagnostics not only form the technologicalbases for condition-based maintenance, they also providean assessment of operational status like insulation integrityand thermal ageing in large power equipment such ascurrent transformers, capacitive bushing, etc. Generally,thermal ageing and partial electrical discharge will lead tochanges of electrical, chemical or physical properties ofinsulation materials, resulting in slight or prominentchanges in dielectric parameters such as the dielectric lossfactor. Among the parameters for online monitoring, thedielectric loss factor tan d is commonly recognised as acritical indicator of insulation quality. At present there isalternative promising research being carried out forinsulation condition assessment of HV electric powerequipment, such as RVM and dielectric spectroscopy inthe time and frequency domain [1, 2], however thesemethods are influenced by an array of inaccuracies anduncertainties and their applicability needs further verifica-tion by experiment. The ongoing progress in this arena isnot a main concern of this paper, which concentrates ondielectric loss factor analysis.
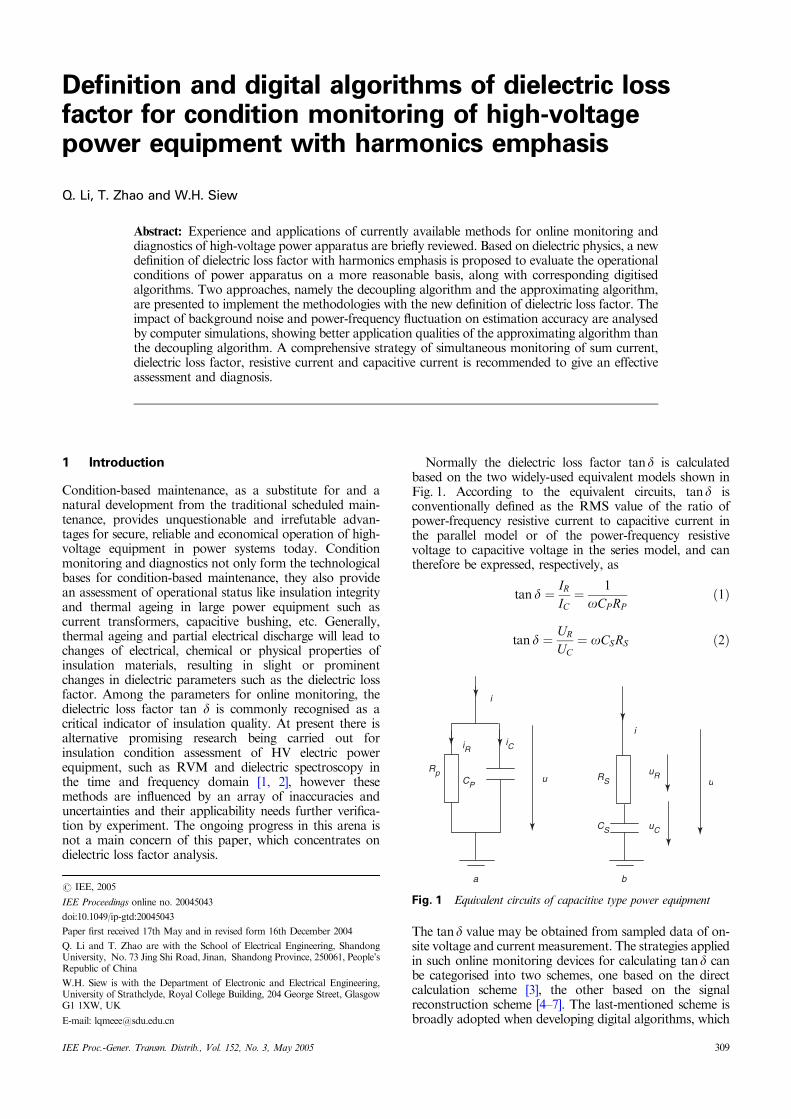
Normally the dielectric loss factor tand is calculatedbased on the two widely-used equivalent models shown inFig. 1. According to the equivalent circuits, tand isconventionally defined as the RMS value of the ratio ofpower-frequency resistive current to capacitive current inthe parallel model or of the power-frequency resistivevoltage to capacitive voltage in the series model, and cantherefore be expressed, respectively, as
tan d ¼ IR
IC¼ 1
oCP RPð1Þ
tan d ¼ UR
UC¼ oCSRS ð2Þ
The tand value may be obtained from sampled data of on-site voltage and current measurement. The strategies appliedin such online monitoring devices for calculating tand canbe categorised into two schemes, one based on the directcalculation scheme [3], the other based on the signalreconstruction scheme [4–7]. The last-mentioned scheme isbroadly adopted when developing digital algorithms, which
u
i
u
i
iC
CP
iR
Rp RS
CS
uR
uC
a b
Fig. 1 Equivalent circuits of capacitive type power equipment
Q. Li and T. Zhao are with the School of Electrical Engineering, ShandongUniversity, No. 73 Jing Shi Road, Jinan, Shandong Province, 250061, People’sRepublic of China
W.H. Siew is with the Department of Electronic and Electrical Engineering,University of Strathclyde, Royal College Building, 204 George Street, GlasgowG1 1XW, UK
E-mail: [email protected]
r IEE, 2005
IEE Proceedings online no. 20045043
doi:10.1049/ip-gtd:20045043
Paper first received 17th May and in revised form 16th December 2004
IEE Proc.-Gener. Transm. Distrib., Vol. 152, No. 3, May 2005 309
includes the Fourier series method, correlative coefficientmethod, high-order sinewave fitting method, etc. Among allthe digital algorithms available at present, only power-frequency components are extracted from the voltage andcurrent data and these are then used to calculate tand. Theharmonic components are intentionally removed. However,these methods, which are based on 50Hz, are deficient forassessing power systems in the foreseeable future. Increas-ingly; more nonlinear devices/systems are used for powersystem management and control including FACTS andthese can only increase the harmonic content of the voltage/current.
The energy loss of dielectric materials in power equip-ment consists of two parts: conducting loss and polarisationloss, and tand is a measurement of both losses. A large tandoften indicates severe heating of the dielectric, simulta-neously resulting in insulation degradation of the material,finally even causing thermal breakdown. Contributions tothe dielectric loss come not only from the power-frequencycomponent in power sources, but also from harmonics.Therefore tand should be given a new definition to fullyaccount for the insulation heating and degradationmechanism in modern power systems. This paper presentsa new definition of tand that includes the effects ofharmonics. This is demonstrated using two digital algo-rithms, including issues related to their application.
2 New definition and digital algorithms forcalculating tan d
2.1 New definition of tan dTaking the parallel branch model as an example, andassuming that both the resistive and capacitive currentcomponents have been obtained through the use of digitalalgorithms, their mathematical expressions can be written inFourier series as follows:
iRðtÞ ¼X1k¼1
ak sinðkot þ jkÞ ð3Þ
iCðtÞ ¼X1k¼1
bk sinðkot þ fkÞ ð4Þ
Here ak and bk represent Fourier coefficients, respectively,for resistive and capacitive current, jk and fk represent thephase angles of every frequency component, and o is theangular power-frequency. Thus the RMS value of eachcurrent component can be calculated by (5) and (6)
IR ¼ffiffiffiffiffiffiffiffiffiffiffiffiffiX1k¼1
a2k
s=ffiffiffi2p
ð5Þ
IC ¼ffiffiffiffiffiffiffiffiffiffiffiffiffiX1k¼1
b2k
s=ffiffiffi2p
ð6Þ
Then tan d can be defined as
tan d ¼ IR
IC¼
ffiffiffiffiffiffiffiffiffiffiffiffiP1k¼1
a2k
P1k¼1
b2k
vuuuuut ð7Þ
This paper proposes two convenient digital algorithms toobtain tand in the following two Sections, using measureddata of line voltage and leakage current.
2.2 Decoupling algorithmCapacitive-type power apparatus has an equivalent capaci-tance in the order of nanofarads, normally with a leakagecurrent in the order of milliamperes, or microamperes,therefore the measured voltage signal uðtÞ from thesecondary side of a voltage transformer is much biggerthan the leakage current signal iðtÞ measured throughearthing connectors or wires. To simplify the digitalalgorithm and to decouple the resistive and capacitivecurrent components, a scheme in hardware design isproposed in which the zero-crossing point of line voltageis detected and used to trigger the data acquisition ofcurrent. Hence the measured line voltage signal uðtÞ can beextended to the negative co-ordinate axis in the timedomain and regarded mathematically as a strict periodicodd function which behaves as uð�tÞ ¼ �uðtÞ. Then it canbe expressed in the form of a Fourier series by (8)
uðtÞ ¼X1k¼1
Uk sin kot ð8Þ
where Uk ¼ 2=TR T0
uðtÞ sin kotdt, T is the power-frequencycycle and k is an odd integer. Correspondingly the measuredcurrent signal iðtÞ can also be transformed to its Fourierseries as shown in (9)
iðtÞ ¼X1k¼1ðpk cos kot þ qk sin kotÞ ð9Þ
where pk ¼ 2=TR T0 iðtÞ cos kotdt and qk ¼ 2=T
R T0 iðtÞ
sin kotdt. According to the topology in Fig. 1a, the totalcurrent can be written as
iðtÞ ¼ uðtÞRpþ Cp
duðtÞdt
¼ 1
Rp
X1k¼1
Uk sin kot
þ oCp
X1k¼1
kUk cos kot ð10Þ
By comparing (9) and (10), the resistive and capacitivecurrent component can be extracted, as shown in (11) and(12).
iRðtÞ ¼1
Rp
X1k¼1
Uk sin kot
¼X1k¼1
qk sin kot ð11Þ
iCðtÞ ¼ oCp
X1k¼1
kUk cos kot
¼X1k¼1
pk cos kotð12Þ
Then the formula to calculate dielectric loss factor has asimilar form to (7)
tan d ¼ IR
IC¼
ffiffiffiffiffiffiffiffiffiffiffiffiP1k¼1
q2k
P1k¼1
p2k
vuuuuut ð13Þ
With this decoupling digital algorithm, only the sampleddata of current signal is required to calculate tand, while thezero-crossing point of line voltage should be available toinitialise a trigger as the starting point for current data
310 IEE Proc.-Gener. Transm. Distrib., Vol. 152, No. 3, May 2005
acquisition. The trigger following detection of a zero-crossing point of line voltage can be readily implemented inhardware design.
2.3 Fundamental frequency-basedapproximating algorithmIn the other method suppose uðtÞ and iðtÞ are thesimultaneously measured voltage and current signals frompower equipment, then their Fourier series can be written asfollows:
uðtÞ ¼X1k¼1ðmk cos kot þ nk sin kotÞ ð14Þ
iðtÞ ¼X1k¼1ðpk cos kot þ qk sin kotÞ ð15Þ
Here mk, nk, pk, qk are the Fourier series coefficients. Usingthe parallel branch model, the resistive current componentmay be expressed by (16)
iRðtÞ ¼iðtÞ � iCðtÞ ¼ iðtÞ � CpduðtÞ
dt
¼X1k¼1½ðpk � koCpnkÞ cos kot
þðqk þ koCpmkÞ sin kot�
ð16Þ
Basically iRðtÞ should be in phase with uðtÞ, which can beapproximated by the fundamental frequency component(50Hz) because it is the principal part in the measuredvoltage and current signals. Hence the following twoequations can be derived and used to obtain the parameterCp:
n1
m1¼ q1 þ oCpm1
p1 � oCpn1ð17Þ
Cp ¼n1p1 � m1q1
oðm21 þ n2
1Þð18Þ
Substitution of Cp into (16) results in resistive and capacitivecurrent components, respectively, for iRðtÞ and iCðtÞ at allfrequencies, based on which tand can be given by (7).
This digital algorithm requires simultaneous sampling ofboth the voltage and current signals. The model parameterCp is approximated on a power-frequency basis, howeverthe relationship in harmonic frequencies will be fulfillednaturally and theoretically.
3 Computer simulation
To validate and verify the proposed digital algorithms,computer simulations have been done based on the parallelmodel, in which Cp and Rp are set to 5nF and 120MO,respectively, resulting in a tand of 0.005305, consideringonly the fundamental frequency. Professional software forsignal processing DaDisp is used to generate the computersimulation results.
In practice the frequency components in the line voltageinclude mainly the fundamental frequency, third harmonic,fifth harmonic and so on. Therefore a voltage source withthis characteristic is assumed in the simulations. Also,during the operational environment of power systems,fundamental-frequency fluctuation and background noisemay exist, so simulations incorporating these two perturba-tions are emphasised to demonstrate the accuracy of thedigital algorithms.
In the simulations the sampling rate is set to 25.6kHz tomeet the synchronous sampling criterion for 50Hz, and the
record data length is four power cycles with 2048 sampledpoints. Normally the available hardware design can easilyfacilitate a high enough sampling frequency for powersignals, therefore in the simulations the impact of thesampling frequency is not considered specifically foranalysis.
3.1 Validation of decoupling algorithmApart from the fundamental frequency, it is assumed thatthe line voltage consists of third and fifth harmonics, andcan be expressed in p.u. as follows:
uðtÞ ¼ sinot þ 0:05 sin 3ot
þ 0:07 sin 5otð19Þ
The total current iðtÞ can be calculated according to Fig. 1a.Then this total current is regarded as the measured currentto verify the decoupling algorithm.
When the power-frequency fluctuates in a range of70.6% the calculated results and errors by the decouplingalgorithm are given in Table 1. The simulation deviation of0.12% at 50Hz is mainly due to the truncation error in thecomputation. If the power-frequency changes by 70.3%the calculation error using the algorithm is larger, though5.28% is still acceptable in the context of conditionmonitoring. The error is caused mainly by asynchronoussampling, which results in spectrum leakage of the measuredsignals. However, if one intends to reduce and counteractthis error, measures such as increasing sampling frequencyand data logging length, or installing a synchronoussampling card, could be taken.
Normally the leakage current to be measured on site isaffected by background noise. To show the noise sensitivity(or insensitivity) of the algorithm, different levels ofbackground noise are assumed in the simulation results asshown in Table 2. The presumed total current without noiseis the same as before. The first column in the Table indicatesthe noise amplitude in percentage against net total current.Here random noises of the normal distribution type areselected with the mean value and standard deviation,respectively, as 0.0 and 0.01. It is evident from Table 2 thatthe decoupling algorithm has good noise insensitivity whenthe noise amplitude is within 10% of the measured currentsignal.
Table 1: Results using decoupling algorithm with power-frequency fluctuation
Fund.freq. Hz
Real tand Calculatedtand
Error ofalgorithm
49.7 0.004997 0.005261 5.28%
50.0 0.004976 0.004982 0.12%
50.3 0.004956 0.005142 3.75%
Table 2: Results using decoupling algorithm with differentbackground noise levels
Noiselevel %
Real tand Calculatedtand
Error ofalgorithm
1.0 0.004976 0.004957 �0.38%
2.0 0.004976 0.004928 �0.96%
5.0 0.004976 0.004901 �1.51%
10.0 0.004976 0.004815 �3.22%
IEE Proc.-Gener. Transm. Distrib., Vol. 152, No. 3, May 2005 311
3.2 Validation of fundamental frequency-based approximating algorithmSimilar simulations are carried out to show the effectivenessof the approximating algorithm based on the fundamentalfrequency component. If the original measured voltagesignal in p.u. is
uðtÞ ¼ sinðot þ 30�Þ þ 0:05 sinð3ot þ 160�Þþ 0:07 sinð5ot þ 75�Þ ð20Þ
Then the calculated total current is treated as the measuredcurrent signal already known for the simulations, in whichthe optimal values of Cp and Rp are also set to 5nF and120MO, respectively. The results by approximating algo-rithm under power-frequency fluctuations are given inTable 3, showing that this approximating algorithm givesmuch lower errors and more effectiveness than thedecoupling algorithm. A possible reason might be that thespectrum leakage in both voltage and current in theapproximating algorithm could have cancelled each other.
Simulations with background noise of different levels(Table 4) also showed a much better behaviour by theapproximating algorithm (based on the power-frequencycomponent) than the decoupling method.
As to the impact of vertical sampling resolution, furthercomputer simulations demonstrate that if a 10bit ADCdevice is used, the computation error of tand will be lessthan 0.000002, which is sufficient for on-site monitoring. Atpresent ADC devices of 12 and 16bits are easily obtainedcommercially, thus the impact of the vertical resolution ofsampling is not considered as a main concern here.
In summary, the approximating algorithm gives a betteraccuracy compared with the decoupling algorithm, thusfundamental frequency-based approximating algorithm isrecommended for the online monitoring of tand of HVpower equipment. However, to reduce the impact frompower-frequency fluctuations installation of a synchronoussampling card is necessary.
Since the capacitive current is proportional to the firstderivative of the line voltage, the harmonics will havegreater impact on it than on the resistive current. Hence, acomprehensive monitoring strategy is hereby recommended;that is that the sum current i(t), dielectric loss factor tand,resistive current iR(t) and capacitive current iC(t) should bemonitored simultaneously, which can all be derived fromeither of the proposed two algorithms.
4 Conclusions
� A new definition of tand is proposed with harmonicsemphasis for condition monitoring of power apparatus,which presents a more reasonable evaluation of bothinsulation degradation and heat behaviour on the basis ofdielectric physics than the conventional definition.
� Two convenient digital algorithms based on Fourierseries of the measured voltage and current signals arepresented and also validated by computer simulations undervarious operational conditions, both showing good cap-abilities to withstand frequency fluctuation and backgroundnoise. However, the approximating algorithm provides abetter accuracy than the decoupling algorithm, and isrecommended for online monitoring of tand.� To give a comprehensive assessment of the operationalstatus of HV power equipment especially with heavyharmonics, simultaneous monitoring of sum current, di-electric loss factor, resistive current and capacitive current isrecommended in which the resistive and the capacitivecurrent components can be derived from digital algorithms.
5 References
1 Van Bolhuis, J.P., Gulski, E., and Smit, J.J.: ‘Interpretation of RVMmeasurements beyond the polarisation spectrum’. Conference Recordof the 2002 IEEE Int. Symp. on Electrical Insulation, Boston, MA,USA, 7–10 April 2002, pp. 179–182
2 Zaengl, W.S.: ‘Applications of dielectric spectroscopy in time andfrequency domain for HV power equipment’, IEEE Electr. Insul. Mag.,2003, 19, (6), pp. 9–22
3 Zhao, X., Tan, K., and Zhu, D.: ‘Study on digital measurements fordielectric loss angle’, J. Tsinghua Uni. (Sci. Technol.), 1996, 36, (9),pp. 51–56
4 Allan, D., Blundell, M., and Boyd, K. et al.: ‘New techniques formonitoring the insulation quality of in-service HV apparatus’, IEEETrans. Electr. Insul., 1992, 27, (3), pp. 578–581
5 Lachman, M.F., Walter, W., and Guggenberg, P.A.: ‘Onlinediagnostics of high-voltage bushings and current transformers usingthe sum current method’, IEEE Trans. Power Deliv., 2000, 15, (1),pp. 155–162
6 Djokic, B., and So, E.: ‘Phase measurement of distorted periodic signalsbased on nonsynchronous digital filtering’, IEEE Trans. Instrumen.Meas., 2001, 50, (4), pp. 864–867
7 Wang, P., Raghuveer, M.R., and McDermid, W. et al.: ‘A digitaltechnique for the online measurement of dissipation factor andcapacitance’, IEEE Trans. Dielectr. Electr. Insul., 2001, 8, (2),pp. 228–232
Table 3: Results using approximating algorithm withpower-frequency fluctuation
Fund.freq. Hz
CalculatedCp pF
Real tand Calculatedtand
Error ofalgorithm
49.7 4929 0.004997 0.005069 1.44%
50.0 4980 0.004976 0.004986 0.20%
50.3 5040 0.004956 0.004917 �0.79%
Table 4: Results using approximating algorithm withdifferent background noise levels
Noiselevel %
CalculatedCp pF
Real tand Calculatedtand
Error ofalgorithm
1.0 4998 0.004976 0.004978 0.04%
2.0 5001 0.004976 0.004975 �0.02%
5.0 5005 0.004976 0.004971 �0.10%
10.0 5015 0.004976 0.004961 �0.30%
312 IEE Proc.-Gener. Transm. Distrib., Vol. 152, No. 3, May 2005