Embed Size (px)
Citation preview

International Journal of Language Academy ISSN: 2342-0251
Volume 2/3 Autumn
2014 p. 283/301
International Journal of Language Academy
Volume 2/3 Autumn 2014 p. 283/301
DEFINING THE PSYCHOMETRIC PROPERTIES
OF THE WRITING SENSITIVITY SCALE AND
ANALYSING WRITING SENSITIVITY WITH
REGARD TO DIFFERENT VARIABLES
Yazma Duyarlılığı Ölçeğinin Psikometrik Niteliklerinin
Belirlenmesi ve Yazma Duyarlılığının Farklı Değişkenler
Açısından İncelenmesi
Nihat BAYAT1 & Güçlü ŞEKERCİOĞLU2
Abstract
This study aimed to develop the Writing Sensitivity Scale, to determine its psychometric properties and to investigate how sensitivity toward writing differed according to participants’ demographic characteristics. The research group of this survey study involved preservice Turkish language teachers studying at Akdeniz University, Mehmet Akif Ersoy University, Dokuz Eylül University and Niğde University. In order to develop the instrument and to determine its psychometric properties, data were collected from 396 participants for the pilot study and from 375 participants for the main study. The Writing Sensitivity Scale involving 37 items is scored with a 5-point rating scale. Exploratory factor analysis, confirmatory factor analysis and Cronbach’s alpha analysis were carried out for data analysis. As a result of the analyses, the construct validity of the scores obtained through the Writing Sensitivity Scale and the reliability of the scale in terms of internal consistency can be considered high. In addition, common effects of the variables of sex and grade point average as well as the variables of sex and class level on writing sensitivity were significant. The main effects of the variables of grade point average and frequency of writing on writing sensitivity were significant as well. On the other hand, common effects of the variables of sex and frequency of writing; frequency of writing and frequency of reading books; and lastly frequency of writing and grade point average on writing sensitivity were not significant. Keywords: Writing, writing sensitivity, scale development, Turkish language, preservice teachers.
Özet Bu araştırmada Yazma Duyarlılığı Ölçeğinin geliştirilmesi ve psikometrik niteliklerinin belirlenmesi ile yazma duyarlılığının katılımcıların demografik özelliklerine göre farklılaşma durumlarının incelenmesi amaçlanmıştır. Tarama modeline dayalı olarak yürütülen çalışmanın araştırma grubu Akdeniz, Mehmet Akif Ersoy, Dokuz Eylül ve Niğde Üniversitelerinde lisans eğitimlerine devam eden Türkçe öğretmen adaylarıdır. Aracın geliştirilmesi ve psikometrik niteliklerinin belirlenmesi açısından ön deneme uygulaması için 396 katılımcıdan ve asıl uygulama için 375 katılımcıdan elde edilen veriler doğrultusunda açımlayıcı faktör analizi, doğrulayıcı faktör analizi ve Cronbach alfa analizi uygulanmıştır. Yapılan analizler doğrultusunda puanlamanın 5’li derecelendirme ölçeği üzerinden yapıldığı ve 37 maddeden oluşan tek faktörlü Yazma Duyarlılığı Ölçeği’nden elde edilen puanlar doğrultusunda yapı geçerliliği ve iç tutarlılık boyutunda güvenilirliğin yüksek olduğu ifade edilebilir. Ayrıca cinsiyet ve akademik not ortalaması ile cinsiyet ve sınıf düzeyi değişkenlerinin, yazma duyarlılığı üzerindeki ortak etkilerinin manidar olduğu sonucuna ulaşılmıştır. Buna ek olarak akademik not ortalaması ile yazı yazma sıklığı değişkenlerinin yazma duyarlılığı üzerindeki temel etkilerinin manidar olduğu belirlenmiştir. Diğer taraftan cinsiyet ve yazma sıklığı, yazma ve kitap okuma sıklıkları ile yazma sıklığı ve akademik not ortalaması değişkenlerinin yazma duyarlılığı üzerindeki ortak etkilerinin manidar olmadığı sonucuna ulaşılmıştır. Anahtar Sözcükler: Yazma, yazma duyarlılığı, ölçek geliştirme, Türkçe, öğretmen adayları.
1 Yrd. Doç. Dr. Akdeniz Üniversitesi, e-posta: [email protected] 2 Yrd. Doç. Dr. Akdeniz Üniversitesi, e-posta: [email protected]

Nihat BAYAT & Güçlü ŞEKERCİOĞLU
International Journal of Language Academy
Volume 2/3 Autumn 2014 p. 283/301
284
284
Introduction People with writing skills have some specific characteristics regarding writing. A successful text is produced based on the distinctive qualities of a good writer. It is possible to have a successful text by paying attention to the components of writing in accordance with their functions during the production process. A writer’s shaping his/her text according to general characteristics of the audience is the result of such sensitivity. His/her making some differences in the structure of the text
while addressing different kinds of readers is due to the same reason. The natural output of the act of writing is text. A text is a unity comprised of “a group of entities, used as signs, which are selected, arranged, and intended by an author in a certain context to convey some specific meaning to an audience” (Gracia, 1995, p. 4). The elements enabling the unity of the text are the indicators employed, the selection of these indicators and the arrangements among them, aim,
context, writer, reader and the intended message. The unity of the text is ensured through systematic organization of these units. The act of writing can be addressed as the act of building this system. There are two approaches to written products based on text and the process of text production (Oral, 2003). One of these approaches is the product approach, which focuses on the written product. The product approach attempts to determine the written text’s level of correctness after the writing process is completed. Pincas (1982) asserts that writing is regarded as linguistic knowledge prioritizing the use of vocabulary, syntax and the means of cohesion in this approach. A total of four stages exist in product-based writing: familiarization, controlled writing, guided writing and free writing. Writing occurs based on these stages. In this respect, the product approach treats writing as the imitation of the model text provided by the teacher (Badger & White, 2000). This approach deals with the act of writing after the writing process is completed. The second approach to writing focuses on the production process of the text. In the act of writing, the process writing approach takes into account not only the product but also the writing activities. These activities involve the writer’s producing ideas, gathering data related to the generated ideas, developing the text and sharing it with the reader (Tribble, 1996). The process of textualizing the generated ideas takes place in three stages: prewriting, drafting and revising (Flower & Hayes, 1981). These stages exhibit a cyclic pattern in the writing process. While producing a text, the writer can go back to
previous stages and make some changes. The writing process is described by various researchers in similar ways with some minor differences (Hiemstra & Brier, 1994; Keçik & Uzun, 2003). According to these descriptions, in the prewriting stage, brainstorming related to the topic to write on is carried out, and some subordinate ideas are identified. During the drafting stage, a temporary text is produced by choosing among the identified ideas and putting them together. After the resulting text is discussed individually or in groups, the writer revises the text for the identified mistakes or for improvement. Corrections and the last readings follow this stage (Badger & White, 2000). While all these processes are carried out, the teacher guides the students and tries to increase their capacity. The processes carried out by the writer during the writing process should meet the necessary conditions for the production of a good text. The writer should endeavor to use the components of writing in such a way that s/he can accomplish the identified goal. Therefore, s/he needs to take into account such elements as plan, reader, message, context, language, word choice, tone, and so on. The writers reacting to these factors during the writing process can be considered sensitive writers. In this regard, writing sensitivity can be defined as reacting by paying attention to the components of writing
during text production, developing the text based on the identified goal in terms of these components, and sorting out any potential problems in the text during the revising stage. Hence, writing sensitivity
Defining The Psychometric Properties Of The Writing Sensitivity Scale And
Analysing Writing Sensitivity With Regard To Different Variables
International Journal of Language Academy
Volume 2/3 Autumn 2014 p. 283/301
285
involves knowing the components of writing and processing these components in order to produce a successful text. The writer’s sensitivity during text production can be addressed in terms of textual and non-textual elements. Textual elements are the ones that can be easily observed in the text content such as the organization of ideas, coherence and cohesion, main idea and subordinate ideas, spelling and punctuation, and these elements ensure textuality. As for non-textual elements, these elements
involve the communication atmosphere, the characteristics of the reader and the writer’s need to feel appreciated by means of the text. The writer is expected to fulfill all these duties during text production. The sensitivity toward purposes that can be developed by the writer during the production process can be considered one of the elements to ensure the success of the text. The writing process is shaped through mutual processing of many units. After the purpose, method,
topic and limits of writing are determined during the writing process, the writer makes a choice of information in his/her mind (Güneş, 2007). It is essential for the writer to comprehend the content to be conveyed, to resolve his/her ideas, to reshape these ideas and to transfer them as a whole (Sever, 1991). A successful writing involving these processes as well can be produced by paying attention to the principles of inventing, organizing and expressing (Kavcar, Oğuzkan, & Aksoy, 2002). These aspects enabling the act of writing to result in success take place through the sensitivity to be shown by the writer during the writing process. Each text is developed according to a kind of reader. Sometimes, the meaning to be conveyed through the text might not appear with all its details. The writer organizes his/her text according to the prior knowledge assumedly possessed by the reader. While consuming the text, the reader uses his/her prior knowledge and looks for some similarities between the text and his/her prior knowledge (Grabe & Kaplan, 1996). A sensitive writer is expected to determine the reader’s prior knowledge and comprehension capacity as correctly as possible, and to clearly express the meanings that the reader cannot reach through deduction. All these procedures are carried out during the writing process. The writing model that clearly reflects the writer’s thinking processes before the emergence of the text produced as a result of the writing procedures is the process writing model. The process writing model focuses on the writer’s cognitive processes. According to Flower and Hayes (1981), writing is based on four major principles in this model: 1. The writing process is a series of unique thinking processes utilized by the writer during text production, 2. These processes are organized according to a
hierarchical structure in which each process covers or is embedded within another process, 3. The writing process is guided by the writer and depends on the goal that the writer develops for the written product, 4. Writers determine their own goals. Since the process writing model gives prominence to the writer along with the product within the scope of these principles (McCurdy, Schmitz, & Albertson, 2010), it provides a good basis for identifying the content of writing sensitivity. This is because writing sensitivity is the writer’s cognitive reaction during text production. The process writing model, which is based on a cognitive approach, attempts to depict the act of writing in all its aspects. According to this model, the act of writing is comprised of three units: task environment, the writer’s long term memory and the writing process. Task environment includes everything beyond the writer that affects writing. Topic is the most important element in this area. Using his/her writing skills, the writer explores the topic according to the qualities of the reader and his/her own purposes. The second important element for the task environment is text. As the writing process proceeds, the writer starts to be restricted in terms of what s/he can tell. The new ideas following each statement are required to relate to the previous ones consistently. This necessity keeps the writer within a more limited area. As the text develops, the writer needs to keep a balance between
the knowledge retrieved from his/her long term memory, the time and his/her attention. The second component of the cognitive writing model is the writer’s long term memory. The long term memory includes the writer’s general knowledge regarding the topic, target reader and writing plans. There are

Nihat BAYAT & Güçlü ŞEKERCİOĞLU
International Journal of Language Academy
Volume 2/3 Autumn 2014 p. 283/301
286
286
two major points about the long term memory. The first is retrieving the correct knowledge that is essential for writing, and the second is shaping the retrieved knowledge in accordance with the problem of the text. The writer can sometimes find the correct knowledge, but may not process it in such a way that the reader can understand (McCurdy, Schmitz, & Albertson, 2010). Task environment and long term memory appeared as non-textual elements in the 1981 model. The third component of the cognitive writing model containing textual elements is the writing process.
The writing process involves planning, textualizing and revising. Planning is the act of producing and organizing the content of the text (Graham, 2006; Kellogg, 1994). For planning, the writer needs to determine a purpose, produce ideas and select among the generated ideas in order to fulfill his/her purpose (Flower & Hayes, 1981). The ideas are transformed into written language during the process of textualization that takes place after planning. The writer deals with the linguistic requirements during this process. The people having problems related to linguistic knowledge can experience
difficulties in producing and organizing ideas during the stage of textualization as well. In the stage of revising, readings are done in order to understand whether the text proceeds in line with the purpose and to develop the text. The spelling and punctuation mistakes encountered during the readings are corrected as well (Flower & Hayes, 1981). After the obtainment of new information as a result of the writing studies, the cognitive process theory of writing is revised by Hayes (1996). The new writing model, which also comprises the model created in 1981, involves a new unit called working memory. The working memory organizing the relationships among the other units in the writing process helps the 1996 model to look more systematic. Due to reflecting the components of the act of writing and the relationships among these components clearly, Hayes’s (1996) writing model forms the foundation of writing sensitivity. Hayes’s (1996) writing model reflects the components used before text production in the act of writing, and gives priority to the writer when compared to product-based writing. As an essential behavior to have and exhibit for a writer, writing sensitivity refers to implementing all the requirements of the act of writing for the production of a good text. In this regard, the items needed for the development of the writing sensitivity scale, which constitutes the aim of the present study, were generated by taking into account the behavioral counterparts of the units in Hayes’s (1996) model.
Given the information about writing and writing sensitivity, two purposes were identified for this study. The first is to determine the psychometric properties of the Writing Sensitivity Scale (WSS), and the second is to examine writing sensitivity in terms of such variables as sex, grade point average, class level, frequency of writing, and frequency of reading books. Therefore, the study seeks to answer the following research questions:
1. What kind of a factor design does the WSS have?
2. Is the single-factor design of the WSS verified?
3. What is the internal consistency coefficient of the WSS?
4. Does preservice Turkish language teachers’ writing sensitivity differ significantly according to sex and grade point average (high and low)?
5. Does preservice Turkish language teachers’ writing sensitivity differ significantly according to sex and class level?
6. Does preservice Turkish language teachers’ writing sensitivity differ significantly according to sex and frequency of writing?

Defining The Psychometric Properties Of The Writing Sensitivity Scale And
Analysing Writing Sensitivity With Regard To Different Variables
International Journal of Language Academy
Volume 2/3 Autumn 2014 p. 283/301
287
7. Does preservice Turkish language teachers’ writing sensitivity differ significantly according to frequency of writing and reading books?
8. Does preservice Turkish language teachers’ writing sensitivity differ significantly according to frequency of writing and grade point average (high and low)?
Method
Model and Research Group The research group of this survey study involves undergraduate students of the department of Turkish Language Teaching at Faculty of Education. In order to determine the psychometric properties of the WSS, two groups were selected for the pilot study and the main study. Data were collected from 396 preservice Turkish language teachers studying at Akdeniz University and Mehmet Akif Ersoy
University for the pilot study, and from 375 preservice Turkish language teachers studying at Dokuz Eylül University and Niğde University for the main study. The total number of participants of both implementations is 771. For the pilot study and the main study, distribution of participants by university, class level and sex is demonstrated in Table 1.
Table 1: Distribution of Participants by University, Class Level and Sex
University Class Sex Level f f
Pilot Study Akdeniz University 1 56 Female 32
Male 24 2 36 Female 21
Male 15
3 91 Female 41 Male 50
4 21 Female 9 Male 12
Total 204 Mehmet Akif Ersoy University 1 63 Female 37
Male 26 2 58 Female 34
Male 24 3 45 Female 25
Male 20 4 26 Female 14
Male 12 Total 192
Main Study Dokuz Eylül University 2 42 Female 24
Male 18 3 76 Female 40
Male 36 4 33 Female 15
Male 18
Total 151 Niğde University 1 32 Female 19
Male 13 2 44 Female 30

Nihat BAYAT & Güçlü ŞEKERCİOĞLU
International Journal of Language Academy
Volume 2/3 Autumn 2014 p. 283/301
288
288
Male 14 3 76 Female 54
Male 22 4 72 Female 40
Male 32 Total 224
Grand Total 771
While 53.79% of the participants (n=213) are female and 46.21% of them (n=183) are male in the pilot study, 59.2% of the participants (n=222) are female and %40.8 of them (n=153) are male in the main study. The small number of the 4th year students stands out in both implementations. This results from the low attendance of students in the last semester.
In both the pilot study and the main study, the aforementioned instrument was administered to the participants on a voluntary basis.
Instrument For the pilot form of the Writing Sensitivity Scale (WSS) that was developed by the researchers, 89 tentative items were written in line with the theoretical basis in the literature. Five experts were provided with an expert form and asked for their opinions about the items of the draft instrument. Four of these experts are teaching staff in the field of Turkish Language at Akdeniz University, Mehmet Akif Ersoy University and Niğde University, and one of them is a teaching staff in the field of Measurement and Evaluation at Ankara University. The experts were asked to evaluate the relevant items based on their “suitability in terms of the measured feature (construct)”, “suitability in terms of intelligibility” and “suitability in terms of the fundamental principles of scaling”. In accordance with the suggestions of the experts, adjustments about the language use were made on the items, and it was decided to exclude 7 items from the instrument. Thus, the pilot form of the WSS involving 82 items was made ready for the pilot study. As a result of the analyses of the data acquired through this pilot study, it was decided to exclude 45 items from the instrument, and changes related to language
use were made on some items. The main study was based on the 37-item form of the WSS. The WSS, which does not consist of any reverse coded items, is scored based on a 5-point rating scale involving the options “not at all true of me, not true of me, moderately true of me, true of me and very true of me”.
Data Analysis In both the pilot study and the main study, exploratory factor analysis (EFA) was initially conducted to gather evidence of construct validity in terms of the psychometric properties of the WSS. In social sciences, factor analysis is one of the most frequently used techniques to obtain evidence of construct validity for studies of scale development and adaptation, and for studies involving a scale used for a different purpose or a different sample. Factor analysis is carried out to reveal a factor structure or to verify a previously estimated factor structure instead of providing a single coefficient for the validity of a scale. The information obtained through factor analysis provides a road map for validity and reliability analyses and for the other statistical analyses to be conducted with the scores gathered through the scale. Factor analysis is a multivariate statistical analysis used to discover a few new and conceptually meaningful variables (factors/constructs) by grouping together a large number of related variables or to test the models explaining the relationships among factors and their indicators. There
are two basic methods of factor analysis: exploratory and confirmatory factor analysis (Çokluk, Şekercioğlu, & Bu yu köztu rk, 2012).

Defining The Psychometric Properties Of The Writing Sensitivity Scale And
Analysing Writing Sensitivity With Regard To Different Variables
International Journal of Language Academy
Volume 2/3 Autumn 2014 p. 283/301
289
There is no consensus in the literature regarding what the cut-off point should be in terms of the factor loading in EFA. According to Kline (1994), factor loading is a coefficient that explains the relationship of the items to the factor. Factor loadings are supposed to be high for the factors that the items belong to. If there is a cluster formed by the items with a high level of relationship to a factor, this finding means that those items measure the relevant construct together. According to Tabachnick and Fidell (2001), the decision to identify the cut-off point for the size of the loadings in order to evaluate factor loadings is based on the researcher’s preferences. As a fundamental principle, it is
essential for the loading of each variable to be at least .32 and higher. In this regard, if factor loading is .45, the relationship of that item to the relevant factor can be considered “fair” since 20% of the variance is explained. According to Stevens (1992) and Kim-Yin (2004), the significance of factor loadings is based on sample size. As the sample size increases, the cut-off point for the loading decreases; however, a loading of .40 and higher is generally recommended (as cited in Field, 2005; as cited in Şencan, 2005). Therefore, in the present study, it was decided to define the acceptance level as
.45 for factor loadings of the items in EFA. For additional evidence associated with construct validity, confirmatory factor analysis (CFA) was carried out to find out whether the single factor construct of the WSS acknowledged as a result of EFA was confirmed as a model. CFA is an analysis used to test whether a previously defined and limited construct is verified as a model. Moreover, this analysis is sometimes used to refer to the verification of a theoretical construct or model (Maruyama, 1998). In this respect, CFA is utilized to evaluate construct validity (Floyd & Widaman, 1995; Kline, 2005). In addition, Stapleton (1997) refers to CFA as a considerably stronger method used to reveal empirical evidence of construct validity, beyond this identification. Hence, as a result of the CFA, the relevant model is based on a strong theoretical or empirical foundation (Raykov & Marcoulides, 2008; Stevens, 1996). Furthermore, Cronbach’s Alpha coefficient was calculated with the scores obtained through the WSS in order to gather evidence of reliability in terms of internal consistency. In order to determine whether the data gathered through the pilot study and the main study were normally distributed, measures of central tendency and coefficients of skewness and kurtosis were calculated and histograms were drawn in line with the assumptions of EFA and CFA. As a result of the analyses, the distributions in both studies were found near symmetrical. In addition, no multicollinearity problem was detected between the items. Moreover, two-factor analysis of variance was carried out in order to answer the last five research questions. The significance level was set at .05 for all the analyses.
Lastly, for the hypothesis tests in which grade point average was addressed as an independent variable, the relevant variable was turned into a dummy discrete variable. In this process, mean plus one standard deviation and mean minus one standard deviation were defined as cut-off points. As the mean of grade point averages was 2.76 and the standard deviation was .41, the students that obtained a score of 3.17 and higher were defined as the upper group (with a high level of writing sensitivity) and the ones who got a score of 2.35 and lower were defined as the lower group (with a low level of writing sensitivity).
Findings Exploratory factor analysis (EFA) was carried out to obtain evidence of construct validity with the scores gathered through the WSS. In order to test the suitability of the sample size for factoring before conducting EFA, Kaiser-Meyer-Olkin (KMO) test was carried out. As a result of the analyses, KMO values were calculated as .93 for the data set used in the pilot study, and as .95 for the data set used in the main study. The findings about factor loadings of the items reached through the analyses of the
data belonging to the pilot study and the main study are provided in Table 2.

Nihat BAYAT & Güçlü ŞEKERCİOĞLU
International Journal of Language Academy
Volume 2/3 Autumn 2014 p. 283/301
290
290
Table 2: Factor Loadings of the Items in the Pilot Study and the Main Study1
Items PS2 MS3
2 2
1. I develop a thesis (main idea) before starting to write a text. .56 .58 2. While developing the text, I follow a specific sequence of stages
(e.g. identifying the problem, making suggestions, discussing ideas, and so on).
.51 .59
3. I pay attention to the organization of the texts, i.e. relationship between sentences and paragraphs, I read in order to use in my writings.
.55 .59
4. I research before starting to write. .54 .58 5. I organize ideas in a certain way to express the views the way I
aim for them to be perceived.
.57 .65
6. I develop the text by taking into account the reader’s level of comprehension.
.52 .62
7. I make an effort for the text I’m writing to be better than the ones I wrote before.
.53 .62
8. I avoid the details that may cause me to get off the topic I discuss in the text.
.57 .59
9. I decide on which aspect of the topic I will discuss while writing (e.g. violence against women while writing on women’s issues).
.53 .65
10. I try to give original information about the topic I write on. .47 .59 11. I present the ideas that I put forward in writing along with their
justifications. .56 .62
12. I remove the expressions that contradict the main idea in writing. .48 .61 13. I pay attention to whether the title covers the text I have written. .59 .62 14. I compare the text I have written with the other texts addressing
similar topics. .49 .48
15. In the conclusion part, I wrap up the ideas that I discuss throughout the text and conclude.
.49 .67
16. I make a new paragraph when I move on to a different aspect of the topic while writing.
.48 .60
17. After I finish the text, I read it again to check spelling mistakes. .57 .59 18. While writing, I often go back and read the text to see if it is what
I would like it to be. .49 .52
19. In the conclusion part, I refer to the thesis statement (main idea). .46 .64 20. While writing, I pay attention to spelling rules. .59 .63 21. I pay attention to making sure that the topic I discuss has unity
between paragraphs. .63 .71
22. While writing, I pay attention to using punctuation marks correctly.
.62 .64
23. While writing, I choose words that are appropriate for the reader’s
age and education level.
.54 .62
24. Before writing the text, I consider how to present my thesis. .49 .68 25. If there are expressions with the same meaning in different parts
of the text, I change (remove/correct) them. .57 .59
26. While writing the text, I pay attention to subject-verb agreement
in sentences.
.52 .66
27. I make an effort to write the conclusion part effectively in order for the main idea to make a lasting impact on the reader.
.50 .73
28. If I think that the meaning of a sentence will not be understood, I .51 .61
Defining The Psychometric Properties Of The Writing Sensitivity Scale And
Analysing Writing Sensitivity With Regard To Different Variables
International Journal of Language Academy
Volume 2/3 Autumn 2014 p. 283/301
291
change it. 29. I check whether the text has the characteristics of its type (e.g.
essay, story, article, etc.). .64 .64
30. I pay attention to using appropriate conjunctions in order to reflect the relationship between ideas clearly.
.61 .67
31. While writing the text, I choose a style that is appropriate for general characteristics of the reader.
.54 .65
32. I pay attention to having a logical link among the sentences in the text.
.60 .75
33. If another person/institution has given the topic of the text I will write on, I pay attention to staying on that topic.
.46 .55
34. I use language that is appropriate for the type of the text (essay, story, article, etc.).
.70 .68
35. While writing, I check whether there is unity between successive sentences.
.71 .72
36. When we prepare a text as a group, I pay attention to getting everybody’s ideas reflected in the text.
.54 .60
37. I check the text I have written in terms of its tone (styles with a psychological effect such as didactic, dignifying, insulting styles).
.57 .57
1 Factor loadings were obtained as result of the EFA conducted after the application of Turkish form of the WSS. 2 Pilot study 3 Main study.
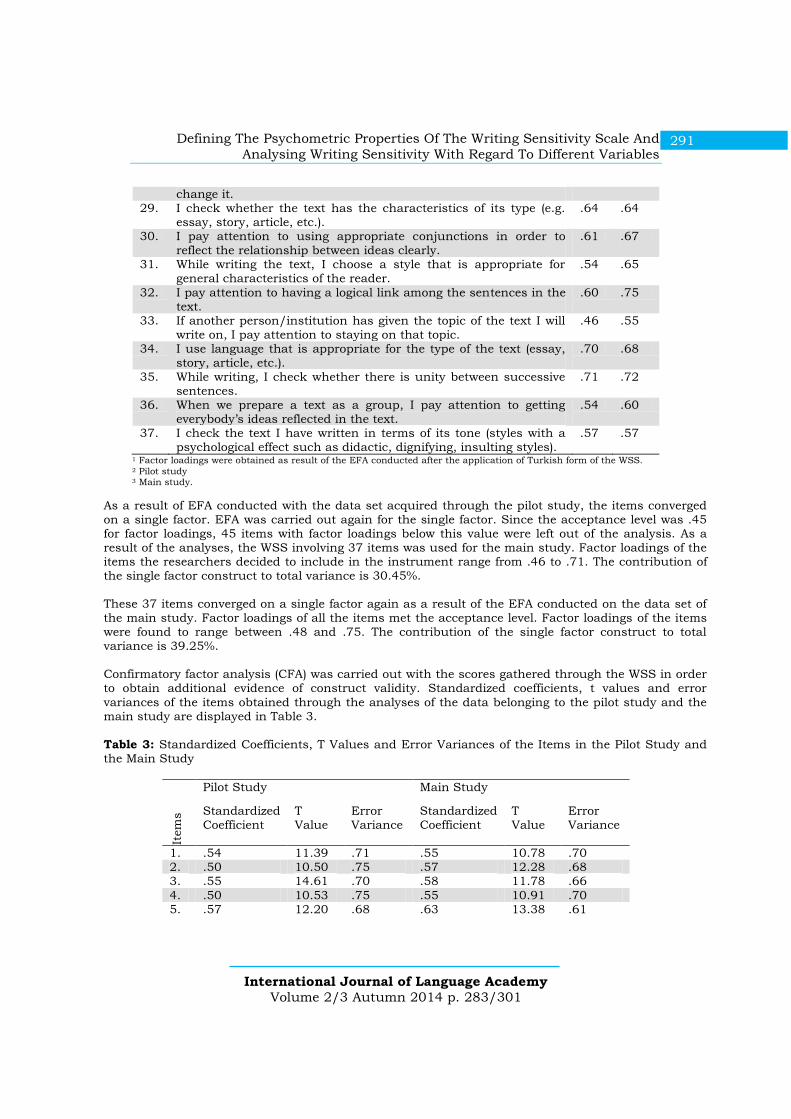
As a result of EFA conducted with the data set acquired through the pilot study, the items converged on a single factor. EFA was carried out again for the single factor. Since the acceptance level was .45 for factor loadings, 45 items with factor loadings below this value were left out of the analysis. As a result of the analyses, the WSS involving 37 items was used for the main study. Factor loadings of the items the researchers decided to include in the instrument range from .46 to .71. The contribution of the single factor construct to total variance is 30.45%. These 37 items converged on a single factor again as a result of the EFA conducted on the data set of the main study. Factor loadings of all the items met the acceptance level. Factor loadings of the items were found to range between .48 and .75. The contribution of the single factor construct to total variance is 39.25%. Confirmatory factor analysis (CFA) was carried out with the scores gathered through the WSS in order to obtain additional evidence of construct validity. Standardized coefficients, t values and error
variances of the items obtained through the analyses of the data belonging to the pilot study and the main study are displayed in Table 3.
Table 3: Standardized Coefficients, T Values and Error Variances of the Items in the Pilot Study and the Main Study
Item
s
Pilot Study Main Study
Standardized Coefficient
T Value
Error Variance
Standardized Coefficient
T Value
Error Variance
1. .54 11.39 .71 .55 10.78 .70 2. .50 10.50 .75 .57 12.28 .68
3. .55 14.61 .70 .58 11.78 .66
4. .50 10.53 .75 .55 10.91 .70 5. .57 12.20 .68 .63 13.38 .61

Nihat BAYAT & Güçlü ŞEKERCİOĞLU
International Journal of Language Academy
Volume 2/3 Autumn 2014 p. 283/301
292
292
6. .50 10.84 .75 .60 12.57 .64 7. .54 12.54 .70 .61 14.10 .63 8. .57 13.13 .68 .59 14.94 .65 9. .49 10.17 .76 .65 15.59 .58 10. .46 9.09 .79 .57 11.65 .67 11. .52 10.20 .73 .61 12.60 .63 12. .47 9.89 .78 .61 14.90 .63
13. .58 12.44 .66 .62 14.47 .61 14. .46 10.21 .78 .46 9.93 .78 15. .52 10.51 .73 .66 14.54 .57 16. .50 10.60 .75 .61 14.24 .63 17. .57 13.82 .68 .58 12.93 .67 18. .48 10.95 .77 .52 11.08 .73
19. .43 8.81 .81 .64 15.51 .60 20. .57 12.09 .67 .59 11.87 .65 21. .66 17.63 .56 .70 16.42 .51 22. .56 12.49 .68 .62 13.85 .61 23. .52 11.31 .73 .59 13.21 .65 24. .50 10.39 .75 .67 14.94 .55 25. .58 13.97 .66 .59 13.58 .65 26. .53 11.64 .72 .65 15.28 .58 27. .53 12.22 .72 .72 17.09 .48 28. .53 10.58 .72 .60 13.12 .65 29. .61 12.87 .63 .63 13.90 .60 30. .60 12.32 .64 .66 15.13 .56 31. .54 11.17 .71 .62 14.03 .61 32. .62 13.27 .61 .74 17.99 .45 33. .50 9.96 .75 .55 11.64 .70 34. .69 17.21 .52 .68 16.20 .54 35. .69 15.46 .53 .72 17.03 .49 36. .57 12.07 .68 .59 13.85 .65 37. .57 11.84 .67 .55 11.05 .70
As a result of the CFA carried out with the data set belonging to the pilot study, standardized coefficients of the items with significant t values to explain the latent variable ranged between .43 and .69, and error variances of these items ranged between 52. and 81. By means of CFA, fit indices were
calculated as 2(627)=1576.94, p=.000, 2/sd=2.52, RMSEA=.062, NNFI=.96 and SRMR=.061. As for the results of CFA conducted with the data gathered from the main study, standardized
coefficients of the items with significant t values to explain the latent variable ranged between .46 and .74, while error variances of these items ranged between .45 and .78. When the modification suggestions were examined, it was decided to make three modifications. In this regard, the correlations between error variances of the 1st and 2nd items; 20th and 22nd items; and lastly 23rd and
31st items were fixed. These modifications contributed significantly to 2, p=.000. As a result of CFA, fit
indices were calculated as 2(626)=1297.96, p=.000, 2/sd=2.07, RMSEA=.054, NNFI=.98 and
SRMR=.051. Cronbach’s Alpha coefficient was calculated to determine the internal consistency coefficient of the single-factor WSS for the pilot study and the main study. Alpha coefficient was calculated to be .93 for the data gathered from the pilot study, and .96 for the data reached through the main study.

Defining The Psychometric Properties Of The Writing Sensitivity Scale And
Analysing Writing Sensitivity With Regard To Different Variables
International Journal of Language Academy
Volume 2/3 Autumn 2014 p. 283/301
293
Two-factor analysis of variance was carried out to find out whether preservice Turkish language teachers’ writing sensitivity significantly differed according to sex and grade point average (high and low). The findings obtained through the analysis are illustrated in Table 4.
Table 4: Common Effect of the Variables of Sex and Grade Point Average (GPA) on Writing Sensitivity
Source of Variance
Sum of Squares
sd Sum of Squares
F p 2
Sex 262.405 1 262.405 .787 .377 – GPA 5881.241 1 5881.241 17.648 .000 .138 Sex x GPA 2757.482 1 2757.482 8.274 .005 .070 Error 36658.149 110 333.256 Total 2701379 114
As can be seen in Table 4, common effect of sex and grade point average is significant, F(1,114)=8.274,
p=.005, 2=.070. According to the result of multiple comparison test (Tukey) that was carried out to
determine the source of the difference, writing sensitivity of males that took part in the lower group in
terms of grade point average ( =139.42) is lower than that of females in the upper group ( =158.35),
that of males in the upper group ( =165.75), and that of females in the lower group ( =153.42). The
effect size of the relevant difference was found to be “medium” (Cohen, Manion, & Morrison, 2007). When the main effect of sex was analyzed, it was seen that the difference between the mean scores was not significant, F(1,114)=.787, p=.377. In addition, when the main effect of grade point average was examined, it was found that writing sensitivity of the groups with a high and low grade point
average significantly differed from each other, F(1,114)=17.648, p=.000, 2=.138. In this respect,
writing sensitivity of the participants of the upper group in terms of grade point average ( =160.28) is
higher than that of the participants belonging to the lower group ( =144.88). The effect size of the
relevant difference is “large”. Two-factor analysis of variance was conducted to determine whether the participants’ writing sensitivity significantly differed according to sex and class level. The findings obtained through the analysis are shown in Table 5.
Table 5: Common Effect of the Variables of Sex and Class Level on Writing Sensitivity
Source of Variance
Sum of Squares
sd Sum of Squares
F p 2
Sex 1744.406 1 1744.406 5.241 .023 .014 Class Level 3639.582 3 1213.194 3.645 .013 .030 Sex x Class Level 5511.031 3 1837.010 5.519 .001 .044 Error 118818.875 357 332.826 Total 8626074 365
As is clear from Table 5, common effect of sex and class level is significant, F(3,365)=5.519, p=.001,
2=.044. According to the result of multiple comparison test (Dunnett’s C) that was performed to
determine the source of the difference, second-year male students’ writing sensitivity ( =137.75) is
lower than that of second-year female students ( =154.87) and that of third-year female students
( =158.76). Moreover, fourth-year female students’ writing sensitivity ( =149.46) is lower than that of
third-year female students ( =158.76). The effect size of the relevant difference is “medium”. Following
the analysis of the main effect of class level, it was observed that the difference between mean scores
was significant, F(3,365)=3.645, p=.013, 2=.030. However, the relevant difference was not considered
to be remarkable in practical terms since the effect size was small.

Nihat BAYAT & Güçlü ŞEKERCİOĞLU
International Journal of Language Academy
Volume 2/3 Autumn 2014 p. 283/301
294
294
Two-factor analysis of variance was carried out to reveal whether the participants’ writing sensitivity significantly differed according to sex and frequency of writing. The findings gathered through the analysis are given in Table 6.
Table 6: Common Effect of the Variables of Sex and Frequency of Writing on Writing Sensitivity
Source of Variance
Sum of Squares
sd Sum of Squares
F p 2
Sex 2236.275 1 2236.275 6.726 .010 .019 Writing 10147.281 3 3382.427 10.173 .000 .079 Sex x Writing 694.606 3 231.535 .696 .555 – Error 118368.812 356 332.497 Total 8573737 364
As displayed in Table 6, common effect of sex and frequency of writing is not significant, F(3,364)=.696, p=.555. On the other hand, when the main effect of frequency of writing was examined, it was seen that the difference between the mean scores was significant, F(3,364)=10.173, p=.000,
2=.079. In this regard, writing sensitivity of the participants who write once a week ( =159.62) is
higher than that of the participants writing once every six months ( =145.56) and that of the
participants writing once a year ( =144.54). Furthermore, writing sensitivity of the participants who
write once a month ( =154.22) is higher than that of the participants writing once every six months
( =145.56) and that of the participants writing once a year ( =144.54). The effect size of the
aforementioned difference is “medium”. Two-factor analysis of variance was conducted to determine whether the participants’ writing sensitivity significantly differed according to frequency of writing and reading books. The findings obtained through the analysis are provided in Table 7.
Table 7: Common Effect of the Variables of Frequency of Writing and Reading Books on Writing Sensitivity
Source of Variance
Sum of Squares
sd Sum of Squares
F p 2
Writing 2891.431 3 963.810 2.781 .041 .023 Reading books 296.385 3 98.795 .285 .836 – Writing x Reading books 2916.586 7 416.655 1.202 .301 – Error 121991.373 352 346.566 Total 8633339 366
As exhibited in Table 7, common effect of frequency of writing and reading books is not significant, F(7,366)=1.202, p=.301. When the main effect of frequency of reading books was analyzed, it was observed that the difference between the mean scores was not significant, F(3,366)=.285, p=.836.
Lastly, two-factor analysis of variance was carried out to ascertain whether the participants’ writing sensitivity significantly differed according to frequency of writing and grade point average (high and low). The findings reached through the analyses are demonstrated in Table 8.

Defining The Psychometric Properties Of The Writing Sensitivity Scale And
Analysing Writing Sensitivity With Regard To Different Variables
International Journal of Language Academy
Volume 2/3 Autumn 2014 p. 283/301
295
Table 8: Common Effect of the Variables of Frequency of Writing and Grade Point Average (GPA) on Writing Sensitivity
Source of
Variance
Sum of
Squares sd Sum of
Squares F p 2
Writing 3688.519 3 1229.506 3.683 .014 .093 GPA 3502.102 1 3502.102 10.492 .002 .089 Writing x GPA 734.494 3 244.831 .733 .534 – Error 36050.086 108 333.797 Total 2756340 116
As can be seen in Table 8, common effect of frequency of writing and grade point average is not significant, F(3,116)=.733, p=.534.
Discussion and Conclusion Psychological characteristics are abstract or latent rather than concrete and observable, and these are called “construct” (Nunnaly & Bernstein, 1994). These latent structures are referred to as “construct” or “factor” (Kline, 2005). In this regard, one of the most important aspects of the validity of the scores obtained through psychological measurement tools is construct validity. It was discussed in the test standards report published in 1954 that the concept of validity should be integrated under the umbrella term “construct validity” (Cronbach & Meehl, 1955; Jonson & Plake, 1998; Şencan, 2005;
Urbina, 2004; Westen & Rosenthal, 2005). In addition, Kline (2000) states that construct validity covers the other approaches about validity, and that all kinds of validity are related to the evaluation of construct validity. In this respect, other kinds of validity can be used to evaluate the construct validity involving experimental manipulations of some variables in order to see whether estimation methods of test scores change. One of the most frequently used techniques to obtain evidence of construct validity for studies of scale development and adaptation in behavioral sciences is factor analysis. Thus, findings of EFA and CFA are addressed as empirical evidence regarding psychometric properties of the WSS. Initially, as KMO values of the data sets gathered from both the pilot study and the main study are above .90, the sample size can be considered adequate for factoring. According to Leech, Barrett and Morgan (2005), if KMO is between .90 and 1.00, it is possible to define the data set as “excellent” for factoring.
Within the scope of the single-factor construct of the WSS that came out as a result of EFA, factor loadings of the items can be called “good, very good and excellent” as they have loadings of .55 and higher except for two items (Tabachnick & Fidell, 2001). Another point to consider about the results of the analyses is that the EFA findings belonging to the main study are better than those of the pilot study. For instance, factor loadings of 33 items increased in EFA findings of the main study, and this increase ranged between .01 and .23. On the other hand, two items’ factor loadings did not change, and two items’ factor loadings got lower compared to the pilot study. In addition, total variance explained was 30.45% in the pilot study, and this value increased to 39.25% in the main study. Gorsuch (1974) notes that the magnitude of the proportion of variance explained indicates the strength of the factor structure of the scale developed. A value of 30% and higher can be considered adequate for variance explained with single factor scales (Büyüköztürk, 2014). As a result of the CFA that was conducted to obtain additional evidence of construct validity, it was
observed that fit indices generally met the acceptance level. In the literature, the ratio 2/sd being
below 3 in large samples is called “perfect fit”; a RMSEA below .08 is referred to as “good fit”; a SRMR below .08 is considered “good fit”; and lastly, a NNFI above .95 is called “perfect fit” (Brown, 2006; Hooper, Coughlan, & Mullen, 2008; Hu & Bentler, 1999; Jöreskog & Sörbom, 1993; Kline, 2005). When CFA findings gathered through both the pilot study and the main study are evaluated, we can

Nihat BAYAT & Güçlü ŞEKERCİOĞLU
International Journal of Language Academy
Volume 2/3 Autumn 2014 p. 283/301
296
296
state that single factor structure of the WSS is verified since fit indices generally meet the acceptance level. In addition, the fact that the single factor structure verified in the pilot study is also confirmed with the data gathered from another group with similar characteristics strengthens the evidence of construct validity.
Moreover, according to Nunnaly and Bernstein (1994), a reliability coefficient of .70–.80 can be considered adequate for research studies. In this regard, as internal consistency coefficient is above .90 in both the pilot study and the main study, reliability of the scores obtained through the WSS in
terms of internal consistency can be called high.
When the results associated with the first aim are examined, validity and reliability of the scores gathered through the WSS can be considered high.
Two-factor analysis of variance was carried out for the research questions relating to the second aim of the study. Initially, it was found that common effect of the variables of sex and grade point average on writing sensitivity was significant, that the main effect of grade point average on writing sensitivity was significant, but that sex was not significant on its own. The fact that sex and grade point average were significant together indicates that sex can only be evaluated along with academic achievement in terms of writing sensitivity. In this respect, it is a remarkable point that while the main effect of being female or male is not significant by itself, males with low academic achievement have a lower level of writing sensitivity compared to females with low academic achievement as well as females and males with high academic achievement. Whereas many studies on writing (Tüfekçioğlu, 2010; Karasakaloğlu & Saracaloğlu, 2009; Ceran, 2013; Aşılıoğlu & Özkan, 2013) point out sex difference, it was observed in the present study that males with high academic achievement had the same level of writing sensitivity as females. Therefore, academic achievement might be an important factor for writing sensitivity. In this respect, it is recommended that studies of writing achievement not neglect levels of academic achievement but take them into account as a variable for analyses. In addition, several studies (Baş & Şahin, 2012; Yıldız & Büyükkasap, 2011) reached the result that academic achievement by itself affected writing positively. It was found in the present study that common effect of the variables of sex and class level on writing sensitivity was significant. Writing sensitivity increased in the second and third year at the department of Turkish Language Teaching. This increase is thought to result from concentrating on academic topics. There are many courses related to writing until the third year at the department. These courses do not appear in the fourth year. Moreover, in Turkish education system, preservice teachers’ getting away from academic topics in the fourth year due to courses like school experience and preparation
for various exams may have decreased their writing sensitivity. Findings of the present study indicate that the main effect of frequency of writing on writing sensitivity is significant. Frequency of writing reflects the participants’ levels of writing experience. It is not surprising that the ones who frequently write develop sensitivity toward writing.
Furthermore, it was found that common effect of the variables of sex and frequency of writing on writing sensitivity was not significant, that common effect of frequency of writing and reading books on writing sensitivity was not significant, and lastly that common effect of the variables of frequency of writing and grade point average on writing sensitivity was not significant.
When the results related to the second aim are analyzed, it is seen that writing sensitivity of females, and males with high academic achievement are higher than males with low academic achievement,
that preservice Turkish language teachers’ writing sensitivity increases in the second and third year in favor of females, and that frequency of writing increases writing sensitivity. Writing sensitivity is a kind of reaction that might come out after the completion of the process of getting knowledgeable about

Defining The Psychometric Properties Of The Writing Sensitivity Scale And
Analysing Writing Sensitivity With Regard To Different Variables
International Journal of Language Academy
Volume 2/3 Autumn 2014 p. 283/301
297
writing. The fact that preservice Turkish language teachers’ writing sensitivity increases to a certain extent along with their academic development is related to this.
The writing sensitivity scale developed through this study can be used to determine writing sensitivity of university students studying at language and literature departments and different fields of social sciences, who are supposed to perform above a certain level in writing. In addition, developing the psychometric properties of the scale by administering it to students studying at departments apart from Turkish language teaching might yield more beneficial results.
References
Aşılıoğlu, B. ve Özkan, E. (2013). Ortaokul öğrencilerinin yazma kaygılarının bazı değişkenler açısından incelenmesi: Diyarbakır örneği. International Journal of Social Science (IASSS), 6(6),
83-111. Badger, R., & White, G. (2000). A process genre approach to teaching writing. ELT Journal, 54/2, 153-
160. Baş, G. ve Şahin, C. (2012). İlköğretim 6. 7. ve 8. sınıf öğrencilerinin okuma tutumları ve yazma
eğilimleri ile Türkçe dersindeki akademik başarıları arasındaki ilişki. Turkish Studies-International Periodical For The Languages, Literature and History of Turkish or Turkic, 7/3, 555-572.
Brown, T. A. (2006). Confirmatory factor analysis for applied research. (First Edition). NewYork:
Guilford Publications, Inc.
Büyüköztürk, Ş. (2014). Sosyal bilimler için veri analizi el kitabı: İstatistik, araştırma deseni, SPSS
uygulamaları ve yorum. (On Dokuzuncu Baskı). Ankara: Pegem Yayıncılık. Ceran, D. (2013). Türkçe öğretmeni adaylarının yazma eğitimi dersine yönelik tutumlarının
değerlendirilmesi. Turkish Studies - International Periodical For The Languages, Literature and History of Turkish or Turkic, 8/1, 1151-1169.
Cronbach, L. J. & Meehl, P. E. (1955). Construct validity in psychological tests. Psychological Bulletin.
52, 281–302. Cohen, L., Manion, L. & Morrison, K. (2007). Research methods in education. (Sixth Edition). NewYork:
Routledge. Çokluk, Ö., Şekercioğlu, G. ve Büyüköztürk, Ş. (2012). Sosyal bilimler için çok değişkenli istatistik:
SPSS ve LISREL uygulamaları. (2. Baskı). Ankara: Pegem Akademi. Field, A. (2005). Discovering statistics using SPSS. (Second Edition). Thousand Oaks, California: Sage
Publications, Inc. Flower, L., & Hayes, J. R. (1981). A cognitive process theory of writing. College Composition and
Communication, 32(4), 365-387. Floyd, F. J. & Widaman, K. F. (1995). Factor analysis in the development and refinement of clinical
assessment instruments. Psychological Assessment, 7 (3), 286–299.
Grabe, W. ve Kaplan, R.B. (1996). Theory and Practice of Writing. London: Longman.
Nihat BAYAT & Güçlü ŞEKERCİOĞLU
International Journal of Language Academy
Volume 2/3 Autumn 2014 p. 283/301
298
298
Gracia, J.J.E. (1995). A Theory of Textuality: The Logic and Epistemology. Albany: State University of New York Press.
Graham, S. (2006). Strategy instruction and the teaching of writing: A meta-analysis. In C. A.
MacArthur, S. Graham, & J. Fitzgerald (Eds.), Handbook of writing research. New York, NY:
The Guilford Press. Güneş, F. (2007). Türkçe Öğretimi ve Zihinsel Yapılandırma. Ankara: Nobel Yayınları. Hayes, J. R. (1996). A new framework for understanding cognition and affect in writing. In C. M. Levy
& S. Ransdell (Eds.), The science of writing: Theories, methods, individual differences, and applications (pp. 1-27). Mahwah, NJ: Lawrence Erlbaum.
Hiemstra, R., & Brier, M.E. (1994). Professional Writing. Florida: Krieger Publishing Company. Hooper, D., Coughlan, J. & Mullen, M. (2008). Structural equation modeling: Guidelines for
determining model fit. The Electronic Journal of Business Research Methods, 6 (1), 53-60. Hu, L. & Bentler, P. M. (1999). Cut off criteria for fit indexes in covariance structure analysis:
Conventional criteria versus new alternatives. Structural Equation Modeling, 6, 1–55.
Jonson, J. L. & Plake, B. S. (1998). A historical comparison of validity standarts and validity practices.
Educational and Psychological Measurement. 58 (5), 736–754. Jöreskog, G. K. & Sörbom, D. (1993). LISREL 8: Structural equation modeling with the SIMPLIS
command language. Lincolnwood: Scientific Software International, Inc. Karasakaloğlu, N. ve Saracaloğlu, A.S. (2009). Sınıf öğretmeni adaylarının Türkçe derslerine yönelik
tutumları, akademik benlik tasarımları ile başarıları arasındaki ilişki. Yüzüncü Yıl University Eğitim Fakültesi Dergisi, 6(1), 343-362.
Kavcar, C., Oğuzkan, F. ve Aksoy, Ö. (2002). Yazılı ve Sözlü Anlatım. Ankara: Anı Yayıcılık.
Keçik, İ ve Uzun, L. (2003). Türkçe Sözlü ve Yazılı Anlatım, Eskişehir: Anadolu University Yayınları. Kellog, R.T. (1994). The Psychology of Writing. New York: Oxford Unıversıty Press. Kline, P. (1994). An easy guide to factor analysis. NewYork: Routledge. Kline, R. B. (2005). Principles and practice of structural equation modeling. (Second Edition). NewYork:
Guilford Publications, Inc. Leech, N. L., Barrett, K. C. & Morgan, G. A. (2005). SPSS for intermediate statistics: Use and
interpretation. (Second Edition). New Jersey: Lawrence Erlbaum Associates, Inc. Maruyama, G. M. (1998). Basics of structural equation modeling. (First Edition). Thousand Oaks,
California: Sage Publications, Inc.
McCurdy, M., Schmitz, S., & Albertson, A. (2010). Evidence-Based written language instruction:
Developing and implementing written language programs at the core, supplemental, and intervention levels. in Practical Handbook of School Psychology, Eds. Gretchen Gimpel Peacock,

Defining The Psychometric Properties Of The Writing Sensitivity Scale And
Analysing Writing Sensitivity With Regard To Different Variables
International Journal of Language Academy
Volume 2/3 Autumn 2014 p. 283/301
299
Ruth A. Ervin, Edward J. Daly, Kenneth W. Merrell. pp. 300-318.New York: The Guilford Press.
Nunnaly, J. C. & Bernstein, I. H. (1994). Psychometric theory. (Third Edition). NewYork: McGraw-Hill,
Inc.
Oral, G. (2003). Yine Yazı Yazıyoruz -Okulda/İşyerinde/Evde Kullanılabilecek Yaratıcı Yazı Etkinlikleri
ve Kuramsal Temelleri. Ankara: Pegem A Yayıncılık.
Pincas, A. (1982). Teaching English Writing. London: Macmillan. Raykov, T. & Marcoulides, G. A. (2008) An introduction to applied multivariate analysis. (First Edition).
NewYork: Taylor & Francis Group.
Sever, S.(1991). Dil ve edebiyat öğretiminde yaratıcılık. Eğitimde Nitelik Geliştirme/ Eğitimde Arayışlar
1. Sempozyumu Bildiri Metinleri. s.371-374. İstanbul: Kültür Koleji Yayınları.
Stapleton, C. D. (1997). Basic concepts and procedures of confirmatory factor analysis. Austin: The
Annual Meeting of the Southwest Educational Research Association. Stevens, J. (1996). Applied multivariate statistics for social sciences. (Third Edition). New Jersey:
Lawrence Erlbaum Associates, Inc. Şencan, H. (2005). Sosyal ve davranışsal ölçümlerde geçerlilik ve güvenilirlik. (Birinci Baskı). Ankara:
Seçkin Yayınları. Tabachnick, G. B. & Fidell, L. S. (2001). Using multivariate statistics. (Fourt Edition). Needham
Heights: Allyn & Bacon, Inc. Tribble, C. (1996). Writing. Oxford: Oxford University Press. Tüfekçioğlu, B. (2010). Yazma becerisinin bazı değişkenler açısından incelenmesi. Dil Dergisi, 149, 30-
45. Urbina, S. (2004). Essentials of psychological testing. (First Edition). New Jersey: Wiley & Sons, Inc.
Westen, D. & Rosenthal, R. (2005). Improving construct validity: Cronbach, Meehl, and Neurath’s
Ship. Psychological Assessment. 17 (4), 409–412. Yıldız, A. ve Büyükkasap, E. (2011). Öğretmen adaylarının belirsizlik ilkesini anlama düzeyleri ve
öğrenme amaçlı yazmanın akademik başarıya etkisi. Türk Fen Eğitimi Dergisi, 8(4), 134-148.

Nihat BAYAT & Güçlü ŞEKERCİOĞLU
International Journal of Language Academy
Volume 2/3 Autumn 2014 p. 283/301
300
300
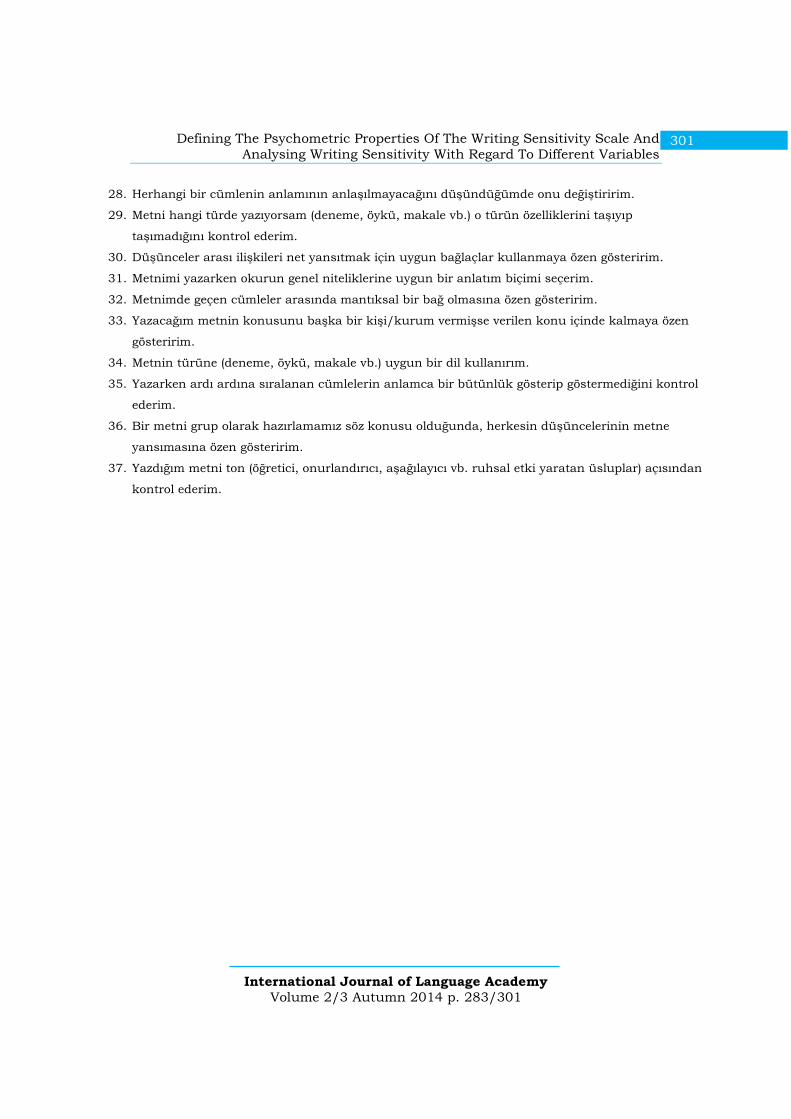
Appendix Writing Sensitivity Scale (Turkish Form)
1. Metnimi yazmaya başlamadan önce bir tez (ana fikir) belirlerim.
2. Metnimi oluştururken anlatımda belli bir sıra (sorunu belirleme, öneride bulunma, tartışma gibi)
izlerim.
3. Yazılarımda kullanmak için okuduğum metinlerin kurgusuna (cümleler ve paragraflar arası
ilişkiler) dikkat ederim.
4. Yazmaya başlamadan önce iyi bir araştırma yaparım.
5. Metnin bütününde düşüncenin istediğim gibi algılanmasını sağlayacak bir anlatım sırası
oluştururum.
6. Metnimi okurun kavrama düzeyini dikkate alarak oluştururum.
7. Yazdığım metnin daha önce yazdıklarımdan daha iyi olması için çaba harcarım.
8. Metnimde ele aldığım konudan uzaklaşmama neden olacak ayrıntılardan kaçınırım.
9. Yazarken konunun hangi boyutunu (örneğin, kadın sorunları ile ilgili yazı yazarken kadına
yönelik şiddet vb.) ele alacağıma karar veririm.
10. Yazdığım konuya ilişkin özgün bilgiler vermeye çalışırım.
11. Yazıda ileri sürdüğüm düşünceleri dayanaklarıyla veririm.
12. Yazdığım yazıda ana düşünce ile çelişen ifadeleri çıkarırım.
13. Başlığımın yazdığım metni kapsayıp kapsamadığına dikkat ederim.
14. Yazdığım metni benzer konuları işleyen diğer metinlerle karşılaştırırım.
15. Yazının sonuç bölümünde, metin boyunca ele aldığım fikirleri toparlayarak bir sonuca bağlarım.
16. Yazarken konunun farklı bir boyutuna geçtiğimde yeni bir paragraf oluştururum.
17. Metnimi bitirdikten sonra yazım hatalarını denetlemek için yeniden okurum.
18. Yazı yazarken istediğim gibi olup olmadığını anlamak için sık sık dönüp okurum.
19. Metnin sonuç bölümünde tez cümleme (ana fikir) göndermede bulunurum.
20. Yazarken yazım kurallarına özen gösteririm.
21. Ele aldığım konunun paragraflar arasında bir bütünlük göstermesine özen gösteririm.
22. Yazarken noktalama işaretlerini doğru kullanmaya özen gösteririm.
23. Yazarken okurun yaş ve eğitim düzeyine uygun sözcükler seçerim.
24. Metnimi yazmadan önce tezimi nasıl savunacağım üzerine düşünürüm.
25. Metnin farklı yerlerinde aynı anlama gelen ifadeler varsa bunu değiştiririm (çıkarırım/düzeltirim).
26. Metnimi yazarken kurduğum cümlelerde özne-yüklem uyumuna dikkat ederim.
27. Ana fikri okurun zihninde kalıcı kılmak için, sonuç bölümünü etkili bir biçimde yazmaya çaba
gösteririm.
Defining The Psychometric Properties Of The Writing Sensitivity Scale And
Analysing Writing Sensitivity With Regard To Different Variables
International Journal of Language Academy
Volume 2/3 Autumn 2014 p. 283/301
301
28. Herhangi bir cümlenin anlamının anlaşılmayacağını düşündüğümde onu değiştiririm.
29. Metni hangi türde yazıyorsam (deneme, öykü, makale vb.) o türün özelliklerini taşıyıp
taşımadığını kontrol ederim.
30. Düşünceler arası ilişkileri net yansıtmak için uygun bağlaçlar kullanmaya özen gösteririm.
31. Metnimi yazarken okurun genel niteliklerine uygun bir anlatım biçimi seçerim.
32. Metnimde geçen cümleler arasında mantıksal bir bağ olmasına özen gösteririm.
33. Yazacağım metnin konusunu başka bir kişi/kurum vermişse verilen konu içinde kalmaya özen
gösteririm.
34. Metnin türüne (deneme, öykü, makale vb.) uygun bir dil kullanırım.
35. Yazarken ardı ardına sıralanan cümlelerin anlamca bir bütünlük gösterip göstermediğini kontrol
ederim.
36. Bir metni grup olarak hazırlamamız söz konusu olduğunda, herkesin düşüncelerinin metne
yansımasına özen gösteririm.
37. Yazdığım metni ton (öğretici, onurlandırıcı, aşağılayıcı vb. ruhsal etki yaratan üsluplar) açısından
kontrol ederim.