Embed Size (px)
Citation preview
Defining how aging Pseudotsuga and Abies compensate formultiple stresses through multi-criteria assessment of afunctional-structural model
MAUREEN c. KENNEDY,1,2,3 E, DAVID FORD4 and THOMAS M, HINCKLEY4
the morphological contrast may relate to physiological pro-cesses. Our results show that multi-criteria optimization withPareto optimality has promise to advance the use of modelsin theory development and in exploration of functional~structural trade-offs, particularly in complex biological sys-tems with multiple limiting factors.
Keywords: age-related decline, carbon limitation, hydrauliclimitation, Pareto optimality, reiteration.
Introduction
There is considerable interest in understanding the physiologyof aging trees: in how old trees manage to grow so large andpersist to such old ages (Westing 1964, Lanner 2002), whatcauses net growth to decline in large trees (Gower et al.1996, Mencuccini and Grace 1996, Ryan et al. 1997, Ryanand Yoder 1997, Bond 2000, Acker et al. 2002, Ryan et al.2004) and in the genera! relationship between plant formand function as both growth and aging occur. A number oftheories about the types of stress experienced by aging treeshave been proposed (Ishii et aJ. 2007). Of the two studied inmost detail, one is based on water relations (Ryan and Yoder1997, Hubbard et al. 1999, Bond 2000, Hubbard et al. 2002,Woodruff et al. 2004), whereas the other is based on carbohy-drate dynamics (Odum 1969, Grier and Logan 1977, Cannell1989, Hunt et al. 1999). It would seem likely that more thanone kind of stress is related to growth dynamics in old trees.There are also several ways in which old-growth trees cancompensate for the stresses. In this work, we show how to in-tegrate the multiple factors that are involved in aging and howboth morphological and physiological characters may miti-gate their effects, and we present a method of multi-criteriaoptimization that is new to tree physiology as a way of study-ing this complex of aging, morphology and physiology.
Summary Many hypotheses have been advanced about fac-tors that control tree longevity. We use a simulation model withmulti-criteria optimization and Pareto optimality to determinebranch morphologies in the Pinaceae that minimize the effectof growth limitations due to water stress while simultaneouslymaximizing carbohydrate gain. Two distinct branch morphol-ogies in the Pareto optimal space resemble Pseudotsugamenziesii (Mirb.) Franco and Abies grandis (Dougl. ex D.Don) Lindl., respectively. These morphologies are distin-guished by their performance with respect to two pathwaysof compensation for hydraulic limitation: minimizing themean path length to terminal foliage (Pseudotsuga) and min-imizing the mean number of junction constrictions to termi-nal foliage (Abies). Within these rNO groups, we find trade-offs between the criteria for foliage display and the criteriafor hydraulic functioning, which shows that an appropriateframework for considering tree longevity is how trees com-pensate, simultaneously, for multiple stresses. The diversemorphologies that are found in a typical old-growth coniferforest may achieve compensation in different ways. Themethod of Pareto optimization that we employ preservesall solutions that are successful in achieving different combi-nations of criteria. The model for branch development thatwe use simulates the process of delayed adaptive reiteration(DAR), whereby new foliage grows from suppressed budswithin the established branch structure. We propose a theo-retical synthesis for the role of morphology in the persistenceof old Pseudotsuga based on the characteristics of branchmorphogenesis found in branches simulated from the optimalset. (i) The primary constraint on branch growth for Pseudot-suga is the mean path length; (ii) as has been previously not-ed, DAR is an opportunistic architecture; and (iii) DAR islimited by the number of successive reiterations that canform. We show that Pseudotsuga morphology is not the onlysolution to old-growth constraints, and we suggest how themodel results should be used to guide future empirical inves-tigation based on the two contrasting morphologies and how
to internal and external conditions (Honda 1971, Fruh 1997,Reffye et al. 1997, Fournier and Andrieu 1999, Kaitaniemi etal. 2000, Pearcy et al. 2005, Sterck et al. 2005, Sterck andSchieving 2007). FSMs have promise to provide insight forthe relationship between plant form and function, but for thispromise to be fulfilled the models must be tested against pro-cesses that occur in real plants. Kennedy et al. (2004) dem-onstrate that reiteration has the potential to increase thelongevity of a Pseudotsuga branch relative to a branch with-out reiteration, but their model is limited in its capacity toexplain 'why' reiteration enables Pseudotsuga to overcomesize-related constraints. Such an explanation requires relatingalternative morphologies and processes of morphogenesis tothe performance of the branch with respect to the many tasksinvolved in sustaining growth and then comparing those al-ternative morphologies to observed growth patterns.
A frequent technique to evaluate plant form and function (ororganism behavior and function in general) is to apply an op-timality argument, and simulation models are often used as op-timization tools (Smith 1978). In the case of FSMs, the modelis used to find the plant structure that performs best with re-spect to a measure of plant performance (e.g., light intercep-tion). It is rare that the actual plant structure matches thestructure found to be optimal for a single measure (Hondaand Fisher 1978, Honda and Fisher 1979, Farnsworth andNiklas 1995, Pearcy et al. 2005). Wright (1932), and againin 1988 (Wright 1988), characterizes fitness landscapes thatcontain multiple adaptive peaks which correspond to optimalphenotypes, and Farnsworth and Niklas (1995) describe howthe number of these peaks increases as the number of require-ments also increases, whereas the heights of individual peaksdecrease towards the mean height across the landscape suchthat there is no single global optimum. From engineering,we know that optimal performance for multiple functionscan cause suboptimal performances with respect to a singlefunction (Niklas 1999). The main function of a branch is sus-tained growth, and to accomplish that function the branch
Pseudotsuga menziesii (Mirb.) Franco (Douglas-fir), here-after Pseudotsuga, is dominant in Tsuga-Pseudotsuga forestsof the Pacific Northwest (Franklin and Dyrness 1973). Indi-vidual trees of Pseudotsuga achieve great longevity (up to1400 years; Herman and Lavender 1990) despite evident con-straints in annual growth (Ishii et al. 2000, Ishii et al. 2003).(Ishii and Ford 2001, Ishii and Ford 2002) propose that the per-sistence of Pseudotsuga depends on its capacity for continuousfoliage production within its crown through the reiteration ofexisting branch structures (delayed adaptive reiteration,DAR; Figure 1). This is an expression of its morphology thatis distinct from younger trees as well as from other species(Ishii and McDowell 2002). Understanding the importanceof this growth form in the context offactors that may constrainnet growth is complicated by the clear diversity of plant formsthat coexist in old-growth forests ofthe Pacific Northwest. Forexample, both Thuja plicata Donn ex D. Don and Abies am-abilis Dougl. ex Forbes inhabit the same forest type as Pseu-dotsuga and may live to the same or even more advanced ages(Minore 1990, Van Pelt 200 I), although Abies tends to beshorter lived than Pseudotsuga and Thuja. These three (Pseu-dotsuga, Thuja and Abies) exhibit contrasting morphologies,yet they coexist in the same old-growth canopy; none ofthem can be considered to be exclusively 'optimal' relativeto the others. We require a method whereby the perfor-mances of varying plant morphologies can be measuredagainst multiple stresses that impact growth.
Functional-structural models
Kennedy et al. (2004) produced a functional-structural mod-el (FSM) to simulate branch development in old-growthPseudotsuga and to evaluate the effect of reiteration onlong-term growth. In FSMs, biological processes are coupledwith spatial representation of ideal plant form (Sievanen et al.2000, Godin and Sinoquet 2005), which are then evaluatedfor the consequences of hypothesized responses of plant form
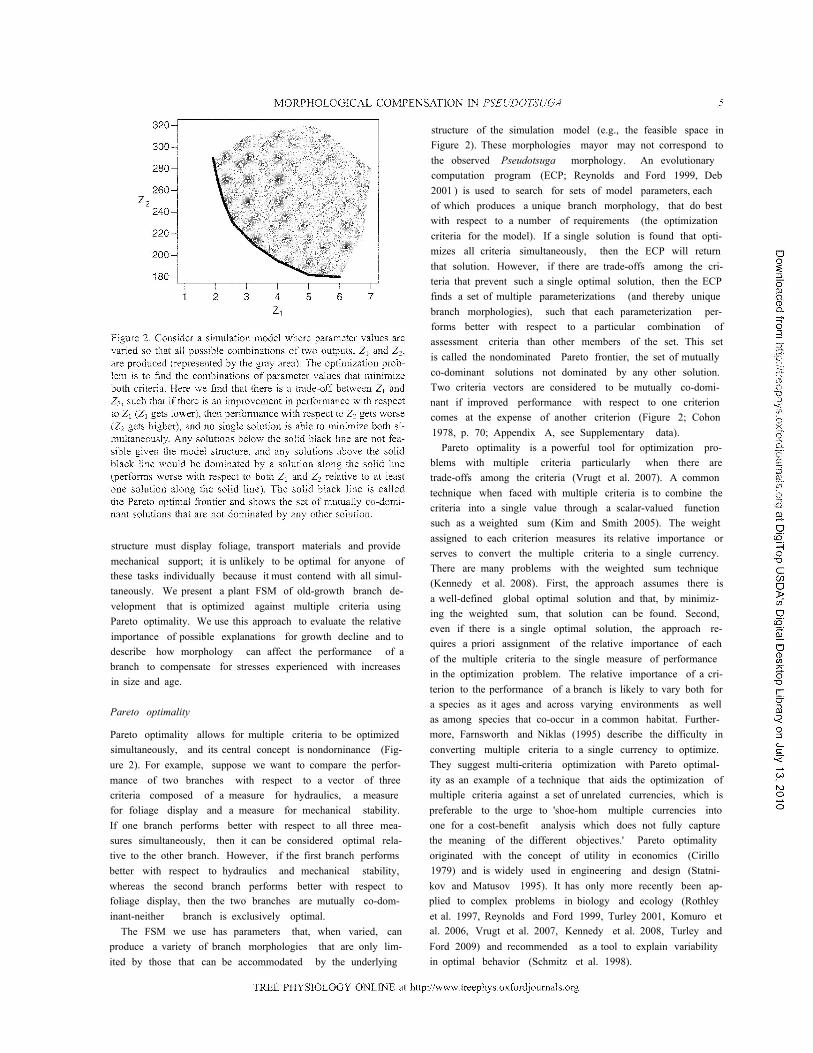
structure of the simulation model (e.g., the feasible space inFigure 2). These morphologies mayor may not correspond tothe observed Pseudotsuga morphology. An evolutionarycomputation program (ECP; Reynolds and Ford 1999, Deb2001 ) is used to search for sets of model parameters, eachof which produces a unique branch morphology, that do bestwith respect to a number of requirements (the optimizationcriteria for the model). If a single solution is found that opti-mizes all criteria simultaneously, then the ECP will returnthat solution. However, if there are trade-offs among the cri-teria that prevent such a single optimal solution, then the ECPfinds a set of multiple parameterizations (and thereby uniquebranch morphologies), such that each parameterization per-forms better with respect to a particular combination ofassessment criteria than other members of the set. This setis called the nondominated Pareto frontier, the set of mutuallyco-dominant solutions not dominated by any other solution.Two criteria vectors are considered to be mutually co-domi-nant if improved performance with respect to one criterioncomes at the expense of another criterion (Figure 2; Cohon1978, p. 70; Appendix A, see Supplementary data).
Pareto optimality is a powerful tool for optimization pro-blems with multiple criteria particularly when there aretrade-offs among the criteria (Vrugt et al. 2007). A commontechnique when faced with multiple criteria is to combine thecriteria into a single value through a scalar-valued functionsuch as a weighted sum (Kim and Smith 2005). The weightassigned to each criterion measures its relative importance orserves to convert the multiple criteria to a single currency.There are many problems with the weighted sum technique(Kennedy et al. 2008). First, the approach assumes there isa well-defined global optimal solution and that, by minimiz-ing the weighted sum, that solution can be found. Second,even if there is a single optimal solution, the approach re-quires a priori assignment of the relative importance of eachof the multiple criteria to the single measure of performancein the optimization problem. The relative importance of a cri-terion to the performance of a branch is likely to vary both fora species as it ages and across varying environments as wellas among species that co-occur in a common habitat. Further-more, Farnsworth and Niklas (1995) describe the difficulty inconverting multiple criteria to a single currency to optimize.They suggest multi-criteria optimization with Pareto optimal-ity as an example of a technique that aids the optimization ofmultiple criteria against a set of unrelated currencies, which ispreferable to the urge to 'shoe-hom multiple currencies intoone for a cost-benefit analysis which does not fully capturethe meaning of the different objectives.' Pareto optimalityoriginated with the concept of utility in economics (Cirillo1979) and is widely used in engineering and design (Statni-kov and Matusov 1995). It has only more recently been ap-plied to complex problems in biology and ecology (Rothleyet al. 1997, Reynolds and Ford 1999, Turley 2001, Komuro etal. 2006, Vrugt et al. 2007, Kennedy et al. 2008, Turley andFord 2009) and recommended as a tool to explain variabilityin optimal behavior (Schmitz et al. 1998).
structure must display foliage, transport materials and providemechanical support; it is unlikely to be optimal for anyone ofthese tasks individually because it must contend with all simul-taneously. We present a plant FSM of old-growth branch de-velopment that is optimized against multiple criteria usingPareto optimality. We use this approach to evaluate the relativeimportance of possible explanations for growth decline and todescribe how morphology can affect the performance of abranch to compensate for stresses experienced with increasesin size and age.
Pareto optimality
Pareto optimality allows for multiple criteria to be optimizedsimultaneously, and its central concept is nondorninance (Fig-ure 2). For example, suppose we want to compare the perfor-mance of two branches with respect to a vector of threecriteria composed of a measure for hydraulics, a measurefor foliage display and a measure for mechanical stability.If one branch performs better with respect to all three mea-sures simultaneously, then it can be considered optimal rela-tive to the other branch. However, if the first branch performsbetter with respect to hydraulics and mechanical stability,whereas the second branch performs better with respect tofoliage display, then the two branches are mutually co-dom-inant-neither branch is exclusively optimal.
The FSM we use has parameters that, when varied, canproduce a variety of branch morphologies that are only lim-ited by those that can be accommodated by the underlying
A feature of Pareto optimality that is valuable for the studyof complex biological questions is that it provides a discoveryprocess for uncovering the relationships between the structureand functioning among species in a particular environment.The Pareto optimal frontier that we calculate is relevant tothe system of interest insofar as the model produces branchesthat adequately replicate observed patterns. The intersectionof the theoretical Pareto optimal space with the observed or-ganism pattern shows the importance of this relationship rel-ative to other possible structure-- function relationships. If oneaccepts that in order to sustain growth a branch must performmany tasks, some of which may have conflicting require-ments, then there are possibly multiple branch morphologiesthat balance those tasks with some success. These morphol-ogies would depend on the relative importance of each of thetasks in a given environment and on the interaction betweenthe morphology of a species and its physiology. The Paretooptimal frontier allows for a visualization of these solutions,where each point in the frontier corresponds to a uniquebranch morphology that is able to achieve a non dominatedcombination of criteria values. Vrugt et al. (2007) explain thatfor a multi-criteria function F(0): 'The Pareto set of solutionsdefines the minimum uncertainty (variability) that can beachieved without stating a subjective relative preference formaximizing one specific component of F(0) at the expenseof another.' We find the solutions in the frontier that corre-spond to observed morphologies and contrast them to evalu-ate how the varying performances are achieved. Thisoptimization is a first step that enables us to assess whetherthe simulated Pareto optima] frontier adequately characterizesprocesses in old-growth canopies. The simulation exercisethen provides a path for future empirical research that can im-prove the modeling effort, whereby the performance of actualbranches are measured for the criteria found to be importantin the optimization process and interpreted in the context oftheir varying life history, physiology and morphology.
Methods
Pseudotsuga branch morphology
Ishii and Ford (2001) demonstrated that the foliage withinPseudotsuga crowns is regenerated through delayed adaptivereiteration (DAR), in which a reserve of buds is maintainedalong branch axes; these are later released to form new foliat-ed shoots (Figure lB). The resulting shoots are epicormic, andthey are distinguished from shoots generated through the usu-al growth sequence and from adventitious shoots. These epi-connie shoots proliferate new foliage in a pattern that closelyresembles the architectural hierarchy exhibited by the branch(Figure 1). This hierarchy is described by a dominant Order 1main axis with two to three daughter shoots per year and lim-ited bifurcation on immediate lateral axes (Orders 2 and 3).The reiteration ofthis pattern is likely controlled via the estab-lishment of apical control as the new epicormic axis develops
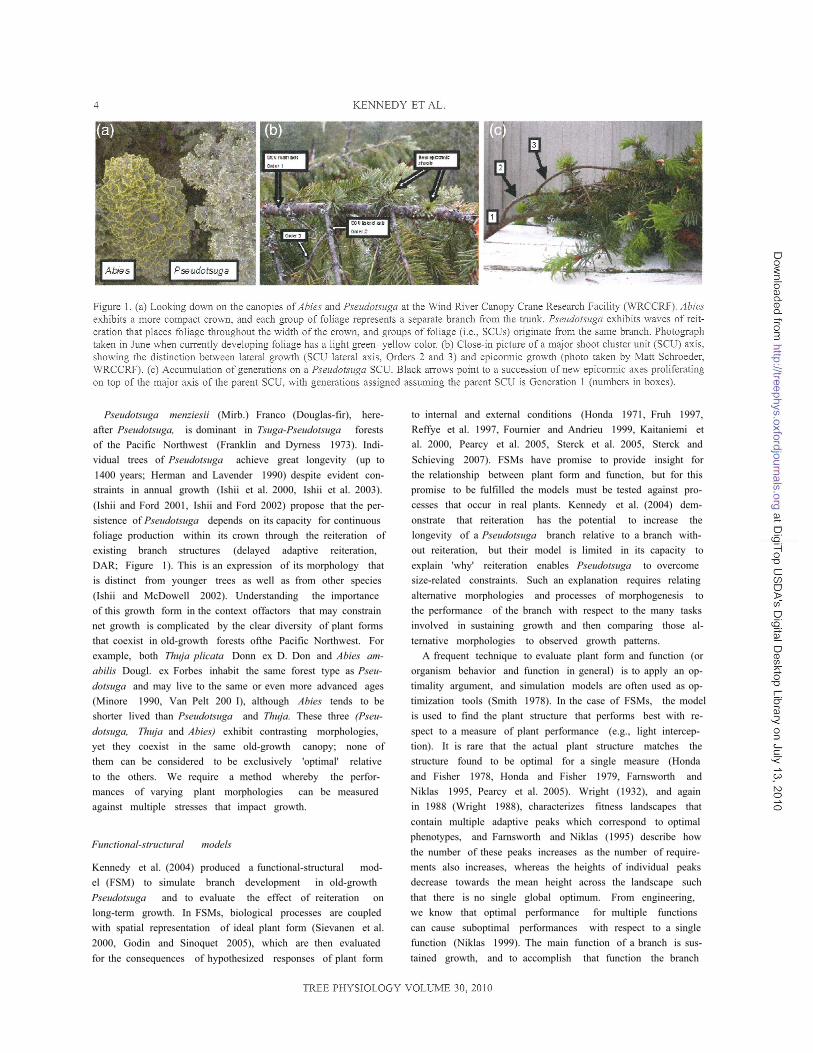
(Kennedy et al. 2004, Kennedy and Ford 2009). Wilen an epi-cormic shoot successfully proliferates to replicate the charac-teristic architectural hierarchy, it forms an independent clusterof foliage, the shoot cluster unit (SCU; Ishii and Ford 2001).Up to seven generations of reiteration can form, with each gen-eration proliferating on top of the previous one (Figure 1C).Reiteration of complete branches also occurs from the treehunk at the base of dead or dying branches, and these can pro-duce a secondary crown within the shell of the first (Ishii andWilson 2001, Ishii et al. 2002, Van Pelt and Sillett 2008).
BRANCHPR03
The FSM we developed is the third version of an FSM firstpresented by Kennedy et al. (2004) and assessed and im-proved by Kennedy and Ford (2009). The model objectiveis to simulate morphogenesis in old-growth Pseudotsuga.BRANCHPRO3 is a stochastic model that simulates two ma-jor processes of branch development on a yearly time step:release of suppressed buds proximally along major branchaxes and the bifurcation of active terminal nodes (Figure3). The combination of bud release and bifurcation deter-mines the overall process of morphogenesis and the resultingbranch morphology. Although we have elements for a theoryfor what influences bud release and bifurcation, each of theseprocesses is still subject to unknown relationships and sto-chastic events. We therefore apply probability structureswhose mean values relate to the possible influence of localvariables on each process, but the realized value of each pro-cess is subject to stochastic influences. Details of the modelstructure and mathematical equations are provided in Appen-dix B (see Supplementary data). The simulated branch is ini-tialized with a single foliated shoot, and branch developmentis simulated through 90 years.
There is a single suppressed bud for every Order 1 shoot.Every year, for every suppressed bud, the probability of re-lease is calculated from Eq. (1) and the bud release testedagainst that probability (random number generators foundin Press et al. 1999, pp. 282, 287, 294). If the bud is released,then it forms a new epicormic foliated shoot (e.g., FigureIB). The second major model process is bifurcation. The bi-furcation rate (r) is calculated (Eq. 2) for every foliated shootwith active buds (i.e., the current year's growth; Figure 3). Ifthe computed value is <0, it is given a value of O. A randomnumber is then drawn from a Poisson distribution, whose rateparameter is the function value r. If the random value drawn is>3, then the number of daughter shoots assigned is exactly 3(Appendix B). In BRANCHPR03, a shoot retains its foliagefor no more than 10 simulated years (Kennedy 2002, Kennedyet al. 2004), after which the shoot is not included in the pop-ulation offoliated shoots. Individual clusters of foliage on thebranch are tested each simulation year for whether they con-stitute an independent SCD. Shoot cluster units are assumedto only form on epicormic axes, and a cluster offoliage is con-sidered independent of its parent SCU if its main axis con-tinues to proliferate new foliage beyond 10 years. At the
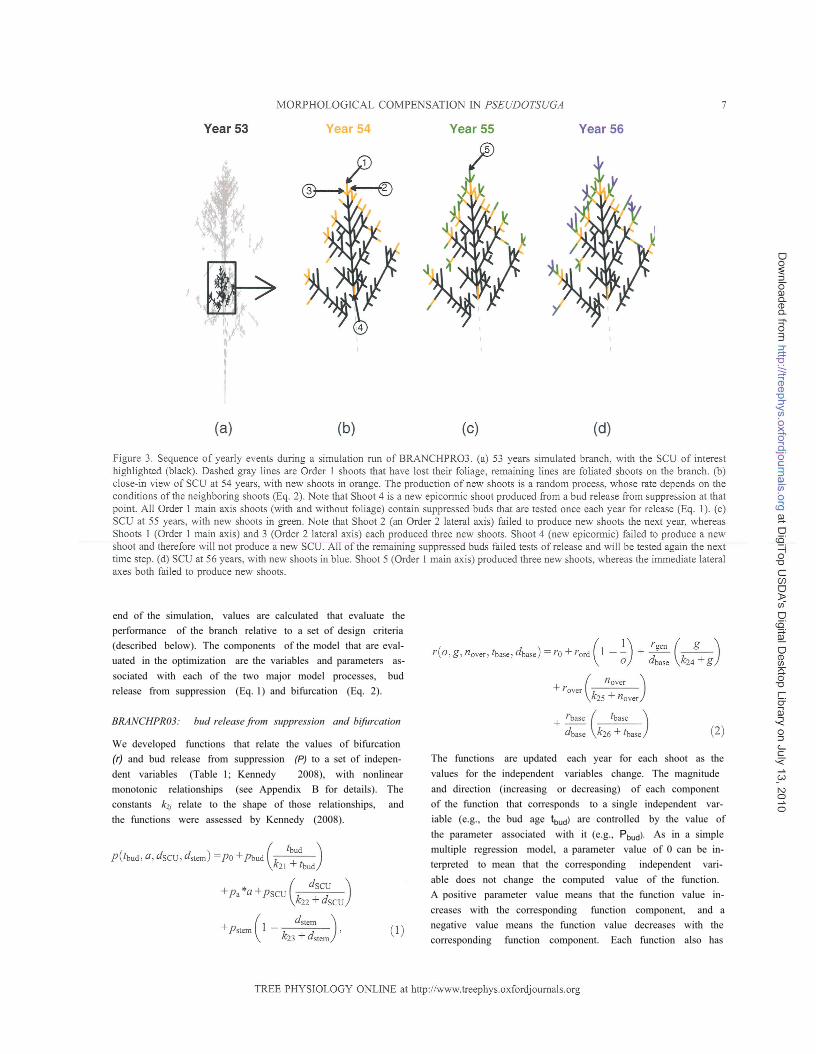
The functions are updated each year for each shoot as thevalues for the independent variables change. The magnitudeand direction (increasing or decreasing) of each componentof the function that corresponds to a single independent var-iable (e.g., the bud age tbud) are controlled by the value ofthe parameter associated with it (e.g., Pbud). As in a simplemultiple regression model, a parameter value of 0 can be in-terpreted to mean that the corresponding independent vari-able does not change the computed value of the function.A positive parameter value means that the function value in-creases with the corresponding function component, and anegative value means the function value decreases with thecorresponding function component. Each function also has
end of the simulation, values are calculated that evaluate theperformance of the branch relative to a set of design criteria(described below). The components of the model that are eval-uated in the optimization are the variables and parameters as-sociated with each of the two major model processes, budrelease from suppression (Eq. 1) and bifurcation (Eq. 2).
BRANCHPR03: bud release from suppression and bifurcation
We developed functions that relate the values of bifurcation(r) and bud release from suppression (P) to a set of indepen-dent variables (Table 1; Kennedy 2008), with nonlinearmonotonic relationships (see Appendix B for details). Theconstants k2j relate to the shape of those relationships, andthe functions were assessed by Kennedy (2008).
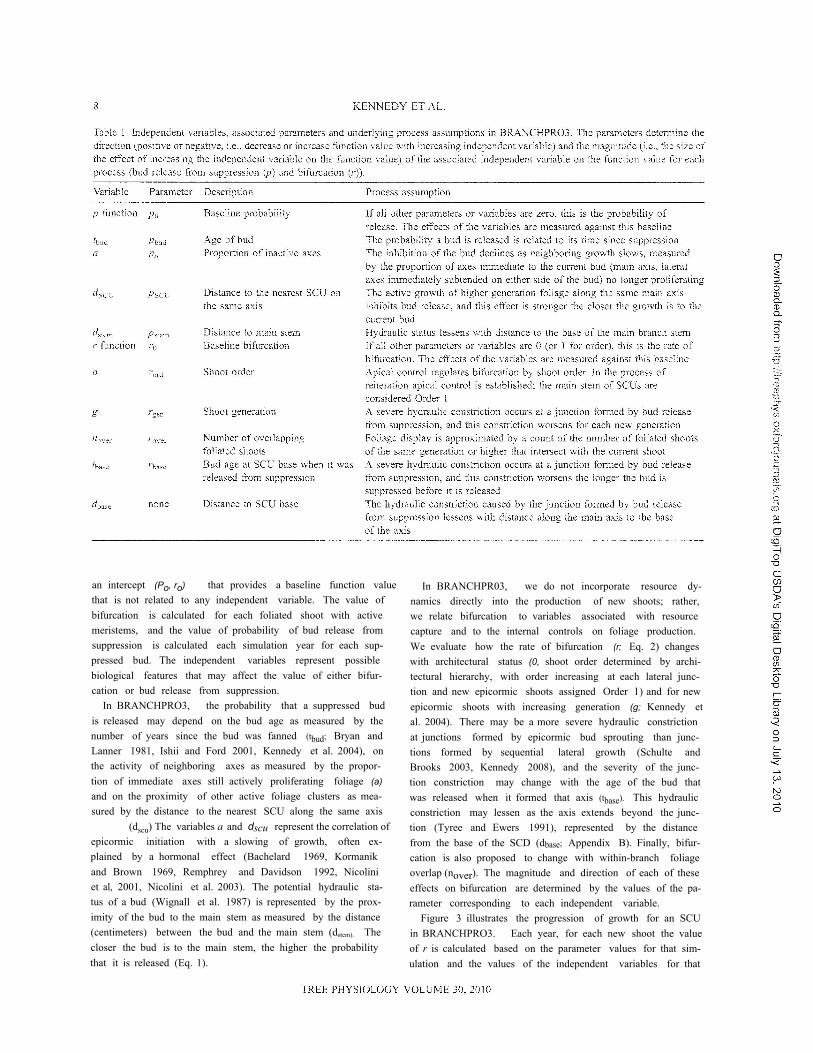
In BRANCHPR03, we do not incorporate resource dy-namics directly into the production of new shoots; rather,we relate bifurcation to variables associated with resourcecapture and to the internal controls on foliage production.We evaluate how the rate of bifurcation (r; Eq. 2) changeswith architectural status (0, shoot order determined by archi-tectural hierarchy, with order increasing at each lateral junc-tion and new epicormic shoots assigned Order l ) and for newepicormic shoots with increasing generation (g; Kennedy etal. 2004). There may be a more severe hydraulic constrictionat junctions formed by epicormic bud sprouting than junc-tions formed by sequential lateral growth (Schulte andBrooks 2003, Kennedy 2008), and the severity of the junc-tion constriction may change with the age of the bud thatwas released when it formed that axis (tbase). This hydraulicconstriction may lessen as the axis extends beyond the junc-tion (Tyree and Ewers 1991), represented by the distancefrom the base of the SCD (dbase; Appendix B). Finally, bifur-cation is also proposed to change with within-branch foliageoverlap (nover). The magnitude and direction of each of theseeffects on bifurcation are determined by the values of the pa-rameter corresponding to each independent variable.
Figure 3 illustrates the progression of growth for an SCUin BRANCHPRO3. Each year, for each new shoot the valueof r is calculated based on the parameter values for that sim-ulation and the values of the independent variables for that
an intercept (Po, ro) that provides a baseline function valuethat is not related to any independent variable. The value ofbifurcation is calculated for each foliated shoot with activemeristems, and the value of probability of bud release fromsuppression is calculated each simulation year for each sup-pressed bud. The independent variables represent possiblebiological features that may affect the value of either bifur-cation or bud release from suppression.
In BRANCHPRO3, the probability that a suppressed budis released may depend on the bud age as measured by thenumber of years since the bud was fanned (tbud; Bryan andLanner 1981, Ishii and Ford 2001, Kennedy et al. 2004), onthe activity of neighboring axes as measured by the propor-tion of immediate axes still actively proliferating foliage (a)and on the proximity of other active foliage clusters as mea-sured by the distance to the nearest SCU along the same axis
(dscu) The variables a and dscu represent the correlation ofepicormic initiation with a slowing of growth, often ex-plained by a hormonal effect (Bachelard 1969, Kormanikand Brown 1969, Remphrey and Davidson 1992, Nicoliniet al, 2001, Nicolini et al. 2003). The potential hydraulic sta-tus of a bud (Wignall et al. 1987) is represented by the prox-imity of the bud to the main stem as measured by the distance(centimeters) between the bud and the main stem (dstem). Thecloser the bud is to the main stem, the higher the probabilitythat it is released (Eq. 1).
branch is then used to calculate the optimization criteria andevaluated for its performance relative to other simulatedbranches. The focus of the optimization is the process of rnor-phogenesis and the resulting branch morphoiogy, and we donot explicitly include a resource constraint in the optimization.The solutions available to the optimization are constrained bythe underlying model structure, which was designed to mimicthe developmental pathways observed in Pseudotsuga. Opti-mization results must be interpreted in the context of theFSM process structure and its reiationship to our understand-ing of the observed processes. The parameter search is con-ducted using an evolutionary algorithm that had beenpreviously developed for ecological models (Reynolds andFord 1999).
Empirical criteria
The empirical criteria are designed to capture the basicbranching pattern of old-growth Pseudotsuga and to con-strain a portion of the optimal set to be consistent with theobserved Pseudotsuga architectural pattern. This ensures that,without explicit consideration of resource dynamics, the levelof foliage production is commensurate with that achieved byPseudotsuga.
Targets for the empirical criteria are based on the empiricalwork of Ishii and Ford (2001) at the Wind River CanopyCrane Research Facility (WRCCRF; trees were ~400 yearsold; Shaw et al. 2004). Six of the branches they sampled werenear 90 years old, and the remaining three were near 145years old. We used values they measured for the 90-yearbranches to set the upper and lower limits for the empiricaltarget ranges of the first three empirical criteria (Table 2), be-cause that branch year is represented by more individuals inthe observed set of branches, and for computational efficien-cy. Results calculated for 145-year branches are consistent
shoot in that year. From the value of r, a random value fromthe Poisson distribution is drawn to determine the number ofdaughter shoots to be produced the next year. Suppressedbuds are found along Order 1 axes, and each year for eachsuppressed bud, the probability of release is calculated basedon the parameter values for that simulation and the values ofthe independent variables for that bud in that year. The bud isthen tested for release against that probability, and if it suc-ceeds it forms a new epiconnic shoot. The value of r for thenew epicormic shoot is calculated, and this is used to deter-mine the number of daughter shoots to be formed from it thenext simulation year. The mode! structure as we describe itconstrains the possible morphologies that can be simulatedin the optimization search and thereby defines the feasiblespace in Figure 2. The rules for foliage proliferation ensurethat simulated branch structures are consistent with observedgrowth regulations in the old-growth branches. The values ofthe multiple criteria are calculated for a branch after 90 yearsof branch development, which is near the mean age of six ofthe nine branches sampled by Ishii and Ford (2001).
Multi-criteria optimization
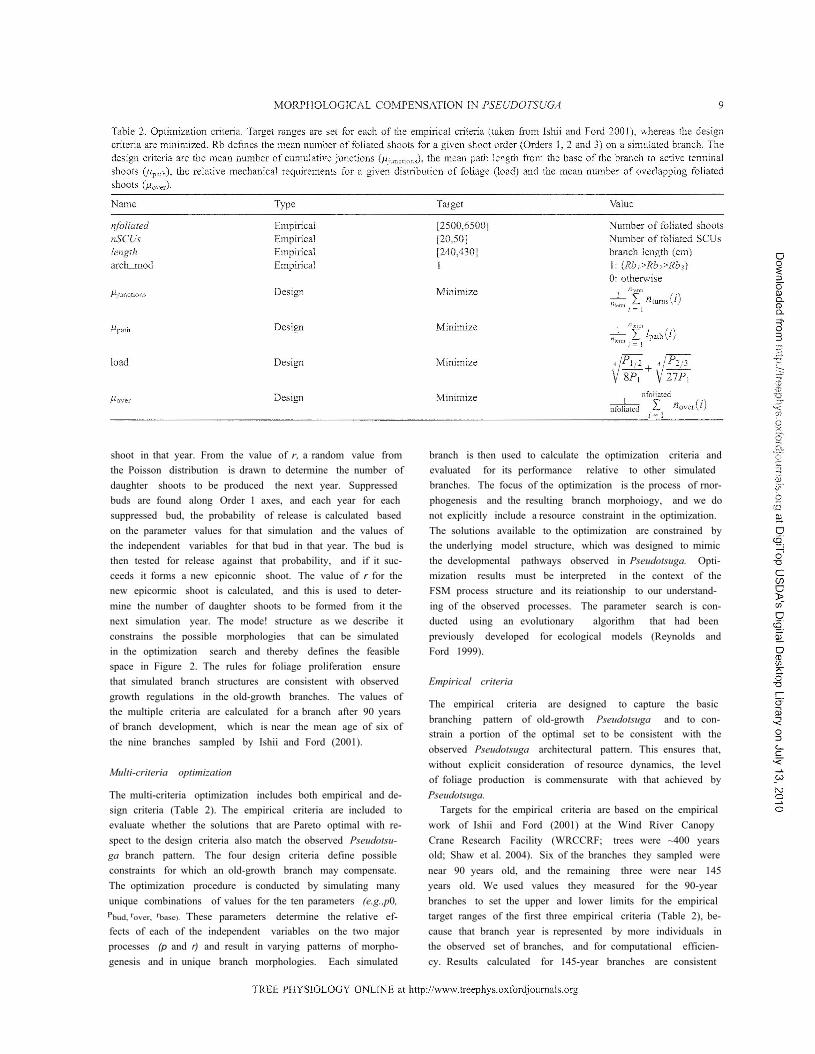
The multi-criteria optimization includes both empirical and de-sign criteria (Table 2). The empirical criteria are included toevaluate whether the solutions that are Pareto optimal with re-spect to the design criteria also match the observed Pseudotsu-ga branch pattern. The four design criteria define possibleconstraints for which an old-growth branch may compensate.The optimization procedure is conducted by simulating manyunique combinations of values for the ten parameters (e.g.,p0,Pbud, rover, rbase). These parameters determine the relative ef-fects of each of the independent variables on the two majorprocesses (p and r) and result in varying patterns of morpho-genesis and in unique branch morphologies. Each simulated
with the results presented here (Kennedy 2008). The empiri-cal criteria are the number of foliated shoots at 90 years (nfo-liated), the number of independent SCUs with foliated shootsat 90 years (nSCUs) and the length of the branch at 90 years(length). The fourth empirical measure (arch.rnod) evaluateswhether the branch follows the characteristic architectural hi-erarchy of Pseudotsuga. It is given a value of 1 if the branchfollows the observed hierarchy (Order 1 bifurcation greaterthan Order 2 bifurcation, which is greater than Order 3 bifur-cation), a 0 otherwise. Any simulated branch that is able toachieve values within the target range for ail four of theseempirical criteria simultaneously is assumed to adequatelyreplicate the observed branch pattern.
Design criteria
The four design criteria relate to two major theories proposedto explain the frequent observation that tree growth declineswith increasing tree size (Gower et al. 1996, Mencuccini andGrace 1996, Ryan et al. 1997, Ryan and Yoder 1997, Bond2000, Acker et al. 2002, Ryan et al. 2004). A recent theoryproposes that growth decline is caused by hydrauiic limita-tion (Bond 2000), whereas an older theory is that, with in-crease in tree size, there is an increase in the demands ofthe tree for carbohydrate relative to a given level of produc-tion (Odum 1969, Grier and Logan 1977, Cannell 1989, Huntet al. 1999). There is evidence of several processes in Pseu-dotsuga that compensate for growth limitations via physio-logical and structural changes that mitigate the effects ofsize on net production (McDowell et al. 2002b), mostly eval-uated with respect to hydraulic limitation; these includechanges in leaf water potential and foliar osmotic potential,changes in the leafarea to sapwood area ratio (LA:SA;McDowell et al. 2002a, 2002b, Barnard and Ryan 2003,Woodruff et al. 2004), changes in sapwood hydraulic conduc-tivity and storage (Phillips et a1. 2003, Cermak et al. 2007)and hydraulic lift by both horizontal and vertical roots (War-ren et a1. 2007). In general, however, these studies do notconsider whether the morphology (or growth pattern) ofold-growth trees may also compensate for size-related con-straints. For the purpose of the branch optimization, we focuson the potential for morphology to reduce hydraulic limita-tion and increase the photosynthesis:respiration ratio (therebyreduce carbon limitation).
Hydraulic constraints
The first two design criteria measure the impact on morpholo-gy for two possible hydraulic constraints. The resistance of wa-ter flow to a particular foliage cluster in the crown is a functionof path length from the soil to the leaf, specific conductivity ofthe wood sections along this pathway, the possible restrictionsassociated with hranching points and xylem area that can sup-ply water to the foliage (Zimmermann 1978, Tyree and Zim-mermann 2002). Quantifying all ofthese components requiresa highly detailed model, which is out of the scope of the currentmodeling effort. We focus on the possible hydraulic restriction
associated with branching points (Larson and Isebrands 1978,Zimmermann 1978, Ewers and Zimmermann 1984a, 1984b,Tyree and Alexander 1993) and on the effect of increasing re-sistance with increasing path and branch length (Tyree andEwers 1991, Waring and Silvester 1994, Panek and Waring1995, Walcroft et al. 1996). A branch morphology with a smal-ler number of cumulative junctions from its base to Thetermi-nal foliage may perform better than a branch with a highernumber of cumulative junctions. Furthermore, a branch witha shorter path length for water transport from the base of thebranch to terminal foliage may perform better than a branchwith a longer path length. A branch with smaller values of boththe number of cumulative junctions and path length may per-form better than one with higher values of either variable. Themean number of junctions to terminal foliage (Ujuntions) andthe mean path length to terminal foliage (Upath) are the firsttwo design criteria included in the multi-criteria optimization(Table 2).
Carbon limitation
The third and fourth design criteria evaluate the possible roleof morphology in increasing the ratio of photosynthesis tocarbohydrate requirement. Ishii et a1. (2007) state that the in-crease of productive tissue relative to nonproductive tissue isone way in which DAR may decrease the respiration to pho-tosynthesis ratio. Because DAR arises from main branch ax-es, it concentrates mechanical stress produced by new foliagetoward the stem where foliage has already been supported,relative to that for non-reiterating branch expansion. This les-sens the requirement for support tissue. A morphology thatdecreases diameter requirement distally on the branch (atone-half and two-thirds branch length; P 1/2; P 2/3) relative tothe base (P1) would decrease new wood growth requirementrelative to a given level of photosynthesis (load; Table 2).The value of load is calculated as the sum of the ratios ofdiameter required at one-half and two-thirds the branchlength, relative to the base of the branch (adapted fromPearcy et al. 2005, Morgan and Cannell 1988, Cannell1989). If all of the foliage is displayed at the terminal endof the branch, then this ratio takes a maximum value of1.034 (Appendix B; Table B2). This criterion is reduced asthe foliage is displayed more evenly along the major branchaxis. Another way the ratio of photosynthesis to respirationmay increase relative to a given carbohydrate demand wouldbe a morphology that more effectively displays foliage tolight, relative to other morphologies, through the productionof epicormic axes (Ishii et a1.2007). Pseudotsuga is generallyconsidered a shade intolerant species with a sparse crown(Minore 1979), so it is important for foliage in Pseudotsugato be displayed in a manner that increases light interception.Ishii et al. (2007) hypothesize that DAR may place shoots inbetter illuminated areas within the crown. For the final designcriterion, we calculate the number of foliated shoots overlap-ping each other foliated shoot on the branch and average thatacross all foliated shoots (Uover) If the foliage is displayed
other clusters of parameterizations (Appendix C). We com-pare the two partitions with respect to several measures, in-cluding the criteria performance and the morphologicalcharacteristics of each.
Pareto optimal solution set: criteria performance
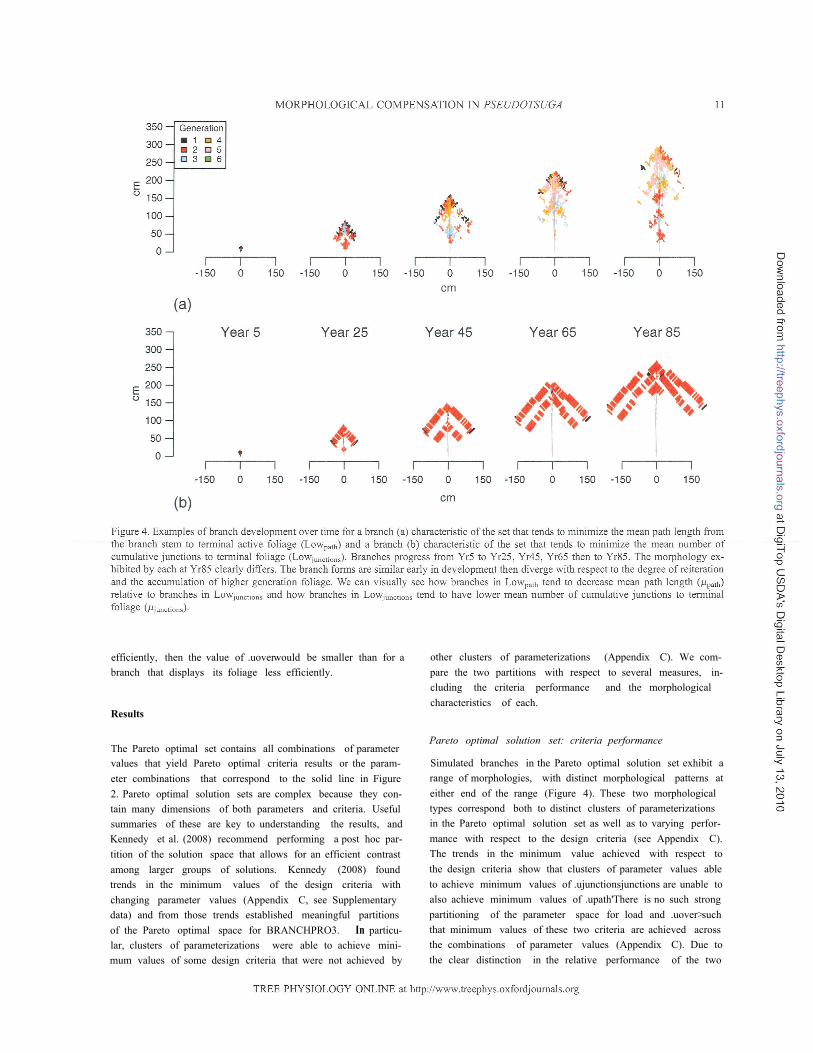
Simulated branches in the Pareto optimal solution set exhibit arange of morphologies, with distinct morphological patterns ateither end of the range (Figure 4). These two morphologicaltypes correspond both to distinct clusters of parameterizationsin the Pareto optimal solution set as well as to varying perfor-mance with respect to the design criteria (see Appendix C).The trends in the minimum value achieved with respect tothe design criteria show that clusters of parameter values ableto achieve minimum values of .ujunctionsjunctions are unable toalso achieve minimum values of .upath'There is no such strongpartitioning of the parameter space for load and .uover>suchthat minimum values of these two criteria are achieved acrossthe combinations of parameter values (Appendix C). Due tothe clear distinction in the relative performance of the two
efficiently, then the value of .uoverwould be smaller than for abranch that displays its foliage less efficiently.
Results
The Pareto optimal set contains all combinations of parametervalues that yield Pareto optimal criteria results or the param-eter combinations that correspond to the solid line in Figure2. Pareto optimal solution sets are complex because they con-tain many dimensions of both parameters and criteria. Usefulsummaries of these are key to understanding the results, andKennedy et al. (2008) recommend performing a post hoc par-tition of the solution space that allows for an efficient contrastamong larger groups of solutions. Kennedy (2008) foundtrends in the minimum values of the design criteria withchanging parameter values (Appendix C, see Supplementarydata) and from those trends established meaningful partitionsof the Pareto optimal space for BRANCHPRO3. In particu-lar, clusters of parameterizations were able to achieve mini-mum values of some design criteria that were not achieved by
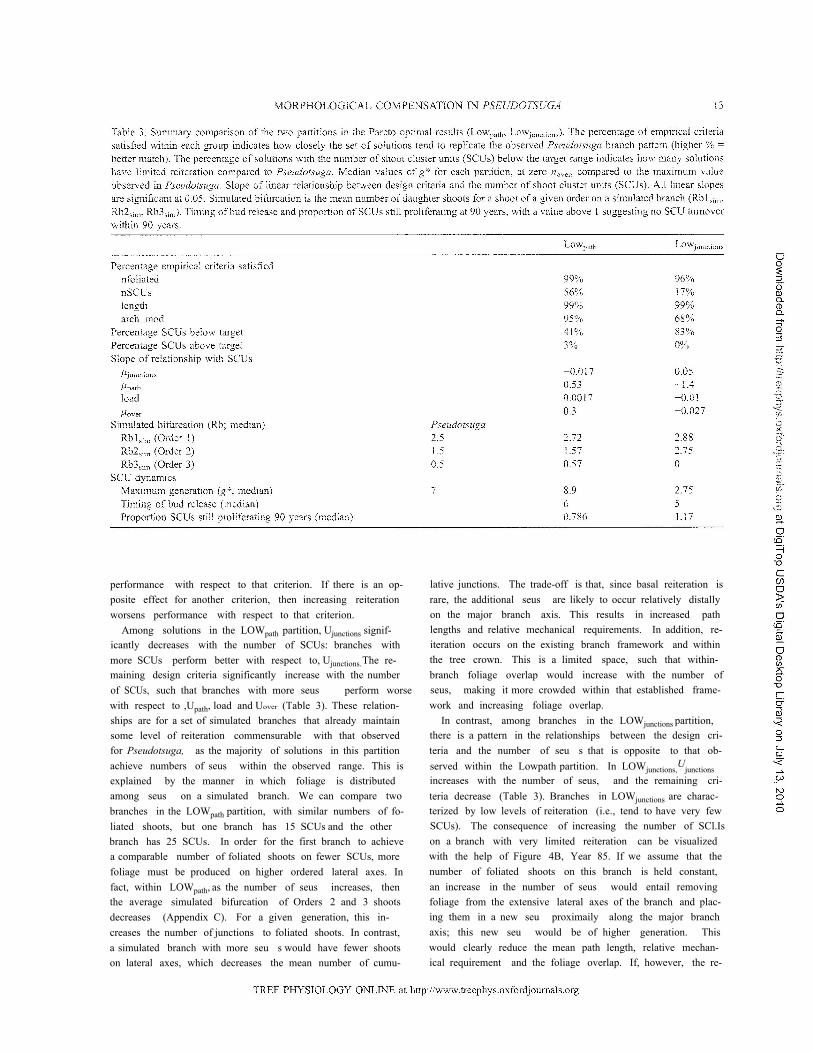
tectural model of Pseudotsuga than solutions in LOWjunctionsThis implies that branches in the LOWpath partition moreclosely match the observed Pseudotsuga branch pattern be-cause they are able to achieve more of the empirical criteria.It also clearly demonstrates that multiple measures are re-quired to evaluate whether a simulated branch morphologyis able to adequately replicate the observed morphology. Fur-thermore, within each partition, there is variability in thenumber of SCUs that are produced on simulated branches.The number of SCUs is a measure of the level of reiterationthat occurs throughout branch development, and branches inLOWpath exhibit more SCU development (and, hence, greaterreiteration) than branches in LOWjunctions (Table 3). By usingthe number of SCUs as a surrogate for the level of reiteration,we can evaluate how increasing reiteration modifies perfor-mance of a branch with respect to the design criteria. Wefit linear models to the relationship between the number ofSCUs and the value of each of the design criteria. If the valueof a design criterion significantly decreases with the numberof SCUs on the branch, then increasing reiteration improves
groups of morphologies with respect to the two hydraulic C1;-
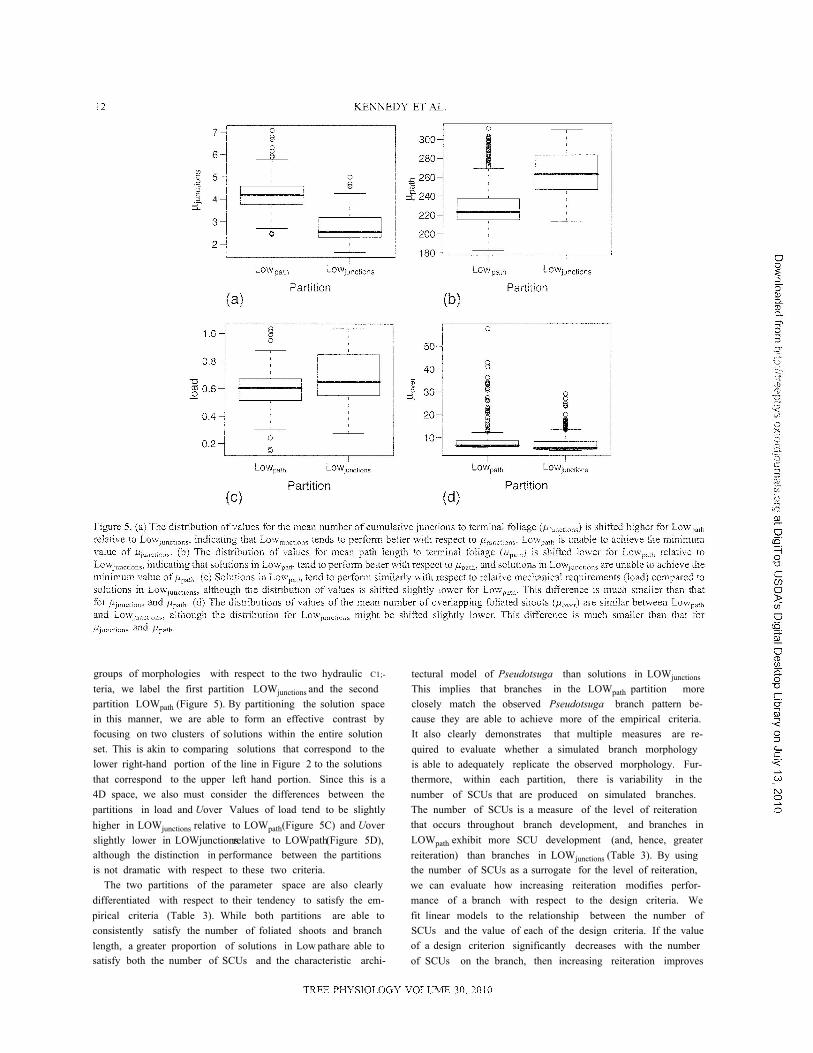
teria, we label the first partition LOWjunctions and the secondpartition LOWpath (Figure 5). By partitioning the solution spacein this manner, we are able to form an effective contrast byfocusing on two clusters of solutions within the entire solutionset. This is akin to comparing solutions that correspond to thelower right-hand portion of the line in Figure 2 to the solutionsthat correspond to the upper left hand portion. Since this is a4D space, we also must consider the differences between thepartitions in load and Uover Values of load tend to be slightlyhigher in LOWjunctions relative to LOWpath (Figure 5C) and Uoverslightly lower in LOWjunctionsrelative to LOWpath(Figure 5D),although the distinction in performance between the partitionsis not dramatic with respect to these two criteria.
The two partitions of the parameter space are also clearlydifferentiated with respect to their tendency to satisfy the em-pirical criteria (Table 3). While both partitions are able toconsistently satisfy the number of foliated shoots and branchlength, a greater proportion of solutions in Low pathare able tosatisfy both the number of SCUs and the characteristic archi-
lative junctions. The trade-off is that, since basal reiteration israre, the additional seus are likely to occur relatively distallyon the major branch axis. This results in increased pathlengths and relative mechanical requirements. In addition, re-iteration occurs on the existing branch framework and withinthe tree crown. This is a limited space, such that within-branch foliage overlap would increase with the number ofseus, making it more crowded within that established frame-work and increasing foliage overlap.
In contrast, among branches in the LOWjunctions partition,there is a pattern in the relationships between the design cri-teria and the number of seu s that is opposite to that ob-served within the Lowpath partition. In LOWjunctions,
Ujunctions
increases with the number of seus, and the remaining cri-teria decrease (Table 3). Branches in LOWjunctions are charac-terized by low levels of reiteration (i.e., tend to have very fewSCUs). The consequence of increasing the number of SCl.Ison a branch with very limited reiteration can be visualizedwith the help of Figure 4B, Year 85. If we assume that thenumber of foliated shoots on this branch is held constant,an increase in the number of seus would entail removingfoliage from the extensive lateral axes of the branch and plac-ing them in a new seu proximaily along the major branchaxis; this new seu would be of higher generation. Thiswould clearly reduce the mean path length, relative mechan-ical requirement and the foliage overlap. If, however, the re-
performance with respect to that criterion. If there is an op-posite effect for another criterion, then increasing reiterationworsens performance with respect to that criterion.
Among solutions in the LOWpath partition, Ujunctions signif-icantly decreases with the number of SCUs: branches withmore SCUs perform better with respect to, Ujunctions. The re-maining design criteria significantly increase with the numberof SCUs, such that branches with more seus perform worsewith respect to ,Upath, load and Uover (Table 3). These relation-ships are for a set of simulated branches that already maintainsome level of reiteration commensurable with that observedfor Pseudotsuga, as the majority of solutions in this partitionachieve numbers of seus within the observed range. This isexplained by the manner in which foliage is distributedamong seus on a simulated branch. We can compare twobranches in the LOWpath partition, with similar numbers of fo-liated shoots, but one branch has 15 SCUs and the otherbranch has 25 SCUs. In order for the first branch to achievea comparable number of foliated shoots on fewer SCUs, morefoliage must be produced on higher ordered lateral axes. Infact, within LOWpath, as the number of seus increases, thenthe average simulated bifurcation of Orders 2 and 3 shootsdecreases (Appendix C). For a given generation, this in-creases the number of junctions to foliated shoots. In contrast,a simulated branch with more seu s would have fewer shootson lateral axes, which decreases the mean number of cumu-
Comparison of branch morphologies
The number of parameters in BRANCHPRO3 make it diffi-cult to compare individual parameters and their effect on thePareto optimal solution space (see Appendix C for distribu-tions of parameter values). Instead, we evaluate how the in-tegrative effects of a parameter vector within a givensimulation modify the process of morphogenesis and the re-sulting branch morphologies.
Simulated bifurcation and liming of bud release
We calculate the mean number of daughter shoots for eachshoot order on branches simulated from all solutions in eachpartition (Table 3). The mean number of daughter shoots onsimulated branches for shoot Orders 1 (Rb1sim) 2 (Rb2sim)and 3 (Rb3sim) are similar between the LOWpath branches andthe observed Pseudotsuga pattern, whereas the mean numberof daughter shoots for Orders 2 and 3 shoots for branches sim-ulated in the LOWjunctions partition clearly differ from Pseudot-suga and violate the architectural hierarchy as defined byarch_mod. This pattern of bifurcation interacts with the timingof bud release to influence the production of seus.
The median value of timing of bud release for branchessimulated in the LOWpath partition is significantly greater thanthe median timing in LOWjunctions (Wilcoxon rank-sum test,P < 0.05), i.e., buds are suppressed longer before they arereleased, and regeneration of foliage occurs more proximallyalong major branch axes in LOWpath than in LOWjunctions
(Table 3). The dynamics of the population of SCUs on thebranch also differs between the two partitions. We considerthe ratio of actively proliferating SCUs at 90 years relative tothe number of new SCUs (Generation 2 or higher) producedthroughout the branch lifespan; a value of 1 or above wouldindicate that all SCUs that ever emerged on the branch arestill actively proliferating at the end of the simulation, anda value below 1 indicates that some of the SCUs failed toproduce foliage and are terminated before the end of the sim-ulation (SCUs turnover). The distribution of this proportionwas shifted below 1 for solutions in LOWpath and above 1for solutions in LOWjunctions (Table 3). This indicates thatSCUs on branches simulated in LOWpath proliferate for sometime then decline. This pattern is consistent with the stages ofseu development described by Ishii and Ford (2001) and isexplained by the lower values of mean bifurcation on simu-lated branches for LOWpath compared to LOWjunctions. In con-trast, in LOWjunctions if an seu develops on the branch itpersists throughout the branch lifespan (Table 3) with bothprimary and secondary axes enduring. These results indicaterhat buds are released earlier on LOWjunctions branches relativeto LOWpath, and once a new SCU is established for LOWjunctions
it continues to proliferate throughout the branch lifespan.
Generation threshold and expected bifurcation
The value of r (bifurcation rate) is calculated from the com-bination of independent variables and parameter values (Eq.
iteration faithfully replicates the underlying architectural pat-tern, then this would increase the maximum number of junc-tions on this branch by 1; this increase is accounted for by theincrease in generation. In essence, increasing the seus for abranch in LOWjunctions puts that branch closer in morphologyto branches in LOWpath, characterized by lower mean pathlength and higher number of junctions.
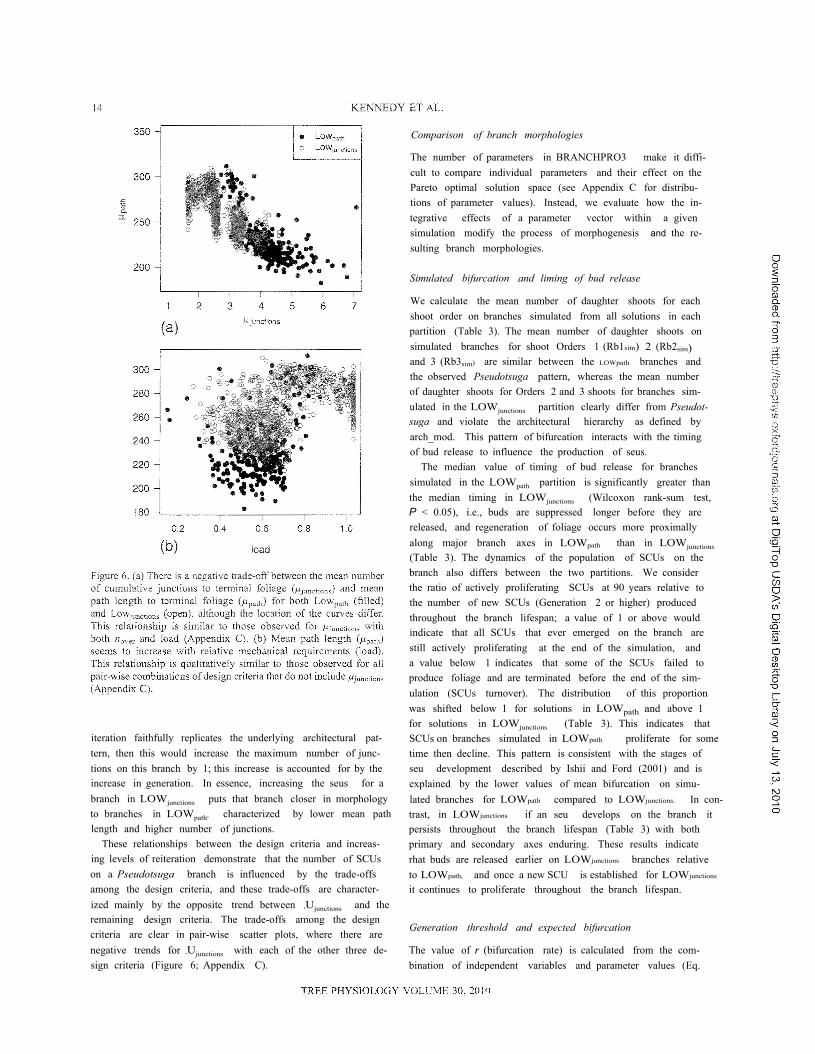
These relationships between the design criteria and increas-ing levels of reiteration demonstrate that the number of SCUson a Pseudotsuga branch is influenced by the trade-offsamong the design criteria, and these trade-offs are character-ized mainly by the opposite trend between ,Ujunctions and theremaining design criteria. The trade-offs among the designcriteria are clear in pair-wise scatter plots, where there arenegative trends for ,Ujunctions with each of the other three de-sign criteria (Figure 6; Appendix C).
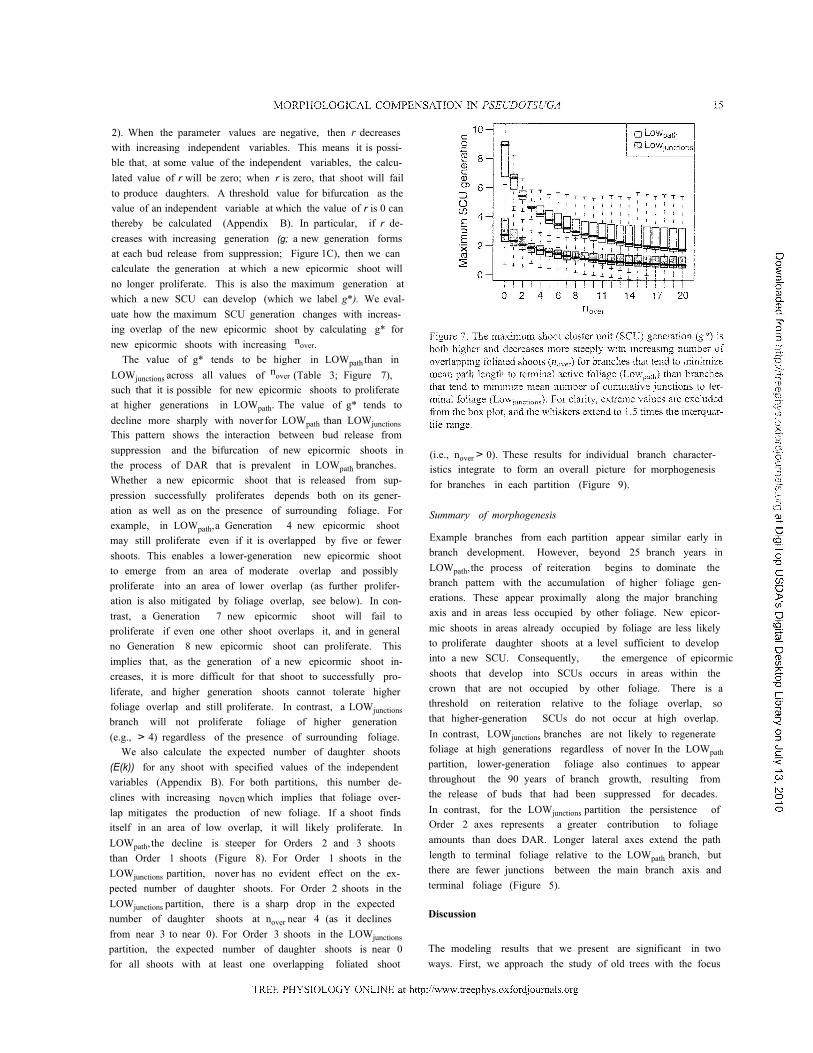
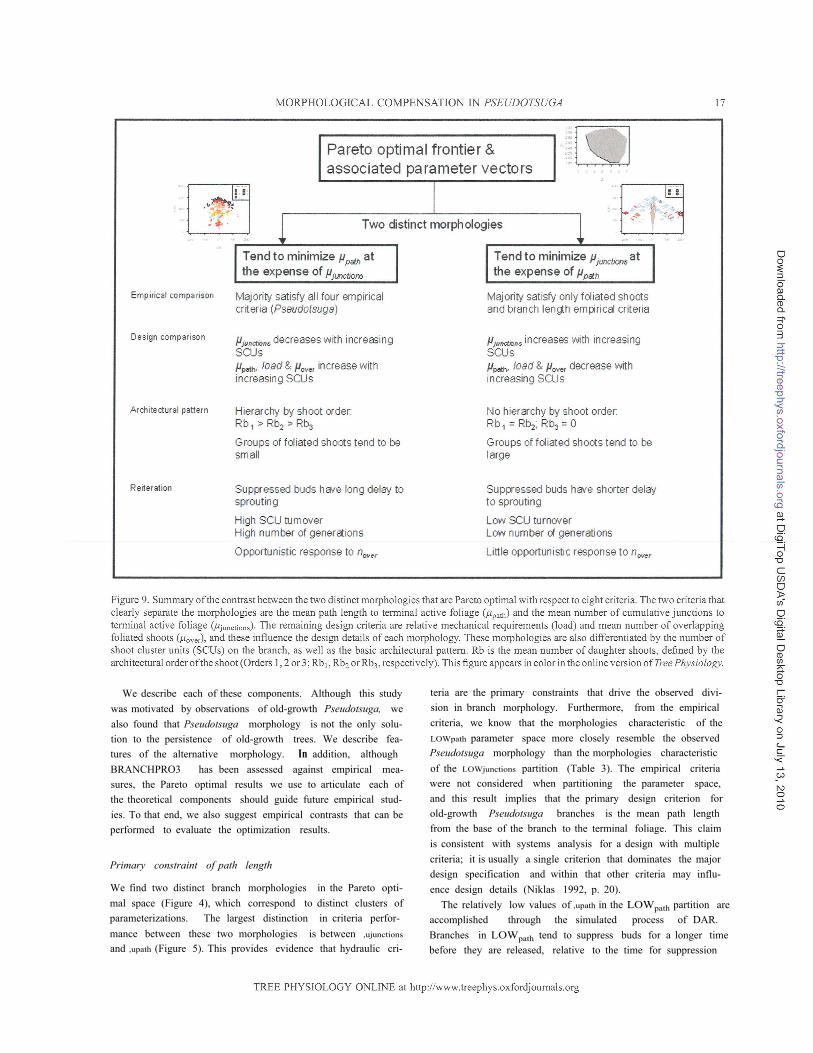
(i.e., nover > 0). These results for individual branch character-istics integrate to form an overall picture for morphogenesisfor branches in each partition (Figure 9).
Summary of morphogenesis
Example branches from each partition appear similar early inbranch development. However, beyond 25 branch years inLOWpath,the process of reiteration begins to dominate thebranch pattem with the accumulation of higher foliage gen-erations. These appear proximally along the major branchingaxis and in areas less occupied by other foliage. New epicor-mic shoots in areas already occupied by foliage are less likelyto proliferate daughter shoots at a level sufficient to developinto a new SCU. Consequently, the emergence of epicormicshoots that develop into SCUs occurs in areas within thecrown that are not occupied by other foliage. There is athreshold on reiteration relative to the foliage overlap, sothat higher-generation SCUs do not occur at high overlap.In contrast, LOWjunctions branches are not likely to regeneratefoliage at high generations regardless of nover In the LOWpathpartition, lower-generation foliage also continues to appearthroughout the 90 years of branch growth, resulting fromthe release of buds that had been suppressed for decades.In contrast, for the LOWjunctions partition the persistence ofOrder 2 axes represents a greater contribution to foliageamounts than does DAR. Longer lateral axes extend the pathlength to terminal foliage relative to the LOWpath branch, butthere are fewer junctions between the main branch axis andterminal foliage (Figure 5).
Discussion
The modeling results that we present are significant in twoways. First, we approach the study of old trees with the focus
2). When the parameter values are negative, then r decreaseswith increasing independent variables. This means it is possi-ble that, at some value of the independent variables, the calcu-lated value of r will be zero; when r is zero, that shoot will failto produce daughters. A threshold value for bifurcation as thevalue of an independent variable at which the value of r is 0 canthereby be calculated (Appendix B). In particular, if r de-creases with increasing generation (g; a new generation formsat each bud release from suppression; Figure 1C), then we cancalculate the generation at which a new epicormic shoot willno longer proliferate. This is also the maximum generation atwhich a new SCU can develop (which we label g*). We eval-uate how the maximum SCU generation changes with increas-ing overlap of the new epicormic shoot by calculating g* fornew epicormic shoots with increasing nover.
The value of g* tends to be higher in LOWpath than inLOWjunctions across all values of nover (Table 3; Figure 7),such that it is possible for new epicormic shoots to proliferateat higher generations in LOWpath. The value of g* tends todecline more sharply with nover for LOWpath than LOWjunctionsThis pattern shows the interaction between bud release fromsuppression and the bifurcation of new epicormic shoots inthe process of DAR that is prevalent in LOWpath branches.Whether a new epicormic shoot that is released from sup-pression successfully proliferates depends both on its gener-ation as well as on the presence of surrounding foliage. Forexample, in LOWpath,a Generation 4 new epicormic shootmay still proliferate even if it is overlapped by five or fewershoots. This enables a lower-generation new epicormic shootto emerge from an area of moderate overlap and possiblyproliferate into an area of lower overlap (as further prolifer-ation is also mitigated by foliage overlap, see below). In con-trast, a Generation 7 new epicormic shoot will fail toproliferate if even one other shoot overlaps it, and in generalno Generation 8 new epicormic shoot can proliferate. Thisimplies that, as the generation of a new epicormic shoot in-creases, it is more difficult for that shoot to successfully pro-liferate, and higher generation shoots cannot tolerate higherfoliage overlap and still proliferate. In contrast, a LOWjunctionsbranch will not proliferate foliage of higher generation(e.g., > 4) regardless of the presence of surrounding foliage.
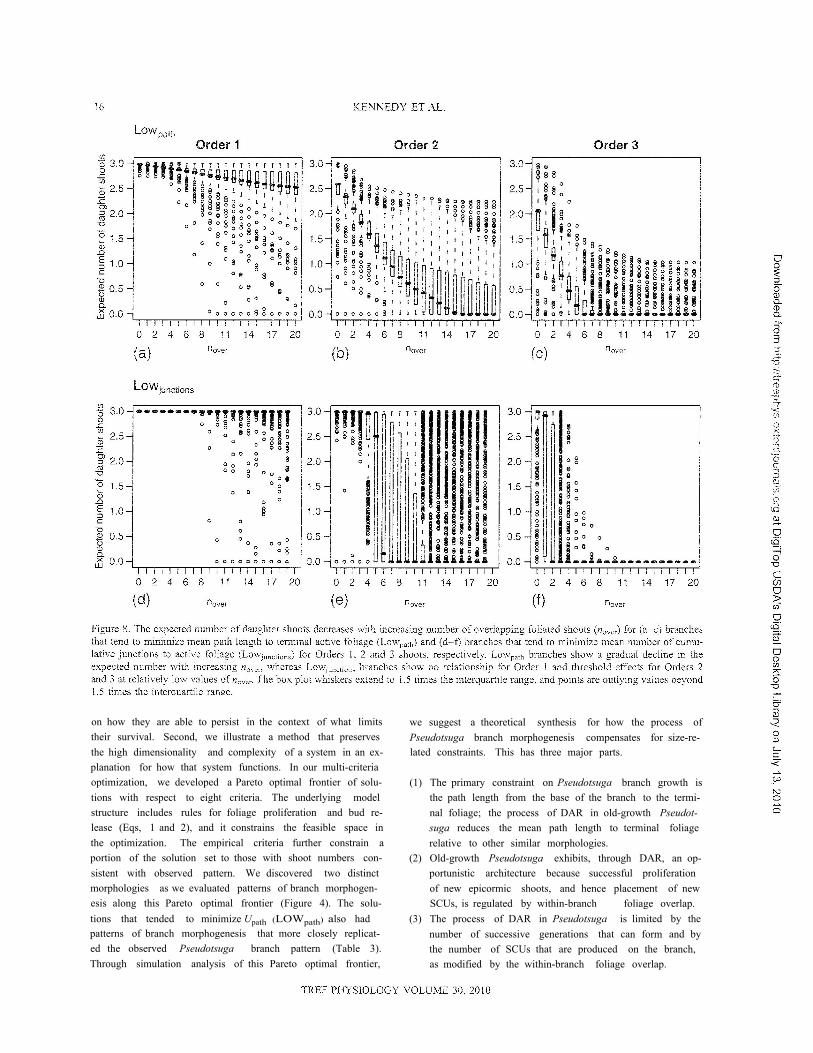
We also calculate the expected number of daughter shoots(E(k)) for any shoot with specified values of the independentvariables (Appendix B). For both partitions, this number de-clines with increasing novcn which implies that foliage over-lap mitigates the production of new foliage. If a shoot findsitself in an area of low overlap, it will likely proliferate. InLOWpath, the decline is steeper for Orders 2 and 3 shootsthan Order 1 shoots (Figure 8). For Order 1 shoots in theLOWjunctions partition, nover has no evident effect on the ex-pected number of daughter shoots. For Order 2 shoots in theLOWjunctions partition, there is a sharp drop in the expectednumber of daughter shoots at nover near 4 (as it declinesfrom near 3 to near 0). For Order 3 shoots in the LOWjunctionspartition, the expected number of daughter shoots is near 0for all shoots with at least one overlapping foliated shoot
we suggest a theoretical synthesis for how the process ofPseudotsuga branch morphogenesis compensates for size-re-lated constraints. This has three major parts.
(1) The primary constraint on Pseudotsuga branch growth isthe path length from the base of the branch to the termi-nal foliage; the process of DAR in old-growth Pseudot-suga reduces the mean path length to terminal foliagerelative to other similar morphologies.
(2) Old-growth Pseudotsuga exhibits, through DAR, an op-portunistic architecture because successful proliferationof new epicormic shoots, and hence placement of newSCUs, is regulated by within-branch foliage overlap.
(3) The process of DAR in Pseudotsuga is limited by thenumber of successive generations that can form and bythe number of SCUs that are produced on the branch,as modified by the within-branch foliage overlap.
on how they are able to persist in the context of what limitstheir survival. Second, we illustrate a method that preservesthe high dimensionality and complexity of a system in an ex-planation for how that system functions. In our multi-criteriaoptimization, we developed a Pareto optimal frontier of solu-tions with respect to eight criteria. The underlying modelstructure includes rules for foliage proliferation and bud re-lease (Eqs, 1 and 2), and it constrains the feasible space inthe optimization. The empirical criteria further constrain aportion of the solution set to those with shoot numbers con-sistent with observed pattern. We discovered two distinctmorphologies as we evaluated patterns of branch morphogen-esis along this Pareto optimal frontier (Figure 4). The solu-tions that tended to minimize Upath (LOWpath) also hadpatterns of branch morphogenesis that more closely replicat-ed the observed Pseudotsuga branch pattern (Table 3).Through simulation analysis of this Pareto optimal frontier,
teria are the primary constraints that drive the observed divi-sion in branch morphology. Furthermore, from the empiricalcriteria, we know that the morphologies characteristic of theLOWpath parameter space more closely resemble the observedPseudotsuga morphology than the morphologies characteristicof the LOWjunctions partition (Table 3). The empirical criteriawere not considered when partitioning the parameter space,and this result implies that the primary design criterion forold-growth Pseudotsuga branches is the mean path lengthfrom the base of the branch to the terminal foliage. This claimis consistent with systems analysis for a design with multiplecriteria; it is usually a single criterion that dominates the majordesign specification and within that other criteria may influ-ence design details (Niklas 1992, p. 20).
The relatively low values of ,upath in the LOWpath partition areaccomplished through the simulated process of DAR.Branches in LOWpath tend to suppress buds for a longer timebefore they are released, relative to the time for suppression
We describe each of these components. Although this studywas motivated by observations of old-growth Pseudotsuga, wealso found that Pseudotsuga morphology is not the only solu-tion to the persistence of old-growth trees. We describe fea-tures of the alternative morphology. In addition, althoughBRANCHPRO3 has been assessed against empirical mea-sures, the Pareto optimal results we use to articulate each ofthe theoretical components should guide future empirical stud-ies. To that end, we also suggest empirical contrasts that can beperformed to evaluate the optimization results.
Primary constraint of path length
We find two distinct branch morphologies in the Pareto opti-mal space (Figure 4), which correspond to distinct clusters ofparameterizations. The largest distinction in criteria perfor-mance between these two morphologies is between ,ujunctions
and ,upath (Figure 5). This provides evidence that hydraulic cri-
of buds on branches in the Lowjunctions partition (Table 3); thisplaces potential new seus more proximally along majorbranch axes. Furthermore, the evident turnover of seus inLOWpath means that the lengths of SCUs main axes are restrictedrelative to SCUs on branches in the Lowjunctions partition(Figure 4), which would reduce mean f.i.patll' Lateral axes inLOWpath are: also restricted in bifurcation relative to main axes(Table 3; Figure 8), and these show a greater degree of apicalcontrol than branches in the LOWjunctions partition. The effectof low apical control and higher Order 2 bifurcation in theLOWjunctions partition is that Order 2 axes are much longerfor LOWjunctions branches than for LOWpath branches, increasingthe path length to terminal foliage.
Opportunistic architecture
Our simulated observations support the fact that DAR is anopportunistic process (Halle et al. 1978, Oldeman 1978,Tomlinson 1983, Begin and Filion 1999). The model resultsclearly demonstrate that DAR is the main feature of branchmorphogenesis in the LOWpath partition, whereas increasedlateral growth is the main feature of branch morphogenesisin the LOWjuncticnspartition. This is shown by the greaternumber of SCUs on the simulated branches in LOWpath incontrast to the more regular pattern of growth as exhibitedby branches in the LOWjunctions partition (Figure 4). Reitera-tion begins with the release of a suppressed bud to form anepicormic shoot; in BRANCHPRO3, the success of the newepicormic shoot in producing daughter shoots varies with thelocal environment in which it emerges (e.g., on the number offoliated shoots that overlap it). In this sense, new epicormicshoots represent sampling points for the within-crown envi-ronment. Ifa bud forms a new epicormic shoot of high gen-eration and foliage overlap, then it is unlikely to successfullyproduce new shoots. SCUs of higher generation will onlyform when there are favorable light conditions to beexploited. The continual decrease in expected number ofdaughters with increasing nover for higher order shoots inLowpath (Figure 8) also ensures that investment in lateralgrowth is relative to favorable light conditions, althoughnot restricted to them. This then allows for an 'exploration'of the within-crown environment; shoots 'prosper' in areas oflow overlap and senesce in areas of high overlap. There isevidence that the Pseudotsuga crown is characterized by apatchy light environment (Parker et al. 2002, Parker et al.2004), and the opportunistic architecture may be an effectivemethod to explore such a patchy environment.
Reiteration is limited
Two pieces of evidence in the optimization suggest that reit-eration is limited. The first is the emergence of a maximumtheoretical generation for SCUs (g*) in branches character-ized by the Pareto optimal set. The median value of the max-imum generation at which a new seu can form amongsolutions in the LOWpath partition is 8.9, which is only slightlyhigher than the observed maximum of 7 for Pseudotsuga
(Table 3; Figure 7). This pattern emerged from the optimiza-tion of the four design criteria simultaneously, and the closecorrespondence between the values of g* in the LOWpath par-tition and the maximum observed generation in Pseudotsugaimplies that the limitation to reiteration in Pseudotsuga isrelated to the constraints represented by the design criteriain conjunction with the way in which the model regulatesthe proliferation of new epicormic shoots.
The value of g* is driven by a restriction of bifurcation atjunctions formed by the release of a bud from suppression;this implies that there is a significant hydraulic constrictionat epicormic junctions relative to the junctions formed byregular sequential growth. Schulte and Brooks (2003) showthat there is no evidence for hydraulic constriction at regu-lar branch junctions for young Pseudotsuga, and in generalhydraulic constrictions are measured at junctions of unequaldiameter (Tyree and Ewers 1991). Eisner et al. (2002) ob-serve that the ratio of conductivity between the branch andthe trunk decreases with decreasing diameter ratio (branchdiameter.trunk diameter). In Pseudotsuga, the difference indiameter at a junction could be greater for epicormic thanfor sequential junctions (e.g., compare diameter of new epi-cormie shoots to diameters of nearby lateral axes in Figure1B) because of the timing of the junction formation, whereinthe longer a bud is suppressed the greater is the disparity indiameter between the parent axis and the new epicormicaxis. Furthermore, although the accumulation of generationsis limited, the mean number of total junctions is higher inLOWpath relative to LOWjunctions. This implies that the con-striction at regular junctions may be less severe for LOWpath
relative to Lowjunctions.The second evidence for a limitation to reiteration in
Pseudotsuga is that the maximum number of SCUs observedin Pseudotsuga is comparable to the numbers of SCUs in themajority of solutions in the LOWpath partition. In Pseudotsuga,the maximum number of seus observed was 50, yet whenbranches were simulated without the constraints of the de-sign criteria, Kennedy et al. (2004) found that hundreds ofSCUs could accumulate. It would seem that the observedrange of seus may result as a compromise between thenumber of cumulative junctions (which decreases with SCUsin the LOWpath partition) and the remaining three criteria (allof which increase with SCUs in the LOWpath partition).
Pseudotsuga is not the only solution
The multiple Pareto optimal solutions show two distinctbranch morphologies, and the characteristics of the contrast-ing morphology (LOWjunctions) provide further insight intohow an alternative process of morphogenesis enables persis-tence in the old-growth canopy (Figure 9). Kennedy (2002)and Kennedy et al. (2004) also simulated branch develop-ment in Abies grandis (Dougl. ex D. Don) Lindl. at theWRCCRF, and the overall branching pattern and values ofbifurcation resemble those observed in the LOWjunctions parti-tion, though without epicormic proliferation. We propose

that the branch pattern characteristic of Lowjunctions resem-bles a more determinate branch pattern such as observedin the true firs like A. grandis (Figures 1A and 4B). Eventhough Abies is smaller and docs not live as long as Pseudot-suga (maximum age of 500 years for Abies in contrast to1200 years for Pseudotsuga), the two species do coexistfor some time in the old-growth canopy. The ability of Abiesto grow rapidly in relatively low light conditions enables it toeither match or even exceed Pseudotsuga when simulta-neously established or to quickly fill gaps; this means thatit often co-occurs as a canopy dominant (Leverenz andHinckley 1990), and it can achieve comparable heights(Van Pelt 2001). This procedure illustrates how different spe-cies exhibit diverse pathways to achieve sustained growth un-der a similar set of multiple, conflicting constraints. Thesepathways are influenced by the underlying physiology andlife history of the species.
Suggestions for empirical evaluation of optimization results
BRANCHPRO3 was assessed against a set of empirical ob-servations of Pseudotsuga morphology and based on the cur-rent state of knowledge of size-related constraints in trees.The search for empirical evidence, however, should not endwith the modeling exercise, and the simulation results aremost useful if they can guide furore avenues of empirical ob-servation (Schmitz 2000). For example, there are implicationsfor theory component 1 with respect to the effect of extremepath length on water relations. Although the bulk of resis-tance to water flow is in the last meter of the hydraulic path-way (Tyree and Ewers 1991), the total resistance depends onthe entirety of the pathway from roots to leaves; e.g., the re-sistance in the last meter for foliage at the end of a 50-m path-way may be more relatively severe than the resistance in thelast meter for foliage at the end of a 10-m pathway. Ishii et al.(2008) show that, in large Sequoia sempervirens trees, foliagewater potential during the wet season is lower (i.e., more neg-ative) in the outer crown relative to the inner crown; their Fig-ure lA implies that the more negative water potential is morepronounced at the upper range of observed heights than thelower range. The effect of path length may be incrementallymore severe at the top of large trees relative to smaller trees,the cause of which may include greater evaporative demand.We propose three empirical contrasts that can be made withold-growth Pseudotsuga to evaluate the effect of path lengthin the branches of large trees. (i) Douglas-fir in Southern Ca-lifornia (Pseudotsuga macrocarpa (Vasey) Mayr) is able toachieve massive crown spread and branch lengths (Gause1966, Bolton and Vogi 1969) but does not achieve similarheight to Pseudotsuga in the Pacific Northwest. The in-creased hydraulic resistance with branch path length maynot be as severe in the shorter trees. (ii) The effect of pathlength can be evaluated for young small Pseudotsuga treesrelative to old large trees. This would determine whetherthe effect of path length differs between trees of varyingage and height. (iii) The path lengths should be measured
in Pseudotsuga branches and compared to path lengths ofAbies. Kennedy et al. (2004) observe that A. grandisbranches tend to be shorter in length and younger in age thanPseudotsuga. Shorter branches would have reduced pathlengths relative to those simulated in the Lowjunctions partitionand would compensate for the trade-off between Upath andUjunctions. If empirical investigation shows that path lengthis not relatively constraining (i.e., does not affect water po-tentials with path lengths < 40 cm), then theory component 1must be re-evaluated in the context of BRANCHPR03. Itmay be that path length is correlated with another componentof the branch morphology that provides a major design spec-ification but was not calculated as a design criterion inBRANCHPR03.
To evaluate whether there is a severe hydraulic constrictionat new epicormic junctions, relative conductivity should bemeasured at epiconnic junctions and compared to junctionsformed by regular lateral growth. If a constriction is detected,then the factors that change the severity of the constrictionshould also be considered (e.g., the age of the bud or therelative diameter of the new epicormic shoot to its parent).If it is found that epiconnic constrictions are no more severethan constrictions at lateral junctions or that the constrictionis independent of epicormic generation, then there is likelyan alternative explanation for the limitation of reiteration inPseudotsuga.
The effect of the light environment on the process of reit-eration should also be evaluated. The relationship we proposeis that morphogenesis is an opportunistic process that re-sponds to a variable within-crown light environment. Thisshould be evaluated through observation of changes in thefrequency of bifurcation and SCD production relative to thelight environment experienced by within-crown shoots aswell as the presence of neighboring foliage within branchesof Pseudotsuga.
Multi-criteria optimization and theory development
We show that the use of multi pie criteria is a powerful tool toexplain variability in optimal behavior (Schmitz et al. 1998)when the relative contributions of the criteria to overall plantperformance are unknown. Farnsworth and Niklas (1995)state that 'We have already indicated our belief that most,if not all, of the Pareto optimal solutions will be acceptedin natural selection given a range of environmental circum-stances and strategy options.' Rothley et a1. (1997) provideevidence for this assertion in an optimal foraging examplethat shows how the actual behavior of grasshoppers movesalong a Pareto optimal frontier of vigilance and energy in-take depending on the predation pressure, and Vrugt et al.(2007) apply it to the flight paths of migratory birds (withpreliminary evidence that the trade-off between energy spentand flight time corresponds to actual flight path choices).Given the difficulty in quantifying a single currency that re-liably predicts optimal fitness across environments and lifehistories, a multi-criteria optimization tool allows us to char-
acterize the morphologies that correspond to Pareto optimalcriteria combinations. This methodology explicitly accommo-dates variability in optimal behavior within the constraints ofthe model and optimization criteria. Using an FSM and fourdesign criteria, we were able to uncover why an alternativemorphology such as that characterized by Abies may alsobe successful in a similar environment. This was possiblewhen multiple system features were integrated into a compre-hensive explanation of an observed phenomenon.
The contrast between the two morphologies cannot be ex-plained solely by the Pareto optimal results but also throughthe consideration of those results in the context of the envi-ronment and life history of the two species. Whereas Pseu-dotsuga is a long-lived pioneer that persists through allsuccessional stages in the Pacific Northwest Abies tends tobe a shade-tolerant secondary species that establishes andpersists in a light-limited understory environment. Abiesmaintains a level of foliage in the understory, with sufficientphotosynthetic capacity that allows it to emerge and respondto gaps formed by overstory disturbance. This is similar tothe changes in expected bifurcation at threshold values ofnover- whereby at zero foliage overlap all three shoot ordershave the maximum number of expected daughter shoots inthe LOWjunctions partition but zero proliferation at higher nover-
For shade-acclimated understory trees, there is a lag betweenthe exposure to increased light and increased growth (Tuckeret al. 1987). This is an extreme response to changes in lightconditions, which contrasts to the effective 'search' of agiven environment as implied by the gradual response ofsimulated Pseudotsuga-like branches to the value of nover-The differences in life history traits between Pseudotsugaand Abies are reflected in their locations along the Paretooptimal frontier, thereby demonstrating the advantage ofusing multi-criteria optimization.
For the paradigm of optimality theory in the study of com-plex biological phenomena, it is valuable to include the si-multaneous optimization of multiple values that reflect themany interacting processes in organisms and ecosystems.This is particularly important under incomplete understand-ing of how multiple features integrate to determine whole-system functioning. This new component of the paradigmspecifies that multiple features act as constraints and thatthe observed systems are consequences of their simultaneousand often synergistic effects. The individual system repre-sents one among many possible solutions to the requirementsimposed by the organism and the constraints.
Supplementary data
Supplementary data for this article are available at TreePhysiology Online.
Acknowledgments
as Joel Reynolds, Hiroaki Ishii, Don Mckenzie, N. Bert Loosmoreand two anonymous reviewers for comments on earlier drafts thatgreatly improved the manuscript.
References
Acker, S., C. Halpern, M. Harmon and C. Dymess. 2002. Trends inbole biomass accumulation, net primary production and tree mor-tality in Pseudotsuga menziesii forests of contrasting age. TreePhysiol, 22:213-217.
Bachelard, E. 1969. Studies on the formation of epicormic shoots oneucalypt stem segments. Aust J. Bioi. Sci. 22:1291·-1296.
Barnard, H. and M. Ryan. 2003. A test of the hydraulic limitation hy-pothesis in fast-growing Eucalyptus saligna. Plant Cell Environ.26:1235-1245.
Begin, c. and L. Filion. 1999. Black spruce (Picea mariana) archi-tecture. Can. J. Bot. 77:664-672.
Bolton, R. and R. Vogi. 1969. Ecological requirements of Pseudat-suga macrocarp a in Santa A..na mountains California. J. For.67:112-116.
Bond, B. 2000. Age-related changes in photosynthesis of woodyplants. Trends Plant Sci. 5:349-353.
Bryan, J. and R. Laurier. 1981. Epicormic branching in RockyMountain Douglas-fir. Can. J. For. Res. 11:190-199.
Cannell, M. 1989. Physiological basis of wood production: a review.Scand. J. For. Res. 1989:459-490.
Cermak, J., J. Kucera, W. Bauerle, N. Phillips and T. Hinckley. 2007.Tree water storage and its diurnal dynamics related to sap flowand changes in stem volume in old-growth Douglas-fir trees. TreePhysiol. 27:181-198.
Cirillo, R. 1979. The economics ofVilfredo Pareto. Frank Cass andCompany Ltd, Totowa, NJ.
Cohen, J. 1978. Multiobjective programming and planning. InMathematics Science and Engineering. Ed. R. Bellman. AcademicPress, New York.
Deb, K. 2001. Multi-objective optimization using evolutionaryalgorithms. John Wiley & Sons, Chichester.
Eisner, N., E. Gilman, J. Grabosky and R. Beeson. 2002. Branchjunction characteristics affect hydraulic segmentation in red maple.J. Arboric. 28:245-251.
Ewers, F. and M. Zimmermann. 1984a. The hydraulic architecture ofbalsam fir (Abies-baisameai. Physiol. Plant. 60:453-458.
Ewers, F. and M. Zimmermann. 1984b. The hydraulic architecture ofeastern hemlock (Tsuga-canadensiss. Can. J. Bot. 62:940-946.
Farnsworth, K. andK. Niklas, 1995. Theories of optimization, form andfunction in branching architecture in plants. Funct. Ecol. 9:355-363.
Fournier, C. and B. Andrieu. 1999. ADEL-maize: an L-system basedmodel for the integration of growth processes from the organ tothe canopy. Agronomie 19:313-327.
Franklin, J. and C. Dyrness. l 973. Natural vegetation of Oregon andWashington. USDA, Forest Service, Portland, OR, PNW-8.
Friih, T. 1997. Simulation of water flow in the branched tree archi-tecture. Silva Fenn. 31 :275-284.
Gause, G. 1966. Silvical characteristics of bigcone Douglas-fir(Pseudotsuga macrocarpa [Vasey] Mayr). U.S.D.o. Agriculture,Berkeley, CA, 10 pp.
Godin, C. and H. Sinoquet. 2005. Functional-structural plant modeling.New Phytol. 166:705-708.
Gower, S., R. McMurtie and D. Murty. 1996. Aboveground netprimary production decline with stand age: potential causes.Trends Ecol. Evo1. II :378-382.
Grier, C. and R. Logan. 1977. Old-growth Pseudotsuga menziesiicommunities of a western Oregon watershed: biomass distributionand production budgets. Ecol. Monogr. 47:373-400.
The authors would like to thank Mark Kot and Charles Laird foruseful comments throughout the development of this project as well
Halle, E, R. Oldeman and P. Tomlinson. 1978. Tropical Trees andForests. An Architectural Analysis. Springer Verlag, New York.
Herman, R. and D. Lavender. 1990. Pseudotsuga menziesii (Mirb.)Franco. Douglas-Fir. In Silvics of North America Volume 1.Conifers. Eds. R. Burns and B. Honkala. Forest Service, UnitedStates Department of Agriculture, Washington, DC.
Honda, H. 1971. Description of the forms of trees by parameters ofthe tree-like body: effects of branching angle and branch lengthon the shape of the tree-like body. J. Theor. Bioi. 31:331-338.
Honda, H. and J. Fisher. 1978. Tree branch angle: maximizing effec-tive leaf area. Science 199:888-890.
Honda, H. and J. Fisher. 1979. Ratio of tree branch lengths: the eq-uitable distribution of leaf clusters on branches. Proc. Natl. Acad.Sci. USA 76:3875-3879.
Hubbard, R., B. Bond and M. Ryan. 1999. Evidence that hydraulicconductance limits photosynthesis in old Pinus ponderosa trees.Tree Physiol. 19:165-172.
Hubbard, R., B. Bond, R. Senock and M. Ryan. 2002. Effects ofbranch height on leaf gas exchange, branch hydraulic conduc-tance and branch sap flux in open-grown ponderosa pine. TreePhysiol. 22:575-581.
Hunt, E.J., M. Lavigne and S. Franklin. 1999. Factors controlling thedecline of net primary production with stand age for balsam fir inNewfoundland assessed using an ecosystem simulation model.Ecol. Mode!. 122:151-164.
Ishii, H. and E.D. Ford. 2001. The role of epicormic shoot produc-tion in maintaining foliage in old Pseudotsuga menziesii (Dou-glas-fir) trees. Can. J. Bot. 79:251-264.
Ishii, H. and E.D. Ford. 2002. Persistence of Pseudotsuga menziesii(Douglas-fir) in temperate coniferous forests of the Pacific North-west Coast, USA. Folia Geobot. 37:63-69.
Ishii, H. and N. McDowell. 2002. Age-related development ofcrown structnre in coastal Douglas-fir trees. For. Ecol. Manage.169:257-270.
Ishii, H. and M. Wilson. 2001. Crown structure of old-growth Dou-glas-fir in the western Cascade Range, Washington. Can. J. For.Res. 31:1250-1260.
Ishii, H., 1. Reynolds, E.D. Ford and D. Shaw. 2000. Height growthand vertical development of an old-growth Pseudotsuga-Tsugaforest in southwestern Washington State, U.S.A. Can. J. For.Res. 30: 17-24.
Ishii, H., E.D. Ford and C. Dinnie. 2002. The role of epicormic shootproduction in maintaining foliage in old Pseudotsuga menziesii(Douglas-fir) trees II. Basal reiteration from older branches.Can. 1. Bot. 80:916-926.
Ishii, H., E. Ford and D. Sprugel. 2003. Comparative crown formand branching pattern of feur co-existing tree species in an old-growth Pseudotsuga-Tsuga forest. Eurasian J. For. Res. 6:99-109.
Ishii, H., E. Ford and M. Kennedy. 2007. Physioiogical and ecolog-ical implications of adaptive reiteration as a mechanism for crownmaintenance and longevity. Tree Physio!. 27:455-462.
Ishii, H., G. Jennings, S. Sillett and G. Koch. 2008. Hydrostatic con-straints on morphological exploitation oflight in tall Sequoia sem-pervirens trees. Oecologia 156:751-763.
Kaitaniemi, P., J. Hanan and P. Room. 2000. Virtnal sorghum: vi-sualisation of partitioning and morphogenesis. Cornput. Electron.Agric. 28: 195-205.
Kennedy, M. 2002. A Geometric Simulation Model of FoliageRegeneration in Abies grandis and Pseudotsuga menziesii. MScThesis. University of Washington, Seattle, WA.
Kennedy, M. 2008. Multi-objective Optimization for EcologicalModel Assessment and Theory Development. PhD Dissertation,University of Washington, Seattle, WA.
Kennedy, M. and E.D. Ford. 2009. Two-criteria model assessmentshows that foliage maintenance in old-growth Pseudotsuga men-ziesii requires both delayed and sequential reiteration. Treesdoi: 10. 1007/s00468-009-0357-5.
Kennedy, M., E. Ford and H. Ishii. 2004. Medel analysis of the im-portance of reiteration tor branch longevity in Pseudotsuga men-ziesii compared with Abies grandis. Can. J. Bot. 82:892-909.
Kennedy, M., E. Ford, P. Singleton, M. Finney and J. Agee. 2008.Informed multi-objective decision-making in environmental man-agement using Pareto optimality. J. Appl. Ecol. 45:181-192.
Kim, K.-J. and R. Smith. 2005. Systematic procedure for designingprocesses with multiple environmental objectives. Environ. Sci.Technol. 39:2394-2405.
Komuro, R., E. Ford and J. Reynolds. 2006. The use of multi-criteriaassessment in developing a process model. Ecol, Model. 197:320-330.
Kormanik, P. and C. Brown. 1969. Origin and development of epicor-mic branches in sweetgum. USDA For. Servo Res. Rep. SE-54.
Lanner, R. 2002. Why do trees Jive so 10ng0 Ageing Res. 1:653-671.Larson, P. and J. Isebrands. 1978. Functional significance of the nod-
al constricted zone in Populus deltoides. Can. J. Bot. 56:801-804.Leverenz, J. and T. Hinckley. 1990. Shoot structure, leaf area index
and productivity of evergreen conifer stands. Tree Physiol.6:135-149.
McDowell, N., H. Barnard and B. Bond et al. 2002a. The rela-tionship between tree height and leaf area: sapwood area ratio.Oecologia 132:12-30.
McDowell, N., N. Phillips, C. Lunch, B. Bond et al.and M. Ryan.2002b. An investigation of hydraulic limitation and compensationin large, old Douglas-fir trees. Tree Physiol. 22:763-774.
Mencuccini, M. and J. Grace. 1996. Hydraulic conductance, lightinterception and needle nutrient concentration in Scots pine standsand their relations with net primary productivity. Tree Physiol.16:459-468.
Minore, D. 1979. Comparative autecological characteristics of north-western tree species: a literatnre review. Pacific Northwest Forestand Range Experiment Station, U.S. Dept. of Agriculture, ForestService, Portland, OR.
Minore, D. 1990. Thuja plicata Donn ex D. Don Western Redcedar,In Silvics of North America Volume I. Conifers. Eds. R. Bumsand B. Honkala. Forest Service, United States Department of Ag-riculture, Washington, DC.
Morgan, J. and M. Cannell. 1988. Support costs of different branchdesigns-effects of position, number, angle and deflection oflaterals. Tree Physiol. 4:303-313.
Nicolini, E., B. Chanson and F. Bonne. 2001. Stem growth andepicorrnic branch formation in understory beech trees (Fagussylvatica L.). Ann. Bot. 87:737-750.
Nicolini, E., Y. Caraglio, R. Pelissier, C. Leroy and J.-C. Roggy.2003. Epicormic branches: a growth indicator for the tropicalforest tree, Dicorynia guianensis Amshoff (Caesalpiniaceae).Ann. Bot. 92:97-105.
Niklas, K. 1992. Plant Biomechanics. An Engineering Approach toPlant Form and Function. The University of Chicago Press,Chicago.
NikJas, K. 1999. Evolutionary walks through a plant morphospace.J. Exp. Bot. 330:39-52.
Odum, E. 1969. The strategy of ecosystem development. Science164:262-270.
Oldeman, R. J978. Architecture and energy exchange of dicotyle-denous trees in the forest. In Tropical Trees as Living Systems.Eds. P. Tomlinson and M. Zimmermann. Cambridge UniversityPress, Cambridge.
Panek, J.A. and R.H. Waring. 1995. Carbon isotope variation inDouglas-fir foliage: improving the 513C-climate relationship.Tree Physiol. 15:657-663.
Parker, G., M. Davis and S. Chapotin. 2002. Canopy light transmit-tance in Douglas-fir-western hemlock stands. Tree Physiol. 22:147-157.
Parker, G., M. Hannon and M. Lefsky et al. 2004. Three-dimension-al structure of an old-growth Pseudotsuga- Tsuga canopy and itsimplications for radiation balance, microclimate, and gas ex-change. Ecosystems 7:440-453.
Pearcy, R., H. Muraoka and F. Valladares. 2005. Crown architecturein sun and shade environments: assessing function and trade-offswith a three-dimensional simulation model. New Phytol. 166:791-800.
Phillips, N., M. Ryan, B. Bond, N. McDowell, T. Hinckley and J.Cermak. 2003. Reliance on stored water increases with tree sizein three species in the Pacific Northwest. Tree Physiol. 22:237-245.
Press, W., B. Flannery, S. Teukolsky and W Vetterling. 1999. Nu-merical Recipes in C: The Art of Scientific Computing. Cam-bridge University Press, New York.
Reffye, P.D., T. Fourcaud, F. Blaise, D. Barthelemy and F. Houllier.1997. A functional model of tree growth and tree architecture.Silva Fenn. 31 :297-311.
Remphrey, W. and C. Davidson. 1992. Spatiotemporal distributionof epiconnic shoots and their architecture in branches of Fraxinuspennsyivanica. Can. J. For. Res. 22:336-340.
Reynolds, I. and E. Ford. 1999. Multi-criteria assessment of ecolog-ical process models. Ecology 80:538-553.
Rothley, K., O. Schmitz and I. Cohon. 1997. Foraging to balanceconflicting demands: novel insights from grasshoppers under pre-dation risk. Behav. Ecol. 8:551-559.
Ryan, M. and B. Yoder. 1997. Hydraulic limits to tree height and treegrowth. Bioscience 47:235-242.
Ryan, M., D. Binkley and I. Fownes. 1997. Age-related decline inforest productivity: pattern and process. Adv. Ecol. Res. 27:213-262.
Ryan, M., D. Binkley, J. Fownes, C. Giardina and R. Senock. 2004.An experimental test of the causes of forest growth decline withstand age. Ecol. Monogr. 74:393-414.
Schmitz, O. 2000. Combining field experiments and individual-based modeling to identity the dynamically relevant organizationscale in a field system. Oikos 89:471-484.
Schmitz, O., J. Cohon, K. Rothley and A. Beckerman. 1998. Recon-ciling variability and optimal behaviour using multiple criteria inoptimization models. Evol. Ecol. 12:73-94.
Schulte, P. and J. Brooks. 2003. Branch junctions and the flow ofwater through xylem in Douglas-fir and ponderosa pine stems.J. Exp. Bot. 54:1597-1605.
Shaw, D., J. Franklin, K. Bible, I. Klopatek, E. Freeman, S. Greeneand G. Parker. 2004. Ecological setting of the wind river old-growth forest. Ecosystems 7:427-439.
Sievanen, R., E. Nikinmaa, P. Nygrwn, H. Ozier-Lafontaine, J. Pert-tun en and H. Hakula. 2000. Components of functional-structuraltree models. Ann. For. Sci. 57:399-412.
Smith, J. 1978. Optimization theory in evolution. Annu. Rev. Ecol.Syst. 9:31-56.
Statnikov, R. and J. Matusov. 1995. Multicriteria Optimizaton andEngineering. Chapman and Hall, New York.
Sterck, F. and F. Schieving. 2007. 3-D growth patterns of trees: ef-fects of carbon economy, meristem activity, and selection. Ecol.Monogr. 77:405-420.
Sterck, F., F. Schieving, A. Lemmens and T. Pons. 2005. Performanceof trees in forest canopies: explorations with a bottom-up function-al-structural plant growth model. New Phytol. 166:827-844.
Tomlinson, P. 1983. Tree architecture. Am. Sci. 71:141-149.Tucker, G., T. Hinckley, J. Leverenz and S.-M. Jiang. 1987. Ad-
justments of foliar morphology in the acclimation of understoryPacific silver fir following clearcutting. For. Ecol. Manage. 21:249-268.
Turley, M. 200 I. Investigating alternative ecological theories usingmultiple criteria assessment with evolutionary computation. PhDDissertation, University of Washington, Seattle, WA.
Turley, M.e. and E.D. Ford. 2009. Definition and calculation of un-certainty in ecological process models. Ecol. Model 220: 1968-1983.
Tyree, M. and I. Alexander. 1993. Hydraulic conductivity of branchjunction in three temperate tree species. Trees 7: 156-159.
Tyree, M. and F. Ewers. 1991. Tansley Review No. 34. The hydrau-lic architecture of trees and other woody plants. New Phytol.119:345-360.
Tyree, M. and M. Zimmermann. 2002. Xylem Structure and theAscent of Sap. Springer-Verlag, Berlin.
Van Pelt, R. 2001. Forest giants of the Pacific Coast. University ofWashington Press, Seattle.
Van Pelt, R. and S. Sillett. 2008. Crown development of coastalPseudotsuga menziesii, including a conceptual model for tallconifers. Ecol. Monogr. 78:283-311.
Vrugt, J.A., J. van Belle and W Bouten. 2007. Pareto front analysisof flight time and energy use in long-distance bird migration. I.Avian BioI. 38:432-442.
Walcroft, A.S., W.B. Silvester, J.C. Grace, S.D. Carson and R.H.Waring. 1996. Effects of branch length on carbon isotope discrim-ination in Pinus radiata. Tree Physiol. 16:281-286.
Waring, R. and W. Silvester. 1994. Variation in foliar 513 valueswithin the crowns of Pinus radiata. Tree Physiol. 14:1203-1213.
Warren, J., F. Meinzer, J. Brooks, J. Domec and R. Coulombe.2007. Hydraulic redistribution of soil water in two old-growthconiferous forests: quantifying patterns and controls. New Phytol.173:753-765.
Westing, A. 1964. The longevity and aging of trees. Gerontologist4:10-15.
Wignall, T., G. Browning and K. MacKenzie. 1987. The physiol-ogy of epiconnic bud emergence in Pedunculate Oak (Quercusrobur L.) Responses to partial notch girdling in thinned and un-thinned stands. Forestry 60:45-56.
Woodruff, D., B. Bond and F. Meinzer. 2004. Does turgor limitgrowth in tall trees? Plant Cell Environ. 27:229-236.
Wright, S. 1932. The roles of mutation, inbreeding, and cross-breeding and selection in evolution. In Proceedings of the 6thInternational Congress of Genetics. Ed. D.F. Jones. Menasha,WI, pp 356-366.
Wright, S. 1988. Surfaces of selective value revisited. Am. Nat.131:115-123.
Zimmermann, M. 1978. Hydraulic architecture of some diffuse-poroustrees. Can. J. Bot. 56:2286-2295.


![Index [assets.cambridge.org]...Index Abdera flexuosa, 170 Abies, 130, 288, 289 Abies alba, 135 Abies sibirica, 283 abiotic environment, 194–201 above-ground environments, 200–205](https://img.pdfslide.us/doc/110x75/60dc1344b5babd1c6847e185/index-index-abdera-flexuosa-170-abies-130-288-289-abies-alba-135-abies.jpg)