Embed Size (px)
Citation preview
Nebraska Public Employees Retirement Systems
Defined Contribution and Cash Balance Plans
Presented to the NCSL Legislative Summit Seattle, Washington
By Phyllis Chambers, NPERS Executive Director August 5, 2015
NPERS administers six retirement plans with 122,000 members and $12.7 billion in assets.
School – DB – established 1946
State Patrol – DB – 1947
Judges – DB – 1955
State – DC – 1964 and CB – 2003
County – DC – 1965 and CB – 2003
Deferred Compensation (DCP) – 1976
2
NPERS Overview
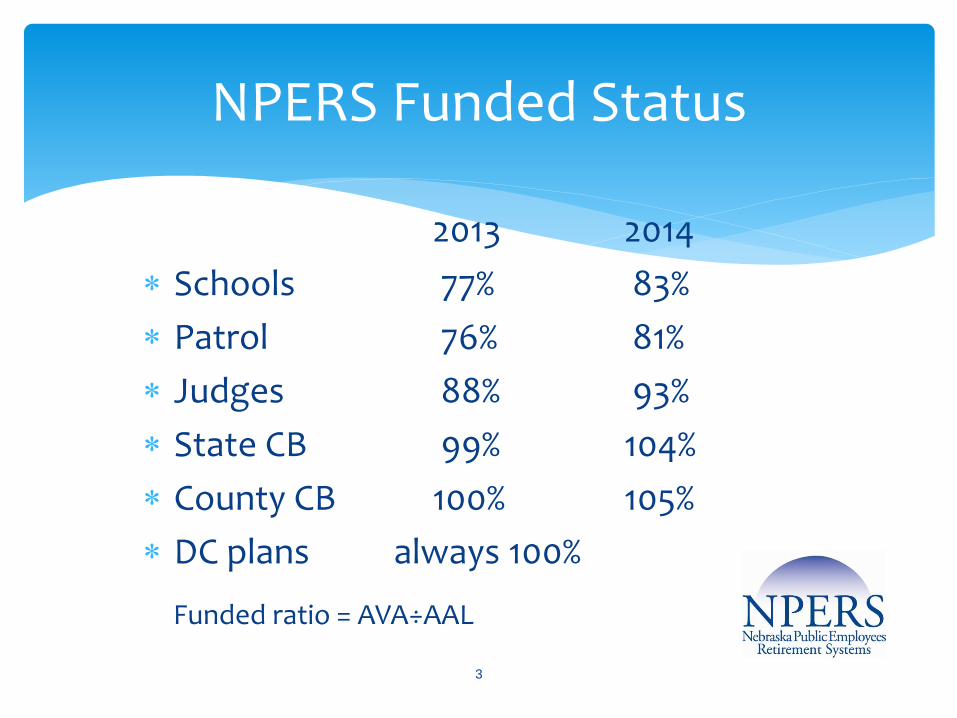
2013 2014
Schools 77% 83%
Patrol 76% 81%
Judges 88% 93%
State CB 99% 104%
County CB 100% 105%
DC plans always 100%
Funded ratio = AVA÷AAL
3
NPERS Funded Status
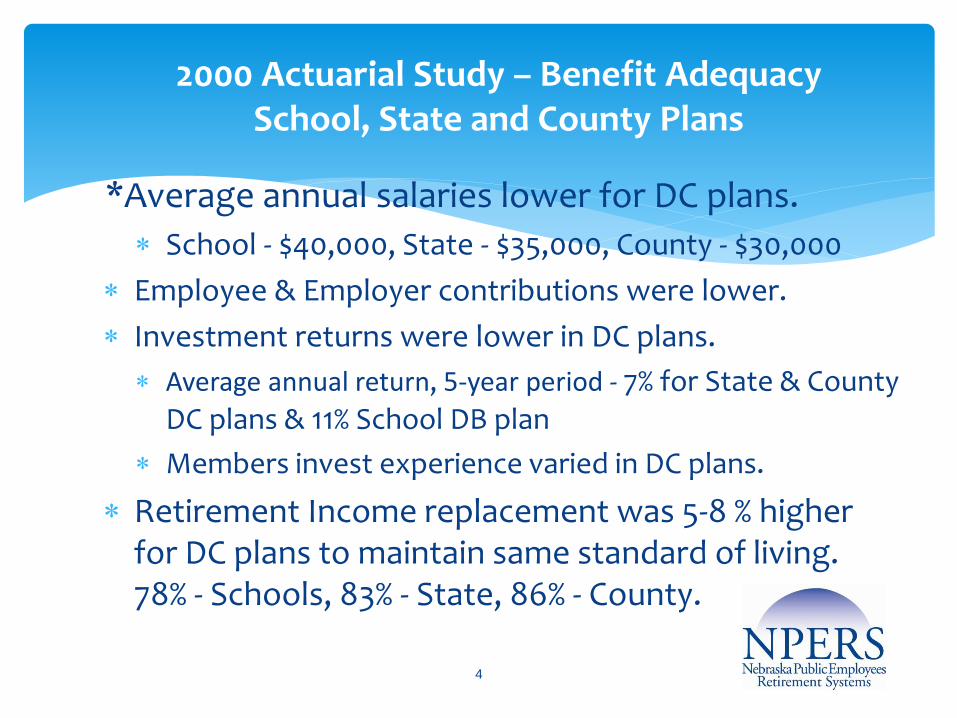
*Average annual salaries lower for DC plans.
School - $40,000, State - $35,000, County - $30,000
Employee & Employer contributions were lower.
Investment returns were lower in DC plans.
Average annual return, 5-year period - 7% for State & County DC plans & 11% School DB plan
Members invest experience varied in DC plans.
Retirement Income replacement was 5-8 % higher for DC plans to maintain same standard of living. 78% - Schools, 83% - State, 86% - County.
4
2000 Actuarial Study – Benefit Adequacy School, State and County Plans
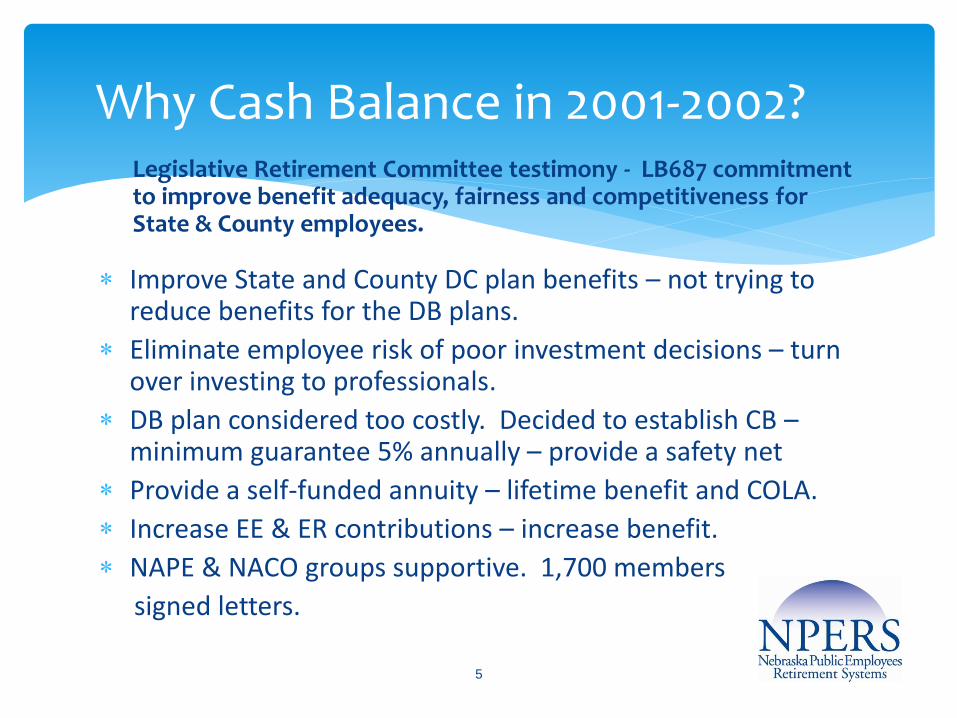
Legislative Retirement Committee testimony - LB687 commitment to improve benefit adequacy, fairness and competitiveness for State & County employees.
Improve State and County DC plan benefits – not trying to reduce benefits for the DB plans.
Eliminate employee risk of poor investment decisions – turn over investing to professionals.
DB plan considered too costly. Decided to establish CB –minimum guarantee 5% annually – provide a safety net
Provide a self-funded annuity – lifetime benefit and COLA.
Increase EE & ER contributions – increase benefit.
NAPE & NACO groups supportive. 1,700 members
signed letters.
5
Why Cash Balance in 2001-2002?
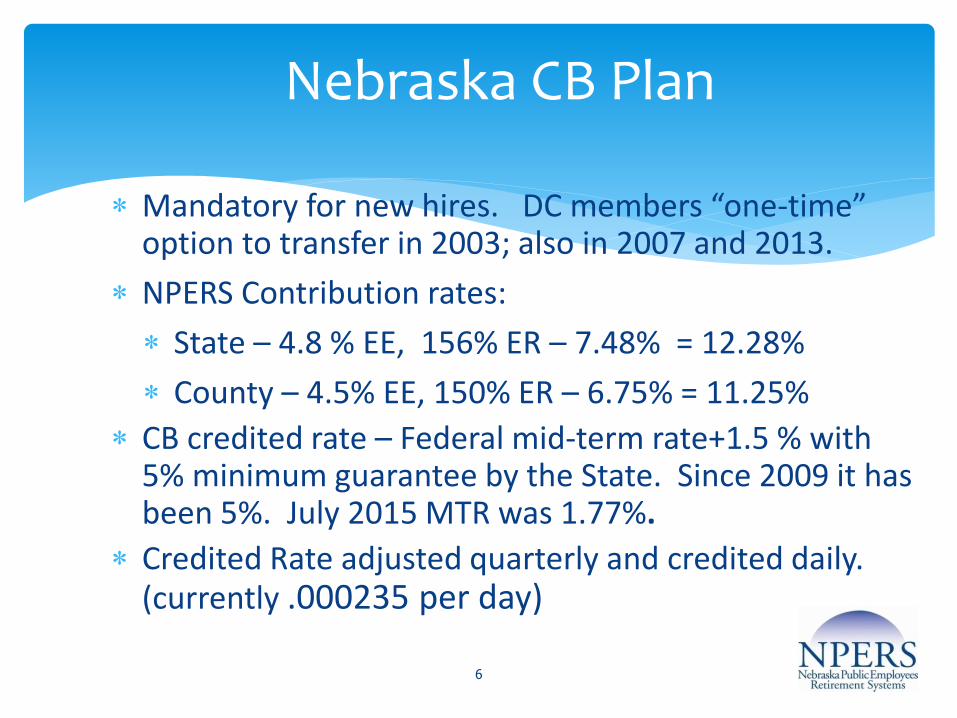
Mandatory for new hires. DC members “one-time” option to transfer in 2003; also in 2007 and 2013.
NPERS Contribution rates:
State – 4.8 % EE, 156% ER – 7.48% = 12.28%
County – 4.5% EE, 150% ER – 6.75% = 11.25%
CB credited rate – Federal mid-term rate+1.5 % with 5% minimum guarantee by the State. Since 2009 it has been 5%. July 2015 MTR was 1.77%.
Credited Rate adjusted quarterly and credited daily. (currently .000235 per day)
6
Nebraska CB Plan
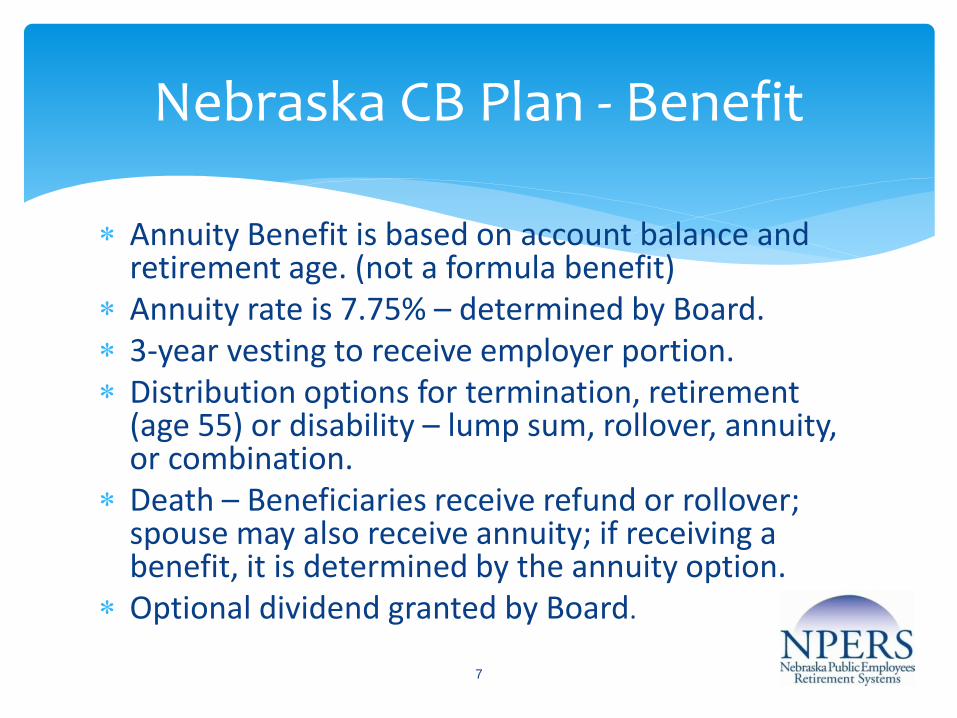
Annuity Benefit is based on account balance and retirement age. (not a formula benefit)
Annuity rate is 7.75% – determined by Board. 3-year vesting to receive employer portion. Distribution options for termination, retirement
(age 55) or disability – lump sum, rollover, annuity, or combination.
Death – Beneficiaries receive refund or rollover; spouse may also receive annuity; if receiving a benefit, it is determined by the annuity option.
Optional dividend granted by Board.
7
Nebraska CB Plan - Benefit
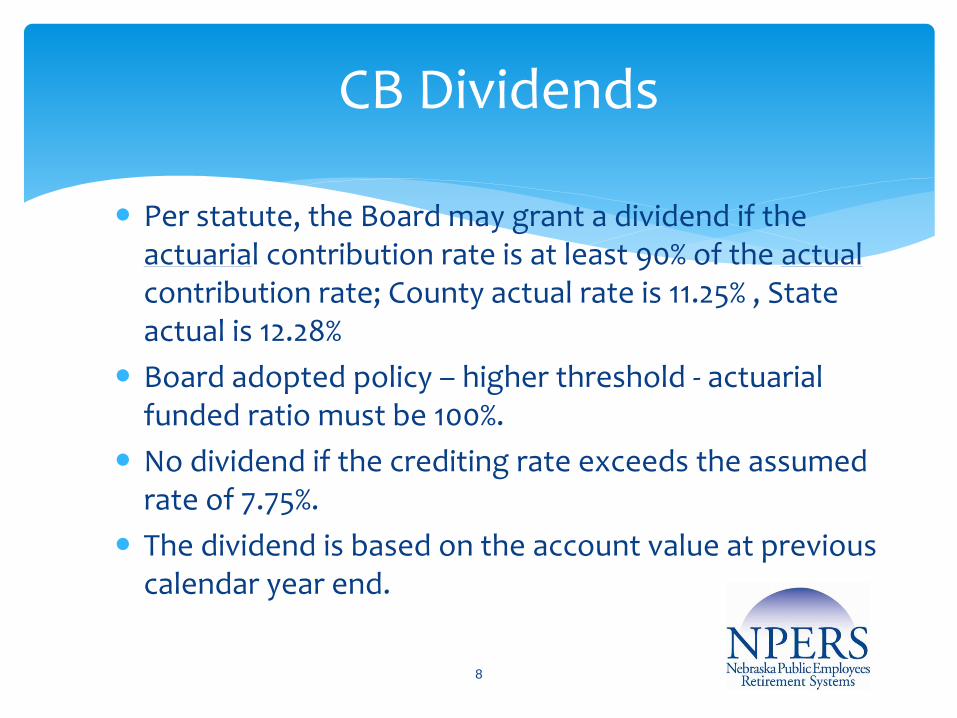
Per statute, the Board may grant a dividend if the actuarial contribution rate is at least 90% of the actual contribution rate; County actual rate is 11.25% , State actual is 12.28%
Board adopted policy – higher threshold - actuarial funded ratio must be 100%.
No dividend if the crediting rate exceeds the assumed rate of 7.75%.
The dividend is based on the account value at previous calendar year end.
8
CB Dividends
9
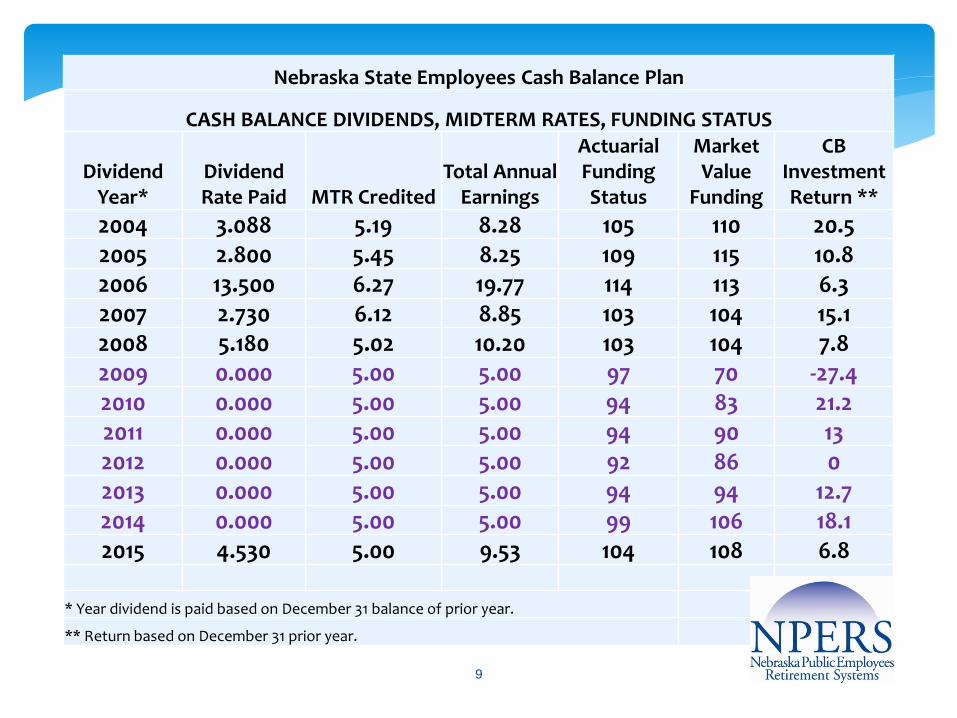
Nebraska State Employees Cash Balance Plan
CASH BALANCE DIVIDENDS, MIDTERM RATES, FUNDING STATUS
Dividend Year*
Dividend Rate Paid MTR Credited
Total Annual Earnings
Actuarial Funding Status
Market Value
Funding
CB Investment Return **
2004 3.088 5.19 8.28 105 110 20.5 2005 2.800 5.45 8.25 109 115 10.8 2006 13.500 6.27 19.77 114 113 6.3 2007 2.730 6.12 8.85 103 104 15.1 2008 5.180 5.02 10.20 103 104 7.8 2009 0.000 5.00 5.00 97 70 -27.4 2010 0.000 5.00 5.00 94 83 21.2 2011 0.000 5.00 5.00 94 90 13 2012 0.000 5.00 5.00 92 86 0 2013 0.000 5.00 5.00 94 94 12.7 2014 0.000 5.00 5.00 99 106 18.1 2015 4.530 5.00 9.53 104 108 6.8
* Year dividend is paid based on December 31 balance of prior year.
** Return based on December 31 prior year.
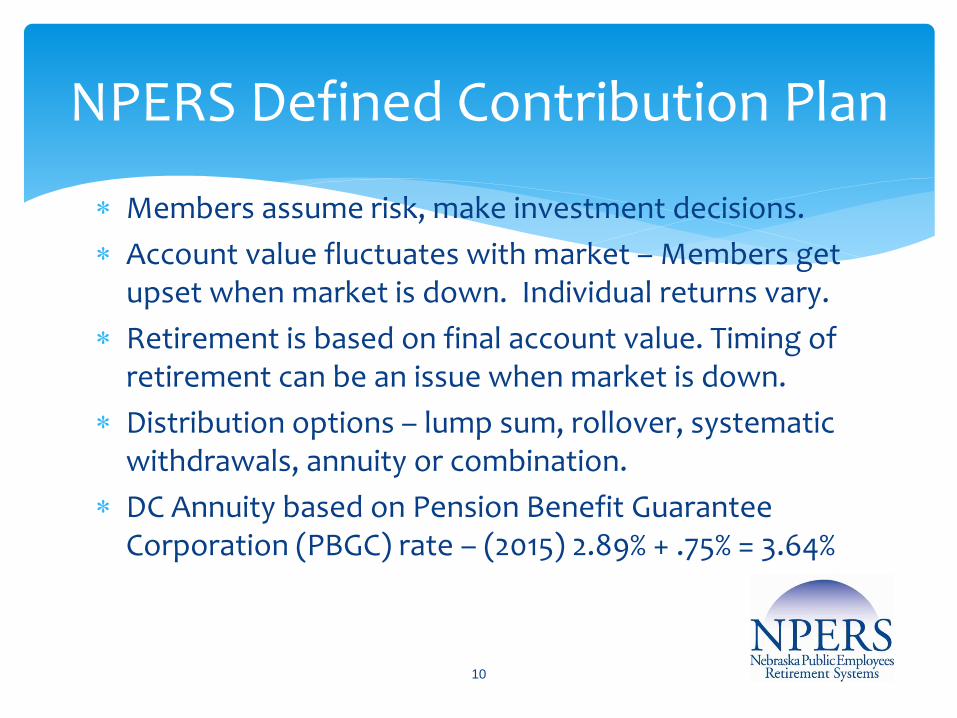
Members assume risk, make investment decisions.
Account value fluctuates with market – Members get upset when market is down. Individual returns vary.
Retirement is based on final account value. Timing of retirement can be an issue when market is down.
Distribution options – lump sum, rollover, systematic withdrawals, annuity or combination.
DC Annuity based on Pension Benefit Guarantee Corporation (PBGC) rate – (2015) 2.89% + .75% = 3.64%
10
NPERS Defined Contribution Plan
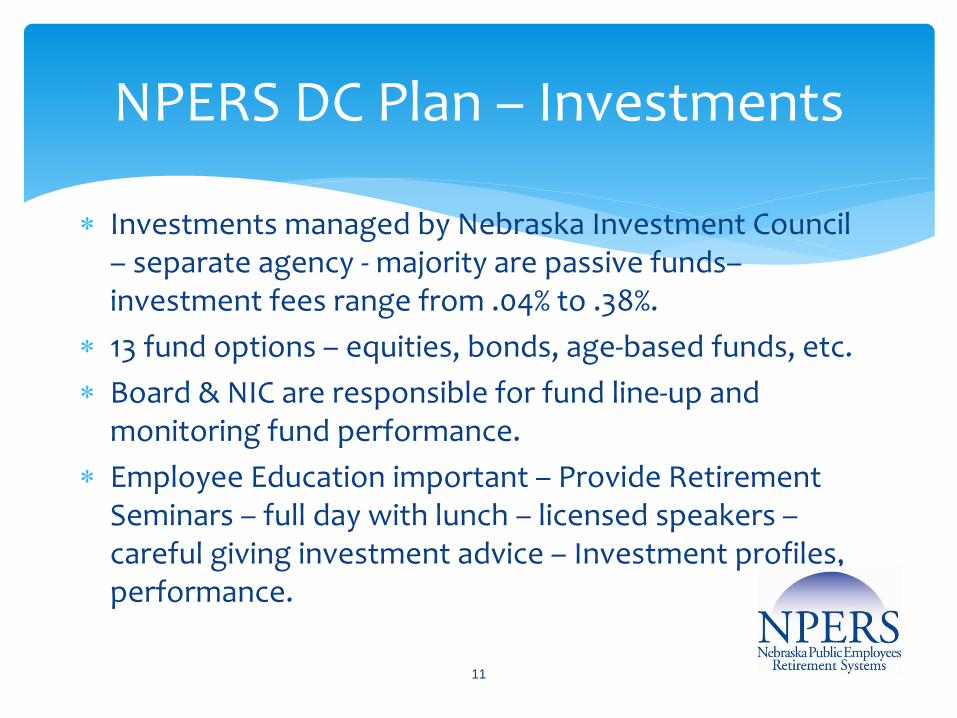
Investments managed by Nebraska Investment Council – separate agency - majority are passive funds– investment fees range from .04% to .38%.
13 fund options – equities, bonds, age-based funds, etc.
Board & NIC are responsible for fund line-up and monitoring fund performance.
Employee Education important – Provide Retirement Seminars – full day with lunch – licensed speakers – careful giving investment advice – Investment profiles, performance.
NPERS DC Plan – Investments
11
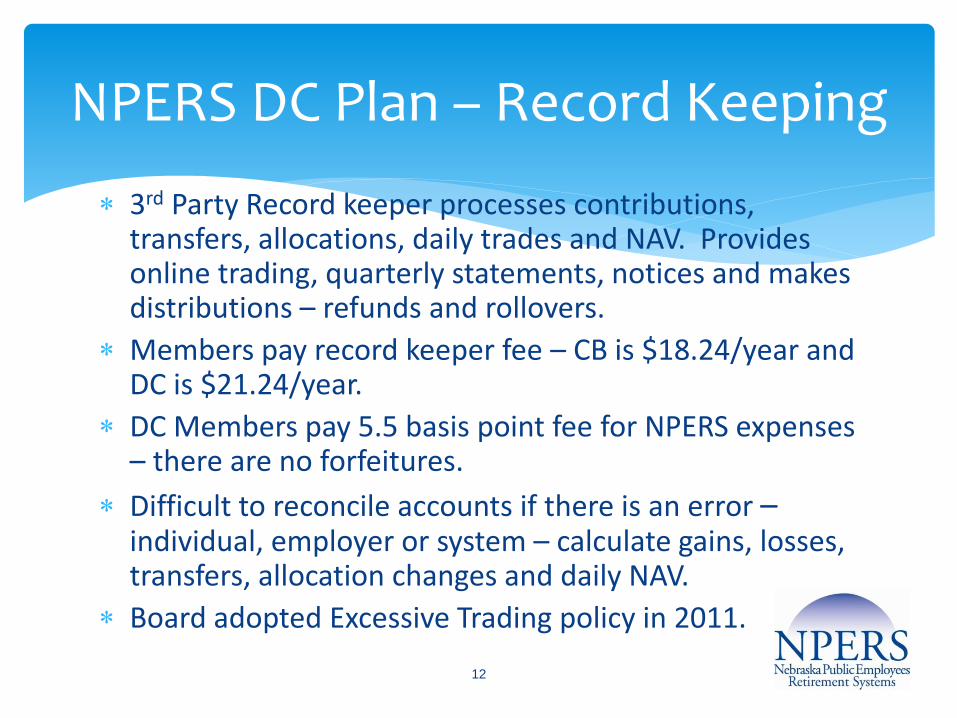
3rd Party Record keeper processes contributions, transfers, allocations, daily trades and NAV. Provides online trading, quarterly statements, notices and makes distributions – refunds and rollovers.
Members pay record keeper fee – CB is $18.24/year and DC is $21.24/year.
DC Members pay 5.5 basis point fee for NPERS expenses – there are no forfeitures.
Difficult to reconcile accounts if there is an error – individual, employer or system – calculate gains, losses, transfers, allocation changes and daily NAV.
Board adopted Excessive Trading policy in 2011.
12
NPERS DC Plan – Record Keeping
13
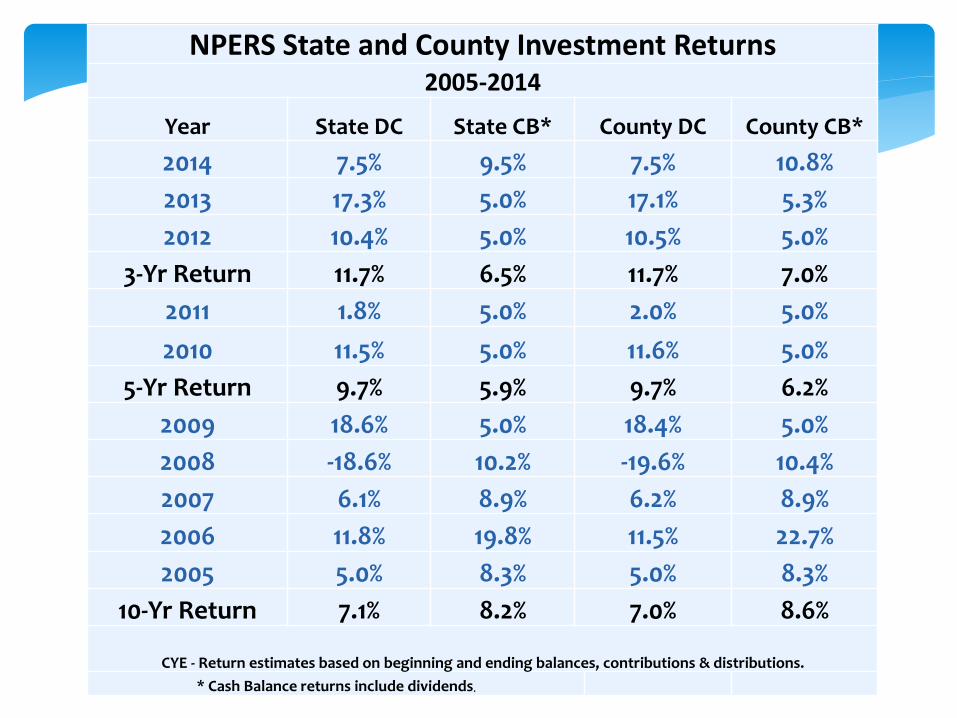
NPERS State and County Investment Returns 2005-2014
Year State DC State CB* County DC County CB*
2014 7.5% 9.5% 7.5% 10.8%
2013 17.3% 5.0% 17.1% 5.3%
2012 10.4% 5.0% 10.5% 5.0%
3-Yr Return 11.7% 6.5% 11.7% 7.0%
2011 1.8% 5.0% 2.0% 5.0%
2010 11.5% 5.0% 11.6% 5.0%
5-Yr Return 9.7% 5.9% 9.7% 6.2%
2009 18.6% 5.0% 18.4% 5.0%
2008 -18.6% 10.2% -19.6% 10.4%
2007 6.1% 8.9% 6.2% 8.9%
2006 11.8% 19.8% 11.5% 22.7%
2005 5.0% 8.3% 5.0% 8.3%
10-Yr Return 7.1% 8.2% 7.0% 8.6%
CYE - Return estimates based on beginning and ending balances, contributions & distributions.
* Cash Balance returns include dividends.
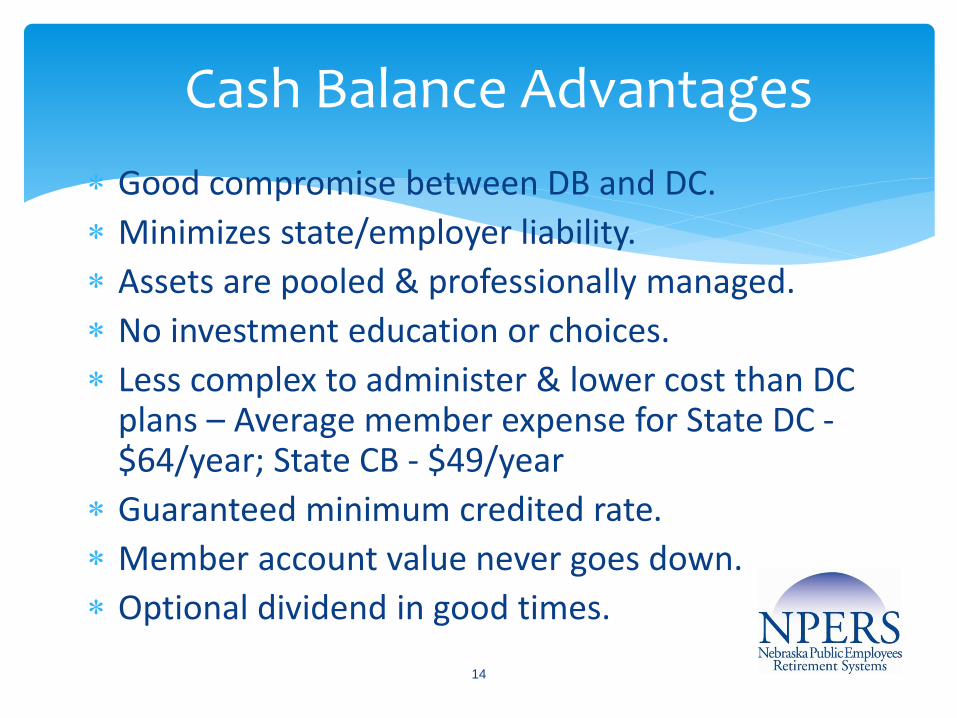
Good compromise between DB and DC.
Minimizes state/employer liability.
Assets are pooled & professionally managed.
No investment education or choices.
Less complex to administer & lower cost than DC plans – Average member expense for State DC - $64/year; State CB - $49/year
Guaranteed minimum credited rate.
Member account value never goes down.
Optional dividend in good times.
14
Cash Balance Advantages
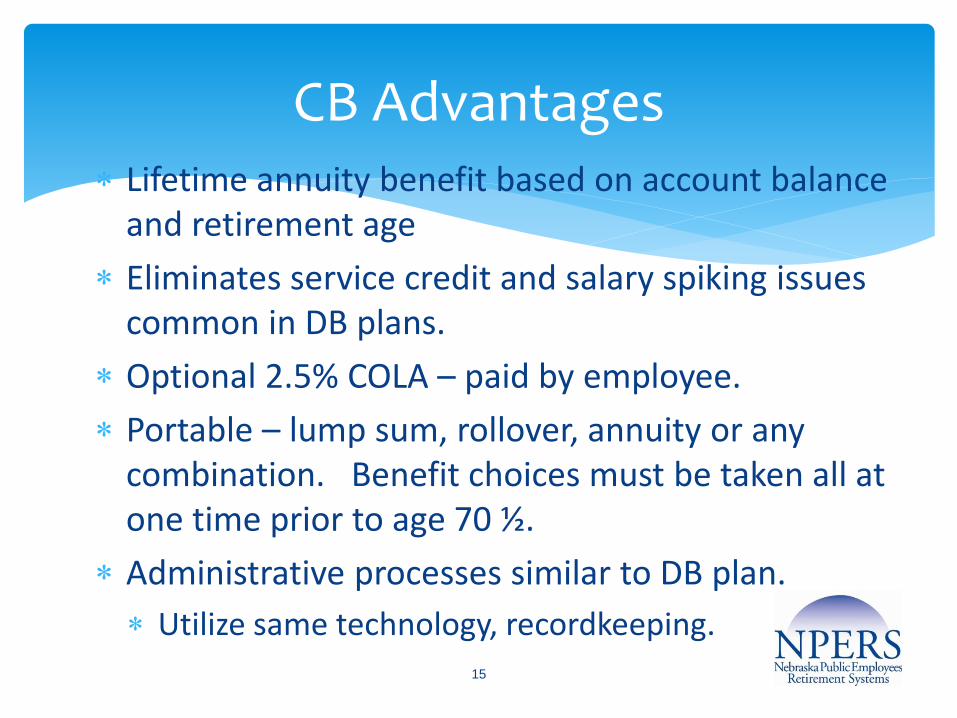
Lifetime annuity benefit based on account balance and retirement age
Eliminates service credit and salary spiking issues common in DB plans.
Optional 2.5% COLA – paid by employee.
Portable – lump sum, rollover, annuity or any combination. Benefit choices must be taken all at one time prior to age 70 ½.
Administrative processes similar to DB plan.
Utilize same technology, recordkeeping.
15
CB Advantages
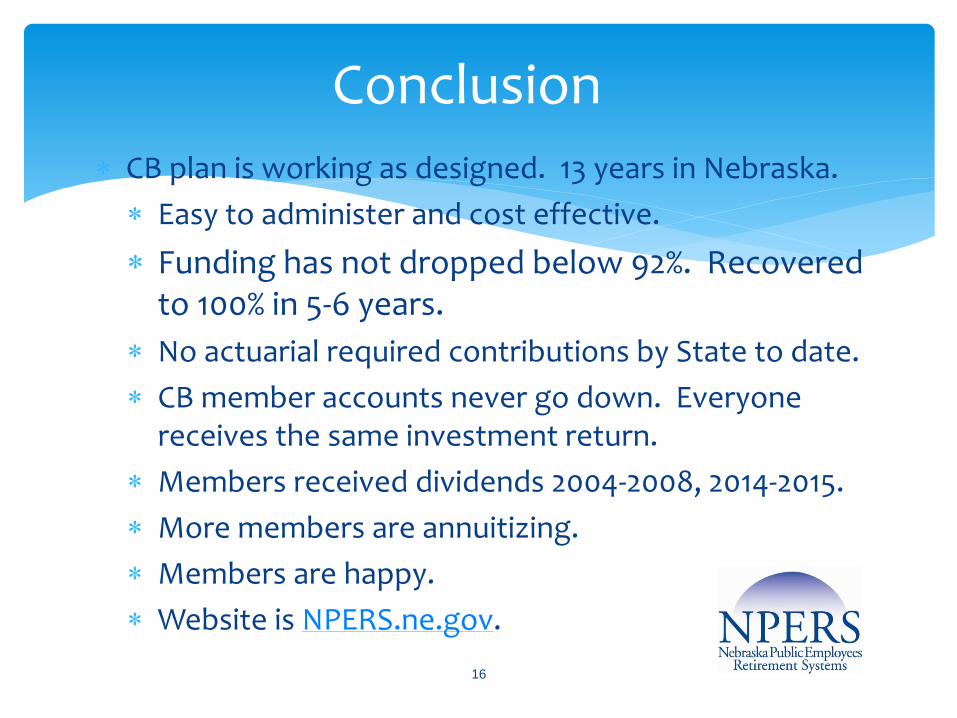
CB plan is working as designed. 13 years in Nebraska.
Easy to administer and cost effective.
Funding has not dropped below 92%. Recovered to 100% in 5-6 years.
No actuarial required contributions by State to date.
CB member accounts never go down. Everyone receives the same investment return.
Members received dividends 2004-2008, 2014-2015.
More members are annuitizing.
Members are happy.
Website is NPERS.ne.gov.
16
Conclusion