Embed Size (px)
Citation preview

Vanguard research March 2010
Deficits, the Fed, and rising interest rates: Implications and considerations for bond investors
AuthorsJoseph H. Davis, Ph.D.Roger Aliaga-Díaz, Ph.D.Donald G. Bennyhoff, CFAAndrew J. PattersonYan Zilbering
Executive summary. This paper addresses three related questions:
• Whyarelong-termU.S.interestrates,suchasthe10-yearTreasury yield,below4%,giventheexpectedfuturepathofU.S.government debtlevelsandtheFederalReserve’s“exitstrategy”?Morepointedly,don’tlong-termrateshavetorisedramatically?
• Howmightbondfundsperformintheeventthatratesdoriseover thenextseveralyears?
• Isitnotprudenttore-allocateone’sbondportfoliodefensivelyintoshorter-maturityfundsbeforeratesstartrising?
Webeginbydeconstructingtheyieldona10-yearTreasurybondinto itscomponents,includinginflationexpectations,anticipatedFedpolicy, andtheeffectsofchangesinbondsupply(i.e.,deficits)anddemand. Ourdeconstructionrevealsthattheexpectedupwardpressurefrom thefiscaldeficitonlongbondrateshasbeenoffsetsofarbyincreased bonddemandarisingfromahigherdomesticsavingsrate.
Connect with Vanguard > www.vanguard.com > global.vanguard.com(non-U.S.investors)

2
Ourinterest-ratedeconstructionalsoprovidesabasisforassessingthefutureeconomicscenariothatis“pricedinto”today’sbondvaluations(andhenceintotheforwardyieldcurve).Onthebasisofthisanalysis,wediscusswhyexpectationsforfutureinterest-ratemovementsseemgenerallyplausible.
Thatsaid,historysuggeststhatrateswilllikelyevolvequitedifferentlyfromwhatisexpectedtoday,astheforecastingtrackrecordofthefuturesmarketisnotoriouslypoor.Consequently,wecalculateimpliedfuturereturnsforTreasuryandcorporatebondbenchmarksover1-,5-,and10-yearinvestmenthorizonsbasedonalternativebutplausiblemacroeconomic,fiscal,andFedpolicyscenarios.Wefindthat,mostbroadly,thosescenariosthatproducethehighestrelativereturnsintheshortrun(suchasadouble-diprecessionscenario)wouldbeexpectedtoproducethelowestrelativereturnsoverthelongrun.Conversely,scenariosinwhichratesrisemorethaniscurrentlyexpected(suchasfromafiscalcrisisorarun-upininflation)couldactuallyproducethehighestrelativenominalreturnsovera10-yearperiod.
Theresultsofourscenarios,togetherwiththeperformanceofvariousbondsegmentsoverthepastseveralyears,underscorethebenefitsofabroadlydiversifiedfixedincomeportfolioregardlessofthefuturedirectionofinterestrates.Akeylessonoftheglobalfinancialcrisisisthatimplementingatoonarrowor“surgical”bondallocation(suchasbyshorteningdurationorinvestingsolelyinriskierbondinstruments)involvesimportanttrade-offsthatmayexposeinvestorstounintendedyield-curveorcreditrisks,whilepotentiallydeprivingthemofahigherorlessvolatilefutureincomestream.Thehighuncertaintysurroundingthefuturedirectionofeconomicgrowth,thedeficit,inflation,andinterestrateswouldseemtosupportgreaterfixedincomediversification, notless.
Executive Summary continued

Introduction
RecentcashflowsintobondmutualfundsandETFshavebeenverystrong.AccordingtoMorningstar,throughthefirstthreequartersof2009theseflowswerefairlywelldiversifiedacrossshorter-maturityandlonger-maturitybondfundsinboththetaxableandmunicipalcategories(seeFigure 1,onpage4).Morerecently,aslightlyhigherpercentageofbondcashflowshasgonetoshort-termfunds.Thisisfairlyatypicalforanenvironmentofextremelylowshort-termyields.
Oneofthelikelycatalystsforthistrendhasbeenincreaseddemandfrommoneymarketinvestorsinsearchofhigheryields.WiththeFederalReservemaintainingitsfederalfundsratetargetcloseto0%,
monetarypolicymakershavemadeitextremelydifficultformanysaverstogeneratesufficientincomefromtheirmoneymarketaccounts.Inthissense,saversunfortunatelyremainthe“sacrificiallambs”ofU.S.monetarypolicyastheFederalReserve attempts to stimulate other segments oftheeconomy.
Another probable influence is increasing concern among bond investors that mounting government debtlevelswilleventuallydriveuplonger-term U.S.interestrates,whichatpresentarebelowtheirhistoricalaverages(seeFigure 2,onpage4).Inaddition,thefuturesmarketexpectstheFederalReservetobeginraisingshort-termratesbeforetheendof2010astheU.S.recoverystrengthens.
*This is the formula for forward rates employed on the Bloomberg website:
f = [(FV-1) / (d2-d1)] * 360
where:f = forward rate (simple interest, ACT/360)d1 = number of days from the settlement date to the start date of the forward periodd2 = number of days from the settlement date to the end date of the forward periodFV = future value. The formula is: (1 + [(r2*d2)/360]) / (1 + [(r1*d1)/360])
where:r1 = the spot rate for d1 days (simple interest)r2 = the spot rate for d2 days (simple interest)
3
A note on the chartsThechartsinthispaperarebasedonmarketforwardratesgeneratedbyuseofaformulacommonlycitedintextbooksandothersources.*Forwardratesarenotprojections;rather,theyaremathematicallyderivedfromthecurrentmarketvaluationsforbondsofdifferentmaturities.Forwardratesdonotrepresentanyindividual’sororganization’sviewsaboutfutureinterestrates.Instead,theyarenormallyinterpretedasacollectiveexpectationoftheentirebondmarket.(Asthepaperpointsout,thatcollectiveexpectationisfrequentlywrong.)
Important notes about riskAllinvestmentsaresubjecttorisk.Pastperformanceisnoguaranteeoffutureresults.Investmentsinbondsaresubjecttointerestrate,credit,andinflationrisk.WhileU.S.Treasuryorgovernmentagencysecuritiesprovidesubstantialprotectionagainstcreditrisk,theydonotprotectinvestorsagainstpricechangesduetochanginginterestrates.Foreigninvestinginvolvesadditionalrisksincludingcurrencyfluctuationsandpoliticaluncertainty.Diversificationdoesnotensureaprofitorprotectagainstaloss inadecliningmarket.
An investment in a money market fund is not insured or guaranteed by the Federal Deposit Insurance Corporation or any other government agency. Although a money market fund seeks to preserve the value of your investment at $1 per share, it is possible to lose money by investing in such a fund.

4
Monthly bond fund and ETF cash flows, January 2009–January 2010
Morningstar monthly municipal, government, and investment-grade fund and ETF cash flows
Figure 1.
Note: Short-term funds and ETFs include the following Morningstar categories: Muni Single State Short, Muni National Short, Short Government, and Short-Term Bond. Intermediate- and long-term funds and ETFs include the following Morningstar categories: Muni California Intermediate/Short, Muni Massachusetts, Muni Minnesota, Muni National Intermediate, Muni New Jersey, Muni New York Intermediate/Short, Muni Ohio, Muni Pennsylvania, Muni Single State Intermediate, Muni New York Long, Muni California Long, Muni National Long, Muni Single State Long, Intermediate Government, Long Government, Intermediate-Term Bond, and Long-Term Bond.
Sources: Morningstar and Vanguard.
Intermediate- and long-termShort-term
Cas
h flo
w ($
Bill
ions
)
0
5000
10000
15000
20000
25000
30000
35000
40000
0
$5B
$10B
$15B
$20B
$25B
$30B
$35B
$40B
81%
19%
69%
31%
67%
33%
75%
25%
66%
34%
56%
44%
60%
40%
60%
40%
61%
39%
55%
45%
56%
44%
41%
59%
54%
46%
Jan.2009
Feb.2009
Mar.2009
April2009
May2009
June2009
July2009
Aug.2009
Sept.2009
Oct.2009
Dec.2009
Nov.2009
Jan.2010
A source of consternation
The current, historical average, and implied future yield on the 10-year Treasury bond
Figure 2.
Note: Calculations are based on data available as of March 29, 2010.
Sources: Bloomberg, Federal Reserve, and Global Financial Data.
2
4
6
8
2
4
6
8%
Yiel
d (%
)
4.9%4.7%
7.3%
4.5%
3.9%
4.4%
5.2%5.6%
Historicalaverages
Forward curve:Bond market expectations
Since1800
Since1900
Since1970
Since2000
Current(3/29/10)
1 yearfrom now
3 yearsfrom now
5 yearsfrom now

Viewingtheseconcernstogether,somebondinvestorsmayhopethatthetotalreturnson shorter-durationfundswillberelativelyinsulatedinthe event that bothshortandlongratesrisebythesameamount(thatis,aparallelupwardshift ininterestrates).
In light of these uncertainties, it’s natural for bond investorstowonderwhethertheyshouldactdefensivelybyreshapingtheirfixedincomeallocationwithanarrowor“surgical”focusonmitigatingrisk.Toprovidebetterperspectiveandgroundsfordiscussion,webeginbyexamininghowthemarketexpectsinterestratestomoveandhowvariousgovernmentbondindexesmightperformifthoseexpectationsweremet.
How might interest rates evolve in the years ahead?
Figure 3showsthebondmarket’sexpectationsforfutureinterestratesalongtheentireyieldcurve.Theseimplicitexpectations—oftenreferredtoastheforwardyieldcurveorsimplyforward rates—canbederivedfromcurrentU.S.Treasurybondprices.Inessence,theforwardcurvecanbeconsideredthesetof“break-even”yieldsthatequalizestheratesofreturnfromTreasurybondsacrosstheentirematurityspectrum.Animportant—andoftenmisunderstood—implicationofFigure3isthatiftheyieldchangesoftheforwardcurvearerealized,thenallTreasurybonds—regardless of their maturity—willearnthesameholding-periodreturn.1
1 For a more detailed and technical discussion of forward rates and yield-curve dynamics, see Ilmanen (1996) and Davis and Aliaga-Díaz (2007).
5
The implied evolution of the U.S. Treasury yield curve—a bear flattening
Spot curve as of February 28, 2010, and selected forward curves
Figure 3.
Source: Bloomberg.
2010
The Fed is expected to flatten the yield curve by (A) raising short-term rates and (B) anchoring long-term inflation expectations.
0
1
2
3
4
5
6
0
1.0
2.0
3.0
4.0
5.0
6.0%
Yiel
d (%
)
1week
2 4 5 6 9 2 3 4 5 7 1510 20131
A
B
2011 2012 2013 2014 2015 2020
Months Years

Giventhedramaticsteepnessoftoday’syieldcurve(asmeasuredbythedifferencebetweenthe10-yearTreasuryyieldandtheyieldonthe3-monthT-bill),thebondmarketexpectstheyieldcurvetoflattensignificantlyintheyearsahead.The“bearflattening”scenarioinFigure3showsthatthemajorityoftheinterestrateadjustmentisexpectedtooccurinshortrates,notlongrates.Asanexample,the2-yearTreasuryyieldisexpectedtorisestronglyoverthenextfiveyearsastheFederalReservenormalizesmonetarypolicy,drivingthe2-yearnotefromitsFebruary2010spotyieldof0.81%to5.28%inFebruary2015.Theyieldona20-yearconstant-maturityTreasurybondisexpectedtoriselessdramatically,fromtheFebruary2010spotyieldof4.43%to5.56%inFebruary2015.
Inshort,theTreasurysecuritymarkethasalready“pricedin”aFedtighteningcyclethatflattenstheyieldcurveinsuchamannerthattheexpectedreturnon,say,ashort-termTreasuryportfoliowouldbeapproximatelythesameasforalonger-durationTreasuryportfolio.
As illustrated in Figure 4, this flattening of the yieldcurvewouldbesimilartowhatoccurredfollowingtheendofthelastlow-rateenvironment(2003–2004).Startingin2004,theFederalReserveraisedshort-termratesinstagesfrom1.00%to5.25%,whiletheyieldonthe10-yearTreasuryhardlychanged.TheFedchiefthen,AlanGreenspan,calledthissituationa“conundrum”becauseitdifferedfromotherFedrate-tighteningcycles,suchasthatof1994,whenlonger-termyieldsrosealmostintandemwiththeriseinthefederalfundsrate.However,others have argued that the conundrum episode waspreciselyhowatighteningcycleshouldoperateunderacrediblecentralbankthateffectivelyanchorslong-terminflationexpectations—theprimarydriveroflongbondyields.
Are the market’s current expectations reasonable?
Anaturalquestion,ofcourse,iswhetherthebondmarket’sexpectationsforfuturelongTreasurybondyieldsarereasonable.InlightoftheconcernsoverU.S.fiscaldeficitsandtheFed’sexitstrategy,manyinvestorsmayfinditperplexingthata10-yearTreasurybondyieldslessthan4%todayandisexpectedtoyieldonlyabout5.5%in2015(recallFigure2).Morepointedly,don’tlong-termrateshave torisemoredramaticallythanthatinresponsetothelargeandgrowingnationaldebt?Inshort,theansweris No, not necessarily.
ItisimportanttorecognizethattherelationshipbetweenU.S.governmentdebtlevelsandlonggovernmentbondyieldsismixedandhasvarieddramaticallyovertime.Figure 5showstheyearlylevelsofdebtandinterestratesintheUnitedStatessincethelate1860s.Asisevidentvisually,theaveragecorrelationbetweenlongbondyieldsandfederal debt levels has been zero.
Infact,wereonetographthecurrentrelationshipbetweendebt-to-GDPratiosandlonggovernmentbondyieldsacross countries,itwouldshowastrikinglysimilarcorrelationofzero.Thereasonfor the general absence of a close association betweendebtandinterestratesisthatthereisonlyaweaklinkbetweendeficitsandinflation,atleastindevelopedmarkets(CataoandTerrones,2003).Theweaknessofthelinkisattributedinparttocross-countrydifferencesincentral-bankcredibility,economicsize,domesticprivatesavingsrates,andperception of futurefiscalprudence.
Japan,forinstance,hasoneofthelowestlong-bondyieldsintheworlddespitehavingthehighestdebt-to-GDPratio.AnexplanationisthatJapan’slong-terminflationexpectationsremaincloseto0%(ifnotoutrightdeflationary),andinvestors(mostlyJapaneseprivatecitizens)havebeenwillingtofundthegovernmentdebt.
6

7
The yield curve tends to flatten when the Fed sufficiently tightens policy
Various constant-maturity Treasury yields since January 1989
Figure 4.
Sources: Federal Reserve and National Bureau of Economic Research.
74% Did not opt out
18% Partial opt-out
8% Full opt-out
1-year excess returns: Europe1-year excess returns: U.S.1-year excess returns: Global
10-year excess returns: Europe10-year excess returns: U.S.10-year excess returns: Global
Parallel shift in 1994 as the Fed begins to raise short-term rates; longer-duration bonds underperform shorter-duration bonds
Bond yields decline in 1995; the Fed’s prior-year tightening is viewed as “too aggressive”
“Conundrum” flattening
Yiel
ds (%
)
0
2
4
6
8
10
12
0
2
4
6
8
10
12%
1989 1990 1991 1992 19951994 1996 1997 1998 1999 2000 2001 2002 2003 2004 2005 2006 2007 2008 2009 20101993
0
1
NBER recessions 3-month T-bill 2-year yield 5-year yield 10-year yield
Government debt and government bond yields
U.S. gross debt-to-GDP ratio and U.S. long-term interest rates, 1869–2009
Figure 5.
Sources: Vanguard calculations based on annual data from Global Financial Data, the Federal Reserve Board, the U.S. Census Bureau, and the U.S. Bureau of Labor Statistics.
74% Did not opt out
18% Partial opt-out
8% Full opt-out
1-year excess returns: Europe1-year excess returns: U.S.1-year excess returns: Global
10-year excess returns: Europe10-year excess returns: U.S.10-year excess returns: Global
World War II: Massive war-related debt is funded
largely through higher domestic savings
Late 1970s/early 1980s: Inflation expectations become unanchored
Gross U.S. government debt/GDP ratio (left axis) 10-year U.S. Treasury yield (right axis)
0.0
0.2
0.4
0.6
0.8
1.0
1.2
1.4
Deb
t/G
DP
rat
io (%
)
0
20
40
60
80
100
120
140%
U.S. Treasury yields (%
)
0
2
4
6
8
10
12
14
16%
0.00
0.02
0.04
0.06
0.08
0.10
0.12
0.14
0.16
1869 1879 1889 1899 1909 1919 1929 1939 1949 1959 1969 1979 1989 1999 2009

What explains the current level of yields? Deconstructing the yield curve
To better understand both the current level of long ratesandthemarket’sexpectationfortheserates,wedeconstructtheyieldonaconstant-maturity10-yearTreasurybondintoitsvariouscomponents.These include:
• Long-terminflationexpectations.
• Uncertaintyoverthoseinflationexpectations (i.e.,aninflationriskpremium).
• ExpectedfutureFedpolicy,asexpressedintheinflation-adjustedfederalfundsrate.
• ExpectedrealGDPgrowth.
• Theeffectsofchangesinbondsupply(i.e.,thestructural deficit2).
• Theeffectsofchangesinbonddemand(especiallyfromforeigncentralbanksandU.S.investors).
2 The model focuses on the structural budget deficit as calculated by the Congressional Budget Office. The structural deficit measures the financing needs the government faces using the assumption that the economy is permanently at full employment. While in theory any deficit financing should depress bond prices and increase bond yields, periods of rising deficits usually coincide with periods of economic weakness and loose monetary policy, both of which tend to decrease yields. Thus, the correlation between regular budget deficits and interest rates can be misleading, as it does not factor in the stance of monetary policy.
8
Decomposing the 10-year Treasury yield
Average decomposition in percentage points by decade and in 2009
Figure 6.
Note: The 10-year yield decomposition is based on the coefficients for the variables listed above that were estimated from a multivariate regression on quarterly data, imposing a long-run co-integrated relationship among long-run inflation expectations, the 10-year Treasury yield, and the federal funds rate. For details of a similar methodology used by the Federal Reserve, see Warnock and Warnock (2009). To minimize potential reverse-causality bias in the response of domestic Treasury purchases to changes in interest rates, we have implemented a two-stage least squares (2SLS) estimator that uses the U.S. household savings rate and lags of the other independent variables as instruments.
Sources: Vanguard calculations based on data from the Congressional Budget Office, the Federal Reserve, the Federal Reserve Bank of Philadelphia, the U.S. Bureau of Labor Statistics, and the U.S. Census Bureau.
-2
0
2
4
6
8
10
12
–2
0
2
4
6
8
10
12%
10-y
ear T
reas
ury
yiel
d (%
)
5.3
2.2
1.10.2
2.2
–0.1–0.4
10.6
3.3
0.2
1.9
–0.2 –0.4–0.1
6.6
2.5
0.2 0.4 0.1
1.4
4.5
2.42.9
–0.6
3.3
–1.3
0.2
–0.8
0.50.2
0.51.1
Sum of thecomponents =
Structural fiscal deficit
1980s 1990s 2000s 2009
Foreign Treasury purchases
U.S. household Treasury purchases
Long-run inflation expectations
Real federal funds rate
Inflation risk premium
Expected real GDP growth Average 10-year Treasury yield

Our statistical decomposition is based on a modelfollowingtheworkofvariousFederal Reserveresearchers,includingLaubach(2007)andWarnockandWarnock(2009).Figure 6 presents the decompositionoftheaverageyieldonthe10-yearTreasurybondforthedecadesofthe1980s,the1990s,andthe2000s,aswellasfortheyear2009.
AsignificantfindingshowninFigure6isthattheexpectedupwardpressurefromthefiscaldeficitonlongbondratesin2009hasbeenoffset(atleastthusfar)byincreasedbonddemandarisingfromahigher domestic savings rate.Byourestimates,thisrecentsuppressantoflongbondyieldshasbeenaspowerfulastheso-called“globalsavingsglut”thatFedChairmanBenBernankeandothersbelievehelpedtokeeplongyieldslowthroughoutthepastdecade.AccordingtotheFederalReserve’sFlowofFundsdata,householdsandU.S.mutualfundsownedapproximately20%ofallU.S.Treasurysecuritiesoutstandinginthethirdquarterof2009,versus14%in2007beforethecrisis.
IftheU.S.savingsratestayselevatedintheyearsahead,futurelongbondyieldsmaynotriseasstronglyassomeinvestorsnowfear.ThebehaviorofJapaneseinterestratestodayandofU.S.ratesduringWorldWarIIisareminderofthepowerfulinfluence that a higher domestic savings rate can haveonagovernment’sborrowingcosts.Anothercriticalfactorgoingforwardwillbetheeffectivenessoffuturemonetaryand fiscal policies in maintaining stablelong-terminflationexpectations.AsisclearfromFigure6,inflationexpectationsarethelargestsinglecomponentoflong-terminterestrates.3
Bond market expectations seem reasonable, but they are often wrong
Ourinterestratedecompositionnotonlyshedsmore light on the factors influencing the current leveloflongTreasurybondyieldsbutalsoprovidesa basis for assessing the future economic scenario thatispricedintotoday’sbondvaluations(andhenceintotheforwardyieldcurve).BycombiningthedecompositioninFigure6withthemarket’sexpectationthatthe10-yearTreasuryyieldwillrisetoapproximately5.5%in2015(recallFigure2),itcanbeshownempiricallythattheanticipatedbearflatteningisconsistentwiththefollowingscenariooverthenextfiveyears:
1. TheFederalReserveraisesthefedfundsratetoamore“neutral”levelofapproximately4%by2015.Thisisthecurrentexpectationinthefedfundsfuturesmarket.
2. GDPgrowthexpectationsrisemodestlythough2015asthenascenteconomicrecoverybecomesself-sustaining.
3. Theexpectedrateoflong-termCPIinflationremainsanchoredat2.5%,althoughtheuncertaintysurroundingthatexpectation (i.e.,theinflationriskpremium)risesmodestly overtime.
4. ForeigncentralbankscontinuetopurchaseU.S.Treasuries,buttheirsharedecreasesastheycontinuetodiversifytheirreserveholdings.
5. Domesticinvestorshelptofinancethehighstructural deficit through an elevated savings rate ofapproximately5%,therebyalleviatingsome (butnotall)ofthepressureonlong-termrates.
3 See Vanguard white papers by Davis (2007) and Davis and Cleborne (2009) for additional comments on the importance of—and future risks to—U.S. inflation expectations.
9
10
Actual federal funds target rate versus market expectationsFigure 7.
Sources: Monthly Federal Reserve and Bloomberg data for the federal funds futures market since January 2000.
Fede
ral f
unds
tar
get
rate
(%)
0
1
2
3
4
5
6
7
8
0
1
2
3
4
5
6
7
8%
Jan.2000
Jan.2001
Jan.2003
Jan.2004
Jan.2005
Jan.2006
Jan.2007
Jan.2008
Jan.2009
Jan.2010
Jan.2011
Jan.2002
Actual federalfunds target
Expectations from federal funds futures market
Actual 10-year Treasury yield versus implied forward rateFigure 8.
Sources: Monthly data since January 1971 provided by Bloomberg, the Federal Reserve, and Vanguard.
10-y
ear T
reas
ury
yiel
d (%
)
0
2
4
6
8
10
12
14
16
18%
Dec.1971
Dec.1976
Dec.1981
Dec.1986
Dec.1991
Dec.1996
Dec.2001
Dec.2011
Dec.2006
0
2
4
6
8
10
12
14
16
18

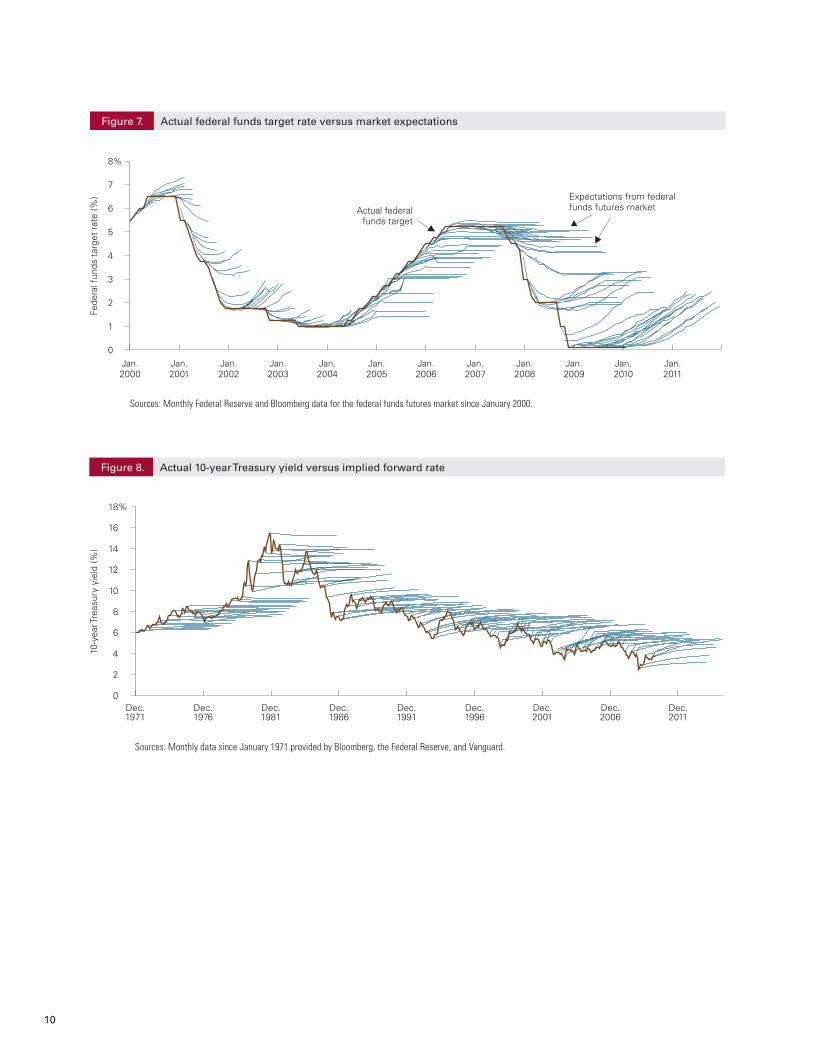
Assuch,thebondmarket’sexpectationsforthefutureshapeoftheyieldcurveseemreasonable. Ofcourse,historysuggeststhatrateswilllikelyevolvedifferentlyfromwhatisexpectedtoday.Indeed,weshowthattheTreasuryforwardyieldcurve—aswithotherinterestrateforecasts—hasbeenapoorpredictorofactualfuturerates.4 This hasbeenthecaseforbothshortrates(Figure 7) andlongrates(Figure 8).
Inlightofthisinformation,howshouldbondinvestorsthinkabouttheriskstocurrentmarket rateexpectations?
Implied bond index performance under various future interest rate scenarios
Figure 9,onpage12,presentshypothetical future annualizedtotalreturnsover1-,5-,and10-yearinvestmenthorizonsforfourshort-andintermediate-termindexescommonlyusedasbenchmarksbytaxablebondfunds:
• BarclaysCapitalU.S.1–5YearTreasuryIndex.
• BarclaysCapitalU.S.5–10YearTreasuryIndex.
• BarclaysCapitalU.S.1–5YearCreditIndex.
• BarclaysCapitalU.S.5–10YearCreditIndex.
Recognizingthatthenumberofdistinctfutureyield-curvescenariosisnearlyinfinite,wechosefivepotentialscenariosfrom10,000simulationsgeneratedbytheVanguardCapitalMarketsModel foracalculationofimpliedreturns.Figure9presentstheresults.Forsimplicity,thereturncalculationswerebasedonyieldchangesonlyat12-monthintervals,whilethematuritiesusedtocalculatefutureindexdurationswerechosenbasedontheclosestavailableconstant-maturityTreasuryyield.DetailsofthescenarioassumptionsarelistedwithFigure9.
These simulations have several important implicationsforlong-termbondinvestors.
Mostbroadly,the scenarios that produce the highest short-run returns would be expected to produce the lowest long-run returns.Agoodexampleistheso-calleddouble-dipscenario;forlong-terminvestors,Scenario4wouldlikelybethemosttroubling.Inthisscenario,thepresentlow-rateenvironmentpersistsindefinitelyastheeconomyfallsbackintorecessionandsuffersfromadecade-longmalaisesimilartowhatJapanhasexperiencedforthepasttwodecades.Indeed,itisthisveryoutcomethattheFederalReservehasendeavoredtoavoid.
Conversely,scenariosinwhichratesrisemorein2011thaniscurrentlyexpectedactuallyproducethehighestrelativenominal10-yearreturns.Forinstance,short-termbondindexeshavelowerreturnsinScenario3thaninScenario1becausetheFedraisesratesmorequicklyandaggressivelythanispresentlyexpectedbythemarket.YetinScenario3,long-runinflationexpectationsremainwellanchored,andthusintermediate-termbondindexeshavesimilar10-yearreturnsinbothscenarios.
Indeed, the scenario that is perhaps the most fearedbymanybondinvestors(Scenario5)isalsotheonewiththehighestexpectedreturnovera10-yearhorizon.Naturally,underthis“fiscalcrisis”scenarioallbondindexeswouldbeexpectedtosuffersignificantlynegativereturnsintheshortrunasinterestratesrisesharply.However,overtimethehigherTreasuryandcorporateyieldswouldprovideahigherabsoluteincomestream,asmanyfixedincomeinvestmentseventuallydidinthe1970s andearly1980s.
4 For a more detailed and technical discussion of interest rate predictability, again please see Ilmanen (1996) and Davis and Aliaga-Díaz (2007), as well as the citations therein.
11

12
Implied Treasury and corporate bond returns under alternative scenariosFigure 9.
Barclays Capital Treasury and Credit Index benchmarks
Impliedfutureannualizedreturns
1year 5years 10years (ending (ending (ending 2/2011) 2/2015) 2/2020)
Scenario 1: Treasury forward yield curve is realized
1–5YearTreasuryIndex –0.6% 1.2% 3.1%
5–10YearTreasuryIndex –1.8 1.2 3.2
1–5YearCreditIndex –0.5 1.4 4.0
5–10YearCreditIndex 0.9 2.3 4.0
Scenario 2: Federal Reserve on hold for longer than expected
1–5YearTreasuryIndex 0.7% 1.0% 3.1%
5–10YearTreasuryIndex 2.8 1.6 3.3
1–5YearCreditIndex 3.1 1.0 4.2
5–10YearCreditIndex 6.2 3.6 5.5
Scenario 3: “Preemptive” Federal Reserve is more aggressive than expected
1–5YearTreasuryIndex –1.1% 3.4% 3.7%
5–10YearTreasuryIndex –4.2 1.8 3.2
1–5YearCreditIndex –2.3 3.4 4.0
5–10YearCreditIndex 0.8 3.5 5.4
Scenario 4: Double-dip scenario in 2011; Japan-type economic stagnation thereafter
1–5YearTreasuryIndex 1.4% 2.0% 2.1%
5–10YearTreasuryIndex 11.9 4.0 2.5
1–5YearCreditIndex 0.5 2.4 3.2
5–10YearCreditIndex 8.5 6.4 5.1
Scenario 5: Fiscal and inflation concerns accelerate dramatically; all rates rise
1–5YearTreasuryIndex –1.4% 2.6% 3.9%
5–10YearTreasuryIndex –12.1 0.8 4.5
1–5YearCreditIndex –2.9 3.0 4.7
5–10YearCreditIndex –12.4 1.8 6.5
Sources: Barclays Capital, Bloomberg, Federal Reserve, and Vanguard.
IMPORTANT NOTES: These hypothetical data do not represent the returns on any particular investment. The projections or other information generated by Vanguard Capital Markets Model® simulations regarding the likelihood of various investment outcomes are hypothetical in nature, do not reflect actual investment results, and are not guarantees of future results. Results from the model may vary with each use and over time.
Description of investment simulation tool: The Vanguard Capital Markets Model (VCMM) is a proprietary financial simulation tool. Part of the tool is a dynamic module that employs vector autoregressive methods to simulate forward-looking return distributions on a wide array of broad asset classes, including stocks, taxable bonds, and cash. For the VCMM simulations in Figure 9, we used market data available through February 28, 2010, for the Treasury spot yield curves. The VCMM then created projections based on historical relationships of past realizations among the interactions of several macroeconomic and financial variables, including the expectations for future conditions reflected in the U.S. term structure of interest rates. The projections
were applied to the following Barclays Capital U.S. bond indexes: 1–5 Year Treasury Index, 1–5 Year Credit Index, 5–10 Year Treasury Index, and 5–10 Year Credit Index. Importantly, taxes are not factored into the analysis.
Limitations: The projections are based on a statistical analysis of February 2010 yield curves in the context of relationships observed in historical data for both yields and index returns, among other factors. Future returns may behave differently from the historical patterns captured in the distribution of returns generated by the VCMM. It is important to note that our model may be underestimating extreme scenarios that were unobserved in the historical data on which the model is based.
Scenario details: For simplicity, the return calculations were based only on yield changes at 12-month intervals. Specifically, the formula for the implied hypothetical return = Starting Yield - (Starting Duration * (Ending Yield – Starting Yield)), where Duration = ((1– (1+Yield)^(-Maturity))/ (1 – (1+Yield)^(–1))). The index maturities used to calculate future index durations were chosen based on the closest available constant-maturity Treasury yield as follows: the 3-year Treasury constant-maturity yield for the Barclays 1–5 Year Credit Index (3.1 years maturity), and the 7-year Treasury constant-maturity yield for the Barclays 5–10 Year Credit Index (7.7 years maturity).
Details on Scenario 1: The 3-year and 7-year Treasury yields rise at a pace similar to that currently implied by the forward curve. Of course, the simulated interest rate paths in this scenario possess more year-to-year volatility than that implied by the forward curve. As a result, the expected returns of the Barclays 1–5 Year Treasury Index and the Barclays 5–10 Year Treasury Index are similar over the intermediate and long run. Overall, this scenario ranks in the 30%–40% percentile of the VCMM projected average return distribution at a one-year horizon, and ranks near the median 50% percentile of the return distribution on a 10-year investment horizon.
Details on Scenario 2: The 3-year and 7-year Treasury yields rise less than currently implied by the forward curve through 2012 as the Federal Reserve raises short-term rates less than is currently expected. However, Treasury yields rise more quickly over the intermediate term as inflation expectations rise. Over the entire simulation horizon, the averages for the 3-year and 7-year Treasury yields are slightly below the average annual yields reflected in the current forward curve given the delayed monetary-policy response. Overall, this scenario ranks in the 75%–85% percentile of the VCMM projected average return distribution at a one-year horizon, and ranks in the 55%–65% percentile of the return distribution on a 10-year investment horizon.
Details on Scenario 3: The 3-year and 7-year Treasury yields both rise more quickly than they do under the current market forward curve, with the Treasury yield curve almost inverting in 2011 based on the unexpectedly aggressive actions of the Federal Reserve. Over the entire simulation horizon, however, the averages for the 3-year and 7-year Treasury yields are very similar to the average annual yields reflected in the current forward curve. Overall, this scenario ranks in the 15%–25% percentile of the VCMM projected average return distribution at a one-year horizon, and ranks in the 55%–65% percentile of the return distribution on a 10-year investment horizon.
Details on Scenario 4: The 3-year and 7-year Treasury yields both decline in 2011 as the economy falls back into recession. Throughout the simulation horizon, Treasury rates remain below those implied by the current forward curve as both economic growth and inflation expectations remain below current market expectations. For a time, corporate bonds underperform Treasury bonds as credit spreads widen during the double-dip recession. Overall, this scenario ranks in the 70%–80% percentile of the VCMM projected average return distribution at a one-year horizon, and ranks in the 30%–40% percentile of the return distribution on a ten-year investment horizon.
Details on Scenario 5: The 3-year and 7-year Treasury yields both rise more dramatically than they do under the current market forward curve. The 3-year yield rises as high as the 7-year yield by 2015, with the slope of the Treasury yield curve between the 3-year and 7-year Treasury rates inverting for a time as the Federal Reserve attempts to stabilize long-term inflation expectations through more restrictive short-term rates. For a time, corporate bonds under-perform Treasury bonds as credit spreads widen during the crisis. Overall, this scenario ranks in the bottom 10% percentile of the VCMM projected average return distribution at a one-year horizon, and ranks in the 75%–85% percentile of the return distribution on a 10-year investment horizon.
Note: The performance of an index is not an exact representation of any particular investment, as you cannot invest directly in an index.

Implications for portfolio construction
Akeylessonoftheglobalfinancialcrisisisthatimplementingatoo-narroworsurgicalbondallocation(suchasbyshorteningdurationorinvestingsolely inriskierbondinstruments)involvesimportanttrade-offsthatmayexposebondinvestorstounintendedyield-curveormarketriskswhilepotentiallydeprivingthemofahigherfutureincomestream.Thesetrade-offsareclearlyevidentintherangeofpotentialinterestratescenariosthatwehavedepictedinFigure9.
Thesevaried—butcertainlypossible—ratescenariosattesttothehighdegreeofuncertaintysurroundingthefuturedirectionofeconomicgrowth,thedeficit,
inflation,andinterestrates.Indeed,thedifficulty ofcorrectlyforecastingnotonlywhich(ifany)ofthesescenarioswillunfold,butalsopreciselywhen,isapowerfulreminderthatfocusingoninterestratemovesandshort-termchangesinbondpricescanbecounterproductive.Tous,therangeofpotentialoutcomesinFigure9wouldseemtosupportgreater fixedincomediversificationintheyearsahead, notless.
As illustrated in Figure 10, the performance of varioussegmentsofthebondmarketoverthepastseveralyearsunderscoresthebenefitsofabroadlydiversifiedfixedincomeportfolioregardless of the future direction of interest rates.
13
U.S. taxable bond market returns, 2003–2009
Annual total returns for Barclays Capital benchmarks
Figure 10.
Note: Past performance is no guarantee of future returns. The performance of an index is not an exact representation of any particular investment, as you cannot invest directly in an index.
Source: Barclays Capital.
Broad-market benchmark: A more broadly diversified portfolio (more securities, exposure to a wide array of risk premiums) that fluctuates less over time
-15
-10
-5
0
5
10
15
20
25
30
–15
–10
–5
0
5
10
15
20
25
30%
2003 2004 2005 2006 2007 2008 2009
Barclays U.S. Aggregate Bond Index
Barclays U.S. 1–5 Year Credit Index
Barclays U.S. Long Credit Index
Barclays U.S. 1–5 Year Treasury Index
Barclays U.S. Long Treasury Index

Overthelongterm,it’sinterestincome—andthereinvestmentofthatincome—thataccountsforthelargestportionoftotalreturnsformanybondfunds.Theimpactofpricefluctuationscanbemorethanoffsetbystayinginvestedandreinvestingincome,evenifthefutureissimilartotherising-rateenvironmentofthelate1970sandearly1980s,asillustratedinFigure11.AccordingtodataprovidedbytheFederalReserve,theyieldonthe10-yearTreasurybondmorethandoubledoverthisperiod,risingfromapproximately6.9%inDecember1976
toashighas15.3%inSeptember1981.Yetthehypothetical$1millioninvestmentmadein1976wouldhavegrowntomorethan$2.0millionbytheendof1983,notnecessarilyadisastrousoutcome given the period’s secular rise in interest rates.Moreover,thehigherlevelofinterestratesintheearly1980ssubsequentlyfellasinflationexpectationsdeclined,settingthestageforevenhigherbondreturnsoverthefollowingdecade.
14
Bond investing in the 1970s and early 1980s
Growth of a $1 million investment in the Barclay’s Capital U.S. Aggregate Bond Index, 1976–1983
Figure 11.
Notes: For this example, we assume that an investor fully funds a $1 million investment in the Barclay’s Capital U.S. Aggregate Bond Index Index on January 1, 1976. We do not account for any expenses or taxes. Interest-on-interest return is calculated as the remainder after subtracting both income and capital returns from the total return.
Past performance is no guarantee of future returns. The performance of an index is not an exact representation of any particular investment, as you cannot invest directly in an index.
Source: Vanguard calculations based on capital, income, and total return data reported by Barclay's Capital.
Higher interest income more than offsets capital
losses over time
0
500,000
1,000,000
1,500,000
2,000,000
$2,500,000
Dec.1975
Dec.1983
IncomeCapital Interest on interest
Capital losses from arising-rate environment
Dec.1976
Dec.1977
Dec.1979
Dec.1978
Dec.1980
Dec.1981
Dec.1982

References
Catao,Luis,andMarcoE.Terrones,2003.Fiscal Deficits and Inflation.Workingpaper,InternationalMonetaryFund.
Davis,JosephH.,2007.Evolving U.S. inflation dynamics: Explanations and investment implications.Vanguardwhitepaper,ValleyForge,Pa.: TheVanguardGroup.
Davis,JosephH.,2008.Macroeconomic Expectations and the Stock Market: The Importance of a Longer-Term Perspective.ValleyForge,Pa.: TheVanguardGroup.
Davis,JosephH.,andRogerAliaga-Díaz,2007. Real-time forecasting of U.S. bond yields and their excess returns.Workingpaper,SocialScienceResearchNetwork.
Davis,JosephH.,andJonathanCleborne,2009.Recent Policy Actions and the Outlook for U.S. Inflation.ValleyForge,Pa.:TheVanguardGroup.
Engen,EricM.,andR.GlennHubbard,2004. FederalGovernmentDebtandInterestRates. NBER Macroeconomics Annual 2004: 83–138.
Ilmanen,Antti,1996.Market’sRateExpectations andForwardRates.Journal of Fixed Income 6(2,September):8–22.
Laubach,Thomas,2007.New Evidence on the Interest Rate Effects of Budget Deficits and Debt.Workingpaper,U.S.BoardofGovernorsoftheFederalReserveSystem.
Warnock,FrancisE.,andVeronicaCacdacWarnock,2009.InternationalCapitalFlowsandU.S.InterestRates.Journal of International Money and Finance 28:903-919.
15

Vanguard research > Vanguard Center for Retirement Research Vanguard Investment Counseling & Research Vanguard Investment Strategy Group
E-mail > [email protected]
ETF Shares can be bought and sold only through a broker (who will charge a commission) and cannot be redeemed with the issuing fund. The market price of ETF Shares may be more or less than net asset value.
CFA® is a trademark owned by CFA Institute.
P.O.Box2600 ValleyForge,PA19482-2600
© 2010 The Vanguard Group, Inc. All rights reserved.
ICRDIR 032010
Connect with Vanguard® >www.vanguard.com >global.vanguard.com(non-U.S.investors)