Embed Size (px)
Citation preview
DQ DEFENDANT QUESTIONNAIRE:
An Inventory of Scientific Findings
Provided by:
Risk & Needs Assessment, Inc.
P.O. Box 44828 Phoenix, Arizona 85064-4828
Telephone: (602) 234-3506 Fax: (602) 266-8227
E-mail: [email protected] Website: www.RiskAndNeeds.com

TABLE OF CONTENTS
Preface.......................................................................................................................................................ii
Introduction...............................................................................................................................................1
Unique Features........................................................................................................................................2
Description of Scales................................................................................................................................3
Truthfulness........................................................................................................................................3
Alcohol Scale .....................................................................................................................................3
Drugs Scale.........................................................................................................................................4
Stress Coping Abilities Scale.............................................................................................................4
Antisocial Scale..................................................................................................................................5
Violence Scale....................................................................................................................................5
Substance Dependency/Abuse Classification Scale .........................................................................6
Research Studies.......................................................................................................................................6
Stress Quotient Research..........................................................................................................................8
DQ Research...........................................................................................................................................11
Validation of the Truthfulness Scale ...............................................................................................11
Validation of the Four DQ Scale Using Criterion Measures..........................................................12
Relationships Between Selected DQ Scales and Polygraph Examination ....................................14
Validation of DQ in a Sample of Substance Abuse Inpatients.......................................................15
Validation of DQ Scales Using DRI Scales as the Criterion Measure ..........................................17
Validation of DQ Scales in a Sample of Vocational Rehabilitation Clients..................................18
Validation of DQ Scales in a Sample of Adult Probationers .........................................................19
Validation of the DQ Violence Scale with a Polygraph Examination...........................................21
Validation of the Antisocial and Violence Scales...........................................................................21
Validation of the Substance Abuse/Dependency Scale and Other DQ Scales ..............................21
Reliability Study of DQ Scales in Two Samples of Probationers..................................................24
Validity, Reliability and Scale Risk Range Accuracy Study of the DQ in Drug Court Clients.......................................................................................................................25
Validation of the DQ in Drug Court Clients ...................................................................................29
Replication Study of DQ Reliability, Validity and Accuracy ........................................................34
A Study of DQ Reliability, Validity and Accuracy........................................................................36
DQ Test Statistics: An Ongoing Analysis.......................................................................................38
DQ Test Statistics and Recidivism Prediction ................................................................................40
Study of DQ Accuracy, Reliability, and Validity ...........................................................................42
Summary.................................................................................................................................................46
DQ Copyright (c) 1997; DQ Software Copyright (c) 1997, 1998 PREFACE
i
ii
Defendant Questionnaire (DQ) research and development began in 1997 and has continued. The DQ is designed to meet the needs of court screening and assessment. The copyrighted DQ database ensures continued research and development. The DQ is a brief, easily administered and automated (computer scored) test that is designed for adult misdemeanor and felony courts, drug courts and substance (alcohol and other drugs) abuse assessment. It includes true/false and multiple choice items and can be completed in 35 minutes. The DQ contains six empirically based scales: Truthfulness, Alcohol, Drugs, Antisocial, Violence and Stress Coping Abilities. In addition, the DQ includes a classification scale called the Substance Abuse/Dependency Scale which contains paraphrased and reformatted DSM-IV criteria for substance dependence and substance abuse. The DQ has been researched on college students, outpatients, inpatients, job applicants, chemical dependency clients, probationers and others. The DQ report explains client's attained scores and makes specific intervention and treatment recommendations. It also presents Truth-Corrected scores, significant items, multiple choice items and much more. The DQ report is designed for adult court, probation and parole use. In addition to treatment recommendations, this report presents specific recommendations. The recommendations for the Alcohol Scale and Drugs Scale are compatible with recommendations of the American Society of Addiction Medicine (ASAM). It is a risk and needs assessment instrument. This document summarizes much of the validity and reliability research that contributed to DQ development. The DQ has demonstrated reliability, validity and accuracy. It correlates impressively with both experienced staff judgment and other recognized tests. DQ tests can be given directly on the computer screen or in paper-pencil test booklet format. All tests are computer scored on-site. DQ reports are available within three minutes of test completion. Diskettes contain all of the software needed to score tests, build a database and print reports. The DQ Windows version also has an optional human voice audio presentation that presents the test on the computer screen with accompanying auditory presentation of the text seen on the computer screen. DQ users are typically not clinicians or diagnosticians. Their role is usually to identify client risk, substance (alcohol and other drugs) abuse and client need prior to recommending intervention, supervision levels and/or treatment. The DQ is to be used in conjunction with a review of available records and respondent interview. No decision or diagnosis should be based solely on DQ results. Client assessment is not to be taken lightly as the decisions made can be vitally important as they effect peoples lives. DQ research is ongoing in nature, so that evaluators can be provided with the most accurate information possible.
INTRODUCTION
DEFENDANT QUESTIONNAIRE (DQ) Increased public awareness of substance (alcohol and other drugs) abuse as a nationwide health problem has clarified the need for identification and treatment of these disorders. Rising health care costs have placed increasing responsibilities on all persons working with substance abusers. Workers in the field must now document and substantiate their intervention and treatment. Patients, clients, their families, probation departments, the courts, diversion programs, corrections programs and funding agencies are now requiring substantiation and documentation of staff decision making. Substance (alcohol and other drugs) abuse and dependency problems must now be measured in terms of degree of severity, with quantitative statements substantiating intervention and treatment. The Defendant Questionnaire (DQ) was developed to help meet the needs of court screening and assessment. The DQ is designed for adult chemical dependency and substance (alcohol and other drugs) abuse assessment. The DQ is particularly useful in drug courts, family courts, municipal courts and county courts. It can be used to evaluate misdemeanor or felony charged defendants. DQ reports are particularly useful at pre-sentence hearings. In these reports quantitative information is obtained by empirically based measures (scales) which independently generate risk (percentile) scores. Scale development is based upon nearly 20 years of research. In addition, explanatory paragraphs describe attained scores and contain specific score-related recommendations. Alcohol Scale and Drugs Scale risk-related recommendations are compatible with ASAM recommended treatment levels. And each scale is presented graphically in the DQ profile.
DEFENDANT QUESTIONNAIRE MEASURES OR SCALES
1. Truthfulness Scale 2. Alcohol Scale 3. Drugs Scale 4. Antisocial 5. Violence 6. Stress Coping Abilities Scale *. Substance Abuse/Dependency Classification Scale The DQ is a brief, easily administered and interpreted substance abuse screening or assessment instrument. The DQ represents the latest developments in psychometric techniques and computerized technology. The DQ can be administered on a computer (IBM-PC compatibles) screen or by using paper-pencil test booklets. Regardless of how the DQ is administered, all tests are scored and interpreted with a computer which generates DQ reports. The DQ requires approximately 35 minutes for completion and is appropriate for high school ages through adulthood. The DQ is composed of True-False and multiple-choice items. It can be administered individually or in groups. The language is direct, non-offensive and uncomplicated. Automated scoring and interpretive procedures help insure objectivity and accuracy. The DQ is to be used in conjunction with a review of available records, a focused interview and experienced staff judgment.
1
The DQ was designed to provide carefully developed measures (called scales) of several behavioral patterns and traits of interest to those working with substance abusers. The measures (scales) chosen for inclusion in the DQ further the understanding of the substance (alcohol and other drugs) abuser. The DQ integrates DSM-IV substance dependency/abuse criteria with Alcohol Scale and Drugs Scale severity measures, and ASAM guidelines. In addition, they provide important information on the client’s test taking attitude, emotional/behavioral adjustment, and much more.
UNIQUE FEATURES Truth Correction: A sophisticated psychometric technique permitted by computerized technology involves "truth-corrected" scores which are calculated individually for DQ scales. Since it would be naive to assume everybody responds truthfully while completing any self-report test, the Truthfulness Scale was developed. The Truthfulness Scale establishes how honest or truthful a person is while completing the DQ. Correlation’s between the Truthfulness Scale and all other scales permit identification of error variance associated with untruthfulness. This error variance can then be added back into scale scores, resulting in more accurate "Truth-Corrected" scores. Unidentified denial or untruthfulness produces inaccurate and distorted results. Raw scores may only reflect what the client wants you to know. Truth-Corrected scores reveal what the client is trying to hide. Truth-Corrected scores are more accurate than raw scores. Risk Range Percentile Scores: Each DQ scale is scored independently of the other scales. DQ scale scoring equations combine client pattern of responding to scale items, Truthfulness Scale and prior history that is contained on the DQ answer sheet. The Truthfulness Scale applies a truth-correction factor so that each scale score is referred to as a Truth-Corrected scale score. These Truth-Corrected scale scores are converted to the percentile scores that are reported in the client DQ report. DQ scale percentile scores represent “degree of severity.” Degree of severity is defined for scales, other than the Alcohol and Drugs scales, as follows: Low Risk (zero to 39th percentile), Medium Risk (40th to 69th percentile), Problem Risk (70th to 89th percentile), and Severe Problem or Maximum Risk (90th to 100th percentile). The Alcohol Scale and Drugs Scale attempt to incorporate ASAM intervention and/or treatment placement recommendations where appropriate. Degree of severity and recommended intervention levels for the Alcohol and Drugs Scale are defined as follows: Non-pathological use (zero to 29th percentile), Substance Education (30 to 39th percentile), Substance Education Program and AA, NA or CA (40 to 54th percentile), Level I--Outpatient treatment (55 to 89th percentile), Level II--Intensive Outpatient/Partial Hospitalization (90 to 95th percentile), Level III--Medically Monitored Intensive Inpatient and Level IV--Medically Managed Intensive Inpatient (95 to 100th percentile). Severe problems include dependency. Standardization data is statistically analyzed where percentile scale scores are derived from obtained scale scores from offender populations. The cumulative distributions of truth-corrected scale scores determine the cut-off scores for each of the four risk range and severity categories. Individual scale score calculations are automatically performed and results are presented in the DQ report numerically (percentile), by attained risk category (narrative) and graphically (DQ profile).
2
DQ Database: Every time a DQ is scored the test data is automatically stored on the diskette for inclusion in the DQ database. This applies to DQ diskettes used anywhere in the United States and Canada. When the preset number of tests are administered (or used up) on a DQ diskette, the diskette is returned for replacement and the test data contained on these used diskettes is input, in a confidential (no names) manner, into the DQ database for later analysis. This database is statistically analyzed annually, at which time future DQ diskettes are adjusted to reflect demographic changes or trends that might have occurred. This unique and proprietary database also enables the formulation of annual summary reports that are descriptive of the populations tested. Summary reports provide important testing information, for budgeting, planning, management and program description. Confidentiality (Delete Client Names): Many agencies and programs are rightfully concerned about protecting their client’s confidentiality. The proprietary Delete Client Names option is provided to allow deletion of client names from test diskettes prior to their being returned to Risk & Needs Assessment. This is optional and once the names have been deleted they are gone and cannot be retrieved. Deleting client names does not delete demographic information or test data. It only deletes the client names when the option is used. The option is available at any time and can be used whether the diskette is full or not. Once the client names are deleted there can be no further editing of client names. This ensures client confidentiality.
DESCRIPTION OF EMPIRICALLY BASED MEASURES OR SCALES DQ scales were developed from large item pools. Three Ph.D. level psychologists familiar with each scale selected initial DQ items. Initial item selection was a rational process based upon clearly understood definitions of each scale. Subsequently, items and scales were analyzed for final test selection. The original pool of potential test items was analyzed and the items with the best statistical properties were retained. Final test and item selection was based on each item's statistical properties. It is important that users of the DQ familiarize themselves with the definition of each scale. For that purpose a description of each DQ scale follows. Truthfulness Scale: This scale is a measure of the truthfulness of the client while completing the DQ. Obtained scores are categorized in terms of percentiles and risk levels, i.e., Low Risk, Medium Risk, Problem Risk, and Severe Problem (Maximum Risk). All interview and self-report information is subject to the dangers of untrue answers due to defensiveness, guardedness or deliberate falsification. The straightforward nature of any self-report questionnaire may appear to some people as intrusive -- giving rise to denial, faking and even distortion. The Truthfulness Scale identifies these self-protective, recalcitrant and guarded people who minimize or even conceal information. It is equally important to establish that the client understood the test items he or she was responding to, and the Truthfulness Scale also helps identify the reading impaired. The Truthfulness Scale goes beyond establishing the truthfulness of the client. The correlation between the Truthfulness Scale and each other scale has been established, error variance associated with untruthfulness has been identified, and this error variance measure is added back into "truth-corrected" scale scores. Truth-corrected scale scores are more accurate than raw scores. A high Truthfulness Scale score (at or above the 90th percentile) invalidates all scale scores. Alcohol Scale: This empirically based scale is a measure of a person having alcohol related problems. Obtained scores are categorized in terms of percentiles and severity intervention levels (i.e., Non-
3

pathological use, Substance (alcohol/drug) Education, Substance Education Program and AA, NA or CA, Level I Outpatient Treatment, Level II Intensive Outpatient/Partial Hospitalization, Level III and Level IV Intensive Inpatient. An elevated score at or above the 90th percentile identifies dependency and severe problems. Alcoholism is a significant problem in our society. Woolfolk and Richardson note in their book, "Stress, Sanity and Survival" that alcoholism costs industries over $15.6 billion annually due to absenteeism and medical expenses. And over two decades later these costs have increased substantially. The harm associated with alcohol abuse -- mental, emotional, and physical -- is well documented. The costs associated with alcohol-related problems are staggering. Alcoholism has been empirically related to arrest records, hospitalizations, illicit substance (drugs) abuse, emotional problems, driving records and stress. Experienced staff are aware of alcoholics' job performance problems, impaired interpersonal relationships and poor stress coping abilities. It is apparent that most people have been exposed to alcohol in our society. Frequency and magnitude of alcohol use or severity of abuse are important factors. It is important to assess or measure the degree of severity of alcohol abuse, including dependency. This is done with the Alcohol Scale. Drugs Scale: This empirically based scale is a measure of a person having drug abuse related problems. Obtained scores are categorized in terms of percentiles and severity intervention levels (i.e., Non-pathological use, Substance (alcohol/drug) Education, Substance Education Program and AA, NA or CA, Level I Outpatient Treatment, Level II Intensive Outpatient/Partial Hospitalization, Level III and Level IV Intensive Inpatient. A drug may be broadly defined as any chemical substance that affects living processes. This definition includes alcohol as well as marijuana, cocaine, crack, ice, heroin, opium, amphetamines, barbiturates, LSD, etc. An important distinction between these substances is legality. The major licit (or legal) drugs are caffeine, nicotine and alcohol. They are generally socially approved and legally marketed substances. Increased public awareness of illicit (or illegal) substance use and abuse as well as its effects on peoples' lives is a growing concern. The burgeoning awareness of marijuana and cocaine abuse is but one example of this concern about illicit substance use and abuse. Since both licit and illicit substances, as discussed herein, are defined as "drugs," correlation’s between alcohol and drug abuse measures have been shown to exist. To discriminate between these groups in the DQ the licit versus illicit dichotomy is emphasized. It is apparent that many people have been exposed to drugs in our society. Frequency and magnitude of drug use or abuse are important factors. It is important to assess or measure the degree of severity of drug abuse including dependency. This is done with the Drugs Scale. Stress Coping Abilities Scale: This empirically based scale is a measure of a person’s experienced stress level in comparison to that person’s ability to cope with stress. Obtained scores are categorized in terms of percentiles and risk levels (i.e., Low Risk, Medium Risk, Problem Risk and Severe Problem (Maximum Risk).
4
Stress is an increasingly significant concept in our society. The National Institute for Occupational Safety and Health (NIOSH) recently evaluated the health records of 22,000 workers in 130 organizations. Their conclusion: stress affects workers in all types of job levels; unskilled laborers are equally susceptible, as are top-line executives. How effectively individuals cope with stress determines whether or not stress is a significant factor in their lives. Two concepts, stress and coping abilities dominate the literature on stress. The Stress Coping Abilities Scale includes measures of both of these concepts in its Stress Quotient (SQ) equation. The better an individual’s coping skills, compared to their amount of experienced stress, the higher the SQ score. In contrast, if an individual is experiencing more stress than he or she can cope with, the lower the SQ score. In the DQ profile, Stress Quotient (SQ) scores were inverted to conform to the established risk levels ranging from low to high risk categories. Stress exacerbates other symptoms of emotional, attitudinal, interpersonal and substance abuse related problems. Frequency and magnitude of impaired stress coping abilities are important factors in understanding the substance abuser. A Stress Coping Abilities Scale score at or above the 90th percentile is typically indicative of a diagnosable mental health problem. It is important to assess or measure the degree of severity of stress coping ability problems. This is done with the Stress Coping Abilities Scale. Antisocial Scale: This term refers to those chronically antisocial individuals who seem to lack the capacity to form significant attachments or loyalties with others or groups. They are often callous, given to immediate pleasure, appear devoid of a sense of responsibility, and fail to learn from experience. They seem to lack in social judgment. Such individuals often rationalize their behavior in a “seemingly logical” manner and can be very convincing to others. Obtained scores are categorized in terms of percentiles and risk levels (i.e., Low Risk, Medium Risk, Problem Risk and Severe Problem (Maximum) Risk). Underlying characteristics often include personal self-aggrandizement, acquisition of money and material goods, and the control of others. Antisocial individuals are typically selfish, affectionless, ungrateful, narcissistic, and sometimes exhibitionistic. They can be egocentric, “demanding a lot and giving little.” Their conduct often appears hostile from a social standpoint, and they show few feelings of anxiety, guilt, or remorse. They are often restless. The defect, or lacunae, as it has been termed, may be limited to a general style of behavior--such as stealing, running away, or promiscuity. Antisocial individuals show a moral or ethical blunting and a lack of sympathy or concern for others. They lack a sense of responsibility, engage in purposeless lying, and manifest denial as well as projection. Violence Scale: This scale measures the client’s use of physical force to injure, damage, or destroy. It identifies individuals that are dangerous to themselves and others. Obtained scores are categorized in terms of percentiles and risk levels (i.e., Low Risk, Medium Risk, Problem Risk and Severe Problem (Maximum) Risk). An ever-present concern when evaluating offenders is lethality or violence potential. Violence is a significant problem in our society. The harm associated with violence--mental, emotional, and physical--is often under-reported by victims and family. And, there are some people who are “violence prone.” They are sensitive to perceived criticism, seek revenge, and overtly try to hurt, harm, or even destroy.
5
Studies such as those conducted at the University of Michigan indicate that drivers can be classified on a risk potential index as safe drivers or high risk drivers by monitoring inappropriate driving behavior such as moving violations, arrests, etc. Mortimer, et al. (1971)1 concluded that alcoholics were significantly more involved in such offenses. Selzer (1971)2 concluded in his research that for maximal screening effectiveness, test results and arrest records be used jointly. More recently (1984), the National Council on Alcoholism pointed out that “research results indicate driver’s potential for risk-taking behavior may exist independently of his or her use of alcohol, and manifest itself as, aggressive irresponsibility.” Continuing (NCA Newsletter, 1984), “positive correlations were found between high-risk groups and a number of other enforcement-related variables. Among these are non-traffic related drinking offenses, violent crimes, social, and fraudulent offenses, non-violent crimes, larceny, etc.” These studies emphasize the importance of a multidimensional approach to assessing aggressiveness-related problems and violence. A person’s aggressiveness (e.g., acting out potential) may be related to substance abuse, overall adjustment, emotional problems, traits such as aggressiveness or risk-taking, and stress-coping abilities. Violence may result from aggressiveness taken to a higher or more violent level of physical force, assault and lethality. With these relationships in mind, it is important to explore these areas of inquiry to better understand the substance (alcohol and other drugs) abuser. This is done with the Violence Scale. Substance Abuse/Dependency Classification Scale: Psychoactive substance use, abuse and dependency are discussed and defined in the Diagnostic and Statistical Manual of Mental Disorders (DSM-IV). And it is from this source that the Substance Abuse/Dependency Scale evolved. Dependency as used in the DQ is defined as admission to three or more of the seven DSM-IV symptoms of dependency. Substance Abuse is defined as admission to one or more of the four DSM-IV symptoms. The Substance Abuse/Dependency Scale incorporates the seven DSM-IV Substance Dependency criteria items and the four DSM-IV Substance Abuse criteria items. The DQ Alcohol Scale and Drugs Scale measure risk or severity level and include DSM-IV equivalent items to support DSM-IV criteria items. Defendant admission of three of the seven DSM-IV dependency items results in Substance Dependence classification. Similarly, defendant admission to one of the four DSM-IV abuse items results in Substance Abuse classification. The DQ report is designed for substance (alcohol and other drugs) abuse assessment in court settings. It is particularly useful at pre-sentence hearings. DQ test items are personal. The straightforward nature of any self-report questionnaire may appear to some people as intrusive. Although perhaps discomforting to some, such criticism is directly related to the DQ’s strength in assessing substance abuse and related problems objectively. Information deemed personal by some is necessary in an empirical (as opposed to rational) approach to assessment. A similar type of criticism (intrusiveness) has been leveled at the MMPI in the past.
RESEARCH STUDIES The Defendant Questionnaire (DQ) validation studies were conducted with established Minnesota Multiphasic Personality Inventory (MMPI) scales as well as Polygraph examinations and other reports. Reliability and validity studies have been conducted on substance abuse inpatients, outpatients, college students, job applicants, defendants, diversion program attendees, probationers, inmates and counseling patients. The DQ has been studied in adult court settings and probation departments.
6
Empirically based DQ scales (or measures) were developed by statistically relating scale item configurations to known substance (alcohol and other drugs) abuse groups. The DQ was then normed against an adult drug court offender population. A summary of much of this DQ research follows. This document first presents the earlier studies that investigated the Stress Coping Abilities Scale. The research represented in this document is reported chronologically -- as it occurred. Chronological presentation enables the reader to follow the evolution of the DQ into a state-of-the-art assessment instrument. More recent studies (toward the end of this document) are most representative of current DQ statistics. DQ risk level classification categories are presented below. These percentages are based on DQ respondent scale scores. This permits comparison of predicted percentages with obtained percentages for each risk range category.
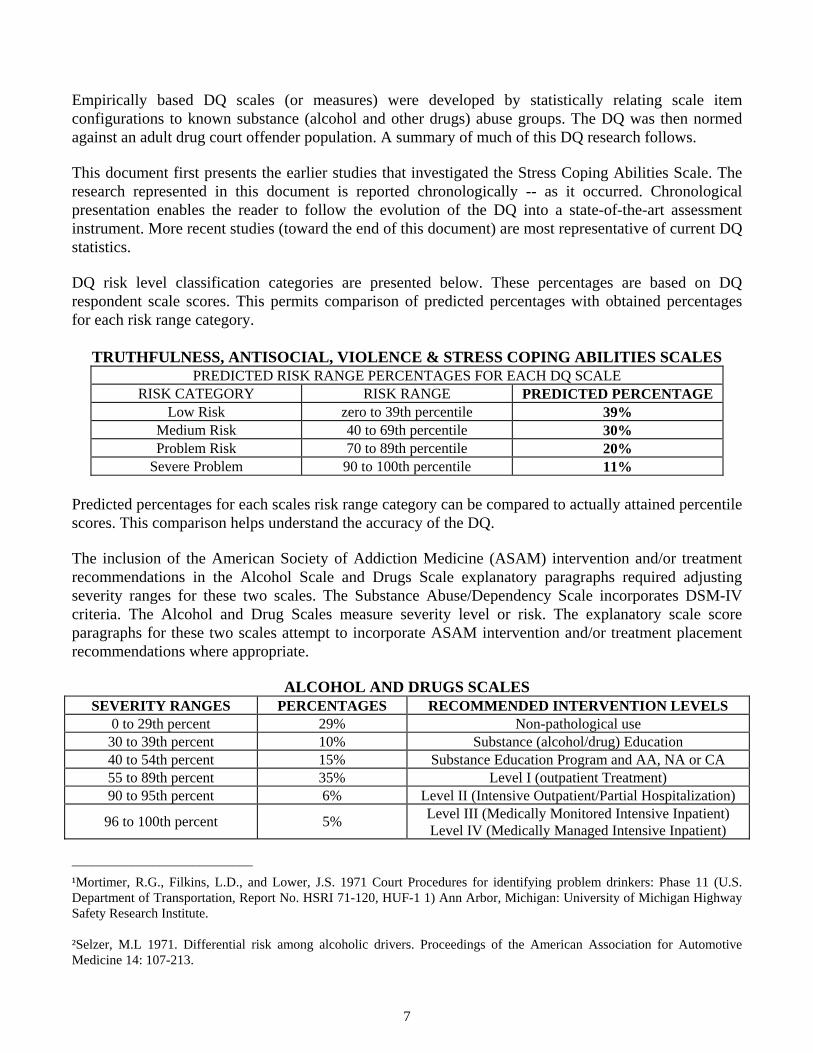
TRUTHFULNESS, ANTISOCIAL, VIOLENCE & STRESS COPING ABILITIES SCALES PREDICTED RISK RANGE PERCENTAGES FOR EACH DQ SCALE
RISK CATEGORY RISK RANGE PREDICTED PERCENTAGE Low Risk zero to 39th percentile 39%
Medium Risk 40 to 69th percentile 30% Problem Risk 70 to 89th percentile 20%
Severe Problem 90 to 100th percentile 11% Predicted percentages for each scales risk range category can be compared to actually attained percentile scores. This comparison helps understand the accuracy of the DQ. The inclusion of the American Society of Addiction Medicine (ASAM) intervention and/or treatment recommendations in the Alcohol Scale and Drugs Scale explanatory paragraphs required adjusting severity ranges for these two scales. The Substance Abuse/Dependency Scale incorporates DSM-IV criteria. The Alcohol and Drug Scales measure severity level or risk. The explanatory scale score paragraphs for these two scales attempt to incorporate ASAM intervention and/or treatment placement recommendations where appropriate.
ALCOHOL AND DRUGS SCALES SEVERITY RANGES PERCENTAGES RECOMMENDED INTERVENTION LEVELS
0 to 29th percent 29% Non-pathological use 30 to 39th percent 10% Substance (alcohol/drug) Education 40 to 54th percent 15% Substance Education Program and AA, NA or CA 55 to 89th percent 35% Level I (outpatient Treatment) 90 to 95th percent 6% Level II (Intensive Outpatient/Partial Hospitalization)
96 to 100th percent 5% Level III (Medically Monitored Intensive Inpatient) Level IV (Medically Managed Intensive Inpatient)
___________________________
¹Mortimer, R.G., Filkins, L.D., and Lower, J.S. 1971 Court Procedures for identifying problem drinkers: Phase 11 (U.S. Department of Transportation, Report No. HSRI 71-120, HUF-1 1) Ann Arbor, Michigan: University of Michigan Highway Safety Research Institute. ²Selzer, M.L 1971. Differential risk among alcoholic drivers. Proceedings of the American Association for Automotive Medicine 14: 107-213.
7

STRESS QUOTIENT
The Stress Quotient (SQ) or Stress Coping Abilities Scale is based upon the following mathematical equation:
SQ = CS/S x k
The Stress Quotient (SQ) scale is a numerical value representing a person's ability to handle or cope with stress relative to their amount of experienced stress. CS (Coping Skill) refers to a person's ability to cope with stress. S (Stress) refers to experienced stress. k (Constant) represents a constant value in the SQ equation to establish SQ score ranges. The SQ includes measures of both stress and coping skills in the derivation of the Stress Quotient (SQ) score. The better an individual's coping skills, compared to the amount of experienced stress, the higher the SQ score. The Stress Quotient (SQ) scale equation represents empirically verifiable relationships. The SQ scale (and its individual components) lends itself to research. Nine studies were conducted to investigate the validity and reliability of the Stress Quotient or Stress Coping Abilities Scale. Validation Study 1: This study was conducted (1980) to compare SQ between High Stress and Low Stress groups. The High Stress group (N=10) was comprised of 5 males and 5 females. Their average age was 39. Subjects for the High Stress group were randomly selected from outpatients seeking treatment for stress. The Low Stress group (N=10) was comprised of 5 males and 5 females (average age 38.7) randomly selected from persons not involved in treatment for stress. High Stress group SQ scores ranged from 32 to 97, with a mean of 64.2. Low Stress group SQ scores ranged from 82 to 156, with a mean of 115.7. The t-test statistical analysis of the difference between the means of the two groups indicated that the High Stress group had significantly higher SQ scores than the Low Stress group (t = 4.9, p < .001). This study shows that the SQ or Stress Coping Abilities Scale is a valid measure of stress coping. The Stress Coping Abilities Scale significantly discriminates between high stress individuals and low stress individuals. Validation Study 2: This study (1980) evaluated the relationship between the SQ scale and two criterion measures: Taylor Manifest Anxiety Scale and Cornell Index. These two measures have been shown to be valid measures of anxiety and neuroticism, respectively. If the SQ or Stress Coping Abilities Scale is correlated with these measures it would indicate that the SQ or Stress Coping Abilities Scale is a valid measure. In the Taylor Manifest Anxiety Scale, high scores indicate a high level of anxiety. Similarly, in the Cornell Index high scores indicate neuroticism. Negative correlation coefficients between the two measures and the SQ were expected because high SQ scores indicate good stress coping abilities. The three tests were administered to forty-three (43) subjects selected from the general population. There were 21 males and 22 females ranging in age from 15 to 64 years. Utilizing a product-moment correlation, SQ scores correlated -.70 with the Taylor Manifest Anxiety Scale and -.75 with the Cornell Index. Both correlations were significant, in the predicted direction, at the p < .01 level. These results support the finding that the Stress Coping Abilities Scale is a valid measure of stress coping abilities. The reliability of the SQ was investigated in ten subjects (5 male and 5 female) randomly chosen from this study. A split-half correlation analysis was conducted on the SQ items. The product-moment correlation coefficient (r) was .85, significant at the p < .01 level. This correlation indicates that the SQ or Stress Coping Abilities Scale is a reliable measure. These results support the Stress Coping Abilities Scale as a reliable and valid measure.
8
Validation Study 3: In this study (1981) the relationship between the SQ Scale and the Holmes Rahe Social Readjustment Rating Scale (SRRS) was investigated. The SRRS, which is comprised of a self-rating of stressful life events, has been shown to be a valid measure of stress. Three correlation analyses were done. SRRS scores were correlated with SQ scores and separately with two components of the SQ scale: Coping Skill (CS) scores and Stress (S) scores. It was hypothesized that the SQ and SRRS correlation would be negative, since subjects with lower SQ scores would be more likely to either encounter less stressful life events or experience less stress in their lives. It was also predicted that subjects with a higher CS would be less likely to encounter stressful life events, hence a negative correlation was hypothesized. A positive correlation was predicted between S and SRRS, since subjects experiencing more frequent stressful life events would reflect more experienced stress. The participants in this study consisted of 30 outpatient psychotherapy patients. There were 14 males and 16 females. The average age was 35. The SQ and the SRRS were administered in counterbalanced order. The results showed there was a significant positive correlation (product-moment correlation coefficient) between SQ and SRRS (r = .4006, p<.01). The correlation results between CS and SRRS was not significant (r = .1355, n.s.). There was a significant positive correlation between S and SRRS (r = .6183, p<.001). The correlations were in predicted directions. The significant correlations between SQ and SRRS as well as S and SRRS support the construct validity of the SQ or Stress Coping Abilities Scale. Validation Study 4: This validation study (1982) evaluated the relationship between factor C (Ego Strength) in the 16 PF Test as a criterion measure and the SQ in a sample of juveniles. High scores on factor C indicate high ego strength and emotional stability, whereas high SQ scores reflect good coping skills. A positive correlation was predicted because emotional stability and coping skills reflect similar attributes. The participants were 34 adjudicated delinquent adolescents. They ranged in age from 15 to 18 years with an average age of 16.2. There were 30 males and 4 females. The Cattell 16 PF Test and the SQ scale were administered in counterbalanced order. All subjects had at least a 6.0 grade equivalent reading level. The correlation (product-moment correlation coefficient) results indicated that Factor C scores were significantly correlated with SQ scores (r = .695, p<.01). Results were significant and in the predicted direction. These results support the SQ or Stress Coping Abilities Scale as a valid measure of stress coping abilities in juvenile offenders. In a subsequent study the relationship between factor Q4 (Free Floating Anxiety) on the 16 PF Test and S (Stress) on the SQ scale was investigated. High Q4 scores reflect free floating anxiety and tension, whereas high S scores measure experienced stress. A high positive correlation between Q4 and S was predicted. There were 22 of the original 34 subjects included in this analysis since the remainder of the original files were unavailable. All 22 subjects were male. The results indicated that Factor Q4 scores were significantly correlated (product-moment correlation coefficient) with S scores (r = .584, p<.05). Results were significant and in predicted directions. The significant correlation’s between factor C and SQ scores as well as factor Q4 and S scores support the construct validity of the SQ scale. Validation Study 5: Psychotherapy outpatient clients were used in this validation study (1982) that evaluated the relationship between selected Wiggin's MMPI (Minnesota Multiphasic Personality Inventory) supplementary content scales (ES & MAS) as criterion measures and the SQ scale. ES measures ego strength and MAS measures manifest anxiety. It was predicted that the ES and SC correlation would be positive, since people with high ego strength would be more likely to possess good coping skills. Similarly, it was predicted that MAS and S correlations would be positive, since people experiencing high levels of manifest anxiety would also likely experience high levels of stress. The subjects were 51 psychotherapy outpatients ranging in age from 22 to 56 years with an average age of 34. There were 23 males and 28 females. The MMPI and the SQ were administered in counterbalanced
9
order. The correlation (product-moment correlation coefficient) results indicated that ES and CS were positively significantly correlated (r = .29, p<.001). MAS and S comparisons resulted in an r of .54, significant at the p < .001 level. All results were significant and in predicted directions. In a related study (1982) utilizing the same population data (N=51) the relationship between the Psychasthenia (Pt) scale in the MMPI and the S component of the SQ scale was evaluated. The Pt scale in the MMPI reflects neurotic anxiety, whereas the S component of the SQ scale measures stress. Positive Pt and S correlations were predicted. The correlation (product-moment correlation coefficient) results indicated that the Pt scale and the S component of the SQ scale were significantly correlated (r = .58, p<.001). Results were significant and in the predicted direction. The significant correlation’s between MMPI scales (ES, MAS, Pt) and the SQ scale components (CS, S) support the construct validity of the SQ or Stress Coping Abilities Scale. Reliability Study 6: The reliability of the Stress Quotient (SQ) or Stress Coping Abilities Scale was investigated (1984) in a population of outpatient psychotherapy patients. There were 100 participants, 41 males and 59 females. The average age was 37. The SQ was administered soon after intake. The most common procedure for reporting inter-item (within test) reliability is with Coefficient Alpha. The reliability analysis indicated that the Coefficient Alpha of 0.81 was highly significant (F = 46.74, p<.001). Highly significant inter-item scale consistency was demonstrated. Reliability Study 7: (1985) The reliability of the Stress Quotient (SQ) or Stress Coping Abilities Scale was investigated in a sample of 189 job applicants. There were 120 males and 69 females with an average age of 31. The SQ was administered at the time of pre-employment screening. The reliability analysis indicated that the Coefficient Alpha of 0.73 was highly significant (F = 195.86, p<.001). Highly significant Cronbach Coefficient Alpha reveals that all SQ scale items are significantly (p<.001) related and measure one factor or trait. Validation Study 8: Chemical dependency inpatients were used in a validation study (1985) to determine the relation between MMPI scales as criterion measures and the Stress Quotient (SQ) Scale or Stress Coping Abilities Scale. The SQ is inversely related to other MMPI scales, consequently, negative correlation’s were predicted. The participants were 100 chemical dependency inpatients. There were 62 males and 38 females with an average age of 41. The SQ and the MMPI were administered in counterbalanced order. The reliability analysis results indicated that the Coefficient Alpha of 0.84 was highly significant (F = 16.20, p<001). Highly significant inter-item scale consistency was demonstrated. The correlation (product-moment correlation coefficient) results between the Stress Quotient (SQ) and selected MMPI scales were significant at the p < .001 level and in predicted directions. The SQ correlation results were as follows: Psychopathic Deviate (-0.59), Psychasthenia (-.068), Social Maladjustment (-0.54), Authority Conflict (-0.46), Taylor Manifest Anxiety Scale (-0.78), Authority Problems (-0.22), and Social Alienation (-0.67). The most significant SQ correlation was with the Taylor Manifest Anxiety Scale. As discussed earlier, stress exacerbates symptoms of impaired adjustment as well as emotional and attitudinal problems. These results support the Stress Quotient or Stress Coping Abilities Scale as a valid measure of stress coping abilities. Validation Study 9: In a replication of earlier research, a study (1986) was conducted to further evaluate the reliability and validity of the Stress Quotient (SQ). The participants were 212 inpatients in chemical dependency programs. There were 122 males and 90 females with an average age of 44. The SQ and MMPI were administered in counterbalanced order. Reliability analysis of the SQ scale resulted
10
in a Coefficient Alpha of 0.986 (F = 27.77, p<.001). Highly significant inter-item scale consistency was again demonstrated. Rounded off, the Coefficient Alpha for the SQ was 0.99. In the same study (1986, inpatients), product-moment correlations were calculated between the Stress Quotient (SQ) and selected MMPI scales. The SQ correlated significantly (.001 level) with the following MMPI scales: Psychopathic Deviate (Pd), Psychasthenia (Pt), Anxiety (A), Manifest Anxiety (MAS), Ego Strength (ES), Social Responsibility (RE), Social Alienation (PD4A), Social Alienation (SC1A), Social Maladjustment (SOC), Authority Conflict (AUT), Manifest Hostility (HOS), Suspiciousness/Mistrust (TSC-II), Resentment/Aggression (TSC-V) and Tension/Worry (TSC-VII). All SQ correlations with selected MMPI scales were significant (at the .001 level of significance) and in predicted directions. These results support the SQ scale or Stress Coping Abilities Scale as a valid measure of stress coping abilities. The studies cited above demonstrate empirical relationships between the SQ scale (Stress Coping Abilities Scale) and other established measures of stress, anxiety and coping skills. This research demonstrates that the Stress Quotient (SQ) or Stress Coping Abilities Scale is a reliable and valid measure of stress coping abilities. The SQ has high inter-item scale reliability. The SQ also has high concurrent (criterion-related) validity with other recognized and accepted tests. The SQ scale permits objective (rather than subjective) analysis of the interaction of these important variables. In the research that follows, the Stress Quotient or SQ is also referred to as the Stress Coping Abilities Scale.
DQ RESEARCH The Defendant Questionnaire (DQ) is designed for court use. The DQ has a long history of research and development, much of which is contained in the following summary. DQ research is reported in a chronological format, reporting studies as they occurred. This gives the reader the opportunity to see how the DQ evolved into a state-of-the-art risk and needs assessment instrument. For current information refer to the more recent studies near the end of this document. Initially, a large item pool was rationally developed for DQ scale consideration. Consensual agreement among three Ph.D. level psychologists and other experienced chemical dependency counselors familiar with scale definitions reduced the initial item pool markedly. Final item selection was empirical - comparing statistically related item configurations to known substance abuse groups. Items chosen had acceptable inter-item reliability coefficients and correlated highest with their respective scales. Final item selection was based on each item's statistical properties. The DQ was then objectively standardized and normed on adult drug court offender populations. 10. Validation of the Truthfulness Scale The Truthfulness Scale in the DQ is an important psychometric scale as these scores establish how truthful the respondent was while completing the DQ. Truthfulness Scale scores determine whether or not DQ profiles are accurate and are integral to the calculation of Truth-Corrected DQ scale scores. The Truthfulness Scale identifies respondents who were self-protective, recalcitrant and guarded, as well as those who minimized or even concealed information while completing the test. Truthfulness Scale items are designed to detect respondents who try to fake good or put themselves into a favorable light. These scale items are statements about oneself that most people would agree to. The following statement
11
is an example of a Truthfulness Scale item, “Sometimes I worry about what others think or say about me.” This preliminary study (1985) used the 21 Truthfulness Scale items in the DQ to determine if these Truthfulness Scale items could differentiate between respondents who were honest from those trying to fake good. It was hypothesized that the group trying to fake good would score higher on the Truthfulness Scale than the group instructed to be honest. Method Seventy-eight Arizona State University college students enrolled in an introductory psychology class were randomly assigned to one of two groups. Group 1 comprised the “Honest” group and Group 2 comprised the “Fakers” group. Group 1 was instructed to be honest and truthful while completing the test. Group 2 was instructed to "fake good" while completing the test, but to respond "in such a manner that their faking good would not be detected." The test, which included the DQ Truthfulness Scale, was administered to the subjects and the Truthfulness Scale was embedded in the test as one of the six scales. Truthfulness Scale scores were made up of the number of deviant answers given to the 21 Truthfulness Scale items. Results The mean Truthfulness Scale score for the Honest group was 2.71 and the mean Truthfulness Scale score for Fakers was 15.77. The results of the correlation (product-moment correlation coefficient) between the Honest group and the Fakers showed that the Fakers scored significantly higher on the Truthfulness Scale than the Honest group (r = 0.27, p < .05). The Truthfulness Scale successfully measured how truthful the respondents were while completing the test. The results of this study demonstrate that the Truthfulness Scale accurately detects "Fakers" from those students that took the test honestly. 11. Validation of Four DQ Scales using Criterion Measures In general terms, a test is valid if it measures what it is supposed to measure. The process of confirming this statement is called validating a test. A common practice when validating a test is to compute a correlation between it and another (criterion) test that purports to measure the same thing and that has been previously validated. For the purpose of this study (1985), the four DQ scales (Truthfulness, Alcohol, Drugs, Stress Coping Abilities) were validated with comparable scales on the Minnesota Multiphasic Personality Inventory (MMPI). The MMPI was selected for this validity study because it is the most researched, validated and widely used objective personality test in the United States. The DQ scales were validated with MMPI scales as follows. The Truthfulness Scale was validated with the L Scale. The Alcohol Scale was validated with the MacAndrew Scale. The Drugs Scale was validated with the MacAndrew and Psychopathic Deviant scales. The Stress Coping Abilities Scale was validated with the Taylor Manifest Anxiety, Psychasthenia, Social Maladjustment and Social Alienation scales. Method One hundred (100) chemical dependency inpatients were administered both the DQ scales and the MMPI. Tests were counterbalanced for order effects -- half were given the DQ scales first and half the MMPI first. (1985)
12
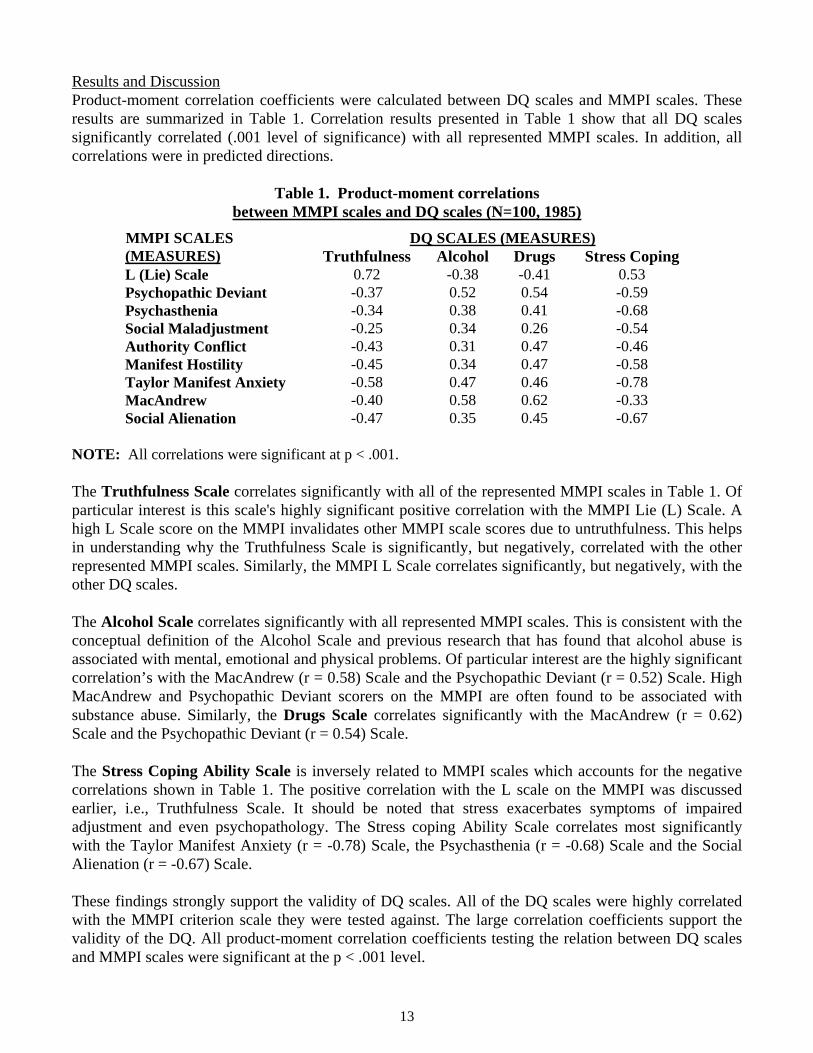
Results and Discussion Product-moment correlation coefficients were calculated between DQ scales and MMPI scales. These results are summarized in Table 1. Correlation results presented in Table 1 show that all DQ scales significantly correlated (.001 level of significance) with all represented MMPI scales. In addition, all correlations were in predicted directions.
Table 1. Product-moment correlations between MMPI scales and DQ scales (N=100, 1985)
MMPI SCALES DQ SCALES (MEASURES) (MEASURES) Truthfulness Alcohol Drugs Stress Coping L (Lie) Scale 0.72 -0.38 -0.41 0.53 Psychopathic Deviant -0.37 0.52 0.54 -0.59 Psychasthenia -0.34 0.38 0.41 -0.68 Social Maladjustment -0.25 0.34 0.26 -0.54 Authority Conflict -0.43 0.31 0.47 -0.46 Manifest Hostility -0.45 0.34 0.47 -0.58 Taylor Manifest Anxiety -0.58 0.47 0.46 -0.78 MacAndrew -0.40 0.58 0.62 -0.33 Social Alienation -0.47 0.35 0.45 -0.67
NOTE: All correlations were significant at p < .001. The Truthfulness Scale correlates significantly with all of the represented MMPI scales in Table 1. Of particular interest is this scale's highly significant positive correlation with the MMPI Lie (L) Scale. A high L Scale score on the MMPI invalidates other MMPI scale scores due to untruthfulness. This helps in understanding why the Truthfulness Scale is significantly, but negatively, correlated with the other represented MMPI scales. Similarly, the MMPI L Scale correlates significantly, but negatively, with the other DQ scales. The Alcohol Scale correlates significantly with all represented MMPI scales. This is consistent with the conceptual definition of the Alcohol Scale and previous research that has found that alcohol abuse is associated with mental, emotional and physical problems. Of particular interest are the highly significant correlation’s with the MacAndrew (r = 0.58) Scale and the Psychopathic Deviant (r = 0.52) Scale. High MacAndrew and Psychopathic Deviant scorers on the MMPI are often found to be associated with substance abuse. Similarly, the Drugs Scale correlates significantly with the MacAndrew (r = 0.62) Scale and the Psychopathic Deviant (r = 0.54) Scale. The Stress Coping Ability Scale is inversely related to MMPI scales which accounts for the negative correlations shown in Table 1. The positive correlation with the L scale on the MMPI was discussed earlier, i.e., Truthfulness Scale. It should be noted that stress exacerbates symptoms of impaired adjustment and even psychopathology. The Stress coping Ability Scale correlates most significantly with the Taylor Manifest Anxiety (r = -0.78) Scale, the Psychasthenia (r = -0.68) Scale and the Social Alienation (r = -0.67) Scale. These findings strongly support the validity of DQ scales. All of the DQ scales were highly correlated with the MMPI criterion scale they were tested against. The large correlation coefficients support the validity of the DQ. All product-moment correlation coefficients testing the relation between DQ scales and MMPI scales were significant at the p < .001 level.
13

12. Relationships Between Selected DQ Scales and Polygraph Examination A measure that has often been used in business or industry for employee selection is the Polygraph examination. The polygraph exam is most often used to determine the truthfulness or honesty of an individual while being tested. The Polygraph examination is more accurate as the area of inquiry is more "situation" specific. Conversely, the less specific the area of inquiry, the less reliable the Polygraph examination becomes. Three DQ scales were chosen for this study (1985); Truthfulness Scale, Alcohol Scale and Drugs Scale. The Truthfulness Scale was chosen because it is used in the DQ to measure the truthfulness or honesty of the respondent while completing the DQ. The Alcohol and Drugs scales are well suited for comparison with the polygraph exam because of the situation specific nature of the scales. Alcohol and Drugs scale items are direct and relate specifically to alcohol and drug use. The comparison with the Truthfulness Scale is less direct because of the subtle nature of the Truthfulness Scale items as used in the DQ. The Truthfulness Scale is affected by the respondent’s attitude, emotional stability and tendencies to fake good. It was expected that the Alcohol and Drugs scales would be highly correlated with the polygraph results and the Truthfulness Scale would show a somewhat less but nonetheless significant correlation. Method One hundred and eighty-nine (189) job applicants were administered both the DQ scales and the Polygraph examination (1985). Tests were given in a counterbalanced order, half of the applicants were given the DQ scales first and the other half of the applicants were administered the polygraph first. The subjects were administered the DQ scales and polygraph exam in the same room in the same session with the examiner present for both tests. Results The product-moment correlation results between the Polygraph exam and DQ scales indicated there was a significant positive correlation between the Truthfulness Scale and Polygraph exam (r = 0.23, p<.001). Similarly, significant positive relationships were observed between the Polygraph exam and the Alcohol Scale (r = 0.54, p<.001) and the Drugs Scale (r = 0.56, p<.001). In summary, this study supports the validity of the DQ Truthfulness, Alcohol and Drugs scales. There were strong positive relationships between the selected DQ scales and the Polygraph examination. The highly significant product-moment correlations between DQ scales and Polygraph examinations demonstrate the validity of the DQ Truthfulness, Alcohol and Drugs abuse measures. These results are important because the Polygraph exam is a direct measure obtained from the individual being tested rather than a rating by someone else. This is similar to self-report such as utilized in the DQ. The fact that there was a very strong relationship between Polygraph results and DQ scales shows that this type of information can be obtained accurately in self-report instruments. These results indicate that the DQ Truthfulness Scale is an accurate measure of the respondent’s truthfulness or honesty while completing the DQ. The Truthfulness Scale is an essential measure in self-report instruments. There must be a means to determine the honesty or “correctness” of the respondents answers and there must be a means to adjust scores when the respondent is less than honest. The DQ Truthfulness Scale addresses both of these issues. The Truthfulness Scale measures truthfulness and then applies a correction to other scales based on the Truthfulness Scale score. The Truthfulness Scale
14
ensures accurate assessment. The results of this study shows that the DQ is a valid assessment instrument. 13. Validation of DQ Scales in a Sample of Substance Abuse Inpatients The DQ is an adult chemical dependency and substance (alcohol and other drugs) abuse assessment instrument. It is designed for use in court-related settings, diversion programs and probation departments. The DQ is a specific test designed for specific defendant populations. The present study (1987) was conducted to validate the DQ scales in a sample of substance abuse inpatients in a chemical dependency facility. Selected scales in the Minnesota Multiphasic Personality Inventory (MMPI) were used as criterion measures for the different DQ scales. The Truthfulness Scale was validated with MMPI L Scale, F Scale and K Scale. The Alcohol Scale was validated with MMPI MacAndrew Scale (MAC) and Psychopathic Deviate-Obvious (PD-O). The Drugs Scale was validated with MMPI MacAndrew Scale and Psychopathic Deviate-Obvious. The Stress Coping Abilities Scale was validated with MMPI Psychasthenia (PT), Anxiety (A), Taylor Manifest Anxiety (MAS) and Tension/Worry (TSC-VII). The MMPI scales were chosen to compare to the DQ scales because they measure similar attributes. Method The subjects used in the study (1987) were 212 substance (alcohol and other drugs) abuse inpatients in chemical dependency facilities. The DQ and MMPI scales were administered in counterbalanced order. Results and Discussion The product-moment correlation results are summarized in Table 2. Since this study is important in understanding DQ validity, each DQ scale is briefly summarized below. (N=212): The Truthfulness Scale correlates significantly in predicted directions with selected MMPI criterion scales, L Scale (lie, p<.001), F Scale (validity, p<.001) and K Scale (validity correction, p<.001). Other significant correlations with traditional MMPI scales include: PD (Psychopathic deviate, p<.001), ES (Ego Strength, p<.001), and RE (Social responsibility, p<.001); Harris MMPI subscales: PD2 (Authority Problems, p<.001), PD4 (Social Alienation, p<.001), SCIA (Social Alienation, p<.001); Wiggins MMPI content scales: SOC (Social Maladjustment, p<.001), HOS (Manifest Hostility, p<.001); Wiener-Harmon MMPI subscales: PDO (Psychopathic Deviant-Obvious, p<.001); Tryon, Stein & Chu MMPI cluster scales: TSC-V (Resentment/Aggressive, p<.001). The Alcohol Scale correlates significantly in predicted directions with selected MMPI criterion scales: MAC (MacAndrew scale, p<.001), and PD-O (Psychopathic Deviate Obvious, p<.021). The Drugs Scale correlates significantly in predicted directions with selected MMPI criterion scales: MAC (MacAndrew scale, p<.001), and PD-O (Psychopathic Deviate Obvious, p<.001). The Stress Coping Abilities Scale correlates significantly in predicted directions with selected MMPI criterion scales: PT (Psychasthenia, p<.001), A (Anxiety, p<.001), MAS (Taylor Manifest Anxiety, p<.001), PD4 (Social Alienation, p<.001) and TSC-VII (Tension/Worry, p<.001).
15

Table 2. DQ-MMPI Product-moment Correlations Inpatients, Chemical Dependency Facilities (N = 212, 1987)
MMPI SCALES DQ SCALES (MEASURES) (MEASURES) Truthfulness Alcohol Drugs Stress Coping L 0.60 -0.24 -0.15 -0.30 F -0.34 0.32 0.32 0.49 K 0.39 -0.28 -0.29 -0.51 MAC -0.30 0.35 0.37 0.28 PD-O -0.35 0.22 0.33 0.53 PD2 -0.26 0.18 0.17 0.07 PD -0.33 0.21 0.33 0.39 HOS -0.45 0.25 0.33 0.46 TSC-V -0.46 0.34 0.28 0.58 ES 0.25 -0.27 -0.25 -0.51 RE 0.41 -0.27 -0.34 -0.45 SOC -0.19 0.17 0.08 0.39 PD4 -0.41 0.20 0.28 0.55 SCIA -0.36 0.27 0.32 0.39 PT -0.39 0.27 0.24 0.58 A -0.41 0.31 0.31 0.68 MAS -0.44 0.25 0.18 0.65 TSC-VII -0.41 0.33 0.29 0.66
These findings strongly support the validity of DQ scales in this sample of chemical dependency inpatients. All DQ scales were highly correlated with the MMPI criterion scales they were tested against. The large correlation coefficients support the DQ as a valid instrument. Inpatients in chemical dependency facilities are known to have substance abuse problems and these correlation results confirm the validity of the instruments. These findings support the validity of the DQ. The DQ Alcohol and Drugs scales are direct measures of alcohol and drug use or abuse, respectively, whereas the MacAndrew Scale was developed from discriminant analysis and does not include a truthfulness scale. The MacAndrew Scale items do not relate specifically to alcohol and drugs. Hence, the correlations between the MacAndrew Scale and the Alcohol and Drugs scales could be affected by the lack of a truthfulness measure which is a deficiency of the MacAndrew Scale. However, the correlation coefficients were still significant. Where MMPI scales are closely related (by definition) to DQ scales the correlation coefficients were highly significant. For example, the DQ Truthfulness Scale and the MMPI L Scale both measure tendencies to fake good, and the correlation was very highly significant at r = .60. The correlation between Resistance Scale and MMPI Social Responsibility Scale was r = -.88, and the correlation between the Stress Coping Abilities Scale and MMPI Tension/Worry Scale was r = -.66. This study supports the validity of the Defendant Questionnaire (DQ).
16
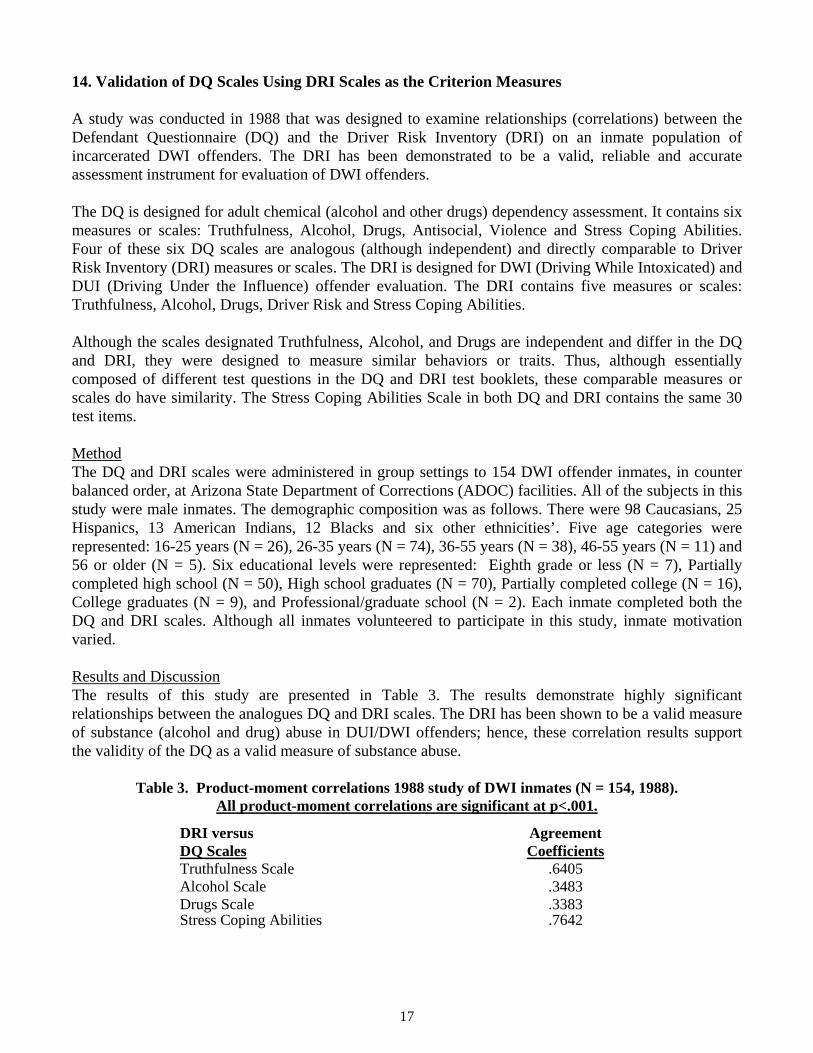
14. Validation of DQ Scales Using DRI Scales as the Criterion Measures A study was conducted in 1988 that was designed to examine relationships (correlations) between the Defendant Questionnaire (DQ) and the Driver Risk Inventory (DRI) on an inmate population of incarcerated DWI offenders. The DRI has been demonstrated to be a valid, reliable and accurate assessment instrument for evaluation of DWI offenders. The DQ is designed for adult chemical (alcohol and other drugs) dependency assessment. It contains six measures or scales: Truthfulness, Alcohol, Drugs, Antisocial, Violence and Stress Coping Abilities. Four of these six DQ scales are analogous (although independent) and directly comparable to Driver Risk Inventory (DRI) measures or scales. The DRI is designed for DWI (Driving While Intoxicated) and DUI (Driving Under the Influence) offender evaluation. The DRI contains five measures or scales: Truthfulness, Alcohol, Drugs, Driver Risk and Stress Coping Abilities. Although the scales designated Truthfulness, Alcohol, and Drugs are independent and differ in the DQ and DRI, they were designed to measure similar behaviors or traits. Thus, although essentially composed of different test questions in the DQ and DRI test booklets, these comparable measures or scales do have similarity. The Stress Coping Abilities Scale in both DQ and DRI contains the same 30 test items. Method The DQ and DRI scales were administered in group settings to 154 DWI offender inmates, in counter balanced order, at Arizona State Department of Corrections (ADOC) facilities. All of the subjects in this study were male inmates. The demographic composition was as follows. There were 98 Caucasians, 25 Hispanics, 13 American Indians, 12 Blacks and six other ethnicities’. Five age categories were represented: 16-25 years (N = 26), 26-35 years (N = 74), 36-55 years (N = 38), 46-55 years (N = 11) and 56 or older (N = 5). Six educational levels were represented: Eighth grade or less (N = 7), Partially completed high school (N = 50), High school graduates (N = 70), Partially completed college (N = 16), College graduates (N = 9), and Professional/graduate school (N = 2). Each inmate completed both the DQ and DRI scales. Although all inmates volunteered to participate in this study, inmate motivation varied. Results and Discussion The results of this study are presented in Table 3. The results demonstrate highly significant relationships between the analogues DQ and DRI scales. The DRI has been shown to be a valid measure of substance (alcohol and drug) abuse in DUI/DWI offenders; hence, these correlation results support the validity of the DQ as a valid measure of substance abuse.
Table 3. Product-moment correlations 1988 study of DWI inmates (N = 154, 1988). All product-moment correlations are significant at p<.001.
DRI versus Agreement DQ Scales Coefficients Truthfulness Scale .6405 Alcohol Scale .3483 Drugs Scale .3383 Stress Coping Abilities .7642
17
It was noted that inmate motivation varied widely. This is evident in the Stress Coping Abilities correlation coefficient of .7642. Even though this is a highly significant correlation (p<.001), the Agreement Coefficient could be expected to be even higher because these were identical scales consisting of the same items. It is reasonable to conclude that low motivation on the part of many inmate volunteers contributed to lower Agreement Coefficients. Inmate volunteers were serving DWI-related sentences and these tests had no bearing on their incarcerated status or sentences. However, in spite of widely varied inmate motivation, Agreement Coefficients for all five sets of scale comparisons were highly significant. These results are important for another reason. This study extends the DQ normative (standardization sample) population to include inmates and incarcerated individuals who are serving their sentences in maximum security facilities. The validity of the DQ has been demonstrated on a sample of incarcerated substance (alcohol and other drugs) abuse offenders. 15. Validation of DQ Scales in a Sample of Vocational Rehabilitation Clients The Defendant Questionnaire (DQ) was investigated in a sample of individuals who are not generally associated with substance abuse but who have other handicaps. The participants in the present study (1991) were Vocational Rehabilitation clients. These are individuals who have some form of handicap and require assistance in obtaining and/or maintaining employment. Selected scales in the Minnesota Multiphasic Personality Inventory (MMPI) were used as criterion measures for the different Defendant Questionnaire (DQ) scales. Comparisons to previous validating studies which used substance (alcohol and other drugs) abuse subjects will be made to determine the applicability of the DQ to various adult samples. Method The subjects used in the present study consisted of 74 Vocational Rehabilitation clients. The DQ and MMPI scales were administered in counterbalanced order. Product-moment correlations were calculated between DQ scales and selected criterion MMPI scales. The Truthfulness Scale was validated with the MMPI L Scale, F Scale and K Scale. The Alcohol Scale was validated with the MMPI MacAndrew Scale (MAC) and Psychopathic Deviate (PD). The Drugs Scale was validated with the MMPI MacAndrew Scale, Psychopathic Deviate. The Stress Coping Abilities Scale was validated with the MMPI Psychasthenia (PT), Taylor Manifest Anxiety (MAS) and Tension (TSC-VII). Result and Discussion There were 74 Vocational Rehabilitation clients used in the study. There were 49 males and 25 females. Age was distributed (frequency given in parentheses) as follows: 18 to 21 years (11), 22 to 25 years (7), 26-29 years (11), 30-33 years (14), 34-37 years (10), 42-45 years (9), 46-49 years (8), 50 or more years (4). Six education categories were represented: 8th grade or less (11), Partially completed High School (18), GED (14), High School Graduate (21), Some College (6), College Graduate (4). There were 47 Caucasians, 12 Blacks, 8 Hispanics, 6 American Indians and 1 other ethnicity. The correlation results are summarized in Table 4. For clarity, DQ scales are summarized individually and their MMPI scale correlations discussed. The Truthfulness Scale was significantly correlated with the MMPI scales that are associated with truthfulness measures. The DQ Truthfulness Scale was significantly correlated with the MMPI L Scale (p<.001), F scale (p<.01) and K scale (p<.01). When a person attains elevated L, F or K scales on the MMPI, other MMPI scale scores are invalidated. Similarly, an elevated Truthfulness Scale score on the DQ invalidates other DQ scale scores.
18
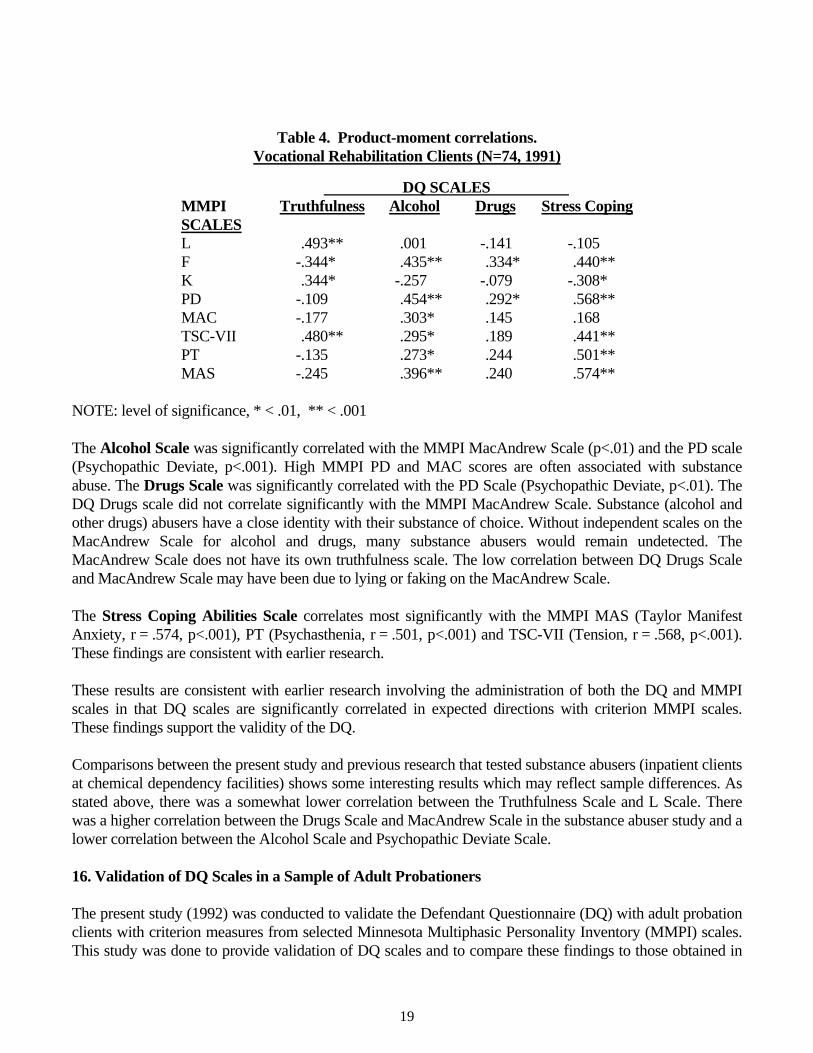
Table 4. Product-moment correlations. Vocational Rehabilitation Clients (N=74, 1991)
DQ SCALES MMPI SCALES
Truthfulness Alcohol Drugs Stress Coping
L .493** .001 -.141 -.105 F -.344* .435** .334* .440** K .344* -.257 -.079 -.308* PD -.109 .454** .292* .568** MAC -.177 .303* .145 .168 TSC-VII .480** .295* .189 .441** PT -.135 .273* .244 .501** MAS -.245 .396** .240 .574**
NOTE: level of significance, * < .01, ** < .001 The Alcohol Scale was significantly correlated with the MMPI MacAndrew Scale (p<.01) and the PD scale (Psychopathic Deviate, p<.001). High MMPI PD and MAC scores are often associated with substance abuse. The Drugs Scale was significantly correlated with the PD Scale (Psychopathic Deviate, p<.01). The DQ Drugs scale did not correlate significantly with the MMPI MacAndrew Scale. Substance (alcohol and other drugs) abusers have a close identity with their substance of choice. Without independent scales on the MacAndrew Scale for alcohol and drugs, many substance abusers would remain undetected. The MacAndrew Scale does not have its own truthfulness scale. The low correlation between DQ Drugs Scale and MacAndrew Scale may have been due to lying or faking on the MacAndrew Scale. The Stress Coping Abilities Scale correlates most significantly with the MMPI MAS (Taylor Manifest Anxiety, r = .574, p<.001), PT (Psychasthenia, r = .501, p<.001) and TSC-VII (Tension, r = .568, p<.001). These findings are consistent with earlier research. These results are consistent with earlier research involving the administration of both the DQ and MMPI scales in that DQ scales are significantly correlated in expected directions with criterion MMPI scales. These findings support the validity of the DQ. Comparisons between the present study and previous research that tested substance abusers (inpatient clients at chemical dependency facilities) shows some interesting results which may reflect sample differences. As stated above, there was a somewhat lower correlation between the Truthfulness Scale and L Scale. There was a higher correlation between the Drugs Scale and MacAndrew Scale in the substance abuser study and a lower correlation between the Alcohol Scale and Psychopathic Deviate Scale. 16. Validation of DQ Scales in a Sample of Adult Probationers The present study (1992) was conducted to validate the Defendant Questionnaire (DQ) with adult probation clients with criterion measures from selected Minnesota Multiphasic Personality Inventory (MMPI) scales. This study was done to provide validation of DQ scales and to compare these findings to those obtained in
19
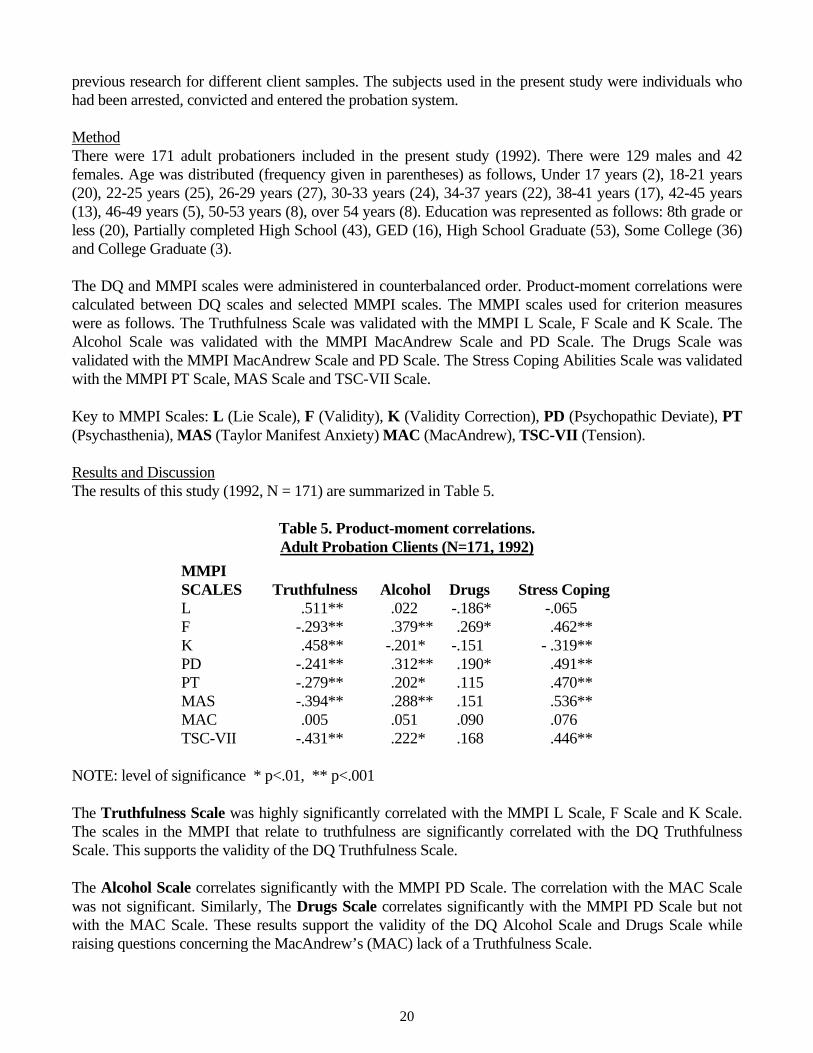
previous research for different client samples. The subjects used in the present study were individuals who had been arrested, convicted and entered the probation system. Method There were 171 adult probationers included in the present study (1992). There were 129 males and 42 females. Age was distributed (frequency given in parentheses) as follows, Under 17 years (2), 18-21 years (20), 22-25 years (25), 26-29 years (27), 30-33 years (24), 34-37 years (22), 38-41 years (17), 42-45 years (13), 46-49 years (5), 50-53 years (8), over 54 years (8). Education was represented as follows: 8th grade or less (20), Partially completed High School (43), GED (16), High School Graduate (53), Some College (36) and College Graduate (3). The DQ and MMPI scales were administered in counterbalanced order. Product-moment correlations were calculated between DQ scales and selected MMPI scales. The MMPI scales used for criterion measures were as follows. The Truthfulness Scale was validated with the MMPI L Scale, F Scale and K Scale. The Alcohol Scale was validated with the MMPI MacAndrew Scale and PD Scale. The Drugs Scale was validated with the MMPI MacAndrew Scale and PD Scale. The Stress Coping Abilities Scale was validated with the MMPI PT Scale, MAS Scale and TSC-VII Scale. Key to MMPI Scales: L (Lie Scale), F (Validity), K (Validity Correction), PD (Psychopathic Deviate), PT (Psychasthenia), MAS (Taylor Manifest Anxiety) MAC (MacAndrew), TSC-VII (Tension). Results and Discussion The results of this study (1992, N = 171) are summarized in Table 5.
Table 5. Product-moment correlations. Adult Probation Clients (N=171, 1992)
MMPI SCALES Truthfulness Alcohol Drugs Stress Coping L .511** .022 -.186* -.065 F -.293** .379** .269* .462** K .458** -.201* -.151 - .319** PD -.241** .312** .190* .491** PT -.279** .202* .115 .470** MAS -.394** .288** .151 .536** MAC .005 .051 .090 .076 TSC-VII -.431** .222* .168 .446**
NOTE: level of significance * p<.01, ** p<.001 The Truthfulness Scale was highly significantly correlated with the MMPI L Scale, F Scale and K Scale. The scales in the MMPI that relate to truthfulness are significantly correlated with the DQ Truthfulness Scale. This supports the validity of the DQ Truthfulness Scale. The Alcohol Scale correlates significantly with the MMPI PD Scale. The correlation with the MAC Scale was not significant. Similarly, The Drugs Scale correlates significantly with the MMPI PD Scale but not with the MAC Scale. These results support the validity of the DQ Alcohol Scale and Drugs Scale while raising questions concerning the MacAndrew’s (MAC) lack of a Truthfulness Scale.
20
The Stress Coping Abilities Scale correlates highly significantly with the MMPI PT Scale, MAS Scale and TSC-VII Scale. These results support the validity of the DQ Stress Coping Abilities Scale. This study supports the validity of DQ scales in a sample of adult probationers. DQ scales correlate significantly, in predicted directions with criterion MMPI scales. The MMPI was selected for this criterion-related validity study because it is the most widely used and respected personality test in the United States. A short coming of the MMPI MAC Scale (MacAndrew) is that it is a discriminant scale that discriminates between known substance abusers and non-abusers. However, none of the MacAndrew items relate to alcohol or drugs per se. And the MacAndrew Scale lacks a Truthfulness Scale. The DQ Alcohol and Drugs scales correlate with the PD Scale which has been shown to be a valid measure of substance abusers and substance abusing adult probationers. With the exception of the MacAndrew Scale, these correlation results are in close agreement with previous studies that validated DQ scales with criterion measures selected from the MMPI. The results of this study support the validity of the DQ. 17. Validation of the DQ Violence Scale with a Polygraph Examination The Violence Scale measures physical force to injure, damage or destroy. The Violence Scale identifies people that are dangerous to themselves and others. This study (1994) was conducted to evaluate the validity of the Violence Scale in the DQ. Method and Results One hundred and seven (107) halfway house male resident volunteers participated in the study (1994). The Violence Scale and a Polygraph “violence” examination were alternately administered. The Product-moment correlation coefficient of r = .25 was significant at p<.01. This means the DQ Violence Scale and polygraph examination on violence were in agreement most of the time. This significant correlation was in the predicted direction. This study supports the validity of the Violence Scale. 18. Validation of the Antisocial and Violence Scales The present study (1994) utilized selected MMPI scales as criterion measures to validate the Antisocial Scale and Violence Scale. Ninety-seven (97) male chemical dependency outpatients were alternately administered the MMPI and the Antisocial and Violence scales. The results demonstrated that the Antisocial Scale correlated significantly, in the expected direction, with the following MMPI scales: Psychopathic Deviant (PD, r = 0.48), Social Alienation (SCIA, r = 0.46) and Social Maladjustment (SOC, r = 0.51). The Violence Scale correlated significantly in the predicted direction with the following MMPI scales: Hypomania (MA, r = 0.49) and Manifest Hostility (HOS, r = 0.44). All correlations were significant at p<.01. These results support the validity of the Antisocial and Violence Scales. 19. Validation of the Substance Abuse/Dependency Scale and Other DQ Scales The Substance Abuse/Dependency Scale incorporates the seven DSM-IV criteria for substance dependency classification and the four DSM-IV criteria for substance abuse classification. Also, equivalent items were added to the Alcohol and Drugs scales. When a person admits to three or more of the seven DSM-IV criteria for substance dependence they are classified as dependent. Similarly, when a person admits to one or more of the four DSM-IV criteria for substance abuse they are classified as
21

abuse. A study (1997) conducted by Dr. Fred Marsteller of Emory University and Dr. Donald Davignon of Behavior Data Systems entitled “A Validation Study of the DRI-II in a Large Sample of DUI Offenders” investigated the validity of this Substance Abuse/Dependency Scale along with the predictive accuracy of the Alcohol and Drugs scales in identifying offenders classified as dependent or abuse. The DQ Truthfulness Scale, Alcohol Scale and Drugs Scale, as well as the Substance Dependency/Abuse Scale, were validated using criterion measures selected for this study. The following tests were done: the Truthfulness Scale was validated with the MMPI-2 L Scale. The Alcohol Scale was validated with the MMPI-2 MacAndrew Scale. The Drugs Scale was validated with the Drug Abuse Screening Test (DAST). The Substance Abuse/Dependency Scale was validated with a DSM-IV substance use dependency scale devised for this study. Method For concurrent validity comparisons the following tests were incorporated into a 159 item “criterion test.” MMPI-2 L Scale, MacAndrew, Drug Abuse Screening Test (DAST), MMPI F Scale, and the DSM-IV substance dependency items. All criterion test items were written in a True/False format. The MMPI-2 F Scale was included in the criterion test because it indicates a haphazard approach to testing or a wish to put self in a bad light. The DQ scales and the criterion test were administered in counterbalanced order to all participants as part of their normal DUI screening procedure. There were 1,014 DUI offenders included in the present study (1997). There were 811 males (80%) and 203 females (20%). The offenders are broadly defined as Caucasian (83.3%), between the ages of 21 and 40 (65.7%), High School graduate or better (75.2%) and single (49.4%). Results and Discussion Product-moment correlation coefficients are presented in Table 6. Intraclass correlations were also computed but the correlations were identical to the product-moment correlations to the second decimal place when the product-moment correlations were positive and the intraclass correlation is undefined when the product-moment correlations were negative.
Table 6. Product-moment correlations. DUI Offenders (N = 1,014, 1997) All product-moment correlations shown are significant at p<.001.
DQ Scales MMPI-2 L MacAndrew DAST DSM-IV
Truthfulness .668 -.371 -.289 -.324 Alcohol -.154 .291 .508 .625 Drugs n.s. .152 .618 .276 Abuse/Dependency -.251 .352 .371 .964
The correlation between the Truthfulness Scale and the MMPI-2 L Scale is highly significant (r = .668, p<.001) and in the expected positive direction. It is rare to find correlation coefficients in validation testing above .60. Usually they are much lower. These results support the validity of the DQ Truthfulness Scale. The Alcohol Scale correlates significantly with the MacAndrew Scale (r = .291, p<.001), in the predicted direction. The MacAndrew Alcoholism Scale (MacAndrew, 1965) was derived from the MMPI as a measure of alcoholism. The MacAndrew Scale used in this study is the revised version applicable to the current version of the MMPI, the MMPI-2. MacAndrew Scale items were selected
22
because, as a group, they successfully discriminated alcoholics from non-alcoholics in validation samples. The MacAndrew Scale items have little face validity with respect to alcohol use, with only one item referring directly to alcohol. The opinion of researchers using the MacAndrew Scale is that it reflects both a) behaviors and symptoms which are common among alcoholics. The Alcohol Scale measures alcohol use and identifies alcohol-related problems. The Alcohol Scale items specifically refer to alcohol use and alcohol-related symptoms. The correlation between the Alcohol Scale and the MacAndrew Scale was significant and in the positive direction. The relatively small correlation coefficient with the MacAndrew Scale may reflect several differences between the scales. The MacAndrew Scale was developed to detect alcoholism per se. Its items are generally not directly related to alcohol use and alcohol-related problems, but refer instead to secondary symptoms and characteristics which have successfully discriminated alcoholics from non-alcoholics in clinical validation samples. The MacAndrew Scale was also devised to identify alcoholism among White males (Greene, 1991) and females and ethnic minorities have been shown to respond differently from White males. The Alcohol Scale is very direct in asking about alcohol use and alcohol-use related symptoms. It is also designed to assess alcohol-related problems across a broad range of severity, not just differentiate alcoholics from non-alcoholics. Furthermore, the Alcohol Scale incorporates truth-correction, whereas the MacAndrew Scale does not. The Drugs Scale correlates significantly with the DAST (r = .618, p<.001) in the predicted direction. The DAST is a drug use questionnaire that directly refers to drug use and abuse. It was designed to screen clinical populations for significant drug abuse problems. The Drugs Scale measures drug (marijuana, crack, cocaine, barbiturates, amphetamines, heroin) use and abuse problems. The Drugs Scale provides assessment across the full spectrum, while the DAST focuses on major problems or extreme cases. These results support the validity of the Drugs Scale. The Drugs Scale accurately measures illicit drug use and abuse. Again, the truth-corrected scores of the Drugs Scale may reduce the correlation with the DAST which is not truth-corrected. There was a high positive correlation between the Substance Abuse/Dependency Scale and the DSM-IV Criterion items (r = .964, p<.001). This high correlation reflects their very strong overlap. This result supports the validity of the Substance Abuse/Dependency Scale. This finding suggests that clients answer DSM-IV substance dependency criteria items in the same way they answer Substance Abuse/Dependency Scale items (and their equivalents). These results support the validity of the DQ scales used in this study. There were very strong positive correlations between the DQ scales and the criterion scales used to test the different DQ scales. To assess the ability of the different scales used in this study to distinguish among subjects rated as “no classification”, “substance abuse” or “substance dependent” based on the criterion DSM-IV scale, ANOVAs comparing the mean scores for each scale among the classification groups were computed. The question addressed here is whether the different scales used in this study can discriminate among the classification groups. Mean scale scores for each classification group is presented in Table 7. The ANOVA comparison among the “no classification”, “abuse” and “dependence” groups found that for each scale, the classification groups were very significantly different (all p’s<.001). It is noteworthy that for the Alcohol Scale, the differences among the “classification” groups are larger than those for the
23

MacAndrew Scale. This finding supports the conclusion that the Alcohol Scale accurately discriminates between “classification” categories and does so better than the MacAndrew Scale.
Table 7. Mean scale scores for each classification group. Drug court clients (N=100, 1997). ANOVA comparisons between groups are significantly different at p<.001.
no classification abuse dependent Truthfulness Scale 12.7 9.1 8.1 MMPI-2 L Scale 7.3 5.7 5.0 Alcohol Scale 9.4 12.5 28.7 MacAndrew Scale 20.2 21.7 24.0 Drugs Scale 4.1 3.8 8.5 DAST 3.4 4.1 7.2 Each of the DQ scales (Truthfulness, Alcohol, Drugs and Substance Dependency/Abuse) correlate highly significantly with their respective criterion tests. These large correlation coefficients support the validity of DQ scales. ANOVA results support the discriminant validity of the DQ scales. Greene, R.L. (1991). The MMPI-2/MMPI: An Interpretive Manual. Boston: Allyn and Bacon. 20. Reliability Study of DQ Scales in Two Samples of Probationers This study (1997) was conducted to test the reliability of the DQ scales in two samples of probationers. Within-test reliability measures to what extent a test with multiple scales measuring different factors, measures each factor independent of the other factors (scales) in the test. It also measures to what extent items in each scale consistently measure the particular trait (or factor) that scale was designed to measure. Within-test reliability measures are referred to as inter-item reliability. The most common method of reporting within-test (scale) inter-item reliability is with coefficient alpha. Any approach to detection, assessment, or measurement must meet the criteria of reliability and validity. Reliability refers to an instrument’s consistency of results regardless of who uses it. This means that the outcome must be objective, verifiable, and reproducible. Ideally, the instrument or test must also be practical, economical, and accessible. Psychometric principles and computer technology insures accuracy, objectivity, practicality, cost-effectiveness and accessibility. Method and Results There were two samples of adult probationers included in this study (1997). The subjects in Group 1 consisted of 850 adult probationers. There were 663 males (78%) and 187 females (22%). Demographic composition of these probationers is as follows: Age: 19 & under (21%); 20-29 (43%); 30-39 (23%); 40-49 (9%); 50-59 (2%) and 60 & over (1%). Ethnicity: Caucasian (74%); Black (11%); Hispanic (10%); Asian (1%); Native American (3%) and Other (1%). Education: Eighth grade or less (7%); Some H.S. (30%); H.S. graduate (47%); Some college (11%) and College graduate (4%). Marital Status: Single (61%); Married (19%); Divorced (13%); Separated (5%) and Widowed (1%). Group 2 consisted of 2,331 adult probationers. There were 1,847 males (79%) and 484 females (21%). Demographic composition of these probationers is as follows: Age: 19 & under (15%); 20-29 (40%); 30-39 (28%); 40-49 (13%); 50-59 (3%) and 60 & over (1%). Ethnicity: Caucasian (58%); Black (25%); Hispanic (15%); Asian (1%); Native American (1%) and Other (1%). Education: Eighth grade or less (9%); Some
24
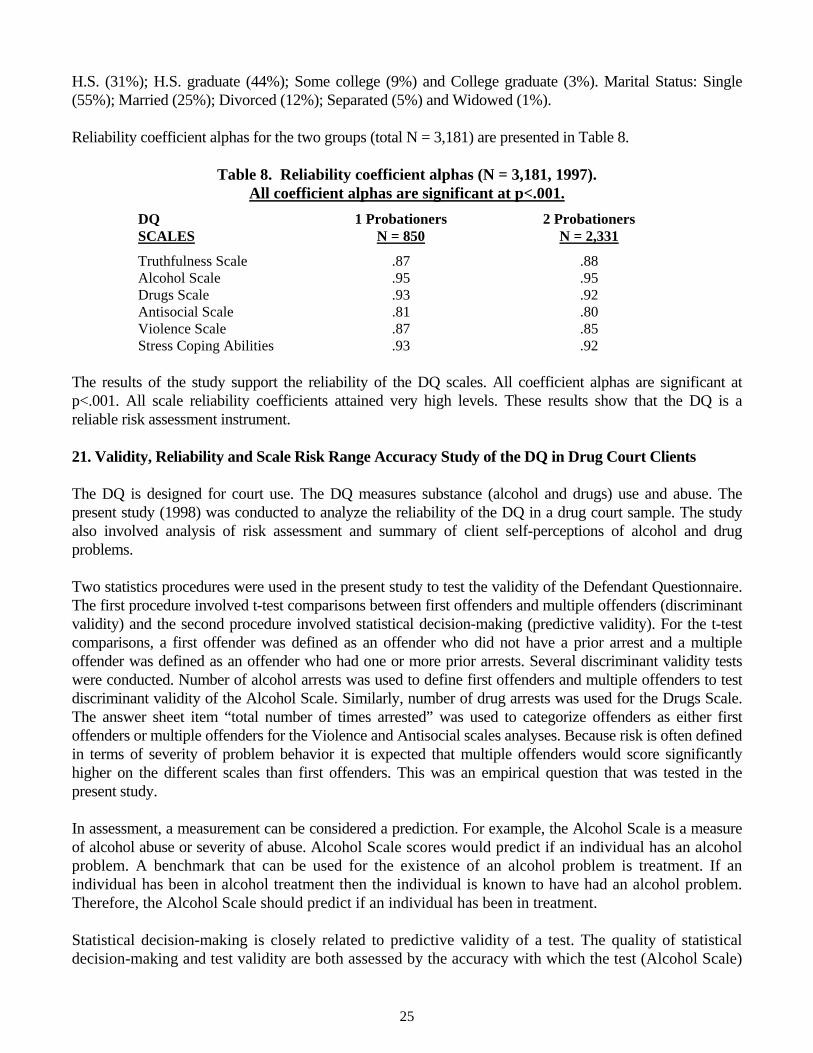
H.S. (31%); H.S. graduate (44%); Some college (9%) and College graduate (3%). Marital Status: Single (55%); Married (25%); Divorced (12%); Separated (5%) and Widowed (1%). Reliability coefficient alphas for the two groups (total N = 3,181) are presented in Table 8.
Table 8. Reliability coefficient alphas (N = 3,181, 1997). All coefficient alphas are significant at p<.001.
DQ SCALES
1 Probationers N = 850
2 Probationers N = 2,331
Truthfulness Scale .87 .88 Alcohol Scale .95 .95 Drugs Scale .93 .92 Antisocial Scale .81 .80 Violence Scale .87 .85 Stress Coping Abilities .93 .92
The results of the study support the reliability of the DQ scales. All coefficient alphas are significant at p<.001. All scale reliability coefficients attained very high levels. These results show that the DQ is a reliable risk assessment instrument. 21. Validity, Reliability and Scale Risk Range Accuracy Study of the DQ in Drug Court Clients The DQ is designed for court use. The DQ measures substance (alcohol and drugs) use and abuse. The present study (1998) was conducted to analyze the reliability of the DQ in a drug court sample. The study also involved analysis of risk assessment and summary of client self-perceptions of alcohol and drug problems. Two statistics procedures were used in the present study to test the validity of the Defendant Questionnaire. The first procedure involved t-test comparisons between first offenders and multiple offenders (discriminant validity) and the second procedure involved statistical decision-making (predictive validity). For the t-test comparisons, a first offender was defined as an offender who did not have a prior arrest and a multiple offender was defined as an offender who had one or more prior arrests. Several discriminant validity tests were conducted. Number of alcohol arrests was used to define first offenders and multiple offenders to test discriminant validity of the Alcohol Scale. Similarly, number of drug arrests was used for the Drugs Scale. The answer sheet item “total number of times arrested” was used to categorize offenders as either first offenders or multiple offenders for the Violence and Antisocial scales analyses. Because risk is often defined in terms of severity of problem behavior it is expected that multiple offenders would score significantly higher on the different scales than first offenders. This was an empirical question that was tested in the present study. In assessment, a measurement can be considered a prediction. For example, the Alcohol Scale is a measure of alcohol abuse or severity of abuse. Alcohol Scale scores would predict if an individual has an alcohol problem. A benchmark that can be used for the existence of an alcohol problem is treatment. If an individual has been in alcohol treatment then the individual is known to have had an alcohol problem. Therefore, the Alcohol Scale should predict if an individual has been in treatment. Statistical decision-making is closely related to predictive validity of a test. The quality of statistical decision-making and test validity are both assessed by the accuracy with which the test (Alcohol Scale)
25
classifies “known” cases (treatment). In the present study predictive validity was evaluated in the Defendant Questionnaire (DQ) by using contingency tables defined by scale scores and either treatment or number of arrests. Treatment was used with the Alcohol Scale and Drugs Scale, and violent crime or assault arrests were used with the Violence Scale. Risk range percentile scores are calculated for each DQ scale. These risk range percentile scores are derived from scoring equations based on responses to scale items, Truth-Corrections and prior criminal history information. These scores are then converted to percentile scores. There are four risk range categories: Low Risk (zero to 39th percentile), Medium Risk (40 to 69th percentile), Problem Risk (70 to 89th percentile) and Severe Problem or Maximum Risk (90 to 100th percentile). Risk range percentile scores represent degree of severity. Analysis of the accuracy of DQ risk range percentile scores involves comparing the risk range percentile scores obtained from client DQ test results to the predicted risk range percentages as defined above. The percentages of clients expected to fall into each risk range is the following: Low Risk (39%), Medium Risk (30%), Problem Risk (20%) and Severe Problem or Maximum Risk (11%). The actual percentage of probationers falling in each of the four risk ranges, based on their risk range percentile scores, was compared to these predicted percentages. Method and Results The DQ was administered to 100 court clients (1998) as part of routine evaluation in a municipal substance abuse screening program. There 86 (86%) males and 14 (14%) females. Demographic composition of the subjects was as follows: Age in years: 19 & under (15%); 20-29 (38%); 30-39 (28%); 40-49 (12%); 50-59 (5%); 60 & over (1%). Ethnicity: Caucasian (10.5%); Black (4.2%); Hispanic (78.9%); Native American (5.3%); Other (1.1%). Education: 8th grade or less (9%); Some High School (25%); H.S. graduate (52%); Some college (2%); College graduate (7%). Marital Status: Single (76.1%); Married (18.2%); Divorced (3.4%); Separated (2.3%). Reliability coefficient alphas are presented in Table 9.
Table 9. Reliability coefficient alphas (N = 100, 1998). All coefficient alphas are significant at p<.001.
DQ SCALE
Drug court clients N = 100
Truthfulness Scale .89 Alcohol Scale .93 Drugs Scale .89 Antisocial Scale .81 Violence Scale .85 Stress Coping Abilities .93
These results support the reliability of the DQ. All reliability coefficient alphas were significant at p<.001. The drug court clients used in the present study reveal similar reliability statistics that have been found in probationers used in other studies. The DQ is a statistically reliable screening instrument for assessment of court and substance (alcohol and drugs) abuse defendants. Risk analysis is presented in Table 10.
26

Table 10. Risk Range Percentile Scores for Drug Court Clients (N = 100, 1998).
0%5%
10%15%20%25%30%35%40%45%
Truthfulness Alcohol Drug Antisocial Violence Stress Coping
Low Medium Problem Severe Problem
Risk Range Truthfulness Alcohol Drugs Antisocial Violence Stress Coping Predicted
Low 36.0 39.0 38.0 40.0 39.0 39.0 39% Medium 30.0 29.0 31.0 30.0 29.0 30.0 30% Problem 24.0 21.0 20.0 19.0 21.0 20.0 20% Maximum 10.0 11.0 11.0 11.0 11.0 11.0 11%
These results show that obtained risk range percentile scores closely approximated the predicted risk range percentile scores for each of the six DQ scales presented in Table 10 for drug court client sample included in the study. These results indicate that the DQ is a very accurate risk assessment instrument for drug court use. The results of the comparisons between obtained risk percentages and predicted percentages shows that all obtained scale risk range percentile scores were within 4.0 percent of predicted. The largest difference between obtained and predicted risk range percentages occurred on the Truthfulness Scale. All other scales were within one percentage point of predicted. This is very accurate defendant risk assessment. The t-test comparisons between first offenders and multiple offenders for each scale is presented in Tables 11 through 13. There were 100 court defendants used in this analysis.
Table 11. T-test comparisons between first offenders and multiple offenders. Offender status defined by total number of arrests. (N = 100, 1998)
DQ Scale
First Offenders Mean (N=20)
Multiple Offenders Mean (N=80)
T-value
Level of significance
Truthfulness Scale 12.10 12.08 t = 0.02 n.s. Antisocial Scale 12.10 22.88 t = 6.29 p<.001 Violence Scale 9.6 18.39 t = 4.36 p<.001
Stress Coping Abilities 142.85 127.29 t = 1.18 n.s.
Table 12. T-test comparison of Alcohol Scale between first offenders and multiple offenders. Offender status defined by number of alcohol arrests.
DQ Scale
First Offenders Mean (N=45)
Multiple Offenders Mean (N=55)
T-value
Level of significance
Alcohol Scale 14.27 21.29 t = 2.56 p=.012
27
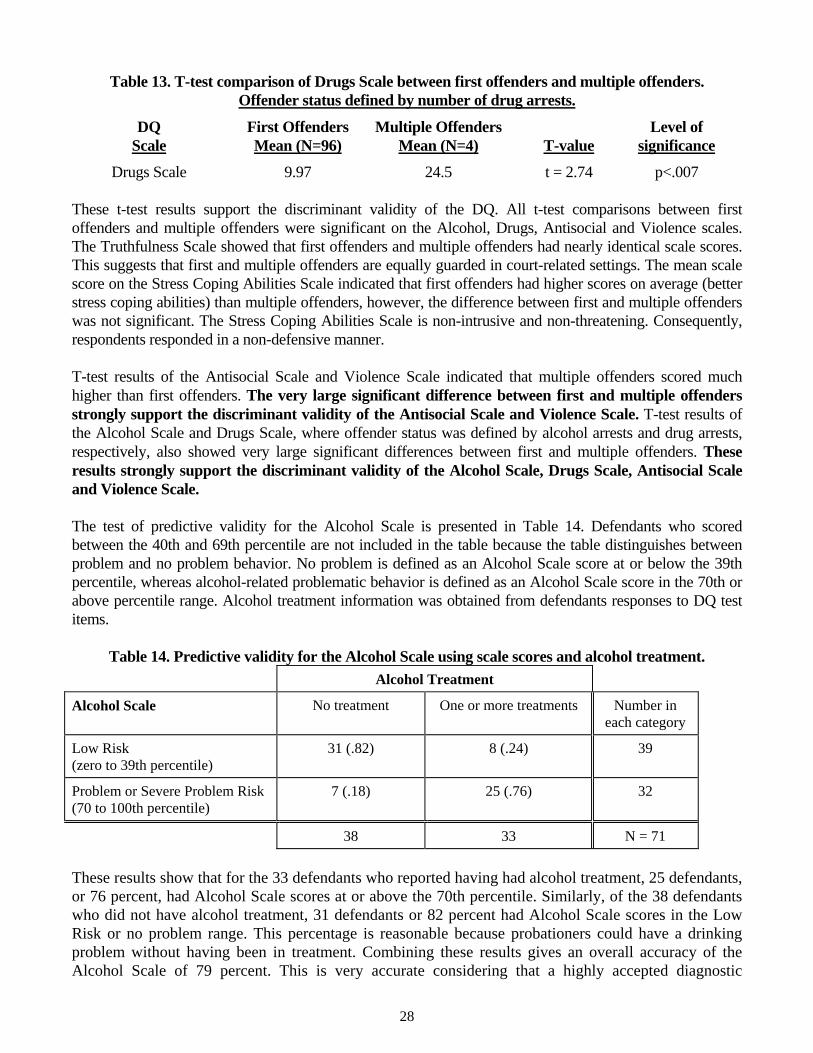
Table 13. T-test comparison of Drugs Scale between first offenders and multiple offenders. Offender status defined by number of drug arrests.
DQ Scale
First Offenders Mean (N=96)
Multiple Offenders Mean (N=4)
T-value
Level of significance
Drugs Scale 9.97 24.5 t = 2.74 p<.007 These t-test results support the discriminant validity of the DQ. All t-test comparisons between first offenders and multiple offenders were significant on the Alcohol, Drugs, Antisocial and Violence scales. The Truthfulness Scale showed that first offenders and multiple offenders had nearly identical scale scores. This suggests that first and multiple offenders are equally guarded in court-related settings. The mean scale score on the Stress Coping Abilities Scale indicated that first offenders had higher scores on average (better stress coping abilities) than multiple offenders, however, the difference between first and multiple offenders was not significant. The Stress Coping Abilities Scale is non-intrusive and non-threatening. Consequently, respondents responded in a non-defensive manner. T-test results of the Antisocial Scale and Violence Scale indicated that multiple offenders scored much higher than first offenders. The very large significant difference between first and multiple offenders strongly support the discriminant validity of the Antisocial Scale and Violence Scale. T-test results of the Alcohol Scale and Drugs Scale, where offender status was defined by alcohol arrests and drug arrests, respectively, also showed very large significant differences between first and multiple offenders. These results strongly support the discriminant validity of the Alcohol Scale, Drugs Scale, Antisocial Scale and Violence Scale. The test of predictive validity for the Alcohol Scale is presented in Table 14. Defendants who scored between the 40th and 69th percentile are not included in the table because the table distinguishes between problem and no problem behavior. No problem is defined as an Alcohol Scale score at or below the 39th percentile, whereas alcohol-related problematic behavior is defined as an Alcohol Scale score in the 70th or above percentile range. Alcohol treatment information was obtained from defendants responses to DQ test items.
Table 14. Predictive validity for the Alcohol Scale using scale scores and alcohol treatment.
Alcohol Treatment
Alcohol Scale No treatment One or more treatments Number in each category
Low Risk (zero to 39th percentile)
31 (.82) 8 (.24) 39
Problem or Severe Problem Risk (70 to 100th percentile)
7 (.18) 25 (.76) 32
38 33 N = 71
These results show that for the 33 defendants who reported having had alcohol treatment, 25 defendants, or 76 percent, had Alcohol Scale scores at or above the 70th percentile. Similarly, of the 38 defendants who did not have alcohol treatment, 31 defendants or 82 percent had Alcohol Scale scores in the Low Risk or no problem range. This percentage is reasonable because probationers could have a drinking problem without having been in treatment. Combining these results gives an overall accuracy of the Alcohol Scale of 79 percent. This is very accurate considering that a highly accepted diagnostic
28
procedure, the mammogram, is about 70 percent accurate. These results show there is a very strong positive correlation between Alcohol Scale scores and alcohol treatment. The predictive validity test of the Drugs Scale was done in the same way using drug treatment as the criterion. Of the 26 defendants who reported having had drug treatment 21 or 81 percent had Drugs Scale scores in the 70th percentile or higher (Problem Risk and above). Of the 43 defendants who did not have treatment 33 (77%) had Drugs Scale scores in the Low Risk (no problem) range. The overall accuracy of the Drugs Scale in predicting drug treatment was 78 percent. These results show there is a very strong positive correlation between the Drugs Scale and drug treatment. For the Violence Scale, 79 percent of the defendants who had been arrested for a violent crime or assault, had Violence Scale scores at or above the 70th percentile and the overall accuracy was 79 percent. This means that there is a very strong positive correlation between Violence Scale scores and total number of arrests. Taken together these results strongly support the reliability, validity and accuracy of the DQ. Reliability coefficient alphas were significant at p<.001 for all DQ scales. T-test comparisons between first offenders and multiple offenders support discriminant validity of the Alcohol Scale, Drugs Scale, Antisocial Scale and Violence Scale because multiple offenders scored significantly higher on the different scales than first offenders. Predictive validity of the Alcohol Scale, Drugs Scale and Violence Scale was shown by the accuracy with which the scales identified problem risk behavior (having had treatment or having had an arrest). The Alcohol Scale had an accuracy of 79 percent, the Drugs Scale had an accuracy of 78 percent and the Violence Scale had an accuracy of 79 percent. These results support the reliability, validity and accuracy of the DQ. 22. Validation of the DQ in Drug Court Clients This study (1998) investigated the DQ in a sample of drug court clients and replicated an earlier study that reported scale accuracy, discriminant and predictive validity, as well as reliability tests. The earlier study validated the DQ on a small sample (N=100) of drug court defendants. The present study sample consisted of a larger sample of 300 drug court defendants. Within-test reliability statistics were performed on the Defendant Questionnaire as was done in the earlier investigation. The within-test reliability measures, or inter-item reliability, are reported with coefficient alpha. Reliability coefficient alphas for the six DQ scales are presented. The two validity statistics that were carried out in the previous study are also used to test the validity of the DQ. For an explanation of these validation procedures please refer to the study presented above. The first validation procedure compares first offenders and multiple offenders (discriminant validity). Multiple offenders are defined as offenders who reported two or more arrests on their DQ answer sheet. For the Alcohol Scale t-test comparisons, alcohol arrests are used to categorize offenders as either a first offender or a multiple offender. For the Drugs Scale, drug arrests are used to categorize offenders and for all other scales, offenders are categorized by total number of times arrested. Because risk is often defined in terms of severity of problem behavior, it is expected that multiple offenders would score significantly higher on the different scales than first offenders. The second validation procedure (predictive validity) determines the accuracy of the DQ in identifying cases with “known” problems. For this procedure, known cases are defined as clients who have been in
29

treatment for alcohol or drugs, or have been arrested for assault or a violent crime. This procedure is used to validate the Alcohol Scale, Drugs Scale and Violence Scale. Method and Results The DQ was administered to 300 drug court clients (1998) as part of routine evaluation in a southwestern municipal court substance abuse screening program. There were 242 (80.7%) males and 58 (19.3%) females. The demographic composition of the drug court clients was as follows: Age in years: 19 & under (17.7%); 20-29 (36%); 30-39 (29.3%); 40-49 (10.3%); 50-59 (5.3%); 60 & over (0.7%). Ethnicity: Caucasian (25.6%); Black (2.4%); Hispanic (64.7%); Native American (5.2%); Other (2.1%). Education: 8th grade or less (7.3%); Some High School (28.7%); H.S. graduate (47.3%); Some college (8%); College graduate (6.3%). Marital Status: Single (69.6%); Married (20.4%); Divorced (7.8%); Separated (1.5%); Windowed (0.7%). Comparisons of obtained DQ risk range percentile scores to predicted percentages are presented in the figure and table below. Predicted risk range percentages are presented in the right hand column of Table 15.
Table 15. Risk Range Percentile Scores for Drug Court Clients (N = 300, 1998).
0%5%
10%15%20%25%30%35%40%45%
Truthfulness Alcohol Drug Antisocial Violence Stress Coping
Low Medium Problem Severe Problem
Risk Range Truthfulness Alcohol Drugs Antisocial Violence Stress Coping Predicted
Low 37.0 38.7 38.0 40.0 38.7 38.0 39% Medium 30.3 31.0 30.0 30.7 30.3 30.7 30% Problem 21.7 18.3 20.7 19.0 20.3 20.3 20% Maximum 11.0 12.0 11.3 10.3 10.7 11.0 11%
Comparisons between obtained risk range percentages and predicted percentages show that all obtained risk range percentile scores were within 2.0 percent of predicted. 21 of the 24 possible risk range percentages (6 scales x 4 risk ranges) were within one percentage point of predicted. This is very accurate defendant risk assessment. These results show that obtained risk range percentile scores closely approximated the predicted risk range percentile scores for each of the six DQ scales presented in Table 15 for this sample of 300 drug court clients. These results indicate that the DQ is a very accurate risk assessment instrument for drug court use. Reliability coefficient alphas are presented in Table 16.
30

Table 16. Reliability coefficient alphas (N = 300, 1998). All coefficient alphas are significant at p<.001.
DQ SCALE
Drug court clients N = 300
Truthfulness Scale .90 Alcohol Scale .93 Drugs Scale .91 Antisocial Scale .84 Violence Scale .89 Stress Coping Abilities .92
Dependency Items* .92 Abuse Items* .87
* The Substance Abuse/Dependency Scale is a classification (as opposed to measurement) scale derived from DSM-IV criteria. The dependency and abuse items are used to determine whether or not clients meet dependency or abuse criteria. They do not measure the extent to which criteria are met. However, they are included here because they demonstrate that client responses are consistent on these DSM-IV dependency and abuse items. These results strongly support the reliability of the DQ. All of the coefficient alphas for the DQ scales are well above generally accepted standards (.80) for reliability. Most of the DQ scales are at or above .90. These high coefficient alpha results are similar to results found in previous studies. The DQ is a statistically reliable screening instrument for assessment of court and substance (alcohol and drugs) abuse defendants. The t-test comparisons between first offenders and multiple offenders for each scale is presented in Tables 17 through 19. There were 300 drug court defendants used in this discriminant validity analysis.
Table 17. T-test comparisons between first offenders and multiple offenders. Offender status defined by total number of arrests. (N = 300, 1998)
DQ Scale
First Offenders Mean (N=89)
Multiple Offenders Mean (N=211)
T-value
Level of significance
Truthfulness Scale 12.24 11.57 t = 0.89 n.s. Antisocial Scale 11.67 23.58 t = 11.64 p<.001 Violence Scale 8.8 18.71 t = 8.13 p<.001
Stress Coping Abilities 137.99 122.5 t = 2.44 p=.015
Table 18. T-test comparison of Alcohol Scale between first offenders and multiple offenders. Offender status defined by number of alcohol arrests.
DQ Scale
First Offenders Mean (N=152)
Multiple Offenders Mean (N=148)
T-value
Level of significance
Alcohol Scale 11.5 23.53 t = 7.97 p<.001
31
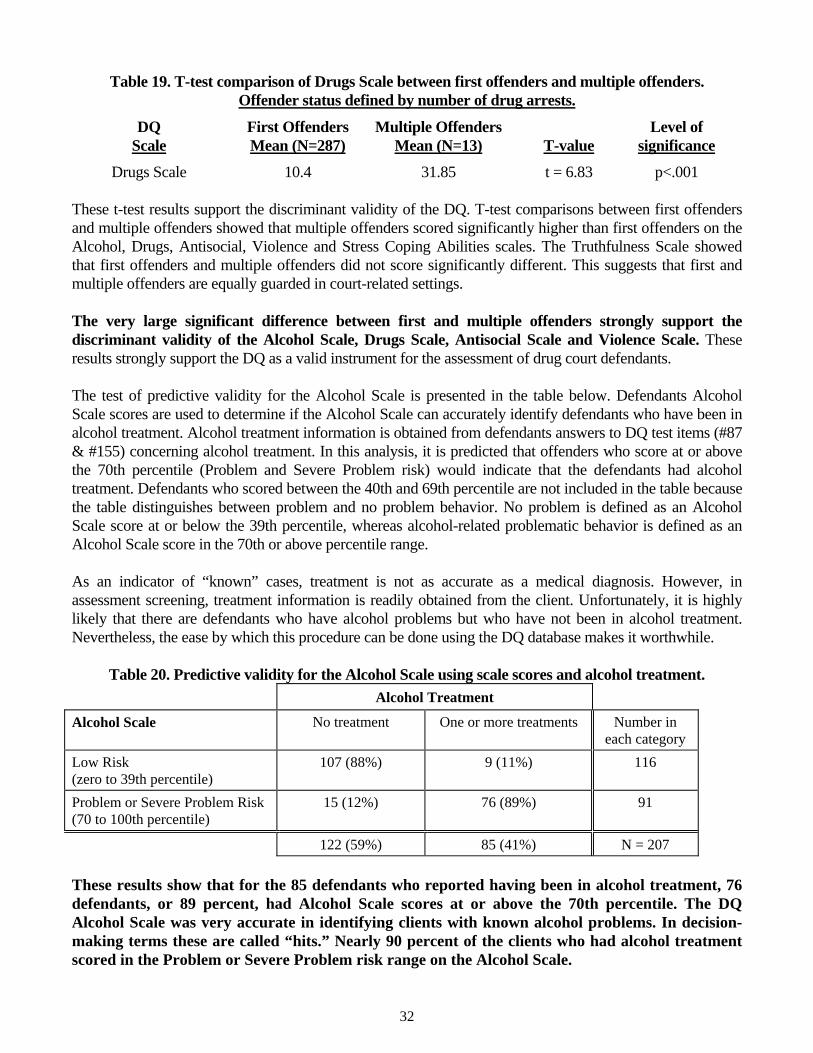
Table 19. T-test comparison of Drugs Scale between first offenders and multiple offenders. Offender status defined by number of drug arrests.
DQ Scale
First Offenders Mean (N=287)
Multiple Offenders Mean (N=13)
T-value
Level of significance
Drugs Scale 10.4 31.85 t = 6.83 p<.001 These t-test results support the discriminant validity of the DQ. T-test comparisons between first offenders and multiple offenders showed that multiple offenders scored significantly higher than first offenders on the Alcohol, Drugs, Antisocial, Violence and Stress Coping Abilities scales. The Truthfulness Scale showed that first offenders and multiple offenders did not score significantly different. This suggests that first and multiple offenders are equally guarded in court-related settings. The very large significant difference between first and multiple offenders strongly support the discriminant validity of the Alcohol Scale, Drugs Scale, Antisocial Scale and Violence Scale. These results strongly support the DQ as a valid instrument for the assessment of drug court defendants. The test of predictive validity for the Alcohol Scale is presented in the table below. Defendants Alcohol Scale scores are used to determine if the Alcohol Scale can accurately identify defendants who have been in alcohol treatment. Alcohol treatment information is obtained from defendants answers to DQ test items (#87 & #155) concerning alcohol treatment. In this analysis, it is predicted that offenders who score at or above the 70th percentile (Problem and Severe Problem risk) would indicate that the defendants had alcohol treatment. Defendants who scored between the 40th and 69th percentile are not included in the table because the table distinguishes between problem and no problem behavior. No problem is defined as an Alcohol Scale score at or below the 39th percentile, whereas alcohol-related problematic behavior is defined as an Alcohol Scale score in the 70th or above percentile range. As an indicator of “known” cases, treatment is not as accurate as a medical diagnosis. However, in assessment screening, treatment information is readily obtained from the client. Unfortunately, it is highly likely that there are defendants who have alcohol problems but who have not been in alcohol treatment. Nevertheless, the ease by which this procedure can be done using the DQ database makes it worthwhile.
Table 20. Predictive validity for the Alcohol Scale using scale scores and alcohol treatment.
Alcohol Treatment
Alcohol Scale No treatment One or more treatments Number in each category
Low Risk (zero to 39th percentile)
107 (88%) 9 (11%) 116
Problem or Severe Problem Risk (70 to 100th percentile)
15 (12%) 76 (89%) 91
122 (59%) 85 (41%) N = 207
These results show that for the 85 defendants who reported having been in alcohol treatment, 76 defendants, or 89 percent, had Alcohol Scale scores at or above the 70th percentile. The DQ Alcohol Scale was very accurate in identifying clients with known alcohol problems. In decision-making terms these are called “hits.” Nearly 90 percent of the clients who had alcohol treatment scored in the Problem or Severe Problem risk range on the Alcohol Scale.
32
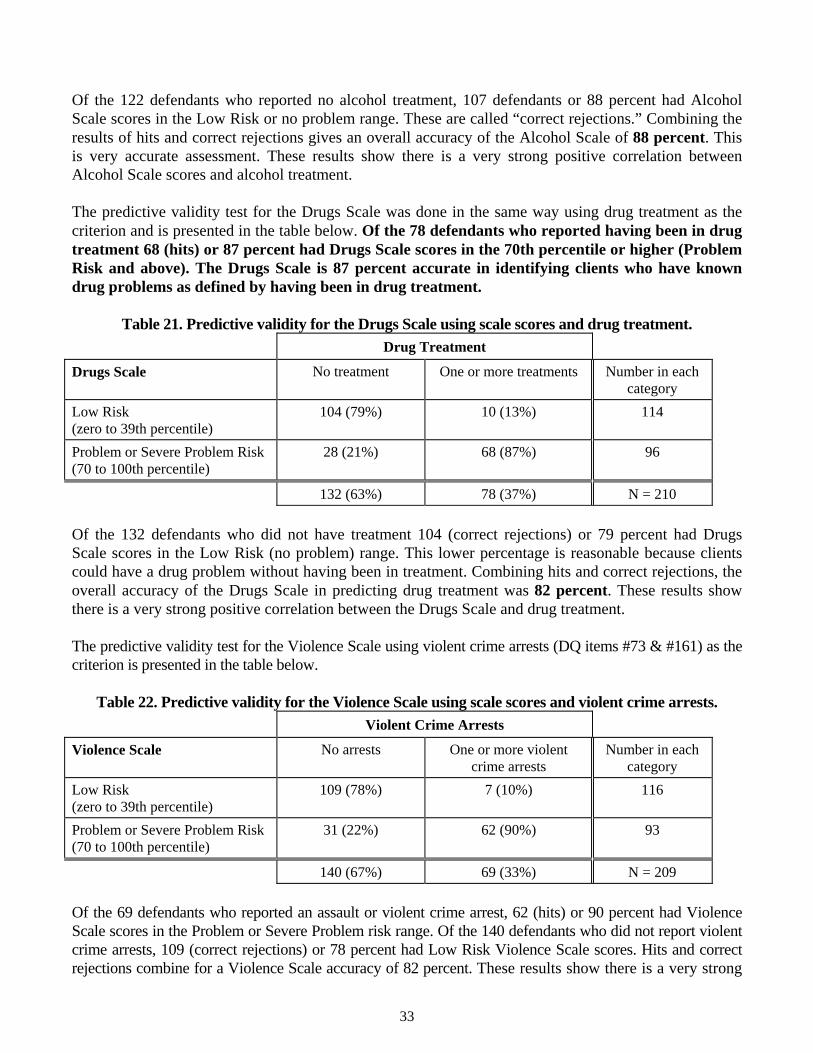
Of the 122 defendants who reported no alcohol treatment, 107 defendants or 88 percent had Alcohol Scale scores in the Low Risk or no problem range. These are called “correct rejections.” Combining the results of hits and correct rejections gives an overall accuracy of the Alcohol Scale of 88 percent. This is very accurate assessment. These results show there is a very strong positive correlation between Alcohol Scale scores and alcohol treatment. The predictive validity test for the Drugs Scale was done in the same way using drug treatment as the criterion and is presented in the table below. Of the 78 defendants who reported having been in drug treatment 68 (hits) or 87 percent had Drugs Scale scores in the 70th percentile or higher (Problem Risk and above). The Drugs Scale is 87 percent accurate in identifying clients who have known drug problems as defined by having been in drug treatment.
Table 21. Predictive validity for the Drugs Scale using scale scores and drug treatment.
Drug Treatment
Drugs Scale No treatment One or more treatments Number in each category
Low Risk (zero to 39th percentile)
104 (79%) 10 (13%) 114
Problem or Severe Problem Risk (70 to 100th percentile)
28 (21%) 68 (87%) 96
132 (63%) 78 (37%) N = 210
Of the 132 defendants who did not have treatment 104 (correct rejections) or 79 percent had Drugs Scale scores in the Low Risk (no problem) range. This lower percentage is reasonable because clients could have a drug problem without having been in treatment. Combining hits and correct rejections, the overall accuracy of the Drugs Scale in predicting drug treatment was 82 percent. These results show there is a very strong positive correlation between the Drugs Scale and drug treatment. The predictive validity test for the Violence Scale using violent crime arrests (DQ items #73 & #161) as the criterion is presented in the table below.
Table 22. Predictive validity for the Violence Scale using scale scores and violent crime arrests.
Violent Crime Arrests
Violence Scale No arrests One or more violent crime arrests
Number in each category
Low Risk (zero to 39th percentile)
109 (78%) 7 (10%) 116
Problem or Severe Problem Risk (70 to 100th percentile)
31 (22%) 62 (90%) 93
140 (67%) 69 (33%) N = 209
Of the 69 defendants who reported an assault or violent crime arrest, 62 (hits) or 90 percent had Violence Scale scores in the Problem or Severe Problem risk range. Of the 140 defendants who did not report violent crime arrests, 109 (correct rejections) or 78 percent had Low Risk Violence Scale scores. Hits and correct rejections combine for a Violence Scale accuracy of 82 percent. These results show there is a very strong
33
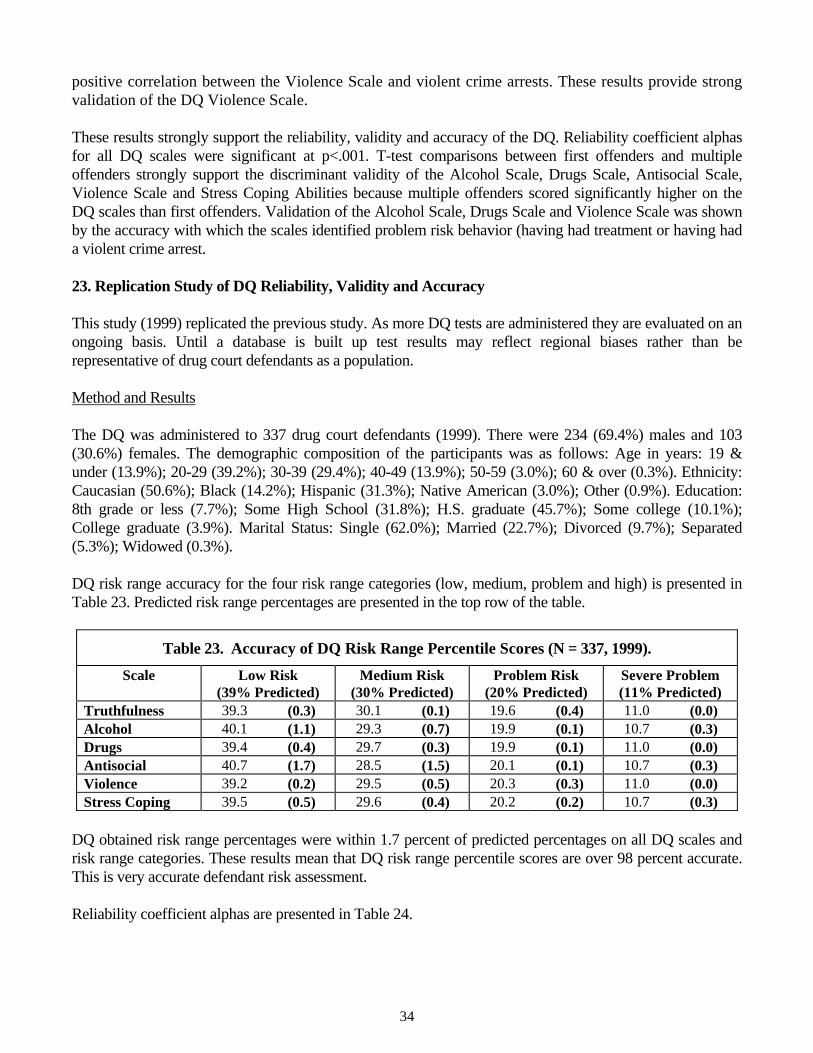
positive correlation between the Violence Scale and violent crime arrests. These results provide strong validation of the DQ Violence Scale. These results strongly support the reliability, validity and accuracy of the DQ. Reliability coefficient alphas for all DQ scales were significant at p<.001. T-test comparisons between first offenders and multiple offenders strongly support the discriminant validity of the Alcohol Scale, Drugs Scale, Antisocial Scale, Violence Scale and Stress Coping Abilities because multiple offenders scored significantly higher on the DQ scales than first offenders. Validation of the Alcohol Scale, Drugs Scale and Violence Scale was shown by the accuracy with which the scales identified problem risk behavior (having had treatment or having had a violent crime arrest. 23. Replication Study of DQ Reliability, Validity and Accuracy This study (1999) replicated the previous study. As more DQ tests are administered they are evaluated on an ongoing basis. Until a database is built up test results may reflect regional biases rather than be representative of drug court defendants as a population. Method and Results The DQ was administered to 337 drug court defendants (1999). There were 234 (69.4%) males and 103 (30.6%) females. The demographic composition of the participants was as follows: Age in years: 19 & under (13.9%); 20-29 (39.2%); 30-39 (29.4%); 40-49 (13.9%); 50-59 (3.0%); 60 & over (0.3%). Ethnicity: Caucasian (50.6%); Black (14.2%); Hispanic (31.3%); Native American (3.0%); Other (0.9%). Education: 8th grade or less (7.7%); Some High School (31.8%); H.S. graduate (45.7%); Some college (10.1%); College graduate (3.9%). Marital Status: Single (62.0%); Married (22.7%); Divorced (9.7%); Separated (5.3%); Widowed (0.3%). DQ risk range accuracy for the four risk range categories (low, medium, problem and high) is presented in Table 23. Predicted risk range percentages are presented in the top row of the table.
Table 23. Accuracy of DQ Risk Range Percentile Scores (N = 337, 1999).
Scale Low Risk (39% Predicted)
Medium Risk (30% Predicted)
Problem Risk (20% Predicted)
Severe Problem (11% Predicted)
Truthfulness 39.3 (0.3) 30.1 (0.1) 19.6 (0.4) 11.0 (0.0) Alcohol 40.1 (1.1) 29.3 (0.7) 19.9 (0.1) 10.7 (0.3) Drugs 39.4 (0.4) 29.7 (0.3) 19.9 (0.1) 11.0 (0.0) Antisocial 40.7 (1.7) 28.5 (1.5) 20.1 (0.1) 10.7 (0.3) Violence 39.2 (0.2) 29.5 (0.5) 20.3 (0.3) 11.0 (0.0) Stress Coping 39.5 (0.5) 29.6 (0.4) 20.2 (0.2) 10.7 (0.3)
DQ obtained risk range percentages were within 1.7 percent of predicted percentages on all DQ scales and risk range categories. These results mean that DQ risk range percentile scores are over 98 percent accurate. This is very accurate defendant risk assessment. Reliability coefficient alphas are presented in Table 24.
34
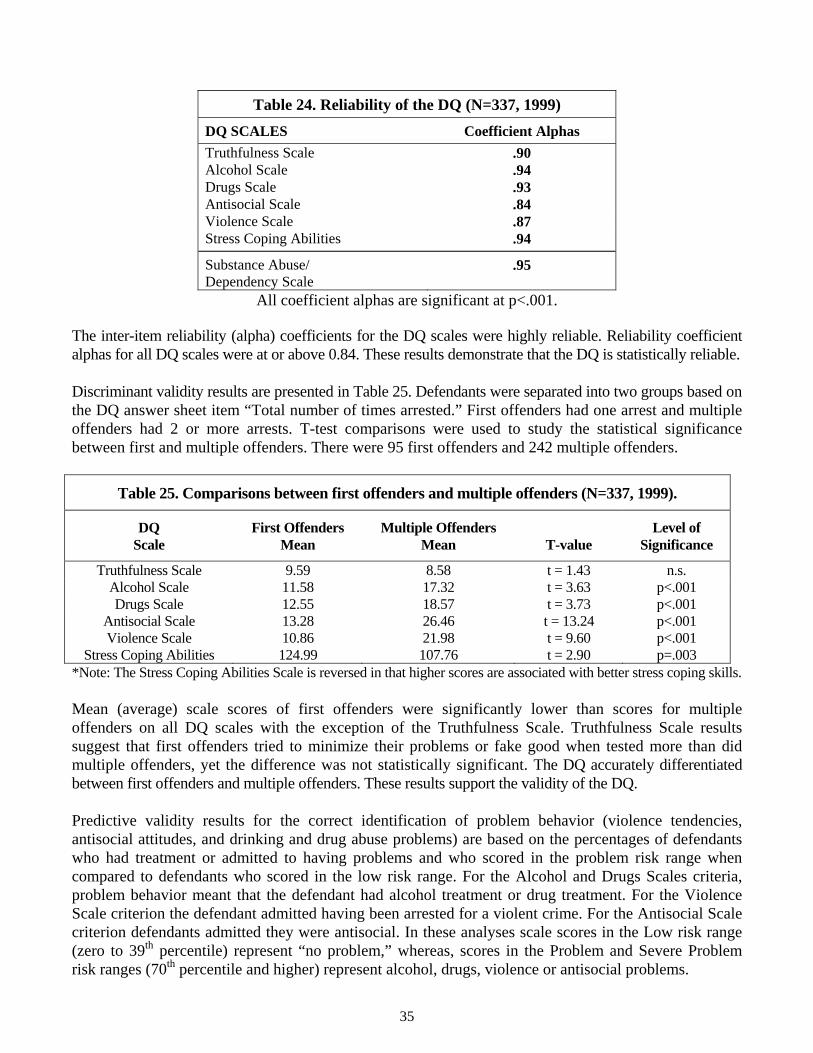
Table 24. Reliability of the DQ (N=337, 1999)
DQ SCALES Coefficient Alphas
Truthfulness Scale .90 Alcohol Scale .94 Drugs Scale .93 Antisocial Scale .84 Violence Scale .87 Stress Coping Abilities .94
Substance Abuse/ Dependency Scale
.95
All coefficient alphas are significant at p<.001. The inter-item reliability (alpha) coefficients for the DQ scales were highly reliable. Reliability coefficient alphas for all DQ scales were at or above 0.84. These results demonstrate that the DQ is statistically reliable. Discriminant validity results are presented in Table 25. Defendants were separated into two groups based on the DQ answer sheet item “Total number of times arrested.” First offenders had one arrest and multiple offenders had 2 or more arrests. T-test comparisons were used to study the statistical significance between first and multiple offenders. There were 95 first offenders and 242 multiple offenders.
Table 25. Comparisons between first offenders and multiple offenders (N=337, 1999).
DQ Scale
First Offenders Mean
Multiple Offenders Mean
T-value
Level of Significance
Truthfulness Scale 9.59 8.58 t = 1.43 n.s. Alcohol Scale 11.58 17.32 t = 3.63 p<.001 Drugs Scale 12.55 18.57 t = 3.73 p<.001
Antisocial Scale 13.28 26.46 t = 13.24 p<.001 Violence Scale 10.86 21.98 t = 9.60 p<.001
Stress Coping Abilities 124.99 107.76 t = 2.90 p=.003 *Note: The Stress Coping Abilities Scale is reversed in that higher scores are associated with better stress coping skills. Mean (average) scale scores of first offenders were significantly lower than scores for multiple offenders on all DQ scales with the exception of the Truthfulness Scale. Truthfulness Scale results suggest that first offenders tried to minimize their problems or fake good when tested more than did multiple offenders, yet the difference was not statistically significant. The DQ accurately differentiated between first offenders and multiple offenders. These results support the validity of the DQ. Predictive validity results for the correct identification of problem behavior (violence tendencies, antisocial attitudes, and drinking and drug abuse problems) are based on the percentages of defendants who had treatment or admitted to having problems and who scored in the problem risk range when compared to defendants who scored in the low risk range. For the Alcohol and Drugs Scales criteria, problem behavior meant that the defendant had alcohol treatment or drug treatment. For the Violence Scale criterion the defendant admitted having been arrested for a violent crime. For the Antisocial Scale criterion defendants admitted they were antisocial. In these analyses scale scores in the Low risk range (zero to 39th percentile) represent “no problem,” whereas, scores in the Problem and Severe Problem risk ranges (70th percentile and higher) represent alcohol, drugs, violence or antisocial problems.
35
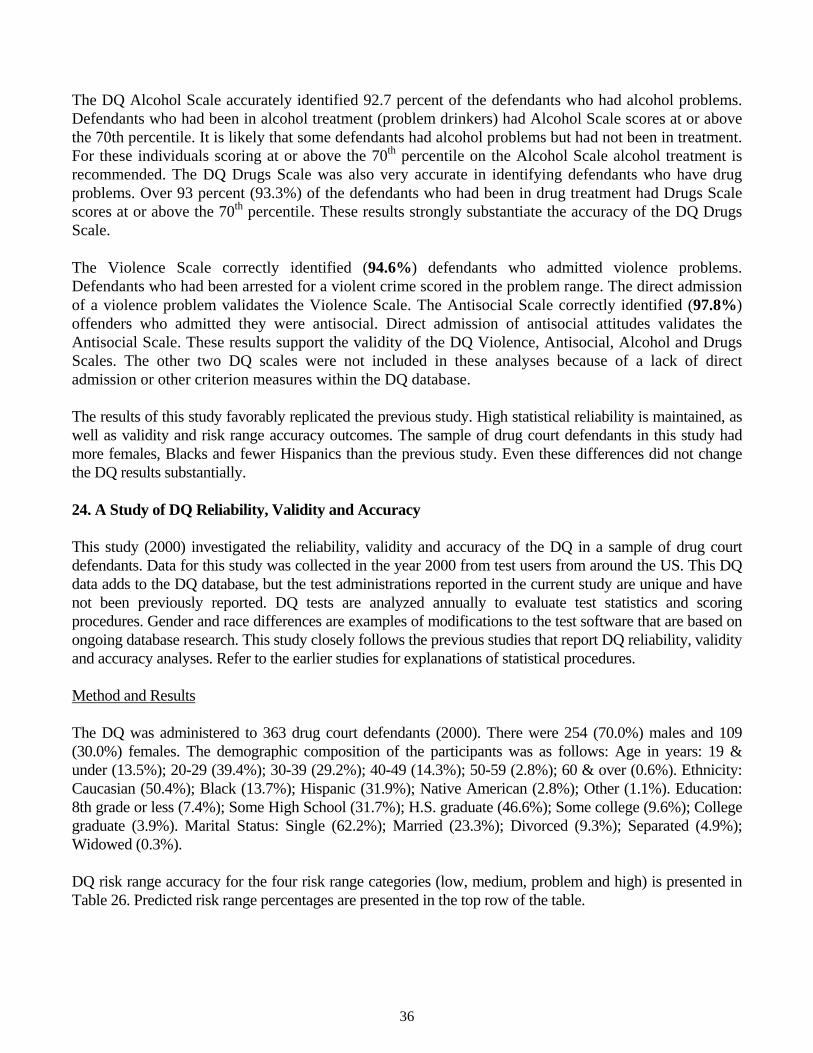
The DQ Alcohol Scale accurately identified 92.7 percent of the defendants who had alcohol problems. Defendants who had been in alcohol treatment (problem drinkers) had Alcohol Scale scores at or above the 70th percentile. It is likely that some defendants had alcohol problems but had not been in treatment. For these individuals scoring at or above the 70th percentile on the Alcohol Scale alcohol treatment is recommended. The DQ Drugs Scale was also very accurate in identifying defendants who have drug problems. Over 93 percent (93.3%) of the defendants who had been in drug treatment had Drugs Scale scores at or above the 70th percentile. These results strongly substantiate the accuracy of the DQ Drugs Scale. The Violence Scale correctly identified (94.6%) defendants who admitted violence problems. Defendants who had been arrested for a violent crime scored in the problem range. The direct admission of a violence problem validates the Violence Scale. The Antisocial Scale correctly identified (97.8%) offenders who admitted they were antisocial. Direct admission of antisocial attitudes validates the Antisocial Scale. These results support the validity of the DQ Violence, Antisocial, Alcohol and Drugs Scales. The other two DQ scales were not included in these analyses because of a lack of direct admission or other criterion measures within the DQ database. The results of this study favorably replicated the previous study. High statistical reliability is maintained, as well as validity and risk range accuracy outcomes. The sample of drug court defendants in this study had more females, Blacks and fewer Hispanics than the previous study. Even these differences did not change the DQ results substantially. 24. A Study of DQ Reliability, Validity and Accuracy This study (2000) investigated the reliability, validity and accuracy of the DQ in a sample of drug court defendants. Data for this study was collected in the year 2000 from test users from around the US. This DQ data adds to the DQ database, but the test administrations reported in the current study are unique and have not been previously reported. DQ tests are analyzed annually to evaluate test statistics and scoring procedures. Gender and race differences are examples of modifications to the test software that are based on ongoing database research. This study closely follows the previous studies that report DQ reliability, validity and accuracy analyses. Refer to the earlier studies for explanations of statistical procedures. Method and Results The DQ was administered to 363 drug court defendants (2000). There were 254 (70.0%) males and 109 (30.0%) females. The demographic composition of the participants was as follows: Age in years: 19 & under (13.5%); 20-29 (39.4%); 30-39 (29.2%); 40-49 (14.3%); 50-59 (2.8%); 60 & over (0.6%). Ethnicity: Caucasian (50.4%); Black (13.7%); Hispanic (31.9%); Native American (2.8%); Other (1.1%). Education: 8th grade or less (7.4%); Some High School (31.7%); H.S. graduate (46.6%); Some college (9.6%); College graduate (3.9%). Marital Status: Single (62.2%); Married (23.3%); Divorced (9.3%); Separated (4.9%); Widowed (0.3%). DQ risk range accuracy for the four risk range categories (low, medium, problem and high) is presented in Table 26. Predicted risk range percentages are presented in the top row of the table.
36
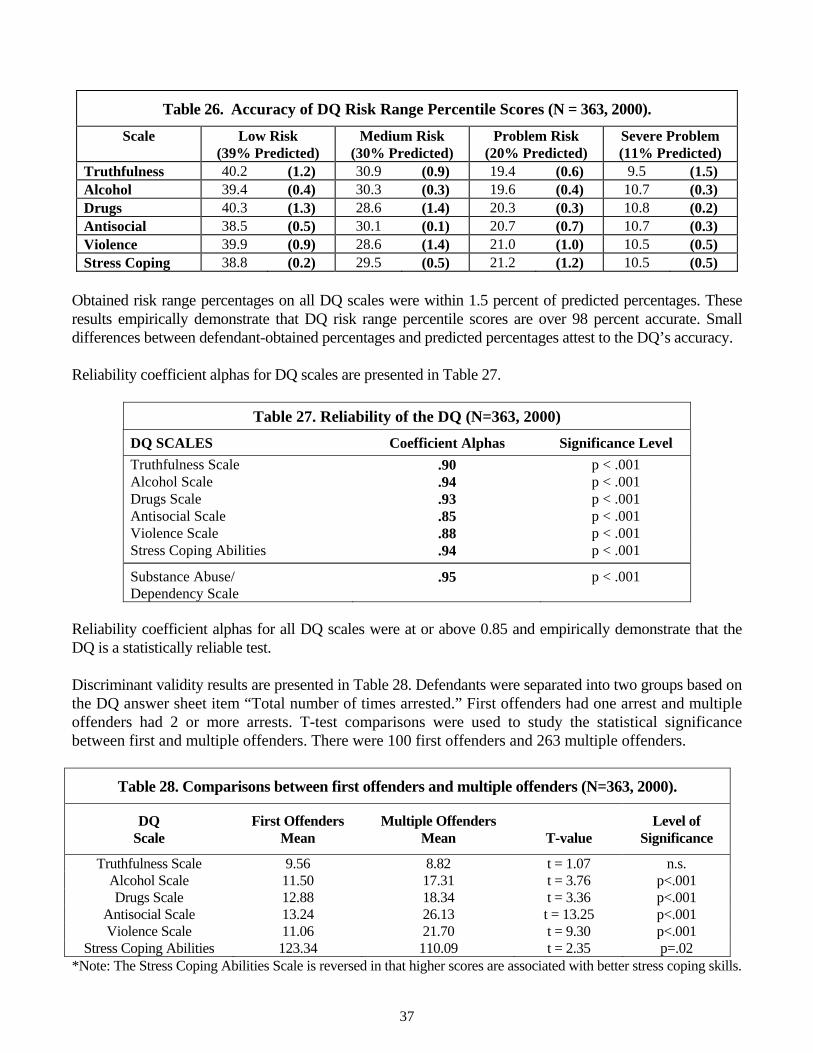
Table 26. Accuracy of DQ Risk Range Percentile Scores (N = 363, 2000).
Scale Low Risk (39% Predicted)
Medium Risk (30% Predicted)
Problem Risk (20% Predicted)
Severe Problem (11% Predicted)
Truthfulness 40.2 (1.2) 30.9 (0.9) 19.4 (0.6) 9.5 (1.5) Alcohol 39.4 (0.4) 30.3 (0.3) 19.6 (0.4) 10.7 (0.3) Drugs 40.3 (1.3) 28.6 (1.4) 20.3 (0.3) 10.8 (0.2) Antisocial 38.5 (0.5) 30.1 (0.1) 20.7 (0.7) 10.7 (0.3) Violence 39.9 (0.9) 28.6 (1.4) 21.0 (1.0) 10.5 (0.5) Stress Coping 38.8 (0.2) 29.5 (0.5) 21.2 (1.2) 10.5 (0.5)
Obtained risk range percentages on all DQ scales were within 1.5 percent of predicted percentages. These results empirically demonstrate that DQ risk range percentile scores are over 98 percent accurate. Small differences between defendant-obtained percentages and predicted percentages attest to the DQ’s accuracy. Reliability coefficient alphas for DQ scales are presented in Table 27.
Table 27. Reliability of the DQ (N=363, 2000)
DQ SCALES Coefficient Alphas Significance Level
Truthfulness Scale .90 p < .001 Alcohol Scale .94 p < .001 Drugs Scale .93 p < .001 Antisocial Scale .85 p < .001 Violence Scale .88 p < .001 Stress Coping Abilities .94 p < .001
Substance Abuse/ Dependency Scale
.95 p < .001
Reliability coefficient alphas for all DQ scales were at or above 0.85 and empirically demonstrate that the DQ is a statistically reliable test. Discriminant validity results are presented in Table 28. Defendants were separated into two groups based on the DQ answer sheet item “Total number of times arrested.” First offenders had one arrest and multiple offenders had 2 or more arrests. T-test comparisons were used to study the statistical significance between first and multiple offenders. There were 100 first offenders and 263 multiple offenders.
Table 28. Comparisons between first offenders and multiple offenders (N=363, 2000).
DQ Scale
First Offenders Mean
Multiple Offenders Mean
T-value
Level of Significance
Truthfulness Scale 9.56 8.82 t = 1.07 n.s. Alcohol Scale 11.50 17.31 t = 3.76 p<.001 Drugs Scale 12.88 18.34 t = 3.36 p<.001
Antisocial Scale 13.24 26.13 t = 13.25 p<.001 Violence Scale 11.06 21.70 t = 9.30 p<.001
Stress Coping Abilities 123.34 110.09 t = 2.35 p=.02 *Note: The Stress Coping Abilities Scale is reversed in that higher scores are associated with better stress coping skills.
37
As in previous studies, mean (average) scale scores of first offenders were significantly lower than scores for multiple offenders on all DQ scales with the exception of the Truthfulness Scale. Again, DQ scales accurately differentiated between first offenders and multiple offenders. These results demonstrate that DQ scales are valid. Predictive validity results for the correct identification of problem behavior (violence tendencies, antisocial attitudes, and drinking and drug abuse problems) are as follows. The Alcohol Scale identified 93.2 percent of the defendants who had alcohol problems. Defendants who had been in alcohol treatment (problem drinkers) had Alcohol Scale scores at or above the 70th percentile. The Drugs Scale was also accurate in identifying defendants who have drug problems. Over 93 percent (93.4%) of the defendants who had been in drug treatment had Drugs Scale scores at or above the 70th percentile. The Violence Scale correctly identified (96.4%) defendants who admitted violence problems. Defendants who had been arrested for a violent crime scored in the problem range. The Antisocial Scale correctly identified (95.0%) offenders who admitted they were antisocial. The validity of the DQ Violence, Antisocial, Alcohol and Drugs Scales is demonstrated by these results. The results of this study are similar to the studies presented above. DQ reliability is maintained at or above .85, validity is again demonstrated empirically and scale score risk range percentile accuracy was again within two percent of expected percentiles. The DQ is fundamentally sound and replicate statistics across different samples. 25. DQ Test Statistics: An Ongoing Analysis This study (2001) continues the analyses of DQ reliability, validity and accuracy in a sample of drug court defendants. Data for this study was collected in the year 2001 from the agencies and departments that use the DQ. Test data have not been previously reported. This study closely follows the previous studies that report DQ reliability, validity and accuracy analyses. Method and Results The DQ was administered to 427 drug court defendants (2001). There were 326 (76.3%) males and 101 (23.7%) females. The demographic composition of the participants was as follows: Age in years: 19 & under (17.3%); 20-29 (37.2%); 30-39 (26.5%); 40-49 (15.5%); 50-59 (2.1%); 60 & over (1.2%). Ethnicity: Caucasian (70.2%); Black (3.6%); Hispanic (22.9%); Native American (1.7%); Other (1.7%). Education: 8th grade or less (7.7%); Some High School (23.4%); H.S. graduate (53.4%); Some college (9.8%); College graduate (2.8%). Marital Status: Single (61.2%); Married (26.9%); Divorced (7.4%); Separated (3.8%); Widowed (0.8%). Nearly three-fourths (71.6%) of the defendants reported having been arrested two or more times. Over half (50.9%) of the defendants had three or more arrests. Over one-fourth (27.8%) of the defendants had two or more alcohol-related arrests and 9.5 percent had two or more drug-related arrests. Nearly half (44.4%) of the defendants were sentenced to jail one or more times and 7.8 percent were sentenced to prison one or more times. DQ risk range accuracy for the four risk range categories (low, medium, problem and high) is presented in Table 29. Predicted risk range percentages are presented in the top row of the table. The differences between obtained and predicted risk range percentages are presented in parentheses in the table.
38
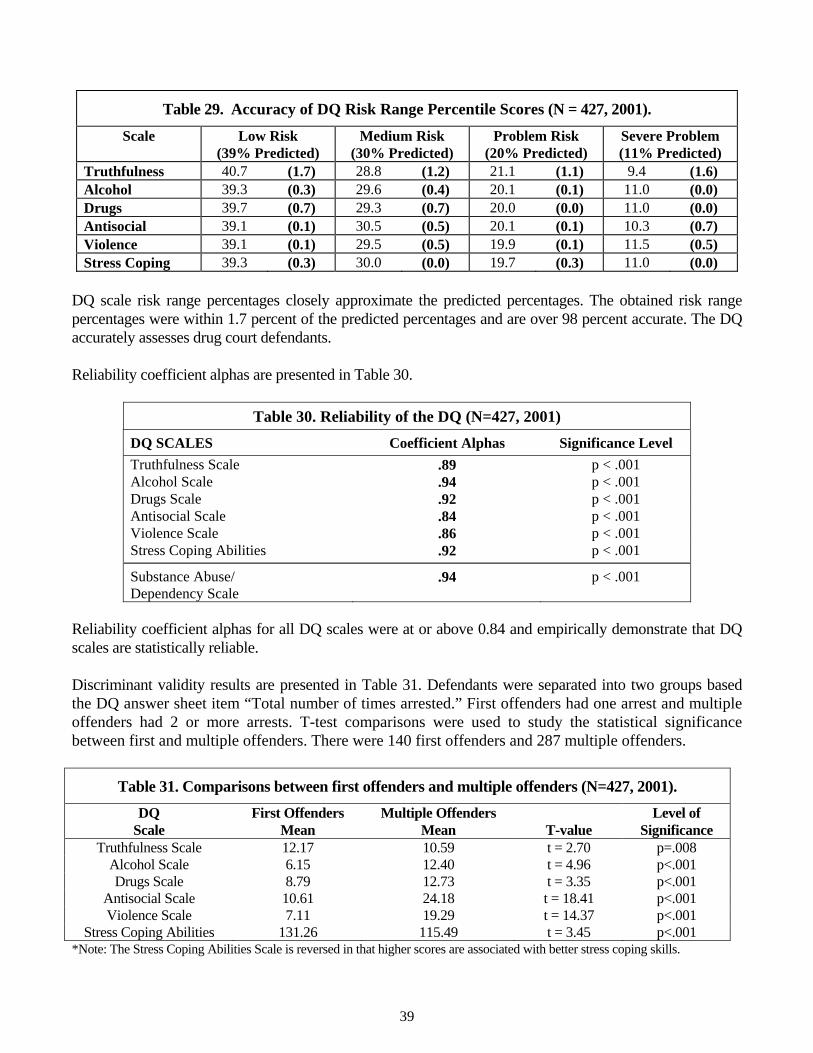
Table 29. Accuracy of DQ Risk Range Percentile Scores (N = 427, 2001).
Scale Low Risk (39% Predicted)
Medium Risk (30% Predicted)
Problem Risk (20% Predicted)
Severe Problem (11% Predicted)
Truthfulness 40.7 (1.7) 28.8 (1.2) 21.1 (1.1) 9.4 (1.6) Alcohol 39.3 (0.3) 29.6 (0.4) 20.1 (0.1) 11.0 (0.0) Drugs 39.7 (0.7) 29.3 (0.7) 20.0 (0.0) 11.0 (0.0) Antisocial 39.1 (0.1) 30.5 (0.5) 20.1 (0.1) 10.3 (0.7) Violence 39.1 (0.1) 29.5 (0.5) 19.9 (0.1) 11.5 (0.5) Stress Coping 39.3 (0.3) 30.0 (0.0) 19.7 (0.3) 11.0 (0.0)
DQ scale risk range percentages closely approximate the predicted percentages. The obtained risk range percentages were within 1.7 percent of the predicted percentages and are over 98 percent accurate. The DQ accurately assesses drug court defendants. Reliability coefficient alphas are presented in Table 30.
Table 30. Reliability of the DQ (N=427, 2001)
DQ SCALES Coefficient Alphas Significance Level
Truthfulness Scale .89 p < .001 Alcohol Scale .94 p < .001 Drugs Scale .92 p < .001 Antisocial Scale .84 p < .001 Violence Scale .86 p < .001 Stress Coping Abilities .92 p < .001
Substance Abuse/ Dependency Scale
.94 p < .001
Reliability coefficient alphas for all DQ scales were at or above 0.84 and empirically demonstrate that DQ scales are statistically reliable. Discriminant validity results are presented in Table 31. Defendants were separated into two groups based the DQ answer sheet item “Total number of times arrested.” First offenders had one arrest and multiple offenders had 2 or more arrests. T-test comparisons were used to study the statistical significance between first and multiple offenders. There were 140 first offenders and 287 multiple offenders.
Table 31. Comparisons between first offenders and multiple offenders (N=427, 2001).
DQ Scale
First Offenders Mean
Multiple Offenders Mean
T-value
Level of Significance
Truthfulness Scale 12.17 10.59 t = 2.70 p=.008 Alcohol Scale 6.15 12.40 t = 4.96 p<.001 Drugs Scale 8.79 12.73 t = 3.35 p<.001
Antisocial Scale 10.61 24.18 t = 18.41 p<.001 Violence Scale 7.11 19.29 t = 14.37 p<.001
Stress Coping Abilities 131.26 115.49 t = 3.45 p<.001 *Note: The Stress Coping Abilities Scale is reversed in that higher scores are associated with better stress coping skills.
39
Average scale scores of first offenders were significantly lower than average scores for multiple offenders on all DQ scales except the Truthfulness Scale. These results are consistent with those reported in previous DQ studies. Offenders who have problems (multiple arrests) score higher on DQ scales than offenders who have only one arrest. DQ scales measure what they purport to measure, that is, defendant risk. Predictive validity results for the correct identification of problem behavior (violence tendencies, antisocial attitudes, and drinking and drug abuse problems) are as follows. The Alcohol Scale identified 100 percent of the defendants who had alcohol problems. Defendants who had been in alcohol treatment (problem drinkers) had Alcohol Scale scores at or above the 70th percentile. The Drugs Scale was also accurate in identifying defendants who have drug problems. Over 95 percent (95.6%) of the defendants who had been in drug treatment had Drugs Scale scores at or above the 70th percentile. The Violence Scale correctly identified (100%) defendants who admitted violence problems. Defendants who had been arrested for a violent crime scored in the problem range. The Antisocial Scale correctly identified (100%) offenders who admitted they were antisocial. These results are somewhat higher than those reported in previous studies but there doesn’t appear to be much difference in the demographic composition of this sample from previous DQ study samples. DQ Violence, Antisocial, Alcohol and Drugs Scales are accurate. The results of this study demonstrate that DQ reliability, validity and scale score accuracy are well established. The DQ accurately and reliably assesses drug court defendants’ risk and needs. 26. DQ Test Statistics and Recidivism Prediction This study (2002) developed a prediction equation for recidivism and continued the analyses of DQ reliability, validity and accuracy in a sample of drug court defendants. Data for the DQ test statistics was collected in the year 2002 and have not been previously reported. The prediction analysis combined recent DQ tests for a total N of 1,868. The predictive ability of the DQ in predicting number of arrests was examined. The demographic variables used in the analysis were: Age, gender, race, education level and marital status. Court history variables included, age at first arrest, alcohol arrests and drug arrests. DQ scales or “criminogenic needs” variables included the Truthfulness, Alcohol, Drugs, Antisocial, Violence, Stress Coping Abilities and the Substance Abuse/Dependency Classification Scale. Multiple regression analysis was used to determine which predictor variables significantly contributed to the prediction equation. Method and Results The DQ was administered to 736 drug court defendants (2002). There were 537 (73.0%) males and 199 (27.0%) females. The demographic composition of the participants was as follows: Age in years: 19 & under (16.3%); 20-29 (36.3%); 30-39 (23.5%); 40-49 (16.2%); 50-59 (6.8%); 60 & over (0.8%). Ethnicity: Caucasian (85.7%); Black (6.2%); Hispanic (5.7%); Native American (1.7%); Other (0.7%). Education: 8th grade or less (2.3%); Some High School (24.5%); H.S. graduate (48.8%); Some college (13.6%); College graduate (7.6%). Marital Status: Single (58.3%); Married (25.8%); Divorced (10.1%); Separated (4.2%); Widowed (1.7%). DQ risk range accuracy for the four risk range categories (low, medium, problem and high) is presented in Table 32. Predicted risk range percentages are presented in the top row of the table.
40
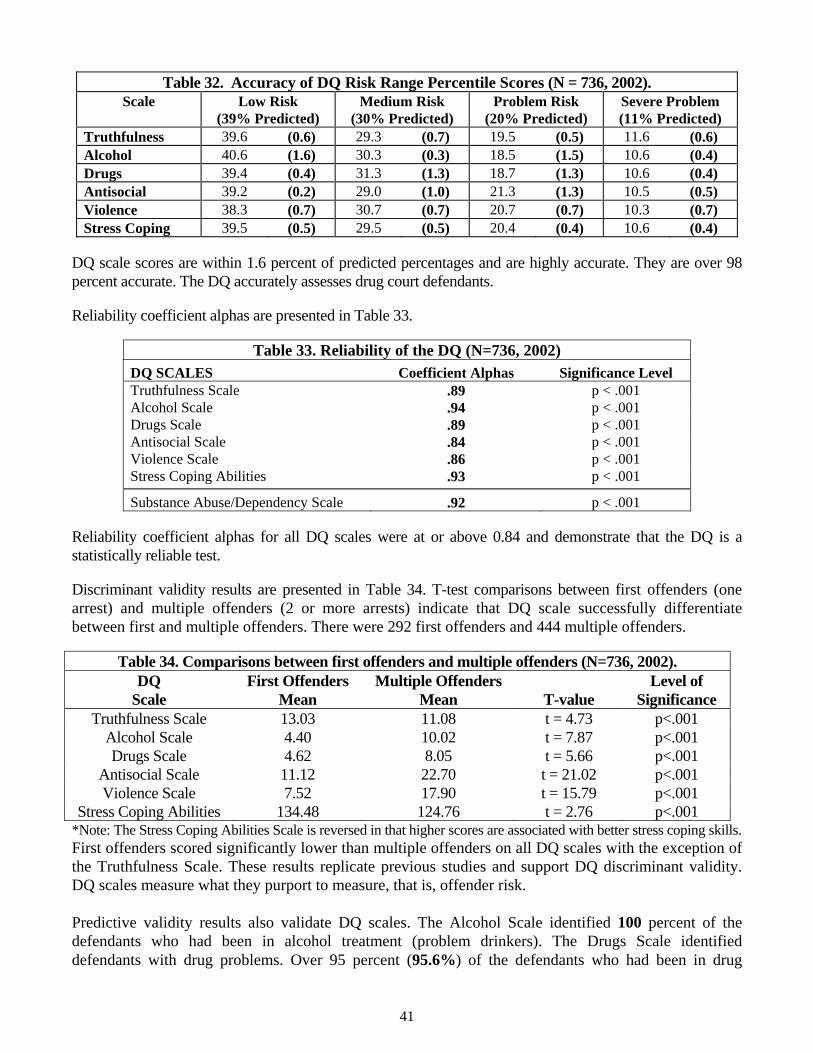
Table 32. Accuracy of DQ Risk Range Percentile Scores (N = 736, 2002). Scale Low Risk
(39% Predicted) Medium Risk
(30% Predicted) Problem Risk
(20% Predicted) Severe Problem (11% Predicted)
Truthfulness 39.6 (0.6) 29.3 (0.7) 19.5 (0.5) 11.6 (0.6) Alcohol 40.6 (1.6) 30.3 (0.3) 18.5 (1.5) 10.6 (0.4) Drugs 39.4 (0.4) 31.3 (1.3) 18.7 (1.3) 10.6 (0.4) Antisocial 39.2 (0.2) 29.0 (1.0) 21.3 (1.3) 10.5 (0.5) Violence 38.3 (0.7) 30.7 (0.7) 20.7 (0.7) 10.3 (0.7) Stress Coping 39.5 (0.5) 29.5 (0.5) 20.4 (0.4) 10.6 (0.4)
DQ scale scores are within 1.6 percent of predicted percentages and are highly accurate. They are over 98 percent accurate. The DQ accurately assesses drug court defendants. Reliability coefficient alphas are presented in Table 33.
Table 33. Reliability of the DQ (N=736, 2002) DQ SCALES Coefficient Alphas Significance Level Truthfulness Scale .89 p < .001 Alcohol Scale .94 p < .001 Drugs Scale .89 p < .001 Antisocial Scale .84 p < .001 Violence Scale .86 p < .001 Stress Coping Abilities .93 p < .001
Substance Abuse/Dependency Scale .92 p < .001 Reliability coefficient alphas for all DQ scales were at or above 0.84 and demonstrate that the DQ is a statistically reliable test. Discriminant validity results are presented in Table 34. T-test comparisons between first offenders (one arrest) and multiple offenders (2 or more arrests) indicate that DQ scale successfully differentiate between first and multiple offenders. There were 292 first offenders and 444 multiple offenders.
Table 34. Comparisons between first offenders and multiple offenders (N=736, 2002). DQ
Scale First Offenders
Mean Multiple Offenders
Mean
T-value Level of
Significance Truthfulness Scale 13.03 11.08 t = 4.73 p<.001
Alcohol Scale 4.40 10.02 t = 7.87 p<.001 Drugs Scale 4.62 8.05 t = 5.66 p<.001
Antisocial Scale 11.12 22.70 t = 21.02 p<.001 Violence Scale 7.52 17.90 t = 15.79 p<.001
Stress Coping Abilities 134.48 124.76 t = 2.76 p<.001 *Note: The Stress Coping Abilities Scale is reversed in that higher scores are associated with better stress coping skills. First offenders scored significantly lower than multiple offenders on all DQ scales with the exception of the Truthfulness Scale. These results replicate previous studies and support DQ discriminant validity. DQ scales measure what they purport to measure, that is, offender risk. Predictive validity results also validate DQ scales. The Alcohol Scale identified 100 percent of the defendants who had been in alcohol treatment (problem drinkers). The Drugs Scale identified defendants with drug problems. Over 95 percent (95.6%) of the defendants who had been in drug
41
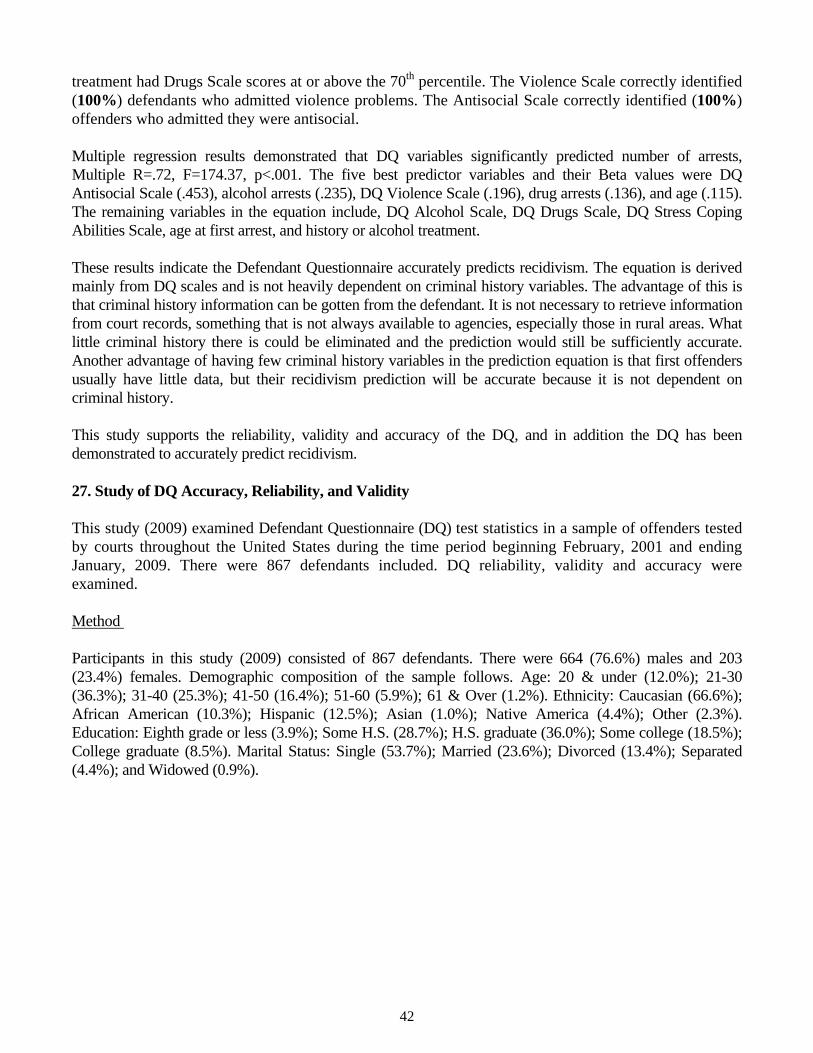
treatment had Drugs Scale scores at or above the 70th percentile. The Violence Scale correctly identified (100%) defendants who admitted violence problems. The Antisocial Scale correctly identified (100%) offenders who admitted they were antisocial. Multiple regression results demonstrated that DQ variables significantly predicted number of arrests, Multiple R=.72, F=174.37, p<.001. The five best predictor variables and their Beta values were DQ Antisocial Scale (.453), alcohol arrests (.235), DQ Violence Scale (.196), drug arrests (.136), and age (.115). The remaining variables in the equation include, DQ Alcohol Scale, DQ Drugs Scale, DQ Stress Coping Abilities Scale, age at first arrest, and history or alcohol treatment. These results indicate the Defendant Questionnaire accurately predicts recidivism. The equation is derived mainly from DQ scales and is not heavily dependent on criminal history variables. The advantage of this is that criminal history information can be gotten from the defendant. It is not necessary to retrieve information from court records, something that is not always available to agencies, especially those in rural areas. What little criminal history there is could be eliminated and the prediction would still be sufficiently accurate. Another advantage of having few criminal history variables in the prediction equation is that first offenders usually have little data, but their recidivism prediction will be accurate because it is not dependent on criminal history. This study supports the reliability, validity and accuracy of the DQ, and in addition the DQ has been demonstrated to accurately predict recidivism. 27. Study of DQ Accuracy, Reliability, and Validity This study (2009) examined Defendant Questionnaire (DQ) test statistics in a sample of offenders tested by courts throughout the United States during the time period beginning February, 2001 and ending January, 2009. There were 867 defendants included. DQ reliability, validity and accuracy were examined. Method Participants in this study (2009) consisted of 867 defendants. There were 664 (76.6%) males and 203 (23.4%) females. Demographic composition of the sample follows. Age: 20 & under (12.0%); 21-30 (36.3%); 31-40 (25.3%); 41-50 (16.4%); 51-60 (5.9%); 61 & Over (1.2%). Ethnicity: Caucasian (66.6%); African American (10.3%); Hispanic (12.5%); Asian (1.0%); Native America (4.4%); Other (2.3%). Education: Eighth grade or less (3.9%); Some H.S. (28.7%); H.S. graduate (36.0%); Some college (18.5%); College graduate (8.5%). Marital Status: Single (53.7%); Married (23.6%); Divorced (13.4%); Separated (4.4%); and Widowed (0.9%).
42
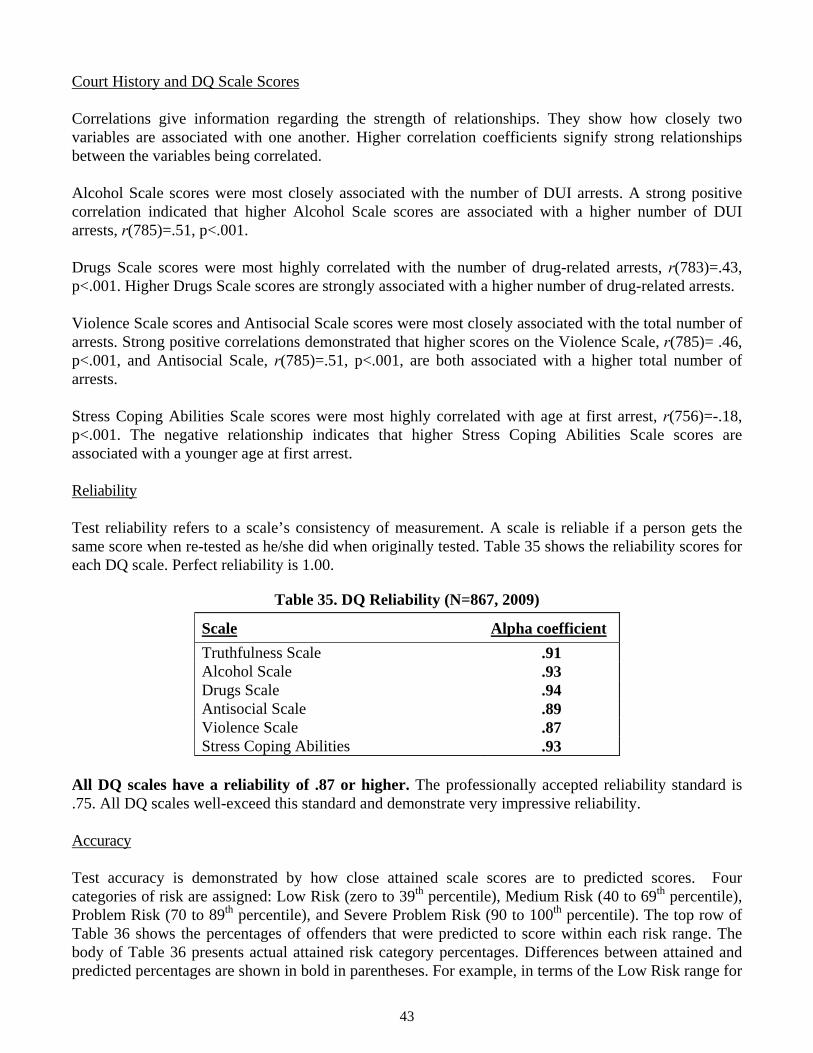
Court History and DQ Scale Scores Correlations give information regarding the strength of relationships. They show how closely two variables are associated with one another. Higher correlation coefficients signify strong relationships between the variables being correlated. Alcohol Scale scores were most closely associated with the number of DUI arrests. A strong positive correlation indicated that higher Alcohol Scale scores are associated with a higher number of DUI arrests, r(785)=.51, p<.001. Drugs Scale scores were most highly correlated with the number of drug-related arrests, r(783)=.43, p<.001. Higher Drugs Scale scores are strongly associated with a higher number of drug-related arrests. Violence Scale scores and Antisocial Scale scores were most closely associated with the total number of arrests. Strong positive correlations demonstrated that higher scores on the Violence Scale, r(785)= .46, p<.001, and Antisocial Scale, r(785)=.51, p<.001, are both associated with a higher total number of arrests. Stress Coping Abilities Scale scores were most highly correlated with age at first arrest, r(756)=-.18, p<.001. The negative relationship indicates that higher Stress Coping Abilities Scale scores are associated with a younger age at first arrest. Reliability Test reliability refers to a scale’s consistency of measurement. A scale is reliable if a person gets the same score when re-tested as he/she did when originally tested. Table 35 shows the reliability scores for each DQ scale. Perfect reliability is 1.00.
Table 35. DQ Reliability (N=867, 2009)
Scale Alpha coefficient
Truthfulness Scale .91 Alcohol Scale .93 Drugs Scale .94 Antisocial Scale .89 Violence Scale .87 Stress Coping Abilities .93
All DQ scales have a reliability of .87 or higher. The professionally accepted reliability standard is .75. All DQ scales well-exceed this standard and demonstrate very impressive reliability. Accuracy Test accuracy is demonstrated by how close attained scale scores are to predicted scores. Four categories of risk are assigned: Low Risk (zero to 39th percentile), Medium Risk (40 to 69th percentile), Problem Risk (70 to 89th percentile), and Severe Problem Risk (90 to 100th percentile). The top row of Table 36 shows the percentages of offenders that were predicted to score within each risk range. The body of Table 36 presents actual attained risk category percentages. Differences between attained and predicted percentages are shown in bold in parentheses. For example, in terms of the Low Risk range for
43
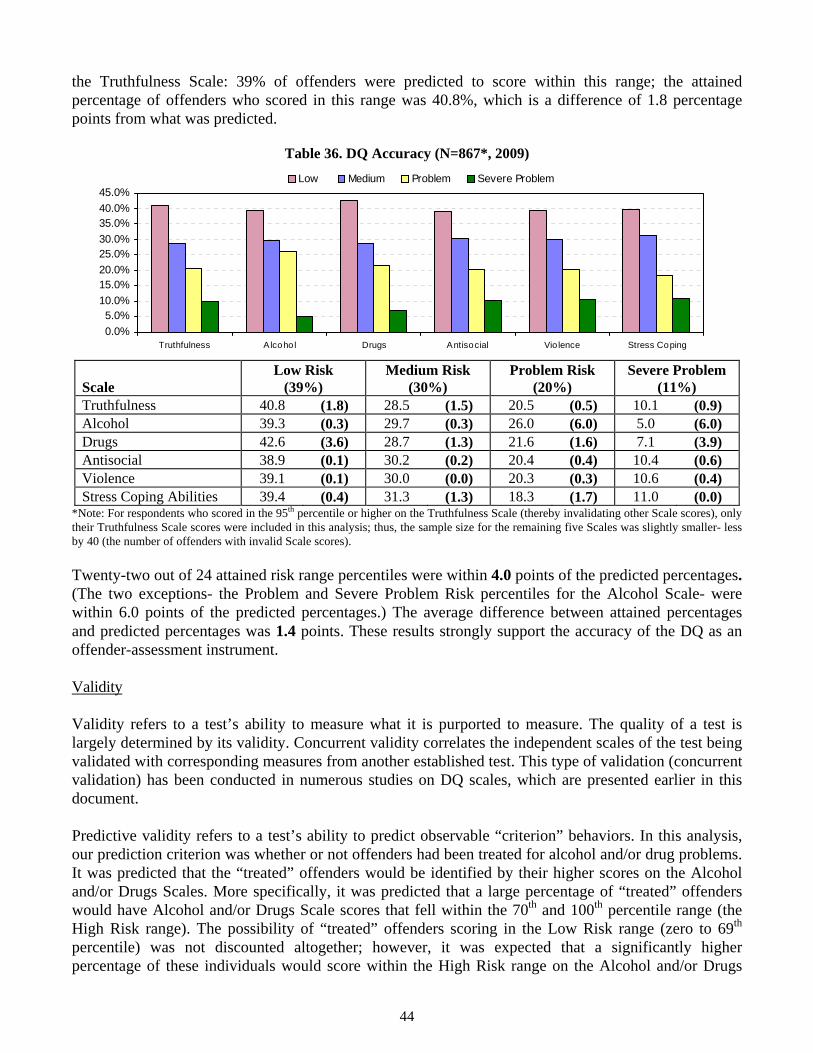
the Truthfulness Scale: 39% of offenders were predicted to score within this range; the attained percentage of offenders who scored in this range was 40.8%, which is a difference of 1.8 percentage points from what was predicted.
Table 36. DQ Accuracy (N=867*, 2009)
0.0%
5.0%10.0%
15.0%20.0%
25.0%30.0%
35.0%40.0%
45.0%
Truthfulness Alcohol Drugs Antisocial Vio lence Stress Coping
Low Medium Problem Severe Problem
Scale Low Risk
(39%) Medium Risk
(30%) Problem Risk
(20%) Severe Problem
(11%) Truthfulness 40.8 (1.8) 28.5 (1.5) 20.5 (0.5) 10.1 (0.9) Alcohol 39.3 (0.3) 29.7 (0.3) 26.0 (6.0) 5.0 (6.0) Drugs 42.6 (3.6) 28.7 (1.3) 21.6 (1.6) 7.1 (3.9) Antisocial 38.9 (0.1) 30.2 (0.2) 20.4 (0.4) 10.4 (0.6) Violence 39.1 (0.1) 30.0 (0.0) 20.3 (0.3) 10.6 (0.4) Stress Coping Abilities 39.4 (0.4) 31.3 (1.3) 18.3 (1.7) 11.0 (0.0)
*Note: For respondents who scored in the 95th percentile or higher on the Truthfulness Scale (thereby invalidating other Scale scores), only their Truthfulness Scale scores were included in this analysis; thus, the sample size for the remaining five Scales was slightly smaller- less by 40 (the number of offenders with invalid Scale scores). Twenty-two out of 24 attained risk range percentiles were within 4.0 points of the predicted percentages. (The two exceptions- the Problem and Severe Problem Risk percentiles for the Alcohol Scale- were within 6.0 points of the predicted percentages.) The average difference between attained percentages and predicted percentages was 1.4 points. These results strongly support the accuracy of the DQ as an offender-assessment instrument. Validity Validity refers to a test’s ability to measure what it is purported to measure. The quality of a test is largely determined by its validity. Concurrent validity correlates the independent scales of the test being validated with corresponding measures from another established test. This type of validation (concurrent validation) has been conducted in numerous studies on DQ scales, which are presented earlier in this document. Predictive validity refers to a test’s ability to predict observable “criterion” behaviors. In this analysis, our prediction criterion was whether or not offenders had been treated for alcohol and/or drug problems. It was predicted that the “treated” offenders would be identified by their higher scores on the Alcohol and/or Drugs Scales. More specifically, it was predicted that a large percentage of “treated” offenders would have Alcohol and/or Drugs Scale scores that fell within the 70th and 100th percentile range (the High Risk range). The possibility of “treated” offenders scoring in the Low Risk range (zero to 69th percentile) was not discounted altogether; however, it was expected that a significantly higher percentage of these individuals would score within the High Risk range on the Alcohol and/or Drugs
44

Scales than the Low Risk range. The results of the analysis confirmed these predictions. The majority (91.7%) of offenders who had been treated for alcohol problems scored in the High Risk range on the Alcohol Scale. Additionally, the majority (91.3%) of the offenders who had been treated for drug problems scored in the High Risk range on the Drugs Scale. These findings indicate that the Alcohol and Drugs Scales accurately identify offenders who have been treated for alcohol and/or drug problems, thus providing support for the predictive validity of the DQ.
In a second validity analysis, the prediction criterion was offender status. By comparing the scale scores of First and Multiple Offenders, the analysis examined whether test scales could distinguish between offenders with known different levels of problem severity. It was predicted that Multiple Offenders would obtain significantly higher scale scores than First Offenders. T-test results (presented in Table 37) revealed that Multiple Offenders did indeed score significantly higher than First Offenders on the Alcohol Scale, Drugs Scale, Violence Scale, Antisocial Scale, and Stress Coping Abilities Scale (on which higher scores indicate poorer stress coping abilities).
Table 37. Independent Samples t-test Results (N=867*, 2009)
Scale Mean Scores
First Offenders Mean Scores
Multiple Offenders t-value
Cohen’s d (effect size)
Truthfulness 53.0 45.5 3.38 0.26* Alcohol 28.5 53.0 -9.92 0.77** Drugs 32.9 56.6 -8.34 0.67** Antisocial 29.4 55.6 -15.08 1.15*** Violence 44.2 67.3 -14.44 1.17*** Stress Coping Abilities 44.6 52.5 -3.51 0.29*
*Small effect; **Medium effect; ***Large effect *Note: For respondents who scored in the 95th percentile or higher on the Truthfulness Scale (thereby invalidating other Scale scores), only their Truthfulness Scale scores were included in this analysis; thus, the sample size for the remaining five Scales was slightly smaller- less by 40 (the number of offenders with invalid Scale scores). These results strongly support the predictive validity of the Defendant Questionnaire. This is important because it shows that the Alcohol, Drugs, Violence, Antisocial, and Stress Coping Abilities Scales do accurately measure levels of severity. The scales effectively discriminate between offenders who are known to have more severe problems (Multiple Offenders) and First Offenders. Substance Abuse/Dependency Scale The DQ Substance Abuse/Dependency Scale classifies offenders as “substance dependent”, “substance abuse” or non-problematic according to their responses regarding DSM-IV criteria. Offenders are classified “substance abuse” if they admit to one or more of the four abuse criteria (symptoms). These DSM-IV criteria are discussed in the DQ Orientation and Training Manual. Offenders are classified “substance dependent” if they admit to three or more of the seven dependency criteria (symptoms) or if they have ever been diagnosed “substance dependent” in the past. (According to DSM-IV methodology, once an individual is diagnosed “dependent”, that diagnosis applies for the rest of his/her life.) The DSM-IV substance abuse and substance dependency criteria literally reflect these scales as presented in the DSM-IV, and are widely used for classification purposes.
45

DSM-IV Classification
Classification Males % Females % Total N % Non-Problematic 33.1 29.1 277 31.9
Substance Abuse 22.5 13.3 175 20.2
Substance Dependent 44.4 57.6 409 47.2
Diagnosed dependent in past 30.0 33.2 265 30.6
The table above shows that almost half of the sample was classified as “substance dependent” according to DSM-IV criteria. Additionally, 30.6 percent of the sample had been diagnosed “substance dependent” in the past. Just over twenty percent of offenders were classified as substance abusers, and just over thirty percent were classified as non-problematic. More than two thirds of offenders were classified as either “substance dependent” or “substance abuse”.
When Offender status is considered, 55.8% of Multiple Offenders were diagnosed “substance dependent”, and 20.2 percent were diagnosed “substance abuse”. Additionally, 38.8 percent had been diagnosed “substance dependent” in the past. Twenty-four percent of Multiple Offenders were classified as non-problematic.
Unlike Multiple Offenders, the majority of First Offenders (50.7%) were classified as non-problematic. An additional 22.4 percent of First Offenders were diagnosed “substance abuse”, and only 26.9 percent were diagnosed “substance dependent”. The percentage of Multiple Offenders that had been diagnosed “substance dependent” in the past was almost four times that of First Offenders (10.0%).
The results of chi-square analyses indicated that the differences between the percentages of First Offenders and Multiple Offenders that were classified “substance dependent”, χ²(1) = 53.43, p <.001, V= .26, “substance dependent” in the past, χ²(1) = 61.72, p <.001, V= .28, and non-problematic, χ²(1) = 53.31, p <.001, V= .26, were all statistically significant. 28. Study of DQ Accuracy, Reliability, and Validity in a Large Sample This study (2010) examined Defendant Questionnaire (DQ) test statistics in a sample of offenders tested by courts in a southwestern US state. Test data was gathered from April of 2008 through April of 2009. There were 3,681 defendants included. DQ reliability, validity and accuracy were examined. Method Participants in this study (2010) consisted of 3,681 defendants. There were 2,684 (73.1%) males and 987 (26.9%) females [there were 10 cases with missing gender information]. Demographic composition of the sample follows. Age: 20 & under (15.3%); 21-30 (40.2%); 31-40 (22.3%); 41-50 (16.5%); 51-60 (4.8%); 61 & Over (0.9%). Ethnicity: Caucasian (72.8%); African American (12.4%); Hispanic (4.3%); Asian (0.9%); Native American (8.8%); Other (0.8%). Education: Eighth grade or less (3.5%); Some H.S. (20.5%); H.S. graduate/GED (58.5%); Trade/technical school (9.7%); Some college (7.0%); College graduate (0.8%). Marital Status: Single (56.6%); Married (21.1%); Divorced (16.8%); Separated (4.5%); and Widowed (1.0%).
46
Court History and DQ Scale Scores Correlations give information regarding the strength of relationships. They show how closely two variables are associated with one another. Higher correlation coefficients signify strong relationships between the variables. Alcohol Scale scores were most closely associated with the number of DUI arrests. A strong positive correlation indicated that higher Alcohol Scale scores are associated with a higher number of DUI arrests, r(3623)=.44, p<.001. Drugs Scale scores were most highly correlated with the number of drug-related arrests, r(3674)=.37, p<.001. Higher Drugs Scale scores are strongly associated with a higher number of drug-related arrests. Violence Scale scores and Antisocial Scale scores were most closely associated with the number of times sentenced to prison. Strong positive correlations demonstrated that higher scores on the Violence Scale, r(3671)= .36, p<.001, and Antisocial Scale, r(3671)=.35, p<.001, are both associated with a greater number of prison sentences. Stress Coping Abilities Scale scores were most highly correlated with the number of months employed in the past 12 months, r(3649)=-.10, p<.001. The positive relationship indicates that higher (better) Stress Coping Abilities Scale scores are associated with a longer length of employment. Reliability Test reliability refers to a scale’s consistency of measurement. A scale is reliable if a person gets the same score when re-tested as he/she did when originally tested. Reliability ranges from zero (no reliability) to 1.0 (perfect reliability). The professionally accepted standard for reliability is .75. Reliability coefficients for each DQ scale are presented in Table 38 on the following page.
Table 38. DQ Reliability (N=3,681, 2010)
Scale Alpha coefficient
Truthfulness Scale .88 Alcohol Scale .92 Drugs Scale .90 Antisocial Scale .84 Violence Scale .86 Stress Coping Abilities .92
All DQ scales have a reliability of .87 or higher. All scales’ coefficients exceed the professionally accepted standard of .75 and demonstrate excellent reliability. Accuracy Test accuracy is demonstrated by how close attained scale scores are to predicted scores. Four categories of risk are assigned: Low Risk (zero to 39th percentile), Medium Risk (40 to 69th percentile), Problem Risk (70 to 89th percentile), and Severe Problem Risk (90 to 100th percentile). The top row of Table 36 shows the percentages of offenders that were predicted to score within each risk range. The body of Table 36 presents actual attained risk category percentages. Differences between attained and predicted percentages are shown in bold in parentheses. For example, in terms of the Low Risk range for the Truthfulness Scale: 39% of offenders were predicted to score within this range; the attained
47
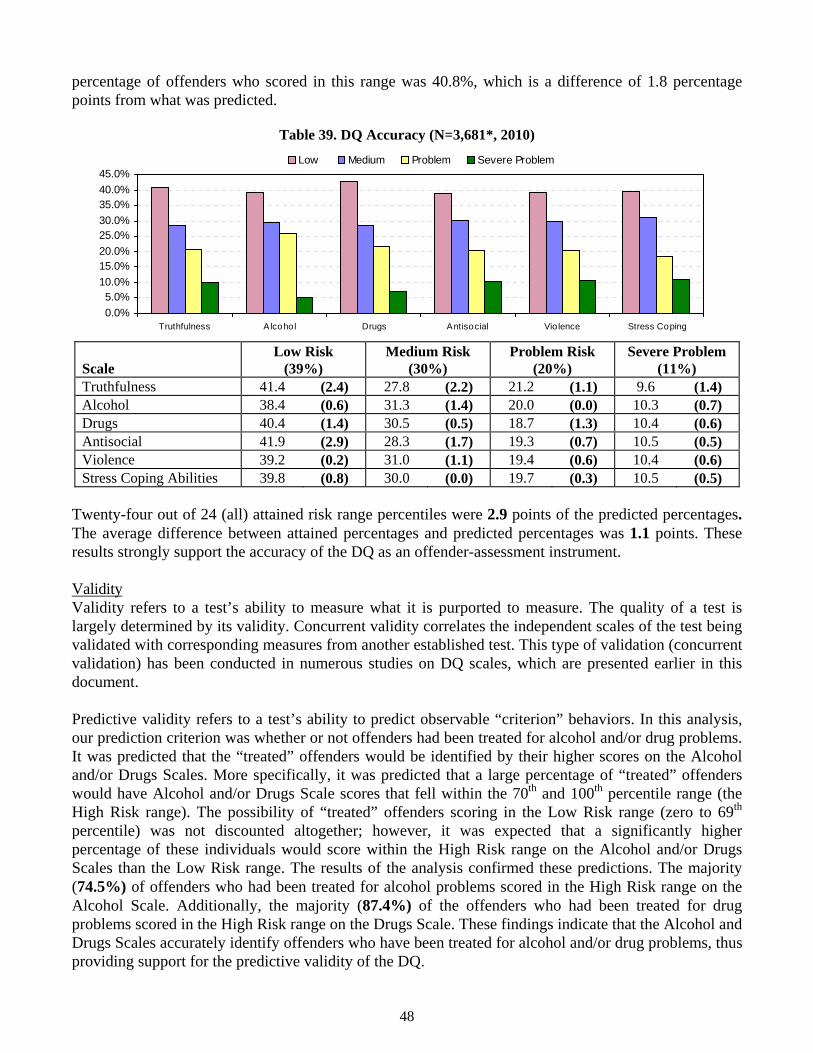
percentage of offenders who scored in this range was 40.8%, which is a difference of 1.8 percentage points from what was predicted.
Table 39. DQ Accuracy (N=3,681*, 2010)
0.0%
5.0%10.0%
15.0%20.0%
25.0%30.0%
35.0%40.0%
45.0%
Truthfulness Alcohol Drugs Antisocial Vio lence Stress Coping
Low Medium Problem Severe Problem
Scale Low Risk
(39%) Medium Risk
(30%) Problem Risk
(20%) Severe Problem
(11%) Truthfulness 41.4 (2.4) 27.8 (2.2) 21.2 (1.1) 9.6 (1.4) Alcohol 38.4 (0.6) 31.3 (1.4) 20.0 (0.0) 10.3 (0.7) Drugs 40.4 (1.4) 30.5 (0.5) 18.7 (1.3) 10.4 (0.6) Antisocial 41.9 (2.9) 28.3 (1.7) 19.3 (0.7) 10.5 (0.5) Violence 39.2 (0.2) 31.0 (1.1) 19.4 (0.6) 10.4 (0.6) Stress Coping Abilities 39.8 (0.8) 30.0 (0.0) 19.7 (0.3) 10.5 (0.5)
Twenty-four out of 24 (all) attained risk range percentiles were 2.9 points of the predicted percentages. The average difference between attained percentages and predicted percentages was 1.1 points. These results strongly support the accuracy of the DQ as an offender-assessment instrument. Validity Validity refers to a test’s ability to measure what it is purported to measure. The quality of a test is largely determined by its validity. Concurrent validity correlates the independent scales of the test being validated with corresponding measures from another established test. This type of validation (concurrent validation) has been conducted in numerous studies on DQ scales, which are presented earlier in this document. Predictive validity refers to a test’s ability to predict observable “criterion” behaviors. In this analysis, our prediction criterion was whether or not offenders had been treated for alcohol and/or drug problems. It was predicted that the “treated” offenders would be identified by their higher scores on the Alcohol and/or Drugs Scales. More specifically, it was predicted that a large percentage of “treated” offenders would have Alcohol and/or Drugs Scale scores that fell within the 70th and 100th percentile range (the High Risk range). The possibility of “treated” offenders scoring in the Low Risk range (zero to 69th percentile) was not discounted altogether; however, it was expected that a significantly higher percentage of these individuals would score within the High Risk range on the Alcohol and/or Drugs Scales than the Low Risk range. The results of the analysis confirmed these predictions. The majority (74.5%) of offenders who had been treated for alcohol problems scored in the High Risk range on the Alcohol Scale. Additionally, the majority (87.4%) of the offenders who had been treated for drug problems scored in the High Risk range on the Drugs Scale. These findings indicate that the Alcohol and Drugs Scales accurately identify offenders who have been treated for alcohol and/or drug problems, thus providing support for the predictive validity of the DQ.
48
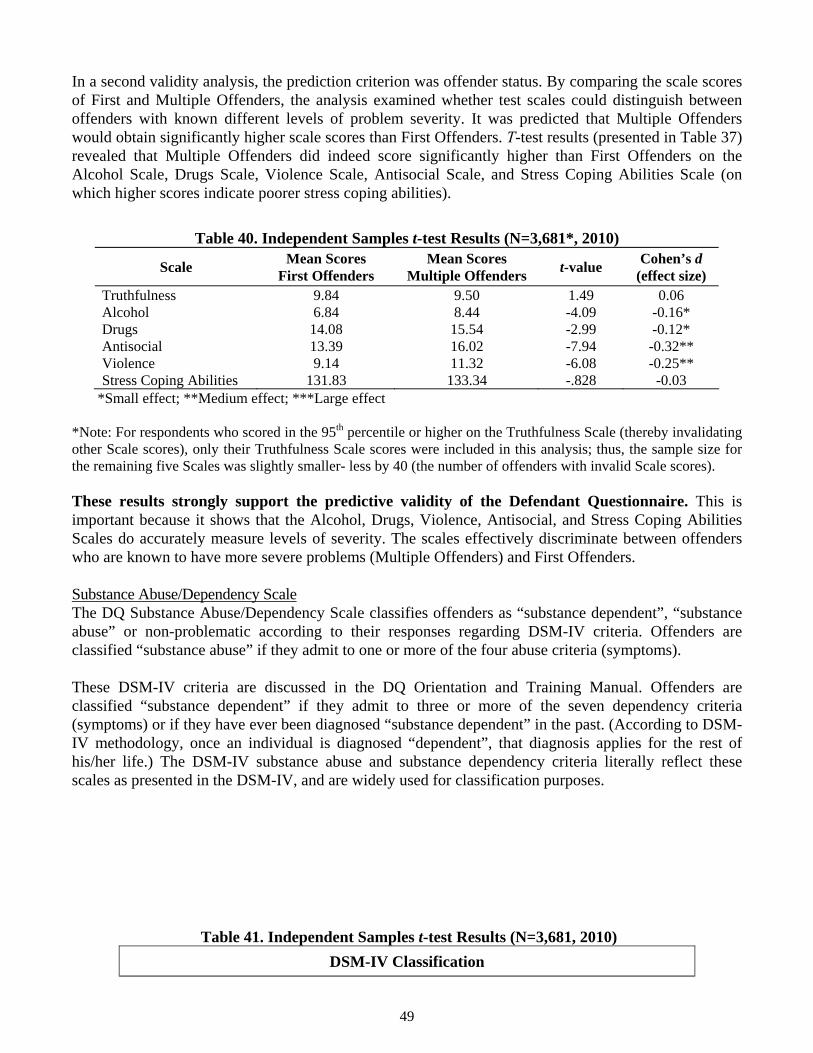
In a second validity analysis, the prediction criterion was offender status. By comparing the scale scores of First and Multiple Offenders, the analysis examined whether test scales could distinguish between offenders with known different levels of problem severity. It was predicted that Multiple Offenders would obtain significantly higher scale scores than First Offenders. T-test results (presented in Table 37) revealed that Multiple Offenders did indeed score significantly higher than First Offenders on the Alcohol Scale, Drugs Scale, Violence Scale, Antisocial Scale, and Stress Coping Abilities Scale (on which higher scores indicate poorer stress coping abilities).
Table 40. Independent Samples t-test Results (N=3,681*, 2010)
Scale Mean Scores
First Offenders Mean Scores
Multiple Offenders t-value
Cohen’s d (effect size)
Truthfulness 9.84 9.50 1.49 0.06 Alcohol 6.84 8.44 -4.09 -0.16* Drugs 14.08 15.54 -2.99 -0.12* Antisocial 13.39 16.02 -7.94 -0.32** Violence 9.14 11.32 -6.08 -0.25** Stress Coping Abilities 131.83 133.34 -.828 -0.03
*Small effect; **Medium effect; ***Large effect *Note: For respondents who scored in the 95th percentile or higher on the Truthfulness Scale (thereby invalidating other Scale scores), only their Truthfulness Scale scores were included in this analysis; thus, the sample size for the remaining five Scales was slightly smaller- less by 40 (the number of offenders with invalid Scale scores). These results strongly support the predictive validity of the Defendant Questionnaire. This is important because it shows that the Alcohol, Drugs, Violence, Antisocial, and Stress Coping Abilities Scales do accurately measure levels of severity. The scales effectively discriminate between offenders who are known to have more severe problems (Multiple Offenders) and First Offenders. Substance Abuse/Dependency Scale The DQ Substance Abuse/Dependency Scale classifies offenders as “substance dependent”, “substance abuse” or non-problematic according to their responses regarding DSM-IV criteria. Offenders are classified “substance abuse” if they admit to one or more of the four abuse criteria (symptoms). These DSM-IV criteria are discussed in the DQ Orientation and Training Manual. Offenders are classified “substance dependent” if they admit to three or more of the seven dependency criteria (symptoms) or if they have ever been diagnosed “substance dependent” in the past. (According to DSM-IV methodology, once an individual is diagnosed “dependent”, that diagnosis applies for the rest of his/her life.) The DSM-IV substance abuse and substance dependency criteria literally reflect these scales as presented in the DSM-IV, and are widely used for classification purposes.
Table 41. Independent Samples t-test Results (N=3,681, 2010)
DSM-IV Classification
49
50
Classification Males % Females % Total N % Non-Problematic 28.5 35.0 1,102 30.2
Substance Abuse 70.8 63.3 2,529 68.7
Substance Dependent 28.1 31.0 1,057 29.0
Diagnosed dependent in past 17.1 20.8 665 18.1
The table above shows that almost one-third of the sample was classified as “substance dependent” according to DSM-IV criteria. Additionally, 18.1 percent of the sample had been diagnosed “substance dependent” in the past. Nearly 70 percent of offenders were classified as substance abusers, and thirty percent were classified as non-problematic. The majority of offenders were classified as either “substance dependent” or “substance abuse”.
When Offender status is considered, 35.6 percent of Multiple Offenders were diagnosed “substance dependent”, and 64.5 percent were diagnosed “substance abuse”. Additionally, 21 percent had been diagnosed “substance dependent” in the past. Less than one-fourth (21.4%) of Multiple Offenders were classified as non-problematic.
Similar to Multiple Offenders, the majority of First Offenders (72.8%) were classified as substance abusers, but unlike Multiple Offenders, the second-largest proportion of First Offenders (32.6%) was classified as non-problematic. An additional 27.4 percent of First Offenders were diagnosed “substance dependent”. Only 17.2 percent of First offenders had been diagnosed “substance dependent” in the past.
The results of chi-square analyses indicated that the differences between the percentages of First Offenders and Multiple Offenders that were classified “substance dependent”, χ²(1) = 20.18, p <.001, V= .10, “substance abuse”, χ²(1) = 20.94, p <.001, V= .10, and non-problematic, χ²(1) = 37.38, p <.001, V= .11, were all statistically significant.
SUMMARY In conclusion, this document summarizes many studies and statistics that support the reliability and validity of the DQ. Based on this research, the DQ presents an accurate picture of substance (alcohol and other drugs) abusers and the risk they represent. The DQ provides a sound empirical foundation for responsible decision making. Summarized research demonstrates that the DQ is a reliable, valid and accurate instrument for court defendant assessment. It is reasonable to conclude that the DQ does what it purports to do. The DQ acquires a vast amount of relevant information for staff review prior to decision making. Empirically based scales are objective and accurate. Assessment has shifted from subjective opinions to objective accountability. The DQ is not a personality test, nor is it a clinical diagnostic instrument. Yet, it is much more than just another alcohol or drug test. The DQ is an adult risk and needs assessment instrument. Areas for future research are many and complex. DQ research continues to evaluate age, gender, ethnicity, education and first offenders vs. multiple offenders. Consistent with the foregoing, we encourage more research on demographic, cultural and environmental factors impacting on defendant adjustment, risk and need.