Embed Size (px)
Citation preview
DDEEFFEENNCCEE EECCOONNOOMMIICC TTRREENNDDSS IINN TTHHEE AASSIIAA––PPAACCIIFFIICC 22000088
© Commonwealth of Australia 2008 ISSN 1835-386X (Print) ISSN 1835-3878 (Online)
This work is copyright. Apart from any use as permitted under the Copyright Act 1968, no part may be reproduced by any process without prior written permission from the Commonwealth.
Requests and inquiries concerning reproduction and rights should be addressed to:
Commonwealth Copyright Administration, Attorney General’s Department, Robert Garran Offices, National Circuit, Barton ACT 2600
or posted at http://www.ag.gov.au/cca
iii
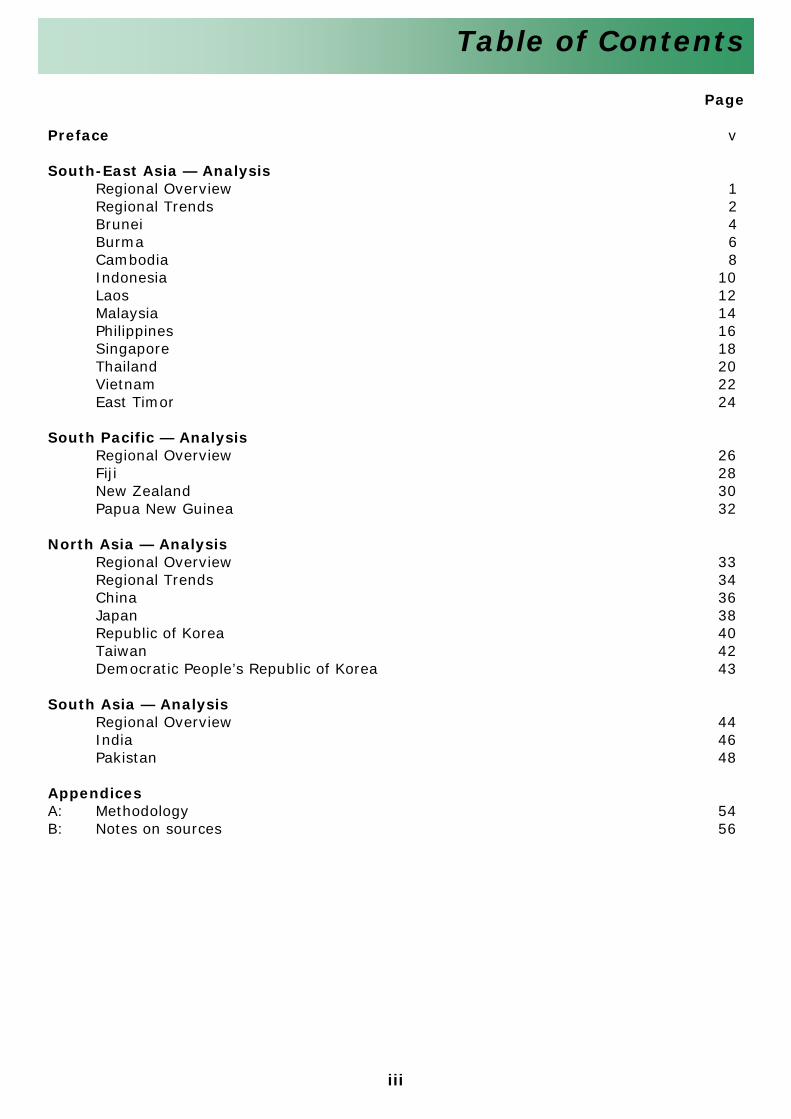
Table of Contents
Page Preface v South-East Asia — Analysis
Regional Overview 1 Regional Trends 2 Brunei 4 Burma 6 Cambodia 8 Indonesia 10 Laos 12 Malaysia 14 Philippines 16 Singapore 18 Thailand 20 Vietnam 22 East Timor 24
South Pacific — Analysis
Regional Overview 26 Fiji 28 New Zealand 30 Papua New Guinea 32
North Asia — Analysis
Regional Overview 33 Regional Trends 34 China 36 Japan 38 Republic of Korea 40 Taiwan 42 Democratic People’s Republic of Korea 43
South Asia — Analysis Regional Overview 44 India 46 Pakistan 48
Appendices A: Methodology 54 B: Notes on sources 56
iv
Table of Contents
Tables
Page South-East Asia
Brunei 3 Burma 5 Cambodia 7 Indonesia 9 Laos 11 Malaysia 13 Philippines 15 Singapore 17 Thailand 19 Vietnam 21 East Timor 23
South Pacific
Fiji 27 New Zealand 29 Papua New Guinea 31
North Asia
China 35 Japan 37 Republic of Korea 39 Taiwan 41
South Asia
India 45 Pakistan 47
Australia 50
North America
Canada 52 United States of America 53
v
Preface
Aims The Defence Economic Trends analyses significant trends in defence funding in the Asia-Pacific region. It draws together official defence budgets and national economic data to enable comparisons between countries and over time. Methodology This edition of the Defence Economic Trends in the Asia–Pacific has been updated from the previous methodology introduced in 2000 to compare defence funding trends in the region. Underpinning much of the analysis in this publication are a series of defence spending deflators that are used to convert nominal official defence budgets into constant 2005 terms. While there are some limitations to undertaking expenditure comparisons, our estimates aim to give readers the best available guide to the overall trend for spending on regional armed forces in real terms. For an explanation of the model, and notes on comparing expenditure over time and between countries, please refer to Appendix A. Statistical notes All defence expenditure figures relate to official defence budget estimates unless otherwise stated. Gross domestic product (GDP) and defence budgets are provided both in nominal terms and in constant US dollar terms, to enable comparisons to be made over time and between countries. Online version This publication is available on-line at the Department of Defence’s website: www.defence.gov.au/dio/product.html Feedback We encourage readers to comment on this publication, via the feedback sheet provided, so we can improve next year's edition. If you have any questions in relation to Defence Economic Trends 2008 please contact us direct by phone or fax at:
Defence Intelligence Organisation Telephone: +61 2 6127 5262 Facsimile: +61 2 6127 5086
1
South-East Asia – Regional Overview
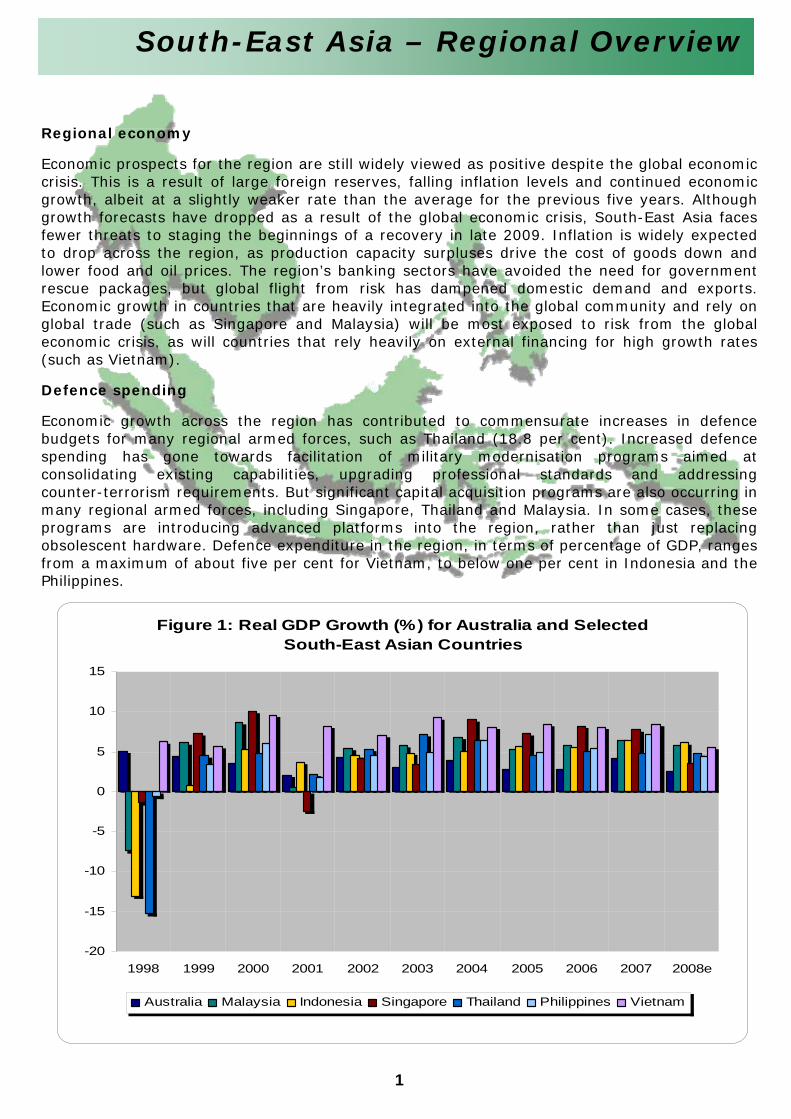
Figure 1: Real GDP Growth (%) for Australia and Selected South-East Asian Countries
-20
-15
-10
-5
0
5
10
15
1998 1999 2000 2001 2002 2003 2004 2005 2006 2007 2008e
Australia Malaysia Indonesia Singapore Thailand Philippines Vietnam
Regional economy
Economic prospects for the region are still widely viewed as positive despite the global economiccrisis. This is a result of large foreign reserves, falling inflation levels and continued economicgrowth, albeit at a slightly weaker rate than the average for the previous five years. Althoughgrowth forecasts have dropped as a result of the global economic crisis, South-East Asia facesfewer threats to staging the beginnings of a recovery in late 2009. Inflation is widely expectedto drop across the region, as production capacity surpluses drive the cost of goods down andlower food and oil prices. The region’s banking sectors have avoided the need for governmentrescue packages, but global flight from risk has dampened domestic demand and exports.Economic growth in countries that are heavily integrated into the global community and rely onglobal trade (such as Singapore and Malaysia) will be most exposed to risk from the globaleconomic crisis, as will countries that rely heavily on external financing for high growth rates(such as Vietnam).
Defence spending
Economic growth across the region has contributed to commensurate increases in defencebudgets for many regional armed forces, such as Thailand (18.8 per cent). Increased defencespending has gone towards facilitation of military modernisation programs aimed atconsolidating existing capabilities, upgrading professional standards and addressingcounter-terrorism requirements. But significant capital acquisition programs are also occurring inmany regional armed forces, including Singapore, Thailand and Malaysia. In some cases, theseprograms are introducing advanced platforms into the region, rather than just replacingobsolescent hardware. Defence expenditure in the region, in terms of percentage of GDP, rangesfrom a maximum of about five per cent for Vietnam, to below one per cent in Indonesia and thePhilippines.
2
South-East Asia – Regional Trends
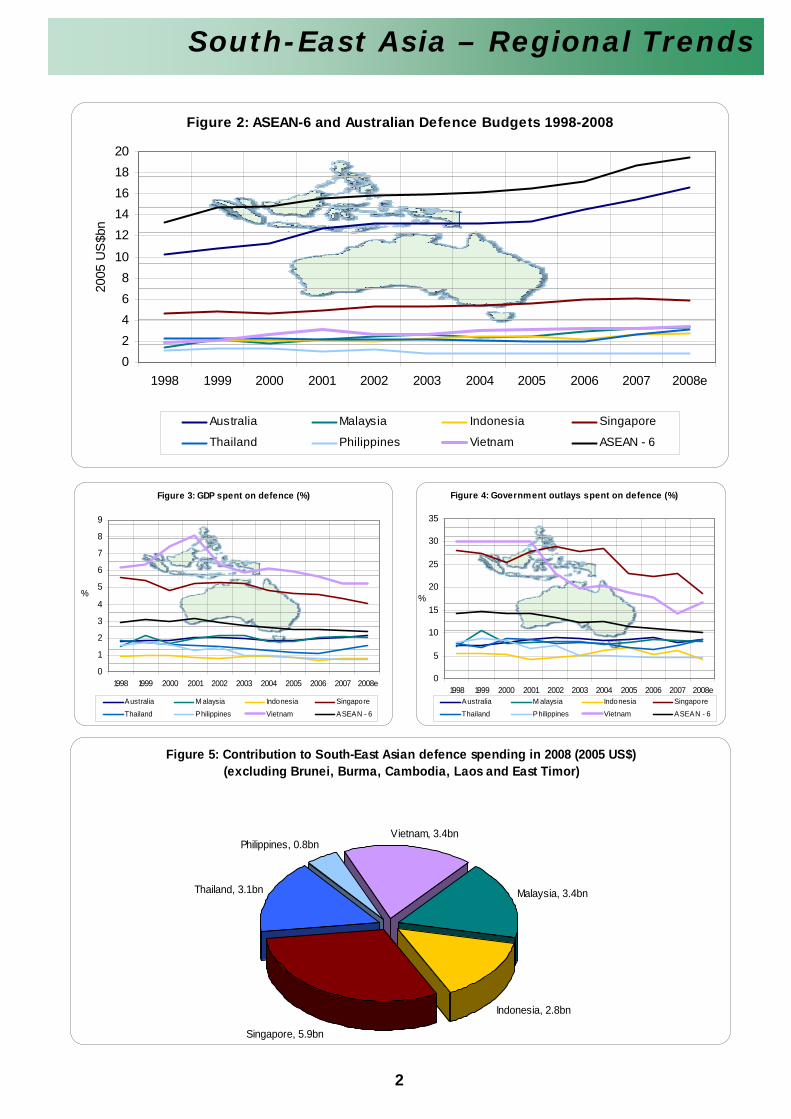
Figure 2: ASEAN-6 and Australian Defence Budgets 1998-2008
02468
10
1214161820
1998 1999 2000 2001 2002 2003 2004 2005 2006 2007 2008e
2005
US
$bn
Australia Malaysia Indonesia Singapore
Thailand Philippines Vietnam ASEAN - 6
Figure 5: Contribution to South-East Asian defence spending in 2008 (2005 US$)(excluding Brunei, Burma, Cambodia, Laos and East Timor)
Singapore, 5.9bn
Indonesia, 2.8bn
Malaysia, 3.4bn
Vietnam, 3.4bn
Thailand, 3.1bn
Philippines, 0.8bn
Figure 3: GDP spent on defence (%)
0
1
2
3
4
5
6
7
8
9
1998 1999 2000 2001 2002 2003 2004 2005 2006 2007 2008e
%
Australia M alaysia Indonesia Singapore
Thailand Philippines Vietnam ASEAN - 6
Figure 4: Government outlays spent on defence (%)
0
5
10
15
20
25
30
35
1998 1999 2000 2001 2002 2003 2004 2005 2006 2007 2008e
%
Australia M alaysia Indonesia Singapore
Thailand Philippines Vietnam ASEAN - 6
3
19
98
19
99
20
00
20
01
20
02
20
03
20
04
20
05
20
06
20
07
20
08
e
Off
icia
l D
efe
nce
Bu
dg
et:
Curr
ent
B$ b
n0.6
0.6
0.5
0.5
0.5
0.4
0.5
0.5
0.5
0.5
0.5
2005 B
$ b
n0.7
0.8
0.5
0.6
0.5
0.5
0.5
0.5
0.5
0.5
0.4
2005 U
S$ b
n0.4
0.5
0.3
0.3
0.3
0.3
0.3
0.3
0.3
0.3
0.3
Rea
l G
row
th (
%)
16.3
5.0
(30.2
)1.6
(0.5
)(4
.1)
(3.5
)1.0
(4.4
)0.1
(14.1
)
Perc
enta
ge
of
Rea
l G
DP
5.5
5.6
3.8
3.7
3.6
3.3
3.2
3.2
3.0
2.9
2.5
Perc
enta
ge
of
Nom
inal
Gove
rnm
ent
Spen
din
g10.0
10.9
14.6
11.6
11.6
9.4
11.5
10.7
10.1
9.9
9.8
Per
capita
(2005 U
S$)
1,4
35.9
1,4
74.1
1,0
03.5
995.1
966.5
905.6
852.3
833.0
779.3
765.8
644.7
GD
P:
Curr
ent
B$ b
n6.8
7.8
10.3
10.0
10.5
11.4
13.3
15.9
18.2
18.5
24.1
2005 U
S$ b
n (
Rea
l G
DP)
8.1
8.4
8.6
8.8
9.2
9.4
9.5
9.5
10.0
10.0
10.0
Rea
l gro
wth
(%
)(7
.5)
3.1
2.9
2.7
3.9
2.9
0.5
0.4
4.4
0.6
(0.5
)Pe
r ca
pita
(2005 U
S$)
26,1
79.7
26,3
83.3
26,4
68.1
26,5
40.2
26,9
22.0
27,0
68.4
26,5
21.8
25,7
60.4
26,3
25.0
26,0
01.4
25,3
45.8
Go
vern
men
t s p
en
din
g (
curr
en
t B
$ b
n)
5.5
5.5
3.2
4.0
3.9
4.8
4.0
4.8
5.1
5.2
5.3
Po
pu
lati
on
(m
)0.3
0.3
0.3
0.3
0.3
0.3
0.4
0.4
0.4
0.4
0.4
Infl
ati
on
(an
nu
al
% c
han
ge)
(0.4
)(0
.0)
1.2
0.6
(2.3
)0.3
0.9
1.1
0.2
0.3
0.8
Gro
wth
in D
efen
ce S
pen
din
g v
s G
row
th in G
DP
(Annual
% C
han
ge)
(40.0
)
(30.0
)
(20.0
)
(10.0
)
0.0
10.0
20.0
1998
1999
2000
2001
2002
2003
2004
2005
2006
2007
2008e
%
Rea
l G
row
th in D
efen
ce S
pen
din
gRea
l G
row
th in G
DP
Perc
enta
ge
of N
om
inal
Gove
rnm
ent
Spen
din
g o
n D
efen
ce
0.0
2.0
4.0
6.0
8.0
10.0
12.0
14.0
16.0
1998
1999
2000
2001
2002
2003
2004
2005
2006
2007
2008e
%
Bru
nei
Dar
uss
alam
— D
efen
ce a
nd E
conom
ic T
rends
1998—
2008
4
Brunei
EEccoonnoommyy
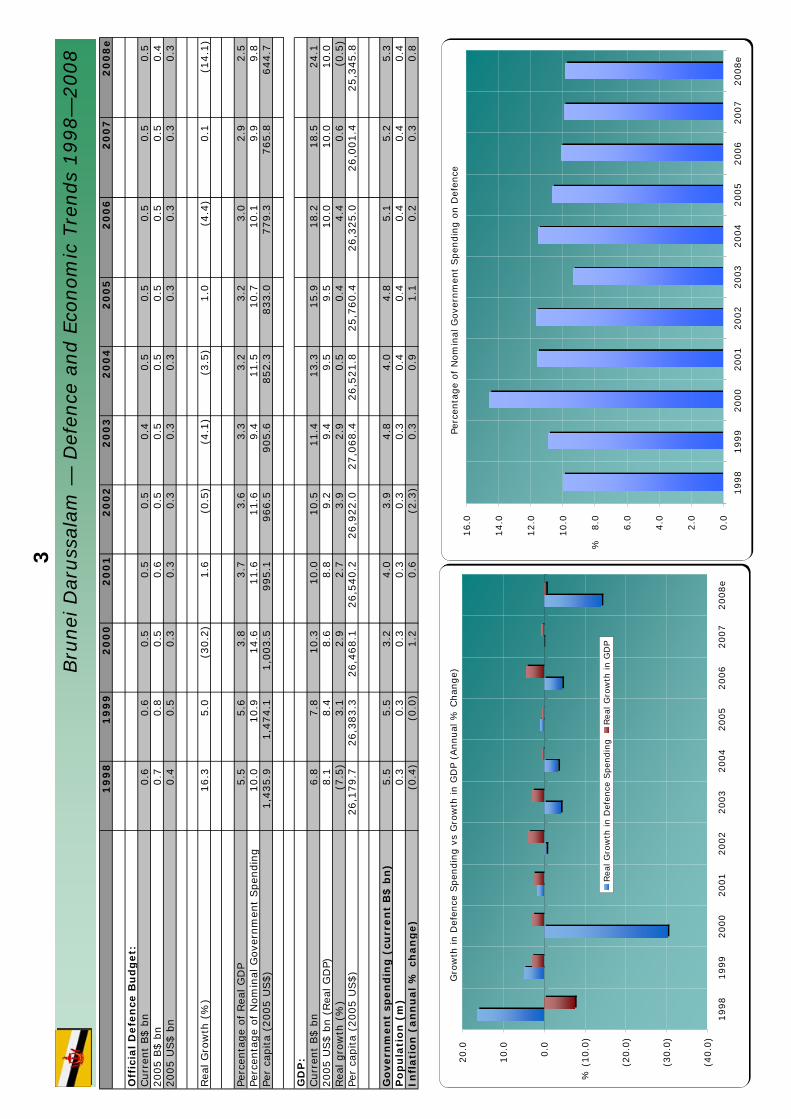
Brunei’s economy is based on oil and gas. Revenue from its energy resources and income from overseas investment has enabled Brunei to build a prosperous state, despite recording relatively prudent levels of economic growth over the last two decades – averaging 1.2 per cent per annum. Per capita income levels are among the highest in the region, and attract expatriate skills and labour. As oil and gas reserves decline, Brunei is attempting to expand its financial services and tourism sectors. While Brunei is currently largely shielded from many of the direct impacts of the global economic crisis, the decline in global oil prices is impacting government revenues and the International Monetary Fund is forecasting an economic contraction of 1.5 per cent in 2008, and an average growth rate of about 0.4 per cent per annum out to 2010.
DDeeffeennccee ssppeennddiinngg
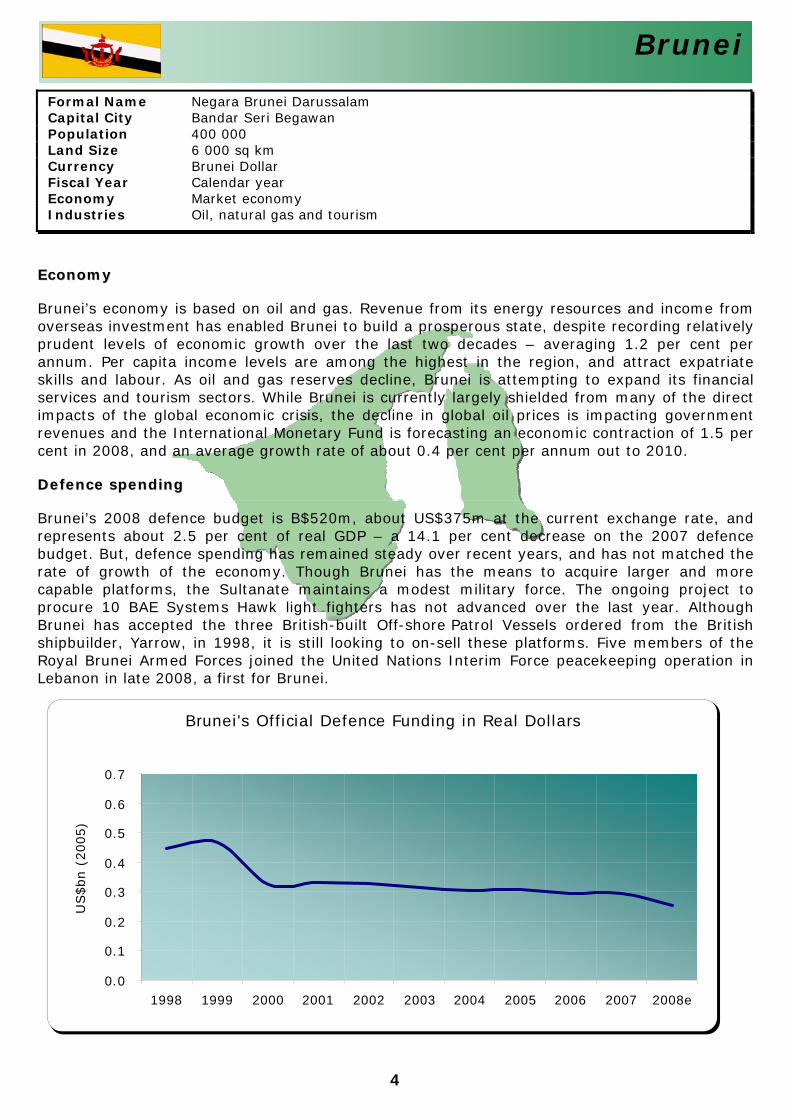
Brunei’s 2008 defence budget is B$520m, about US$375m at the current exchange rate, and represents about 2.5 per cent of real GDP – a 14.1 per cent decrease on the 2007 defence budget. But, defence spending has remained steady over recent years, and has not matched the rate of growth of the economy. Though Brunei has the means to acquire larger and more capable platforms, the Sultanate maintains a modest military force. The ongoing project to procure 10 BAE Systems Hawk light fighters has not advanced over the last year. Although Brunei has accepted the three British-built Off-shore Patrol Vessels ordered from the British shipbuilder, Yarrow, in 1998, it is still looking to on-sell these platforms. Five members of the Royal Brunei Armed Forces joined the United Nations Interim Force peacekeeping operation in Lebanon in late 2008, a first for Brunei.
Brunei's Official Defence Funding in Real Dollars
0.0
0.1
0.2
0.3
0.4
0.5
0.6
0.7
1998 1999 2000 2001 2002 2003 2004 2005 2006 2007 2008e
US$bn (
2005)
Formal Name Negara Brunei Darussalam Capital City Bandar Seri Begawan Population 400 000 Land Size 6 000 sq km Currency Brunei Dollar Fiscal Year Calendar year Economy Market economy Industries Oil, natural gas and tourism
5
19
98
19
99
20
00
20
01
20
02
20
03
20
04
20
05
20
06
20
07
e2
00
8e
Off
icia
l D
efe
nce
Bu
dg
et:
Curr
ent
Kya
ts b
n24.4
31.8
29.8
33.3
37.0
38.0
40.0
40.0
40.0
55.3
74.4
2005 K
yats
bn
80.9
90.2
84.1
72.8
54.0
45.2
45.9
40.0
32.5
33.5
33.5
2005 U
S$ b
n0.0
60.0
70.0
60.0
60.0
40.0
30.0
40.0
30.0
20.0
30.0
3
Rea
l G
row
th (
%)
(11.3
)11.6
(6.7
)(1
3.5
)(2
5.8
)(1
6.3
)1.5
(12.9
)(1
8.8
)3.3
(0.0
)
Perc
enta
ge
of Rea
l G
DP
1.5
1.5
1.3
1.0
0.6
0.5
0.4
0.3
0.2
0.2
0.2
Perc
enta
ge
of N
om
inal
Govt
. Spen
din
g36.5
44.8
36.2
37.6
43.3
39.1
36.2
32.0
29.9
29.3
28.7
Per
capita
(2005 U
S$)
1.3
1.4
1.3
1.1
0.8
0.7
0.7
0.6
0.4
0.4
0.4
GD
P:
Curr
ent
Kya
ts b
n1,6
09.8
2,1
90.3
2,5
52.7
3,5
48.5
5,6
25.3
7,7
16.6
9,0
78.9
12,2
86.8
16,7
15.7
23,6
06.0
32,3
97.0
2005 U
S$ b
n (
Rea
l G
DP)
4.1
4.5
5.2
5.7
6.4
7.3
8.3
9.5
10.7
11.2
11.5
Rea
l gro
wth
(%
)0.7
10.9
13.7
11.3
12.0
13.8
13.6
13.6
12.7
5.5
2.0
Per
capita
(2005 U
S$)
84.9
92.3
102.9
114.6
123.4
137.6
153.2
170.6
188.5
194.9
194.9
Go
vern
men
t sp
en
din
g (
curr
en
t K
yats
bn
)66.9
71.0
82.3
88.7
85.5
97.3
110.5
125.1
133.9
189.1
259.5
Po
pu
lati
on
(m
)48.2
49.1
50.1
50.1
52.2
53.2
54.3
55.4
56.5
57.6
58.8
Infl
ati
on
(an
nu
al
% c
han
ge)
49.1
10.9
(1.7
)34.5
58.1
24.9
3.8
10.7
25.7
33.9
34.5
Gro
wth
in D
efen
ce S
pen
din
g v
s G
row
th in G
DP
(Annual
% C
han
ge)
(30.0
)
(25.0
)
(20.0
)
(15.0
)
(10.0
)
(5.0
)
0.0
5.0
10.0
15.0
20.0
1998
1999
2000
2001
2002
2003
2004
2005
2006
2007e
2008e
%
Rea
l G
row
th in D
efen
ce S
pen
din
gRea
l G
row
th in G
DP
Perc
enta
ge
of N
om
inal
Gove
rnm
ent
Spen
din
g o
n D
efen
ce
0.0
5.0
10.0
15.0
20.0
25.0
30.0
35.0
40.0
45.0
50.0
1998
1999
2000
2001
2002
2003
2004
2005
2006
2007e
2008e
%Burm
a —
Def
ence
and E
conom
ic T
rends
1998—
2008
6
Burma
EEccoonnoommyy
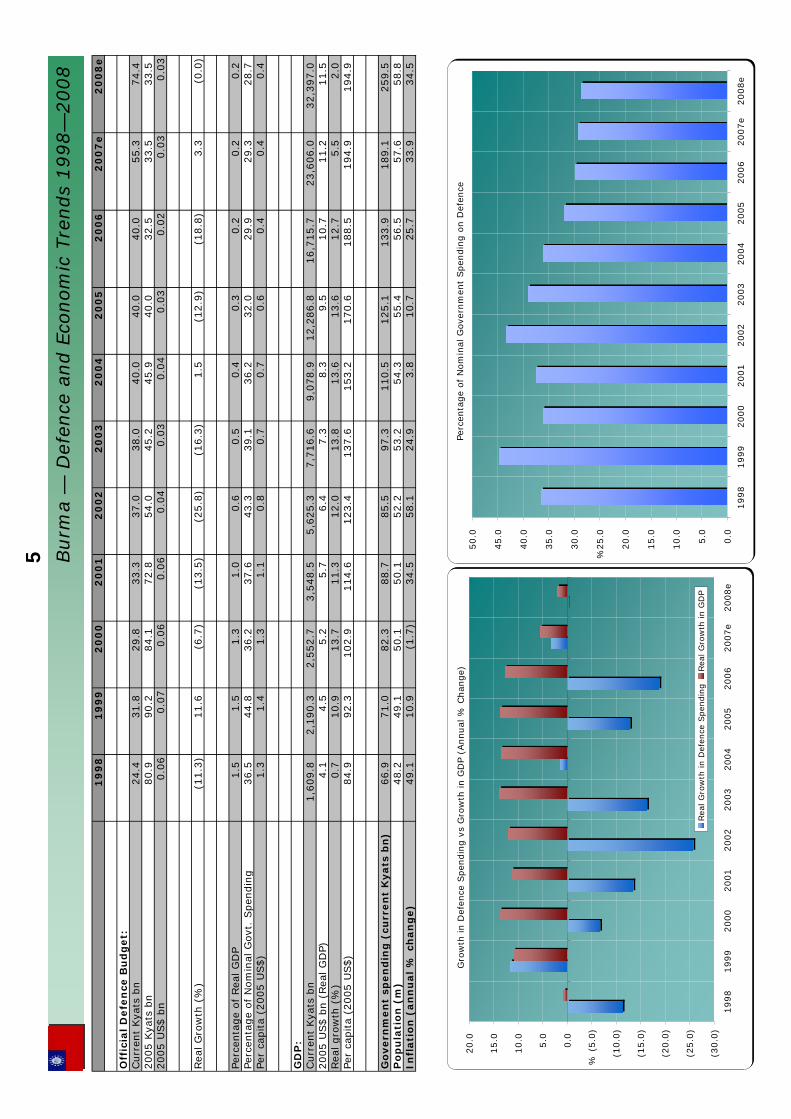
Burma is rich in natural resources and despite nearly three decades of modest economic growth (recording an average growth rate of about 6.5 per cent per annum), decades of political instability, administrative challenges and economic isolation have steadily eroded national infrastructure, public services and living standards. It is estimated that a quarter of the population live below the poverty line. Almost a decade of trade and economic sanctions has left Burma with high foreign debt and fiscal problems. The regime is developing its off-shore gas resources, which find a ready market in China and India. In 2008, vast areas of Burma’s rice growing areas were impacted by Cyclone Nargis. Given its reliance on export income from energy and food commodities, Burma’s economy will be directly impacted by the global economic crisis. Burma’s economic growth is predicted to decline from 11.9 per cent in 2007 to an average of 4.5 per cent per annum out to 2010, according to the International Monetary Fund – on the back of significant declines in global energy and rice prices.
DDeeffeennccee ssppeennddiinngg
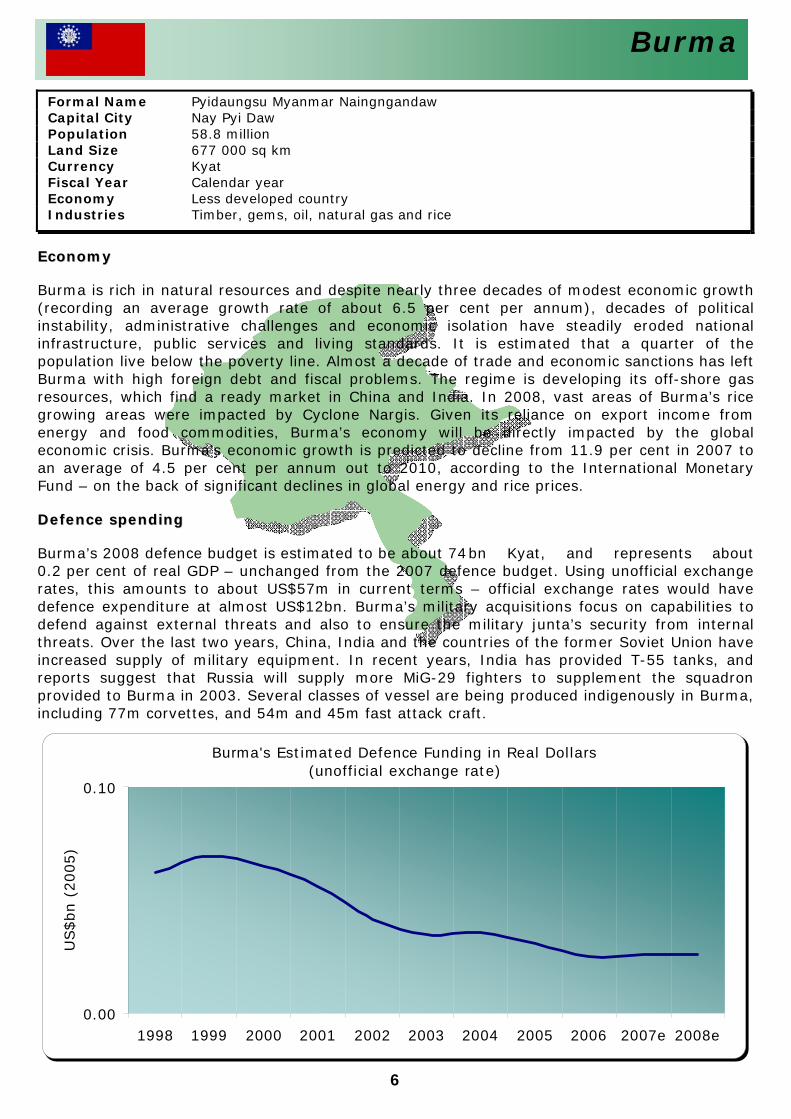
Burma’s 2008 defence budget is estimated to be about 74 bn Kyat, and represents about 0.2 per cent of real GDP – unchanged from the 2007 defence budget. Using unofficial exchange rates, this amounts to about US$57m in current terms – official exchange rates would have defence expenditure at almost US$12bn. Burma’s military acquisitions focus on capabilities to defend against external threats and also to ensure the military junta’s security from internal threats. Over the last two years, China, India and the countries of the former Soviet Union have increased supply of military equipment. In recent years, India has provided T-55 tanks, and reports suggest that Russia will supply more MiG-29 fighters to supplement the squadron provided to Burma in 2003. Several classes of vessel are being produced indigenously in Burma, including 77m corvettes, and 54m and 45m fast attack craft.
Burma's Estimated Defence Funding in Real Dollars (unofficial exchange rate)
0.00
0.10
1998 1999 2000 2001 2002 2003 2004 2005 2006 2007e 2008e
US$bn (
2005)
Formal Name Pyidaungsu Myanmar Naingngandaw Capital City Nay Pyi Daw Population 58.8 million Land Size 677 000 sq km Currency Kyat Fiscal Year Calendar year Economy Less developed country Industries Timber, gems, oil, natural gas and rice
7
19
98
19
99
20
00
20
01
20
02
20
03
20
04
20
05
20
06
20
07
20
08
e
Off
icia
l D
efe
nce
Bu
dg
et:
Curr
ent
Rie
ls b
n281.0
330.0
311.2
277.5
265.0
268.0
278.0
456.0
503.0
557.0
692.7
2005 R
iels
bn
328.8
375.3
361.1
317.4
297.2
296.2
294.4
456.0
480.5
501.1
529.2
2005 U
S$ b
n0.0
80.0
90.0
90.0
80.0
70.0
70.0
70.1
10.1
20.1
20.1
3
Rea
l G
row
th (
%)
(11.2
)14.1
(3.8
)(1
2.1
)(6
.4)
(0.3
)(0
.6)
54.9
5.4
4.3
5.6
Perc
enta
ge
of Rea
l G
DP
2.4
2.5
2.2
1.8
1.6
1.4
1.3
1.8
1.7
1.6
1.6
Perc
enta
ge
of N
om
inal
Gove
rnm
ent.
Spen
din
g19.4
22.1
13.2
11.8
10.9
9.7
9.5
13.1
13.3
14.0
15.2
Per
capita
(2005 U
S$)
6.6
7.4
7.0
6.0
5.5
5.4
5.3
8.1
8.3
8.5
8.9
GD
P:
Curr
ent
Rie
ls b
n11,7
18.8
13,3
76.1
14,0
82.6
15,6
33.2
16,7
80.5
18,5
35.2
21,4
38.3
25,7
54.3
29,8
49.1
35,0
39.3
43,2
93.0
2005 U
S$ b
n (
Rea
l G
DP)
3.3
3.7
4.0
4.4
4.6
5.0
5.6
6.3
7.0
7.7
8.2
Rea
l gro
wth
(%
)1.4
12.1
8.8
8.1
6.6
8.5
10.3
13.3
10.8
10.2
7.0
Per
capita
(2005 U
S$)
270.9
296.8
317.6
337.8
354.1
377.9
409.9
455.1
492.2
535.7
563.7
Go
vern
men
t sp
en
din
g (
curr
en
t R
iels
bn
)1,4
45.0
1,4
95.0
2,3
55.0
2,3
44.0
2,4
41.8
2,7
59.0
2,9
37.0
3,4
80.0
3,7
84.0
3,9
77.0
4,5
52.3
Po
pu
lati
on
(m
)12.2
12.5
12.7
12.9
13.1
13.3
13.6
13.8
14.2
14.3
14.6
Infl
ati
on
(an
nu
al %
ch
an
ge)
14.8
4.0
(0.8
)0.2
3.3
1.2
3.8
5.9
4.7
5.9
20.1
Gro
wth
in D
efen
ce S
pen
din
g v
s G
row
th in G
DP
(Annual
% C
han
ge)
(20.0
)
(10.0
)
0.0
10.0
20.0
30.0
40.0
50.0
60.0
1998
1999
2000
2001
2002
2003
2004
2005
2006
2007
2008e
%
Rea
l G
row
th in D
efen
ce S
pen
din
gRea
l G
row
th in G
DP
Perc
enta
ge
of N
om
inal
Gove
rnm
ent
Spen
din
g o
n D
efen
ce
0.0
5.0
10.0
15.0
20.0
25.0
1998
1999
2000
2001
2002
2003
2004
2005
2006
2007
2008e
%Cam
bodia
— D
efen
ce a
nd E
conom
ic T
rends
1998—
2008
8
Cambodia +
Cambodia's Official Defence Funding in Real Dollars
0.00
0.02
0.04
0.06
0.08
0.10
0.12
0.14
1998 1999 2000 2001 2002 2003 2004 2005 2006 2007 2008e
US$bn (
2005)
EEccoonnoommyy
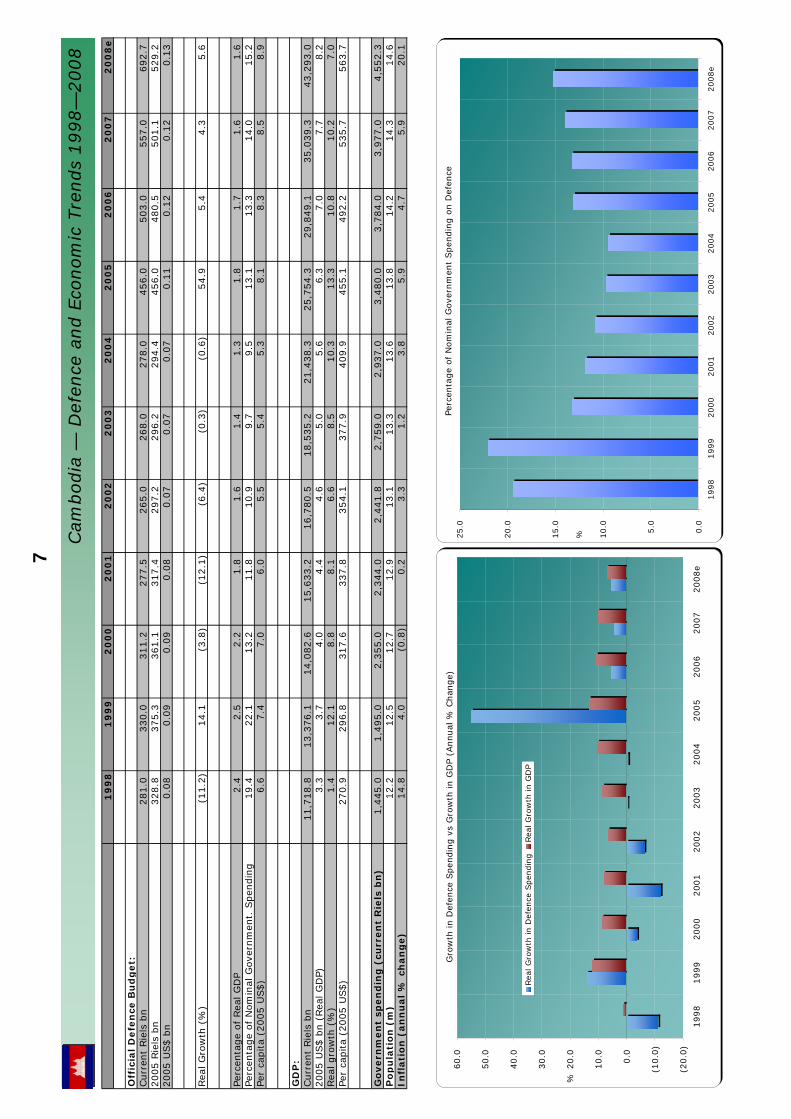
Although Cambodia has a history of high economic growth – recording an average growth rate of about eight per cent per annum over the last two decades – poverty remains a major challenge. The move from a centrally planned to a market economy over the last decade, along with membership of the World Trade Organisation in 2004 is yet to inject the expected level of foreign investment. Administrative and infrastructure challenges have deterred investment in areas other than ready-made garments and tourism. The proposal to drill for off-shore oil and gas is proceeding, but production is not expected until 2011. Cambodia is well positioned to avoid direct impacts from the initial phases of the global economic crisis, with strong economic growth of six per cent per annum forecast for 2008, according to the International Monetary Fund. But second order effects are expected to impact the Cambodian economy from 2009, with the International Monetary Fund forecasting an economic contraction of 0.5 per cent, before returning to positive growth of three per cent in 2010. The global economic climate will also make investment harder to attract.
DDeeffeennccee ssppeennddiinngg
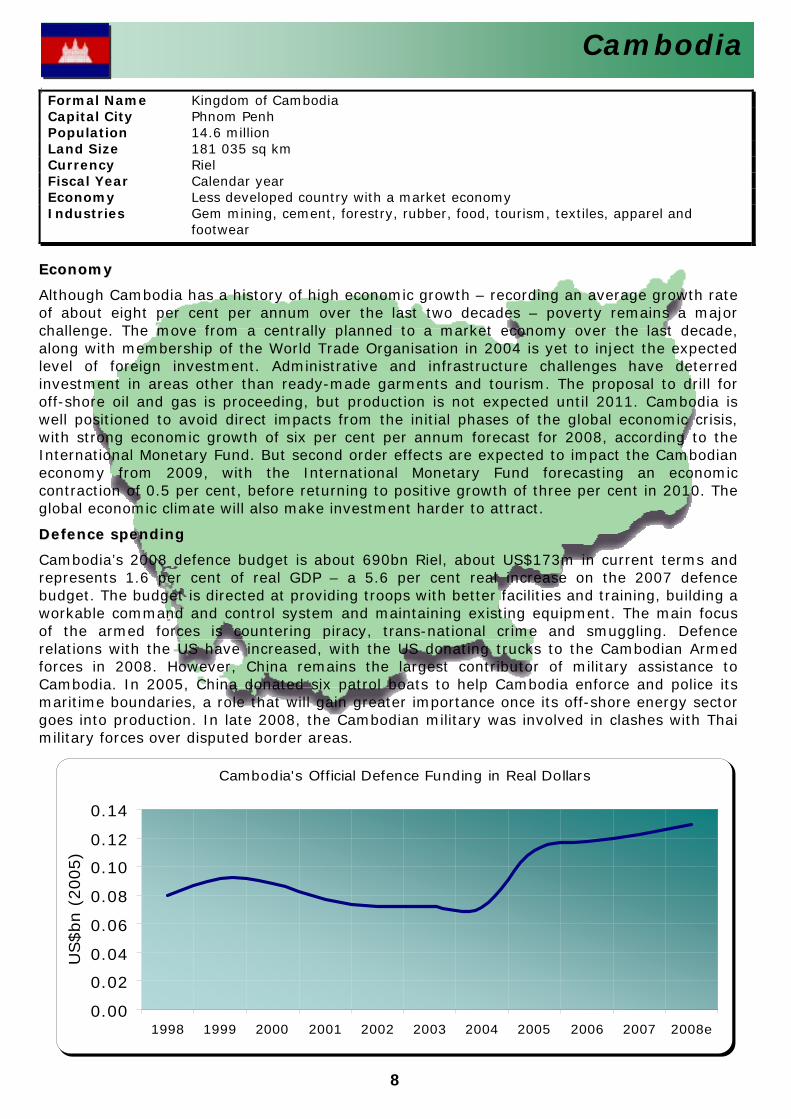
Cambodia’s 2008 defence budget is about 690bn Riel, about US$173m in current terms and represents 1.6 per cent of real GDP – a 5.6 per cent real increase on the 2007 defence budget. The budget is directed at providing troops with better facilities and training, building a workable command and control system and maintaining existing equipment. The main focus of the armed forces is countering piracy, trans-national crime and smuggling. Defence relations with the US have increased, with the US donating trucks to the Cambodian Armed forces in 2008. However, China remains the largest contributor of military assistance to Cambodia. In 2005, China donated six patrol boats to help Cambodia enforce and police its maritime boundaries, a role that will gain greater importance once its off-shore energy sector goes into production. In late 2008, the Cambodian military was involved in clashes with Thai military forces over disputed border areas.
Formal Name Kingdom of Cambodia Capital City Phnom Penh Population 14.6 million Land Size 181 035 sq km Currency Riel Fiscal Year Calendar year Economy Less developed country with a market economy Industries Gem mining, cement, forestry, rubber, food, tourism, textiles, apparel and
footwear
9
19
98
19
99
20
00
20
01
20
02
20
03
20
04
20
05
20
06
20
07
20
08
e
Off
icia
l D
efe
nce
Bu
dg
et:
Curr
ent
Rupia
h b
n9,4
00.0
12,1
87.1
13,0
00.0
14,3
00.0
15,4
15.8
18,2
84.0
21,4
10.0
23,9
00.0
23,6
00.0
31,3
00.0
36,4
00.0
2005 R
upia
h b
n18,2
96.6
20,1
09.1
20,2
66.1
19,8
47.5
19,5
36.4
21,8
42.1
23,9
55.7
23,9
00.0
20,8
10.9
25,4
86.0
26,8
65.4
2005 U
S$ b
n1.9
2.1
2.1
2.0
2.0
2.3
2.5
2.5
2.1
2.6
2.8
Rea
l G
row
th (
%)
(17.0
)9.9
0.8
(2.1
)(1
.6)
11.8
9.7
(0.2
)(1
2.9
)22.5
5.4
Perc
enta
ge
of
Rea
l G
DP
0.9
1.0
0.9
0.9
0.8
0.9
0.9
0.9
0.7
0.8
0.8
Perc
enta
ge
of
Nom
inal
Gove
rnm
ent
Spen
din
g5.4
5.6
5.3
4.2
4.6
5.2
6.1
6.7
5.3
6.2
4.3
Per
capita
(2005 U
S$)
9.2
10.0
10.2
9.8
9.6
10.5
11.4
11.2
9.7
11.7
12.2
GD
P:
Curr
ent
Rupia
h b
n1,0
56,1
31.5
1,2
15,2
31.2
1,3
89,7
69.9
1,6
46,3
22.0
1,8
21,8
33.4
2,0
13,6
74.6
2,2
95,8
26.2
2,7
74,2
81.1
3,3
39,4
79.6
3,9
57,4
03.9
4,6
07,5
92.5
2005 U
S$ b
n (
Rea
l G
DP)
213.7
215.4
226.9
235.2
245.8
257.5
270.5
285.9
301.6
320.7
340.2
Rea
l gro
wth
(%
)(1
3.1
)0.8
5.4
3.6
4.5
4.8
5.0
5.7
5.5
6.3
6.1
Per
capita
(2005 U
S$)
1,0
45.6
1,0
38.4
1,1
06.2
1,1
31.1
1,1
66.2
1,2
05.9
1,2
50.0
1,3
04.1
1,3
58.4
1,4
25.6
1,4
93.1
Go
vern
men
t s p
en
din
g (
curr
en
t R
up
iah
bn
)173,9
19.0
215,9
26.0
244,1
33.3
340,3
25.7
332,4
64.5
354,7
75.0
348,3
30.0
358,9
03.0
443,5
09.0
504,7
76.0
854,7
00.0
Po
pu
lati
on
(m
)204.4
207.4
205.1
207.9
210.7
213.6
216.4
219.2
222.1
224.9
227.8
Infl
ati
on
(an
nu
al %
ch
an
ge)
58.0
20.8
3.8
11.5
11.8
6.8
6.1
10.5
13.1
6.2
9.8
Sta
tist
ical N
ote
: In
dones
ia's
fis
cal ye
ar c
han
ged
in 2
000.
As
a re
sult t
he
2000 b
udget
only
cove
rs 9
month
s an
d h
as b
een a
nnual
ised
to p
roduce
the
figure
for
2000.
Gro
wth
in D
efen
ce S
pen
din
g v
s G
row
th in G
DP
(Annual
% C
han
ge)
(20.0
)
(15.0
)
(10.0
)
(5.0
)
0.0
5.0
10.0
15.0
20.0
25.0
1998
1999
2000
2001
2002
2003
2004
2005
2006
2007
2008e
%
Rea
l G
row
th in D
efen
ce S
pen
din
gRea
l G
row
th in G
DP
Perc
enta
ge
of N
om
inal
Gove
rnm
ent
Spen
din
g o
n D
efen
ce
0.0
1.0
2.0
3.0
4.0
5.0
6.0
7.0
1998
1999
2000
2001
2002
2003
2004
2005
2006
2007
2008e
Indones
ia —
Def
ence
and E
conom
ic T
rends
1998—
2008
10
Indonesia
Indonesia's Official Defence Funding in Real Dollars
0.0
0.5
1.0
1.5
2.0
2.5
3.0
1998 1999 2000 2001 2002 2003 2004 2005 2006 2007 2008e
US$bn (
2005)
EEccoonnoommyy
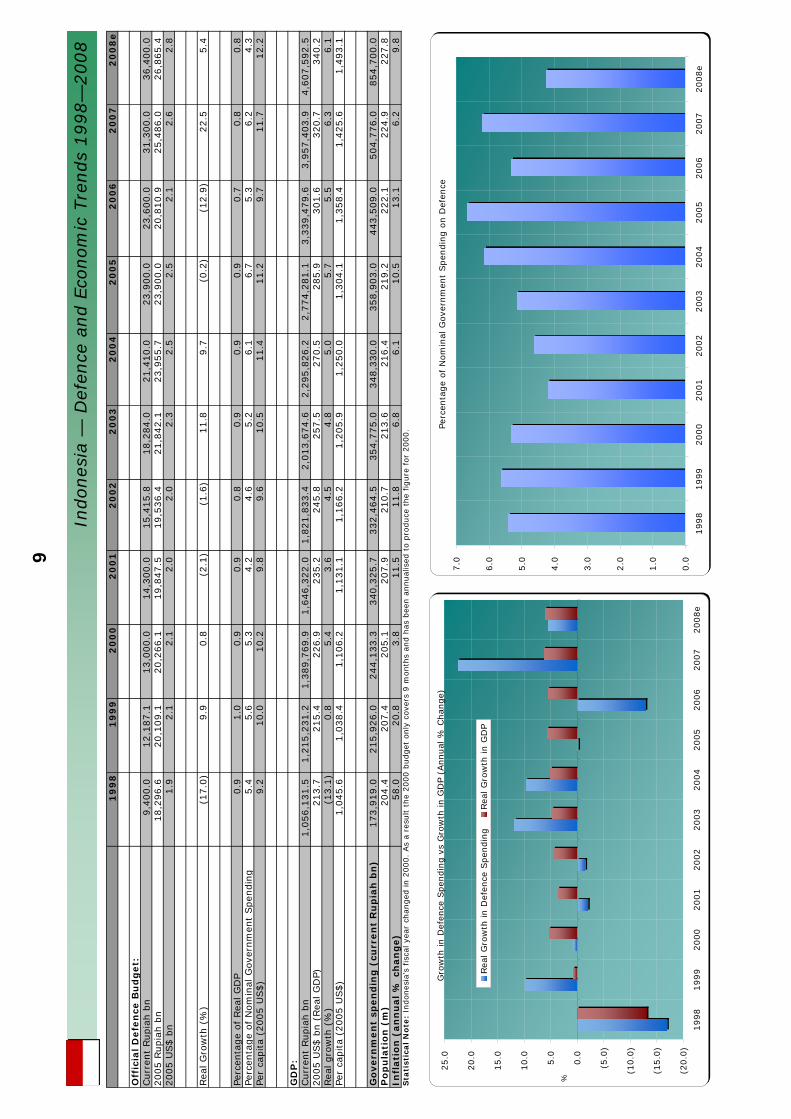
The Indonesian economy has maintained modest growth over the last nine years, recording anaverage growth rate of about 5.3 per cent per annum. Despite the growth in investments and exports, unemployment remains high, domestic demand sluggish and the Rupiah is unstable.Indonesia is now a net importer of oil, and the May 2008 reduction in fuel subsidies along with rising food and fuel prices contributed to high inflation in 2008. However, with global commodity prices declining, inflationary pressures are decreasing. Although Indonesia isforecast to record economic growth of six per cent for 2008, reduced growth of about three per cent per annum is forecast out to 2010, according to the International Monetary Fund. This level of growth will not be enough to generate the level of jobs necessary to significantly reduce unemployment. With reduced foreign debt and rising foreign exchangereserves, Indonesia may be less exposed to the impacts of the global economic crisis. However, sourcing finance to fund the government budget will become more difficult in the current global financial climate.
DDeeffeennccee ssppeennddiinngg
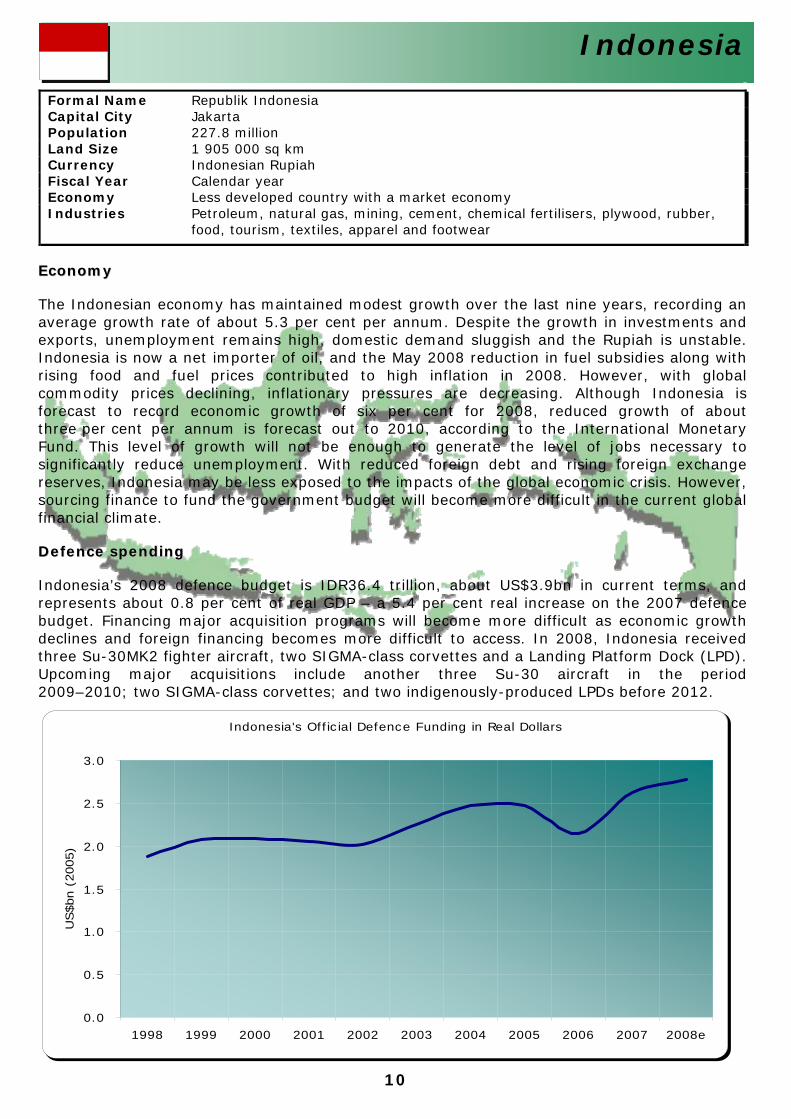
Indonesia’s 2008 defence budget is IDR36.4 trillion, about US$3.9bn in current terms, and represents about 0.8 per cent of real GDP – a 5.4 per cent real increase on the 2007 defence budget. Financing major acquisition programs will become more difficult as economic growthdeclines and foreign financing becomes more difficult to access. In 2008, Indonesia received three Su-30MK2 fighter aircraft, two SIGMA-class corvettes and a Landing Platform Dock (LPD).Upcoming major acquisitions include another three Su-30 aircraft in the period 2009–2010; two SIGMA-class corvettes; and two indigenously-produced LPDs before 2012.
Formal Name Republik Indonesia Capital City Jakarta Population 227.8 million Land Size 1 905 000 sq km Currency Indonesian Rupiah Fiscal Year Calendar year Economy Less developed country with a market economy Industries Petroleum, natural gas, mining, cement, chemical fertilisers, plywood, rubber,
food, tourism, textiles, apparel and footwear
11
19
98
19
99
20
00
20
01
20
02
20
03
20
04
20
05
20
06
20
07
20
08
e
Off
icia
l D
efe
nce
Bu
dg
et:
Curr
ent
Kip
bn
110.0
110.0
107.0
111.8
115.0
115.0
120.6
125.0
135.0
157.1
185.1
2005 K
ip b
n509.6
223.8
175.3
168.1
157.4
136.1
129.2
125.0
126.4
141.5
153.0
2005 U
S$ b
n0.0
50.0
20.0
20.0
20.0
10.0
10.0
10.0
10.0
10.0
10.0
1
Rea
l G
row
th (
%)
(22.9
)(5
6.1
)(2
1.7
)(4
.1)
(6.4
)(1
3.5
)(5
.1)
(3.3
)1.1
11.9
8.1
Perc
enta
ge
of Rea
l G
DP
2.6
1.1
0.8
0.7
0.6
0.5
0.5
0.4
0.4
0.4
0.4
Perc
enta
ge
of N
om
inal
Gove
rnm
ent
Spen
din
gn/a
4.1
3.0
3.1
2.9
3.1
2.4
2.1
1.9
2.0
1.9
Per
capita
(2005 U
S$)
9.5
4.1
3.1
2.9
2.7
2.3
2.1
2.0
2.0
2.2
2.3
GD
P:
Curr
ent
Kip
bn
4,2
40.0
10,3
28.6
13,6
69.5
15,7
01.8
18,4
01.0
22,5
97.1
26,5
49.2
30,4
80.8
35,1
93.1
39,2
85.0
46,2
65.0
2005 U
S$ b
n (
Rea
l G
DP)
1.9
2.0
2.1
2.2
2.4
2.5
2.7
2.9
3.1
3.3
3.6
Rea
l gro
wth
(%
)3.6
7.3
5.8
5.7
5.9
6.1
6.4
7.1
8.1
7.9
7.5
Per
capita
(2005 U
S$)
369.5
387.1
400.2
413.4
427.8
443.5
461.0
484.2
513.2
543.6
573.6
Go
vern
men
t sp
en
din
g (
curr
en
t K
ip b
n)
n/a
2,7
04.9
3,5
31.4
3,6
11.4
4,0
17.0
3,7
21.0
5,1
24.0
6,0
01.0
6,9
68.0
7,9
74.0
9,5
50.0
Po
pu
lati
on
(m
)5.0
5.2
5.3
5.4
5.5
5.7
5.8
5.9
6.0
6.1
6.3
Infl
ati
on
(an
nu
al
% c
han
ge)
90.1
128.4
23.2
9.3
9.2
15.5
10.5
7.2
6.8
4.5
8.4
Gro
wth
in D
efen
ce S
pen
din
g v
s G
row
th in G
DP
(Annual
% C
han
ge)
(60.0
)
(50.0
)
(40.0
)
(30.0
)
(20.0
)
(10.0
)
0.0
10.0
20.0
1998
1999
2000
2001
2002
2003
2004
2005
2006
2007
2008e
%
Rea
l G
row
th in D
efen
ce S
pen
din
gRea
l G
row
th in G
DP
Perc
enta
ge
of
Nom
inal
Gove
rnm
ent
Spen
din
g o
n D
efen
ce
0.0
0.5
1.0
1.5
2.0
2.5
3.0
3.5
4.0
4.5
1998
1999
2000
2001
2002
2003
2004
2005
2006
2007
2008e
%
Laos
— D
efen
ce a
nd E
conom
ic T
rends
1998—
2008
12
Laos
EEccoonnoommyy
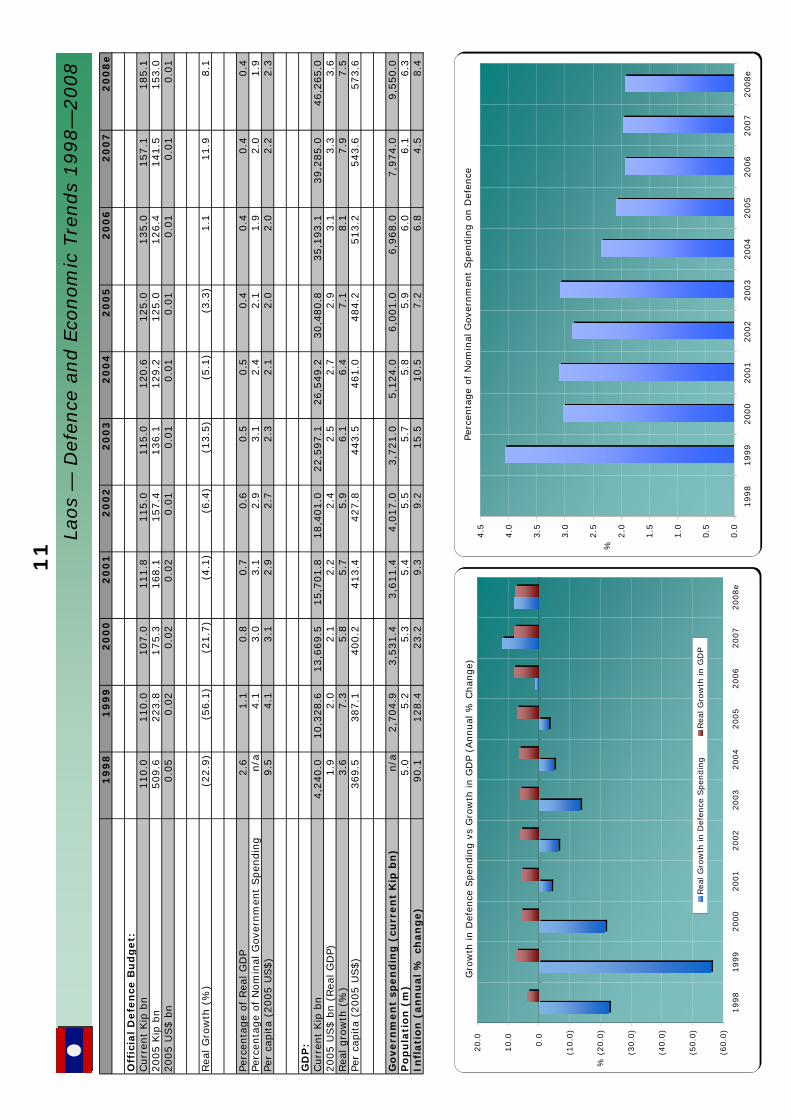
Despite three decades of modest economic growth (recording an average growth rate of about six per cent per annum), living standards in Laos remain among the region’s lowest and the country is heavily dependent on foreign aid. Economic liberalisation in the last decade has resulted in uneven growth and there has been some investment in infrastructure, mainly in dam and road construction. The mining, food processing and garment sectors have also attracted foreign investment. Laos is well positioned to avoid most of the direct impacts of the global economic crisis, with strong economic growth forecast for 2008 – 7.2 per cent – according to the International Monetary Fund. But economic growth will taper off to about 4.5 per cent out to 2010, and foreign investment and aid will become more difficult to attract in the current global financial climate.
DDeeffeennccee ssppeennddiinngg
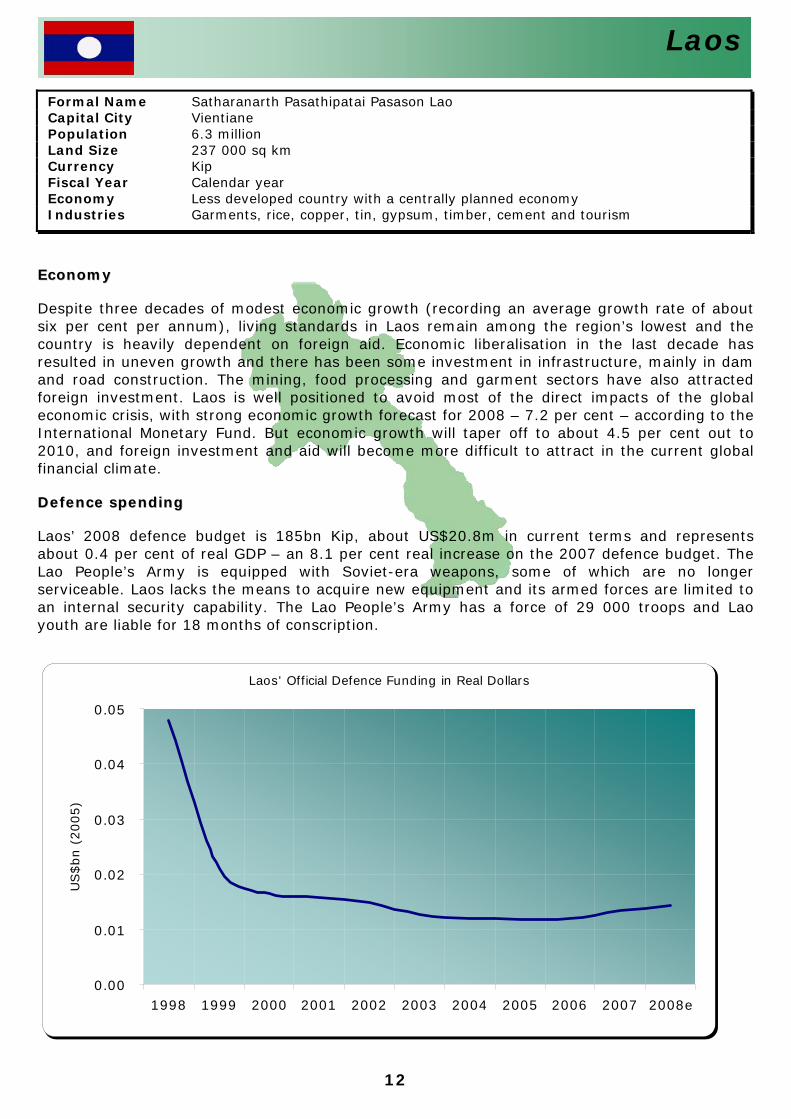
Laos’ 2008 defence budget is 185bn Kip, about US$20.8m in current terms and represents about 0.4 per cent of real GDP – an 8.1 per cent real increase on the 2007 defence budget. The Lao People’s Army is equipped with Soviet-era weapons, some of which are no longer serviceable. Laos lacks the means to acquire new equipment and its armed forces are limited to an internal security capability. The Lao People’s Army has a force of 29 000 troops and Lao youth are liable for 18 months of conscription.
Laos' Official Defence Funding in Real Dollars
0.00
0.01
0.02
0.03
0.04
0.05
1998 1999 2000 2001 2002 2003 2004 2005 2006 2007 2008e
US
$bn (
2005)
Formal Name Satharanarth Pasathipatai Pasason Lao Capital City Vientiane Population 6.3 million Land Size 237 000 sq km Currency Kip Fiscal Year Calendar year Economy Less developed country with a centrally planned economy Industries Garments, rice, copper, tin, gypsum, timber, cement and tourism
13
19
98
19
99
20
00
20
01
20
02
20
03
20
04
20
05
20
06
20
07
20
08
e
Off
icia
l D
efe
nce
Bu
dg
et:
Curr
ent
Rin
ggits
bn
4.5
6.9
6.0
7.3
8.3
9.1
8.5
9.4
11.7
13.4
14.5
2005 R
inggits
bn
5.4
8.2
6.9
8.4
9.4
10.0
8.9
9.4
11.2
12.3
12.7
2005 U
S$ b
n1.4
2.2
1.8
2.2
2.5
2.6
2.3
2.5
3.0
3.2
3.4
Rea
l G
row
th (
%)
(16.5
)53.4
(15.8
)20.7
12.1
6.6
(10.9
)5.5
19.1
9.9
3.6
Perc
enta
ge
of
Rea
l G
DP
1.5
2.2
1.7
2.0
2.1
2.2
1.8
1.8
2.0
2.1
2.0
Perc
enta
ge
of
Nom
inal
Gove
rnm
ent
Spen
din
g7.0
10.6
7.7
8.0
8.3
8.3
7.6
8.0
8.6
8.4
8.2
Per
capita
(2005 U
S$)
63.8
95.6
77.8
91.9
100.9
105.6
92.3
95.5
111.9
120.9
123.2
GD
P:
Curr
ent
Rin
ggits
bn
287.5
305.3
356.4
352.6
383.2
418.8
474.0
522.4
573.7
641.9
695.7
2005 U
S$ b
n (
Rea
l G
DP)
94.9
100.7
109.4
110.0
115.9
122.6
131.0
138.0
145.9
155.2
164.1
Rea
l gro
wth
(%
)(7
.4)
6.1
8.7
0.5
5.4
5.8
6.8
5.3
5.8
6.3
5.8
Per
capita
(2005 U
S$)
4,2
77.7
4,4
33.8
4,6
58.1
4,5
81.2
4,7
27.0
4,9
07.4
5,1
42.7
5,3
15.9
5,5
29.0
5,7
81.5
6,0
11.8
Go
vern
men
t sp
en
din
g (
curr
en
t R
ing
git
s b
n)
64.1
65.1
78.0
91.1
100.5
109.8
112.5
117.4
136.7
159.5
176.9
Po
pu
lati
on
(m
)22.2
22.7
23.5
24.0
24.5
25.0
25.5
26.0
26.4
26.8
27.3
Infl
ati
on
Rate
(an
nu
al
% c
han
ge)
5.3
2.7
1.6
1.4
1.8
1.1
1.4
3.0
3.6
2.0
6.0
Stat
istic
al N
ote:
The
200
3 an
d 20
04 fi
gure
s in
clud
e a
fund
ing
supp
lem
ent
Gro
wth
in D
efen
ce S
pen
din
g v
s G
row
th in G
DP
(Annual
% C
han
ge)
(30.0
)
(20.0
)
(10.0
)
0.0
10.0
20.0
30.0
40.0
50.0
60.0
1998
1999
2000
2001
2002
2003
2004
2005
2006
2007
2008e
%
Rea
l G
row
th in D
efen
ce S
pen
din
gRea
l G
row
th in G
DP
Perc
enta
ge
of
Nom
inal
Gove
rnm
ent
Spen
din
g o
n D
efen
ce
0.0
2.0
4.0
6.0
8.0
10.0
12.0
1998
1999
2000
2001
2002
2003
2004
2005
2006
2007
2008e
%
Mal
aysi
a —
Def
ence
and E
conom
ic T
rends
1998—
2008
14
Malaysia
EEccoonnoommyy
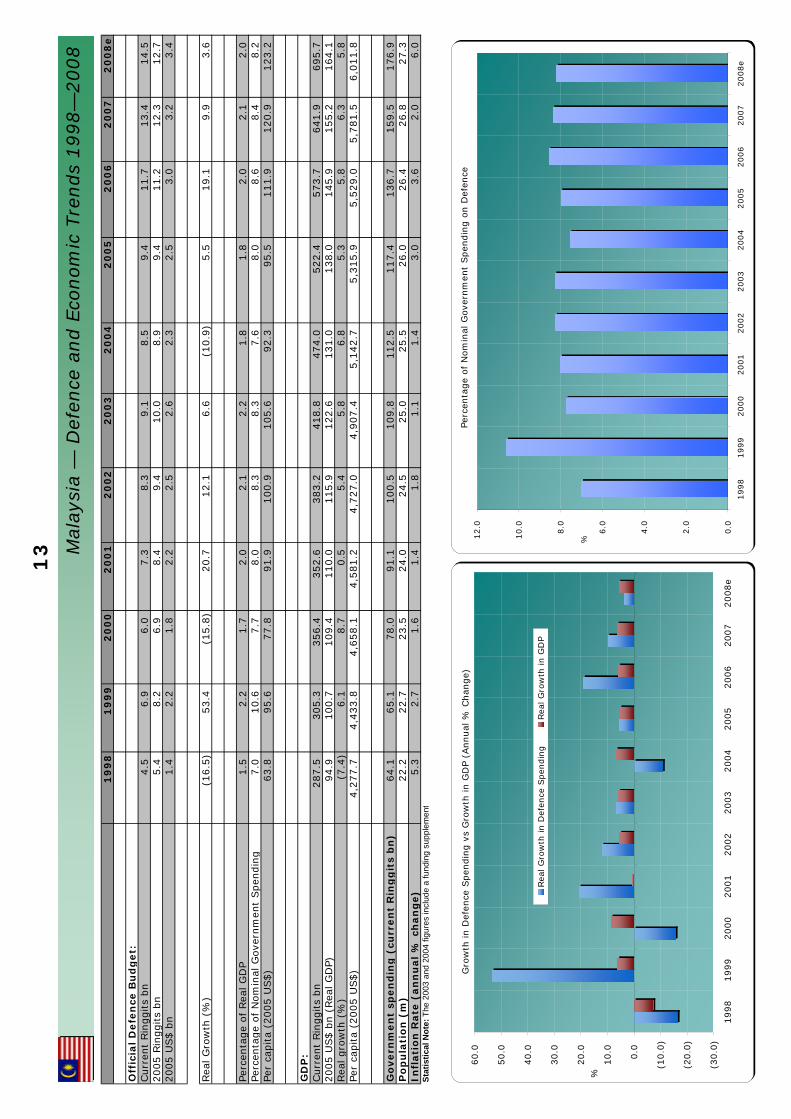
Malaysia has successfully made the transition from an agrarian to a manufacturing and service-based society. The economy has settled into a stable and sustainable growth pattern (recording an average growth rate of about six per cent per annum over the last three decades), with a steady increase in foreign investment. Confidence in its economic potential remains strong and Malaysia continues to be a net exporter of crude oil. Although still a major exporter of electronics and computer products, increasing wage rates are eroding Malaysia’s competitiveness. There are a growing number of international companies abandoning Penang, the country’s electronics hub, for places with lower labour costs. Falling demand and declining commodity prices associated with the global economic crisis have seen economic growth decline to an estimated 4.6 per cent in 2008. Further, despite large foreign exchange reserves and strong fiscal policies, the International Monetary Fund forecast an economic contraction of 3.5 per cent in 2009 before returning to growth of about 1.3 per cent in 2010.
DDeeffeennccee ssppeennddiinngg
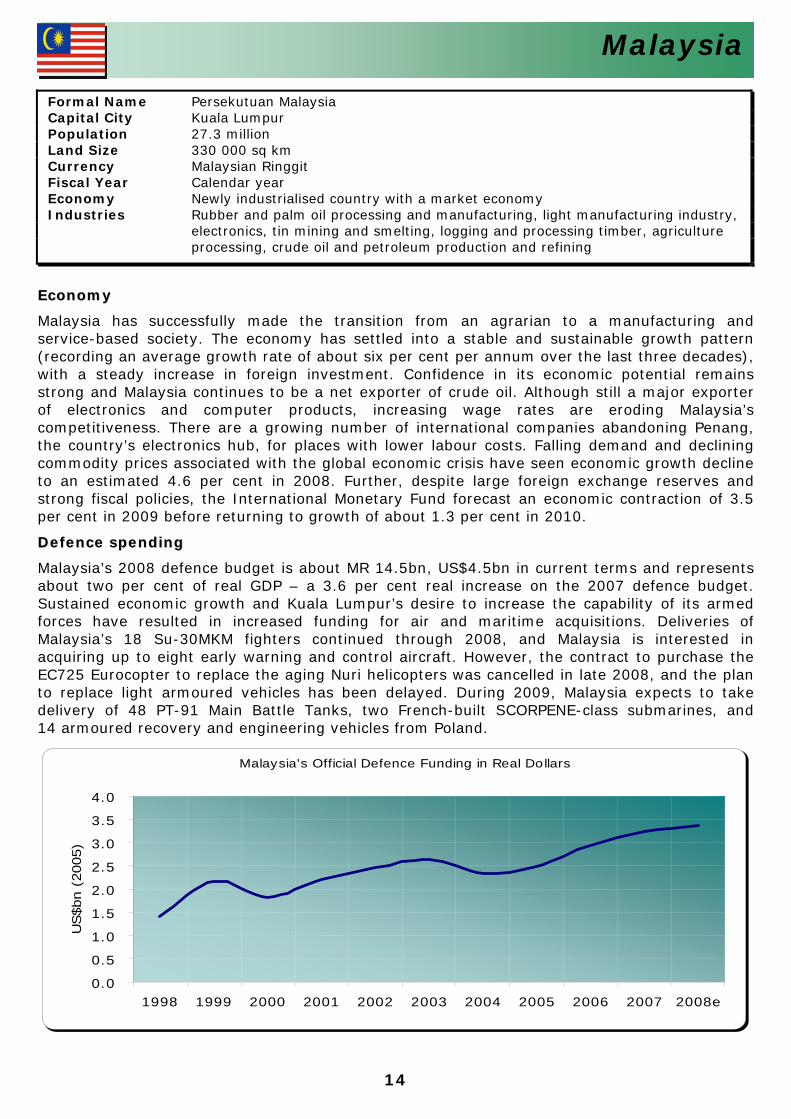
Malaysia’s 2008 defence budget is about MR 14.5bn, US$4.5bn in current terms and represents about two per cent of real GDP – a 3.6 per cent real increase on the 2007 defence budget. Sustained economic growth and Kuala Lumpur’s desire to increase the capability of its armed forces have resulted in increased funding for air and maritime acquisitions. Deliveries of Malaysia’s 18 Su-30MKM fighters continued through 2008, and Malaysia is interested in acquiring up to eight early warning and control aircraft. However, the contract to purchase the EC725 Eurocopter to replace the aging Nuri helicopters was cancelled in late 2008, and the plan to replace light armoured vehicles has been delayed. During 2009, Malaysia expects to take delivery of 48 PT-91 Main Battle Tanks, two French-built SCORPENE-class submarines, and 14 armoured recovery and engineering vehicles from Poland.
Malaysia's Official Defence Funding in Real Dollars
0.0
0.5
1.0
1.5
2.0
2.5
3.0
3.5
4.0
1998 1999 2000 2001 2002 2003 2004 2005 2006 2007 2008e
US$bn (
2005)
Formal Name Persekutuan Malaysia Capital City Kuala Lumpur Population 27.3 million Land Size 330 000 sq km Currency Malaysian Ringgit Fiscal Year Calendar year Economy Newly industrialised country with a market economy Industries Rubber and palm oil processing and manufacturing, light manufacturing industry,
electronics, tin mining and smelting, logging and processing timber, agriculture processing, crude oil and petroleum production and refining
15
19
98
19
99
20
00
20
01
20
02
20
03
20
04
20
05
20
06
20
07
20
08
e
Off
icia
l D
efe
nce
Bu
dg
et:
Curr
ent
Peso
bn
41.0
52.0
54.0
46.8
57.3
42.4
45.2
46.6
49.3
51.5
56.1
2005 P
eso b
n60.9
72.3
71.3
57.5
68.1
48.5
48.7
46.6
46.2
47.0
46.7
2005 U
S$ b
n1.1
1.3
1.3
1.0
1.2
0.9
0.9
0.8
0.8
0.9
0.8
Rea
l G
row
th (
%)
6.8
18.7
(1.3
)(1
9.4
)18.5
(28.8
)0.4
(4.2
)(0
.9)
1.8
(0.7
)
Perc
enta
ge
of
Rea
l G
DP
1.5
1.8
1.6
1.3
1.5
1.0
0.9
0.9
0.8
0.8
0.7
Perc
enta
ge
of
Nom
inal
Gove
rnm
ent
Spen
din
g7.8
8.8
8.3
6.5
7.3
5.0
5.1
4.8
4.7
4.5
4.6
Per
capita
(2005 U
S$)
15.1
17.6
17.0
13.4
15.5
10.8
10.6
9.9
9.6
9.6
9.4
GD
P:
Curr
ent
Peso
bn
2,6
65.1
2,9
76.9
3,3
54.7
3,6
31.5
3,9
63.9
4,3
16.4
4,8
71.6
5,4
44.0
6,0
32.8
6,6
48.3
7,5
63.8
2005 U
S$ b
n (
Rea
l G
DP)
72.4
74.9
79.4
80.8
84.4
88.5
94.2
98.8
104.2
111.7
116.6
Rea
l gro
wth
(%
)(0
.6)
3.4
6.0
1.8
4.4
4.9
6.4
5.0
5.4
7.2
4.4
Per
capita
(2005 U
S$)
990.4
1,0
02.1
1,0
39.6
1,0
36.5
1,0
61.1
1,0
91.7
1,1
26.9
1,1
59.2
1,1
97.7
1,2
60.6
1,2
90.1
Go
vern
men
t sp
en
din
g (
curr
en
t P
eso
bn
)528.0
590.2
649.0
714.5
789.1
839.6
893.8
962.9
1,0
44.4
1,1
49.0
1,2
26.7
Po
pu
lati
on
(m
)73.1
74.7
76.3
77.9
79.5
81.1
83.6
85.3
87.0
88.6
90.4
Infl
ati
on
(an
nu
al
% c
han
ge)
9.7
6.4
4.0
6.8
3.0
3.5
6.0
7.7
6.2
2.8
10.1
Gro
wth
in D
efen
ce S
pen
din
g v
s G
row
th in G
DP
(Annual
% C
han
ge)
(30.0
)
(25.0
)
(20.0
)
(15.0
)
(10.0
)
(5.0
)
0.0
5.0
10.0
15.0
20.0
1998
1999
2000
2001
2002
2003
2004
2005
2006
2007
2008e
%
Rea
l G
row
th in D
efen
ce S
pen
din
gRea
l G
row
th in G
DP
Perc
enta
ge
of N
om
inal
Gove
rnm
ent
Spen
din
g o
n D
efen
ce
0.0
1.0
2.0
3.0
4.0
5.0
6.0
7.0
8.0
9.0
1998
1999
2000
2001
2002
2003
2004
2005
2006
2007
2008e
%
Phili
ppin
es —
Def
ence
and E
conom
ic T
rends
1998—
2008
16
Philippines
Philippines' Official Defence Spending in Real Dollars
0.0
0.2
0.4
0.6
0.8
1.0
1.2
1.4
1998 1999 2000 2001 2002 2003 2004 2005 2006 2007 2008e
US$bn (2005)
Economy
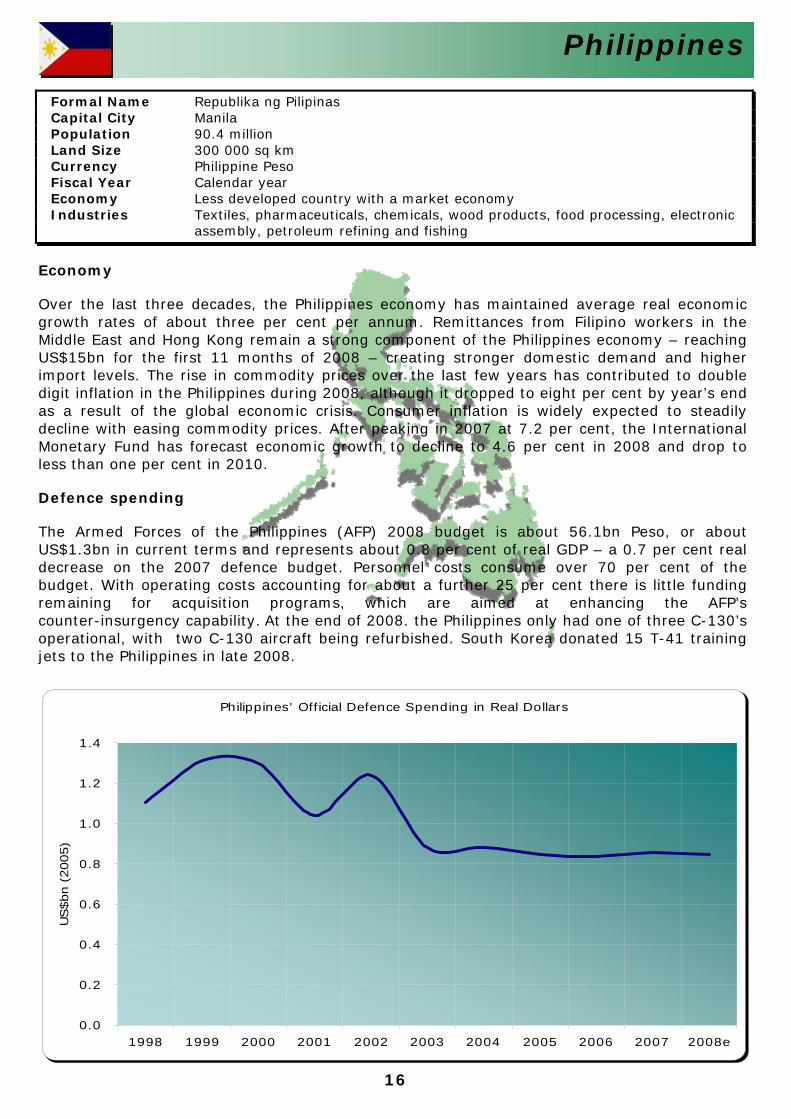
Over the last three decades, the Philippines economy has maintained average real economicgrowth rates of about three per cent per annum. Remittances from Filipino workers in the Middle East and Hong Kong remain a strong component of the Philippines economy – reaching US$15bn for the first 11 months of 2008 – creating stronger domestic demand and higher import levels. The rise in commodity prices over the last few years has contributed to double digit inflation in the Philippines during 2008, although it dropped to eight per cent by year’s endas a result of the global economic crisis. Consumer inflation is widely expected to steadily decline with easing commodity prices. After peaking in 2007 at 7.2 per cent, the International Monetary Fund has forecast economic growth to decline to 4.6 per cent in 2008 and drop to less than one per cent in 2010.
Defence spending
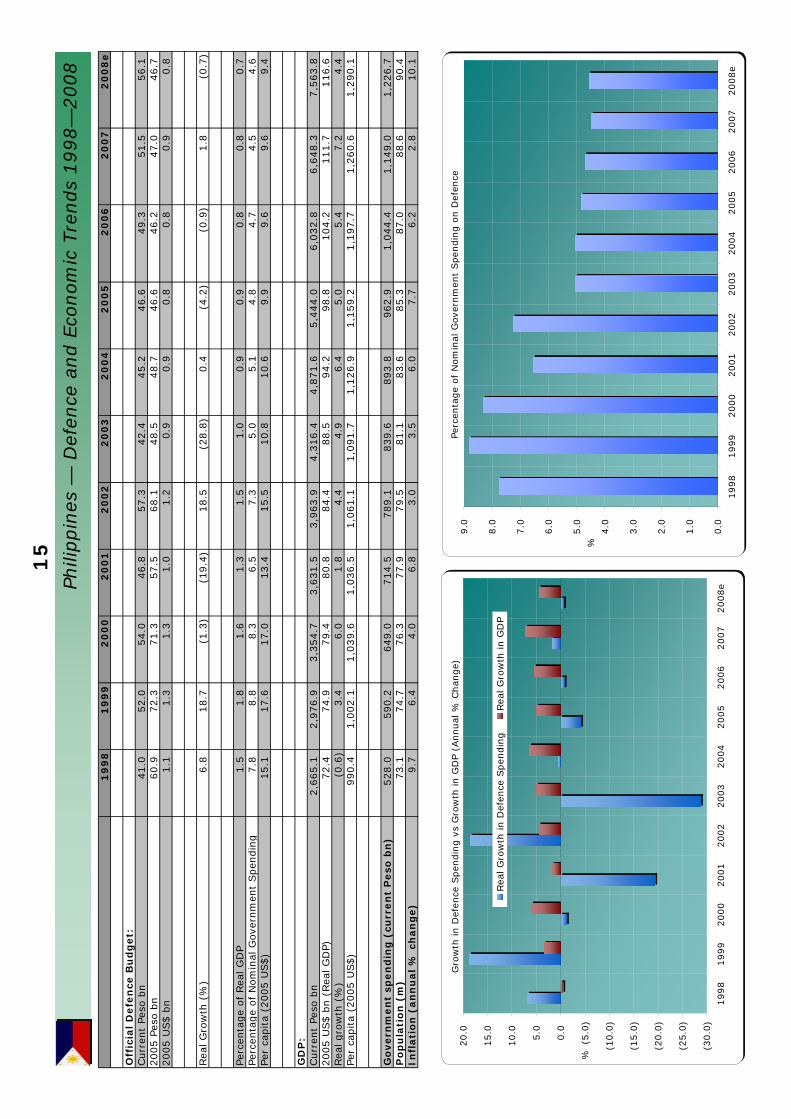
The Armed Forces of the Philippines (AFP) 2008 budget is about 56.1bn Peso, or aboutUS$1.3bn in current terms and represents about 0.8 per cent of real GDP – a 0.7 per cent real decrease on the 2007 defence budget. Personnel costs consume over 70 per cent of thebudget. With operating costs accounting for about a further 25 per cent there is little fundingremaining for acquisition programs, which are aimed at enhancing the AFP’scounter-insurgency capability. At the end of 2008. the Philippines only had one of three C-130’s operational, with two C-130 aircraft being refurbished. South Korea donated 15 T-41 training jets to the Philippines in late 2008.
Formal Name Republika ng Pilipinas Capital City Manila Population 90.4 million Land Size 300 000 sq km Currency Philippine Peso Fiscal Year Calendar year Economy Less developed country with a market economy Industries Textiles, pharmaceuticals, chemicals, wood products, food processing, electronic
assembly, petroleum refining and fishing
17
19
98
19
99
20
00
20
01
20
02
20
03
20
04
20
05
20
06
20
07
20
08
e
Off
icia
l D
efe
nce
Bu
dg
et:
Curr
ent
S$ b
n7.2
7.3
7.4
7.8
8.2
8.3
8.7
9.3
10.1
10.6
10.8
2005 S
$ b
n7.7
8.0
7.8
8.3
8.8
8.9
8.9
9.3
9.9
10.1
9.8
2005 U
S$ b
n4.6
4.8
4.7
5.0
5.3
5.3
5.4
5.6
5.9
6.1
5.9
Rea
l G
row
th (
%)
16.1
3.6
(2.6
)6.3
6.4
1.0
0.4
3.7
6.7
2.7
(2.9
)
Perc
enta
ge
of
Rea
l G
DP
5.6
5.4
4.8
5.2
5.3
5.2
4.8
4.6
4.6
4.4
4.1
Perc
enta
ge
of
Nom
inal
Gove
rnm
ent
Spen
din
g28.1
27.3
25.6
27.9
29.0
27.9
28.5
23.1
22.5
23.0
18.8
Per
capita
(2005 U
S$)
1,1
81.5
1,2
15.0
1,1
63.5
1,2
02.6
1,2
67.6
1,2
97.7
1,2
86.2
1,3
02.8
1,3
47.5
1,3
27.8
1,2
66.9
GD
P:
Curr
ent
S$ b
n137.9
140.0
159.8
153.4
158.0
162.3
184.5
199.4
217.0
243.2
263.3
2005 U
S$ b
n (
Rea
l G
DP)
82.5
88.5
97.4
95.0
99.0
102.4
111.6
119.8
129.6
139.6
144.6
Rea
l gro
wth
(%
)(1
.4)
7.2
10.1
(2.4
)4.2
3.5
9.0
7.3
8.2
7.7
3.6
Per
capita
(2005 U
S$)
21,0
41.2
22,3
91.2
24,2
32.8
22,9
95.8
23,7
26.2
24,8
91.7
26,7
91.6
28,0
79.7
29,4
42.0
30,4
14.5
30,9
81.1
Go
vern
men
t sp
en
din
g (
curr
en
t S
$ b
n)
25.6
26.7
29.0
28.1
28.4
29.9
30.4
40.1
44.7
46.1
57.6
Po
pu
lati
on
(m
)3.9
4.0
4.0
4.1
4.2
4.1
4.2
4.3
4.4
4.6
4.7
Infl
ati
on
(an
nu
al
% c
han
ge)
(0.3
)0.0
1.3
1.0
(0.4
)0.5
1.7
0.5
1.0
2.1
6.5
Gro
wth
in D
efen
ce S
pen
din
g v
s G
row
th in G
DP
(Annual
% C
han
ge)
(5.0
)
0.0
5.0
10.0
15.0
20.0
1998
1999
2000
2001
2002
2003
2004
2005
2006
2007
2008e
%
Rea
l G
row
th in D
efen
ce S
pen
din
gRea
l G
row
th in G
DP
Perc
enta
ge
of N
om
inal
Gove
rnm
ent
Spen
din
g o
n D
efen
ce
0.0
5.0
10.0
15.0
20.0
25.0
30.0
1998
1999
2000
2001
2002
2003
2004
2005
2006
2007
2008e
%
Sin
gap
ore
— D
efen
ce a
nd E
conom
ic T
rends
1998—
2008
18
Singapore
Singapore's Official Defence Funding in Real Dollars
0.0
1.0
2.0
3.0
4.0
5.0
6.0
7.0
1998 1999 2000 2001 2002 2003 2004 2005 2006 2007 2008e
US$bn (
2005)
Economy
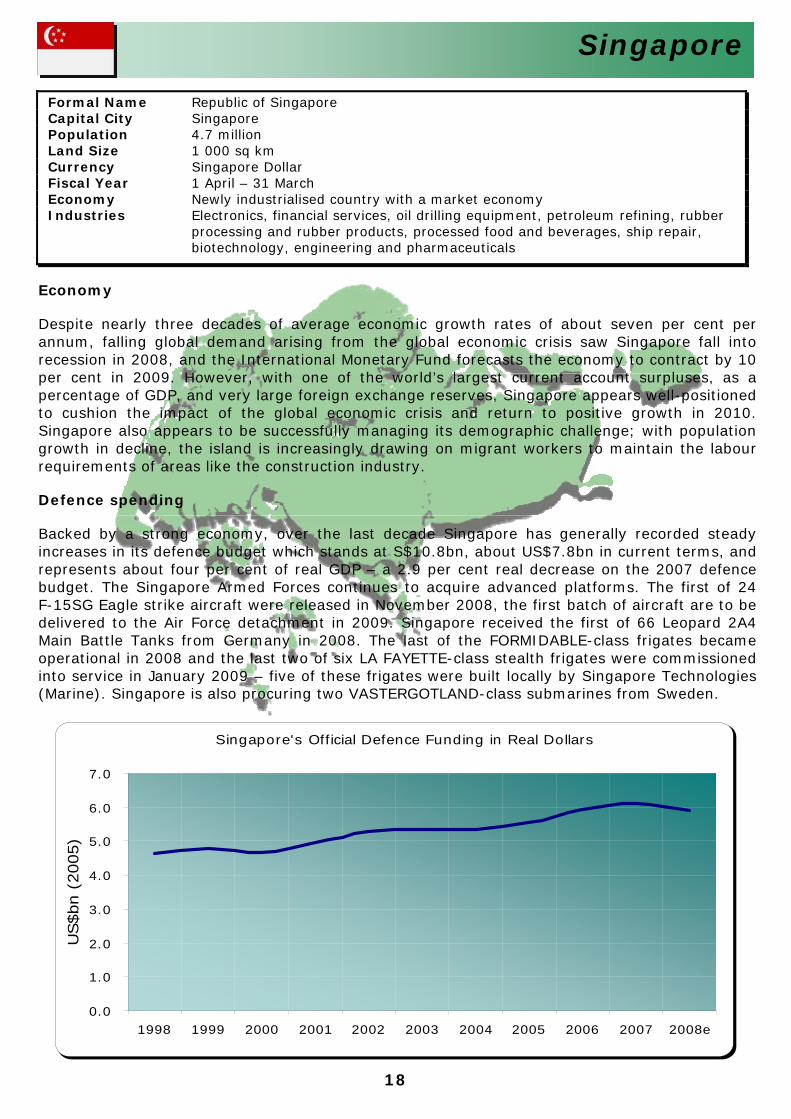
Despite nearly three decades of average economic growth rates of about seven per cent perannum, falling global demand arising from the global economic crisis saw Singapore fall into recession in 2008, and the International Monetary Fund forecasts the economy to contract by 10per cent in 2009. However, with one of the world’s largest current account surpluses, as apercentage of GDP, and very large foreign exchange reserves, Singapore appears well-positioned to cushion the impact of the global economic crisis and return to positive growth in 2010. Singapore also appears to be successfully managing its demographic challenge; with populationgrowth in decline, the island is increasingly drawing on migrant workers to maintain the labour requirements of areas like the construction industry.
Defence spending
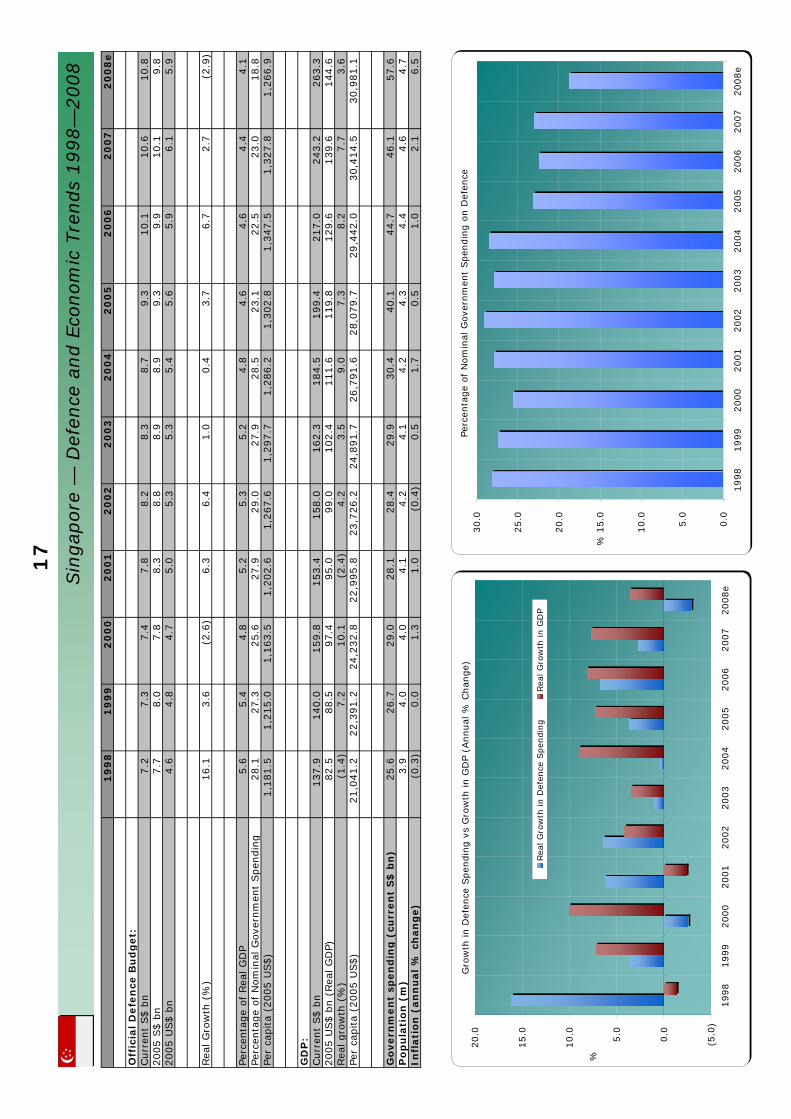
Backed by a strong economy, over the last decade Singapore has generally recorded steady increases in its defence budget which stands at S$10.8bn, about US$7.8bn in current terms, and represents about four per cent of real GDP – a 2.9 per cent real decrease on the 2007 defence budget. The Singapore Armed Forces continues to acquire advanced platforms. The first of 24F-15SG Eagle strike aircraft were released in November 2008, the first batch of aircraft are to be delivered to the Air Force detachment in 2009. Singapore received the first of 66 Leopard 2A4 Main Battle Tanks from Germany in 2008. The last of the FORMIDABLE-class frigates became operational in 2008 and the last two of six LA FAYETTE-class stealth frigates were commissioned into service in January 2009 – five of these frigates were built locally by Singapore Technologies(Marine). Singapore is also procuring two VASTERGOTLAND-class submarines from Sweden.
Formal Name Republic of Singapore Capital City Singapore Population 4.7 million Land Size 1 000 sq km Currency Singapore Dollar Fiscal Year 1 April – 31 March Economy Newly industrialised country with a market economy Industries Electronics, financial services, oil drilling equipment, petroleum refining, rubber
processing and rubber products, processed food and beverages, ship repair, biotechnology, engineering and pharmaceuticals
19
19
98
19
99
20
00
20
01
20
02
20
03
20
04
20
05
20
06
20
07
20
08
e
Off
icia
l D
efe
nce
Bu
dg
et:
Curr
ent
Bah
t bn
81.0
77.4
77.3
77.2
78.5
79.9
78.5
81.2
86.0
115.0
143.5
2005 B
aht
bn
93.2
91.8
89.7
87.8
88.4
88.0
83.1
81.2
81.5
105.9
125.8
2005 U
S$ b
n2.3
2.3
2.2
2.2
2.2
2.2
2.1
2.0
2.0
2.6
3.1
Rea
l G
row
th (
%)
(19.7
)(1
.6)
(2.2
)(2
.1)
0.7
(0.4
)(5
.6)
(2.3
)0.4
29.9
18.8
Perc
enta
ge
of
Rea
l G
DP
1.8
1.7
1.6
1.6
1.5
1.4
1.2
1.1
1.1
1.4
1.5
Perc
enta
ge
of
Nom
inal
Gove
rnm
ent
Spen
din
g7.7
6.7
8.7
8.5
7.7
8.0
7.6
6.8
6.3
7.3
8.6
Per
capita
(2005 U
S$)
37.9
36.9
35.8
34.7
34.6
34.2
31.8
31.0
31.0
40.0
47.1
GD
P:
Curr
ent
Bah
t bn
4,6
26.4
4,6
37.1
4,9
22.7
5,1
33.5
5,4
50.6
5,9
17.4
6,4
89.5
7,0
95.6
7,8
30.3
8,4
69.1
9,1
76.3
2005 U
S$ b
n (
Rea
l G
DP)
125.8
131.4
137.7
140.7
148.1
158.7
168.8
176.4
185.4
194.2
203.4
Rea
l gro
wth
(%
)(1
5.3
)4.4
4.7
2.2
5.3
7.1
6.3
4.5
5.1
4.8
4.7
Per
capita
(2005 U
S$)
2,0
57.1
2,1
27.4
2,2
06.3
2,2
34.9
2,3
34.3
2,4
79.6
2,5
93.4
2,7
09.6
2,8
40.5
2,9
54.7
3,0
63.9
Go
vern
men
t sp
en
din
g (
curr
en
t B
ah
t b
n)
1,0
51.7
1,1
60.2
884.4
910.0
1,0
23.0
999.9
1,0
28.0
1,2
00.0
1,3
60.0
1,5
66.2
1,6
60.0
Po
pu
lati
on
(m
)61.2
61.8
62.4
62.9
63.5
64.0
65.1
65.1
65.3
65.7
66.4
Infl
ati
on
(an
nu
al
% c
han
ge)
8.1
0.3
1.6
1.7
0.6
1.8
2.8
4.5
4.6
2.2
5.7
Gro
wth
in D
efen
ce S
pen
din
g v
s G
row
th in G
DP
(Annual
% C
han
ge)
(20.0
)
(15.0
)
(10.0
)
(5.0
)
0.0
5.0
10.0
15.0
20.0
25.0
30.0
1998
1999
2000
2001
2002
2003
2004
2005
2006
2007
2008e
%
Rea
l G
row
th in D
efen
ce S
pen
din
gRea
l G
row
th in G
DP
Perc
enta
ge
of N
om
inal
Gove
rnm
ent
Spen
din
g o
n D
efen
ce
0.0
1.0
2.0
3.0
4.0
5.0
6.0
7.0
8.0
9.0
1998
1999
2000
2001
2002
2003
2004
2005
2006
2007
2008e
%
Thai
land —
Def
ence
and E
conom
ic T
rends
1998—
2008
20
Thailand
Thailand's Official Defence Funding in Real Dollars
0.0
0.5
1.0
1.5
2.0
2.5
3.0
3.5
1998 1999 2000 2001 2002 2003 2004 2005 2006 2007 2008e
US$bn
(2005)
Economy
After nearly three decades of average economic growth of about six per cent per annum, theglobal economic crisis and ongoing political instability have resulted in serious consequences forthe Thai economy in 2008 and 2009 – with the extended closure of airports in late 2008impacting on tourism and export revenues. Accordingly, in December 2008 Moody’s, Fitch and Standard and Poor’s downgraded Thailand’s sovereign outlook from stable to negative.Although Thailand has a healthy current account surplus and substantial foreign exchangereserves, the International Monetary Fund has forecast an economic contraction of three per cent in 2009 – its first contraction since the 1997–98 Asian Financial Crisis – before returning to positive growth of about one per cent in 2010. Likewise, inflation is expected to decline, aided by declining global commodity prices.
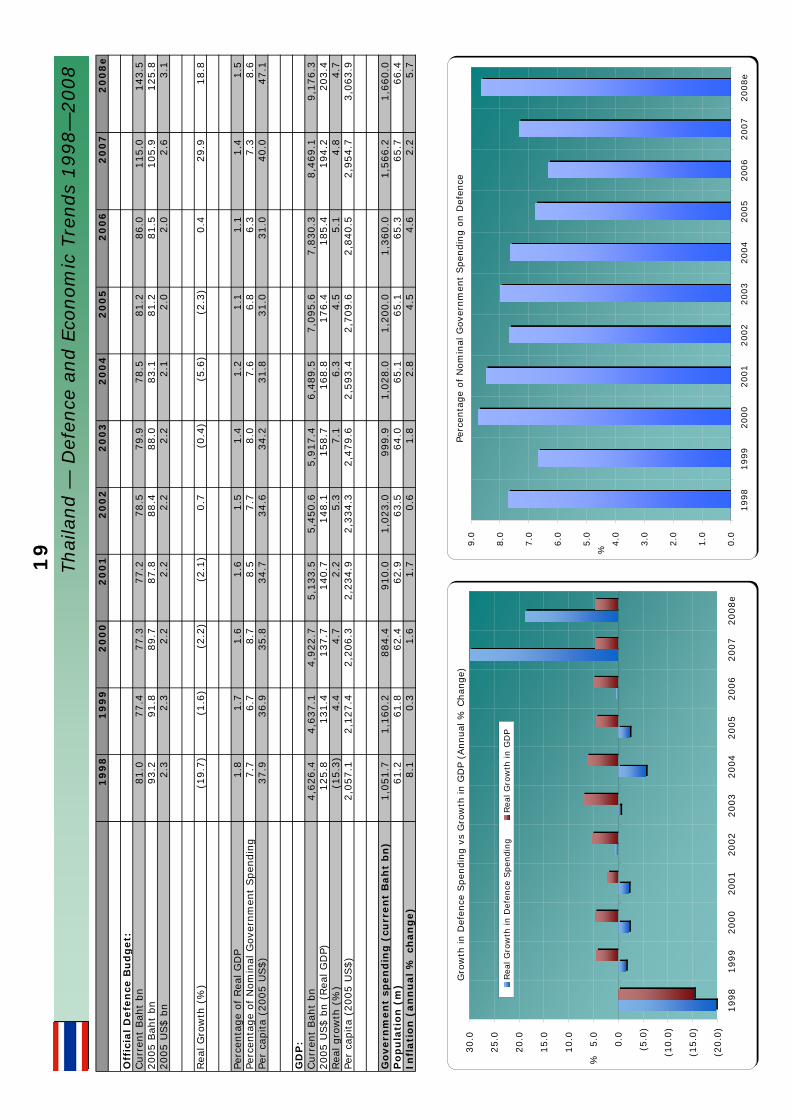
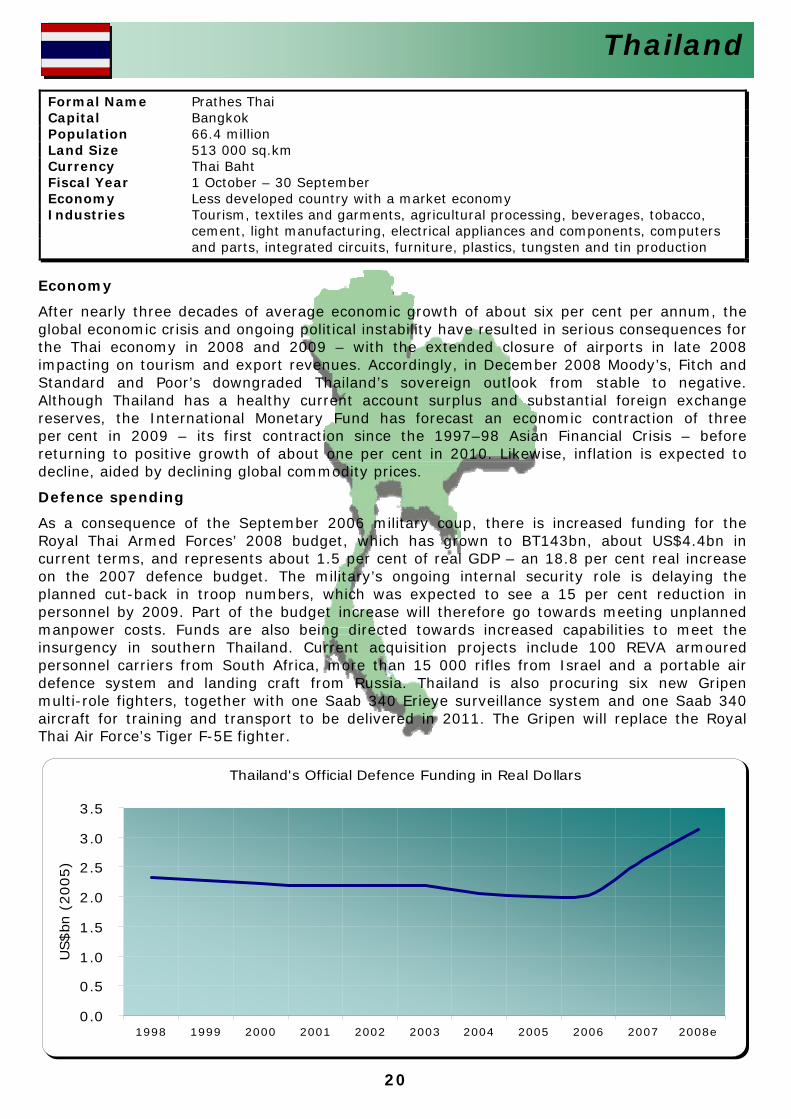
Defence spending
As a consequence of the September 2006 military coup, there is increased funding for the Royal Thai Armed Forces’ 2008 budget, which has grown to BT143bn, about US$4.4bn in current terms, and represents about 1.5 per cent of real GDP – an 18.8 per cent real increase on the 2007 defence budget. The military’s ongoing internal security role is delaying the planned cut-back in troop numbers, which was expected to see a 15 per cent reduction inpersonnel by 2009. Part of the budget increase will therefore go towards meeting unplannedmanpower costs. Funds are also being directed towards increased capabilities to meet the insurgency in southern Thailand. Current acquisition projects include 100 REVA armoured personnel carriers from South Africa, more than 15 000 rifles from Israel and a portable air defence system and landing craft from Russia. Thailand is also procuring six new Gripen multi-role fighters, together with one Saab 340 Erieye surveillance system and one Saab 340aircraft for training and transport to be delivered in 2011. The Gripen will replace the Royal Thai Air Force’s Tiger F-5E fighter.
Formal Name Prathes Thai Capital Bangkok Population 66.4 million Land Size 513 000 sq.km Currency Thai Baht Fiscal Year 1 October – 30 September Economy Less developed country with a market economy Industries Tourism, textiles and garments, agricultural processing, beverages, tobacco,
cement, light manufacturing, electrical appliances and components, computers and parts, integrated circuits, furniture, plastics, tungsten and tin production
21
19
98
19
99
20
00
20
01
20
02
20
03
20
04
20
05
20
06
20
07
20
08
e
Defe
nce
Bu
dg
et
Est
imate
:Curr
ent
Dông b
n22,4
50.0
25,4
45.1
32,6
88.3
38,9
31.9
34,0
19.0
35,8
80.0
43,7
63.0
50,0
00.0
55,0
00.0
60,0
00.0
77,2
98.7
2005 D
ông b
n30,4
58.9
32,9
17.4
41,9
60.6
49,6
07.2
41,7
00.2
41,9
15.6
47,3
60.1
50,0
00.0
51,2
18.6
51,6
05.9
54,0
00.6
2005 U
S$ b
n1.9
2.1
2.6
3.1
2.6
2.6
3.0
3.2
3.2
3.3
3.4
Rea
l G
row
th (
%)
(20.3
)8.1
27.5
18.2
(15.9
)0.5
13.0
5.6
2.4
0.8
4.6
Perc
enta
ge
of
Rea
l G
DP
6.2
6.4
7.4
8.1
6.4
5.8
6.1
6.0
5.6
5.2
5.2
Perc
enta
ge
of
Nom
inal
Gove
rnm
ent
Spen
din
g30.0
30.0
30.0
30.0
23.0
19.8
20.4
19.0
17.9
14.2
16.8
Per
capita
(2005 U
S$)
25.5
27.1
34.1
39.8
33.0
32.7
36.4
37.9
38.3
38.0
39.2
GD
P:
Curr
ent
Dông b
n361,0
16.0
399,9
42.0
441,6
46.0
481,2
95.0
535,4
89.3
613,4
42.9
715,3
07.0
839,2
11.3
974,2
66.2
1,1
44,0
14.7
1,4
86,5
14.3
2005 U
S$ b
n (
Rea
l G
DP)
30.9
32.6
35.7
38.7
41.4
45.2
48.8
52.9
57.2
62.0
65.5
Rea
l gro
wth
(%
)6.3
5.6
9.6
8.2
7.0
9.2
8.0
8.4
8.1
8.5
5.5
Per
capita
(2005 U
S$)
409.3
425.9
460.5
491.4
519.1
558.6
595.0
635.9
677.8
724.9
754.5
Go
vern
men
t sp
en
din
g (
curr
en
t D
ôn
g b
n)
74,7
61.0
84,8
17.0
108,9
61.0
129,7
73.0
148,2
08.0
181,1
83.0
214,1
76.0
262,6
97.0
308,0
58.0
422,9
90.0
459,4
78.0
Po
pu
lati
on
(m
)75.5
76.6
77.6
78.7
79.7
80.9
82.0
83.2
84.4
85.6
86.8
Infl
ati
on
(an
nu
al
% c
han
ge)
7.9
4.1
(1.6
)(0
.4)
4.0
3.2
7.7
8.3
7.5
8.3
24.0
.
Gro
wth
in D
efen
ce S
pen
din
g v
s G
row
th in G
DP
(Annual
% C
han
ge)
(30.0
)
(20.0
)
(10.0
)
0.0
10.0
20.0
30.0
1998
1999
2000
2001
2002
2003
2004
2005
2006
2007
2008e
%
Rea
l G
row
th in D
efen
ce S
pen
din
gRea
l G
row
th in G
DP
Perc
enta
ge
of N
om
inal
Gove
rnm
ent
Spen
din
g o
n D
efen
ce
0.0
5.0
10.0
15.0
20.0
25.0
30.0
1998
1999
2000
2001
2002
2003
2004
2005
2006
2007
2008e
%
Vie
tnam
— D
efen
ce a
nd E
conom
ic T
rends
1998—
2008
22
Vietnam
Vietnam's Official Defence Funding in Real Dollars
0.0
0.5
1.0
1.5
2.0
2.5
3.0
3.5
4.0
1998 1999 2000 2001 2002 2003 2004 2005 2006 2007 2008e
US$bn
(2005)
Economy
Vietnam’s 2006 accession to membership of the World Trade Organisation resulted in a surgein imports and retail sales to meet demand. As domestic consumption flattens out, the rate of economic growth is also levelling off; slowing from 8.5 per cent in 2007, to an anticipated rate of 6.2 per cent in 2008 and 3.3 per cent in 2009, according to the International Monetary Fund. Despite recording one of the strongest growth rates in South-East Asia this decade (recording an average economic growth rate of 7.2 per cent per annum), Vietnam’s economic momentum will be challenged in financing a large current account deficit as tighter global financialconditions reduce foreign direct investment and capital flows. Inflation, which is estimated at 24 per cent in 2008, will remain a threat, but, will probably fall in line with declining global commodity prices.
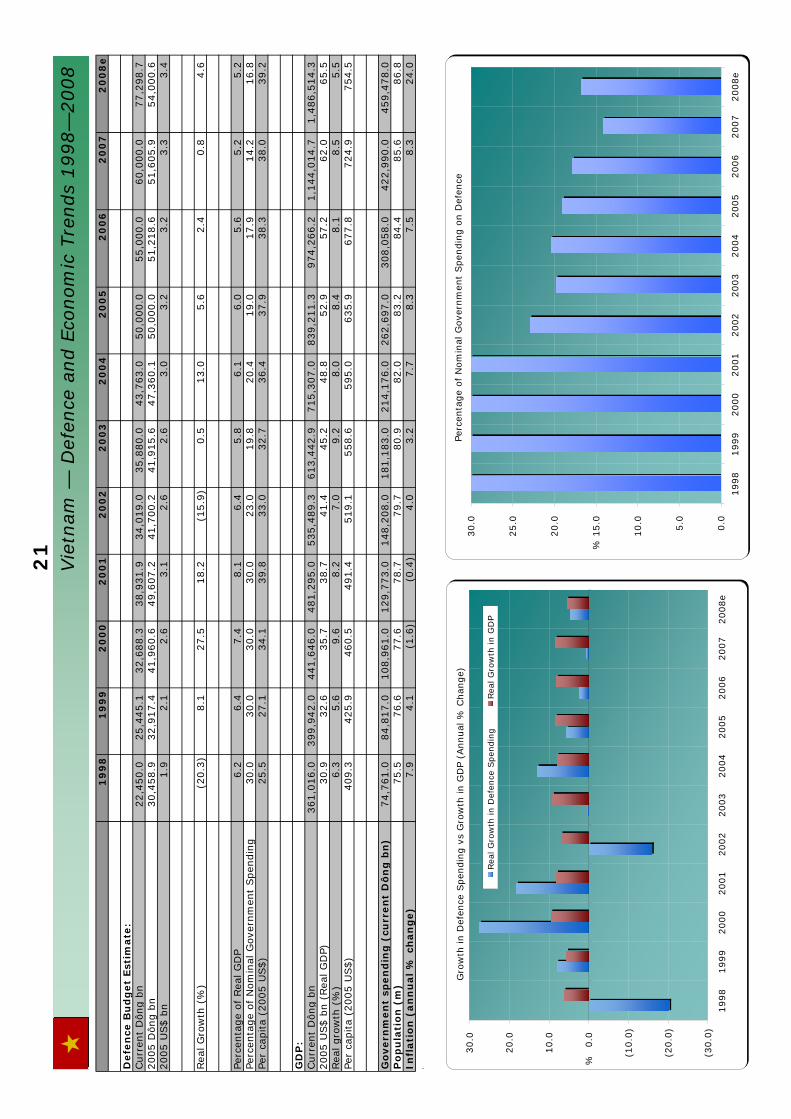
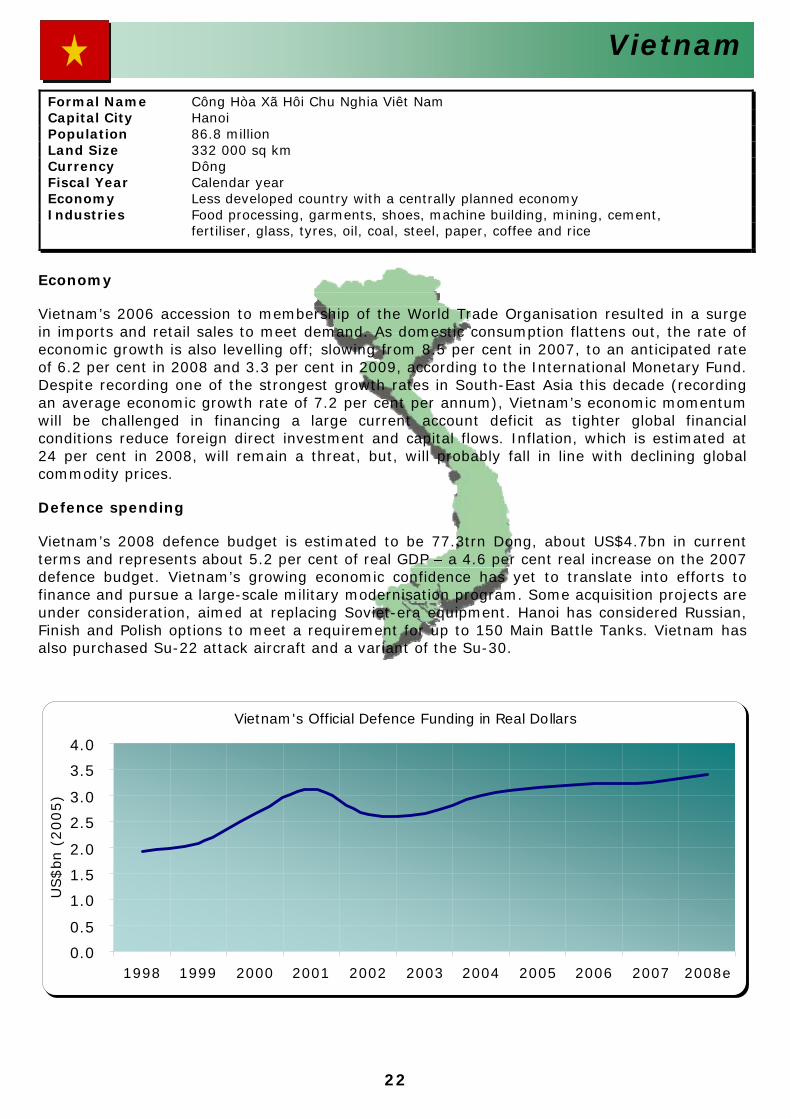
Defence spending
Vietnam’s 2008 defence budget is estimated to be 77.3trn Dong, about US$4.7bn in current terms and represents about 5.2 per cent of real GDP – a 4.6 per cent real increase on the 2007 defence budget. Vietnam’s growing economic confidence has yet to translate into efforts tofinance and pursue a large-scale military modernisation program. Some acquisition projects are under consideration, aimed at replacing Soviet-era equipment. Hanoi has considered Russian, Finish and Polish options to meet a requirement for up to 150 Main Battle Tanks. Vietnam has also purchased Su-22 attack aircraft and a variant of the Su-30.
Formal Name Công Hòa Xã Hôi Chu Nghia Viêt Nam Capital City Hanoi Population 86.8 million Land Size 332 000 sq km Currency Dông Fiscal Year Calendar year Economy Less developed country with a centrally planned economy Industries Food processing, garments, shoes, machine building, mining, cement,
fertiliser, glass, tyres, oil, coal, steel, paper, coffee and rice
23
19
98
19
99
20
00
20
01
20
02
20
03
20
04
20
05
20
06
20
07
20
08
e
Off
icia
l D
efe
nce
Bu
dg
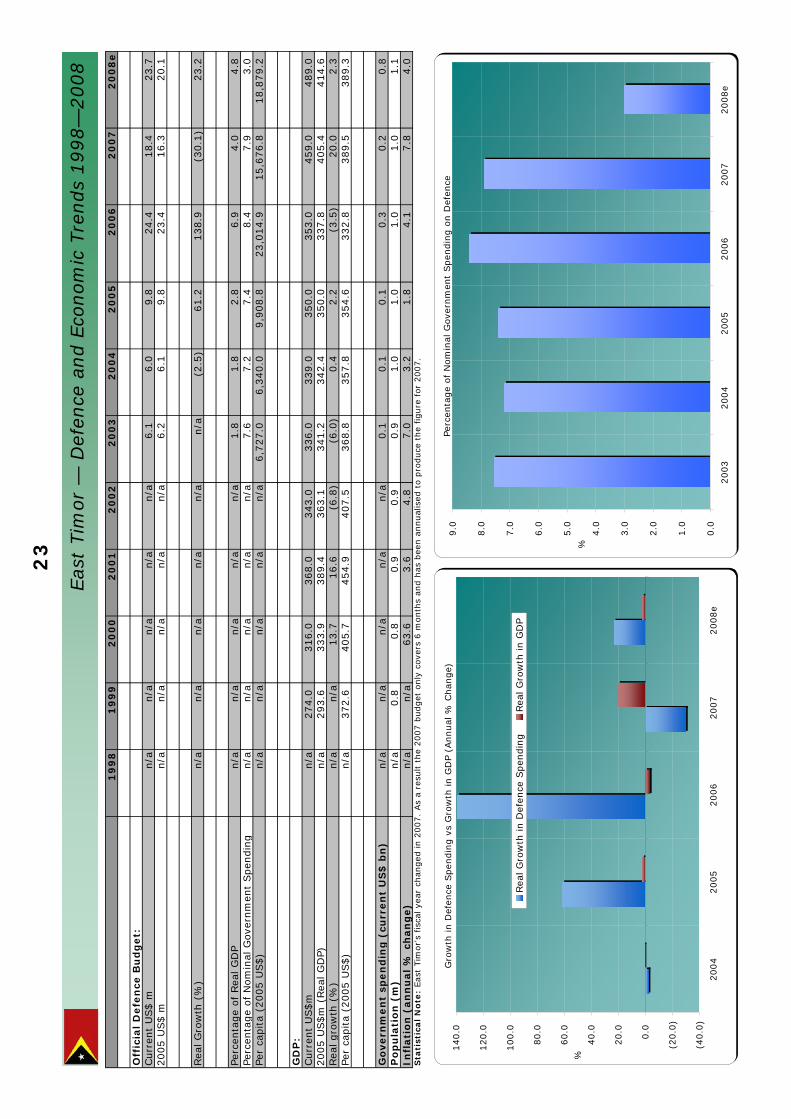
et:
Curr
ent
US$ m
n/a
n/a
n/a
n/a
n/a
6.1
6.0
9.8
24.4
18.4
23.7
2005 U
S$ m
n/a
n/a
n/a
n/a
n/a
6.2
6.1
9.8
23.4
16.3
20.1
Rea
l G
row
th (
%)
n/a
n/a
n/a
n/a
n/a
n/a
(2.5
)61.2
138.9
(30.1
)23.2
Perc
enta
ge
of
Rea
l G
DP
n/a
n/a
n/a
n/a
n/a
1.8
1.8
2.8
6.9
4.0
4.8
Perc
enta
ge
of
Nom
inal
Gove
rnm
ent
Spen
din
gn/a
n/a
n/a
n/a
n/a
7.6
7.2
7.4
8.4
7.9
3.0
Per
capita
(2005 U
S$)
n/a
n/a
n/a
n/a
n/a
6,7
27.0
6,3
40.0
9,9
08.8
23,0
14.9
15,6
76.8
18,8
79.2
GD
P:
Curr
ent
US$m
n/a
274.0
316.0
368.0
343.0
336.0
339.0
350.0
353.0
459.0
489.0
2005 U
S$m
(Rea
l G
DP)
n/a
293.6
333.9
389.4
363.1
341.2
342.4
350.0
337.8
405.4
414.6
Rea
l gro
wth
(%
)n/a
n/a
13.7
16.6
(6.8
)(6
.0)
0.4
2.2
(3.5
)20.0
2.3
Per
capita
(2005 U
S$)
n/a
372.6
405.7
454.9
407.5
368.8
357.8
354.6
332.8
389.5
389.3
Go
vern
men
t sp
en
din
g (
curr
en
t U
S$
bn
)n/a
n/a
n/a
n/a
n/a
0.1
0.1
0.1
0.3
0.2
0.8
Po
pu
lati
on
(m
)n/a
0.8
0.8
0.9
0.9
0.9
1.0
1.0
1.0
1.0
1.1
Infl
ati
on
(an
nu
al
% c
han
ge)
n/a
n/a
63.6
3.6
4.8
7.0
3.2
1.8
4.1
7.8
4.0
Sta
tist
ical
No
te:
Eas
t Tim
or's
fisc
al y
ear
chan
ged
in 2
007.
As
a re
sult t
he
2007 b
udget
only
cove
rs 6
month
s an
d h
as b
een a
nnual
ised
to p
roduce
the
figure
for
2007.
Gro
wth
in D
efen
ce S
pen
din
g v
s G
row
th in G
DP
(Annual
% C
han
ge)
(40.0
)
(20.0
)
0.0
20.0
40.0
60.0
80.0
100.0
120.0
140.0
2004
2005
2006
2007
2008e
%
Rea
l G
row
th in D
efen
ce S
pen
din
gRea
l G
row
th in G
DP
Perc
enta
ge
of
Nom
inal
Gove
rnm
ent
Spen
din
g o
n D
efen
ce
0.0
1.0
2.0
3.0
4.0
5.0
6.0
7.0
8.0
9.0
2003
2004
2005
2006
2007
2008e
%
Eas
t Tim
or
— D
efen
ce a
nd E
conom
ic T
rends
1998—
2008
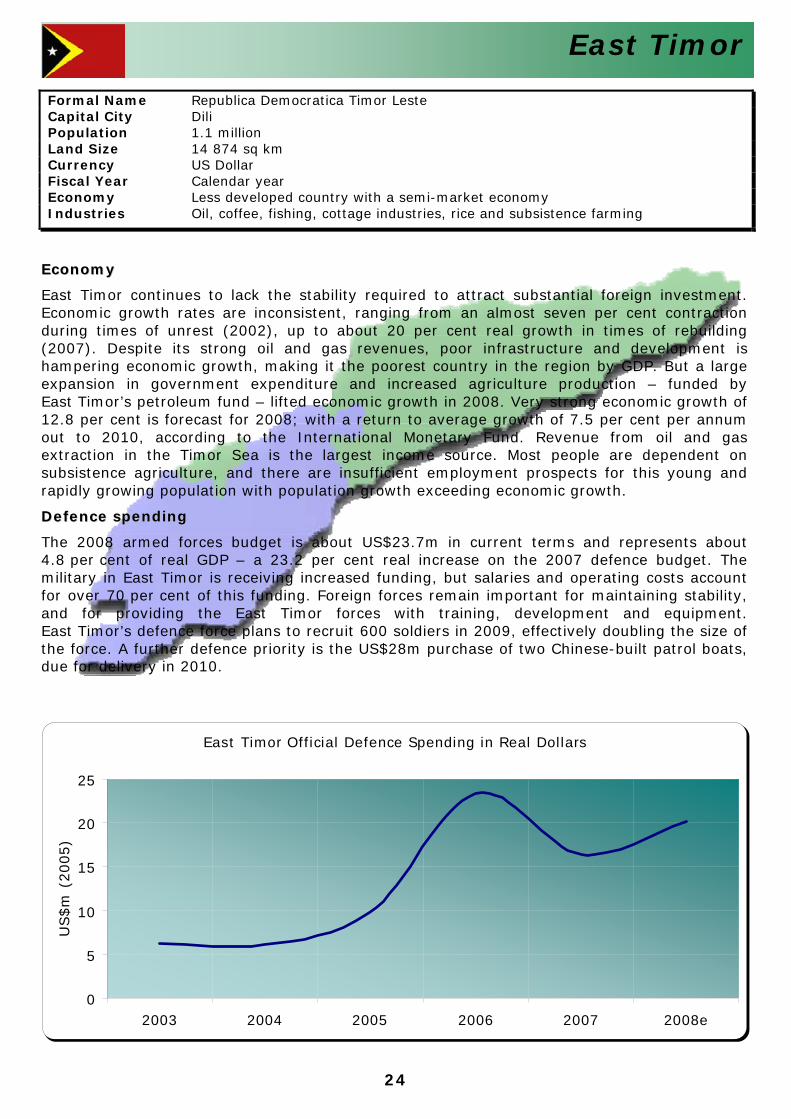
24
East Timor
East Timor Official Defence Spending in Real Dollars
0
5
10
15
20
25
2003 2004 2005 2006 2007 2008e
US$m
(2005)
Formal Name Republica Democratica Timor Leste Capital City Dili Population 1.1 million Land Size 14 874 sq km Currency US Dollar Fiscal Year Calendar year Economy Less developed country with a semi-market economy Industries Oil, coffee, fishing, cottage industries, rice and subsistence farming
EEccoonnoommyy
East Timor continues to lack the stability required to attract substantial foreign investment.Economic growth rates are inconsistent, ranging from an almost seven per cent contractionduring times of unrest (2002), up to about 20 per cent real growth in times of rebuilding(2007). Despite its strong oil and gas revenues, poor infrastructure and development ishampering economic growth, making it the poorest country in the region by GDP. But a large expansion in government expenditure and increased agriculture production – funded by East Timor’s petroleum fund – lifted economic growth in 2008. Very strong economic growth of12.8 per cent is forecast for 2008; with a return to average growth of 7.5 per cent per annumout to 2010, according to the International Monetary Fund. Revenue from oil and gasextraction in the Timor Sea is the largest income source. Most people are dependent onsubsistence agriculture, and there are insufficient employment prospects for this young andrapidly growing population with population growth exceeding economic growth.
DDeeffeennccee ssppeennddiinngg
The 2008 armed forces budget is about US$23.7m in current terms and represents about4.8 per cent of real GDP – a 23.2 per cent real increase on the 2007 defence budget. The military in East Timor is receiving increased funding, but salaries and operating costs accountfor over 70 per cent of this funding. Foreign forces remain important for maintaining stability,and for providing the East Timor forces with training, development and equipment. East Timor’s defence force plans to recruit 600 soldiers in 2009, effectively doubling the size ofthe force. A further defence priority is the US$28m purchase of two Chinese-built patrol boats, due for delivery in 2010.

25
This page is intentionally blank
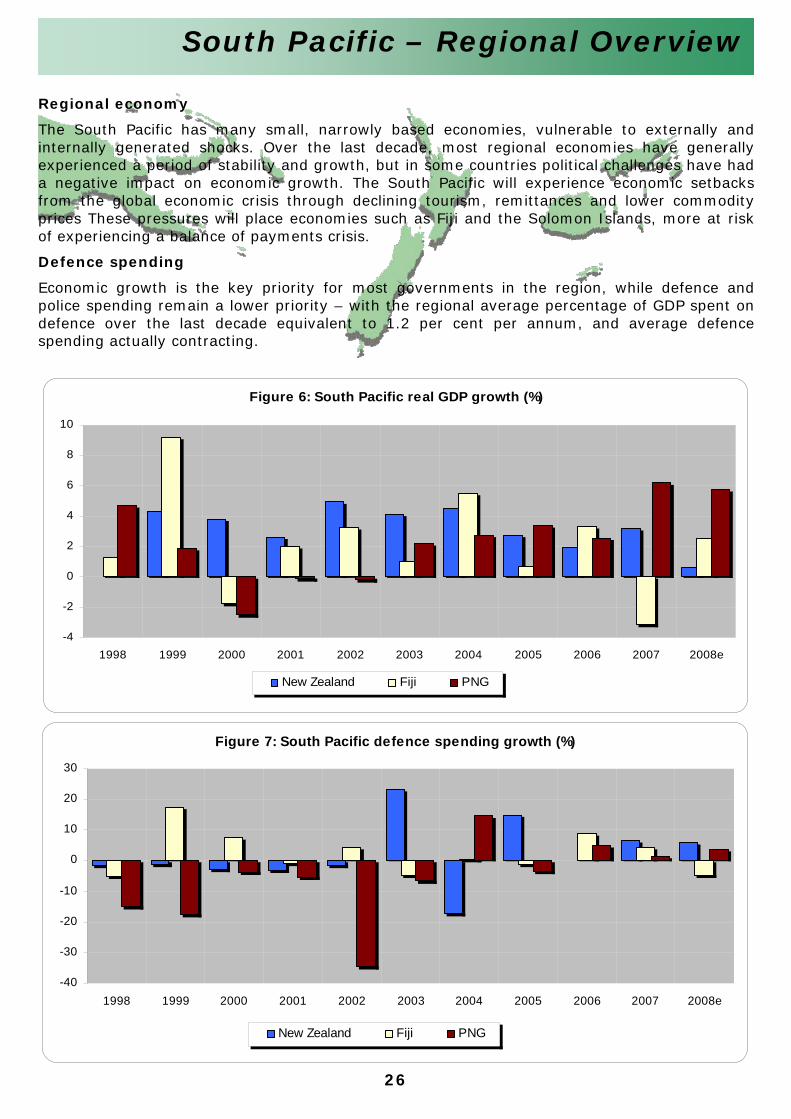
26
South Pacific – Regional Overview
Figure 6: South Pacific real GDP growth (%)
-4
-2
0
2
4
6
8
10
1998 1999 2000 2001 2002 2003 2004 2005 2006 2007 2008e
New Zealand Fiji PNG
Figure 7: South Pacific defence spending growth (%)
-40
-30
-20
-10
0
10
20
30
1998 1999 2000 2001 2002 2003 2004 2005 2006 2007 2008e
New Zealand Fiji PNG
Regional economy
The South Pacific has many small, narrowly based economies, vulnerable to externally andinternally generated shocks. Over the last decade, most regional economies have generally experienced a period of stability and growth, but in some countries political challenges have had a negative impact on economic growth. The South Pacific will experience economic setbacks from the global economic crisis through declining tourism, remittances and lower commodity prices These pressures will place economies such as Fiji and the Solomon Islands, more at riskof experiencing a balance of payments crisis.
Defence spending
Economic growth is the key priority for most governments in the region, while defence and police spending remain a lower priority – with the regional average percentage of GDP spent ondefence over the last decade equivalent to 1.2 per cent per annum, and average defencespending actually contracting.
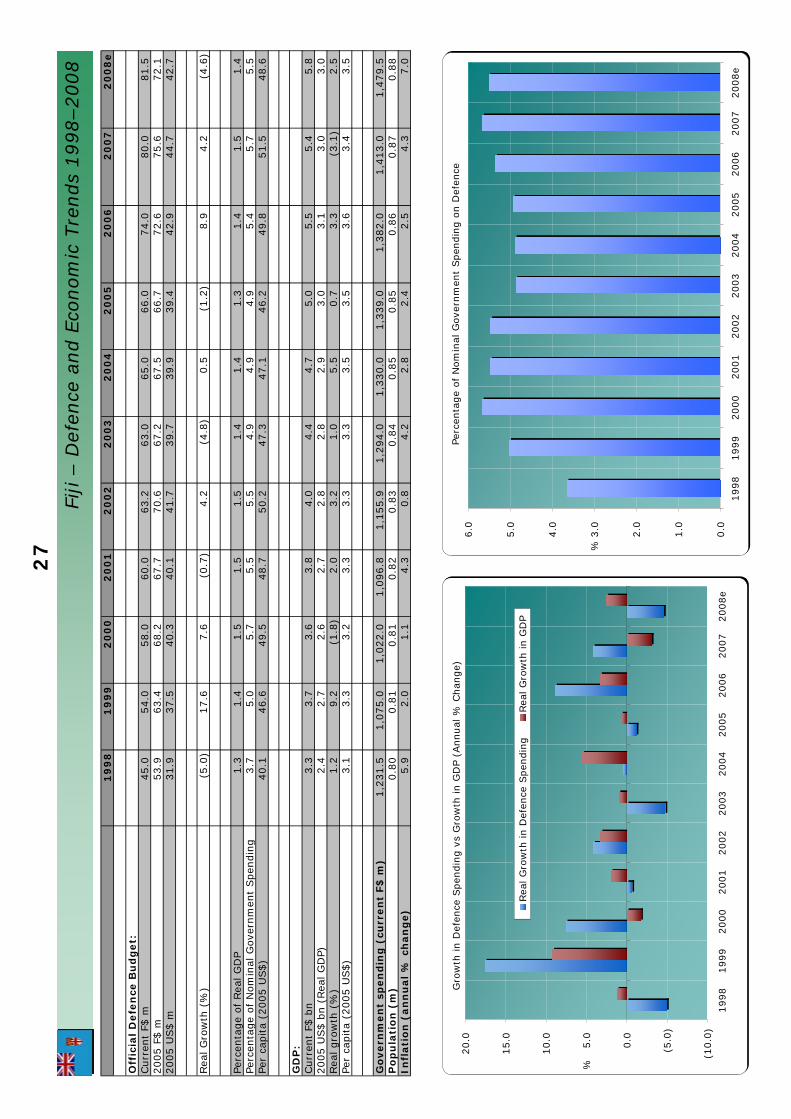
27
19
98
19
99
20
00
20
01
20
02
20
03
20
04
20
05
20
06
20
07
20
08
e
Off
icia
l D
efe
nce
Bu
dg
et:
Curr
ent
F$ m
45.0
54.0
58.0
60.0
63.2
63.0
65.0
66.0
74.0
80.0
81.5
2005 F
$ m
53.9
63.4
68.2
67.7
70.6
67.2
67.5
66.7
72.6
75.6
72.1
2005 U
S$ m
31.9
37.5
40.3
40.1
41.7
39.7
39.9
39.4
42.9
44.7
42.7
Rea
l G
row
th (
%)
(5.0
)17.6
7.6
(0.7
)4.2
(4.8
)0.5
(1.2
)8.9
4.2
(4.6
)
Perc
enta
ge
of Rea
l G
DP
1.3
1.4
1.5
1.5
1.5
1.4
1.4
1.3
1.4
1.5
1.4
Perc
enta
ge
of N
om
inal
Gove
rnm
ent
Spen
din
g3.7
5.0
5.7
5.5
5.5
4.9
4.9
4.9
5.4
5.7
5.5
Per
capita
(2005 U
S$)
40.1
46.6
49.5
48.7
50.2
47.3
47.1
46.2
49.8
51.5
48.6
GD
P:
Curr
ent
F$ b
n3.3
3.7
3.6
3.8
4.0
4.4
4.7
5.0
5.5
5.4
5.8
2005 U
S$ b
n (
Rea
l G
DP)
2.4
2.7
2.6
2.7
2.8
2.8
2.9
3.0
3.1
3.0
3.0
Rea
l gro
wth
(%
)1.2
9.2
(1.8
)2.0
3.2
1.0
5.5
0.7
3.3
(3.1
)2.5
Per
capita
(2005 U
S$)
3.1
3.3
3.2
3.3
3.3
3.3
3.5
3.5
3.6
3.4
3.5
Go
vern
men
t sp
en
din
g (
curr
en
t F$
m)
1,2
31.5
1,0
75.0
1,0
22.0
1,0
96.8
1,1
55.9
1,2
94.0
1,3
30.0
1,3
39.0
1,3
82.0
1,4
13.0
1,4
79.5
Po
pu
lati
on
(m
)0.8
00.8
10.8
10.8
20.8
30.8
40.8
50.8
50.8
60.8
70.8
8In
flati
on
(an
nu
al
% c
han
ge)
5.9
2.0
1.1
4.3
0.8
4.2
2.8
2.4
2.5
4.3
7.0
Gro
wth
in D
efen
ce S
pen
din
g v
s G
row
th in G
DP
(Annual
% C
han
ge)
(10.0
)
(5.0
)
0.0
5.0
10.0
15.0
20.0
1998
1999
2000
2001
2002
2003
2004
2005
2006
2007
2008e
%
Rea
l G
row
th in D
efen
ce S
pen
din
gRea
l G
row
th in G
DP
Perc
enta
ge
of
Nom
inal
Gove
rnm
ent
Spen
din
g o
n D
efen
ce
0.0
1.0
2.0
3.0
4.0
5.0
6.0
1998
1999
2000
2001
2002
2003
2004
2005
2006
2007
2008e
%
Fiji –
Def
ence
and E
conom
ic T
rends
1998–2008
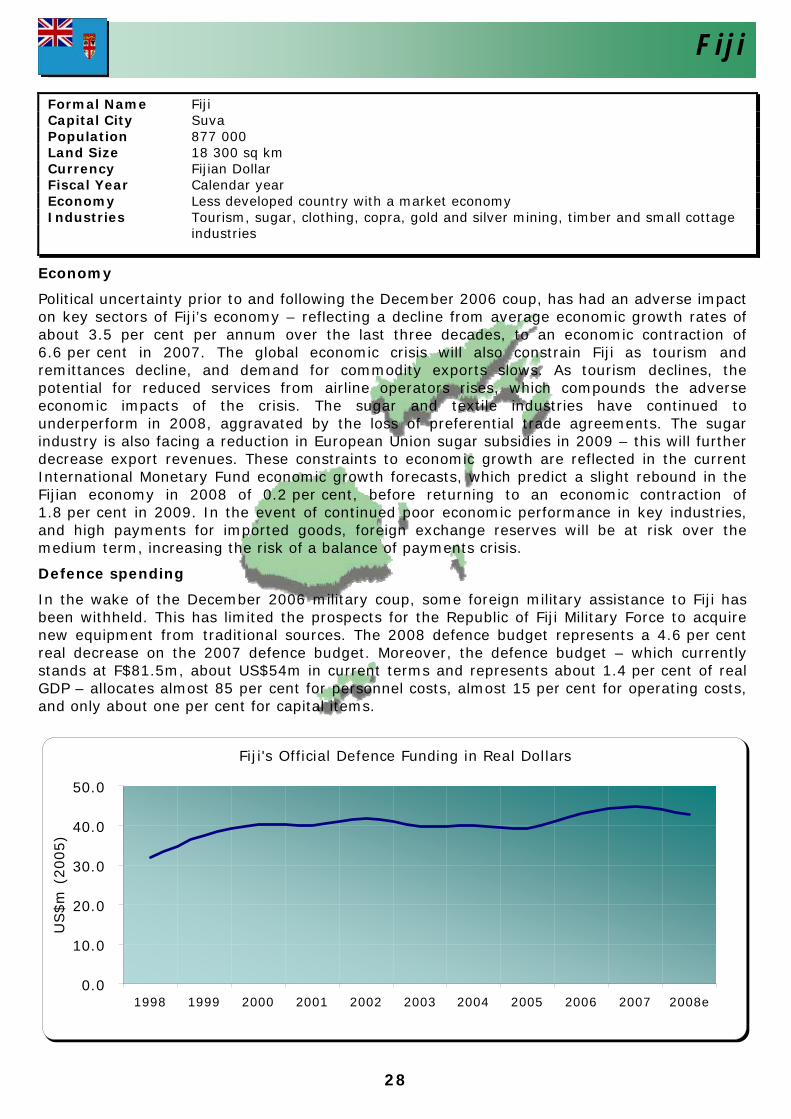
28
Fiji
Fiji's Official Defence Funding in Real Dollars
0.0
10.0
20.0
30.0
40.0
50.0
1998 1999 2000 2001 2002 2003 2004 2005 2006 2007 2008e
US$m
(2005)
Economy
Political uncertainty prior to and following the December 2006 coup, has had an adverse impacton key sectors of Fiji’s economy – reflecting a decline from average economic growth rates ofabout 3.5 per cent per annum over the last three decades, to an economic contraction of 6.6 per cent in 2007. The global economic crisis will also constrain Fiji as tourism and remittances decline, and demand for commodity exports slows. As tourism declines, the potential for reduced services from airline operators rises, which compounds the adverse economic impacts of the crisis. The sugar and textile industries have continued to underperform in 2008, aggravated by the loss of preferential trade agreements. The sugar industry is also facing a reduction in European Union sugar subsidies in 2009 – this will further decrease export revenues. These constraints to economic growth are reflected in the current International Monetary Fund economic growth forecasts, which predict a slight rebound in the Fijian economy in 2008 of 0.2 per cent, before returning to an economic contraction of 1.8 per cent in 2009. In the event of continued poor economic performance in key industries, and high payments for imported goods, foreign exchange reserves will be at risk over themedium term, increasing the risk of a balance of payments crisis.
Defence spending
In the wake of the December 2006 military coup, some foreign military assistance to Fiji has been withheld. This has limited the prospects for the Republic of Fiji Military Force to acquirenew equipment from traditional sources. The 2008 defence budget represents a 4.6 per cent real decrease on the 2007 defence budget. Moreover, the defence budget – which currently stands at F$81.5m, about US$54m in current terms and represents about 1.4 per cent of real GDP – allocates almost 85 per cent for personnel costs, almost 15 per cent for operating costs,and only about one per cent for capital items.
Formal Name Fiji Capital City Suva Population 877 000 Land Size 18 300 sq km Currency Fijian Dollar Fiscal Year Calendar year Economy Less developed country with a market economy Industries Tourism, sugar, clothing, copra, gold and silver mining, timber and small cottage
industries
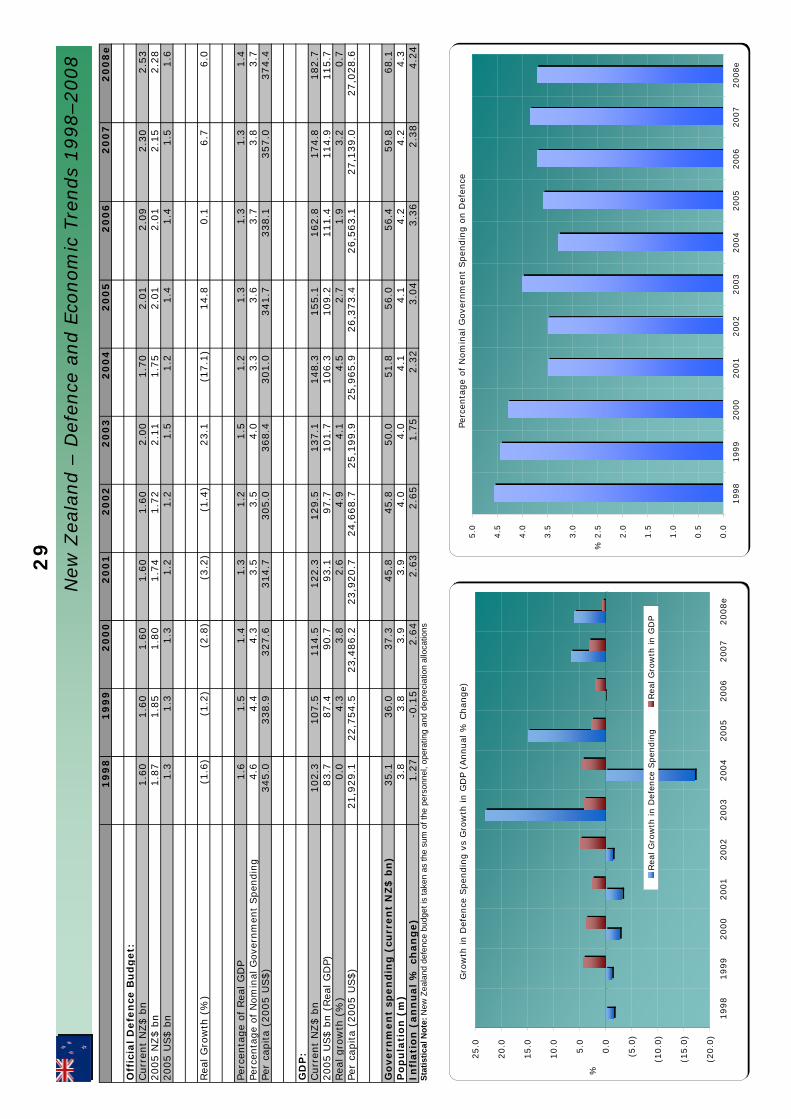
29
19
98
19
99
20
00
20
01
20
02
20
03
20
04
20
05
20
06
20
07
20
08
e
Off
icia
l D
efe
nce
Bu
dg
et:
Curr
ent
NZ$ b
n1.6
01.6
01.6
01.6
01.6
02.0
01.7
02.0
12.0
92.3
02.5
32005 N
Z$ b
n1.8
71.8
51.8
01.7
41.7
22.1
11.7
52.0
12.0
12.1
52.2
82005 U
S$ b
n1.3
1.3
1.3
1.2
1.2
1.5
1.2
1.4
1.4
1.5
1.6
Rea
l G
row
th (
%)
(1.6
)(1
.2)
(2.8
)(3
.2)
(1.4
)23.1
(17.1
)14.8
0.1
6.7
6.0
Perc
enta
ge
of
Rea
l G
DP
1.6
1.5
1.4
1.3
1.2
1.5
1.2
1.3
1.3
1.3
1.4
Perc
enta
ge
of
Nom
inal
Gove
rnm
ent
Spen
din
g4.6
4.4
4.3
3.5
3.5
4.0
3.3
3.6
3.7
3.8
3.7
Per
capita
(2005 U
S$)
345.0
338.9
327.6
314.7
305.0
368.4
301.0
341.7
338.1
357.0
374.4
GD
P:
Curr
ent
NZ$ b
n102.3
107.5
114.5
122.3
129.5
137.1
148.3
155.1
162.8
174.8
182.7
2005 U
S$ b
n (
Rea
l G
DP)
83.7
87.4
90.7
93.1
97.7
101.7
106.3
109.2
111.4
114.9
115.7
Rea
l gro
wth
(%
)0.0
4.3
3.8
2.6
4.9
4.1
4.5
2.7
1.9
3.2
0.7
Per
capita
(2005 U
S$)
21,9
29.1
22,7
54.5
23,4
86.2
23,9
20.7
24,6
68.7
25,1
99.9
25,9
65.9
26,3
73.4
26,5
63.1
27,1
39.0
27,0
28.6
Go
vern
men
t sp
en
din
g (
curr
en
t N
Z$
bn
)35.1
36.0
37.3
45.8
45.8
50.0
51.8
56.0
56.4
59.8
68.1
Po
pu
lati
on
(m
)3.8
3.8
3.9
3.9
4.0
4.0
4.1
4.1
4.2
4.2
4.3
Infl
ati
on
(an
nu
al
% c
han
ge)
1.2
7-0
.15
2.6
42.6
32.6
51.7
52.3
23.0
43.3
62.3
84.2
4St
atis
tical
Not
e: N
ew Z
eala
nd d
efen
ce b
udge
t is
take
n as
the
sum
of t
he p
erso
nnel
, ope
ratin
g an
d de
prec
iatio
n al
loca
tions
Gro
wth
in D
efen
ce S
pen
din
g v
s G
row
th in G
DP
(Annual
% C
han
ge)
(20.0
)
(15.0
)
(10.0
)
(5.0
)
0.0
5.0
10.0
15.0
20.0
25.0
1998
1999
2000
2001
2002
2003
2004
2005
2006
2007
2008e
%
Rea
l G
row
th in D
efen
ce S
pen
din
gRea
l G
row
th in G
DP
Perc
enta
ge
of
Nom
inal
Gove
rnm
ent
Spen
din
g o
n D
efen
ce
0.0
0.5
1.0
1.5
2.0
2.5
3.0
3.5
4.0
4.5
5.0
1998
1999
2000
2001
2002
2003
2004
2005
2006
2007
2008e
%
New
Zea
land –
Def
ence
and E
conom
ic T
rends
1998–2008
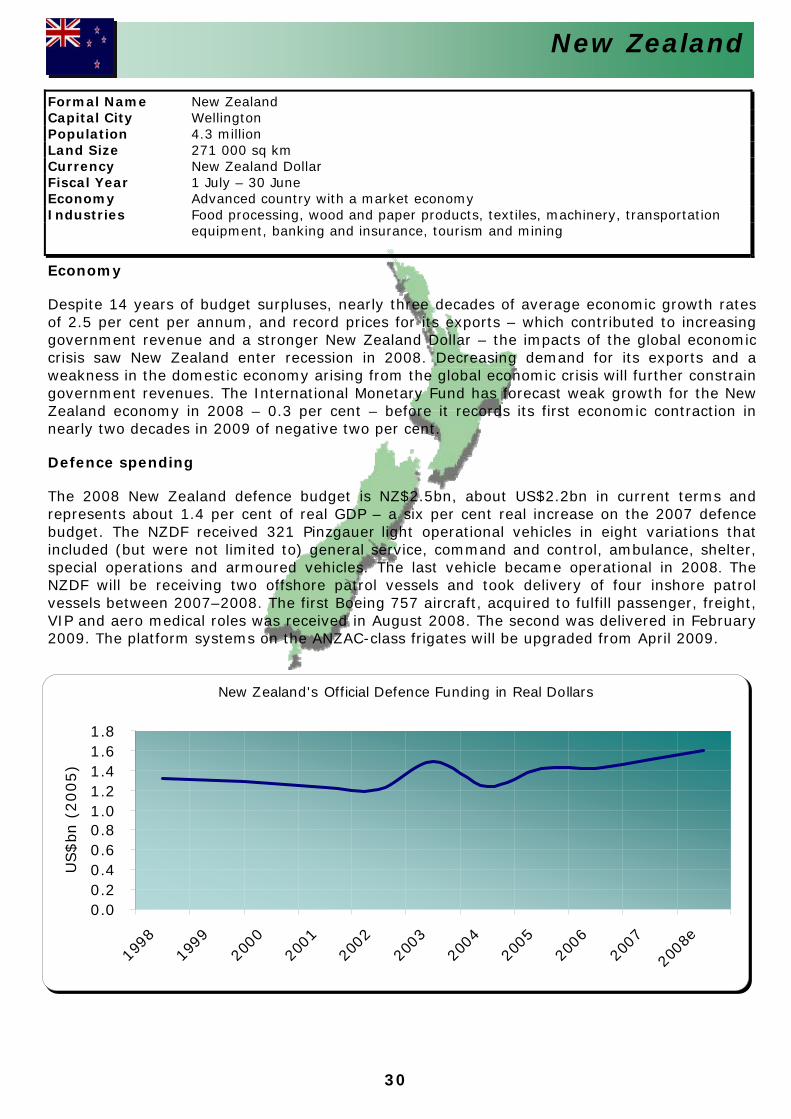
30
New Zealand
New Zealand's Official Defence Funding in Real Dollars
0.00.20.40.60.81.01.21.41.61.8
1998
1999
2000
2001
2002
2003
2004
2005
2006
2007
2008
e
US$bn
(2005)
Economy
Despite 14 years of budget surpluses, nearly three decades of average economic growth ratesof 2.5 per cent per annum, and record prices for its exports – which contributed to increasing government revenue and a stronger New Zealand Dollar – the impacts of the global economic crisis saw New Zealand enter recession in 2008. Decreasing demand for its exports and a weakness in the domestic economy arising from the global economic crisis will further constrain government revenues. The International Monetary Fund has forecast weak growth for the NewZealand economy in 2008 – 0.3 per cent – before it records its first economic contraction in nearly two decades in 2009 of negative two per cent.
Defence spending
The 2008 New Zealand defence budget is NZ$2.5bn, about US$2.2bn in current terms and represents about 1.4 per cent of real GDP – a six per cent real increase on the 2007 defence budget. The NZDF received 321 Pinzgauer light operational vehicles in eight variations that included (but were not limited to) general service, command and control, ambulance, shelter,special operations and armoured vehicles. The last vehicle became operational in 2008. The NZDF will be receiving two offshore patrol vessels and took delivery of four inshore patrol vessels between 2007–2008. The first Boeing 757 aircraft, acquired to fulfill passenger, freight, VIP and aero medical roles was received in August 2008. The second was delivered in February 2009. The platform systems on the ANZAC-class frigates will be upgraded from April 2009.
Formal Name New Zealand Capital City Wellington Population 4.3 million Land Size 271 000 sq km Currency New Zealand Dollar Fiscal Year 1 July – 30 June Economy Advanced country with a market economy Industries Food processing, wood and paper products, textiles, machinery, transportation
equipment, banking and insurance, tourism and mining
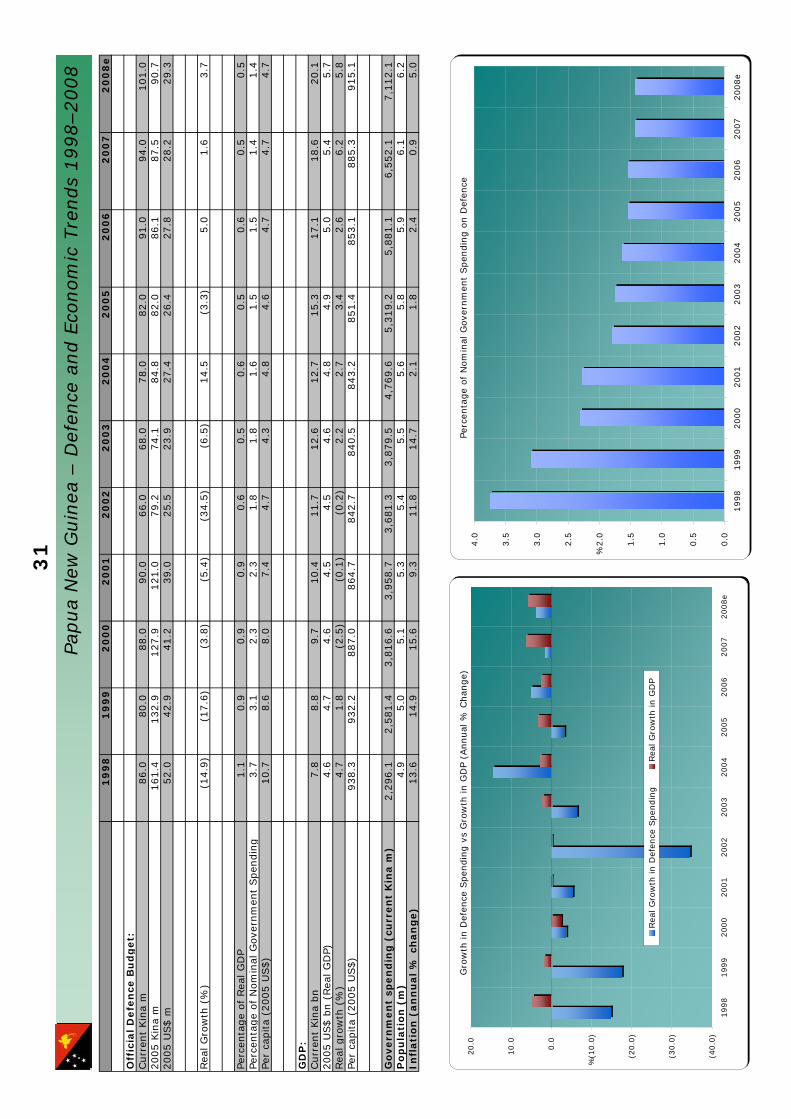
31
19
98
19
99
20
00
20
01
20
02
20
03
20
04
20
05
20
06
20
07
20
08
e
Off
icia
l D
efe
nce
Bu
dg
et:
Curr
ent
Kin
a m
86.0
80.0
88.0
90.0
66.0
68.0
78.0
82.0
91.0
94.0
101.0
2005 K
ina
m161.4
132.9
127.9
121.0
79.2
74.1
84.8
82.0
86.1
87.5
90.7
2005 U
S$ m
52.0
42.9
41.2
39.0
25.5
23.9
27.4
26.4
27.8
28.2
29.3
Rea
l G
row
th (
%)
(14.9
)(1
7.6
)(3
.8)
(5.4
)(3
4.5
)(6
.5)
14.5
(3.3
)5.0
1.6
3.7
Perc
enta
ge
of
Rea
l G
DP
1.1
0.9
0.9
0.9
0.6
0.5
0.6
0.5
0.6
0.5
0.5
Perc
enta
ge
of
Nom
inal
Gove
rnm
ent
Spen
din
g3.7
3.1
2.3
2.3
1.8
1.8
1.6
1.5
1.5
1.4
1.4
Per
capita
(2005 U
S$)
10.7
8.6
8.0
7.4
4.7
4.3
4.8
4.6
4.7
4.7
4.7
GD
P:
Curr
ent
Kin
a bn
7.8
8.8
9.7
10.4
11.7
12.6
12.7
15.3
17.1
18.6
20.1
2005 U
S$ b
n (
Rea
l G
DP)
4.6
4.7
4.6
4.5
4.5
4.6
4.8
4.9
5.0
5.4
5.7
Rea
l gro
wth
(%
)4.7
1.8
(2.5
)(0
.1)
(0.2
)2.2
2.7
3.4
2.6
6.2
5.8
Per
capita
(2005 U
S$)
938.3
932.2
887.0
864.7
842.7
840.5
843.2
851.4
853.1
885.3
915.1
Go
vern
men
t sp
en
din
g (
curr
en
t K
ina m
)2,2
96.1
2,5
81.4
3,8
16.6
3,9
58.7
3,6
81.3
3,8
79.5
4,7
69.6
5,3
19.2
5,8
81.1
6,5
52.1
7,1
12.1
Po
pu
lati
on
(m
)4.9
5.0
5.1
5.3
5.4
5.5
5.6
5.8
5.9
6.1
6.2
Infl
ati
on
(an
nu
al
% c
han
ge)
13.6
14.9
15.6
9.3
11.8
14.7
2.1
1.8
2.4
0.9
5.0
Gro
wth
in D
efen
ce S
pen
din
g v
s G
row
th in G
DP
(Annual
% C
han
ge)
(40.0
)
(30.0
)
(20.0
)
(10.0
)
0.0
10.0
20.0
1998
1999
2000
2001
2002
2003
2004
2005
2006
2007
2008e
%
Rea
l G
row
th in D
efen
ce S
pen
din
gRea
l G
row
th in G
DP
Perc
enta
ge
of
Nom
inal
Gove
rnm
ent
Spen
din
g o
n D
efen
ce
0.0
0.5
1.0
1.5
2.0
2.5
3.0
3.5
4.0
1998
1999
2000
2001
2002
2003
2004
2005
2006
2007
2008e
%
Papua
New
Guin
ea –
Def
ence
and E
conom
ic T
rends
1998–2008
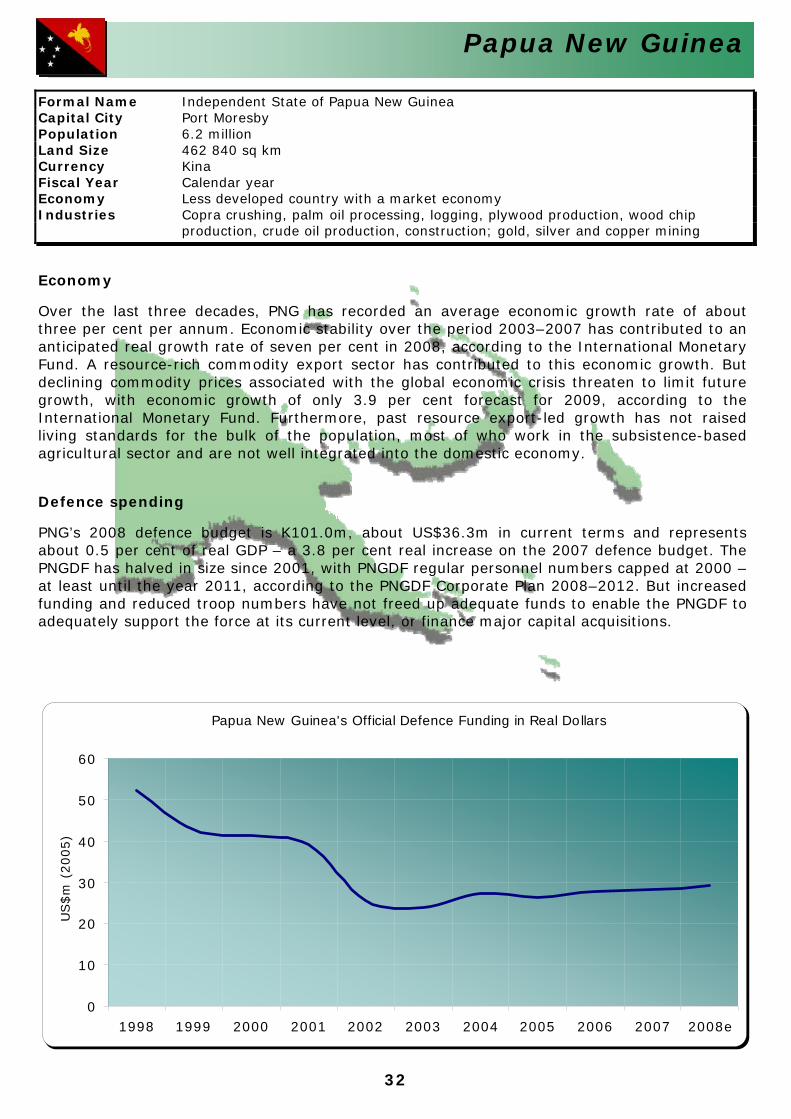
32
Papua New Guinea
Papua New Guinea's Official Defence Funding in Real Dollars
0
10
20
30
40
50
60
1998 1999 2000 2001 2002 2003 2004 2005 2006 2007 2008e
US
$m
(2005)
Economy
Over the last three decades, PNG has recorded an average economic growth rate of aboutthree per cent per annum. Economic stability over the period 2003–2007 has contributed to an anticipated real growth rate of seven per cent in 2008, according to the International MonetaryFund. A resource-rich commodity export sector has contributed to this economic growth. But declining commodity prices associated with the global economic crisis threaten to limit futuregrowth, with economic growth of only 3.9 per cent forecast for 2009, according to theInternational Monetary Fund. Furthermore, past resource export-led growth has not raisedliving standards for the bulk of the population, most of who work in the subsistence-based agricultural sector and are not well integrated into the domestic economy.
Defence spending
PNG’s 2008 defence budget is K101.0m, about US$36.3m in current terms and representsabout 0.5 per cent of real GDP – a 3.8 per cent real increase on the 2007 defence budget. The PNGDF has halved in size since 2001, with PNGDF regular personnel numbers capped at 2000 –at least until the year 2011, according to the PNGDF Corporate Plan 2008–2012. But increased funding and reduced troop numbers have not freed up adequate funds to enable the PNGDF toadequately support the force at its current level, or finance major capital acquisitions.
Formal Name Independent State of Papua New Guinea Capital City Port Moresby Population 6.2 million Land Size 462 840 sq km Currency Kina Fiscal Year Calendar year Economy Less developed country with a market economy Industries Copra crushing, palm oil processing, logging, plywood production, wood chip
production, crude oil production, construction; gold, silver and copper mining
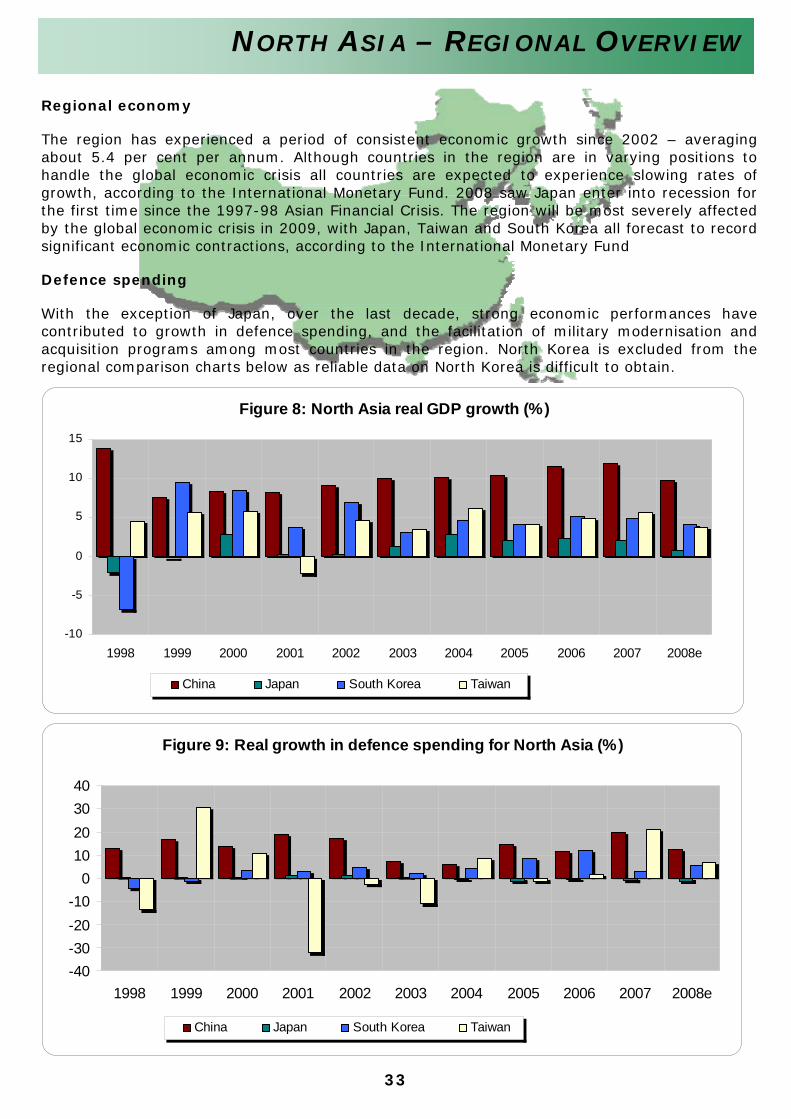
33
NORTH ASIA – REGIONAL OVERVIEW
Figure 8: North Asia real GDP growth (%)
-10
-5
0
5
10
15
1998 1999 2000 2001 2002 2003 2004 2005 2006 2007 2008e
China Japan South Korea Taiwan
Figure 9: Real growth in defence spending for North Asia (%)
-40-30-20-10
010203040
1998 1999 2000 2001 2002 2003 2004 2005 2006 2007 2008e
China Japan South Korea Taiwan
Regional economy
The region has experienced a period of consistent economic growth since 2002 – averagingabout 5.4 per cent per annum. Although countries in the region are in varying positions tohandle the global economic crisis all countries are expected to experience slowing rates ofgrowth, according to the International Monetary Fund. 2008 saw Japan enter into recession forthe first time since the 1997-98 Asian Financial Crisis. The region will be most severely affectedby the global economic crisis in 2009, with Japan, Taiwan and South Korea all forecast to recordsignificant economic contractions, according to the International Monetary Fund
Defence spending
With the exception of Japan, over the last decade, strong economic performances havecontributed to growth in defence spending, and the facilitation of military modernisation andacquisition programs among most countries in the region. North Korea is excluded from theregional comparison charts below as reliable data on North Korea is difficult to obtain.
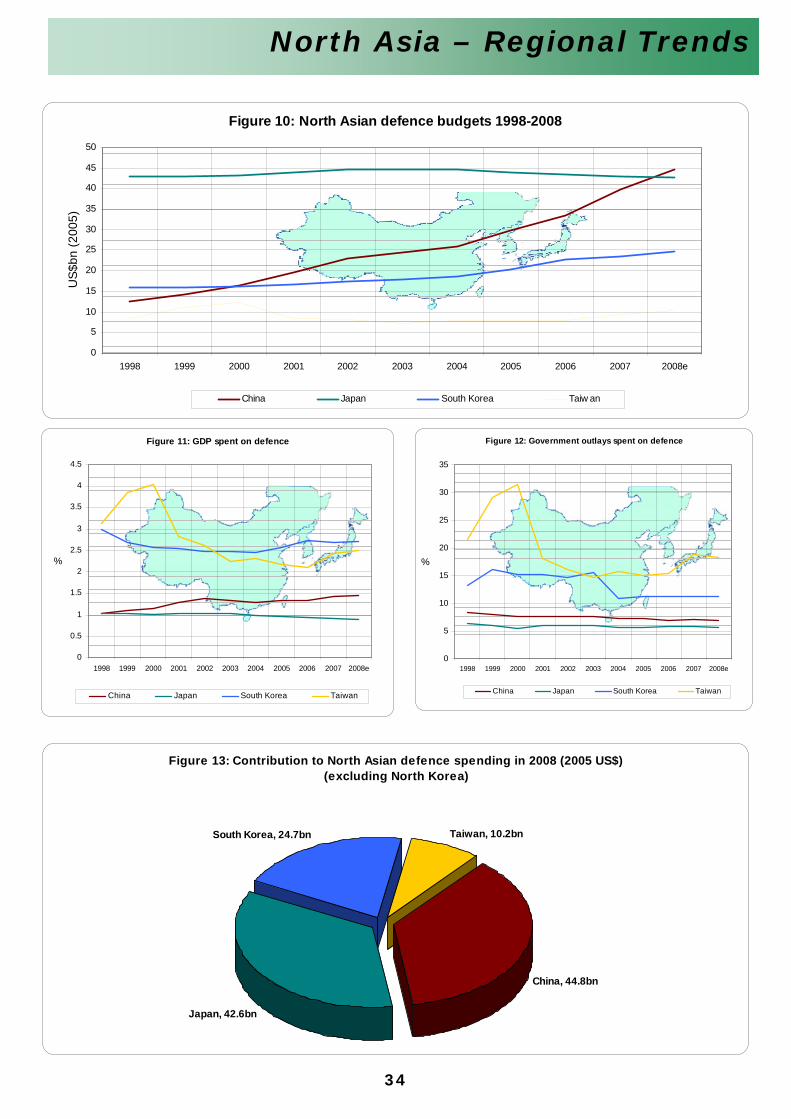
34
North Asia – Regional Trends
Figure 10: North Asian defence budgets 1998-2008
0
5
10
15
20
25
30
35
40
45
50
1998 1999 2000 2001 2002 2003 2004 2005 2006 2007 2008e
US$
bn (2
005)
China Japan South Korea Taiw an
Figure 11: GDP spent on defence
0
0.5
1
1.5
2
2.5
3
3.5
4
4.5
1998 1999 2000 2001 2002 2003 2004 2005 2006 2007 2008e
%
China Japan South Korea Taiwan
Figure 12: Government outlays spent on defence
0
5
10
15
20
25
30
35
1998 1999 2000 2001 2002 2003 2004 2005 2006 2007 2008e
%
China Japan South Korea Taiwan
Figure 13: Contribution to North Asian defence spending in 2008 (2005 US$)(excluding North Korea)
South Korea, 24.7bn Taiwan, 10.2bn
China, 44.8bn
Japan, 42.6bn
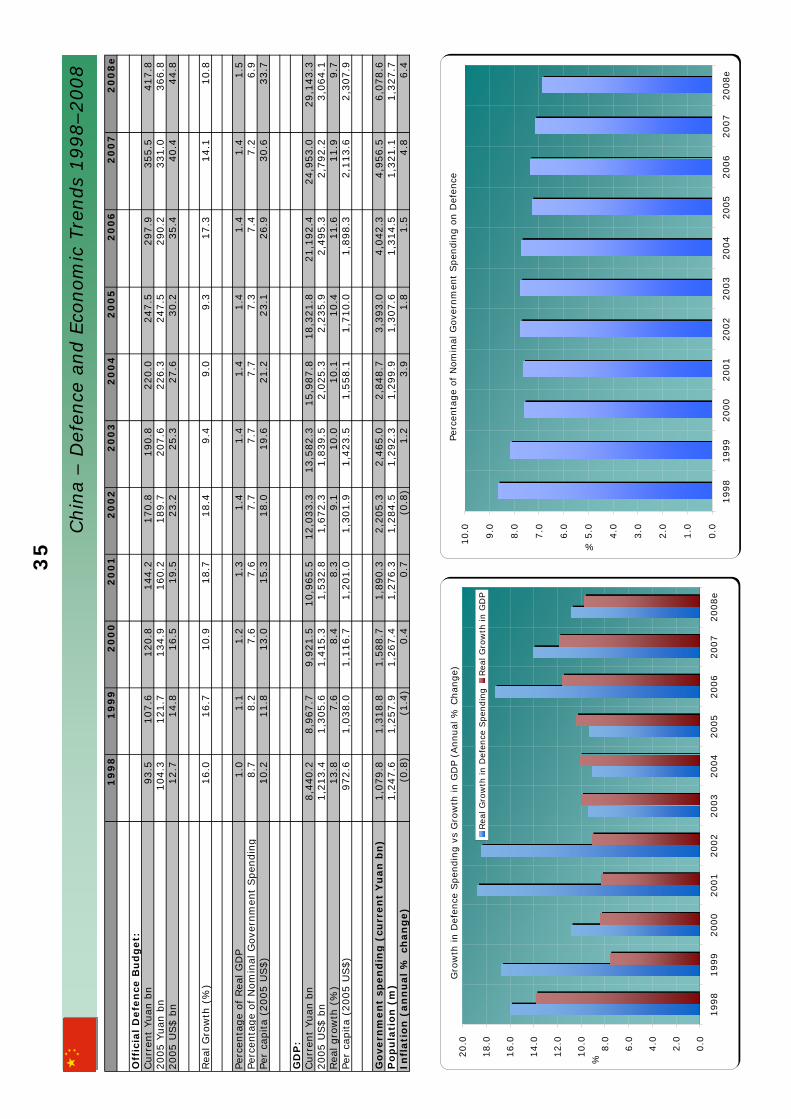
35
19
98
19
99
20
00
20
01
20
02
20
03
20
04
20
05
20
06
20
07
20
08
e
Off
icia
l D
efe
nce
Bu
dg
et:
Curr
ent
Yuan
bn
93.5
107.6
120.8
144.2
170.8
190.8
220.0
247.5
297.9
355.5
417.8
2005 Y
uan
bn
104.3
121.7
134.9
160.2
189.7
207.6
226.3
247.5
290.2
331.0
366.8
2005 U
S$ b
n12.7
14.8
16.5
19.5
23.2
25.3
27.6
30.2
35.4
40.4
44.8
Rea
l G
row
th (
%)
16.0
16.7
10.9
18.7
18.4
9.4
9.0
9.3
17.3
14.1
10.8
Perc
enta
ge
of
Rea
l G
DP
1.0
1.1
1.2
1.3
1.4
1.4
1.4
1.4
1.4
1.4
1.5
Perc
enta
ge
of
Nom
inal
Gove
rnm
ent
Spen
din
g8.7
8.2
7.6
7.6
7.7
7.7
7.7
7.3
7.4
7.2
6.9
Per
capita
(2005 U
S$)
10.2
11.8
13.0
15.3
18.0
19.6
21.2
23.1
26.9
30.6
33.7
GD
P:
Curr
ent
Yuan
bn
8,4
40.2
8,9
67.7
9,9
21.5
10,9
65.5
12,0
33.3
13,5
82.3
15,9
87.8
18,3
21.8
21,1
92.4
24,9
53.0
29,1
43.3
2005 U
S$ b
n1,2
13.4
1,3
05.6
1,4
15.3
1,5
32.8
1,6
72.3
1,8
39.5
2,0
25.3
2,2
35.9
2,4
95.3
2,7
92.2
3,0
64.1
Rea
l gro
wth
(%
)13.8
7.6
8.4
8.3
9.1
10.0
10.1
10.4
11.6
11.9
9.7
Per
capita
(2005 U
S$)
972.6
1,0
38.0
1,1
16.7
1,2
01.0
1,3
01.9
1,4
23.5
1,5
58.1
1,7
10.0
1,8
98.3
2,1
13.6
2,3
07.9
Go
vern
men
t sp
en
din
g (
curr
en
t Y
uan
bn
)1,0
79.8
1,3
18.8
1,5
88.7
1,8
90.3
2,2
05.3
2,4
65.0
2,8
48.7
3,3
93.0
4,0
42.3
4,9
56.5
6,0
78.6
Po
pu
lati
on
(m
)1,2
47.6
1,2
57.9
1,2
67.4
1,2
76.3
1,2
84.5
1,2
92.3
1,2
99.9
1,3
07.6
1,3
14.5
1,3
21.1
1,3
27.7
Infl
ati
on
(an
nu
al
% c
han
ge)
(0.8
)(1
.4)
0.4
0.7
(0.8
)1.2
3.9
1.8
1.5
4.8
6.4
Gro
wth
in D
efen
ce S
pen
din
g v
s G
row
th in G
DP
(Annual
% C
han
ge)
0.0
2.0
4.0
6.0
8.0
10.0
12.0
14.0
16.0
18.0
20.0
1998
1999
2000
2001
2002
2003
2004
2005
2006
2007
2008e
%
Rea
l G
row
th in D
efen
ce S
pen
din
gRea
l G
row
th in G
DP
Perc
enta
ge
of N
om
inal
Gove
rnm
ent
Spen
din
g o
n D
efen
ce
0.0
1.0
2.0
3.0
4.0
5.0
6.0
7.0
8.0
9.0
10.0
1998
1999
2000
2001
2002
2003
2004
2005
2006
2007
2008e
%
Chin
a – D
efen
ce a
nd E
conom
ic T
rends
1998–2008
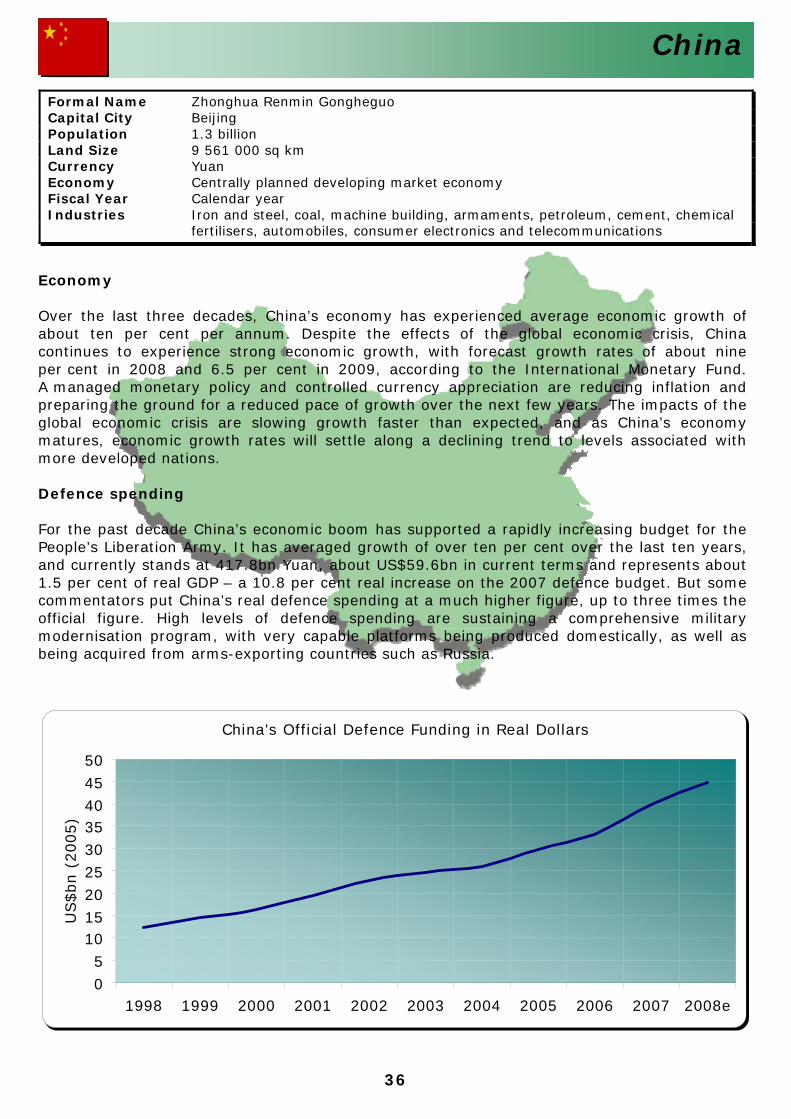
36
China
China's Official Defence Funding in Real Dollars
05
101520253035404550
1998 1999 2000 2001 2002 2003 2004 2005 2006 2007 2008e
US$bn (
2005)
Economy Over the last three decades, China’s economy has experienced average economic growth of about ten per cent per annum. Despite the effects of the global economic crisis, China continues to experience strong economic growth, with forecast growth rates of about nine per cent in 2008 and 6.5 per cent in 2009, according to the International Monetary Fund. A managed monetary policy and controlled currency appreciation are reducing inflation and preparing the ground for a reduced pace of growth over the next few years. The impacts of the global economic crisis are slowing growth faster than expected, and as China’s economy matures, economic growth rates will settle along a declining trend to levels associated with more developed nations. Defence spending For the past decade China’s economic boom has supported a rapidly increasing budget for the People’s Liberation Army. It has averaged growth of over ten per cent over the last ten years, and currently stands at 417.8bn Yuan, about US$59.6bn in current terms and represents about 1.5 per cent of real GDP – a 10.8 per cent real increase on the 2007 defence budget. But some commentators put China’s real defence spending at a much higher figure, up to three times the official figure. High levels of defence spending are sustaining a comprehensive military modernisation program, with very capable platforms being produced domestically, as well as being acquired from arms-exporting countries such as Russia.
Formal Name Zhonghua Renmin Gongheguo Capital City Beijing Population 1.3 billion Land Size 9 561 000 sq km Currency Yuan Economy Centrally planned developing market economy Fiscal Year Calendar year Industries Iron and steel, coal, machine building, armaments, petroleum, cement, chemical fertilisers, automobiles, consumer electronics and telecommunications
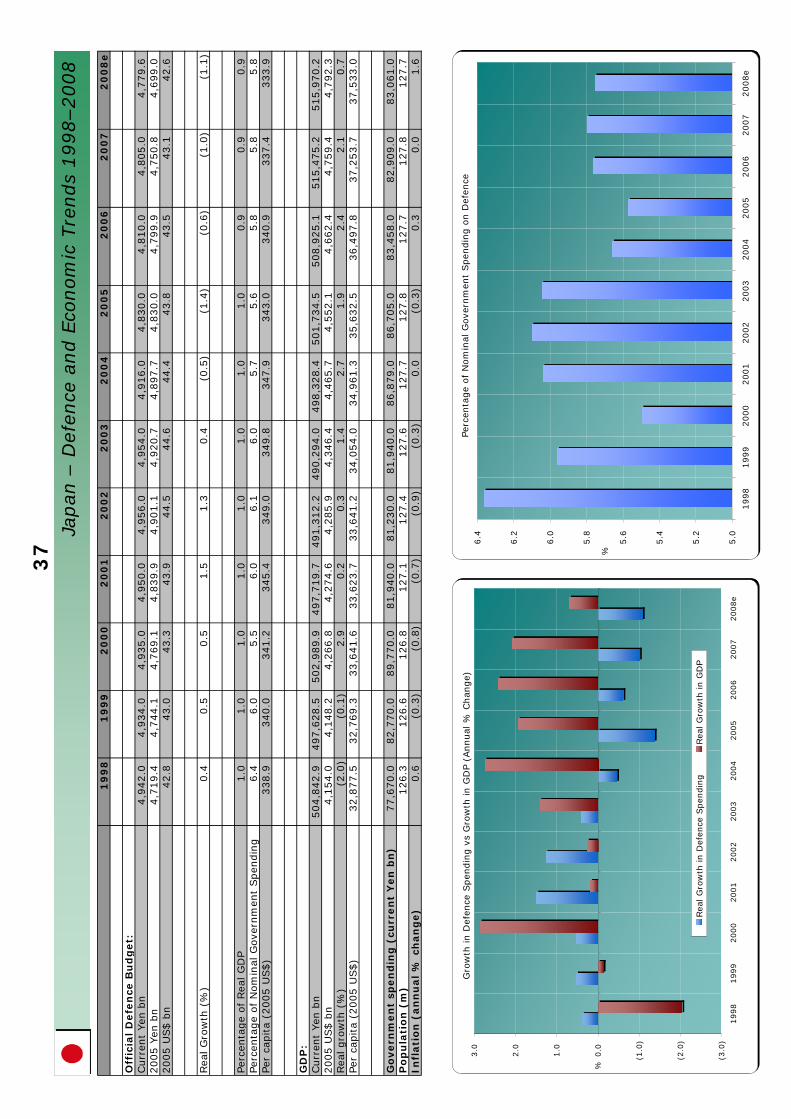
37
19
98
19
99
20
00
20
01
20
02
20
03
20
04
20
05
20
06
20
07
20
08
e
Off
icia
l D
efe
nce
Bu
dg
et:
Curr
ent
Yen
bn
4,9
42.0
4,9
34.0
4,9
35.0
4,9
50.0
4,9
56.0
4,9
54.0
4,9
16.0
4,8
30.0
4,8
10.0
4,8
05.0
4,7
79.6
2005 Y
en b
n4,7
19.4
4,7
44.1
4,7
69.1
4,8
39.9
4,9
01.1
4,9
20.7
4,8
97.7
4,8
30.0
4,7
99.9
4,7
50.8
4,6
99.0
2005 U
S$ b
n42.8
43.0
43.3
43.9
44.5
44.6
44.4
43.8
43.5
43.1
42.6
Rea
l G
row
th (
%)
0.4
0.5
0.5
1.5
1.3
0.4
(0.5
)(1
.4)
(0.6
)(1
.0)
(1.1
)
Perc
enta
ge
of Rea
l G
DP
1.0
1.0
1.0
1.0
1.0
1.0
1.0
1.0
0.9
0.9
0.9
Perc
enta
ge
of N
om
inal
Gove
rnm
ent
Spen
din
g6.4
6.0
5.5
6.0
6.1
6.0
5.7
5.6
5.8
5.8
5.8
Per
capita
(2005 U
S$)
338.9
340.0
341.2
345.4
349.0
349.8
347.9
343.0
340.9
337.4
333.9
GD
P:
Curr
ent
Yen
bn
504,8
42.9
497,6
28.5
502,9
89.9
497,7
19.7
491,3
12.2
490,2
94.0
498,3
28.4
501,7
34.5
508,9
25.1
515,4
75.2
515,9
70.2
2005 U
S$ b
n4,1
54.0
4,1
48.2
4,2
66.8
4,2
74.6
4,2
85.9
4,3
46.4
4,4
65.7
4,5
52.1
4,6
62.4
4,7
59.4
4,7
92.3
Rea
l gro
wth
(%
)(2
.0)
(0.1
)2.9
0.2
0.3
1.4
2.7
1.9
2.4
2.1
0.7
Per
capita
(2005 U
S$)
32,8
77.5
32,7
69.3
33,6
41.6
33,6
23.7
33,6
41.2
34,0
54.0
34,9
61.3
35,6
32.5
36,4
97.8
37,2
53.7
37,5
33.0
Go
vern
men
t sp
en
din
g (
curr
en
t Y
en
bn
)77,6
70.0
82,7
70.0
89,7
70.0
81,9
40.0
81,2
30.0
81,9
40.0
86,8
79.0
86,7
05.0
83,4
58.0
82,9
09.0
83,0
61.0
Po
pu
lati
on
(m
)126.3
126.6
126.8
127.1
127.4
127.6
127.7
127.8
127.7
127.8
127.7
Infl
ati
on
(an
nu
al
% c
han
ge)
0.6
(0.3
)(0
.8)
(0.7
)(0
.9)
(0.3
)0.0
(0.3
)0.3
0.0
1.6
Gro
wth
in D
efen
ce S
pen
din
g v
s G
row
th in G
DP
(Annual
% C
han
ge)
(3.0
)
(2.0
)
(1.0
)
0.0
1.0
2.0
3.0
1998
1999
2000
2001
2002
2003
2004
2005
2006
2007
2008e
%
Rea
l G
row
th in D
efen
ce S
pen
din
gRea
l G
row
th in G
DP
Perc
enta
ge
of
Nom
inal
Gove
rnm
ent
Spen
din
g o
n D
efen
ce
5.0
5.2
5.4
5.6
5.8
6.0
6.2
6.4
1998
1999
2000
2001
2002
2003
2004
2005
2006
2007
2008e
%
Japan
– D
efen
ce a
nd E
conom
ic T
rends
1998–2008
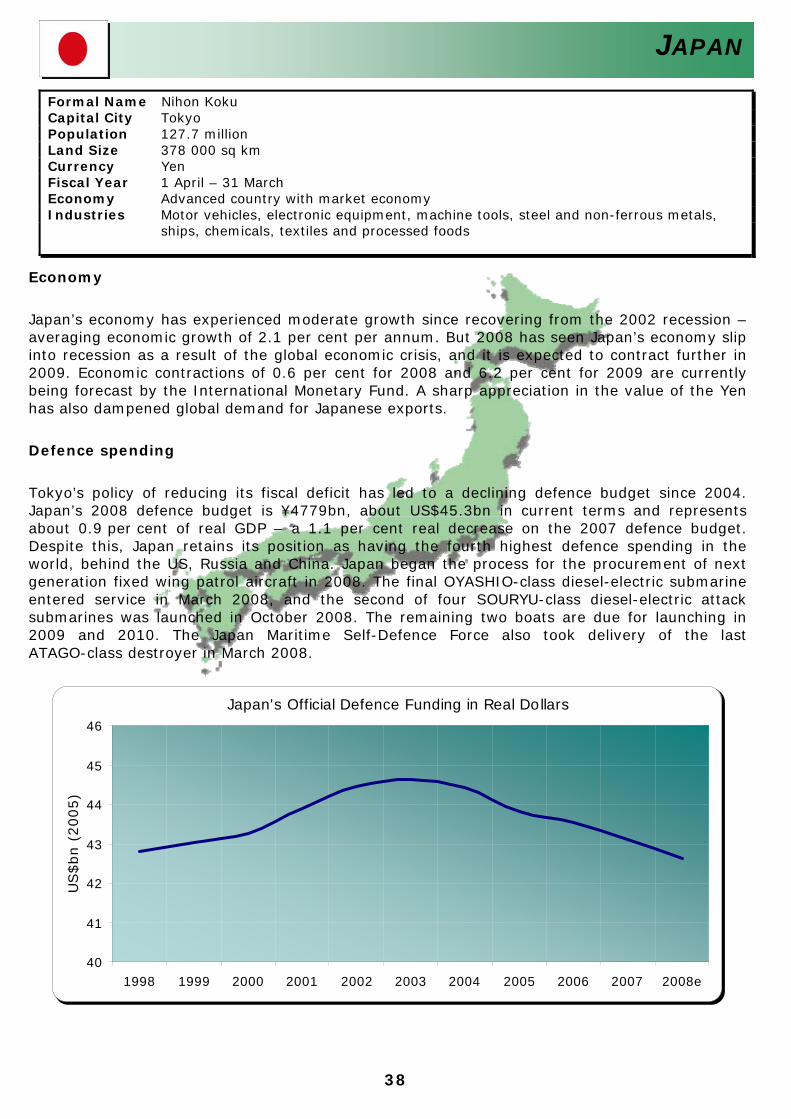
38
JAPAN
Japan's Official Defence Funding in Real Dollars
40
41
42
43
44
45
46
1998 1999 2000 2001 2002 2003 2004 2005 2006 2007 2008e
US
$bn (
2005)
Economy
Japan’s economy has experienced moderate growth since recovering from the 2002 recession –averaging economic growth of 2.1 per cent per annum. But 2008 has seen Japan’s economy slip into recession as a result of the global economic crisis, and it is expected to contract further in 2009. Economic contractions of 0.6 per cent for 2008 and 6.2 per cent for 2009 are currently being forecast by the International Monetary Fund. A sharp appreciation in the value of the Yen has also dampened global demand for Japanese exports.
Defence spending
Tokyo’s policy of reducing its fiscal deficit has led to a declining defence budget since 2004. Japan’s 2008 defence budget is ¥4779bn, about US$45.3bn in current terms and representsabout 0.9 per cent of real GDP – a 1.1 per cent real decrease on the 2007 defence budget. Despite this, Japan retains its position as having the fourth highest defence spending in the world, behind the US, Russia and China. Japan began the process for the procurement of nextgeneration fixed wing patrol aircraft in 2008. The final OYASHIO-class diesel-electric submarine entered service in March 2008, and the second of four SOURYU-class diesel-electric attack submarines was launched in October 2008. The remaining two boats are due for launching in2009 and 2010. The Japan Maritime Self-Defence Force also took delivery of the lastATAGO-class destroyer in March 2008.
Formal Name Nihon Koku Capital City Tokyo Population 127.7 million Land Size 378 000 sq km Currency Yen Fiscal Year 1 April – 31 March Economy Advanced country with market economy Industries Motor vehicles, electronic equipment, machine tools, steel and non-ferrous metals, ships, chemicals, textiles and processed foods
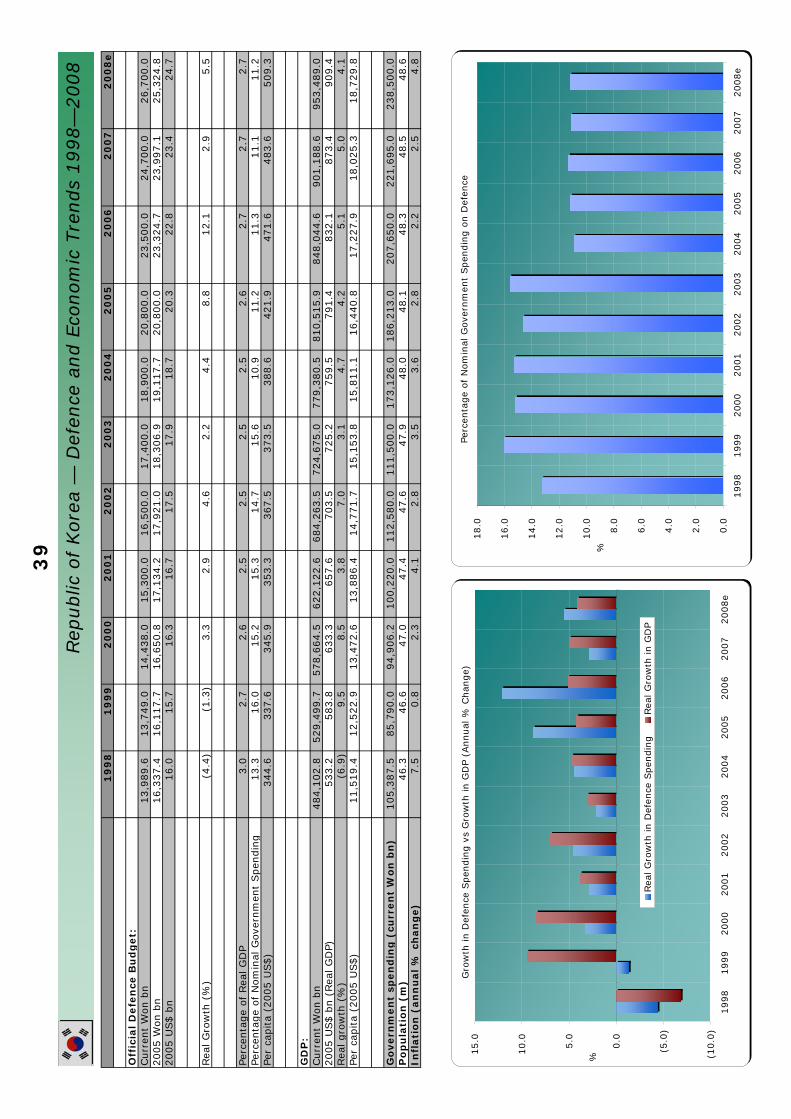
39
19
98
19
99
20
00
20
01
20
02
20
03
20
04
20
05
20
06
20
07
20
08
e
Off
icia
l D
efe
nce
Bu
dg
et:
Curr
ent
Won b
n13,9
89.6
13,7
49.0
14,4
38.0
15,3
00.0
16,5
00.0
17,4
00.0
18,9
00.0
20,8
00.0
23,5
00.0
24,7
00.0
26,7
00.0
2005 W
on b
n16,3
37.4
16,1
17.7
16,6
50.8
17,1
34.2
17,9
21.0
18,3
06.9
19,1
17.7
20,8
00.0
23,3
24.7
23,9
97.1
25,3
24.8
2005 U
S$ b
n16.0
15.7
16.3
16.7
17.5
17.9
18.7
20.3
22.8
23.4
24.7
Rea
l G
row
th (
%)
(4.4
)(1
.3)
3.3
2.9
4.6
2.2
4.4
8.8
12.1
2.9
5.5
Perc
enta
ge
of
Rea
l G
DP
3.0
2.7
2.6
2.5
2.5
2.5
2.5
2.6
2.7
2.7
2.7
Perc
enta
ge
of
Nom
inal
Gove
rnm
ent
Spen
din
g13.3
16.0
15.2
15.3
14.7
15.6
10.9
11.2
11.3
11.1
11.2
Per
capita
(2005 U
S$)
344.6
337.6
345.9
353.3
367.5
373.5
388.6
421.9
471.6
483.6
509.3
GD
P:
Curr
ent
Won b
n484,1
02.8
529,4
99.7
578,6
64.5
622,1
22.6
684,2
63.5
724,6
75.0
779,3
80.5
810,5
15.9
848,0
44.6
901,1
88.6
953,4
89.0
2005 U
S$ b
n (
Rea
l G
DP)
533.2
583.8
633.3
657.6
703.5
725.2
759.5
791.4
832.1
873.4
909.4
Rea
l gro
wth
(%
)(6
.9)
9.5
8.5
3.8
7.0
3.1
4.7
4.2
5.1
5.0
4.1
Per
capita
(2005 U
S$)
11,5
19.4
12,5
22.9
13,4
72.6
13,8
86.4
14,7
71.7
15,1
53.8
15,8
11.1
16,4
40.8
17,2
27.9
18,0
25.3
18,7
29.8
Go
vern
men
t sp
en
din
g (
curr
en
t W
on
bn
)105,3
87.5
85,7
90.0
94,9
06.2
100,2
20.0
112,5
80.0
111,5
00.0
173,1
26.0
186,2
13.0
207,6
50.0
221,6
95.0
238,5
00.0
Po
pu
lati
on
(m
)46.3
46.6
47.0
47.4
47.6
47.9
48.0
48.1
48.3
48.5
48.6
Infl
ati
on
(an
nu
al
% c
han
ge)
7.5
0.8
2.3
4.1
2.8
3.5
3.6
2.8
2.2
2.5
4.8
Gro
wth
in D
efen
ce S
pen
din
g v
s G
row
th in G
DP
(Annual
% C
han
ge)
(10.0
)
(5.0
)
0.0
5.0
10.0
15.0
1998
1999
2000
2001
2002
2003
2004
2005
2006
2007
2008e
%
Rea
l G
row
th in D
efen
ce S
pen
din
gRea
l G
row
th in G
DP
Perc
enta
ge
of N
om
inal
Gove
rnm
ent
Spen
din
g o
n D
efen
ce
0.0
2.0
4.0
6.0
8.0
10.0
12.0
14.0
16.0
18.0
1998
1999
2000
2001
2002
2003
2004
2005
2006
2007
2008e
%
Rep
ublic
of
Kore
a —
Def
ence
and E
conom
ic T
rends
1998—
2008
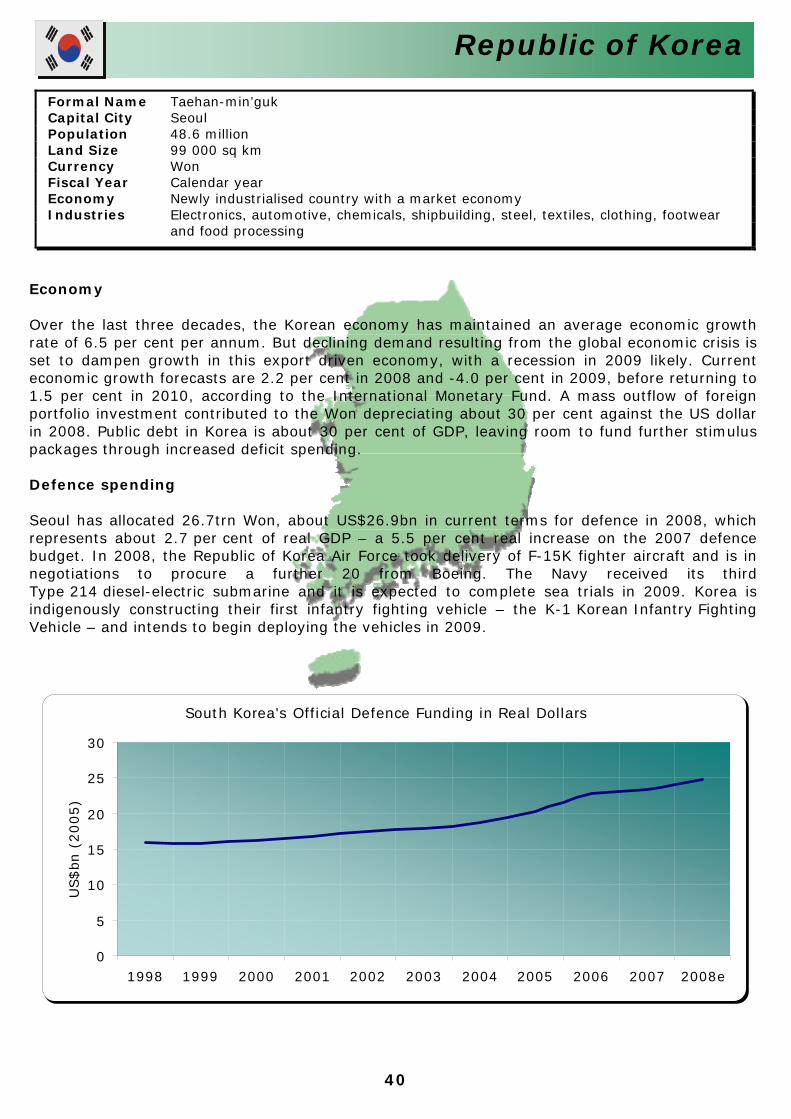
40
Republic of Korea
South Korea's Official Defence Funding in Real Dollars
0
5
10
15
20
25
30
1998 1999 2000 2001 2002 2003 2004 2005 2006 2007 2008e
US$bn
(2005)
Economy Over the last three decades, the Korean economy has maintained an average economic growthrate of 6.5 per cent per annum. But declining demand resulting from the global economic crisis is set to dampen growth in this export driven economy, with a recession in 2009 likely. Current economic growth forecasts are 2.2 per cent in 2008 and -4.0 per cent in 2009, before returning to1.5 per cent in 2010, according to the International Monetary Fund. A mass outflow of foreign portfolio investment contributed to the Won depreciating about 30 per cent against the US dollarin 2008. Public debt in Korea is about 30 per cent of GDP, leaving room to fund further stimuluspackages through increased deficit spending. Defence spending Seoul has allocated 26.7trn Won, about US$26.9bn in current terms for defence in 2008, whichrepresents about 2.7 per cent of real GDP – a 5.5 per cent real increase on the 2007 defence budget. In 2008, the Republic of Korea Air Force took delivery of F-15K fighter aircraft and is in negotiations to procure a further 20 from Boeing. The Navy received its third Type 214 diesel-electric submarine and it is expected to complete sea trials in 2009. Korea is indigenously constructing their first infantry fighting vehicle – the K-1 Korean Infantry Fighting Vehicle – and intends to begin deploying the vehicles in 2009.
Formal Name Taehan-min’guk Capital City Seoul Population 48.6 million Land Size 99 000 sq km Currency Won Fiscal Year Calendar year Economy Newly industrialised country with a market economy Industries Electronics, automotive, chemicals, shipbuilding, steel, textiles, clothing, footwear
and food processing
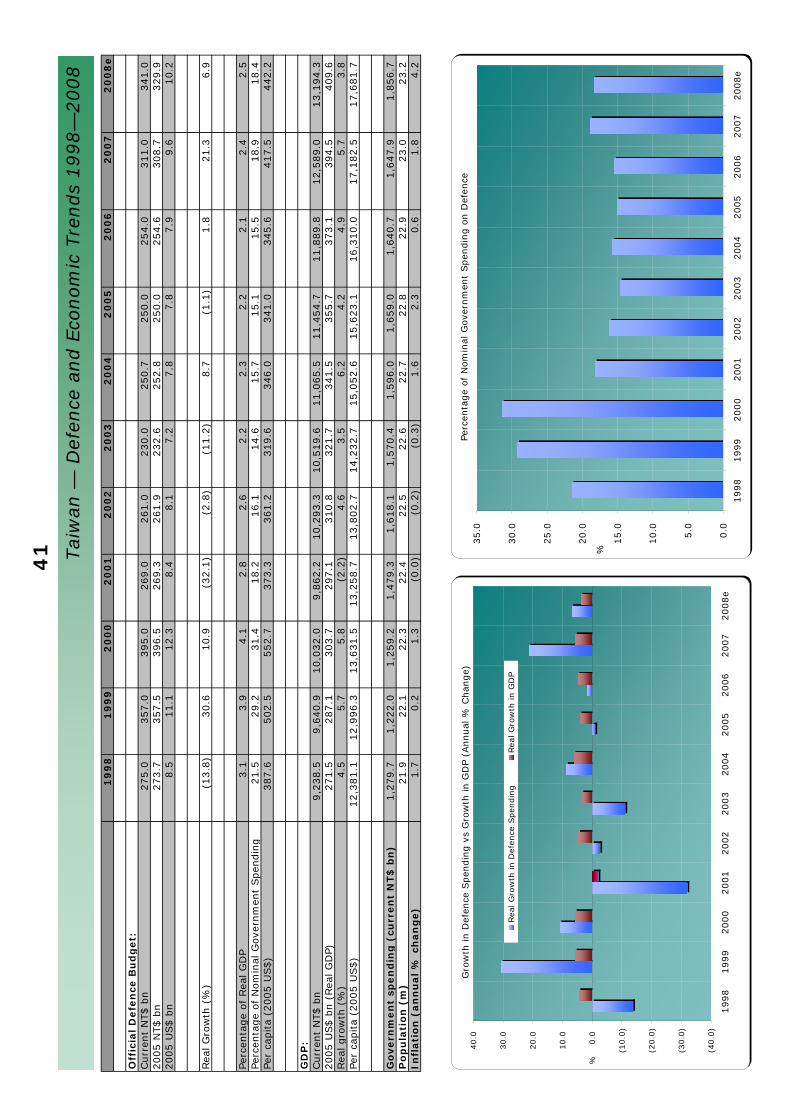
41
19
98
19
99
20
00
20
01
20
02
20
03
20
04
20
05
20
06
20
07
20
08
e
Off
icia
l D
efe
nce
Bu
dg
et:
Curr
ent
NT$ b
n275.0
357.0
395.0
269.0
261.0
230.0
250.7
250.0
254.0
311.0
341.0
2005 N
T$ b
n273.7
357.5
396.5
269.3
261.9
232.6
252.8
250.0
254.6
308.7
329.9
2005 U
S$ b
n8.5
11.1
12.3
8.4
8.1
7.2
7.8
7.8
7.9
9.6
10.2
Rea
l G
row
th (
%)
(13.8
)30.6
10.9
(32.1
)(2
.8)
(11.2
)8.7
(1.1
)1.8
21.3
6.9
Perc
enta
ge
of
Rea
l G
DP
3.1
3.9
4.1
2.8
2.6
2.2
2.3
2.2
2.1
2.4
2.5
Perc
enta
ge
of
Nom
inal
Gove
rnm
ent
Spen
din
g21.5
29.2
31.4
18.2
16.1
14.6
15.7
15.1
15.5
18.9
18.4
Per
capita
(2005 U
S$)
387.6
502.5
552.7
373.3
361.2
319.6
346.0
341.0
345.6
417.5
442.2
GD
P:
Curr
ent
NT$ b
n9,2
38.5
9,6
40.9
10,0
32.0
9,8
62.2
10,2
93.3
10,5
19.6
11,0
65.5
11,4
54.7
11,8
89.8
12,5
89.0
13,1
94.3
2005 U
S$ b
n (
Rea
l G
DP)
271.5
287.1
303.7
297.1
310.8
321.7
341.5
355.7
373.1
394.5
409.6
Rea
l gro
wth
(%
)4.5
5.7
5.8
(2.2
)4.6
3.5
6.2
4.2
4.9
5.7
3.8
Per
capita
(2005 U
S$)
12,3
81.1
12,9
96.3
13,6
31.5
13,2
58.7
13,8
02.7
14,2
32.7
15,0
52.6
15,6
23.1
16,3
10.0
17,1
82.5
17,6
81.7
Go
vern
men
t sp
en
din
g (
curr
en
t N
T$
bn
)1,2
79.7
1,2
22.0
1,2
59.2
1,4
79.3
1,6
18.1
1,5
70.4
1,5
96.0
1,6
59.0
1,6
40.7
1,6
47.9
1,8
56.7
Po
pu
lati
on
(m
)21.9
22.1
22.3
22.4
22.5
22.6
22.7
22.8
22.9
23.0
23.2
Infl
ati
on
(an
nu
al
% c
han
ge)
1.7
0.2
1.3
(0.0
)(0
.2)
(0.3
)1.6
2.3
0.6
1.8
4.2
Gro
wth
in D
efen
ce S
pen
din
g v
s G
row
th in G
DP
(Annual
% C
han
ge)
(40.0
)
(30.0
)
(20.0
)
(10.0
)
0.0
10.0
20.0
30.0
40.0
1998
1999
2000
2001
2002
2003
2004
2005
2006
2007
2008e
%
Rea
l G
row
th in D
efen
ce S
pen
din
gRea
l G
row
th in G
DP
Perc
enta
ge
of N
om
inal
Gove
rnm
ent
Spen
din
g o
n D
efen
ce
0.0
5.0
10.0
15.0
20.0
25.0
30.0
35.0
1998
1999
2000
2001
2002
2003
2004
2005
2006
2007
2008e
%Tai
wan
— D
efen
ce a
nd E
conom
ic T
rends
1998—
2008
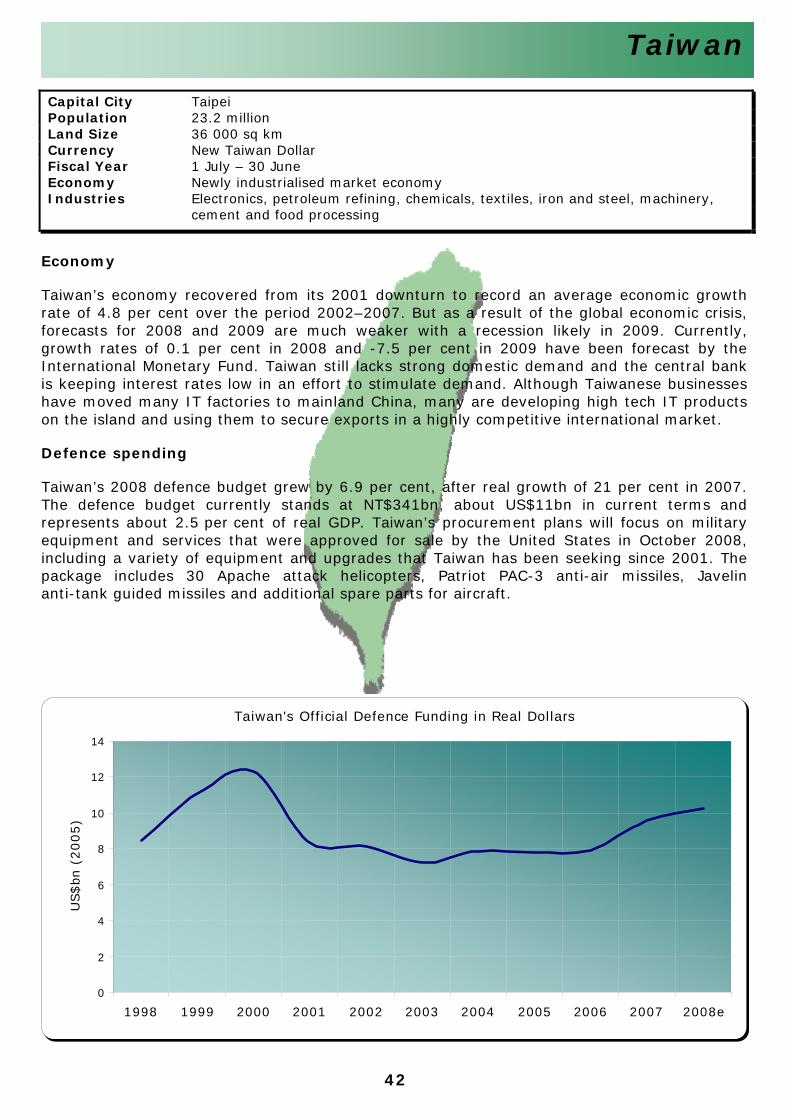
42
Taiwan
Taiwan's Official Defence Funding in Real Dollars
0
2
4
6
8
10
12
14
1998 1999 2000 2001 2002 2003 2004 2005 2006 2007 2008e
US$bn
(2005)
Capital City Taipei Population 23.2 million Land Size 36 000 sq km Currency New Taiwan Dollar Fiscal Year 1 July – 30 June Economy Newly industrialised market economy Industries Electronics, petroleum refining, chemicals, textiles, iron and steel, machinery,
cement and food processing
Economy
Taiwan’s economy recovered from its 2001 downturn to record an average economic growth rate of 4.8 per cent over the period 2002–2007. But as a result of the global economic crisis, forecasts for 2008 and 2009 are much weaker with a recession likely in 2009. Currently,growth rates of 0.1 per cent in 2008 and -7.5 per cent in 2009 have been forecast by the International Monetary Fund. Taiwan still lacks strong domestic demand and the central bankis keeping interest rates low in an effort to stimulate demand. Although Taiwanese businesses have moved many IT factories to mainland China, many are developing high tech IT products on the island and using them to secure exports in a highly competitive international market.
Defence spending
Taiwan’s 2008 defence budget grew by 6.9 per cent, after real growth of 21 per cent in 2007. The defence budget currently stands at NT$341bn, about US$11bn in current terms and represents about 2.5 per cent of real GDP. Taiwan’s procurement plans will focus on militaryequipment and services that were approved for sale by the United States in October 2008, including a variety of equipment and upgrades that Taiwan has been seeking since 2001. Thepackage includes 30 Apache attack helicopters, Patriot PAC-3 anti-air missiles, Javelin anti-tank guided missiles and additional spare parts for aircraft.
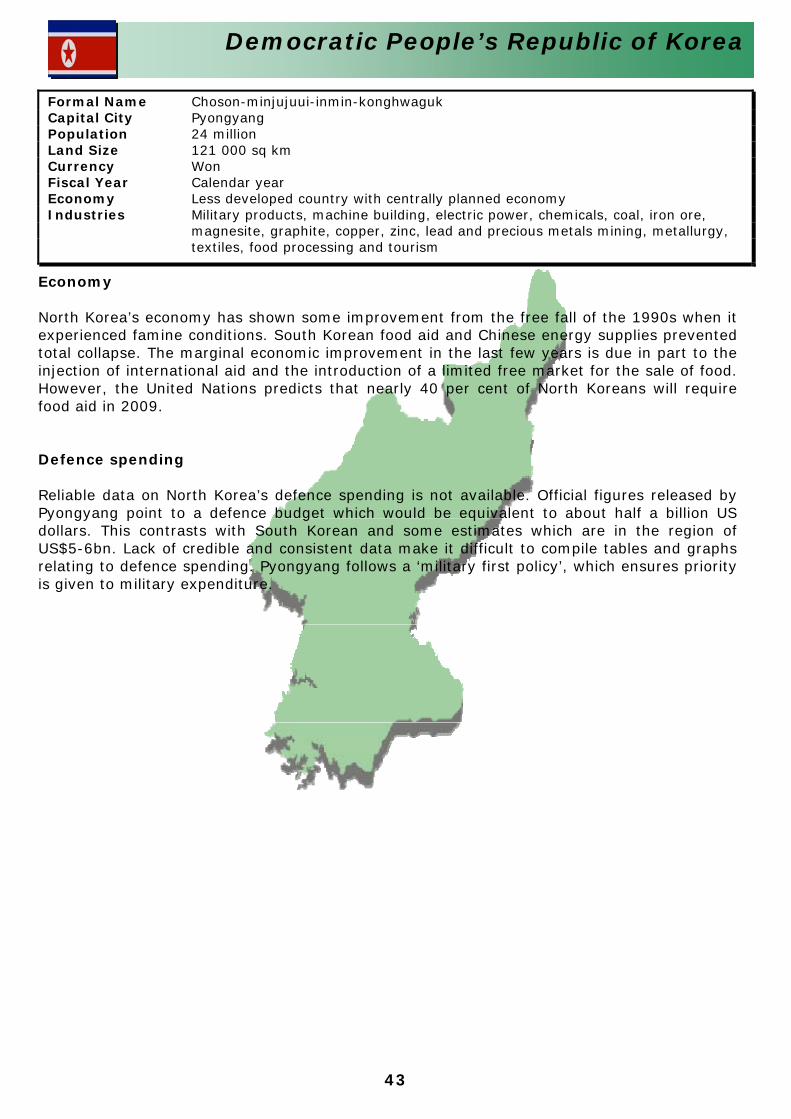
43
Democratic People’s Republic of Korea
Formal Name Choson-minjujuui-inmin-konghwaguk Capital City Pyongyang Population 24 million Land Size 121 000 sq km Currency Won Fiscal Year Calendar year Economy Less developed country with centrally planned economy Industries Military products, machine building, electric power, chemicals, coal, iron ore,
magnesite, graphite, copper, zinc, lead and precious metals mining, metallurgy, textiles, food processing and tourism
Economy North Korea’s economy has shown some improvement from the free fall of the 1990s when it experienced famine conditions. South Korean food aid and Chinese energy supplies prevented total collapse. The marginal economic improvement in the last few years is due in part to the injection of international aid and the introduction of a limited free market for the sale of food. However, the United Nations predicts that nearly 40 per cent of North Koreans will require food aid in 2009. Defence spending Reliable data on North Korea’s defence spending is not available. Official figures released by Pyongyang point to a defence budget which would be equivalent to about half a billion US dollars. This contrasts with South Korean and some estimates which are in the region of US$5-6bn. Lack of credible and consistent data make it difficult to compile tables and graphs relating to defence spending. Pyongyang follows a ‘military first policy’, which ensures priority is given to military expenditure.
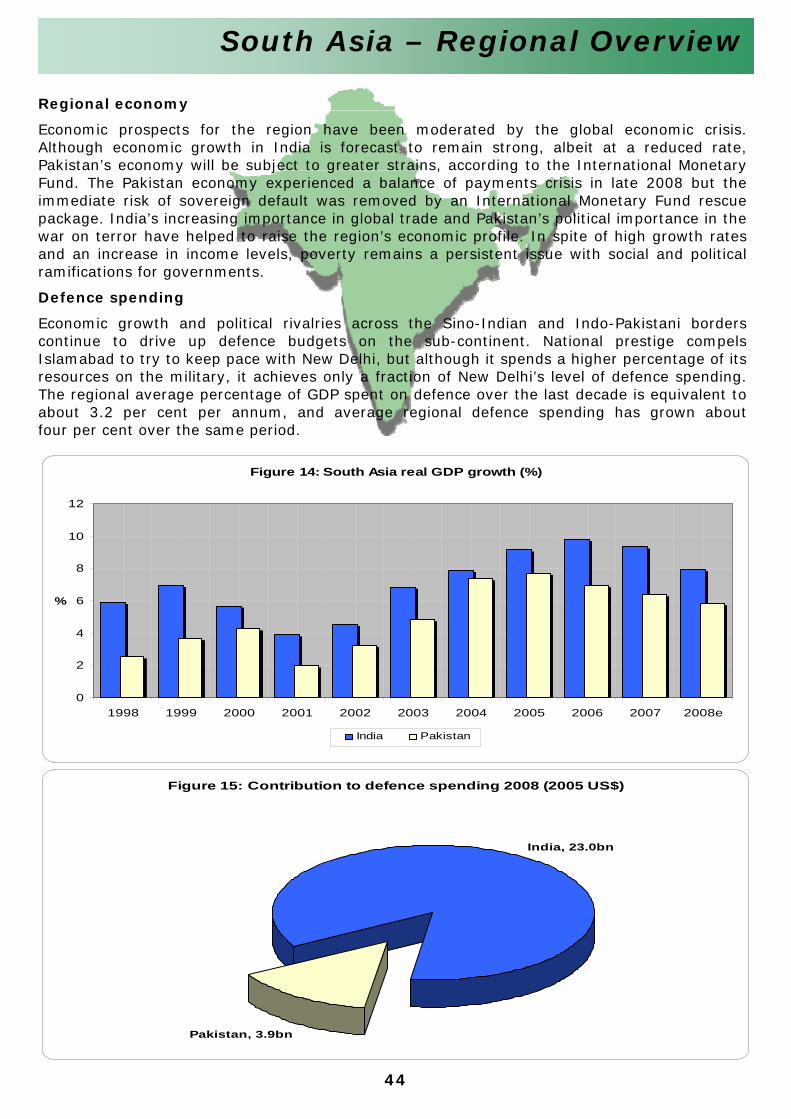
44
South Asia – Regional Overview
Figure 14: South Asia real GDP growth (%)
0
2
4
6
8
10
12
1998 1999 2000 2001 2002 2003 2004 2005 2006 2007 2008e
%
India Pakistan
Figure 15: Contribution to defence spending 2008 (2005 US$)
Pakistan, 3.9bn
India, 23.0bn
Regional economy
Economic prospects for the region have been moderated by the global economic crisis.Although economic growth in India is forecast to remain strong, albeit at a reduced rate,Pakistan’s economy will be subject to greater strains, according to the International MonetaryFund. The Pakistan economy experienced a balance of payments crisis in late 2008 but theimmediate risk of sovereign default was removed by an International Monetary Fund rescuepackage. India’s increasing importance in global trade and Pakistan’s political importance in thewar on terror have helped to raise the region’s economic profile. In spite of high growth rates and an increase in income levels, poverty remains a persistent issue with social and political ramifications for governments.
Defence spending
Economic growth and political rivalries across the Sino-Indian and Indo-Pakistani borders continue to drive up defence budgets on the sub-continent. National prestige compels Islamabad to try to keep pace with New Delhi, but although it spends a higher percentage of its resources on the military, it achieves only a fraction of New Delhi’s level of defence spending. The regional average percentage of GDP spent on defence over the last decade is equivalent to about 3.2 per cent per annum, and average regional defence spending has grown aboutfour per cent over the same period.
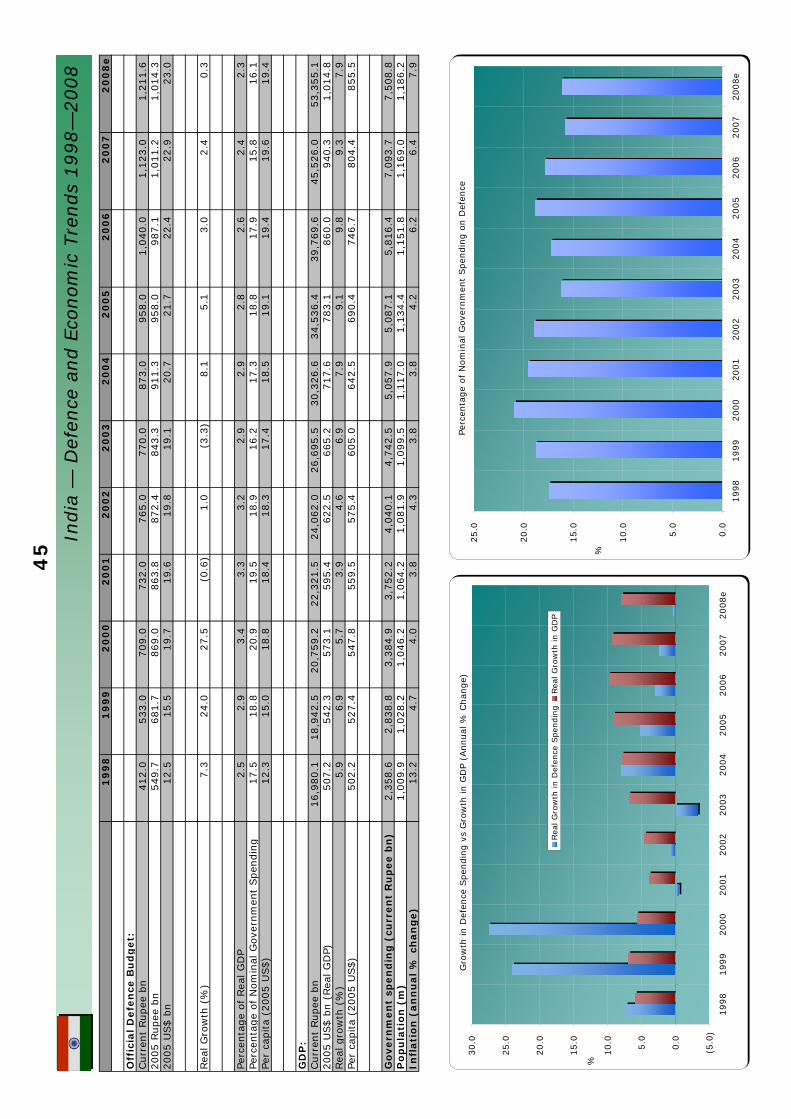
45
19
98
19
99
20
00
20
01
20
02
20
03
20
04
20
05
20
06
20
07
20
08
e
Off
icia
l D
efe
nce
Bu
dg
et:
Curr
ent
Rupee
bn
412.0
533.0
709.0
732.0
765.0
770.0
873.0
958.0
1,0
40.0
1,1
23.0
1,2
11.6
2005 R
upee
bn
549.7
681.7
869.0
863.8
872.4
843.3
911.3
958.0
987.1
1,0
11.2
1,0
14.3
2005 U
S$ b
n12.5
15.5
19.7
19.6
19.8
19.1
20.7
21.7
22.4
22.9
23.0
Rea
l G
row
th (
%)
7.3
24.0
27.5
(0.6
)1.0
(3.3
)8.1
5.1
3.0
2.4
0.3
Perc
enta
ge
of
Rea
l G
DP
2.5
2.9
3.4
3.3
3.2
2.9
2.9
2.8
2.6
2.4
2.3
Perc
enta
ge
of
Nom
inal
Gove
rnm
ent
Spen
din
g17.5
18.8
20.9
19.5
18.9
16.2
17.3
18.8
17.9
15.8
16.1
Per
capita
(2005 U
S$)
12.3
15.0
18.8
18.4
18.3
17.4
18.5
19.1
19.4
19.6
19.4
GD
P:
Curr
ent
Rupee
bn
16,9
80.1
18,9
42.5
20,7
59.2
22,3
21.5
24,0
62.0
26,6
95.5
30,3
26.6
34,5
36.4
39,7
69.6
45,5
26.0
53,3
55.1
2005 U
S$ b
n (
Rea
l G
DP)
507.2
542.3
573.1
595.4
622.5
665.2
717.6
783.1
860.0
940.3
1,0
14.8
Rea
l gro
wth
(%
)5.9
6.9
5.7
3.9
4.6
6.9
7.9
9.1
9.8
9.3
7.9
Per
capita
(2005 U
S$)
502.2
527.4
547.8
559.5
575.4
605.0
642.5
690.4
746.7
804.4
855.5
Go
vern
men
t sp
en
din
g (
curr
en
t R
up
ee b
n)
2,3
58.6
2,8
38.8
3,3
84.9
3,7
52.2
4,0
40.1
4,7
42.5
5,0
57.9
5,0
87.1
5,8
16.4
7,0
93.7
7,5
08.8
Po
pu
lati
on
(m
)1,0
09.9
1,0
28.2
1,0
46.2
1,0
64.2
1,0
81.9
1,0
99.5
1,1
17.0
1,1
34.4
1,1
51.8
1,1
69.0
1,1
86.2
Infl
ati
on
(an
nu
al
% c
han
ge)
13.2
4.7
4.0
3.8
4.3
3.8
3.8
4.2
6.2
6.4
7.9
Gro
wth
in D
efen
ce S
pen
din
g v
s G
row
th in G
DP
(Annual
% C
han
ge)
(5.0
)
0.0
5.0
10.0
15.0
20.0
25.0
30.0
1998
1999
2000
2001
2002
2003
2004
2005
2006
2007
2008e
%
Rea
l G
row
th in D
efen
ce S
pen
din
gRea
l G
row
th in G
DP
Perc
enta
ge
of
Nom
inal
Gove
rnm
ent
Spen
din
g o
n D
efen
ce
0.0
5.0
10.0
15.0
20.0
25.0
1998
1999
2000
2001
2002
2003
2004
2005
2006
2007
2008e
%
India
— D
efen
ce a
nd E
conom
ic T
rends
1998—
2008
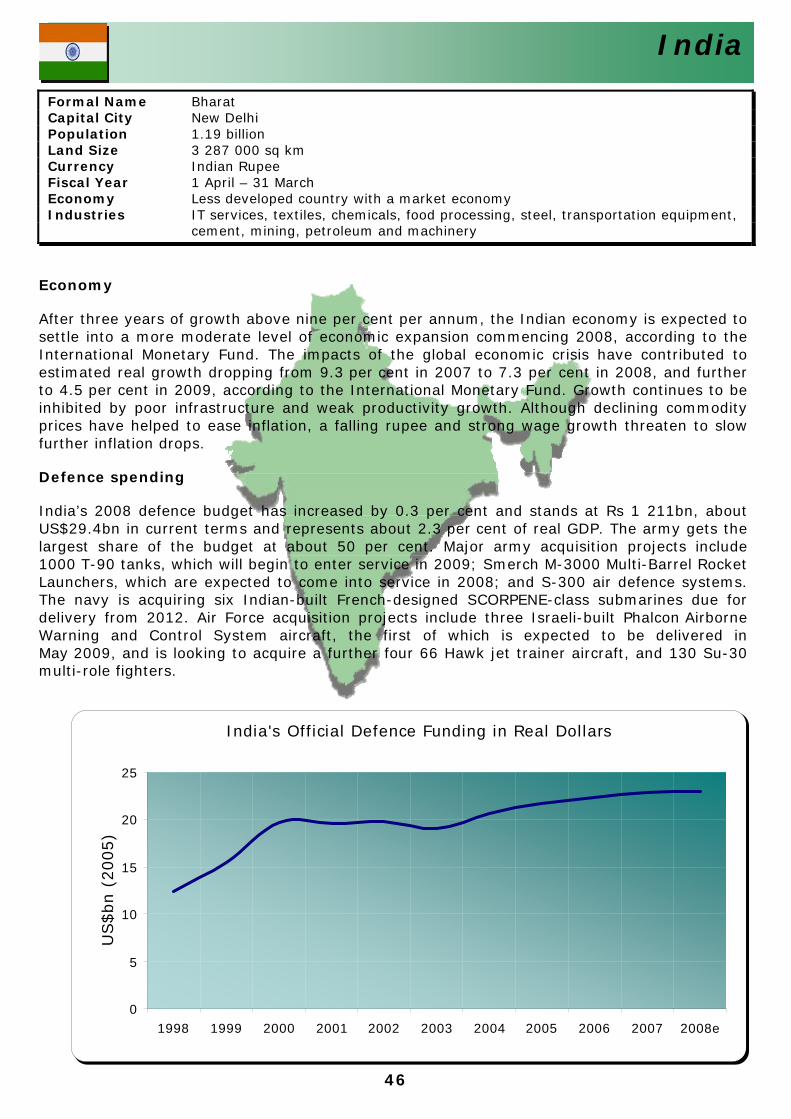
46
India
India's Official Defence Funding in Real Dollars
0
5
10
15
20
25
1998 1999 2000 2001 2002 2003 2004 2005 2006 2007 2008e
US$bn (
2005)
Economy
After three years of growth above nine per cent per annum, the Indian economy is expected to settle into a more moderate level of economic expansion commencing 2008, according to the International Monetary Fund. The impacts of the global economic crisis have contributed to estimated real growth dropping from 9.3 per cent in 2007 to 7.3 per cent in 2008, and further to 4.5 per cent in 2009, according to the International Monetary Fund. Growth continues to be inhibited by poor infrastructure and weak productivity growth. Although declining commodity prices have helped to ease inflation, a falling rupee and strong wage growth threaten to slow further inflation drops.
Defence spending
India’s 2008 defence budget has increased by 0.3 per cent and stands at Rs 1 211bn, about US$29.4bn in current terms and represents about 2.3 per cent of real GDP. The army gets the largest share of the budget at about 50 per cent. Major army acquisition projects include 1000 T-90 tanks, which will begin to enter service in 2009; Smerch M-3000 Multi-Barrel Rocket Launchers, which are expected to come into service in 2008; and S-300 air defence systems. The navy is acquiring six Indian-built French-designed SCORPENE-class submarines due for delivery from 2012. Air Force acquisition projects include three Israeli-built Phalcon Airborne Warning and Control System aircraft, the first of which is expected to be delivered in May 2009, and is looking to acquire a further four 66 Hawk jet trainer aircraft, and 130 Su-30 multi-role fighters.
Formal Name Bharat Capital City New Delhi Population 1.19 billion Land Size 3 287 000 sq km Currency Indian Rupee Fiscal Year 1 April – 31 March Economy Less developed country with a market economy Industries IT services, textiles, chemicals, food processing, steel, transportation equipment,
cement, mining, petroleum and machinery
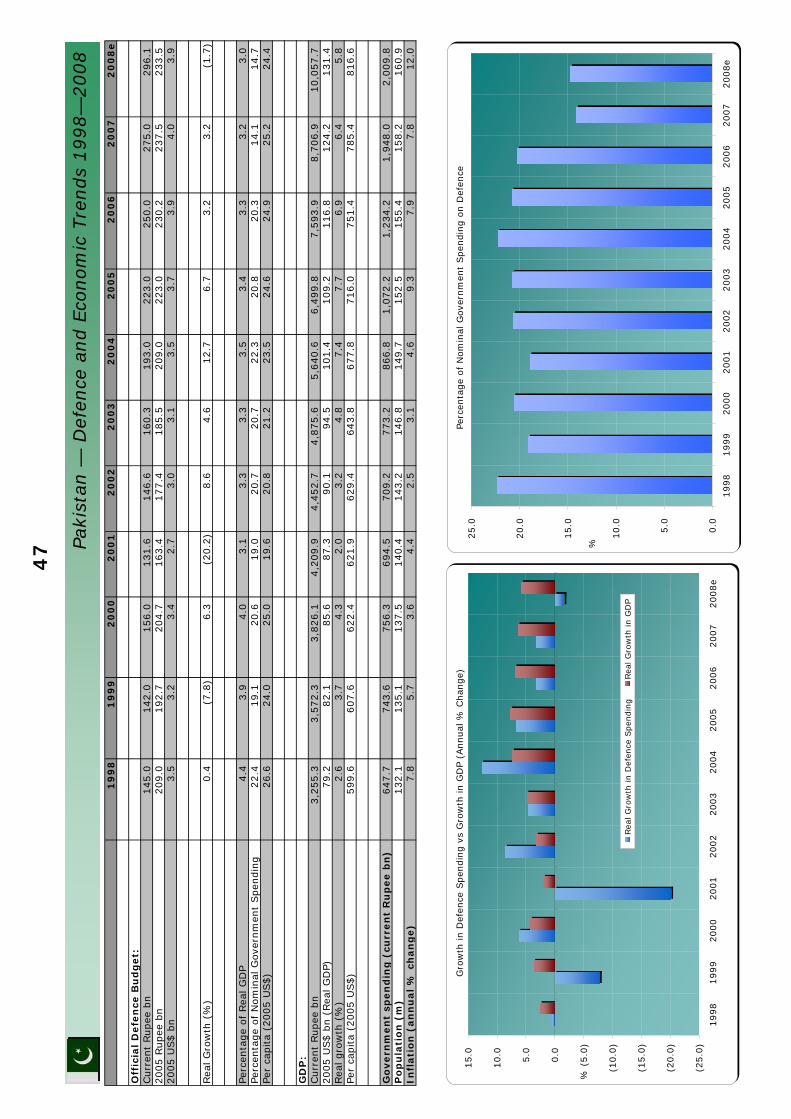
47
19
98
19
99
20
00
20
01
20
02
20
03
20
04
20
05
20
06
20
07
20
08
e
Off
icia
l D
efe
nce
Bu
dg
et:
Curr
ent
Rupee
bn
145.0
142.0
156.0
131.6
146.6
160.3
193.0
223.0
250.0
275.0
296.1
2005 R
upee
bn
209.0
192.7
204.7
163.4
177.4
185.5
209.0
223.0
230.2
237.5
233.5
2005 U
S$ b
n3.5
3.2
3.4
2.7
3.0
3.1
3.5
3.7
3.9
4.0
3.9
Rea
l G
row
th (
%)
0.4
(7.8
)6.3
(20.2
)8.6
4.6
12.7
6.7
3.2
3.2
(1.7
)
Perc
enta
ge
of Rea
l G
DP
4.4
3.9
4.0
3.1
3.3
3.3
3.5
3.4
3.3
3.2
3.0
Perc
enta
ge
of N
om
inal
Gove
rnm
ent
Spen
din
g22.4
19.1
20.6
19.0
20.7
20.7
22.3
20.8
20.3
14.1
14.7
Per
capita
(2005 U
S$)
26.6
24.0
25.0
19.6
20.8
21.2
23.5
24.6
24.9
25.2
24.4
GD
P:
Curr
ent
Rupee
bn
3,2
55.3
3,5
72.3
3,8
26.1
4,2
09.9
4,4
52.7
4,8
75.6
5,6
40.6
6,4
99.8
7,5
93.9
8,7
06.9
10,0
57.7
2005 U
S$ b
n (
Rea
l G
DP)
79.2
82.1
85.6
87.3
90.1
94.5
101.4
109.2
116.8
124.2
131.4
Rea
l gro
wth
(%
)2.6
3.7
4.3
2.0
3.2
4.8
7.4
7.7
6.9
6.4
5.8
Per
capita
(2005 U
S$)
599.6
607.6
622.4
621.9
629.4
643.8
677.8
716.0
751.4
785.4
816.6
Go
vern
men
t sp
en
din
g (
curr
en
t R
up
ee b
n)
647.7
743.6
756.3
694.5
709.2
773.2
866.8
1,0
72.2
1,2
34.2
1,9
48.0
2,0
09.8
Po
pu
lati
on
(m
)132.1
135.1
137.5
140.4
143.2
146.8
149.7
152.5
155.4
158.2
160.9
Infl
ati
on
(an
nu
al %
ch
an
ge)
7.8
5.7
3.6
4.4
2.5
3.1
4.6
9.3
7.9
7.8
12.0
Gro
wth
in D
efen
ce S
pen
din
g v
s G
row
th in G
DP
(Annual
% C
han
ge)
(25.0
)
(20.0
)
(15.0
)
(10.0
)
(5.0
)
0.0
5.0
10.0
15.0
1998
1999
2000
2001
2002
2003
2004
2005
2006
2007
2008e
%
Rea
l G
row
th in D
efen
ce S
pen
din
gRea
l G
row
th in G
DP
Perc
enta
ge
of
Nom
inal
Gove
rnm
ent
Spen
din
g o
n D
efen
ce
0.0
5.0
10.0
15.0
20.0
25.0
1998
1999
2000
2001
2002
2003
2004
2005
2006
2007
2008e
%Paki
stan
— D
efen
ce a
nd E
conom
ic T
rends
1998—
2008
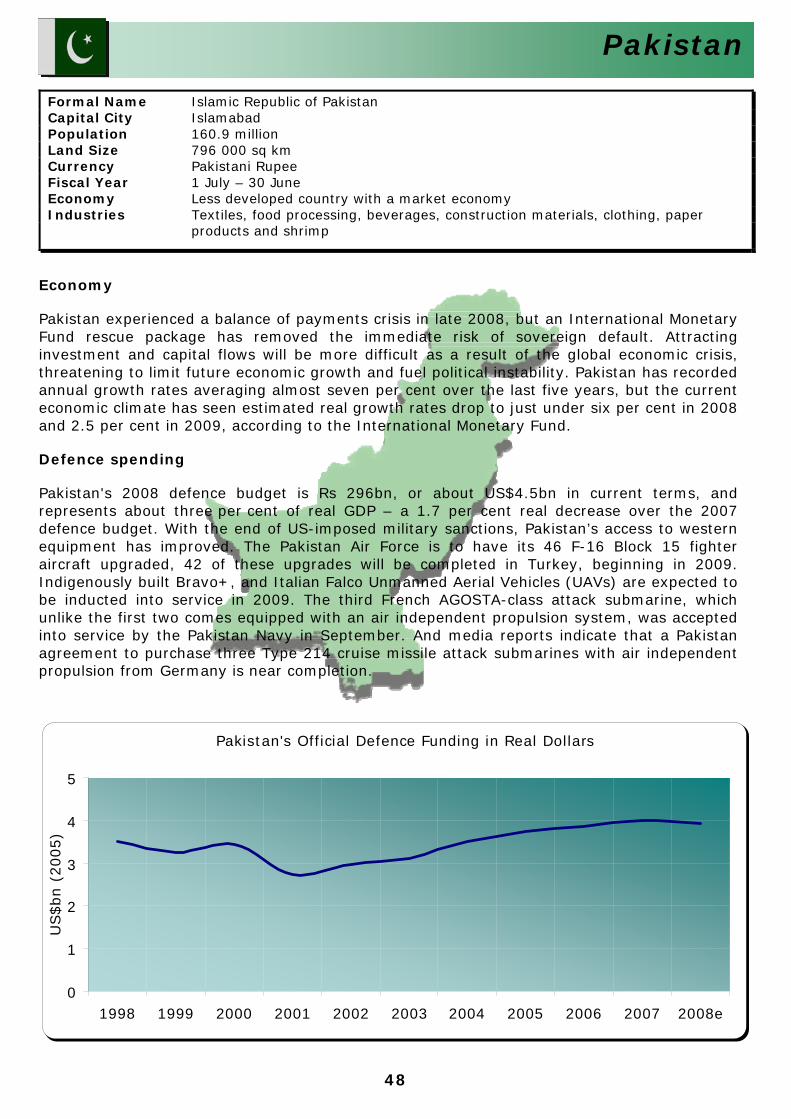
48
Pakistan
Pakistan's Official Defence Funding in Real Dollars
0
1
2
3
4
5
1998 1999 2000 2001 2002 2003 2004 2005 2006 2007 2008e
US$bn (
2005)
Formal Name Islamic Republic of Pakistan Capital City Islamabad Population 160.9 million Land Size 796 000 sq km Currency Pakistani Rupee Fiscal Year 1 July – 30 June Economy Less developed country with a market economy Industries Textiles, food processing, beverages, construction materials, clothing, paper
products and shrimp
Economy
Pakistan experienced a balance of payments crisis in late 2008, but an International Monetary Fund rescue package has removed the immediate risk of sovereign default. Attracting investment and capital flows will be more difficult as a result of the global economic crisis, threatening to limit future economic growth and fuel political instability. Pakistan has recorded annual growth rates averaging almost seven per cent over the last five years, but the current economic climate has seen estimated real growth rates drop to just under six per cent in 2008 and 2.5 per cent in 2009, according to the International Monetary Fund.
Defence spending
Pakistan's 2008 defence budget is Rs 296bn, or about US$4.5bn in current terms, and represents about three per cent of real GDP – a 1.7 per cent real decrease over the 2007 defence budget. With the end of US-imposed military sanctions, Pakistan’s access to western equipment has improved. The Pakistan Air Force is to have its 46 F-16 Block 15 fighter aircraft upgraded, 42 of these upgrades will be completed in Turkey, beginning in 2009. Indigenously built Bravo+, and Italian Falco Unmanned Aerial Vehicles (UAVs) are expected to be inducted into service in 2009. The third French AGOSTA-class attack submarine, which unlike the first two comes equipped with an air independent propulsion system, was accepted into service by the Pakistan Navy in September. And media reports indicate that a Pakistan agreement to purchase three Type 214 cruise missile attack submarines with air independent propulsion from Germany is near completion.
49
Australia
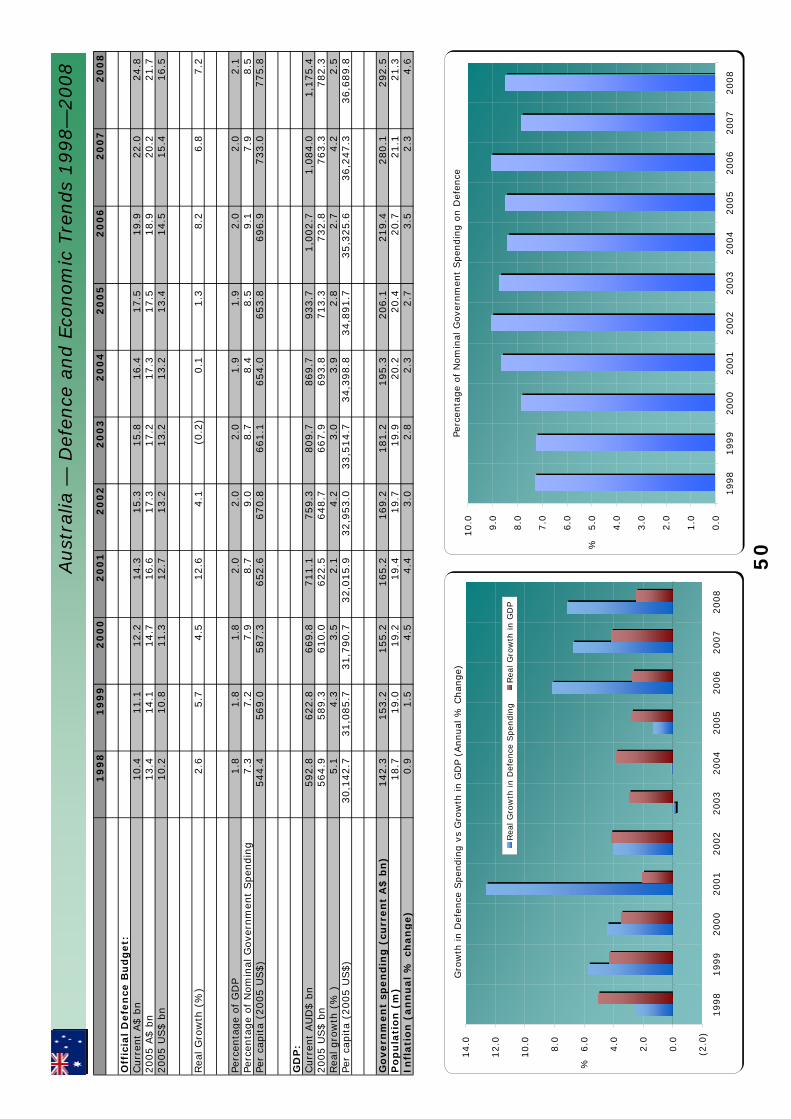
19
98
19
99
20
00
20
01
20
02
20
03
20
04
20
05
20
06
20
07
20
08
Off
icia
l D
efe
nce
Bu
dg
et:
Curr
ent
A$ b
n10.4
11.1
12.2
14.3
15.3
15.8
16.4
17.5
19.9
22.0
24.8
2005 A
$ b
n13.4
14.1
14.7
16.6
17.3
17.2
17.3
17.5
18.9
20.2
21.7
2005 U
S$ b
n10.2
10.8
11.3
12.7
13.2
13.2
13.2
13.4
14.5
15.4
16.5
Rea
l G
row
th (
%)
2.6
5.7
4.5
12.6
4.1
(0.2
)0.1
1.3
8.2
6.8
7.2
Perc
enta
ge
of
GD
P1.8
1.8
1.8
2.0
2.0
2.0
1.9
1.9
2.0
2.0
2.1
Perc
enta
ge
of
Nom
inal
Gove
rnm
ent
Spen
din
g7.3
7.2
7.9
8.7
9.0
8.7
8.4
8.5
9.1
7.9
8.5
Per
capita
(2005 U
S$)
544.4
569.0
587.3
652.6
670.8
661.1
654.0
653.8
696.9
733.0
775.8
GD
P:
Curr
ent
AU
D$ b
n592.8
622.8
669.8
711.1
759.3
809.7
869.7
933.7
1,0
02.7
1,0
84.0
1,1
75.4
2005 U
S$ b
n564.9
589.3
610.0
622.5
648.7
667.9
693.8
713.3
732.8
763.3
782.3
Rea
l gro
wth
(%
)5.1
4.3
3.5
2.1
4.2
3.0
3.9
2.8
2.7
4.2
2.5
Per
capita
(2005 U
S$)
30,1
42.7
31,0
85.7
31,7
90.7
32,0
15.9
32,9
53.0
33,5
14.7
34,3
98.8
34,8
91.7
35,3
25.6
36,2
47.3
36,6
89.8
Go
vern
men
t sp
en
din
g (
curr
en
t A
$ b
n)
142.3
153.2
155.2
165.2
169.2
181.2
195.3
206.1
219.4
280.1
292.5
Po
pu
lati
on
(m
)18.7
19.0
19.2
19.4
19.7
19.9
20.2
20.4
20.7
21.1
21.3
Infl
ati
on
(an
nu
al
% c
han
ge)
0.9
1.5
4.5
4.4
3.0
2.8
2.3
2.7
3.5
2.3
4.6
Gro
wth
in D
efen
ce S
pen
din
g v
s G
row
th in G
DP
(Annual
% C
han
ge)
(2.0
)
0.0
2.0
4.0
6.0
8.0
10.0
12.0
14.0
1998
1999
2000
2001
2002
2003
2004
2005
2006
2007
2008
%
Rea
l G
row
th in D
efen
ce S
pen
din
gRea
l G
row
th in G
DP
Perc
enta
ge
of N
om
inal
Gove
rnm
ent
Spen
din
g o
n D
efen
ce
0.0
1.0
2.0
3.0
4.0
5.0
6.0
7.0
8.0
9.0
10.0
1998
1999
2000
2001
2002
2003
2004
2005
2006
2007
2008
%
Aust
ralia
— D
efen
ce a
nd E
conom
ic T
rends
1998—
2008
50
51
North America
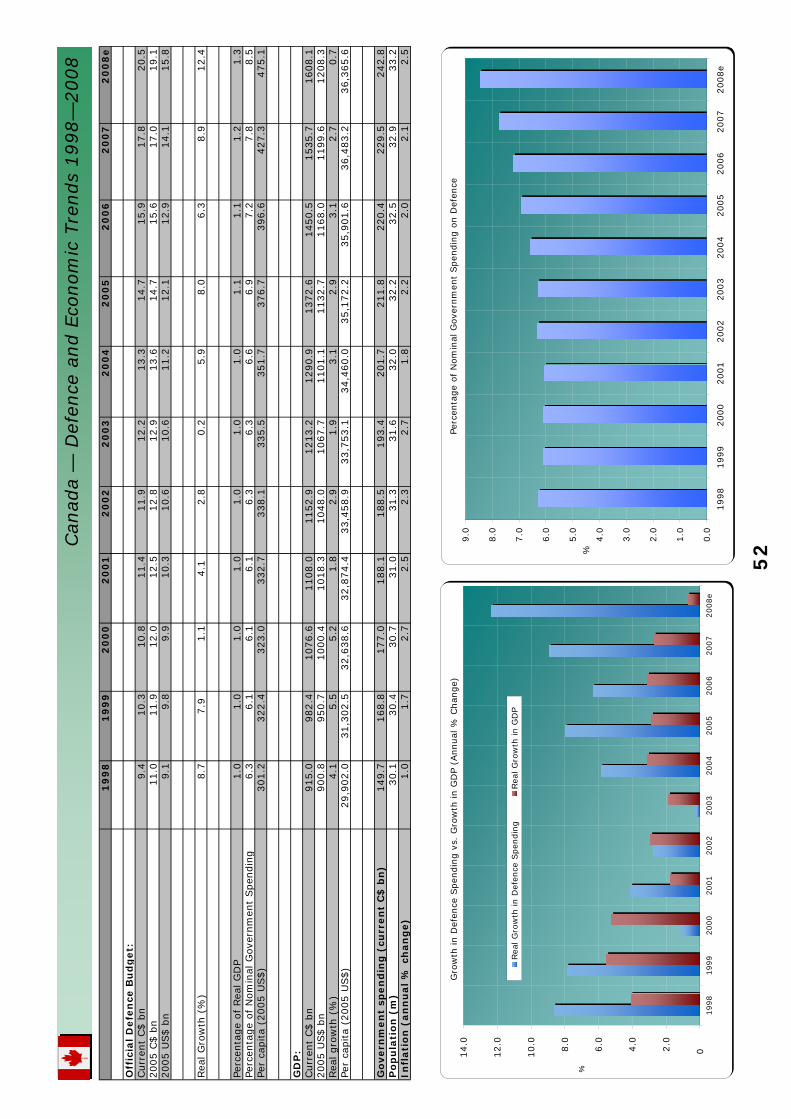
19
98
19
99
20
00
20
01
20
02
20
03
20
04
20
05
20
06
20
07
20
08
e
Off
icia
l D
efe
nce
Bu
dg
et:
Curr
ent
C$ b
n9.4
10.3
10.8
11.4
11.9
12.2
13.3
14.7
15.9
17.8
20.5
2005 C
$ b
n11.0
11.9
12.0
12.5
12.8
12.9
13.6
14.7
15.6
17.0
19.1
2005 U
S$ b
n9.1
9.8
9.9
10.3
10.6
10.6
11.2
12.1
12.9
14.1
15.8
Rea
l G
row
th (
%)
8.7
7.9
1.1
4.1
2.8
0.2
5.9
8.0
6.3
8.9
12.4
Perc
enta
ge
of Rea
l G
DP
1.0
1.0
1.0
1.0
1.0
1.0
1.0
1.1
1.1
1.2
1.3
Perc
enta
ge
of N
om
inal
Gove
rnm
ent
Spen
din
g6.3
6.1
6.1
6.1
6.3
6.3
6.6
6.9
7.2
7.8
8.5
Per
capita
(2005 U
S$)
301.2
322.4
323.0
332.7
338.1
335.5
351.7
376.7
396.6
427.3
475.1
GD
P:
Curr
ent
C$ b
n915.0
982.4
1076.6
1108.0
1152.9
1213.2
1290.9
1372.6
1450.5
1535.7
1608.1
2005 U
S$ b
n900.8
950.7
1000.4
1018.3
1048.0
1067.7
1101.1
1132.7
1168.0
1199.6
1208.3
Rea
l gro
wth
(%
)4.1
5.5
5.2
1.8
2.9
1.9
3.1
2.9
3.1
2.7
0.7
Per
capita
(2005 U
S$)
29,9
02.0
31,3
02.5
32,6
38.6
32,8
74.4
33,4
58.9
33,7
53.1
34,4
60.0
35,1
72.2
35,9
01.6
36,4
83.2
36,3
65.6
Go
vern
men
t sp
en
din
g (
curr
en
t C
$ b
n)
149.7
168.8
177.0
188.1
188.5
193.4
201.7
211.8
220.4
229.5
242.8
Po
pu
lati
on
(m
)30.1
30.4
30.7
31.0
31.3
31.6
32.0
32.2
32.5
32.9
33.2
Infl
ati
on
(an
nu
al %
ch
an
ge)
1.0
1.7
2.7
2.5
2.3
2.7
1.8
2.2
2.0
2.1
2.5
Gro
wth
in D
efen
ce S
pen
din
g v
s. G
row
th in G
DP
(Annual
% C
han
ge)
02.0
4.0
6.0
8.0
10.0
12.0
14.0
1998
1999
2000
2001
2002
2003
2004
2005
2006
2007
2008e
%
Rea
l G
row
th in D
efen
ce S
pen
din
gRea
l G
row
th in G
DP
Perc
enta
ge
of N
om
inal
Gove
rnm
ent
Spen
din
g o
n D
efen
ce
0.0
1.0
2.0
3.0
4.0
5.0
6.0
7.0
8.0
9.0
1998
1999
2000
2001
2002
2003
2004
2005
2006
2007
2008e
%
Can
ada
— D
efen
ce a
nd E
conom
ic T
rends
1998—
2008
52
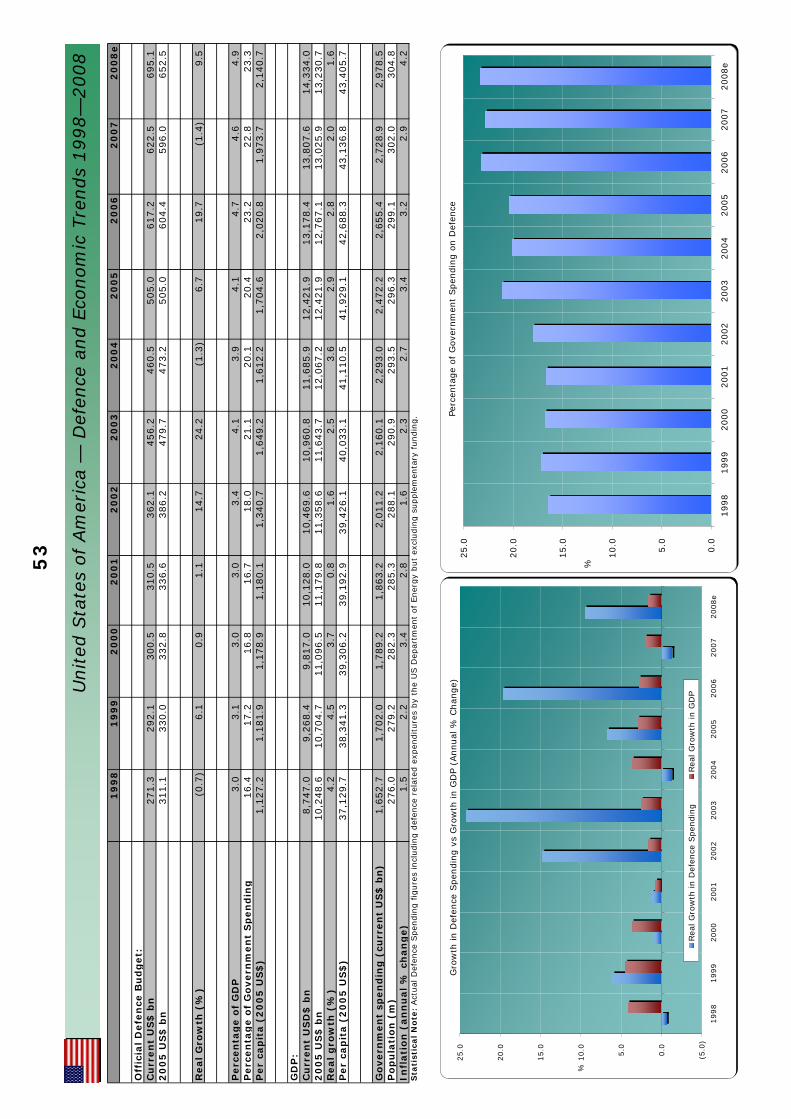
53
19
98
19
99
20
00
20
01
20
02
20
03
20
04
20
05
20
06
20
07
20
08
e
Off
icia
l D
efe
nce
Bu
dg
et:
Cu
rren
t U
S$
bn
271.3
292.1
300.5
310.5
362.1
456.2
460.5
505.0
617.2
622.5
695.1
20
05
US
$ b
n311.1
330.0
332.8
336.6
386.2
479.7
473.2
505.0
604.4
596.0
652.5
Real G
row
th (
%)
(0.7
)6.1
0.9
1.1
14.7
24.2
(1.3
)6.7
19.7
(1.4
)9.5
Perc
en
tag
e o
f G
DP
3.0
3.1
3.0
3.0
3.4
4.1
3.9
4.1
4.7
4.6
4.9
Perc
en
tag
e o
f G
overn
men
t S
pen
din
g16.4
17.2
16.8
16.7
18.0
21.1
20.1
20.4
23.2
22.8
23.3
Per
cap
ita (
20
05
US
$)
1,1
27.2
1,1
81.9
1,1
78.9
1,1
80.1
1,3
40.7
1,6
49.2
1,6
12.2
1,7
04.6
2,0
20.8
1,9
73.7
2,1
40.7
GD
P:
Cu
rren
t U
SD
$ b
n8,7
47.0
9,2
68.4
9,8
17.0
10,1
28.0
10,4
69.6
10,9
60.8
11,6
85.9
12,4
21.9
13,1
78.4
13,8
07.6
14,3
34.0
20
05
US
$ b
n10,2
48.6
10,7
04.7
11,0
96.5
11,1
79.8
11,3
58.6
11,6
43.7
12,0
67.2
12,4
21.9
12,7
67.1
13,0
25.9
13,2
30.7
Real g
row
th (
%)
4.2
4.5
3.7
0.8
1.6
2.5
3.6
2.9
2.8
2.0
1.6
Per
cap
ita (
20
05
US
$)
37,1
29.7
38,3
41.3
39,3
06.2
39,1
92.9
39,4
26.1
40,0
33.1
41,1
10.5
41,9
29.1
42,6
88.3
43,1
36.8
43,4
05.7
Go
vern
men
t sp
en
din
g (
curr
en
t U
S$
bn
)1,6
52.7
1,7
02.0
1,7
89.2
1,8
63.2
2,0
11.2
2,1
60.1
2,2
93.0
2,4
72.2
2,6
55.4
2,7
28.9
2,9
78.5
Po
pu
lati
on
(m
)276.0
279.2
282.3
285.3
288.1
290.9
293.5
296.3
299.1
302.0
304.8
Infl
ati
on
(an
nu
al %
ch
an
ge)
1.5
2.2
3.4
2.8
1.6
2.3
2.7
3.4
3.2
2.9
4.2
Sta
tist
ical
No
te: Act
ual
Def
ence
Spen
din
g f
igure
s in
cludin
g d
efen
ce r
elat
ed e
xpen
diture
s by
the
US D
epar
tmen
t of
Ener
gy
but
excl
udin
g s
upple
men
tary
fundin
g.
Gro
wth
in D
efen
ce S
pen
din
g v
s G
row
th in G
DP
(Annual
% C
han
ge)
(5.0
)
0.0
5.0
10.0
15.0
20.0
25.0
1998
1999
2000
2001
2002
2003
2004
2005
2006
2007
2008e
%
Rea
l G
row
th in D
efen
ce S
pen
din
gRea
l G
row
th in G
DP
Perc
enta
ge
of
Gove
rnm
ent
Spen
din
g o
n D
efen
ce
0.0
5.0
10.0
15.0
20.0
25.0
1998
1999
2000
2001
2002
2003
2004
2005
2006
2007
2008e
%
United
Sta
tes
of Am
eric
a —
Def
ence
and E
conom
ic T
rends
1998—
2008
54
Appendix A: Methodology
Current methodology
The Defence Economic Trends 2008 is the seventh year that the Defence Intelligence Organisation has used a proxy defence deflator to calculate nominal defence budget figures in constant or real US Dollars. Whereas, the year 2000 was used as the base year in the 2004-2007 publications, figures in this edition have been updated and are reported in terms of 2005 US dollars.
Using historical budgetary data and macroeconomic statistics, the deflator is modelled on defence expenditure factors across several key cost components:
• Capital Procurement – referring to all military capital equipment budgeted by a given country in the current fiscal year. This also includes investment in research and development programs.
• Personnel – expenditure on personnel as defined by the country. For some countries this may include pensions and superannuation costs; however, others may not include these items in their personnel budgets.
• Operating costs – the ongoing upkeep costs incurred in running a defence force.
The model developed by the Defence Intelligence Organisation is part of an ongoing process of refinement to calculate and compare, on a common basis, defence budgets across countries and time periods.
Although new economic forecasts are released throughout the formulation of this publication, not all data can be updated to the latest predictions. For the Defence Economic Trends 2008, the information depicted in the tables is sourced from the International Monetary Fund's World Economic Outlook released in October 2008; whereas the economic growth forecasts in the text represent the World Economic Update released in April 2009.
Historical methodology
Previously, a broad-based implicit gross domestic product (GDP) price deflator was used to deflate nominal currency amounts into constant 1995 local currency terms. This was then converted to US dollars using the average market exchange rate for 1995. However, the implicit GDP price deflator is an index that captures price behaviour over time in the entire economy. Hence, any in-country differences in relative price movements between defence expenditure and the rest of the economy are not taken into account.
Consequently, any event in the non-defence sectors of the economy, such as a sharp rise in the price of consumer goods, tends to distort defence-spending figures when deflated into constant dollars.
One possible solution to this problem is the use of the defence deflator index. This type of index is tailored to defence consumption only and is free of distortions caused elsewhere in the economy. Unfortunately defence deflators are rarely published and often the magnitude and behaviour of price movements in sectors of the economy which feed into defence expenditure are not known until many years later.
As economic data has become more readily available over the past few years – primarily through online publications – the modelling of a proxy defence deflator based on historical budgetary data and macroeconomic trends has been made possible. The Defence Intelligence Organisation has developed and continues to use such a model.
55
Appendix A: Methodology
Using 2005 as the base year, appropriate price sub-deflators are applied to each of these cost component amounts. The model is able to generate a weighted composite index based on the percentage spent on personnel, capital procurement and operating expenses in each year. This index is used as the proxy defence deflator and is used to deflate the nominal local currency amount into constant 2005 local currency terms. Using the 2005 market US dollars to local currency exchange rate, obtained from the IMF’s International Financial Statistics periodical for 2005, these deflated amounts are then converted into US dollars. Limitations of the model Although the model allows for analysis to be tailored to each country more closely, there are some countries that have insufficient transparency of data to determine the historical relative weights of each cost component. For these countries the GDP price deflator is used instead. When comparing defence budgets between countries, there is an inherent problem of inconsistent treatment. Different countries have different compositions of items in the defence budget. For example, some countries include military pensions, while others place this amount into a different appropriation such as social security. The lack of a uniform definition of what constitutes a defence budget makes a fair comparison between two countries difficult. The model allows some control over what is included, but it is limited by the degree of data transparency and the consistency of official reporting of some of the countries examined in this report. Ongoing refinement The integrity of this model has been discussed with, and approved by, representatives of the Department of Defence, Australian Bureau of Statistics, the Australian Department of the Treasury and the School of Economics and Management at the Australian Defence Force Academy. Some may contend that inconsistencies in the data may impair statistical cogency; however, the approach undertaken represents an improved reflection of trends when compared to using the previous methodology and the degree of error in producing comparable trends is considered to be small. However, the Defence Intelligence Organisation will continually seek to refine this approach as new and more reliable data becomes available (this accounts for changes to some figures from year-to-year). Although official exchange rates are used in most cases, where there is a significant discrepancy between official and unofficial exchange rates in this version, a judgement has been made as to which rate better represents the purchasing power of the budget for that country.
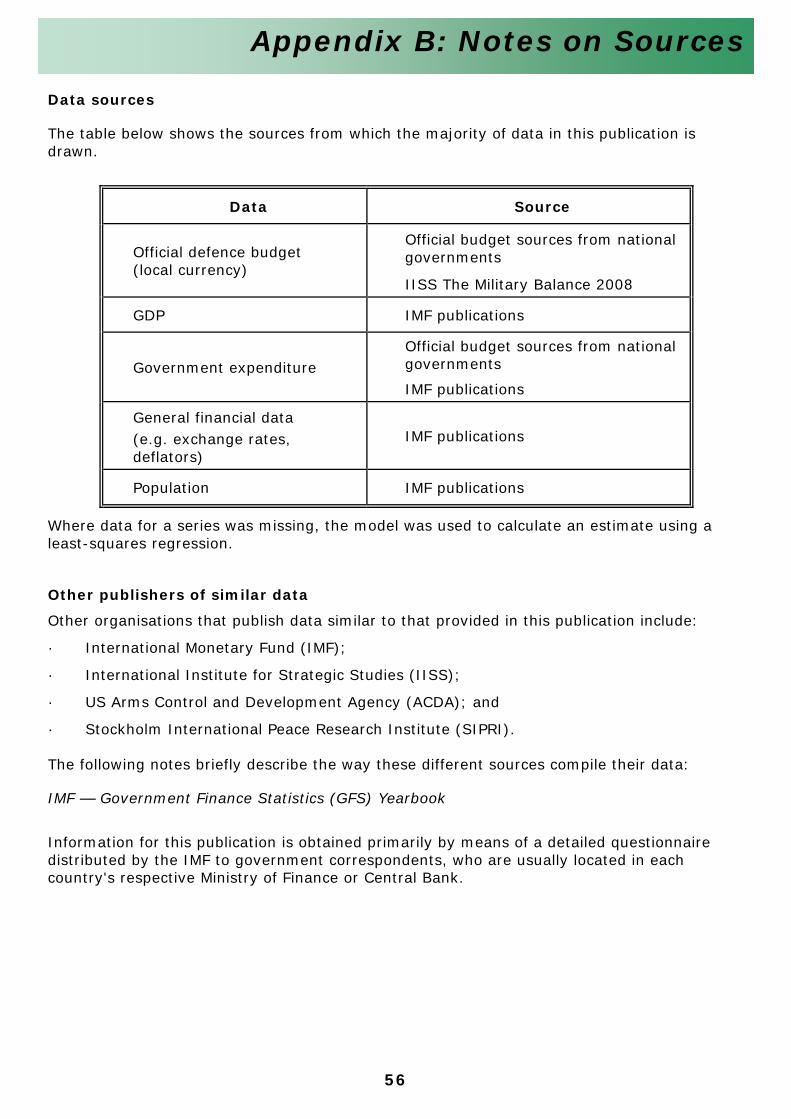
56
Appendix B: Notes on Sources
Data sources
The table below shows the sources from which the majority of data in this publication is drawn.
Data Source
Official defence budget (local currency)
Official budget sources from national governments
IISS The Military Balance 2008
GDP IMF publications
Government expenditure Official budget sources from national governments
IMF publications
General financial data (e.g. exchange rates, deflators)
IMF publications
Population IMF publications
Where data for a series was missing, the model was used to calculate an estimate using a least-squares regression.
Other publishers of similar data
Other organisations that publish data similar to that provided in this publication include:
· International Monetary Fund (IMF);
· International Institute for Strategic Studies (IISS);
· US Arms Control and Development Agency (ACDA); and
· Stockholm International Peace Research Institute (SIPRI).
The following notes briefly describe the way these different sources compile their data:
IMF — Government Finance Statistics (GFS) Yearbook
Information for this publication is obtained primarily by means of a detailed questionnaire distributed by the IMF to government correspondents, who are usually located in each country's respective Ministry of Finance or Central Bank.
57
Appendix B: Notes on Sources
IISS — The Military Balance The IISS method is to cite official defence budgets and to adjust, where necessary, military expenditure to include all other military-related spending. The only exception occurs in the case of NATO countries, where the IISS uses the figures released by governments and, for comparison, also cites the NATO-defined expenditure. Some countries include internal and border security force expenditure in their defence budgets; where separate budgets exist, the IISS generally indicates this in footnotes. IISS figures may vary from previous years, often because of updates made by the governments themselves.
Wherever possible, the IISS uses exchange rates taken from IMF publications, though these may not be applicable to commercial transactions. In some cases, in an effort to make US dollar figures more relevant for international comparisons, the IISS uses a different set of exchange rates to calculate defence spending which reflects the differences in purchasing power parity terms between the civilian and military sectors.
ACDA ACDA generally provides expenditures of the Ministry of Defence, where available. When these are known to include the costs of internal security, an attempt is made to remove these expenditures. A wide variety of data sources are used for these countries, including the publications and data resources of other US government agencies, standardised reporting of countries to the UN, and other international sources.
Other published sources used by ACDA include the GFS Yearbook, the CIA World Factbook, the SIPRI Yearbook and The Military Balance. SIPRI
Where possible, SIPRI includes the following items in its definition of military expenditure:
· all current and capital expenditure on the armed forces in the running of defence departments and other government agencies engaged in defence projects and space activities;
· the cost of paramilitary forces, border guards and police when judged to be trained and equipped for military operations;
· military research and development, testing and evaluation costs; and
· costs of retirement pensions of defence personnel and civilian employees. For the majority of countries, SIPRI derives military expenditure estimates primarily from the GFS Yearbook.
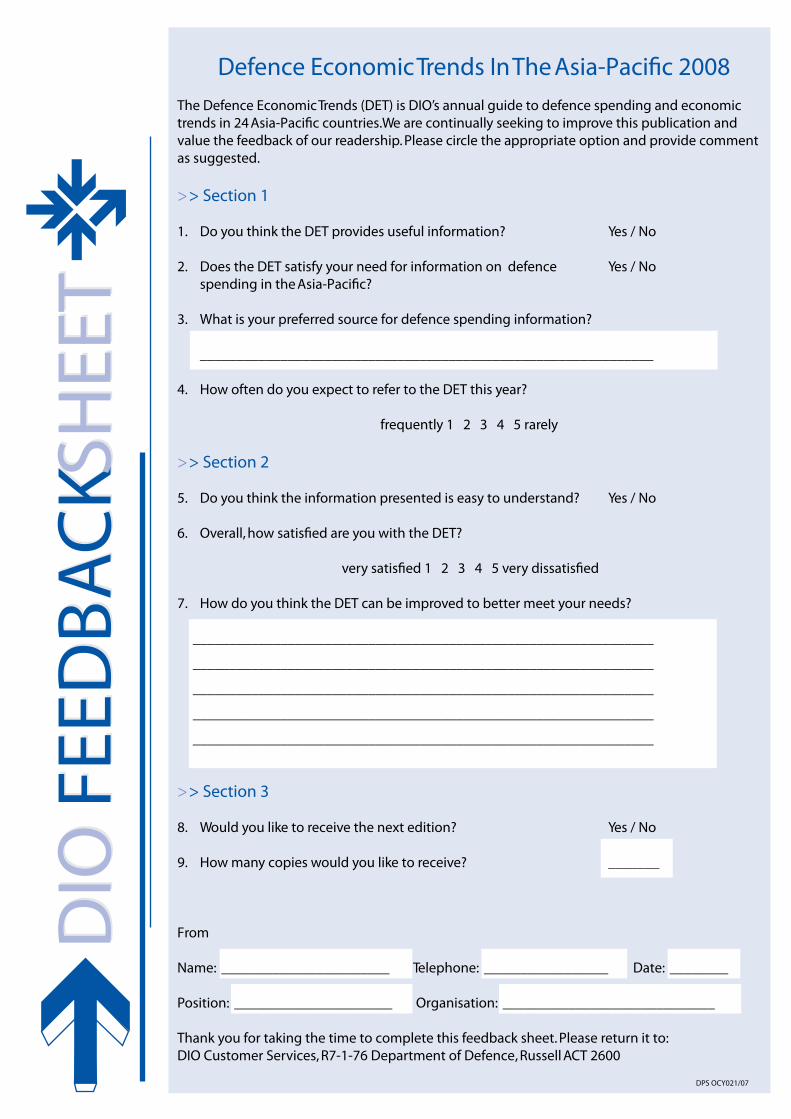
DIO
FEED
BACK
SHEE
TD
IOFEED
BACK
SHEE
TDefence Economic Trends In The Asia-Paci�c 2008
The Defence Economic Trends (DET) is DIO’s annual guide to defence spending and economic trends in 24 Asia-Paci�c countries. We are continually seeking to improve this publication and value the feedback of our readership. Please circle the appropriate option and provide comment as suggested.
>> Section 1
1. Do you think the DET provides useful information? Yes / No
2. Does the DET satisfy your need for information on defence Yes / No spending in the Asia-Paci�c?
3. What is your preferred source for defence spending information?
______________________________________________________________
4. How often do you expect to refer to the DET this year?
frequently 1 2 3 4 5 rarely
>> Section 2
5. Do you think the information presented is easy to understand? Yes / No
6. Overall, how satis�ed are you with the DET?
very satis�ed 1 2 3 4 5 very dissatis�ed
7. How do you think the DET can be improved to better meet your needs? _______________________________________________________________
_______________________________________________________________
_______________________________________________________________
_______________________________________________________________
_______________________________________________________________
>> Section 3
8. Would you like to receive the next edition? Yes / No
9. How many copies would you like to receive? _______
From
Name: _______________________ Telephone: _________________ Date: ________
Position: ______________________ Organisation: _____________________________
Thank you for taking the time to complete this feedback sheet. Please return it to: DIO Customer Services, R7-1-76 Department of Defence, Russell ACT 2600
DPS OCY021/07


![BEN Helps P2P [PROCURE-TO-PAY] Presents “The Procure to Pay Life Cycle” BEN Helps & P2P [PROCURE-TO-PAY] Presents “The Procure to Pay Life Cycle” Last](https://img.pdfslide.us/doc/110x75/56649d6d5503460f94a4d696/ben-helps-p2p-procure-to-pay-presents-the-procure-to-pay-life-cycle.jpg)


![BRUNEI DARUSSALAM[1]](https://img.pdfslide.us/doc/110x75/577d24101a28ab4e1e9b8871/brunei-darussalam1.jpg)