Embed Size (px)
Citation preview

DIO Reference Aid 16−512
DEFENCE ECONOMICTRENDS IN THEASIA-PACIFIC
2016
D
EFENCE INTELLIGENCE ORGANISATION
DEFENCE INTELLIGENCE ORG
ANISATION
AUSTRALIA

1
DEFENCE
ECONOMIC TRENDS
IN THE ASIA-PACIFIC
2016
DIO Reference Aid 16–512, August 2016

2

4
PR
EFA
CE
INTENTIONALLY BLANK

5
PR
EFAC
E Purpose
Defence Economic Trends series analyses significant trends in defence funding in the Asia-Pacific region. It draws together official defence budgets and national economic data to illustrate trends over time. It also enables comparisons between individual countries or regions.
Abbreviations
ASEAN Association of Southeast Asian Nations
bn billion
GDP gross domestic product
IMF International Monetary Fund
LNG liquefied natural gas
LMV littoral mission vessel
m million
PNG Papua New Guinea
PNGDF PNG Defence Force
RAN Royal Australian Navy
tr trillion
UAV unmanned aerial vehicle
UN United Nations
UNSC UN Security Council
US United States
Online version
This publication is available online at the Department of Defence’s website: www.defence.gov.au/dio/publications.shtml
Feedback
We encourage readers to comment on this publication. Please email [email protected] with your comments, so we can improve subsequent editions.
If you have any questions in relation to Defence Economic Trends 2016 please contact us directly by phone or fax at:
Defence Intelligence Organisation
Telephone: +61 2 6127 5292
Facsimile: +61 2 6127 5086

6
SOU
TH-E
AST
ASI
A –
REG
ION
AL
OV
ERV
IEW
Regional economy
Economic growth in South-East Asia in 2015, while strong, was below the average experienced in most South-East Asian countries over the past 10 years. Regional growth was hindered by external shocks including slowing growth in China and falling commodity prices. Although low commodity prices will reduce growth in Malaysia and Brunei in 2016, other countries in the region will benefit from higher disposable incomes. Out to 2020, the impact of slowing growth in China on external demand will be only partially offset by improved growth in the US. The inauguration of the ASEAN economic community is intended to lead to increasing trade links between member countries.
Defence spending
In 2015, all South-East Asian countries experienced real increases in defence spending – with Thailand and the Philippines experiencing particularly strong defence spending growth after low figures in 2014. South-East Asia remains an attractive market for defence-related companies due to modernisation programs in Indonesia, the Philippines and Singapore. Strong economic growth, internal security concerns and regional territorial disputes remain key drivers for growth in defence spending in South-East Asia.

7
SOU
TH-EA
ST ASIA
– R
EGIO
NA
L OV
ERV
IEW

8
BRUNEI

9
BR
UN
EI
Economy
Over the past 10 years, Brunei averaged 0.2 per cent annual real economic growth. In 2015, the economy contracted by 1.2 per cent, due to low prices in the oil and gas sector. Growth in agriculture and construction were offset by declines in government and business services. Overall investment and household expenditures also slowed. Low global energy prices led to a large budget deficit, impeding government plans to return the budget to surplus. Brunei’s economic performance is sensitive to changes in global oil and gas prices, as over 90 per cent of government revenue comes from this sector. Brunei’s economy is forecast to average 5.7 per cent real growth to 2020, according to the IMF.
Defence spending
Brunei’s 2015 defence budget was B$537.5m
(US$396m) – a 1.5 per cent real increase on the 2014 defence budget. In 2015, the Royal Brunei Air Force announced it had completed the acquisition of its Sikorsky S-70i Black Hawk helicopter fleet. Between 2013 and 2015, Brunei received a total of 12 S-70i helicopters to replace the outgoing S-70A helicopters. In January 2015, Brunei’s Ministry of Defence announced it would transfer four S-70A helicopters to Malaysia. In March, the Royal Brunei Navy began constructing a new naval training school at the Muara Naval Base. In November, the Royal Brunei Navy participated in the annual Cooperation Afloat Readiness and Training exercise with the US Navy.
Country name Brunei
Capital city Bandar Seri Begawan
Population 419 000
Land size 5765 km2
Currency Brunei dollar
Fiscal year 1 April–31 March
Economy Less-developed country with a market economy
Industries Oil and natural gas

10
CAMBODIA

11
CA
MB
OD
IA
Economy
Over the past 10 years, Cambodia averaged 6.9 per cent annual real economic growth. In 2015, the economy grew by seven per cent, due to expansion in the industry and services sectors. The textiles and garment industries will remain important exporters for Cambodia despite increasing competition. Slow growth in the tourism and agricultural sectors will be offset by moderate inflation, household spending and stronger growth in the manufacturing, construction and services sectors over the next five years. Cambodia’s economy is forecast to average 7.2 per cent real growth to 2020, according to the IMF.
Defence spending
Cambodia’s 2015 defence budget was
KHR1551.2bn (US$377.6m) – a 35.7 per cent real increase on the 2014 defence budget. Over half of Cambodia’s defence budget is probably allocated to personnel expenditure, according to IHS Jane’s. In 2015, the Royal Cambodian Armed Forces inaugurated an officer training school headquarters, funded by the Vietnamese Ministry of Defence. In May 2015, Cambodia received 44 vehicles from China including jeeps, truck-mounted rocket launchers and towed anti-aircraft guns. Cambodia relies heavily on China for military aid and capability procurement.
Country name Cambodia
Capital city Phnom Penh
Population 15.5 million
Land size 181 035 km2
Currency Riel
Fiscal year 1 January–31 December
Economy Less-developed country with a market economy
Industries Gems, cement, forestry, rubber, food, tourism, textiles, apparel and footwear

12
INDONESIA

13
IND
ON
ESIA
Economy
Over the past 10 years, Indonesia averaged 5.8 per cent annual real economic growth. In 2015, the economy grew by 4.7 per cent, due to domestic consumption. However, further growth was constrained by low global commodity prices, delayed infrastructure spending, reduced external demand and subdued investment. Economic reform packages, designed to reduce the cost of doing business and regulatory burdens, will support economic activity but Indonesia will still be vulnerable to sustained downturns in the global economy. Private consumption will be boosted by stable inflation and looser monetary policy. Indonesia’s economy is forecast to average 5.7 per cent real growth to 2020, according to the IMF.
Defence spending
Indonesia’s 2015 defence budget was Rp97tr
(US$7.2bn) – a 5 per cent real increase on the 2014 defence budget. In February 2015, Indonesia took delivery of two locally produced tank landing ships. In March and October, Indonesia commissioned two oceanographic support vessels, KRI Rigel and KRI Spica. Indonesia is considering acquiring Russian Sukhoi Su-35 fighter jets to replace its fleet of F-5 Tiger aircraft. If purchased, the first Su-35 could be delivered in 2018.
Country name Indonesia
Capital city Jakarta
Population 255.5 million
Land size 1 904 569 km2
Currency Rupiah
Fiscal year 1 January–31 December
Economy Less-developed country with a market economy
Industries Petroleum, natural gas, mining, cement, chemical fertilisers, plywood, rubber, tourism, textiles and apparel

14
LAOS

15
LAO
S
Economy
Over the past 10 years, Laos averaged 7.9 per cent annual real economic growth. In 2015, the economy grew by 7.5 per cent, due to electricity exports, construction and services. The construction of the rail network connecting China, Laos and Thailand, and large hydropower construction projects will support economic activity in Laos. Large construction projects will support private consumption. Low inflation and greater growth in copper and power exports will also support GDP. Laos’s economy is forecast to average 7.5 per cent real growth to 2020, according to the IMF.
Defence spending
Reliable data on Laos’s 2015 defence budget is not available. In 2015, Korea’s International Cooperation Agency provided training, equipment and funding to support the Laos People’s Army’s mission to clear unexploded ordinance. The Laos People’s Army is equipped with weapons from communist and former communist states. Since the end of the Cold War, China has replaced Russia and Vietnam as Laos’s main supplier of military equipment. Laos’ armed forces are primarily equipped to counter low-intensity insurgencies.
Country name Laos
Capital city Vientiane
Population 7 million
Land size 236 800 km2
Currency Kip
Fiscal year 1 October–30 September
Economy Less-developed country with a centrally planned economy
Industries Copper, tin, timber, tourism, hydroelectricity, apparel, rice and cement

16
MALAYSIA

17
MA
LAY
SIA
Economy
Over the past 10 years, Malaysia averaged 4.9 per cent annual real economic growth. In 2015, the economy grew by 4.7 per cent, due to strong private consumption. Malaysia’s exports of electronic and electric goods will be weak due to the slowdown in China’s economy. In 2015, a goods and services tax was introduced and Malaysia continues to diversify its economy. Moderate inflation, wholesale retail trade, tourism, financial services and the information and communications sectors will all support economic activity over the next five years. Malaysia’s economy is forecast to average 4.9 per cent real growth to 2020, according to the IMF.
Defence spending
Malaysia’s 2015 defence budget was RM17.8bn
(US$4.7bn) – an 8.8 per cent real increase on the 2014 defence budget. In March 2015, Malaysia received the first of four Airbus A400M Atlas transport aircraft. In September, Malaysian Defence Minister and UK Minister of State for Defence Procurement signed a contract to acquire the Thales Starstreak high-velocity missile ground-based air defence missile system. In October, Malaysia confirmed its intent to acquire six Second Generation Patrol Vessel littoral combat ship vessels from Malaysia’s Boustead Naval Shipyard and 257 AV8 combat vehicles from local industry. In November, Boustead DCNS Naval
Corporation, a joint Malaysian– French venture, secured a contract to refit the Royal Malaysian Navy’s two SCORPENE-class submarines.
Country name Malaysia
Capital city Kuala Lumpur
Population 31.1 million
Land size 329 847 km2
Currency Ringgit
Fiscal year 1 January–31 December
Economy Less-developed country with a market economy
Industries Rubber, palm oil, electronics, tin, timber, agriculture and oil

18
MYA
NM
AR
INSUFFICIENT RELIABLE DATA AVAILABLE

19
MYA
NM
AR
Economy
Over the past 10 years, Myanmar averaged 7.7 per cent annual real economic growth. In 2015, the economy grew by 8.5 per cent, due to strong domestic demand and investment stimulated by structural reform. Severe flooding and landslides in July and August 2015 damaged agriculture and infrastructure. Greater integration with the global economy; foreign direct investment in the telecommunications, oil and gas, banking and construction sectors; and continuing reform will support growth. In particular, large infrastructure and hydrocarbon projects will drive growth. Burma’s economy is forecast to average eight per cent real growth to 2020, according to the IMF.
Defence spending
Myanmar’s 2015 defence budget was K2.8tr
(US$2.4bn) – a 3.9 per cent real increase on the 2014 defence budget. Myanmar is considering purchasing 16 JF-17 Thunder fighter jets from Pakistan. In a commissioning ceremony in June, Myanmar formally accepted into service two Beechcraft 1900D light transport aircraft, at least ten Grob G 120TP basic trainer aircraft, one Mil Mi-35P Hind E attack helicopter, three Airbus AS365 Dauphin 2 helicopters and three Bell 206 Jetranger III helicopters.
Country name Myanmar
Capital city Nay Pyi Taw
Population 51.8 million
Land size 676 578 km2
Currency Kyat
Fiscal year 1 April–31 March
Economy Less-developed country with a market economy
Industries Timber, gems, oil, natural gas, tourism and rice

20
PHILIPPINES

21
PH
ILIPP
INES
Economy
Over the past 10 years, the Philippines averaged 5.4 per cent annual real economic growth. In 2015, the economy grew by six per cent, due to private consumption and investment. Private consumption was driven by increasing employment, low inflation and remittances from overseas. The services and construction sectors drove employment growth; however, this growth was offset by substantial job losses in the agricultural sector due to an El Nino weather system. Investment and government spending will support economic activity over the next five years. Policy support for infrastructure development, human capital investment and governance reforms will also support growth. The Philippines’ economy is forecast to average 6.5 per cent real growth to 2020, according to the IMF.
Defence spending
The Philippines’ 2015 defence budget was
₱144.5bn (US$3.2bn) – a 16.3 per cent real increase on the 2014 defence budget. In May 2015, the Philippines Navy commissioned the first of three donated ex-Philippine National Oil Company oil tankers. In June, the Philippines received the first 6 of 28 upgraded M113A2+ armoured personnel carriers from Israel. In July, the navy commissioned two gifted ex-RAN heavy landing craft, and announced the purchase of an additional three decommissioned RAN vessels of the same class. In December, the Philippines received 114 M113A2 armored personnel carriers from the US as part of the Excess Defense Article Program. Also in December, it received the first two F/A-50 Golden Eagle jet fighters from South Korea; the remaining ten are scheduled to be delivered by 2017.
Country name Philippines
Capital city Manila
Population 101.4 million
Land size 300 000 km2
Currency Philippine peso
Fiscal year 1 January–31 December
Economy Less-developed country with a market economy
Industries Textiles, pharmaceuticals, chemicals, wood products, electronics, petroleum refining and fishing

22
SINGAPORE

23
SING
AP
OR
E
Economy
Over the past 10 years, Singapore averaged 5.4 per cent annual real economic growth. In 2015, the economy grew by only 2.2 per cent, due to sluggish domestic demand and external trade. Growth was also constrained by contractions in the manufacturing sector and moderating growth in construction; however, growth in services supported economic activity. Slow growth in China, Singapore’s key trading partner, will reduce exports. Singapore’s economy is forecast to average 3.2 per cent growth to 2020, according to the IMF, and will be supported by strengthening real growth in advanced economies and domestic growth in the finance and wholesale trade sectors.
Defence spending
Singapore’s 2015 defence budget was
S$13.1bn (US$9.7bn) – a 4.4 per cent real increase on the 2014 defence budget. In 2015, work on Singapore’s two new Type 218SG diesel electric submarines began in Germany. In March 2015, Singapore declared full operational capability for the Elbit Hermes 450 tactical UAV. In July, Singapore launched the first of eight locally built new littoral mission vessels (LMV) intended to replace their FEARLESS-class patrol vessels. Two more LMVs were under construction in 2015. In August, Singapore unveiled new vehicles to the public in a parade, including the 6x6 Peacekeeper Protected Response Vehicle, the Leopard 2 armoured engineer vehicle and the combat ambulance.
Country name Singapore
Capital city Singapore
Population 5.5 million
Land size 697 km2
Currency Singapore dollar
Fiscal year 1 April–31 March
Economy Industrialised country with a market economy
Industries Electronics, financial services, petroleum refining, rubber, ship repair and biopharmeceuticals

24
THAILAND

25
THA
ILAN
D
Economy
Over the past 10 years, Thailand averaged 3.3 per cent annual real economic growth. In 2015, the economy grew by only 2.5 per cent, due to declining exports and falling consumer prices. Persistent political uncertainty following the 2014 coup has also contributed to low growth. Despite sustained depreciation in the baht, the downward trend in exports of goods and services continued. Over the next five years, weak merchandise exports and sluggish consumer demand will offset strong economic activity in the tourism sector. Public investment in infrastructure will support economic activity. Thailand’s economy is forecast to average 3.3 per cent real growth to 2020, according to the IMF.
Defence spending
Thailand’s 2015 defence budget was ฿206.5bn
(US$5.7bn) – a 12.8 per cent real increase on the 2014 defence budget. In 2015, Thailand signed a contract with Airbus Helicopters for six light utility EC 145 T2 twin -engine helicopters. Thailand also signed a contract for the T-50 Golden Eagle advanced jet trainer from South Korea. In May 2015, Thailand received its second batch of five OPLOT main battle tanks from Ukraine, from a total order of 49. In September, Thailand announced a deal with the US for further Starstreak high-velocity missile ground-based air-defence missile systems. In October, Thailand ordered eight AW139 helicopters and, in November, received two Mi-17V helicopters from Russia. In November, Thailand also announced the purchase of 16 Evolved Sea Sparrow Missiles, including equipment, training and technical service support, from the US.
Country name Thailand
Capital city Bangkok
Population 68.8 million
Land size 513 120 km2
Currency Baht
Fiscal year 1 October–30 September
Economy Less-developed country with a market economy
Industries Tourism, apparel, agriculture, cement, electronics, furniture, plastics and tin

26
TIMOR-LESTE

27
TIMO
R-LESTE
Economy
Over the past 10 years, Timor-Leste averaged 7 per cent annual real economic growth. In 2015, the economy grew by 4.3 per cent, due to high public spending and major projects. Low commodity prices and a contraction in the production of oil and gas were offset by government spending and investment expenditure. Timor-Leste’s Petroleum Fund will suffer from lower oil revenues and production. Government investment in infrastructure will help drive non-energy sectors of the economy. Private investment in cement, manufacturing and tourism will also support economic activity. Timor-Leste’s economy is forecast to average 5.7 per cent real growth to 2020, according to the IMF.
Defence spending
Timor-Leste’s 2015 defence budget was
US$33.4m – a 6.1 per cent real increase on
the 2014 defence budget. In July 2015, the Timor-Leste Defence Force and US Navy conducted the third Cooperation Afloat
Readiness and Training exercise in Dili. In October and November, Ex Harii Hamutuk was attended by Australia, the US, Japan and Timor-Leste. Its focus was to undertake key infrastructure development projects at Port Hera and Metinaro military bases. Dili has made little progress in achieving procurement plans outlined in its Force 2020 development plan.
Country name Timor-Leste
Capital city Dili
Population 1.3 million
Land size 14 874 km2
Currency US dollar
Fiscal year 1 January–31 December
Economy Less-developed country with a market economy
Industries Oil, coffee, fishing, cottage industries, rice and subsistence farming

28
VIETNAM

29
VIETN
AM
Economy
Over the past 10 years, Vietnam averaged 6.1 per cent annual real economic growth. In 2015, the economy grew by 6.5 per cent, due to a recovery in domestic demand and expansions in the manufacturing and construction sectors. Growth in exports were strong, supported by the devaluation of the dong and stable inflation. Real wage growth also supported domestic demand. Reform of SOE’s and the banking sector continued. Moderate inflation, growth in private consumption and strong foreign investment will support economic activity over the next five years. Vietnam’s economy is forecast to average 6.1 per cent real growth to 2020, according to the IMF.
Defence spending
Vietnam’s 2015 defence budget was around*
₫99tr (US$4.6bn) – a 6.3 per cent real increase on the 2014 defence budget. In June 2015, the US and Vietnam signed an agreement that is intended to increase future defence trade between the two countries. Vietnam has expressed interest in purchasing up to six P-3C maritime patrol aircraft from the US. EU and US fighter aircraft are under consideration along with advanced generation Russian fighters to replace Vietnam’s obsolescent airframes, such as the MiG-21. The third and fourth 636 KILO-class diesel-electric submarines from Russia were delivered to Vietnam in 2015. Media reporting indicates Vietnam has purchased the Israeli SPYDER air defence system. In December, Vietnam unveiled the indigenously manufactured HS-6L high-altitude long-endurance UAV.
Country name Vietnam
Capital city Hanoi
Population 91.6 million
Land size 331 210 km2
Currency Dong
Fiscal year 1 January–31 December
Economy Less-developed country with a centrally planned economy
Industries Food processing, garments, shoes, mining, cement, glass, fertiliser, tyres, oil, coal, steel, paper, coffee and rice
*This budget figure is based on a single unverified source.

30
SOU
TH P
AC
IFIC
– R
EGIO
NA
L O
VER
VIE
W
Regional economy
The South Pacific is characterised by small,
narrow-based economies that rely on
remittances, tourism and commodity exports.
Countries in the region have limited
prospects for diversifying their economies,
and therefore remain vulnerable to shocks
including natural disasters and fluctuations in
commodity prices. Economic conditions were
mixed for the region in 2015. PNG’s revenues
were much lower than forecast due to low
commodity prices. Natural disasters
constrained growth – with PNG experiencing
a severe drought and Fiji hit by Tropical
Cyclone Winston.
Defence spending
South Pacific countries have limited funds to
spend on defence, and defence spending is a
low priority in the region. Fiji, PNG and Tonga
all experienced real growth in their defence
budgets in 2015. However, PNG’s defence
budget was reduced in a supplementary
budget. Many South Pacific countries rely on
foreign partners for military acquisitions or
for overall improvements to their defence
forces. South Pacific countries’ armed forces
often gain operational experience by
deploying small numbers of troops to global
multilateral assistance missions, or alongside
partner countries.

31
SOU
TH PA
CIFIC
– R
EGIO
NA
L OV
ERV
IEW

32
FIJI

33
FIJI
Economy
Over the past 10 years, Fiji averaged 2.2 per cent annual real economic growth. In 2015, the economy grew by 4.3 per cent, due to tourism, remittances, consumption and government spending. Construction and lending for investment increased; however, growth in these sectors was offset by reductions in agricultural activity in the sugar, fisheries and timber sectors due to an El Nino weather system. Although Fiji’s GDP will initially be hindered by the cost of repairing infrastructure damaged by Tropical Cyclone Winston, economic activity for the next five years will be supported by tourism, public infrastructure projects, foreign aid and reconstruction. Fiji’s economy is forecast to average 3.6 per cent real growth to 2020, according to the IMF, but it is vulnerable to external shocks.
Defence spending
Fiji’s 2015 defence budget was FJ$110.8m
(US$57.5m) – a 5.8 per cent real increase on the 2014 defence budget. In 2015, Fiji continued its involvement in UN missions in Iraq, the Golan Heights, Lebanon and South Sudan, and with the Multinational Force Observers in the Sinai. In February 2015, Fiji and Russia signed an MoU on defence cooperation and weapons supply to Fiji. In May 2015, the US lifted its embargo on the provision of military equipment to Fiji, but no transactions have occurred. Also in May, Fiji and France signed a defence cooperation agreement, intended to increase joint exercises and exchanges between the two countries. Chinese defence assistance continues to be of a non-lethal nature, for example training and computers.
Country name Fiji
Capital city Suva
Population 890 000
Land size 18 274 km2
Currency Fijian dollar
Fiscal year 1 January–31 December
Economy Less-developed country with a market economy
Industries Tourism, sugar, clothing, copra, gold and silver mining, timber and cottage industries
34
PAPUA NEW GUINEA

35
PAP
UA
NEW
GU
INEA
Economy
Over the past 10 years, PNG averaged 7.5 per cent annual real economic growth. In 2015, the economy grew by 12.3 per cent, due to commodity exports; however, the drought and low commodity prices led to lower than expected growth and budget reductions. Exports of goods and services increased in 2015, supported by increased production from the mining sector. Non-resource economic activity is forecast to remain weak. PNG’s economy is forecast to average 3.1 per cent real growth to 2020, according to the IMF, and will be supported by exports from major LNG projects and the reopening of the Ok Tedi copper mine. PNG remains heavily reliant on commodity prices to support its economic growth.
Defence spending
PNG’s 2015 defence budget was K285.2m
(US$109.2m) – a 1.4 per cent real increase on the 2014 defence budget. In May 2015, PNG announced it would join Australia’s Pacific Maritime Security Program, which will replace the Pacific Patrol Boat Program. Also in May, the PNG National Disaster Centre and the PNGDF hosted the first Oceania Pacific Resilience Disaster Response Exercise and Exchange in Lae. In December, the PNGDF received a gift of 40 military vehicles (trucks, buses and one-tonne vehicles) from China. The PNGDF continues to receive substantial financial and training support from foreign partners – including Australia and New Zealand. This support is enhancing the PNGDF’s ability to secure its borders and contribute to multilateral forces.
Country name Papua New Guinea
Capital city Port Moresby
Population 7.7 million
Land size 462 840 km2
Currency Kina
Fiscal year 1 January–31 December
Economy Less-developed country with a market economy
Industries Copra crushing, palm oil, timber, crude oil production, construction, and gold, silver, copper and liquefied natural gas (LNG) mining

36
TONGA

37
TON
GA
Economy
Over the past 10 years, Tonga averaged 0.8 per cent annual real economic growth. In 2015, the economy grew by 2.7 per cent, due to growth in the tourism sector and rising remittances from Tongans residing overseas. Low oil prices boosted activity in the transport and electricity sectors. Tonga’s main economic risks arise from a protracted period of slower global growth, possible cost overruns for hosting the 2019 South Pacific Games, high debt levels and natural disasters. Preparations for the South Pacific Games, investments in the tourism sector and low inflation will all support economic activity over the next five years. Tonga’s economy is forecast to average two per cent real growth to 2020, according to the IMF.
Defence spending
Tonga’s 2015 defence budget was T$9.2m
(US$4.8m) – an 11.4 per cent real increase on the 2014 defence budget. Tonga’s armed forces are poorly funded and rely on foreign assistance for new acquisitions and operations. In October 2015, Tonga commissioned a 30-metre landing craft, donated by Australia, which has already played a key role in disaster response activities. Tonga has contributed personnel to multilateral UN and coalition missions, including in Afghanistan.
Country name Tonga
Capital city Nuku’alofa
Population 103 000
Land size 747 km2
Currency Pa’anga
Fiscal year 1 July–30 June
Economy Less-developed country with a market economy
Industries Tourism, fish, squash and vanilla

38
NO
RTH
ASI
A –
REG
ION
AL
OV
ERV
IEW
Regional economy
Despite improved economic conditions in the
US, economic growth in North Asia during 2015
was moderate. Slower economic growth in
Europe and China’s transition to a
lower-growth economy negatively impacted
North Asia’s regional growth. Low commodity
prices had a significant negative effect on
Russia’s economy, while South Korea and
Japan only experienced modest growth.
China’s lower economic growth will moderate
regional economic activity out to 2020.
Defence spending
North Asia’s defence spending in 2015 saw
real increases for all regional countries
defence budgets, as the region continued
military modernisation and the procurement
of air and maritime platforms in response to
ongoing regional tension. North Korea has
been excluded from the regional comparison
charts below due to a lack of reliable data.

39
NO
RTH
ASIA
– R
EGIO
NA
L OV
ERV
IEW

40
CHINA

41
CH
INA
Economy
Over the past 10 years, China averaged 9.5 per cent annual real economic growth. In 2015, the economy grew by 6.8 per cent, due to stronger growth in services and consumption. Despite a moderation in growth, China accounted for about a third of global economic growth in 2015. China’s GDP will continue to slow over the next five years as structural reforms are implemented, but this slowdown will be partially offset by fiscal stimulus designed to maintain social and financial stability. Low inflation and robust consumption will also support economic activity. China’s economy is forecast to average 6.2 per cent real growth to 2020, according to the IMF.
Defence spending
China’s 2015 defence budget was RMB913.5bn*
(US$150.2bn) – an 8.2 per cent real increase on the 2014 defence budget. However, the budget is opaque and difficult to determine accurately. Some commentators place China’s total defence spending at a much higher figure. In January 2015, China launched its fifth DONGDIAO-class intelligence collection ship. In November, China commissioned its largest ship for transporting supplies, weapons and equipment. Also in November, China signed a contract for the purchase of 24 Russian-made Sukhoi Su-35 multirole fighter aircraft. In December, China confirmed its second aircraft carrier is under construction at Dalian shipyard. Also, in December, China commissioned its third Type 052D LUYANG III-class destroyer.
Country name China
Capital city Beijing
Population 1.37 billion
Land size 9 596 960 km2
Currency Renminbi (unit of currency: Yuan)
Fiscal year 1 January–31 December
Economy Socialist market economy
Industries Wide ranging, including iron, steel, petroleum, cement, chemical fertilisers, automobiles, electronics and telecommunications
*The budget figure assumes the local government contribution for 2015 was RMB26.6bn (US$4.4bn)

42
JAPAN
43
JAPA
N
Economy
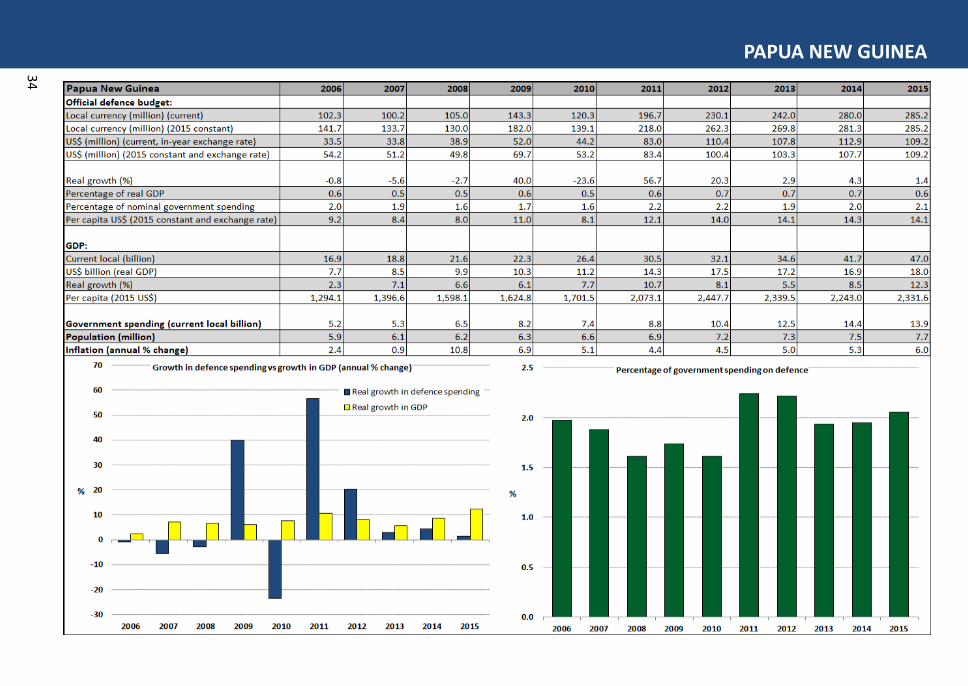
Over the past 10 years, Japan averaged 0.5 per cent annual real economic growth. In 2015, the economy grew by 0.6 per cent, due to increased trade in services; strong tourism; and the continued use of expansionary monetary policy, which was intended to avert deflation, reduce borrowing costs and boost wealth. However, economic growth was still hampered by weakness in the household sector and consumer spending. Exports of manufacturing goods weakened in 2015, primarily due to the slowdown in China. Future growth may come from reforms seeking to increase competition and raise productivity. Japan’s economy is forecast to average 0.7 per cent real growth to 2020, according to the IMF.
Defence spending
Japan’s 2015 defence budget was ¥4.98tr
(US$41bn) – no real increase or decrease on the 2014 defence budget. In March 2015, Japan commissioned its first IZUMO-class helicopter carrier. In July, Japan’s Ministry of Defence selected Fuji Heavy Industries, in collaboration with Bell Helicopters, to develop a next-generation UH-X multipurpose helicopter to replace Japan’s Bell UH-1J Huey helicopters. In September, Tokyo also selected the Boeing KC-46A as its next aerial refueling aircraft. Japan’s new defence procurement agency – the Acquisition, Technology and Logistics Agency – was launched in October. In November, Japan placed its first order for the Northrop Grumman E-2D Advanced Hawkeye airborne early warning and control aircraft.
Country name Japan
Capital city Tokyo
Population 126.7 million
Land size 377 915 km2
Currency Yen
Fiscal year 1 April–31 March
Economy Advanced country with market economy
Industries Automobiles, electronics, machine tools, steel and non-ferrous metals, ships, chemicals and textiles

44
NO
RTH
KO
REA
INSUFFICIENT RELIABLE DATA AVAILABLE

45
NO
RTH
KO
REA
Economy
No official information is published for North Korea. Despite some signs of modest economic growth in the last 10 years, North Korea’s economy remains largely stagnant. Some estimates suggest GDP is around 20 per cent below late-1980s levels. North Korea’s economy is expected to be further constrained by the US sanctions that were introduced in January 2015 following the computer hacking of Sony. In addition, further UNSC sanctions in response to missile launches and nuclear testing are also expected to reduce growth. North Korea will continue to rely on international food aid, arms proliferation, remittances from workers engaged abroad and its trade and aid relationship with China. North Korea continues its efforts to attract foreign investment and promote tourism to the country in order to secure greater sources of foreign currency.
Defence spending
Reliable data on North Korea’s defence spending is not available. Since 2013, North Korea’s byongjin policy has emphasised the parallel development of the economy and the country’s nuclear program. However, Pyongyang also follows a ‘military first’ policy that ensures a large portion of government spending is directed towards military expenditure.
Country name North Korea
Capital city Pyongyang
Population 25 million
Land size 120 538 km2
Currency North Korean won
Fiscal year 1 January–31 December
Economy Less-developed country with centrally planned economy
Industries Military products, machine building, chemicals, mining, metallurgy and apparel

46
RUSSIA

47
RU
SSIA
Economy
Over the past 10 years, Russia averaged 2.4 per cent annual real economic growth. In 2015, the economy contracted by 3.8 per cent, due to a significant decline in private consumption, a weakened ruble, high inflation and a decline in real incomes. Fixed investment declined as commodity producers were hurt by low oil prices and international sanctions. The commodity driven economy will continue to be hampered if oil prices remain low. In 2015, the Bank of Russia lowered the key interest rate four times, in an effort to stimulate growth. Economic recovery is expected to be gradual and Russia’s economy is forecast to average one per cent real growth to 2020, according to the IMF.
Defence spending
Russia’s 2015 defence budget was RU3.1tr
(US$51.7bn) – a 16.2 per cent real increase on the 2014 defence budget. In March 2015, Russia began construction of its fifth YASEN-class nuclear-powered submarine. State trials on the ADMIRAL GRIGOROVICH-class frigate finished in December. The second ship in this class, Admiral Essen, began factory sea trials in October 2015. A total of six ships are on order to be built; however, the final three ships could be exported. In December 2015, Russia’s seventh BOREI-class nuclear-powered ballistic missile submarine, Emperor Alexander III, began construction. The Russian Navy plans to operate a total of eight BOREI-class submarines.
Country name Russia
Capital city Moscow
Population 146.3 million
Land size 17 098 242 km2
Currency Ruble
Fiscal year 1 January–31 December
Economy Industrialised country with an emerging market economy
Industries Oil and gas, coal, precious metals and timber

48
SOUTH KOREA

49
SOU
TH K
OR
EA
Economy
Over the past 10 years, South Korea averaged 3.6 per cent annual real economic growth. In 2015, the economy grew by 2.7 per cent, due to domestic demand from strong private consumption and fixed investment. Domestic demand was also fuelled by fiscal stimulus measures introduced by the government to boost growth. The outbreak of Middle East Respiratory Syndrome and the slowdown in export demand from China constrained economic growth in 2015. Strong employment growth and low oil prices are likely to stimulate domestic demand and growth over the next five years. South Korea’s economy is forecast to average 3.5 per cent real growth to 2020, according to the IMF.
Defence spending South Korea’s 2015 defence budget was
₩37.5tr (US$33.4bn) – a 2.4 per cent real
increase on the 2014 defence budget. In May 2015, South Korea launched the sixth of nine KSS-2 diesel electric submarines. In June, Seoul announced it would purchase four A330-MRTT aerial refueling tanker aircraft from Airbus. Also in June, the US State Department approved a foreign military sales request for Aegis combat systems for South Korean Navy destroyers. Seoul launched its sixth INCHEON-class guided-missile frigate in August; 20 are scheduled to be delivered to the Navy by the mid-2020s.
Country name South Korea
Capital city Seoul
Population 50.6 million
Land size 99 720 km2
Currency South Korean won
Fiscal year 1 January–31 December
Economy Industrialised country with a market economy
Industries Automobiles, electronics, chemicals, shipbuilding, textiles and apparel

50
TAIWAN

51
TAIW
AN
Economy
Over the past 10 years, Taiwan averaged 3.6 per cent annual real economic growth. In 2015, the export-driven economy grew by 2.2 per cent, due to the slowdown in global demand for exports of goods and services, particularly from China. The interest rate remained low and steady in 2015, due to continued loose monetary policy by the Central Bank. The New Taiwan dollar depreciated against the US dollar during most of 2015, but is expected to remain relatively stable throughout 2016. Taiwan’s future economic growth will be constrained by weak domestic and external demand and a shrinking labour force. However, increased productivity gains, in line with technological advances, may assist Taiwan’s GDP growth. Taiwan’s economy is forecast to average three per cent growth to 2020, according to the IMF.
Defence spending
Taiwan’s 2015 defence budget was
NT$312.8bn (US$10bn) – a 2.4 per cent real increase on the 2014 defence budget. In March 2015, Taiwan commissioned Tuo Jiang, the first of up to 12 stealth corvettes planned under the Hsun Hai (sea swift) program. In December, the US announced a large weapon sale to Taiwan, the first since 2011. The package includes two US OLIVER HAZARD PERRY-class guided missile frigates, amphibious assault vehicles, man-portable air defence systems and anti-ship missile defence systems. In December, Taiwan received its third batch of four UH-60M Black Hawk medium-lift utility helicopters. Overall, a total of 60 are scheduled to be received.
Name Taiwan
Capital city Taipei
Population 23.5 million
Land size 35 980 km2
Currency New Taiwan dollar
Fiscal year 1 January–31 December
Economy Newly industrialised market economy
Industries Electronics, petroleum refining, chemicals, textiles, iron and steel, machinery, cement and food

52
SOU
TH A
SIA
– R
EGIO
NA
L O
VER
VIE
W
Regional economy
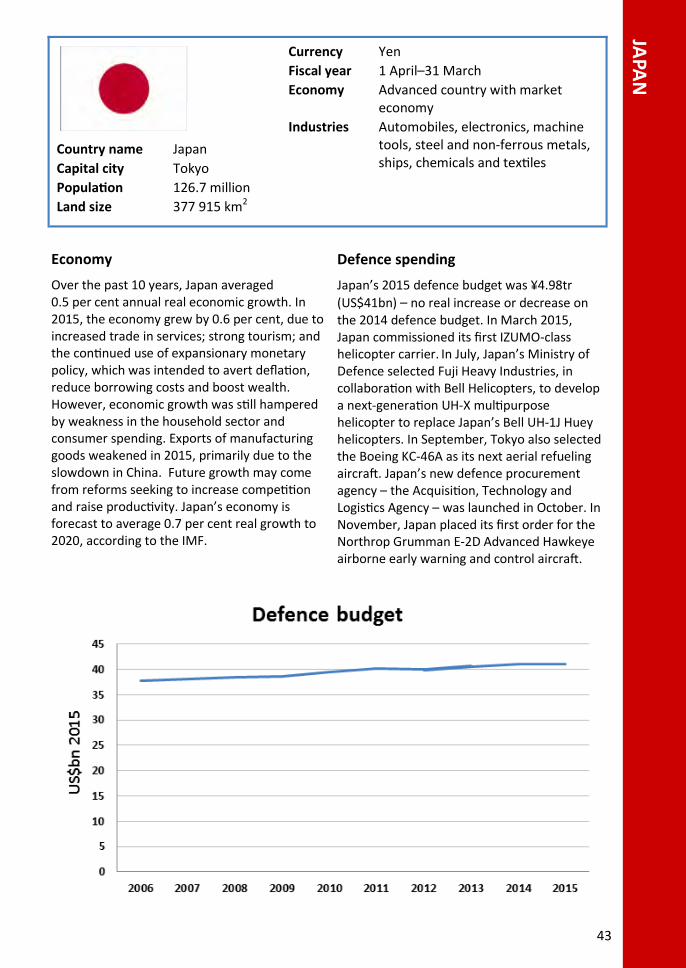
In 2015, economic growth in South Asia was
strong in most countries – with only Sri Lanka
experiencing lower growth than in 2014. Low
oil prices benefited South Asian economies,
which are all net oil importers. South Asian
countries’ ability to overcome external
shocks has improved with stronger current
account balances and increasing capital
inflows; however, the region’s export growth
has slowed. Strong growth in India, coupled
with lower inflation, will stimulate growth in
South Asia out to 2020.
Defence spending
South Asian defence spending in 2015 saw
real increases for all defence budgets. India
remains the region’s largest defence spender.
South Asian countries purchased a range of
different platforms in 2015 aimed at
modernising their armed forces, and were
driven by internal security challenges and
ongoing inter-state rivalries. India continues
to push the development of its indigenous
defence industry. Russia and the US remain
the main defence suppliers to the region.
53
SOU
TH A
SIA – R
EGIO
NA
L OV
ERV
IEW

54
BANGLADESH

55
BA
NG
LAD
ESH
Economy
Over the past 10 years, Bangladesh averaged 6.2 per cent annual real economic growth. In 2015, the economy grew by 6.5 per cent, due to strong domestic consumption driven by higher remittances, higher wages, and public investment. Bangladesh’s international reserves have risen and the public debt-to-GDP ratio remains at a moderate level. Inflation in 2015 was 6.4 per cent, a reduction from 7.3 per cent in 2014, due to declining food prices. However, economic growth was constrained by a significant decline in exports in 2015, due to reduced external demand and political demonstrations disrupting supply chains. Bangladesh’s economy is forecast to average 6.9 per cent real growth to 2020, according to the IMF.
Defence spending
Bangladesh’s 2015 defence budget was
Tk183.8bn (US$2.3bn) – a 5.1 per cent real increase on the 2014 defence budget. In May 2015, a second US Coast Guard Cutter was transferred to the Bangladesh Navy. In June, a Bangladesh shipyard held a keel laying ceremony for the construction of eight high-speed patrol boats. In December, Bangladesh introduced the Yak-130 and the AW139 search and rescue helicopters into the Bangladesh Air Force. Also in December, Bangladesh received five Mi-171 multi-role helicopters from Russia, and the Bangladesh Navy received two new Chinese-built C13B corvettes.
Country name Bangladesh
Capital city Dhaka
Population 159.9 million
Land size 148 460 km2
Currency Bangladeshi taka
Fiscal year 1 July–30 June
Economy Less-developed country with a market economy
Industries Cotton, wheat, jute, tobacco, garments, pharmaceuticals, petroleum products and natural gas

56
INDIA

57
IND
IA
Economy
Over the past 10 years, India averaged 7.5 per cent annual real economic growth. In 2015, the economy grew by 7.3 per cent, due to strong fixed investment and government spending. Lower oil prices helped stimulate growth by underpinning the decline in inflation and raising real incomes. However, economic growth was well below potential and was constrained by slower growth in manufacturing, bottlenecks in infrastructure and shortages in skilled labour. Future economic growth will rely on the implementation of key domestic reforms such as improving the ease of doing business and a goods and services tax. India’s economy is forecast to average 7.6 per cent real growth to 2020, according to the IMF.
Defence spending
India’s 2015 defence budget was Rs3.1tr
(US$48bn) – a 3.6 per cent real increase on the 2014 defence budget. In February 2015, India’s Ministry of Defence approved the state-owned Goa Shipyard Limited to build 12 mine countermeasure vessels. In September, India signed a contract to purchase 15 CH-47F Chinook and 22 AH-64E Apache helicopters from the US. In mid-October, India received the eighth P-8I maritime patrol aircraft from Boeing. All eight aircraft from the 2009 contract have now been received and are in service with the Indian Navy. In November, India’s Navy received the second of four KAMORTA-class anti-submarine warfare corvettes.
Country name India
Capital city New Delhi
Population 1.29 billion
Land size 3 287 263 km2
Currency Indian rupee
Fiscal year 1 April–31 March
Economy Less-developed country with a market economy
Industries IT services, textiles, chemicals, steel, transportation equipment, cement, mining, petroleum and machinery

58
PAKISTAN

59
PAK
ISTAN
Economy
Over the past 10 years, Pakistan averaged 3.9 per cent annual economic growth. In 2015, the economy grew by 4.2 per cent, due to strong growth in services. In 2015, remittances were strong and inflation declined considerably due to reductions in the prices of food and oil.
However, economic growth was constrained by a slowdown in manufacturing and chronic energy shortages. Future growth will continue to be impeded by energy shortages, the challenging business environment and a low investment in human capital. However, the long-term implementation of the
China–Pakistan economic corridor is intended to improve infrastructure, create jobs and provide economic stimulus. Pakistan’s economy is forecast to average 4.9 per cent growth to 2020, according to the IMF.
Defence spending
Pakistan’s 2015 defence budget was
Rs783.1bn (US$7.7bn) – a 6.6 per cent real increase on the 2014 defence budget. In February 2015, the first of four Chinese ZDK-03 Karakorum Eagle early warning aircraft entered service. In April, Pakistan received three Z-10 Thunderbolt attack helicopters gifted from China. In June, Pakistan and the China Ship Trading Company signed an agreement for the construction of six patrol vessels for the Pakistan Maritime Security Agency. In August, Pakistan and Russia signed an agreement for Pakistan’s purchase of four Mi-35 Hind attack helicopters from Russia. In 2015, Pakistan also announced it had finalised a deal with China to purchase eight submarines.
Country name Pakistan
Capital city Islamabad
Population 189.9 million
Land size 796 095 km2
Currency Pakistani rupee
Fiscal year 1 July–30 June
Economy Less-developed country with a market economy
Industries Textiles, food processing, beverages, construction materials, clothing, paper products and prawns

60
SRI LANKA

61
SRI LA
NK
A
Economy
Over the past 10 years, Sri Lanka averaged 6.8 per cent annual real economic growth. In 2015, the economy grew by 6.5 per cent, due to consumption, spurred in part by the new government’s increase to private sector wages. In 2015, Sri Lanka also experienced strong tourism growth, which assisted remittances and foreign exchange earnings. However, Sri Lanka’s exports as a percentage of GDP continued to decline as did the Sri Lankan Rupee against the US dollar. Future economic growth is expected to be constrained by poor infrastructure, shortages in skilled labour and difficulty in attracting foreign direct investment. Sri Lanka’s economy is forecast to average 6.5 per cent real growth to 2020, according to the IMF.
Defence spending
Sri Lanka’s 2015 defence budget was
Rs268.5bn (US$2.0bn) – a 9.4 per cent real increase on the 2014 defence budget. In 2015, Sri Lanka was seeking to purchase
18–24 fighter aircraft, to replace its ageing fighter fleets of Israeli Kfirs and MiG-27s. A large proportion of Sri Lanka’s defence budget is devoted to personnel expenditure. Sri Lanka also receives military support for procurement and training from Russia and China.
Country name Sri Lanka
Capital city Colombo
Population 21.1 million
Land size 65 610 km2
Currency Sri Lankan rupee
Fiscal year 1 January–31 December
Economy Less-developed country with a market economy
Industries Textiles, tourism, tea, coconuts, tobacco, IT services, insurance and banking, cement and construction
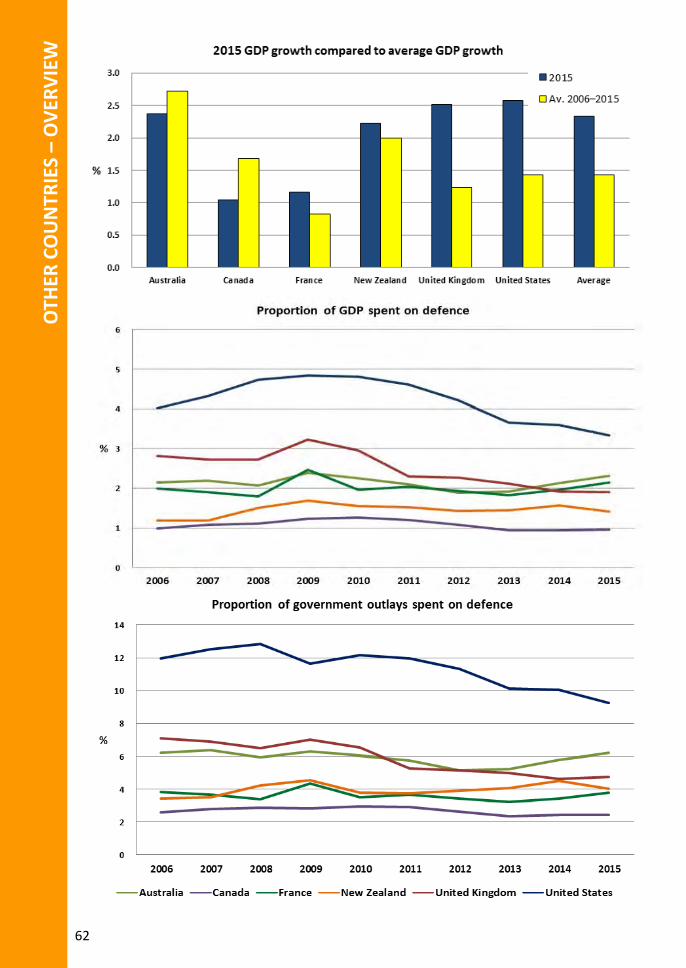
62
OTH
ER C
OU
NTR
IES
– O
VER
VIE
W

63
AUSTRALIA

64
CANADA
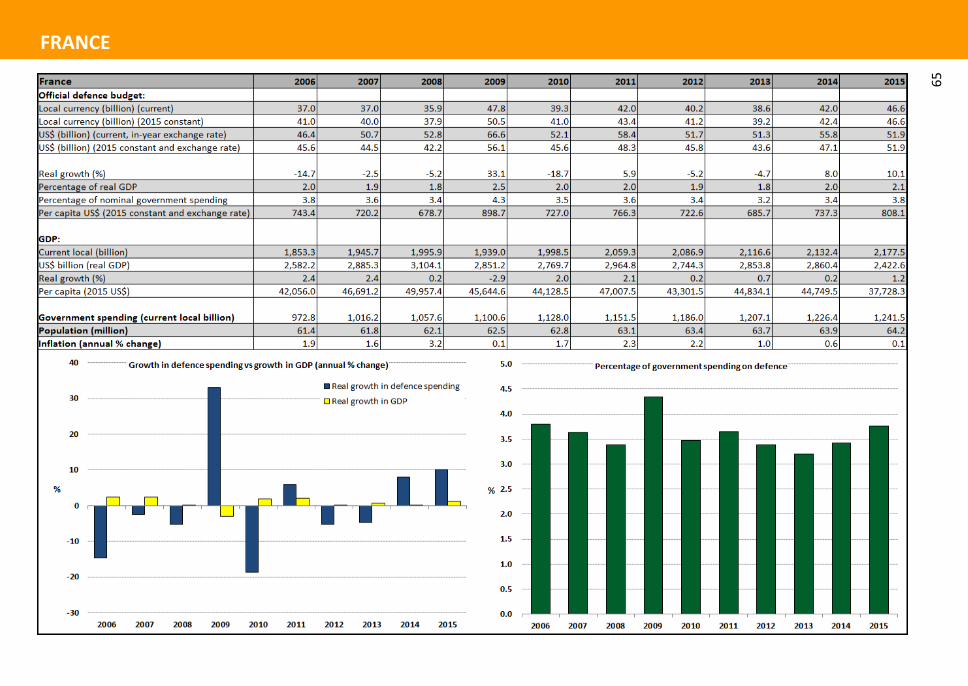
65
FRANCE

66
NEW ZEALAND

67
UNITED KINGDOM

68
UNITED STATES

69
AP
PEN
DIX
A – M
ETHO
DO
LOG
Y
Methodology
The Defence Economic Trends series is titled and numbered according to the year in which the
report is published. Defence Economic Trends 2013 was the first year this method was
implemented. Previous editions were titled for the calendar year of the budgets being reviewed.
The last of the series to use the old convention was Defence Economic Trends 2011, which was
published in 2012.
Defence Economic Trends 2016 uses a different methodology to the Defence Economic Trends
series published before 2013 to calculate historical defence spending in US dollars. Except for
Timor-Leste – which uses the consumer price index as its deflator – a GDP price deflator is used
to deflate historic defence budgets expressed in local currency into 2015 constant terms. This
method is also used to translate historical defence expenditure to a US dollar base in the country
tables. One figure shows nominal defence budgets in US dollars using year-specific (current)
exchange rates; the other figure shows the deflated defence budget in US dollars using constant
2015 exchange rates. This first line provides a more accurate view of the buying power displayed
by defence budgets at any point in time. The second line allows for comparisons over time in US
dollars, removing the affect of fluctuating exchange rates. To create simple visual comparisons of
defence spending trends, graphical representations of defence budgets use constant 2015
exchange rates.
Although new economic forecasts were released during the development of this publication, not
all data can be updated to the latest predictions. For Defence Economic Trends 2016, the
information is sourced from the International Monetary Fund’s World Economic Outlook,
released in October 2015.
The Defence spending paragraphs do not represent an exhaustive list of all procurement
activities in 2015. These paragraphs are intended to provide a snapshot of major acquisitions and
spending decisions prominent in open-source reporting throughout 2015.
Historical methodology
Before Defence Economic Trends 2013, a proxy defence deflator was used to calculate nominal
defence budget figures into constant US dollars. The model used 2005 as a base year for
comparison, using a proxy deflator based on three key defence expenditure factors: capital
procurement, personnel and operating costs. In previous publications, defence budget
calculations used constant exchange rates to convert historical defence spending (expressed in
local currency) into constant US dollar terms.

70
AP
PEN
DIX
B –
NO
TES
ON
SO
UR
CES
Data Sources
The table below shows data sources used for this publication.
Other publishers of similar data
Other organisations that publish data similar to that provided in this publication include the:
IMF
IISS
Stockholm International Peace Research Institute (SIPRI).
However, these organisations use different methodologies to compile their data, as illustrated
below.
IMF
The IMF primarily distributes a detailed questionnaire to government correspondents, typically
located in each country’s respective Ministry of Finance or Central Bank.
IISS
The IISS cites official defence budgets and adjusts, where necessary, military expenditure to
include all other military-related spending. The only exception occurs in the case of NATO
countries, where the IISS uses the figures released by governments and, for comparison, also
cites the NATO-defined expenditure. Some countries include internal and border security force
expenditure in their defence budgets. Where separate budgets exist, the IISS generally indicates
this in footnotes. IISS figures can vary from previous years, often because of updates made by
the governments themselves.
Data Source
Official defence budget
(local currency)
Official budget sources from national governments
International Institute for Strategic Studies (IISS) The Military Balance series
Other open sources, including reputable media or official
newspapers
GDP IMF publications
Government expenditure IMF publications
Official government budgets (for Timor-Leste only)
General financial information IMF publications
Other think tanks and institutions: Economist Intelligence
Unit, World Bank and Asian Development Bank
Population IMF publications
CIA World Fact Book (for North Korea only)

71
AP
PEN
DIX
B – N
OTES O
N SO
UR
CES
Wherever possible, the IISS uses exchange rates taken from IMF publications – although these may not be applicable to commercial transactions. In some cases, in an effort to make US dollar figures more relevant for international comparisons, the IISS uses a different set of exchange rates to calculate defence spending, which reflects the differences in purchasing power parity terms between the civilian and military sectors.
SIPRI
Where possible, SIPRI includes the following items in its definition of military expenditure:
all current and capital expenditure on the armed forces and the running of defence
departments and other government agencies engaged in defence projects and space
activities
the cost of paramilitary forces, border guards and police (when judged to be trained and
equipped for military operations)
military research and development, testing and evaluation costs
costs of retirement pensions of defence personnel and civilian employees.
New Figures
In the Defence Economic Trends 2016 publication, the US budget figure was sourced from the
White House Office of Management and Budget historical figures. In previous versions of the
Defence Economic Trends, SIPRI figures were used.

72
AP
PEN
DIX
B –
NO
TES
ON
SO
UR
CES
© Commonwealth of Australia 2016
ISSN 1835-386X (Print)
ISSN 1835-3878 (Online)
This work is copyright. Apart from any use as permitted under the Copyright Act 1968, no part
may be reproduced by any process without prior written permission from the Commonwealth.
Requests and inquiries concerning reproduction and rights should be addressed to:
Commonwealth Copyright Administration
Attorney General’s Department
Robert Garran Offices
National Circuit
Barton ACT 2600
or posted at http://www.ag.gov.au/cca


![Asia Pacific Youth to Business (Y2B) Forum Proposal [for Asia Pacific]](https://img.pdfslide.us/doc/110x75/568c4db71a28ab4916a50cbd/asia-pacific-youth-to-business-y2b-forum-proposal-for-asia-pacific.jpg)