Embed Size (px)
Citation preview
ECNDT 2006 - Poster 214
Defects Detection in Welds Using Ultrasonic Analysis
Sonia DJILI, Faiza BOUKAZOUHA, Rafik HALIMI, Ali BADIDI BOUDA Scientific Center Research of one Welding and non Destructive Testing, BP64 Route de
Dely-Ibrahim Cheraga Alger, Algeria. [email protected]
Abstract. In some austenitic stainless steel welds grains orientation cause deviation and splitting of the ultrasonic beam. It is especially true in the case of multipass welds when the remelting process after each pass causes complex solidification process. With these orientations we define a precise description of the heterogeneous and anisotropic material. Non destructive testing (NDT) is commonly used industrial method to evaluate the integrity of individual components. In service induced cracks such as fatigue and stress corrosion cracks can, if they are detected, be sized and monitored in order to postpone repairs or replacements.
Introduction
Welding development requires the use of some new processes which can lead to imperfections and defects in welds. Moreover, welds undergo, during life time, thermal and mechanical stresses or deteriorations due to the effects of oxidation, which weaken the welds and could be the defects. It is important, for the environment safety to be able to control this welds in a non-destructive way, to avoid problems such as leak in industrial plants petrochemical industry, chemical industry, transport of gas, refineries... In our work, two welded carbon steel of 3.8 cm thickness were made using two different welding processes: low energy manual arc process and high energy automatic process. The method used to control and characterize welds is ultrasonics method. The experiments were carried out by immersion and using 2.25 MHz piezoelectric transducers. After studying the influence of the welding parameters on the ultrasonic beam characteristics in the welded zone, cylindrical volumics defects, were introduced into the welded zone and the base metal. Longitudinal waves mode with various angles of propagation (L0 and L45) have been generated in order to detect and characterise these
1. Presentation of Welds
1.1 Flux wire process
The welding to high energy is characterized by a well stocked heat and energy more intense than the one to use in the case of the manual process. The temperature can reach 800°c the energy of welding is the order of 1.07KJ/mm.
ECNDT 2006 - Poster 214
1.2 Manual arc process
This process is characterized by a low energy, the current of welding is 150A and tension is 20V. The chemical composition of steel to the used carbon is given in the picture.
Table 1. The Chemical Composition of the Base Metal for the Two Welds.
Element C Mo Cu Nor Mn Cr P If V S Tensor of
it% 0,117 0,001 0,064 <0,03 0,587 Traces <0,009 0,261 <0,01 <0,01
The two welds have been achieved with a material of contribution whose chemical composition is: C 0.1, Mn 0.5, If 0.9.
2. Metallographic Observations
2.1 Macrographic analysis
According to precede works, every zone revealed in macrograph by a particular contrast, would correspond to a set of grains presenting a common orientation. To put in evidence influences he of the welding process or of the energy of welding bet in game a comparison is done more precisely between structures of the two welding. This Macrograph is achieved in the plan (TV) as indicated on the face. 2.1.1 Manual welding
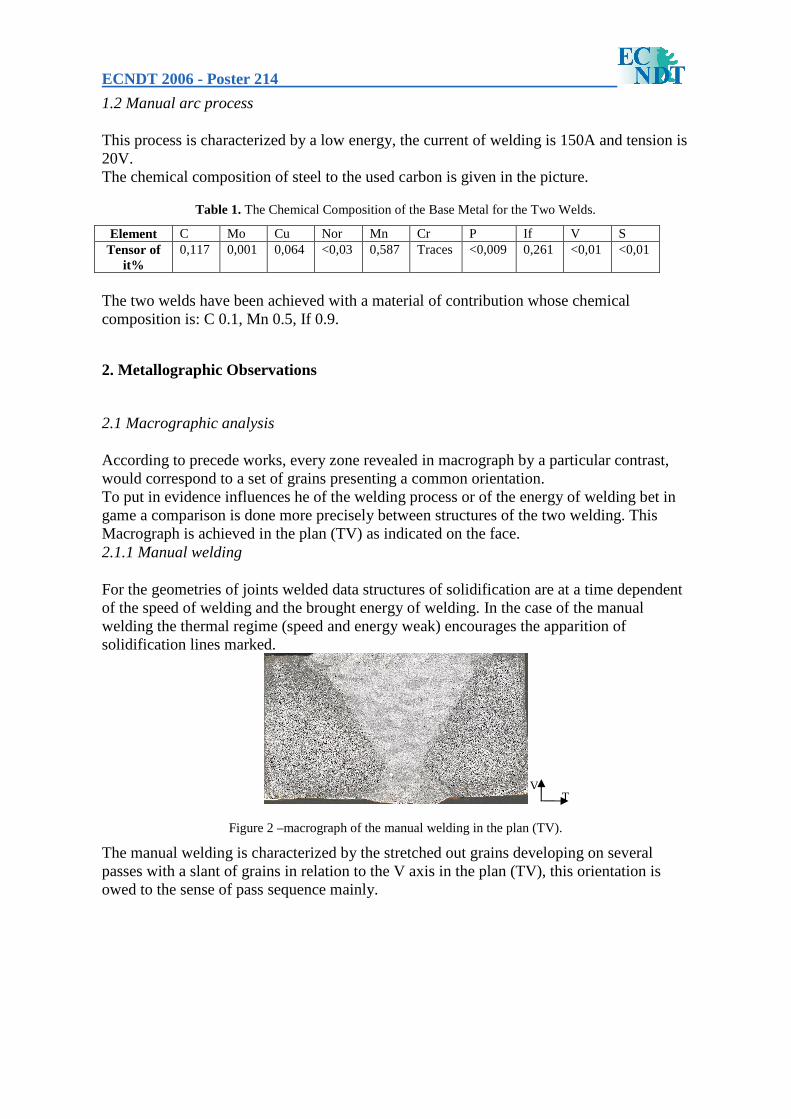
For the geometries of joints welded data structures of solidification are at a time dependent of the speed of welding and the brought energy of welding. In the case of the manual welding the thermal regime (speed and energy weak) encourages the apparition of solidification lines marked.
Figure 2 –macrograph of the manual welding in the plan (TV).
The manual welding is characterized by the stretched out grains developing on several passes with a slant of grains in relation to the V axis in the plan (TV), this orientation is owed to the sense of pass sequence mainly.
V T
ECNDT 2006 - Poster 214
2.1.2 Automatic welding
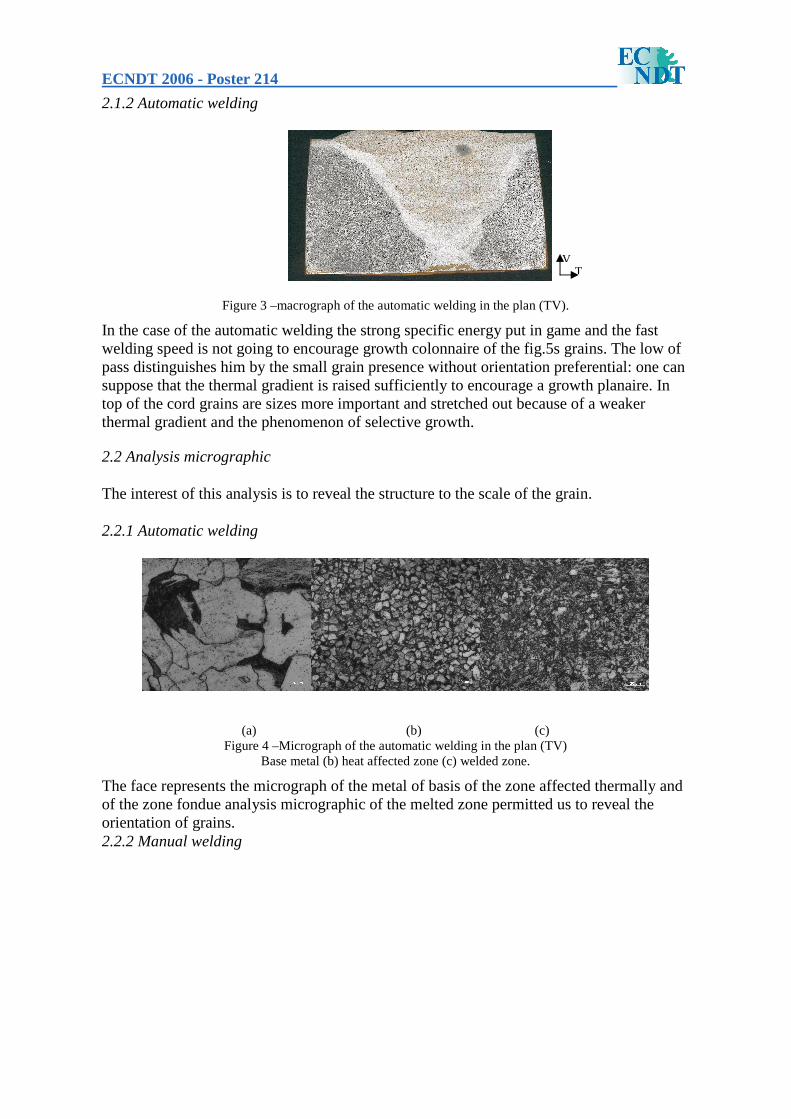
Figure 3 –macrograph of the automatic welding in the plan (TV).
In the case of the automatic welding the strong specific energy put in game and the fast welding speed is not going to encourage growth colonnaire of the fig.5s grains. The low of pass distinguishes him by the small grain presence without orientation preferential: one can suppose that the thermal gradient is raised sufficiently to encourage a growth planaire. In top of the cord grains are sizes more important and stretched out because of a weaker thermal gradient and the phenomenon of selective growth.
2.2 Analysis micrographic
The interest of this analysis is to reveal the structure to the scale of the grain.
2.2.1 Automatic welding
(a) (b) (c) Figure 4 –Micrograph of the automatic welding in the plan (TV)
Base metal (b) heat affected zone (c) welded zone.
The face represents the micrograph of the metal of basis of the zone affected thermally and of the zone fondue analysis micrographic of the melted zone permitted us to reveal the orientation of grains. 2.2.2 Manual welding
T V
ECNDT 2006 - Poster 214
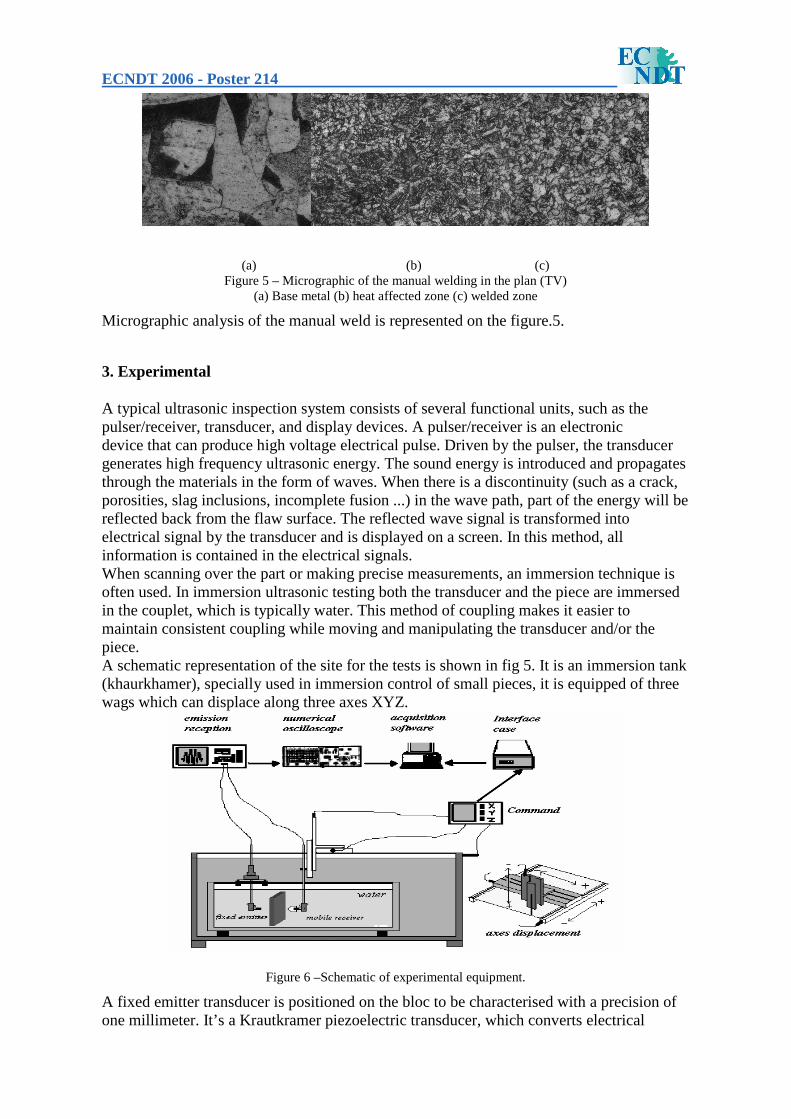
(a) (b) (c) Figure 5 – Micrographic of the manual welding in the plan (TV)
(a) Base metal (b) heat affected zone (c) welded zone
Micrographic analysis of the manual weld is represented on the figure.5.
3. Experimental
A typical ultrasonic inspection system consists of several functional units, such as the pulser/receiver, transducer, and display devices. A pulser/receiver is an electronic device that can produce high voltage electrical pulse. Driven by the pulser, the transducer generates high frequency ultrasonic energy. The sound energy is introduced and propagates through the materials in the form of waves. When there is a discontinuity (such as a crack, porosities, slag inclusions, incomplete fusion ...) in the wave path, part of the energy will be reflected back from the flaw surface. The reflected wave signal is transformed into electrical signal by the transducer and is displayed on a screen. In this method, all information is contained in the electrical signals. When scanning over the part or making precise measurements, an immersion technique is often used. In immersion ultrasonic testing both the transducer and the piece are immersed in the couplet, which is typically water. This method of coupling makes it easier to maintain consistent coupling while moving and manipulating the transducer and/or the piece. A schematic representation of the site for the tests is shown in fig 5. It is an immersion tank (khaurkhamer), specially used in immersion control of small pieces, it is equipped of three wags which can displace along three axes XYZ.
Figure 6 –Schematic of experimental equipment.
A fixed emitter transducer is positioned on the bloc to be characterised with a precision of one millimeter. It’s a Krautkramer piezoelectric transducer, which converts electrical
ECNDT 2006 - Poster 214
signals into mechanical vibrations. It generates longitudinal waves at normal incidence (L0 mode) with 2.25 MHz frequency and 9.5 mm of diameter. This frequency has been chosen in order to get a compromise between a good penetration and a good resolution power5. After crossing the base metal or the joints of welds, the ultrasonic beam is received by a mobile piezoelectric transducer of the same frequency and diameter, fixed on a conical sole made such as the contact surface should be a 2 mm diameter disc6. The cartographies of the ultrasound beam are obtained with an automatic scanning of the opposed surface of the beam with the receiver transducer, with a step of 0.5 mm. For each case, a reference acquisition is done on the base metal.
4. Results
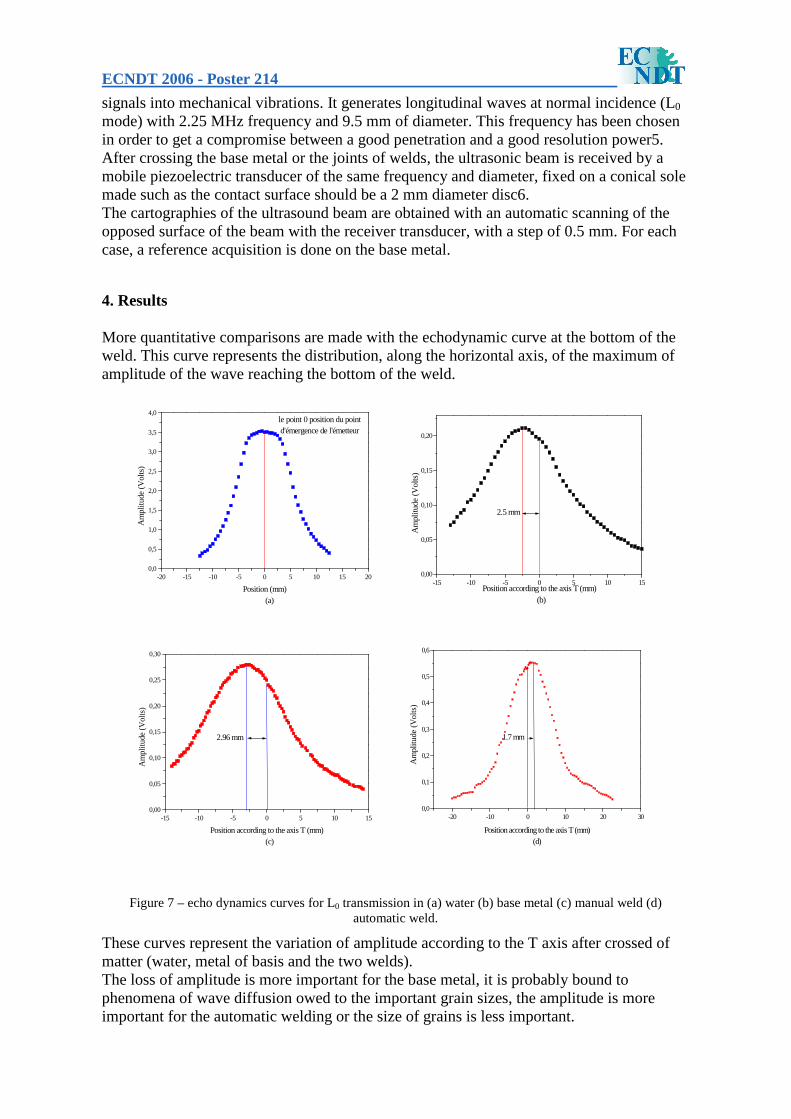
More quantitative comparisons are made with the echodynamic curve at the bottom of the weld. This curve represents the distribution, along the horizontal axis, of the maximum of amplitude of the wave reaching the bottom of the weld.
-20 -15 -10 -5 0 5 10 15 200,0
0,5
1,0
1,5
2,0
2,5
3,0
3,5
4,0le point 0 position du point d'émergence de l'émetteur
Am
plitu
de (
Vol
ts)
Position (mm) (a)
-15 -10 -5 0 5 10 150,00
0,05
0,10
0,15
0,20
2.5 mm
A
mpl
itude
(V
olts
)
Position according to the axis T (mm) (b)
-15 -10 -5 0 5 10 150,00
0,05
0,10
0,15
0,20
0,25
0,30
2.96 mm
Am
plitu
de (
Vol
ts)
Position according to the axis T (mm) (c)
-20 -10 0 10 20 300,0
0,1
0,2
0,3
0,4
0,5
0,6
1.7 mm
Am
plitu
de (
Vol
ts)
Position according to the axis T (mm)(d)
Figure 7 – echo dynamics curves for L0 transmission in (a) water (b) base metal (c) manual weld (d) automatic weld.
These curves represent the variation of amplitude according to the T axis after crossed of matter (water, metal of basis and the two welds). The loss of amplitude is more important for the base metal, it is probably bound to phenomena of wave diffusion owed to the important grain sizes, the amplitude is more important for the automatic welding or the size of grains is less important.
ECNDT 2006 - Poster 214
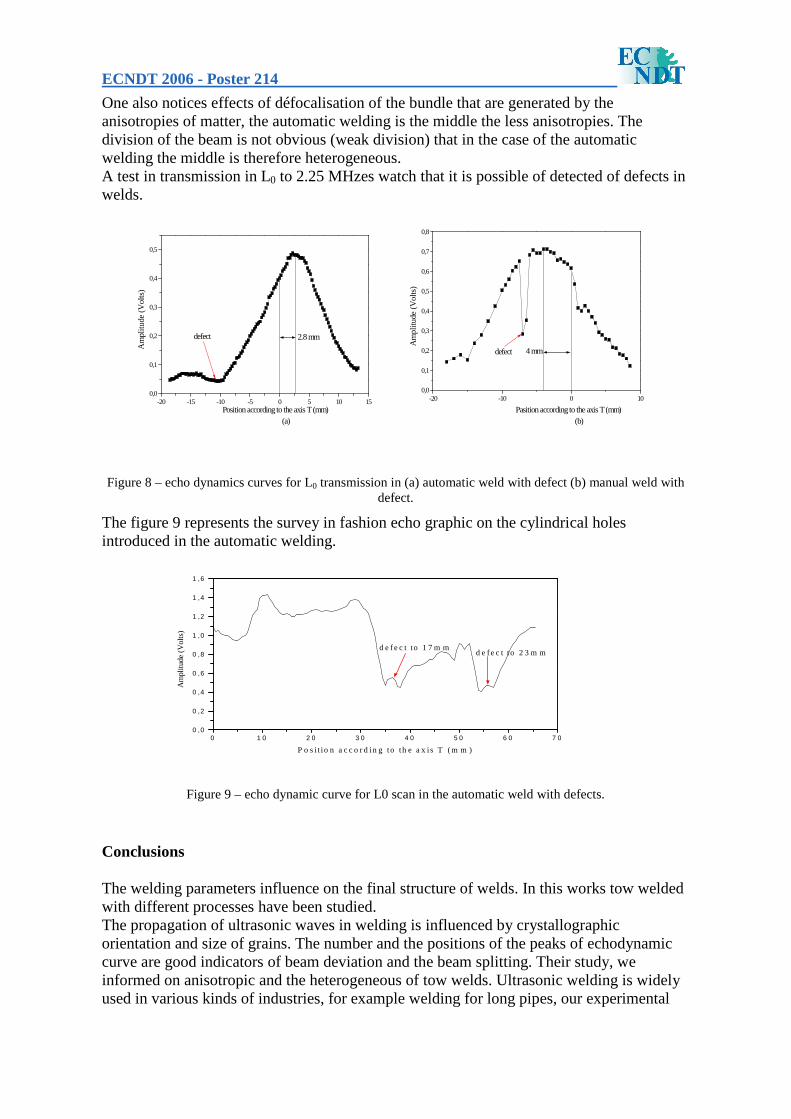
One also notices effects of défocalisation of the bundle that are generated by the anisotropies of matter, the automatic welding is the middle the less anisotropies. The division of the beam is not obvious (weak division) that in the case of the automatic welding the middle is therefore heterogeneous. A test in transmission in L0 to 2.25 MHzes watch that it is possible of detected of defects in welds.
-20 -15 -10 -5 0 5 10 150,0
0,1
0,2
0,3
0,4
0,5
defect
2.8 mm
Am
plitu
de (
Vol
ts)
Position according to the axis T (mm) (a)
-20 -10 0 100,0
0,1
0,2
0,3
0,4
0,5
0,6
0,7
0,8
defect
4 mm
Am
plitu
de (
Vol
ts)
Pasition according to the axis T (mm) (b)
Figure 8 – echo dynamics curves for L0 transmission in (a) automatic weld with defect (b) manual weld with defect.
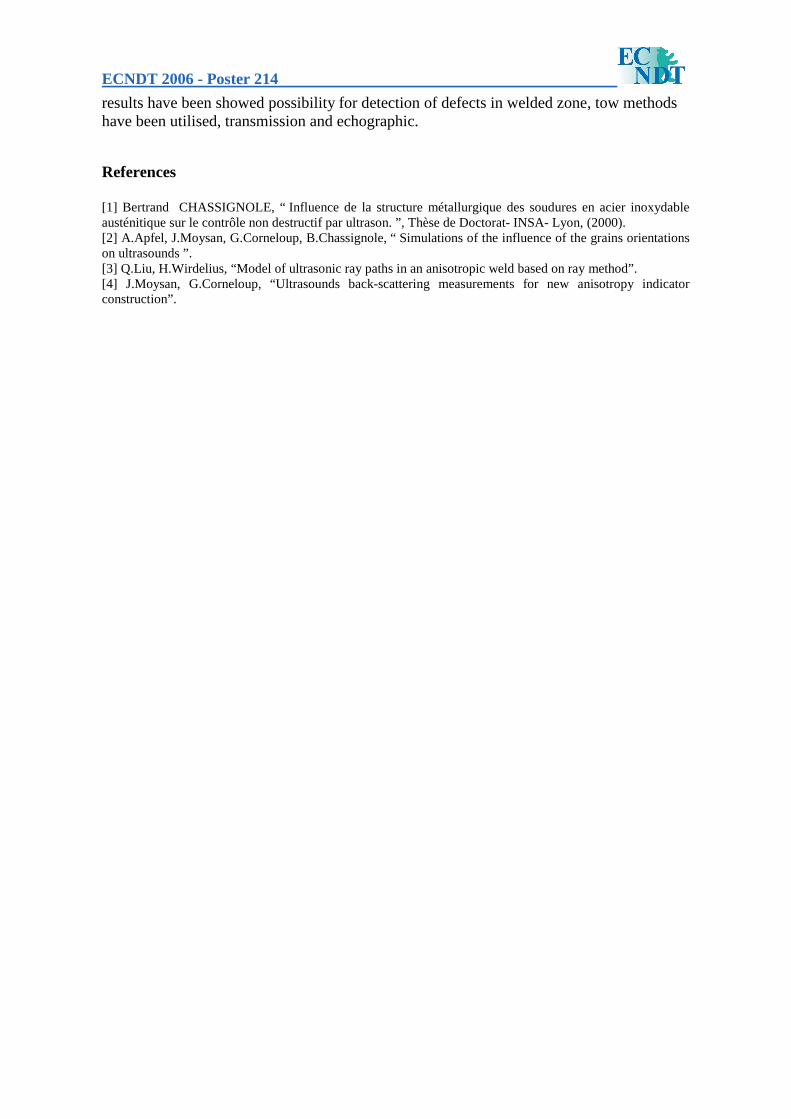
The figure 9 represents the survey in fashion echo graphic on the cylindrical holes introduced in the automatic welding.
0 1 0 2 0 3 0 4 0 5 0 6 0 7 00 ,0
0 ,2
0 ,4
0 ,6
0 ,8
1 ,0
1 ,2
1 ,4
1 ,6
d e fe c t to 2 3 m md e f e c t to 1 7 m m
Am
plitu
de (
Vol
ts)
P o s i t io n a c c o r d in g to th e a x is T ( m m )
Figure 9 – echo dynamic curve for L0 scan in the automatic weld with defects.
Conclusions
The welding parameters influence on the final structure of welds. In this works tow welded with different processes have been studied. The propagation of ultrasonic waves in welding is influenced by crystallographic orientation and size of grains. The number and the positions of the peaks of echodynamic curve are good indicators of beam deviation and the beam splitting. Their study, we informed on anisotropic and the heterogeneous of tow welds. Ultrasonic welding is widely used in various kinds of industries, for example welding for long pipes, our experimental
ECNDT 2006 - Poster 214
results have been showed possibility for detection of defects in welded zone, tow methods have been utilised, transmission and echographic.
References
[1] Bertrand CHASSIGNOLE, “ Influence de la structure métallurgique des soudures en acier inoxydable austénitique sur le contrôle non destructif par ultrason. ”, Thèse de Doctorat- INSA- Lyon, (2000). [2] A.Apfel, J.Moysan, G.Corneloup, B.Chassignole, “ Simulations of the influence of the grains orientations on ultrasounds ”. [3] Q.Liu, H.Wirdelius, “Model of ultrasonic ray paths in an anisotropic weld based on ray method”. [4] J.Moysan, G.Corneloup, “Ultrasounds back-scattering measurements for new anisotropy indicator construction”.