Embed Size (px)
Citation preview

DEERE & COMPANY 2017 ANNUAL REPORT
Deere & CompanyOne John Deere Place Moline, Illinois 61265 (309) 765-8000 www.JohnDeere.com
1918 – Waterloo Boy
DE
ER
E &
CO
MP
AN
Y 20
17 AN
NU
AL R
EP
OR
T
1960 – 4010, the next generation of power
1982 – 50-Series with mechanical front-wheel assist
2017AnnualReport_Cover_F.indd 1 12/22/17 10:09 AM

In observance of the 100th anniversary of
producing tractors, John Deere is connecting
the pride of the past with the promise of
the future.
The Waterloo Boy tractor (shown on the cover
AND�BELOW�WAS�+OHN�%EERElS��RST�TRACTOR�
and a key part of the company’s acquisition of
the Waterloo Gasoline Engine Company in 1918.
The tractor continued to be sold under
the Waterloo Boy name until the John Deere
Model D tractor was introduced in 1923.
The 100-year legacy of the John Deere
tractor is one of evolution and innovation.
Today, leading-edge products such as the
9620RX tractor (shown on the cover and below)
further advance that legacy. Our largest
row-crop tractors, the 9-Series boost farmers’
productivity by combining high horsepower
with advanced technology.
From the Waterloo Boy to the next generation
of tractors, John Deere has focused on
delivering products that connect directly with
our customers’ work and have a meaningful
role in their lives.
100 Years of John Deere Tractors
The new C850 air seeding cart is THE�LARGEST�IN�%EERElS�ΈEET�AND�CAN�ACCURATELY�COVER�����ACRES�PER��LL��Its large 850-bushel capacity meets the needs of grain farmers with lots of ground to cover.
2 67
DEERE & COMPANYSELECTED FINANCIAL DATA
(Dollars in millions except per share amounts)
2017 2016 2015 2014 2013 2012 2011 2010 2009 2008
Net sales and revenues................................. $29,738 $26,644 $28,863 $36,067 $37,795 $36,157 $32,013 $26,005 $23,112 $28,438
Net sales ................................................... 25,885 23,387 25,775 32,961 34,998 33,501 29,466 23,573 20,756 25,803
Finance and interest income .......................... 2,732 2,511 2,381 2,282 2,115 1,981 1,923 1,825 1,842 2,068
Research and development expenses ............... 1,368 1,389 1,425 1,452 1,477 1,434 1,226 1,052 977 943
Selling, administrative and general expenses ..... 3,067 2,764 2,873 3,284 3,606 3,417 3,169 2,969 2,781 2,960
Interest expense.......................................... 900 764 680 664 741 783 759 811 1,042 1,137
Net income* .............................................. 2,159 1,524 1,940 3,162 3,537 3,065 2,800 1,865 873 2,053
Return on net sales ..................................... 8.3% 6.5% 7.5% 9.6% 10.1% 9.1% 9.5% 7.9% 4.2% 8.0%
Return on beginning Deere & Companystockholders’ equity ................................. 33.1% 22.6% 21.4% 30.8% 51.7% 45.1% 44.5% 38.7% 13.4% 28.7%
Comprehensive income (loss)*........................ 3,221 627 994 2,072 5,416 2,171 2,502 2,079 (1,333) 1,303
Net income per share – basic* ....................... $ 6.76 $ 4.83 $ 5.81 $ 8.71 $ 9.18 $ 7.72 $ 6.71 $ 4.40 $ 2.07 $ 4.76
– diluted*..................... 6.68 4.81 5.77 8.63 9.09 7.63 6.63 4.35 2.06 4.70
Dividends declared per share ......................... 2.40 2.40 2.40 2.22 1.99 1.79 1.52 1.16 1.12 1.06
Dividends paid per share ............................... 2.40 2.40 2.40 2.13 1.94 1.74 1.41 1.14 1.12 1.03
Average number of commonshares outstanding (in millions) – basic......... 319.5 315.2 333.6 363.0 385.3 397.1 417.4 424.0 422.8 431.1
– diluted ...... 323.3 316.6 336.0 366.1 389.2 401.5 422.4 428.6 424.4 436.3
Total assets** ............................................ $65,786 $57,918 $57,883 $61,267 $59,454 $56,193 $48,146 $43,186 $41,023 $38,696
Trade accounts and notes receivable – net ....... 3,925 3,011 3,051 3,278 3,758 3,799 3,295 3,464 2,617 3,235
Financing receivables – net ........................... 25,104 23,702 24,809 27,422 25,633 22,159 19,924 17,682 15,255 16,017
Financing receivables securitized – net............. 4,159 5,127 4,835 4,602 4,153 3,618 2,905 2,238 3,108 1,645
Equipment on operating leases – net .............. 6,594 5,902 4,970 4,016 3,152 2,528 2,150 1,936 1,733 1,639
Inventories................................................. 3,904 3,341 3,817 4,210 4,935 5,170 4,371 3,063 2,397 3,042
Property and equipment – net ....................... 5,068 5,171 5,181 5,578 5,467 5,012 4,352 3,791 4,532 4,128
Short-term borrowings:**Equipment operations............................... 375 249 464 434 1,080 425 529 85 490 218Financial services ..................................... 9,660 6,662 7,961 7,584 7,707 5,966 6,307 5,239 3,535 6,619
Total.................................................. 10,035 6,911 8,425 8,018 8,787 6,391 6,836 5,324 4,025 6,837
Short-term securitization borrowings:**Financial services ..................................... 4,119 4,998 4,585 4,553 4,103 3,569 2,773 2,204 3,126 1,679
Long-term borrowings:**Equipment operations............................... 5,491 4,565 4,439 4,619 4,845 5,418 3,155 3,316 3,058 1,984Financial services ..................................... 20,400 19,138 19,336 19,699 16,673 16,970 13,764 13,424 14,232 11,880
Total.................................................. 25,891 23,703 23,775 24,318 21,518 22,388 16,919 16,740 17,290 13,864
Total Deere & Company stockholders’ equity ..... 9,557 6,520 6,743 9,063 10,266 6,842 6,800 6,290 4,819 6,533
Book value per share* .................................. $ 29.70 $ 20.71 $ 21.29 $ 26.23 $ 27.46 $ 17.64 $ 16.75 $ 14.90 $ 11.39 $ 15.47
Capital expenditures .................................... $ 586 $ 668 $ 655 $ 1,004 $ 1,132 $ 1,360 $ 1,050 $ 795 $ 767 $ 1,117
Number of employees (at year end) ................. 60,476 56,767 57,180 59,623 67,044 66,859 61,278 55,650 51,262 56,653
* Attributable to Deere & Company.** Restated balances for adoption of FASB ASU No. 2015-03, Simplifying the Presentation of Debt Issuance Costs. See Note 3.
67
2017AnnualReport_Cover_F.indd 2 12/22/17 8:35 AM

CHAIRMAN’S MESSAGE
John Deere had another year of solid performance in 2017 as
OUR��NANCIAL�RESULTS�STAGED�A�STRONG�IMPROVEMENT��"MONG�OUR�ACHIEVEMENTS �WE�LAUNCHED�ADVANCED�NEW�PRODUCTS �MAINTAINED�OUR�RECORD�OF�STRONG�EXECUTION �AND�MADE�PROGRESS�CARRYING�OUT�THE�AMBITIOUS�STRATEGIC�PLAN�THAT�WILL�GUIDE�OUR�EFFORTS�IN�COMING�YEARS��8E�ALSO�MADE�KEY�ACQUISITIONS�THAT�ARE�EXPECTED�TO�PLAY�AN�IMPORTANT�ROLE�IN�OUR�FUTURE��0N�THE��NANCIAL�FRONT �SALES�AND�NET�INCOME�WERE�THE��FTH�HIGHEST�IN�COMPANY�HISTORY��.EANWHILE �INVESTORS�CHEERED�OUR�SUCCESS�BY�SENDING�THE�PRICE�OF�%EERE�COMMON�STOCK�WELL�INTO�RECORD�TERRITORY��
0VER�THE�PAST�FEW�YEARS �%EERE�HAS�RESPONDED�TO�A�SEVERE�DOWNTURN�IN�THE�GLOBAL�AGRICULTURAL�ECONOMY�p�THE�WORST�IN�A�GENERATION�p�BY�KEEPING�A�TIGHT�REIN�ON�COSTS�AND�RUNNING�THE�COMPANY�WITH�A�LEAN�LINEUP�OF�PRODUCTIVE�ASSETS��"T�THE�SAME�TIME �WElVE�KEPT�OUR�EYES�ON�THE�HORIZON �MAKING�INVESTMENTS�THAT�COMPLEMENT�OUR�EXISTING�STRENGTHS�AND�WILL�DRIVE�GROWTH�IN�THE�FUTURE��
"S�OUR�RECENT�PERFORMANCE�SHOWS �+OHN�%EERE�HAS�BECOME�A�BROADER �MORE�BALANCED�COMPANY�THAT�CAN�STAY�PRO�TABLE�EVEN�IN�THE�FACE�OF�STEEP�DECLINES�IN�DEMAND��*N�ANY�NUMBER�OF�WAYS �OUR�PERFORMANCE�IN������VALIDATES�THE�WORK�WElVE�DONE�
YEAR’S RESULTS SHOW STRONG IMPROVEMENT DEVELOPING�A�WIDER�RANGE�OF�REVENUE�SOURCES�AND�A�MORE�DURABLE�BUSINESS�MODEL��
*N������NET�INCOME�JUMPED����PERCENT�TO�������BILLION�ON�NET�SALES�AND�REVENUES�OF��������BILLION �UP����PERCENT��5HIS�REΈECTED�IMPROVED�CONDITIONS�FOR�THE�AGRICULTURAL�AND�CONSTRUCTION�EQUIPMENT�MARKETS�AND�INCREASING�DEMAND�FOR�OUR�PRODUCTS��
8E�ALSO�GENERATED�������BILLION�IN�ECONOMIC�PRO�T �OR�4HAREHOLDER�7ALUE�"DDED�47"� �MEANING�PRO�TS�STAYED�WELL�ABOVE�THE�UNDERLYING�COST�OF�CAPITAL��47"�q�OPERATING�PRO�T�LESS�AN�IMPLIED�CAPITAL�CHARGE�q�IS�THE�PRIMARY�MEASURE�WE�USE�TO�MANAGE�THE�COMPANY�AND�MAKE�INVESTMENT�DECISIONS�
0UR�PERFORMANCE�ENABLED�US�TO�MAKE�CONTINUED�INVESTMENTS�IN�ADVANCED�PRODUCTS �TECHNOLOGIES �AND�GROWTH�ORIENTED�PROJECTS��'OR�THE�YEAR �%EERE�DEVOTED�ALMOST����BILLION�TO�RESEARCH�AND�DEVELOPMENT�AND�CAPITAL�EXPENDITURES��*N�ADDITION �WE�RETURNED������MILLION�TO�INVESTORS�IN�THE�FORM�OF�DIVIDENDS�
"T�THE�SAME�TIME �THE�COMPANY�MAINTAINED�ITS�STRONG��NANCIAL�CONDITION��%EERElS�EQUIPMENT�OPERATIONS�ENDED�THE�YEAR�WITH�A�HEALTHY�BALANCE�OF�CASH�AND�MARKETABLE�SECURITIES�AND�A�RELATIVELY�
3
�47" �REFERRED�TO�THROUGHOUT�THIS�REPORT �IS�A�NON�(""1��NANCIAL�MEASURE��4EE�PAGE����FOR�DETAILS�
2017AnnualReport_InsidePages_F_Revised.indd 3 12/22/17 8:01 AM

Worldwide net sales and revenues rise 12% in 2017 due mainly to improving market conditions and a favorable customer response to Deere products and services.
SVA surges for year as a result of higher OPERATING�PRO�T�AND�SOUND�ASSET�management. SVA represents operating PRO�T�LESS�AN�IMPLIED�CHARGE�FOR�CAPITAL�
Earnings improve 42% to $2.159 billion FOR����� �REPRESENTING�THE��FTH�HIGHEST�total in company history.
2017 IN REVIEW
New John Deere S700 combines
DELIVER�SIGNI�CANT�IMPROVEMENTS�
IN�mSMARTn�TECHNOLOGIES �OPERATOR�
COMFORT �AND�DATA�ACCURACY��
'EATURING�THE�LATEST�TECHNOLOGY �
THE�MACHINES�HELP�FARMERS�
GET�THE�MOST�EFFECTIVE�HARVESTING�
PERFORMANCE�
LOW�AMOUNT�OF�DEBT��0UR��NANCIAL�SERVICES�ORGANIZATION�REMAINED�CONSERVATIVELY�CAPITALIZED�AS�WELL��
%EERElS�RECENT�PERFORMANCE�HAS�WON�HIGH�MARKS�ON�8ALL�4TREET��4HAREHOLDERS�REALIZED�A�TOTAL�RETURN�OF�SOME����PERCENT�IN����� �MORE�THAN�TWICE�THE�AVERAGE�GAIN�OF�THE�BROAD�6�4��EQUITY�MARKET���
BROAD PRODUCT LINEUP MAKING IMPACT
5HANKS�TO�IMPROVING�MARKET�CONDITIONS �RESULTS�FOR�%EERElS�"GRICULTURE���5URF�"�5�DIVISION�MOVED�SOLIDLY�HIGHER��0PERATING�PRO�T�CLIMBED����PERCENT �TO�������BILLION �ON�A���PERCENT�INCREASE�IN�SALES��
%ESPITE�RELATIVELY�LOW�FARM�COMMODITY�PRICES �THE�DIVISION�SAW�IMPROVEMENT�IN�THE�SALE�OF�BOTH�LARGE�AND�SMALL�PRODUCTS�WITH�THE�BIGGEST�GAINS�COMING�FROM�4OUTH�"MERICA��'URTHER �%EERElS�LARGEST�DIVISION�BROADENED�ITS�GLOBAL�CUSTOMER�BASE�AND�BROUGHT�ADVANCED�NEW�PRODUCTS�TO�MARKET �SUCH�AS�THE�4����COMBINES��
1ERFORMANCE�OF�THE�$ONSTRUCTION���'ORESTRY�$�'�DIVISION�IMPROVED�DRAMATICALLY��0PERATING�PRO�T�ROSE����PERCENT�TO������MILLION�ON�A����PERCENT�INCREASE�IN�SALES��.ODERATE�GLOBAL�ECONOMIC�GROWTH�AND�HIGHER�DEMAND�FROM�THE�/ORTH�"MERICAN�OIL�AND�GAS�SECTOR�LIFTED�SALES��$USTOMERS�RESPONDED�WELL�TO�OUR�EXPANDED�LINE�OF�PRODUCTIVITY�BOOSTING�EQUIPMENT �SUCH�AS�THE�NEW����,�CRAWLER�DOZER�
*N�%ECEMBER����� �%EERE�COMPLETED�THE�LARGEST�ACQUISITION�IN�ITS�HISTORY�WITH�THE������BILLION�PURCHASE�OF�THE�8IRTGEN�(ROUP��"S�THE�WORLDlS�LEADING�MANUFACTURER�OF�ROAD�CONSTRUCTION�EQUIPMENT �8IRTGEN�WILL�ADD�SIZE�AND�SCALE�TO�OUR�$�'�BUSINESS�AND�STRONGLY�COMPLEMENT�%EERE�BRANDED�LINES�OF�EQUIPMENT��
%EERElS��NANCIAL�SERVICES�DIVISION�POSTED�SOLID�PRO�TS�AND�PROVIDED�COMPETITIVE��NANCING�TO�OUR�EQUIPMENT�CUSTOMERS��/ET�INCOME�ROSE�TO������MILLION�WHILE�THE�LOAN�AND�LEASE�PORTFOLIO�GREW�BY�ABOUT���PERCENT �EXCEEDING�����BILLION��'INANCIAL�4ERVICES�IS�A�PROVEN�SOURCE�OF�PRO�T�AND�A�DRIVER�OF�EQUIPMENT�SALES��*T�OPERATES�IN�MORE�THAN����COUNTRIES�AND��NANCES�ABOUT�HALF�OF�THE�NEW�EQUIPMENT�%EERE�SELLS�GLOBALLY�
POWERFUL TRENDS HOLDING GREAT PROMISE
0UR�RECENT�PERFORMANCE�AND�STRONG��NANCIAL�CONDITION�ARE�HELPING�US�CAPITALIZE�ON�POWERFUL�GLOBAL�TRENDS�THAT�WE�BELIEVE�HOLD�GREAT�PROMISE�FOR�OUR�CUSTOMERS�AND�INVESTORS�
%URING�THE��RST�HALF�OF�THIS�CENTURY �GLOBAL�DEMAND�FOR�FOOD�AND�OTHER�KINDS�OF�AGRICULTURAL�PRODUCTION�IS�EXPECTED�TO�NEARLY�DOUBLE �CONTINUING�A�PATTERN�OF�GROWTH�THAT�HAS�SHOWN�REMARKABLE�CONSISTENCY��4INCE�THE�MID�����S �DEMAND�HAS�
Net Sales and Revenues(MM)
2015 2016 2017
$28,863$26,644
$29,738
2015 2016 2017
$774
$339
$1,252
Shareholder Value Added (SVA) (MM)
Net Incomeattributable to Deere & Company
(MM)
2015 2016 2017
$1,940
$1,524
$2,159
4
Unless otherwise indicated, all capitalized names of products and services are trademarks or service marks of Deere & Company.
2017AnnualReport_InsidePages_F_Revised.indd 4 12/22/17 8:01 AM

5
2017AnnualReport_InsidePages_F_Revised.indd 5 12/22/17 8:01 AM

6
Strategic acquisitions in calendar year 2017 support Deere’s global growth strategy and are aimed at helping
the company gain new customers and compete more effectively on a global basis.
Companies acquired included the Wirtgen Group, the world’s leading manufacturer of road construction equipment
(completed December 1, 2017); Blue River Technology, a developer of integrated computer-vision and machine-
learning technology that helps growers reduce the use of herbicides; and Mazzotti, a specialty Italian sprayer
manufacturer noted for innovation as well as product knowledge, designs, and expertise.
With the Wirtgen acquisition, Deere gained six brands across the global road-construction sector, which spans
milling, processing, mixing, paving, compaction, and rehabilitation. Wirtgen’s product portfolio complements
Deere’s existing construction-equipment lineup.
These transactions put Deere in an even better position to capitalize on the world’s rising need for food
and infrastructure.
ACQUISITIONS SUPPORT PLANS FOR SALES AND MARKET SHARE GROWTH
2017AnnualReport_InsidePages_F_Revised.indd 6 12/28/17 4:02 PM

DECLINED�IN�ONLY�TWO�YEARS�AND�HAS�RISEN�ROUGHLY�THREEFOLD�OVER�THE�PERIOD��8HATlS�MORE �WITH�THE�WORLD�POPULATION�GROWING�BY�MORE�THAN���� ����PEOPLE�A�DAY �THIS�TREND�SHOWS�LITTLE�SIGN�OF�EASING��"T�THE�SAME�TIME �DEMAND�IS�CLIMBING�FOR�ROADS �BRIDGES �BUILDINGS �AND�ALL�FORMS�OF�INFRASTRUCTURE��5HESE�FACTORS�BOLSTER�OUR�CONVICTION�THAT�%EERE�WILL�BENE�T�FROM�AN�INCREASING�NEED�FOR�PRODUCTIVE�EQUIPMENT�WELL�INTO�THE�FUTURE��
FOCUSED STRATEGY MAKING PROGRESS
5HE�COMPANY�IS�PURSUING�A�FOCUSED�STRATEGY�TO�HELP�CUSTOMERS�AND�INVESTORS�BENE�T�FROM�THESE�FAVORABLE�TRENDS��0UR�GOALS�INCLUDE�ACHIEVING�GLOBAL�PREEMINENCE�IN�AGRICULTURAL�EQUIPMENT�AND�A�MORE�GLOBAL�PRESENCE�IN�CONSTRUCTION�EQUIPMENT��
%EERElS�OTHER�BUSINESSES �SUCH�AS��NANCIAL�SERVICES �FORESTRY �PARTS �POWER�SYSTEMS �AND�TURF �HAVE�AN�IMPORTANT�ROLE �TOO��5HEY�WORK�IN�SUPPORT�OF�OUR�EQUIPMENT�OPERATIONS�TO�DELIVER�THE�BEST�POSSIBLE�EXPERIENCE�FOR�OUR�CUSTOMERS�AND�HIGHEST�OVERALL�RETURNS�FOR�THE�ENTERPRISE��
$ENTRAL�TO�OUR�STRATEGY �%EERE�IS�INTENSIFYING�ITS�FOCUS�ON�INNOVATION�AND�QUALITY��#OTH�ARE�ESSENTIAL�TO�GAINING�MARKET�SHARE�AND�EXPANDING�OUR�GLOBAL�PRESENCE��%URING�THE�YEAR �%EERElS�INNOVATIVE�EQUIPMENT�CONTINUED�TO�WIN�HIGH�MARKS�FROM�OUR�CUSTOMERS �AND�WE�MADE�FURTHER�PROGRESS�TOWARD�ACHIEVING�TARGETED�LEVELS�OF�PRODUCT�QUALITY��
8E�ARE�STRENGTHENING�OUR�COMMITMENT�TO�TECHNOLOGY �ANALYTICS �AND�PRECISION�AGRICULTURE��"LL�ARE�AREAS�WHERE�WE�INTEND�TO�BE�THE�UNDISPUTED�LEADER��8E�BELIEVE�THE�INTEGRATION�OF�OUR�PRODUCTS�WITH�ADVANCED�TECHNOLOGY�p�LEADING�TO�SMARTER �MORE�PRODUCTIVE�EQUIPMENT�p�WILL�SHAPE�THE�FUTURE�OF�FARMING��
"DDITIONALLY �OUR�PLANS�STRESS�REINFORCING�OUR�STRONG�RELATIONSHIP�WITH�DEALERS��5HEIR�EXPERTISE�AND�CONNECTION�TO�CUSTOMERS�GIVE�%EERE�A�POWERFUL�COMPETITIVE�ADVANTAGE��0UR�DEALERS�ARE�CONTINUING�TO�MAKE�INVESTMENTS�AND�IMPROVE�THEIR�CAPABILITIES �PARTICULARLY�IN�AREAS�SUCH�AS�PRECISION�AGRICULTURE �IN�ORDER�TO�BETTER�SUPPORT�CUSTOMERS��
"S�WELL �THE�%EERE�STRATEGY�EMPHASIZES�SOLID��NANCIAL�PERFORMANCE�UNDER�ALL�TYPES�OF�MARKET�CONDITIONS��8ElRE�MAINTAINING�AGGRESSIVE�GOALS�FOR�PRO�TABILITY�AND�SUSTAINABLE�47"�GROWTH��
NEW PRODUCTS, ADVANCED TECHNOLOGIES
DELIVERING VALUE
*NNOVATIVE�NEW�PRODUCTS �BREAKTHROUGH�TECHNOLOGIES �AND�A�ROBUST�PRODUCT�PORTFOLIO�HELPED�DRIVE�OUR�RESULTS�IN�������5HE�COMPANY�INTRODUCED�DOZENS�OF�PRODUCTS�FEATURING�IMPROVEMENTS�IN�POWER �COMFORT �PRODUCTIVITY �AND�OVERALL�PERFORMANCE��
-ONG�A�%EERE�HALLMARK �PRODUCT�INNOVATION�EARNED�FURTHER�GLOBAL�RECOGNITION�LAST�YEAR �INCLUDING�A�GOLD�MEDAL�AND�TWO�SILVER�MEDALS�FROM�&UROPElS�LEADING�AGRICULTURAL�TRADE�FAIR��)ONORED�PRODUCTS�INCLUDED�INNOVATIVE�CORN�HEAD�TECHNOLOGY �BALLAST�WHEELS�FOR�TRACTORS �AND�AN�AUTOMATIC�GUIDANCE�SYSTEM��*N�ADDITION �A�LEADING�GROUP�OF�6�4��AGRICULTURAL�AND�BIOLOGICAL�ENGINEERS�RECOGNIZED�TEN�OF�OUR�NEW�PRODUCTS�FOR�INNOVATION�q�MORE�THAN�FOR�ANY�OTHER�COMPANY��
)IGHLIGHTING�OUR�NEW�AGRICULTURAL�EQUIPMENT�WERE�FOUR�4����COMBINE�MODELS �THE�MOST�ADVANCED�IN�THE�INDUSTRY��0THER�NEW�PRODUCTS�INCLUDED���4ERIES�UTILITY�TRACTORS �ROUND�BALERS �AN�����BUSHEL�AIR�SEEDING�CART �AND�A�PRECISION�SPRAYING�NOZZLE�CONTROL�SYSTEM��$�'�PRODUCT�HIGHLIGHTS�INCLUDED�AN�INNOVATIVE�PRODUCTION�CLASS�DOZER �AS�WELL�AS�A�LARGE�WHEEL�LOADER �ARTICULATED�DUMP�TRUCKS �AND�A�FORESTRY�FORWARDER���
*N�ADDITION ������WAS�AN�OUTSTANDING�YEAR�FOR�GLOBAL�SALES�OF�OUR�GUIDANCE�SYSTEMS��"UTO5RAC�PRECISION�GUIDANCE�SYSTEMS�ARE�NOW�AVAILABLE�IN����COUNTRIES �COVERING�THE�AREAS�WHERE�%EERE�DOES�THE�VAST�MAJORITY�OF�ITS�BUSINESS�
6SING�COMPUTER�VISION�AND�ARTI�CIAL�INTELLIGENCE �#LUE�3IVER5ECHNOLOGYlS�smart machines can detect, identify, and make management decisions ABOUT�INDIVIDUAL�PLANTS�IN�THE��ELD�
7
2017AnnualReport_InsidePages_F_Revised.indd 7 12/28/17 4:03 PM

5HE����,�CRAWLER�DOZER�IS�THE�INDUSTRYlS�
LARGEST�TO�BE�EQUIPPED�WITH�A�SIX�WAY�BLADE
ALLOWING�THE�MACHINE�TO�DO�THE�WORK�OF�
MULTIPLE�PIECES�OF�EQUIPMENT�
5HE�NEW�����(�FORWARDER�GIVES�
FORESTRY�CUSTOMERS�INCREASED�
POWER �TORQUE �AND�BOOM�CONTROL��
Known for its power and durability,
the 5310 utility tractor is a popular choice
among customers in India for both
agricultural and commercial applications.
8
22.3 in.
44.6 in.
25°
8°
2017AnnualReport_InsidePages_F_Revised.indd 8 12/22/17 8:01 AM

2017AnnualReport_InsidePages_F_Revised.indd 9 1/17/18 9:02 AM
9
On behalf of the John Deere team,
Samuel R. Allen
December 18, 2017
BEING A RESPONSIBLE CORPORATE CITIZENWherever we operate, Deere is committed to being a responsible corporate citizen that shares its success with others. In 2017, the company and its foundation made charitable contributions of approximately $33.4 million, helping improve lives throughout the world.
During the year, the Joint Initiative for Village Advancement (JIVA) was cited by the U.S. Chamber of Commerce Foundation as the best community-improvement program. Sponsored by the John Deere Foundation, JIVA bolsters agricultural productivity, infrastructure, and public education in 13 villages in India with the help of employee volunteers.
In logging a record 160,688 volunteer hours in 2017, Deere employees are off to a good start toward achieving the goal of one-million volunteer hours for the period 2017 through 2022. Last year’s volunteerism efforts ranged from helping U.S. hurricane victims to repairing a school in rural India.
FOCUSING ON SUSTAINABILITY During the year, the company made headway toward meeting its aggressive goals for limiting greenhouse gas emissions, reducing water use, and recycling waste. As an example, our parts distribution center in Milan, Illinois, replaced the polyethylene bubble wrap used to ship parts with recycled paper. This eliminated the need for 17,000 rolls of bubble wrap annually – enough to cover almost 150 football fields.
The John Deere 8400R row-crop tractor earned international recognition for its record-breaking performance in areas ranging from fluid economy to power. With improved engine efficiency, the 8400R produces lower carbon-dioxide emissions than other machines of comparable size.
Among other milestones for 2017, Deere was included in a prominent listing of the world’s most-ethical enterprises for the eleventh consecutive year, named by Fortune magazine as one of the 50 most-admired companies, and recognized for having one of the 100 most-valuable brands. In addition, the company received top-employer awards in a number of the countries where we operate.
ON TRACK FOR LONG-TERM SUCCESSAs the recent agricultural downturn unfolded, we committed ourselves to taking the necessary, sometimes difficult, steps to stay profitable and emerge in an even stronger condition. We responded by shedding costs and assets while making
disciplined investments for the future. Though our results declined from their highs reached earlier in the decade, each of the last three years ranked among the company’s ten best for sales and earnings.
Deere is well-positioned to capitalize on today’s improving market conditions and respond to the world’s increasing need for advanced machinery and services. What’s more, we’re committed to doing so in a manner that produces value for our customers and investors well into the future.
I’m proud to say there has never been a better time to be associated with John Deere. Our company has enjoyed great success for 180 years, yet I’m confident its best days are still ahead!
Updated large square balers deliver technology improvements, including an integrated moisture sensor, a bale weighing system, and the ability to clear the feed system from the tractor cab.

%EERElS�PERFORMANCE�IN������WAS�HELPED�BY�STRENGTHENING�FARM�AND�CONSTRUCTION�MARKETS�AND�THE�IMPACT�OF�ONGOING�ACTIONS�TO�MANAGE�COSTS�AND�DEVELOP�A�MORE�RESILIENT�BUSINESS�MODEL��
– /ET�SALES�AND�REVENUES�INCREASE�TO��������BILLION �UP������EARNINGS�ARE�������BILLION �BOTH�THE��FTH�HIGHEST�IN�COMPANY�HISTORY�
– *MPROVED��NANCIAL�RESULTS�AND�CONTINUED�ASSET�DISCIPLINE�PROPEL�47"�TO�������BILLION�
– $ASH�ΈOW�FROM�OPERATIONS�CONTINUES�TO�BE�STRONG �AT������BILLION�FOR�THE�ENTERPRISE��
– $APITAL�EXPENDITURES�ARE������MILLION �PLUS�ABOUT������MILLION�FOR�ACQUISITIONS��3�%�SPENDING�IS�������BILLION �REΈECTING�INVESTMENT�IN�ADVANCED�NEW�PRODUCTS�AND�TECHNOLOGIES�
– %IVIDENDS�PAID�TO�SHAREHOLDERS�TOTAL������MILLION �OR�������PER�SHARE��
– %EERE�NAMED�TO�LISTINGS�OF�TOP�EMPLOYERS�IN�#RAZIL �$ANADA �(ERMANY �4PAIN �AND�THE�6�4���ALSO�RECOGNIZED�AS�ONE�OF�WORLDlS�MOST�ETHICAL�AND�ADMIRED�COMPANIES�
$774 MM
SVA*
$2,589
2015 2016
Deere & Company Enterprise
$3,543
2017
$3,140 MM
OPERATING
PROFIT
$1,252
$339$516 MM
SVA*
$1,880
2015 2016
$2,821
2017
$2,177 MM
OPERATINGPROFIT
$310
$1,210
Equipment Operations
STRONGER, MORE DYNAMIC BUSINESS MODEL MAKES IMPACT
DEERE & COMPANY ENTERPRISE & EQUIPMENT OPERATIONS
2017 HIGHLIGHTS
EQUIPMENT OPERATIONS
– 0PERATING�PRO�T�FOR�EQUIPMENT�OPERATIONS�SURGES���� �TO�������BILLION �HELPED�BY�IMPROVING�MARKETS�FOR�"�5�AND�$�'��RESULTS�DRIVE�IMPROVEMENT�IN�47"���
– %EERE�ACQUIRES�#LUE�3IVER�5ECHNOLOGY �EXPANDING�ITS�PORTFOLIO�OF�PRECISION�AG�SOLUTIONS��#LUE�3IVER�SPECIALIZES�IN�TECHNOLOGIES�THAT�HELP�GROWERS�MAKE�MANAGEMENT�DECISIONS�ABOUT�INDIVIDUAL�PLANTS�IN�THE��ELD��5HESE�TECHNOLOGIES�HOLD�GREAT�POTENTIAL�FOR�USE�IN�A�RANGE�OF�CROPS�
– &NGINE�BUSINESS�CONTINUES�INVESTING�IN�ADVANCED�POWERTRAIN�SOLUTIONS �INCLUDING�NEW������LITER�DIESEL�ENGINE�AND�INLINE�AFTER�TREATMENT�EMISSIONS�TECHNOLOGY��3ATED�AT�OVER�����HORSEPOWER �THE������LITER�ENGINE�WILL�BE�THE�MOST�POWERFUL�MODEL�IN�THE�%EERE�LINEUP��
– %IVISIONS�MAKE�PROGRESS�IN�ACHIEVING�DISTINCTIVE�PRODUCT�QUALITY �A�HALLMARK�OF�OUR�BRAND��
10
Worldwide Parts Services opened a new Regional Distribution Center (RDC) in Miami, Florida. Miami RDC serves the growing Latin American parts market, strengthening our global parts distribution system.
2017AnnualReport_InsidePages_F_Revised.indd 10 12/22/17 8:01 AM
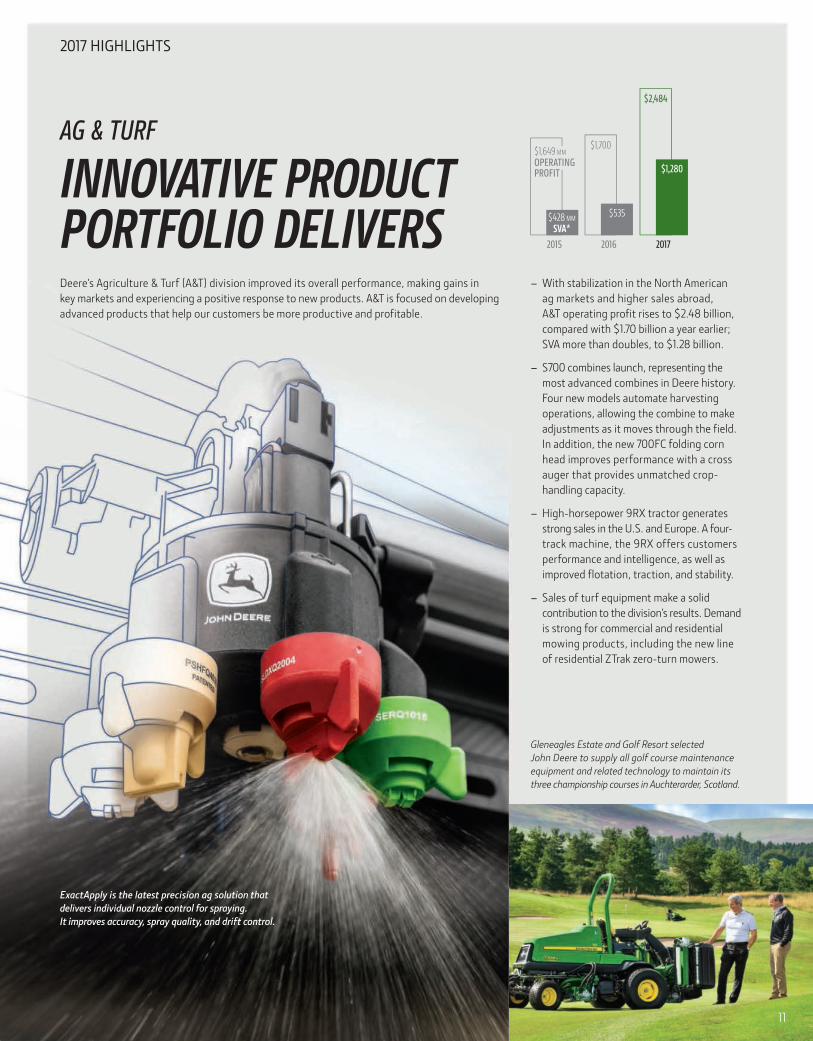
$1,700
2015 2016 2017
$535
$2,484
$1,280
$428 MM
SVA*
$1,649 MM
OPERATING
PROFIT
%EERElS�"GRICULTURE���5URF�"�5�DIVISION�IMPROVED�ITS�OVERALL�PERFORMANCE �MAKING�GAINS�IN�KEY�MARKETS�AND�EXPERIENCING�A�POSITIVE�RESPONSE�TO�NEW�PRODUCTS��"�5�IS�FOCUSED�ON�DEVELOPING�ADVANCED�PRODUCTS�THAT�HELP�OUR�CUSTOMERS�BE�MORE�PRODUCTIVE�AND�PRO�TABLE�
– 8ITH�STABILIZATION�IN�THE�/ORTH�"MERICAN�AG�MARKETS�AND�HIGHER�SALES�ABROAD �"�5�OPERATING�PRO�T�RISES�TO�������BILLION �COMPARED�WITH�������BILLION�A�YEAR�EARLIER��47"�MORE�THAN�DOUBLES �TO�������BILLION�
– 4����COMBINES�LAUNCH �REPRESENTING�THE�MOST�ADVANCED�COMBINES�IN�%EERE�HISTORY��'OUR�NEW�MODELS�AUTOMATE�HARVESTING�OPERATIONS �ALLOWING�THE�COMBINE�TO�MAKE�ADJUSTMENTS�AS�IT�MOVES�THROUGH�THE��ELD��*N�ADDITION �THE�NEW����'$�FOLDING�CORN�HEAD�IMPROVES�PERFORMANCE�WITH�A�CROSS�AUGER�THAT�PROVIDES�UNMATCHED�CROP�HANDLING�CAPACITY��
– )IGH�HORSEPOWER��39�TRACTOR�GENERATES�STRONG�SALES�IN�THE�6�4��AND�&UROPE��"�FOUR��TRACK�MACHINE �THE��39�OFFERS�CUSTOMERS�PERFORMANCE�AND�INTELLIGENCE �AS�WELL�AS�IMPROVED�ΈOTATION �TRACTION �AND�STABILITY��
– 4ALES�OF�TURF�EQUIPMENT�MAKE�A�SOLID�CONTRIBUTION�TO�THE�DIVISIONlS�RESULTS��%EMAND�IS�STRONG�FOR�COMMERCIAL�AND�RESIDENTIAL�MOWING�PRODUCTS �INCLUDING�THE�NEW�LINE�OF�RESIDENTIAL�;5RAK�ZERO�TURN�MOWERS��
INNOVATIVE PRODUCT PORTFOLIO DELIVERS
AG & TURF
2017 HIGHLIGHTS
11
&XACT"PPLY�IS�THE�LATEST�PRECISION�AG�SOLUTION�THAT�
DELIVERS�INDIVIDUAL�NOZZLE�CONTROL�FOR�SPRAYING� *T�IMPROVES�ACCURACY �SPRAY�QUALITY �AND�DRIFT�CONTROL�
Gleneagles Estate and Golf Resort selected John Deere to supply all golf course maintenance equipment and related technology to maintain its three championship courses in Auchterarder, Scotland.
2017AnnualReport_InsidePages_F_Revised.indd 11 12/28/17 4:03 PM

2017 HIGHLIGHTS
– #OLSTERED�BY�IMPROVEMENTS�IN�CONSTRUCTION�MARKETS �$�'�OPERATING�PRO�T�JUMPS�����TO������MILLION�AND�SALES�INCREASE������
– 5HOUGH�MUCH�IMPROVED �47"�REMAINS�IN�NEGATIVE�TERRITORY��
– *N�COMPANYlS�LARGEST�EVER�ACQUISITION �%EERE�ANNOUNCES�PLANS�TO�BUY�8IRTGEN�(ROUP �THE�WORLDlS�LEADING�PRODUCER�OF�ROAD�CONSTRUCTION�EQUIPMENT��.OVE�GIVES�$�'�ACCESS�TO�NEW�CUSTOMERS �MARKETS �AND�GEOGRAPHIES��#ASED�IN�(ERMANY �8IRTGEN�sells products in more than 100 countries
AND�IS�FORECAST�TO�ADD�MORE�THAN����BILLION�TO�DIVISION�SALES�IN�������
– $ONTINUING�TO�DEVELOP�CUSTOMER�FOCUSED�MACHINES�AND�SERVICES �$�'�LAUNCHES�SIGNI�CANT�NEW�PRODUCTS��*NCLUDED�ARE�INDUSTRYlS�LARGEST�CRAWLER�DOZER�EQUIPPED�WITH�A�SIX�WAY�POWER�ANGLE�TILT�1"5�BLADE �A�PIPELAYER�READY�CRAWLER �ARTICULATED�DUMP�TRUCKS �AND�MOTOR�GRADERS��
GROWTH, ADVANCED PRODUCTS LEAD TO IMPROVED RESULTS
CONSTRUCTION & FORESTRY
8ITH�RECOVERING�DEMAND�IN�CONSTRUCTION�MARKETS �THE�$ONSTRUCTION���'ORESTRY�$�'�DIVISION�SAW�INCREASED�SALES�AND�PRO�TS�FOR��������.ODERATE�ECONOMIC�GROWTH�AND�HIGHER�DEMAND�FROM�THE�/ORTH�"MERICAN�OIL�PATCH�CONTRIBUTED�TO�THE�IMPROVEMENT��
2015
$180
$225
2016
$337
$70
2017
$528 MM
OPERATING
PROFIT
$88 MM
SVA*
12
The highly anticipated 345G reduced-tail-swing excavator attracted considerable attention within the industry and will debut in 2018. The 345G offers increased lifting and digging capacity in a compact footprint.
The 30G mini excavator and 332G skid steer are part of C&F’s full suite of compact equipment for the commercial worksite.
2017AnnualReport_InsidePages_F_Revised.indd 12 12/22/17 8:02 AM

– /ET�INCOME�RISES�TO������MILLION�OPERATING�PRO�T������MILLION�AS�A�RESULT�OF�IMPROVED�LEASE�PORTFOLIO�PERFORMANCE �AMONG�OTHER�FACTORS��
– 47"�REACHES�����MILLION �MAINLY�DUE�TO�INCREASED�PRO�T�
– (LOBAL�PORTFOLIO�OF��NANCED�RECEIVABLES�AND�LEASES�INCREASES����p�OR�ABOUT����BILLION�p�TO�OVER�����BILLION�
– 1ORTFOLIO�OUTSIDE�/ORTH�"MERICA�GROWS�NEARLY���� �CONTINUING�SUPPORT�OF�%EERE�CUSTOMERS�WORLDWIDE�
– 3EVOLVING�CHARGE�VOLUMES�RISE����WITH�PORTFOLIO�UP�����OVER�������5HESE�PRODUCTS�HELP�CUSTOMERS�PURCHASE�TURF�EQUIPMENT �PARTS �SERVICE �SEED �AND�OTHER�INPUTS��
– (LOBAL�CAPABILITIES�ADDED �INCLUDING�AUTOMATIC�APPROVALS�FOR�CREDIT�REQUESTS�IN�(ERMANY �#RAZIL �4PAIN �AND�6�,� �INCREASING�ACCURACY�AND�SPEEDING�PROCESS�TIMES�FOR�APPLICATIONS�
+OHN�%EERE�'INANCIAL�4ERVICES�+%'�EXPERIENCED�ANOTHER�SOLIDLY�PRO�TABLE�YEAR �WITH�IMPROVED��NANCIAL�PERFORMANCE�OVER�������5ODAY �+OHN�%EERE�'INANCIAL�FACILITATES�EQUIPMENT�SALES�IN����NATIONS�
DIVISION DELIVERS PROFITS, DRIVES SALES
FINANCIAL SERVICES
2017 HIGHLIGHTS
$29
$709
2015 2016
$42
$722
2017
$ $963 MM
OPERATING
PROFIT
$258 MM
SVA*
13
John Deere Financial’s global team is committed to MAKING�SURE�OUR�CUSTOMERSl��NANCING�WORKS�AS�HARD�and reliably as their equipment. Customers in India, as shown, are taking advantage of competitive �NANCING�OPTIONS��+%'�EXPANDED�ITS�FOOTPRINT�IN�*NDIA�in 2017, adding locations in three states.
2017AnnualReport_InsidePages_F_Revised.indd 13 12/28/17 4:03 PM
14
2017AnnualReport_InsidePages_F_Revised.indd 14 12/22/17 8:02 AM

Figures in parentheses represent complete years of board service through December 31, 2017.
*Elected to the board effective January 1, 2018. Previously served 2007 to 2016.
Figures in parentheses represent complete years of company service through December 31, 2017.
Samuel R. Allen (8)
&JCKTOCP�CPF�&JKGH�(ZGEWVKXG�2H΄EGT��Deere & Company
Vance D. Coffman (13)
5GVKTGF�&JCKTOCP��Lockheed Martin Corporation
Aerospace, defense, and information
technology
Alan C. Heuberger (1)
6GPKQT�0CPCIGT�BMGI
Private investment management
Charles O. Holliday, Jr.*(8)
&JCKTOCP��5Q[CN�'WVEJ�6JGNN�RNE�2KN�CPF�PCVWTCN�ICU�GZRNQTCVKQP��TG΄PKPI�and product sales
Dipak C. Jain (15)
&Q�3TGUKFGPV�CPF�*NQDCN�$FXKUQT��&JKPC�(WTQRG�,PVGTPCVKQPCN�%WUKPGUU�6EJQQNInternational graduate business school
Michael O. Johanns (2)
Former U.S. Senator and
8�6��6GETGVCT[�QH�$ITKEWNVWTG
Clayton M. Jones (10)
5GVKTGF�&JCKTOCP�5QEMYGNN�&QNNKPU��,PE�Aviation electronics and communications
Brian M. Krzanich (1)
&JKGH�(ZGEWVKXG�2H΄EGT��,PVGN�&QTRQTCVKQP�Advanced integrated digital
technology platforms
Gregory R. Page (4)
5GVKTGF�(ZGEWVKXG�'KTGEVQT��&CTIKNN��,PE�Agricultural, food, financial,
and industrial products and services
Sherry M. Smith (6)
Former Executive Vice President and
&JKGH�)KPCPEKCN�2H΄EGT��6WRGTXCNW�,PE��Retail and wholesale grocery and
retail general merchandise products
Samuel R. Allen (42)
&JCKTOCP�CPF�&JKGH�(ZGEWVKXG�2H΄EGT
Jean H. Gilles (37)
6GPKQT�9KEG�3TGUKFGPV��3QYGT�6[UVGOU��:QTNFYKFG�3CTVU�6GTXKEGU��$FXCPEGF�7GEJPQNQI[��(PIKPGGTKPI��CPF�*NQDCN�6WRRN[�0CPCIGOGPV��/QIKUVKEU
Marc A. Howze (16)
Senior Vice President and
&JKGH�$FOKPKUVTCVKXG�2H΄EGr
Mary K.W. Jones (20)
Senior Vice President and
*GPGTCN�&QWPUGN
Rajesh Kalathur (21)
Senior Vice President and
&JKGH�)KPCPEKCN�2H΄EGT
Kimberly K. Beardsley (27)
9KEG�3TGUKFGPV��:QTNFYKFG�Parts Services
Ryan D. Campbell (10)
9KEG�3TGUKFGPV�CPF�&QORVTQNNGT
Pierre J. Guyot (19)
9KEG�3TGUKFGPV��*NQDCN�6WRRN[�Management & Logistics
Matthew G. Haney (4)
Vice President and Deputy
*GPGTCN�&QWPUGN��CPF�&JKGH�&QWPUGN��)KPCPEKCN�6GTXKEGU�'KXKUKQP
Klaus G. Hoehn (25)
9KEG�3TGUKFGPV��$FXCPEGF�7GEJPQNQI[�& Engineering
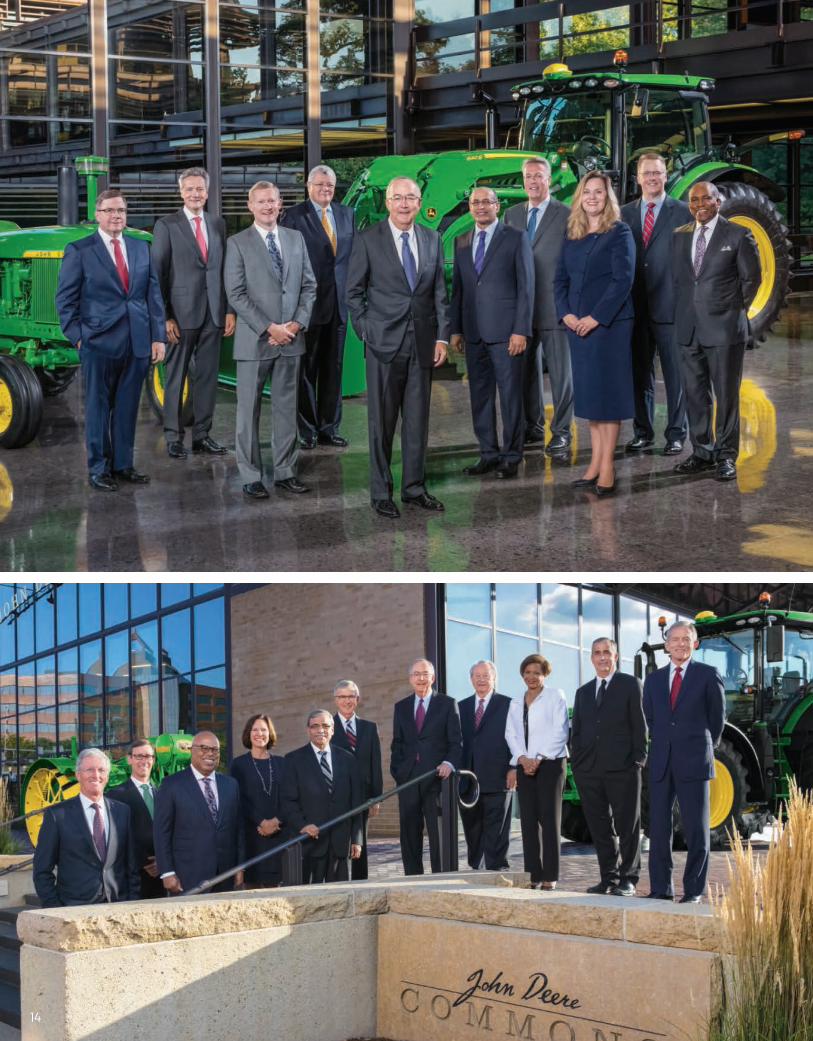
Deere leadership team shown with a 2017 6155R tractor and a 1960 4010 tractor at company headquarters in Moline, Illinois
From left: James M. Field, Markwart von Pentz, John C. May, Jean H. Gilles, Samuel R. Allen, Rajesh Kalathur, Max A. Guinn, Mary K.W. Jones, Cory J. Reed, and Marc A. Howze.
Deere’s Board of Directors is shown with a Waterloo Boy “N” tractor and a John Deere 8400R tractor at the John Deere Pavilion in Moline, Illinois.
From left: Gregory R. Page, Alan C. Heuberger, Dmitri L. Stockton, Sherry M. Smith, Dipak C. Jain, Michael O. Johanns, Samuel R. Allen, Vance D. Coffman, Sheila G. Talton, Brian M. Krzanich, and Clayton M. Jones. (Charles O. Holliday is not pictured.)
Ganesh Jayaram (11)
9KEG�3TGUKFGPV��,PHQTOCVKQP�7GEJPQNQI[
Renee A. Mailhot (26)
Vice President and
&JKGH�&QORNKCPEG�2H΄EGT
James M. McCabe (22)
9KEG�3TGUKFGPV��7CZGU
Bradley D. Morris (40)
9KEG�3TGUKFGPV��/CDQT�5GNCVKQPU
Gregory R. Noe (24)
9KEG�3TGUKFGPV�CPF�'GRWV[�*GPGTCN�&QWPUGN��,PVGTPCVKQPCN
Luann K. Rickert (38)
9KEG�3TGUKFGPV��,PVGTPCN�$WFKV
Thomas C. Spitzfaden (38)
Vice President and Treasurer
Charles R. Stamp, Jr. (18)
9KEG�3TGUKFGPV��&QTRQTCVG�6VTCVGI[��%WUKPGUU�'GXGNQROGPV
Jeffrey A. Trahan (25)
9KEG�3TGUKFGPV��3GPUKQP�)WPF�& Investments
Michael S. Weinert (39)
9KEG�3TGUKFGPV��(PIKPGGTKPI�CPF�0CPWHCEVWTKPI��John Deere Power Systems
Todd E. Davies (27)
Corporate Secretary and
$UUQEKCVG�*GPGTCN�&QWPUGN
Worldwide Agriculture
& Turf Division
James M. Field (23)
3TGUKFGPV��$OGTKECU��$WUVTCNKC��CPF�*NQDCN�+CTXGUVKPI�CPF�7WTH�3NCVHQTOU
John C. May (20)
3TGUKFGPV��$ITKEWNVWTCN�6QNWVKQPU��CPF�&JKGH�,PHQTOCVKQP�2H΄EGT
Markwart von Pentz (27)
3TGUKFGPV��(WTQRG��$UKC��$HTKEC��CPF�*NQDCN�7TCEVQT�3NCVHQTO
Bernhard E. Haas (31)
6GPKQT�9KEG�3TGUKFGPV��*NQDCN�7TCEVQT�3NCVHQTO
John D. Lagemann (35)
6GPKQT�9KEG�3TGUKFGPV��6CNGU��0CTMGVKPI��$OGTKECU�CPF�$WUVTCNKC
Randal A. Sergesketter (37)
6GPKQT�9KEG�3TGUKFGPV��*NQDCN�&TQR�+CTXGUVKPI�3NCVHQTO
John H. Stone (15)
6GPKQT�9KEG�3TGUKFGPV��,PVGNNKIGPV�6QNWVKQPU�*TQWR
Worldwide Construction
& Forestry Division
Max A. Guinn (37)
President
Brian J. Rauch (23)
6GPKQT�9KEG�3TGUKFGPV��(PIKPGGTKPI��0CPWHCEVWTKPI��CPF�6WRRN[�0CPCIGOGPV
Domenic G. Ruccolo (27)
6GPKQT�9KEG�3TGUKFGPV��&)�'KXKUKQP��CPF�&JKGH�(ZGEWVKXG�2H΄EGT��:KTVIGP�*TQWR
David F. Thorne (20)
6GPKQT�9KEG�3TGUKFGPV��6CNGU��0CTMGVKPI
Martin L. Wilkinson (40)
6GPKQT�9KEG�3TGUKFGPV��)QTGUVT[�CPF�6VTCVGI[��%WUKPGUU�'GXGNQROGPV
Worldwide Financial
Services Division
Cory J. Reed (19)
President
David C. Gilmore (27)
6GPKQT�9KEG�3TGUKFGPV��*NQDCN�6CNGU�0CTMGVKPI��CPF�6QWVJ�$OGTKEC
Michael J. Matera (9)
6GPKQT�9KEG�3TGUKFGPV��*NQDCN�&TGFKV��7TCFG�)KPCPEG��CPF�$UKC
Steven N. Owenson (18)
Senior Vice President and Finance Director
Andrew C. Traeger (19)
6GPKQT�9KEG�3TGUKFGPV��*NQDCN�5KUM�CPF�(WTQRG�CPF�$HTKEC
/($'(56+,3�7($0
%2$5'�2)�',5(&7256Dmitri L. Stockton (2)
5GVKTGF�6RGEKCN�$FXKUQT�VQ�&JCKTOCP�CPF�5GVKTGF�6GPKQT�9KEG�3TGUKFGPV��*GPGTCN�(NGEVTKE�&QORCP[�Power and water, aviation, oil and gas,
healthcare, appliances and lighting,
energy management, transportation,
CPF�΄PCPEKCN�UGTXKEGU
5GVKTGF�&JCKTOCP��3TGUKFGPV��CPF�&JKGH�(ZGEWVKXG�2H΄EGT��*(�$UUGV�0CPCIGOGPV�,PE��Global investments
Sheila G. Talton (2)
3TGUKFGPV�CPF�&JKGH�(ZGEWVKXG�2H΄EGT��*TC[�0CVVGT�$PCN[VKEU�Data analytics consulting services for
΄PCPEKCN�UGTXKEGU�CPF�JGCNVJECTG�KPFWUVTKGU
15
2017AnnualReport_InsidePages_F_Revised.indd 15 12/22/17 8:02 AM

$250
$200
$150
$100
$50
$02010 2011 2012 2013 2014 2015 2016 2017
Deere & Company S&P Construction & Farm Machinery & Heavy Trucks S&P 500
2010 2011 2012 2013 2014 2015 2016 2017
Deere & Company $100.00 $104.40 $116.00 $116.09 $121.89 $114.28 $131.55 $205.36
S&P Con & Farm Mach & Hvy Trks $100.00 $109.71 $106.96 $115.87 $136.72 $101.06 $120.07 $185.51
S&P 500 $100.00 $108.09 $124.52 $158.36 $185.71 $195.37 $204.18 $252.43
The graph compares the cumulative total returns of Deere & Company, the S&P 500 Stock Index, and the S&P Construction & Farm Machinery & Heavy Trucks Index over a seven-year period. It assumes $100 was invested on November 1, 2009, and that dividends were reinvested. Deere & Company stock price at October 27, 2017, was $133.25. The Standard & Poor’s 500 Construction & Farm Machinery & Heavy Trucks Index comprises Deere (DE), Caterpillar (CAT), Cummins (CMI), and Paccar (PCAR). The stock performance shown in the graph is not intended to forecast and does not necessarily indicate future price performance
ANNUAL MEETING
5HE�ANNUAL�MEETING�OF�COMPANY�STOCKHOLDERS�WILL�BE�HELD�AT����A�M��$5�ON�'EBRUARY��� ����� �AT�%EERE���$OMPANY�8ORLD�)EADQUARTERS �0NE�+OHN�%EERE�1LACE �.OLINE �*LLINOIS�
TRANSFER AGENT & REGISTRAR
4END�ALL�CORRESPONDENCE �INCLUDING�ADDRESS�CHANGES�AND�CERTI�CATES�FOR�TRANSFER �AS�WELL�AS�INQUIRIES�CONCERNING�LOST �STOLEN �OR�DESTROYEDSTOCK�CERTI�CATES�OR�DIVIDEND�CHECKS �TO��
%EERE���$OMPANYC�O�$OMPUTERSHARE1�0��#OX�������-OUISVILLE �,:�������
1HONE�TOLL�FREE��������������'ROM�OUTSIDE�THE�6�4� �CALL��������������5%%��������������
&MAIL��WEBQUERIES!COMPUTERSHARE�COM
WWW�COMPUTERSHARE�COM�INVESTOR
STOCKHOLDER INFORMATION
7-<($5�&808/$7,9(�727$/�5(7851%EERE�COMPARED�TO�4�1�����*NDEX�AND�4�1�$ONSTRUCTION���'ARM�.ACHINERY���)EAVY�5RUCKS�*NDEX
DIVIDEND REINVESTMENT
& DIRECT PURCHASE PLAN
*NVESTORS�MAY�PURCHASE�INITIAL�%EERE���$OMPANY�SHARES�AND�AUTOMATICALLY�REINVEST�DIVIDENDS�THROUGH�THE�$OMPUTERSHARE�#UY%*3&$5�1LAN��0PTIONAL�MONTHLY�CASH�INVESTMENTS�MAY�BE�MADE�AUTOMATICALLY�THROUGH�ELECTRONIC�DEBITS��
'OR�INQUIRIES�ABOUT�EXISTING�REINVESTMENT�ACCOUNTS �CALL��������������OR�WRITE�TO�
%EERE���$OMPANYC�O�$OMPUTERSHARE1�0��#OX�������-OUISVILLE �,:�������
STOCKHOLDER RELATIONS
%EERE���$OMPANY�WELCOMES�YOUR�COMMENTS�
%EERE���$OMPANY4TOCKHOLDER�3ELATIONS�%EPARTMENT0NE�+OHN�%EERE�1LACE �.OLINE �*-������������1HONE���������������'AX��������������WWW�+OHN%EERE�COM�*NVESTORS
INVESTOR RELATIONS
4ECURITIES�ANALYSTS �PORTFOLIO�MANAGERS �AND�REPRESENTATIVES�OF��NANCIAL�INSTITUTIONS�MAY�CONTACT�
%EERE�*NVESTOR�3ELATIONS%EERE���$OMPANY0NE�+OHN�%EERE�1LACE �.OLINE �*-�����������1HONE��������������&MAIL���%EERE*3!+OHN%EERE�COMWWW�+OHN%EERE�COM�*NVESTORS
STOCK EXCHANGES
%EERE���$OMPANY�COMMON�STOCK�IS�LISTED�ON�THE�/EW�:ORK�4TOCK�&XCHANGE�UNDER�THE�TICKER�SYMBOL�%&�
FORM 10-K
5HE�ANNUAL�REPORT�ON�'ORM����,��LED�WITH�THE�4ECURITIES�AND�&XCHANGE�$OMMISSION�IS�AVAILABLE�ONLINE�OR�UPON�WRITTEN�REQUEST�TO�%EERE���$OMPANY�4TOCKHOLDER�3ELATIONS�
AUDITORS
%ELOITTE���5OUCHE�--1�$HICAGO �*LLINOIS
Copyright © 2017 Standard & Poor’s, a division of S&P Global. All rights reserved (www.researchdatagroup.com/S&P.htm).
16
2017AnnualReport_InsidePages_F_Revised.indd 16 12/26/17 11:25 AM

CONSTRUCTION & FORESTRY
�����..�UNLESS�INDICATED�OTHERWISE 2015 2016 2017
/ET�SALES� � ������������ ����� � ����
0PERATING�PRO�T� �������������������� ���
"VERAGE�ASSETS
����8ITH�INVENTORIES�!�STD�COST� � ��������������� ���� � ���
����8ITH�INVENTORIES�!�-*'0� � ��������������� ������������� ���
030"���!�-*'0� ����������������������� �����
"SSET�TURNS�STD�COST� ���������������������� ����
0PERATING�MARGIN�������������� X������ X����� X�����
030"���!�STANDARD�COST� �������������������������������������
�..� 2015 2016 2017
"VERAGE�ASSETS�!�STD�COST� � �������������� ���� �����
0PERATING�PRO�T� �������������������� ���
Cost of assets ���� ���� ����
47"� ��� ���������� ���
DEERE EQUIPMENT OPERATIONS
�����..�UNLESS�INDICATED�OTHERWISE 2015 2016 2017
/ET�4ALES� �� ���� �� ���� �� ���
0PERATING�PRO�T� � ���� � ���� � ���
"VERAGE�ASSETS
����8ITH�INVENTORIES�!�STD�COST� �� ���� �� ���� �� ���
����8ITH�INVENTORIES�!�-*'0� �� ���� �� ���� �� ���
030"���!�-*'0� ����� ����� ����
"SSET�TURNS�STD�COST� ����� ����� ����
0PERATING�MARGIN��� X����� X����� X������
030"���!�STANDARD�COST� ����� ����� ����
�..� 2015 2016 2017
"VERAGE�ASSETS�!�STD�COST� �� ���� �� ���� �� ���
0PERATING�PRO�T� � ���� � ���� � ���
Cost of assets �� ��� �� ��� ��� ���
47"� ������������������������������� ���
4HAREHOLDER�7ALUE�"DDED�47"�q�ESSENTIALLY �THE�DIFFERENCE�BETWEEN�OPERATING�PRO�T�AND�THE�PRETAX�COST�OF�CAPITAL�q�IS�A�METRIC�USED�BY�+OHN�%EERE�TO�EVALUATE�BUSINESS�RESULTS�AND�MEASURE�SUSTAINABLE�PERFORMANCE�
5O�ARRIVE�AT�47" �EACH�EQUIPMENT�SEGMENT�IS�ASSESSED�A�PRETAX�COST�OF�ASSETS�q�GENERALLY�����OF�AVERAGE�IDENTI�ABLE�OPERATING�ASSETS�WITH�INVENTORY�AT�STANDARD�COST�BELIEVED�TO�MORE�CLOSELY�APPROXIMATE�THE�CURRENT�COST�OF�INVENTORY�AND�THE�COMPANYlS�RELATED�INVESTMENT��5HE��NANCIAL�SERVICES�SEGMENT�IS�ASSESSED�A�COST�OF�AVERAGE�EQUITY�qAPPROXIMATELY�����PRETAX�
5HE�AMOUNT�OF�47"�IS�DETERMINED�BY�DEDUCTING�THE�ASSET�OR�EQUITY�CHARGE�FROM�OPERATING�PRO�T�
Additional information on these metrics and their relationship to amounts presented in accordance with U.S. GAAP can be found at our website, www.JohnDeere.com/Investors. /OTE��Some totals may vary due to rounding.
To create and grow SVA, Deere equipment operations are targeting an operating return on average operating assets (OROA) of 20% at mid-cycle sales volumes and equally ambitious returns at other points in the cycle. (For purposes of this calculation, operating assets ARE�AVERAGE�IDENTI�ABLE�assets during the year with inventories valued at standard cost.)
'INANCIAL�4ERVICES�47"�IS�CALCULATED�ON�A�PRETAX�BASIS�
SVA: FOCUSING ON GROWTH
AND SUSTAINABLE PERFORMANCE
AGRICULTURE & TURF
�����..�UNLESS�INDICATED�OTHERWISE 2015 2016 2017
/ET�SALES� �� ���� �� ���� �� �����
0PERATING�PRO�T� � ���� � ���� � ���
"VERAGE�ASSETS
����8ITH�INVENTORIES�!�STD�COST� ����� ���� � ���� �� ���
����8ITH�INVENTORIES�!�-*'0� � ���� � ���� � ���
030"���!�-*'0� ����� ����� ����
"SSET�TURNS�STD�COST� ����� ����� ����
0PERATING�MARGIN��� X����� X����� X������
030"���!�STANDARD�COST� ����� ����� ����
�..� 2015 2016 2017
"VERAGE�ASSETS�!�STD�COST� �� ���� � ���� �� ���
0PERATING�PRO�T� � ���� � ���� � ���
Cost of assets �� ��� �� ��� �� ���
47"� ���� ���� � ���
FINANCIAL SERVICES
�����..�UNLESS�INDICATED�OTHERWISE 2015 2016 2017
/ET�INCOME�ATTRIBUTABLE�TO�%EERE���$OMPANY� ���� ���� ���
"VERAGE�EQUITY� � ���� � ���� � ���
3ETURN�ON�EQUITY��� ����� ����� ����
�..� 2015 2016 2017
0PERATING�PRO�T� ���� ���� ���
"VERAGE�EQUITY� � ���� � ���� � ���
0PERATING�PRO�T�� ���� ���� ���
$OST�OF�EQUITY� ���� ���� ����
47"� ���� ��� ��
17
2017AnnualReport_InsidePages_F_Revised.indd 17 12/28/17 4:03 PM

TABLE OF CONTENTS
Management’s discussion and analysis ........................19
Reports of management and independent registered public accounting firm ........... 29
Consolidated financial statements ............................. 30
Notes to consolidated financial statements ............... 35
Selected financial data .............................................. 67
World’s Top 50 Most Admired Companies – Fortune magazine
World’s Most Ethical Companies – Ethisphere Institute
Top 100 Global Brands – Interbrand
Company of the Year – Society of Hispanic Professional Engineers
U.S. President’s Volunteer Service Award – Junior Achievement USA
Best Community Improvement Program Award – U.S. Chamber of Commerce Foundation
50 Best Places to Work in the U.S. – Indeed.com
Top Employer recognition in: Brazil (Great Place to Work Institute, Época magazine) Germany (Focus magazine) Mexico (Great Place to Work Institute) Spain (Top Employers Institute) U.S. (Forbes magazine)
Agritechnica Innovation Awards – German Agricultural Society
SIMA Innovation Awards – Paris International Agribusiness Show
Most Innovative Companies in Brazil – Valor Econômico newspaper
Best Working Mother Companies Award in Mexico – Working Mothers Mexico Institute
AWARDS & RECOGNITION
The John Deere Foundation earned the U.S. Chamber of Commerce Foundation’s Best Community Improvement Program award for JIVA, the Joint Initiative for Village Advancement. JIVA is supporting 13 villages in Rajasthan, India, by bolstering agricultural productivity and improving infrastructure and public education.
18
2017AnnualReport_InsidePages_F_Revised.indd 18 1/8/18 1:09 PM

19
MANAGEMENT’S DISCUSSION AND ANALYSIS
RESULTS OF OPERATIONS FOR THE YEARS ENDED 2017 COMPARED WITH 2016
OCTOBER 29, 2017, OCTOBER 30, 2016, AND NOVEMBER 1, 2015CONSOLIDATED RESULTS
OVERVIEW Worldwide net income attributable to Deere & Company in 2017was $2,159 million, or $6.68 per share diluted ($6.76 basic),
Organizationcompared with $1,524 million, or $4.81 per share diluted ($4.83The company’s equipment operations generate revenues andbasic), in 2016. Worldwide net sales and revenues increased 12cash primarily from the sale of equipment to John Deere dealerspercent to $29,738 million in 2017, compared with $26,644and distributors. The equipment operations manufacture andmillion in 2016. Net sales of the worldwide equipmentdistribute a full line of agricultural equipment; a variety ofoperations rose 11 percent in 2017 to $25,885 million fromcommercial and consumer equipment; and a broad range of$23,387 million last year. Sales included price realization of 1equipment for construction and forestry. The company’spercent and a favorable currency translation effect of 1 percent.financial services primarily provide credit services, which mainlyEquipment net sales in the United States and Canada increasedfinance sales and leases of equipment by John Deere dealers and5 percent for 2017. Outside the U.S. and Canada, net salestrade receivables purchased from the equipment operations. Inincreased 20 percent for the year, with a favorable currencyaddition, financial services offers extended equipmenttranslation effect of 1 percent for 2017.warranties. The information in the following discussion is
presented in a format that includes information grouped as Worldwide equipment operations had an operating profit ofconsolidated, equipment operations, and financial services. The $2,821 million in 2017, compared with $1,880 million in 2016.company also views its operations as consisting of two The operating profit increase was primarily due to highergeographic areas, the U.S. and Canada, and outside the U.S. and shipment volumes, a gain on the sale of the remaining interestCanada. The company’s operating segments consist of in SiteOne Landscape Supply, Inc. (SiteOne) (see Note 5), priceagriculture and turf, construction and forestry, and financial realization, and a favorable product mix, partially offset byservices. increases in production costs, selling, administrative and general
expenses, and warranty related expenses.Trends and Economic Conditions
The company’s agriculture and turf equipment sales increased 9 Net income of the company’s equipment operations was $1,707percent in 2017 and are projected to increase about 9 percent million for 2017, compared with $1,058 million in 2016. Thefor 2018. Industry agricultural machinery sales in the U.S. and operating factors mentioned above affected the results.Canada for 2018 are forecast to increase 5 to 10 percent, The financial services operations reported net incomecompared to 2017. Industry sales in the European Union (EU)28 attributable to Deere & Company in 2017 of $477 million,member nations are forecast to increase approximately 5 percent compared with $468 million in 2016. The increase was largelyin 2018, while South American industry sales are projected to be due to lower losses on lease residual values, partially offset byabout the same or increase 5 percent from 2017 levels. Asian less favorable financing spreads and higher selling,sales are forecast to be about the same in 2018. Industry sales administrative and general expenses. Additional information isof turf and utility equipment in the U.S. and Canada are presented in the following discussion of the ‘‘Worldwideexpected to be approximately the same for 2018. The company’s Financial Services Operations.’’construction and forestry sales increased 17 percent in 2017 and
The cost of sales to net sales ratio for 2017 was 77.0 percent,are forecast to increase about 69 percent in 2018. The Wirtgencompared with 78.0 percent last year. The improvement was dueacquisition is expected to add 54 percent to the constructionprimarily to price realization and a favorable product mix,and forestry annual sales forecast (see Note 30). Global forestrypartially offset by increases in production costs and warrantyindustry sales are expected to be about the same to 5 percentrelated expenses.higher in 2018, compared to 2017. Net income of the
company’s financial services operations attributable to Deere & Finance and interest income increased in 2017 due to a largerCompany in 2018 is expected to be approximately $515 million. average credit portfolio and higher average interest rates. Other
income increased due primarily to the gain on the sale of theItems of concern include the uncertainty of the effectiveness ofremaining interest in SiteOne (see Note 5). Selling, administrativegovernmental actions in respect to monetary and fiscal policies,and general expenses increased due primarily to higher incentivethe impact of sovereign debt, eurozone issues, capital marketcompensation expense, higher commissions paid to dealers ondisruptions, trade agreements, changes in demand and pricingdirect sales, and expenses related to voluntaryfor used equipment, and geopolitical events. Significantemployee-separation programs. Interest expense increased duefluctuations in foreign currency exchange rates and volatility into higher average interest rates and higher average borrowings.the price of many commodities could also impact the company’sOther operating expenses increased primarily due to higherresults.depreciation of equipment on operating leases, partially offset
The company completed a successful year as markets for farm by lower losses on lease residual values.and construction equipment improved. Sales of farm machinery
The company has several defined benefit pension plans andin South America made especially strong gains. The Wirtgendefined benefit health care and life insurance plans. Theacquisition was finalized in December, which will establish thecompany’s postretirement benefit costs for these plans in 2017company as a more prominent participant in the globalwere $347 million, compared with $312 million in 2016. Theconstruction equipment markets. The company is confident inlong-term expected return on plan assets, which is reflected inthe present course and believes it is positioned to deliverthese costs, was an expected gain of 7.2 percent in 2017 andstronger, more consistent results in the future.
19

20
7.3 percent in 2016, or $807 million in 2017 and $810 million in 2017 as a result of higher average borrowing rates. The financial2016. The actual return was a gain of $1,563 million in 2017 services operations’ ratio of earnings to fixed charges was 2.12and $645 million in 2016. In 2018, the expected return will be to 1 in 2017, compared with 2.35 to 1 in 2016.approximately 6.8 percent. The company’s postretirement costs
Equipment Operations in U.S. and Canadain 2018 are expected to increase approximately $10 million. The The equipment operations in the U.S. and Canada had ancompany makes any required contributions to the plan assets operating profit of $1,724 million in 2017, compared withunder applicable regulations and voluntary contributions from $1,305 million in 2016. The increase was due primarily to highertime to time based on the company’s liquidity and ability to shipment volumes, a gain on the sale of the remaining interestmake tax-deductible contributions. Total company contributions in SiteOne (see Note 5), a favorable sales mix, and priceto the plans were $428 million in 2017 and $127 million in realization, partially offset by increases in production costs,2016, which include direct benefit payments for unfunded plans. selling, administrative and general expenses, and warrantyThese contributions also included voluntary contributions to plan related expenses. Net sales increased 5 percent due primarily toassets of $301 million in 2017 and $3 million in 2016. Total higher shipment volumes. The physical volume of sales increasedcompany contributions in 2018 are expected to be 5 percent, compared with 2016.approximately $137 million, which are primarily direct benefit
Equipment Operations outside U.S. and Canadapayments for unfunded plans. The company has no significantThe equipment operations outside the U.S. and Canada had anrequired contributions to U.S. pension plan assets in 2018 underoperating profit of $1,097 million in 2017, compared with $575applicable funding regulations. See the discussion in ‘‘Criticalmillion in 2016. The increase was due primarily to higherAccounting Policies’’ for more information about postretirementshipment volumes and price realization, partially offset by higherbenefit obligations.production costs and increased selling, administrative and
BUSINESS SEGMENT AND GEOGRAPHIC AREA RESULTS general expenses. Net sales increased 20 percent in 2017The following discussion relates to operating results by compared to 2016. The increase was primarily the result ofreportable segment and geographic area. Operating profit is higher shipment volumes, price realization, and the favorableincome before certain external interest expense, certain foreign effects of foreign currency translation. The physical volume ofexchange gains or losses, income taxes, and corporate expenses. sales increased 16 percent, compared with 2016.However, operating profit of the financial services segment
MARKET CONDITIONS AND OUTLOOKincludes the effect of interest expense and foreign currencyCompany equipment sales are projected to increase about 22exchange gains or losses.percent for fiscal year 2018 and increase by about 38 percent
Worldwide Agriculture and Turf Operations for the first quarter, compared with the same periods in 2017.The agriculture and turf segment had an operating profit of Included in the forecast is a positive foreign currency translation$2,484 million for the year, compared with $1,700 million in effect of about 2 percent for the year and about 3 percent for2016. Net sales increased 9 percent in 2017 due to higher the first quarter. Net sales and revenues are projected toshipment volumes, price realization, and the favorable effects of increase about 19 percent for fiscal 2018, with net incomecurrency translation. Operating profit was higher due primarily to attributable to Deere & Company of about $2.6 billion.increased shipment volumes, a gain on the sale of the remaining
The acquisition of the Wirtgen Group, which closed in Decemberinterest in SiteOne (see Note 5), price realization, and a favorable2017, is forecast to contribute about $3.1 billion in net sales insales mix, partially offset by increases in production costs,fiscal 2018 (see Note 30). Wirtgen is expected to add aboutselling, administrative and general expenses, and warranty12 percent to the company’s sales for the full year and aboutrelated expenses.6 percent for the first quarter in comparison with 2017. After
Worldwide Construction and Forestry Operations estimated expenses for purchase accounting and transactionThe construction and forestry segment had an operating profit costs, Wirtgen is expected to contribute about $75 million toof $337 million in 2017, compared with $180 million in 2016. operating profit and about $25 million to net income in fiscalNet sales increased 17 percent for the year on account of higher 2018.shipment volumes, price realization, and the favorable effects of
Agriculture and Turf. The company’s worldwide sales ofcurrency translation. Operating profit increased mainlyagriculture and turf equipment are forecast to increase by aboutattributable to improved shipment volumes and price realization,9 percent for fiscal year 2018, including a positive currencypartially offset by higher warranty expenses, increased selling,translation effect of about 2 percent. Industry sales foradministrative and general expenses, and higher productionagricultural equipment in the U.S. and Canada are forecast to becosts.up 5 to 10 percent for 2018, supported by higher demand for
Worldwide Financial Services Operations large equipment. Full year 2018 industry sales in the EU28The operating profit of the financial services segment was $722 member nations are forecast to increase about 5 percent due tomillion in 2017, compared with $709 million in 2016. The improving conditions in the dairy and livestock sectors. Southincrease was largely due to lower losses on lease residual values, American industry sales of tractors and combines are projectedpartially offset by less favorable financing spreads and higher to be about the same to 5 percent higher as a result ofselling, administrative and general expenses. Total revenues of continued positive conditions, particularly in Argentina. Asianthe financial services operations, including intercompany sales are projected to be about the same with strength in Indiarevenues, increased 9 percent in 2017. The average balance of offsetting weakness in China. Industry sales of turf and utilityreceivables and leases financed was 1 percent higher in 2017, equipment in the U.S. and Canada are expected to be about thecompared with 2016. Interest expense increased 25 percent in
20
21
same for 2018. The company’s turf sales are expected to All of the company’s businesses and its results are affected byoutperform the industry owing to the success of new products. general economic conditions in the global markets and
industries in which the company operates; customer confidenceConstruction and Forestry. The company’s worldwide sales of
in general economic conditions; government spending andconstruction and forestry equipment are anticipated to increasetaxing; foreign currency exchange rates and their volatility,about 69 percent for 2018, including a positive currencyespecially fluctuations in the value of the U.S. dollar; interesttranslation effect of about 1 percent. The Wirtgen acquisition isrates; inflation and deflation rates; changes in weather patterns;expected to add about 54 percent to the segment’s salesthe political and social stability of the global markets in whichforecast for the year (see Note 30). The outlook reflectsthe company operates; the effects of, or response to, terrorismmoderate economic growth worldwide, including higher housingand security threats; wars and other conflicts; natural disasters;starts in the U.S. and increased activity in the oil and gas sector.and the spread of major epidemics.In forestry, global industry sales are expected to be about the
same to 5 percent higher than in 2017, mainly as a result of Significant changes in market liquidity conditions, changes in theimproved lumber prices in North America. company’s credit ratings and any failure to comply with financial
covenants in credit agreements could impact access to fundingFinancial Services. Fiscal year 2018 net income attributable to
and funding costs, which could reduce the company’s earningsDeere & Company for the financial services operations isand cash flows. Financial market conditions could also negativelyexpected to be approximately $515 million. The outlook reflectsimpact customer access to capital for purchases of thea higher average portfolio, partially offset by increased selling,company’s products and customer confidence and purchaseadministrative and general expenses.decisions, borrowing and repayment practices, and the number
SAFE HARBOR STATEMENT and size of customer loan delinquencies and defaults. A debtSafe Harbor Statement under the Private Securities Litigation crisis, in Europe or elsewhere, could negatively impact currencies,Reform Act of 1995: Statements under ‘‘Overview,’’ ‘‘Market global financial markets, social and political stability, fundingConditions and Outlook,’’ and other forward-looking statements sources and costs, asset and obligation values, customers,herein that relate to future events, expectations, and trends suppliers, demand for equipment, and company operations andinvolve factors that are subject to change, and risks and results. The company’s investment management activities coulduncertainties that could cause actual results to differ materially. be impaired by changes in the equity, bond and other financialSome of these risks and uncertainties could affect particular markets, which would negatively affect earnings.lines of business, while others could affect all of the company’s
The anticipated withdrawal of the United Kingdom from thebusinesses.European Union and the perceptions as to the impact of the
The company’s agricultural equipment business is subject to a withdrawal may adversely affect business activity, politicalnumber of uncertainties including the factors that affect stability and economic conditions in the United Kingdom, thefarmers’ confidence and financial condition. These factors European Union and elsewhere. The economic conditions andinclude demand for agricultural products, world grain stocks, outlook could be further adversely affected by (i) the uncertaintyweather conditions, soil conditions, harvest yields, prices for concerning the timing and terms of the exit, (ii) new or modifiedcommodities and livestock, crop and livestock production trading arrangements between the United Kingdom and otherexpenses, availability of transport for crops, the growth and countries, (iii) the risk that one or more other European Unionsustainability of non-food uses for some crops (including ethanol countries could come under increasing pressure to leave theand biodiesel production), real estate values, available acreage European Union, or (iv) the risk that the euro as the singlefor farming, the land ownership policies of governments, currency of the Eurozone could cease to exist. Any of thesechanges in government farm programs and policies, international developments, or the perception that any of these developmentsreaction to such programs, changes in environmental regulations are likely to occur, could affect economic growth or businessand their impact on farming practices; changes in and effects of activity in the United Kingdom or the European Union, and couldcrop insurance programs, global trade agreements, animal result in the relocation of businesses, cause businessdiseases and their effects on poultry, beef and pork consumption interruptions, lead to economic recession or depression, andand prices, crop pests and diseases, and the level of farm impact the stability of the financial markets, availability of credit,product exports (including concerns about genetically modified currency exchange rates, interest rates, financial institutions, andorganisms). political, financial and monetary systems. Any of these
developments could affect our businesses, liquidity, results ofFactors affecting the outlook for the company’s turf and utilityoperations and financial position.equipment include consumer confidence, weather conditions,
customer profitability, consumer borrowing patterns, consumer Additional factors that could materially affect the company’spurchasing preferences, housing starts, infrastructure operations, access to capital, expenses and results includeinvestment, spending by municipalities and golf courses, and changes in, uncertainty surrounding and the impact ofconsumable input costs. governmental trade, banking, monetary and fiscal policies,
including financial regulatory reform and its effects on theConsumer spending patterns, real estate and housing prices, theconsumer finance industry, derivatives, funding costs and othernumber of housing starts, interest rates and the levels of publicareas, and governmental programs, policies, tariffs and sanctionsand non-residential construction are important to sales andin particular jurisdictions or for the benefit of certain industriesresults of the company’s construction and forestry equipment.or sectors; actions by central banks; actions by financial andPrices for pulp, paper, lumber and structural panels aresecurities regulators; actions by environmental, health and safetyimportant to sales of forestry equipment.regulatory agencies, including those related to engine emissions,
21

22
carbon and other greenhouse gas emissions, noise and the increases in delinquencies and default rates, which couldeffects of climate change; changes to GPS radio frequency bands materially impact write-offs and provisions for credit losses.or their permitted uses; changes in labor regulations; changes to The company’s outlook is based upon assumptions relating toaccounting standards; changes in tax rates, estimates, laws, and the factors described above, which are sometimes based uponregulations and company actions related thereto; compliance estimates and data prepared by government agencies. Suchwith U.S. and foreign laws when expanding to new markets and estimates and data are often revised. The company, except asotherwise; and actions by other regulatory bodies. required by law, undertakes no obligation to update or revise itsOther factors that could materially affect results include outlook, whether as a result of new developments or otherwise.production, design and technological innovations and Further information concerning the company and its businesses,difficulties, including capacity and supply constraints and prices; including factors that could materially affect the company’sthe loss of or challenges to intellectual property rights whether financial results, is included in the company’s other filings withthrough theft, infringement, counterfeiting or otherwise; the the SEC.availability and prices of strategically sourced materials,
2016 COMPARED WITH 2015components and whole goods; delays or disruptions in thecompany’s supply chain or the loss of liquidity by suppliers; CONSOLIDATED RESULTS
disruptions of infrastructures that support communications, Worldwide net income attributable to Deere & Company in 2016operations or distribution; the failure of suppliers or the was $1,524 million, or $4.81 per share diluted ($4.83 basic),company to comply with laws, regulations and company policy compared with $1,940 million, or $5.77 per share diluted ($5.81pertaining to employment, human rights, health, safety, the basic), in 2015. Worldwide net sales and revenues decreased 8environment, anti-corruption, privacy and data protection, and percent to $26,644 million in 2016, compared with $28,863other ethical business practices; events that damage the million in 2015. Net sales of the worldwide equipmentcompany’s reputation or brand; significant investigations, claims, operations declined 9 percent in 2016 to $23,387 million fromlawsuits or other legal proceedings; start-up of new plants and $25,775 million in 2015. 2016 sales included price realization ofproducts; the success of new product initiatives; changes in 2 percent and an unfavorable currency translation effect of 2customer product preferences and sales mix; gaps or limitations percent. Equipment net sales in the United States and Canadain rural broadband coverage, capacity and speed needed to decreased 13 percent in 2016. Outside the U.S. and Canada, netsupport technology solutions; oil and energy prices, supplies and sales decreased 3 percent in 2016, with an unfavorable currencyvolatility; the availability and cost of freight; actions of translation effect of 4 percent.competitors in the various industries in which the company
Worldwide equipment operations had an operating profit ofcompetes, particularly price discounting; dealer practices
$1,880 million in 2016, compared with $2,177 million in 2015.especially as to levels of new and used field inventories; changes
The operating profit decline was primarily on account of reducedin demand and pricing for used equipment and resulting impacts
shipment volumes, the unfavorable effects of foreign currencyon lease residual values; labor relations and contracts; changes
exchange, and a less favorable product mix, partially offset byin the ability to attract, train and retain qualified personnel;
price realization, lower production costs, lower selling,acquisitions and divestitures of businesses and the failure or
administrative and general expenses, and a gain on the sale of adelay in closing such transactions; greater than anticipated
partial interest in the unconsolidated affiliate SiteOne (seetransaction costs; the integration of new businesses; the failure
Note 5).or delay in realizing anticipated benefits of acquisitions, joint
Net income of the company’s equipment operations was $1,058ventures or divestitures; the implementation of organizationalmillion for 2016, compared with $1,308 million in 2015. Inchanges; the failure to realize anticipated savings or benefits ofaddition to the operating factors mentioned above, a highercost reduction, productivity, or efficiency efforts; difficultieseffective tax rate in 2016 reduced net income.related to the conversion and implementation of enterprise
resource planning systems; security breaches, cybersecurity Net income of the financial services operations attributable toattacks, technology failures and other disruptions to the Deere & Company in 2016 decreased to $468 million, comparedcompany’s and suppliers’ information technology infrastructure; with $633 million in 2015. The decline was primarily due to lesschanges in company declared dividends and common stock favorable financing spreads, higher losses on lease residualissuances and repurchases; changes in the level and funding of values (see Note 5), and a higher provision for credit losses. Theemployee retirement benefits; changes in market values of results in 2015 also benefited from a gain on the sale of theinvestment assets, compensation, retirement, discount and crop insurance business (see Note 4). Additional information ismortality rates which impact retirement benefit costs; and presented in the following discussion of the ‘‘Worldwidesignificant changes in health care costs. Financial Services Operations.’’
The liquidity and ongoing profitability of John Deere Capital The cost of sales to net sales ratio for 2016 was 78.0 percent,Corporation and other credit subsidiaries depend largely on compared with 78.1 percent in 2015. The decrease was duetimely access to capital in order to meet future cash flow primarily to price realization and lower production costs, largelyrequirements, and to fund operations, costs and purchases of offset by the unfavorable effects of foreign currency exchangethe company’s products. If general economic conditions and the impact of a less favorable product mix.deteriorate or capital markets become more volatile, funding
Finance and interest income increased in 2016 due to a largercould be unavailable or insufficient. Additionally, customeraverage leasing portfolio, partially offset by a lower averageconfidence levels may result in declines in credit applications andfinancing receivables portfolio. Other income increased dueprimarily to a gain on the sale of a partial interest in SiteOne
22

23
(see Note 5) and was primarily offset by the gain on the sale of borrowing rates, partially offset by lower average borrowings.the crop insurance operations in 2015 (see Note 4). Research The financial services operations’ ratio of earnings to fixedand development costs decreased largely due to a lower level of charges was 2.35 to 1 in 2016, compared with 3.29 to 1 inactivity and the favorable effects of currency translation. Selling, 2015.administrative and general expenses decreased due primarily to
Equipment Operations in U.S. and Canadalower pension and postretirement benefit expenses, lower The equipment operations in the U.S. and Canada had anincentive compensation expense, and the favorable effects of operating profit of $1,305 million in 2016, compared withcurrency translation, partially offset by a higher provision for $1,643 million in 2015. The decline was due primarily to lowercredit losses. Interest expense increased due to higher average shipment volumes, the unfavorable effects of foreign currencyinterest rates, partially offset by lower average borrowings. Other exchange, and the impact of a less favorable product mix. Theoperating expenses increased primarily due to higher decline was partially offset by price realization, lower productiondepreciation of equipment on operating leases, and higher costs, lower selling, administrative and general expenses, and alosses and impairments on lease residual values. gain on the sale of a partial interest in SiteOne (see Note 5). NetThe company has several defined benefit pension plans and sales decreased 13 percent due primarily to lower shipmentdefined benefit health care and life insurance plans. The volumes, partially offset by price realization. The physical volumecompany’s postretirement benefit costs for these plans in 2016 of sales decreased 14 percent, compared with 2015.were $312 million, compared with $512 million in 2015. The
Equipment Operations outside U.S. and Canadalong-term expected return on plan assets, which is reflected in The equipment operations outside the U.S. and Canada had anthese costs, was an expected gain of 7.3 percent in 2016 and operating profit of $575 million in 2016, compared with $5342015, or $810 million in 2016 and $824 million in 2015. The million in 2015. The increase was due primarily to priceactual return was a gain of $645 million in 2016 and $606 realization, lower production costs, and lower selling,million in 2015. Total company contributions to the plans were administrative and general expenses, partially offset by the$127 million in 2016 and $131 million in 2015, which include unfavorable effects of foreign currency exchange, the impact ofdirect benefit payments for unfunded plans. These contributions a less favorable product mix, and lower shipment volumes. Netalso included voluntary contributions to plan assets of $3 million sales were 3 percent lower primarily reflecting the unfavorablein both 2016 and 2015. effects of foreign currency translation and decreased shipmentBUSINESS SEGMENT AND GEOGRAPHIC AREA RESULTS volumes, partially offset by price realization. The physical volume
of sales decreased 2 percent, compared with 2015.Worldwide Agriculture and Turf Operations
The agriculture and turf segment had an operating profit of CAPITAL RESOURCES AND LIQUIDITY
$1,700 million in 2016, compared with $1,649 million in 2015. The discussion of capital resources and liquidity has beenNet sales decreased 7 percent in 2016 due to lower shipment organized to review separately, where appropriate, thevolumes and the unfavorable effects of currency translation, company’s consolidated totals, equipment operations, andpartially offset by price realization. Operating profit was higher financial services operations.primarily due to price realization, lower production costs, lower
CONSOLIDATEDselling, administrative and general expenses, and a gain on thePositive cash flows from consolidated operating activities insale of a partial interest in SiteOne (see Note 5), partially offset2017 were $2,200 million. This resulted primarily from netby lower shipment volumes, unfavorable effects of foreignincome adjusted for non-cash provisions and an increase incurrency exchange, and a less favorable product mix.accounts payable and accrued expenses, which were partially
Worldwide Construction and Forestry Operations offset by an increase in inventories including equipmentThe construction and forestry segment had an operating profit transferred to operating leases (see Note 6), an increase inof $180 million in 2016, compared with $528 million in 2015. receivables related to sales, and a change in accrued incomeNet sales decreased 18 percent in 2016 largely as a result of taxes payable/receivable. Cash outflows from investing activitieslower shipment volumes and higher sales incentive costs. were $1,644 million in 2017, due primarily to the cost ofOperating profit declined primarily due to lower shipment receivables (excluding receivables related to sales) and cost ofvolumes and higher sales incentive costs, partially offset by a equipment on operating leases exceeding the collections ofreduction in both selling, administrative and general expenses receivables and the proceeds from sales of equipment onand production costs. operating leases by $1,107 million, purchases of property and
equipment of $595 million, and acquisitions of businesses, netWorldwide Financial Services Operations
of cash acquired, of $284 million, partially offset by proceedsThe operating profit of the financial services segment was $709from maturities and sales exceeding purchases of marketablemillion in 2016, compared with $963 million in 2015. The declinesecurities by $286 million and sales of businesses andwas primarily due to less favorable financing spreads, higherunconsolidated affiliates, net of cash sold, of $114 million (seelosses on lease residual values, and a higher provision for creditNote 5). Cash inflows from financing activities were $4,287losses. Additionally, full year results in 2015 benefited from amillion in 2017 due primarily to an increase in borrowings ofgain on the sale of the crop insurance business (see Note 4).$4,616 million and proceeds from issuance of common stockTotal revenues of the financial services operations, including(resulting from the exercise of stock options) of $529 million,intercompany revenues, increased 4 percent in 2016. Thepartially offset by dividends paid of $764 million. Cash and cashaverage balance of receivables and leases financed was 1equivalents increased $4,999 million during 2017. The increasepercent lower in 2016, compared with 2015. Interest expensein cash and cash equivalents was primarily related to theincreased 18 percent in 2016 as a result of higher average
23

24
pending Wirtgen acquisition which closed on December 1, 2017 comprehensive income (loss)) at not more than 11 to 1 at the(see Note 30). end of any fiscal quarter. The credit agreements also require the
equipment operations to maintain a ratio of total debt to totalOver the last three years, operating activities have provided ancapital (total debt and stockholders’ equity excludingaggregate of $9,728 million in cash. In addition, increases inaccumulated other comprehensive income (loss)) of 65 percentborrowings were $4,555 million, proceeds from maturities andor less at the end of each fiscal quarter. Under this provision,sales exceeded purchases of marketable securities bythe company’s excess equity capacity and retained earnings$990 million, proceeds from issuance of common stock (resultingbalance free of restriction at October 29, 2017 was $10,965from the exercise of stock options) were $737 million, andmillion. Alternatively under this provision, the equipmentproceeds from sales of businesses and unconsolidated affiliatesoperations had the capacity to incur additional debt of $20,364were $344 million. The aggregate amount of these cash flowsmillion at October 29, 2017. All of these requirements of thewas used mainly to repurchase common stock of $2,982 million,credit agreements have been met during the periods included inacquire receivables (excluding receivables related to sales) andthe consolidated financial statements.equipment on operating leases that exceeded collections of
receivables and the proceeds from sales of equipment on Debt Ratings. To access public debt capital markets, theoperating leases by $2,664 million, pay dividends of company relies on credit rating agencies to assign short-term$2,342 million, purchase property and equipment of and long-term credit ratings to the company’s securities as an$1,933 million, and acquire businesses of $483 million. Cash and indicator of credit quality for fixed income investors. A securitycash equivalents increased $5,548 million over the three-year rating is not a recommendation by the rating agency to buy, sell,period. or hold company securities. A credit rating agency may change
or withdraw company ratings based on its assessment of theThe company has access to most global capital markets atcompany’s current and future ability to meet interest andreasonable costs and expects to have sufficient sources of globalprincipal repayment obligations. Each agency’s rating should befunding and liquidity to meet its funding needs. Sources ofevaluated independently of any other rating. Lower credit ratingsliquidity for the company include cash and cash equivalents,generally result in higher borrowing costs, including costs ofmarketable securities, funds from operations, the issuance ofderivative transactions, and reduced access to debt capitalcommercial paper and term debt, the securitization of retailmarkets.notes (both public and private markets), and committed and
uncommitted bank lines of credit. The company’s commercial The senior long-term and short-term debt ratings and outlookpaper outstanding at October 29, 2017 and October 30, 2016 currently assigned to unsecured company securities by the ratingwas $3,439 million and $1,253 million, respectively, while the agencies engaged by the company are as follows:total cash and cash equivalents and marketable securitiesposition was $9,787 million and $4,789 million, respectively. The Senior
Long-Term Short-Term Outlookamount of the total cash and cash equivalents and marketablesecurities held by foreign subsidiaries, in which earnings are Fitch Ratings ............................. A F1 Stableconsidered indefinitely reinvested, was $3,386 million and $2,301 Moody’s Investors Service, Inc. ..... A2 Prime-1 Negativemillion at October 29, 2017 and October 30, 2016, respectively. Standard & Poor’s ...................... A A-1 StableAt October 29, 2017, foreign subsidiaries also held cash ofapproximately $3,624 million for the Wirtgen acquisition, which Trade accounts and notes receivable primarily arise from sales ofclosed on December 1, 2017 (see Note 30). goods to independent dealers. Trade receivables increased byLines of Credit. The company also has access to bank lines of $914 million in 2017 due primarily to higher shipment volumes.credit with various banks throughout the world. Worldwide lines The ratio of trade accounts and notes receivable at October 29,of credit totaled $7,878 million at October 29, 2017, $4,061 2017 and October 30, 2016 to fiscal year net sales was 15million of which were unused. For the purpose of computing percent in 2017 and 13 percent in 2016. Total worldwideunused credit lines, commercial paper and short-term bank agriculture and turf receivables increased $553 million andborrowings, excluding secured borrowings and the current construction and forestry receivables increased $361 million. Theportion of long-term borrowings, were primarily considered to collection period for trade receivables averages less than 12constitute utilization. Included in the total credit lines at months. The percentage of trade receivables outstanding for aOctober 29, 2017 were 364-day credit facility agreements of period exceeding 12 months was 1 percent at October 29, 2017$1,750 million, expiring in February 2018, and $750 million, and 2 percent at October 30, 2016.expiring in October 2018. In addition, total credit lines included Deere & Company’s stockholders’ equity was $9,557 million atlong-term credit facility agreements of $2,500 million, expiring in October 29, 2017, compared with $6,520 million at October 30,April 2021, and $2,500 million, expiring in April 2022. These 2016. The increase of $3,037 million resulted from net incomecredit agreements require John Deere Capital Corporation attributable to Deere & Company of $2,159 million, a change in(Capital Corporation) to maintain its consolidated ratio of the retirement benefits adjustment of $829 million, an increaseearnings to fixed charges at not less than 1.05 to 1 for each in common stock of $369 million, a change in the cumulativefiscal quarter and the ratio of senior debt, excluding translation adjustment of $230 million, and a decrease insecuritization indebtedness, to capital base (total subordinated treasury stock of $216 million, which were partially offset bydebt and stockholder’s equity excluding accumulated other dividends declared of $769 million.
24

25
EQUIPMENT OPERATIONS operating activities, including intercompany cash flows, wereThe company’s equipment businesses are capital intensive and $1,877 million in 2017. Cash used by investing activities totaled
$2,897 million in 2017 due primarily to the cost of receivablesare subject to seasonal variations in financing requirements for(excluding trade and wholesale) and cost of equipment oninventories and certain receivables from dealers. The equipmentoperating leases exceeding collections of these receivables andoperations sell a significant portion of their trade receivables tothe proceeds from sales of equipment on operating leases byfinancial services. To the extent necessary, funds provided from$2,476 million and an increase in trade receivables andoperations are supplemented by external financing sources.wholesale notes of $380 million. Cash provided by financingCash provided by operating activities of the equipmentactivities totaled $990 million in 2017, representing primarily anoperations during 2017, including intercompany cash flows, wasincrease in external borrowings of $3,511 million, partially offset$2,438 million due primarily to net income adjusted for non-cashby a decrease in borrowings from Deere & Company ofprovisions and an increase in accounts payable and accrued$2,142 million and dividends paid of $365 million to Deere &expenses, partially offset by an increase in inventories, anCompany. Cash and cash equivalents decreased $29 million.increase in trade receivables, and a change in accrued incomeOver the last three years, the operating activities, includingtaxes payable/receivable.intercompany cash flows, have provided $5,319 million in cash.Over the last three years, these operating activities, includingIn addition, an increase in total borrowings of $1,238 million, aintercompany cash flows, have provided an aggregate of $8,424decrease in trade receivables and wholesale notes of $770million in cash.million, proceeds from sales of businesses, net of cash sold, of
Trade receivables held by the equipment operations increased by $149 million, and a capital investment from Deere & Company of$222 million during 2017. The equipment operations sell a $76 million provided cash inflows. These amounts have beensignificant portion of their trade receivables to financial services used mainly to fund receivables (excluding trade and wholesale)(see previous consolidated discussion). and equipment on operating lease acquisitions, which exceededInventories increased by $564 million in 2017 due primarily to collections and the proceeds from sales of equipment onhigher production volumes and currency translation. Most of operating leases, by $5,848 million and pay dividends to Deere &these inventories are valued on the last-in, first-out (LIFO) Company of $1,607 million. Cash and cash equivalents decreasedmethod. The ratios of inventories on a first-in, first-out (FIFO) $51 million over the three-year period.basis (see Note 15), which approximates current cost, to fiscal Receivables and equipment on operating leases increased byyear cost of sales were 27 percent and 26 percent at $1,890 million in 2017, compared with 2016. Total acquisitionOctober 29, 2017 and October 30, 2016, respectively. volumes of receivables (excluding trade and wholesale notes)Total interest-bearing debt of the equipment operations was and cost of equipment on operating leases increased 8 percent$5,866 million at the end of 2017, compared with $4,814 million in 2017, compared with 2016. The volumes of financing leases,at the end of 2016 and $4,903 million at the end of 2015. The retail notes, and revolving charge accounts increased
approximately 41 percent, 10 percent, and 8 percent,ratio of total debt to total capital (total interest-bearing debtrespectively, while operating lease volumes decreased 4 percent.and stockholders’ equity) at the end of 2017, 2016, and 2015During 2017, the amount of trade receivables increased 27was 38 percent, 42 percent, and 42 percent, respectively.percent, while wholesale notes decreased 9 percent. AtProperty and equipment cash expenditures for the equipmentOctober 29, 2017 and October 30, 2016, net receivables andoperations in 2017 were $591 million, compared with $642leases administered, which include receivables administered butmillion in 2016. Capital expenditures in 2018 are estimated to benot owned, were $40,001 million and $38,116 million,$925 million.respectively.
In September 2017, the company completed the acquisition ofTotal external interest-bearing debt of the financial servicesBlue River Technology (Blue River) for a cash purchase price ofoperations was $34,179 million at the end of 2017, compared$284 million. The purchase price was financed with cash fromwith $30,797 million at the end of 2016 and $31,882 million atoperations (see Note 4).the end of 2015. Total external borrowings have changed
On December 1, 2017, the company acquired from Wirtgen generally corresponding with the level of the receivable andGroup Holding GmbH substantially all the business operations of lease portfolio, the level of cash and cash equivalents, thethe Wirtgen Group. The cash purchase price was e4,475 million change in payables owed to Deere & Company, and the change(or approximately $5,327 million based on the exchange rate at in investment from Deere & Company. The financial servicesthe closing date). The company financed the acquisition and the operations’ ratio of total interest-bearing debt to totaltransaction expenses from a combination of cash, repayment of stockholder’s equity was 7.6 to 1 at the end of 2017, 2016, andintercompany loans from the financial services operations, and 2015.e850 million of medium-term debt financing issued by the
The Capital Corporation has a revolving credit agreement toequipment operations in September 2017 (see Note 30).utilize bank conduit facilities to securitize retail notes (see
FINANCIAL SERVICES Note 13). At October 29, 2017, the facility had a total capacity,The financial services operations rely on their ability to raise or ‘‘financing limit,’’ of up to $3,500 million of securedsubstantial amounts of funds to finance their receivable and financings at any time. The facility was renewed in Novemberlease portfolios. Their primary sources of funds for this purpose 2017 with a capacity of $3,500 million. After a two-yearare a combination of commercial paper, term debt, securitization revolving period, unless the banks and Capital Corporation agreeof retail notes, equity capital, and borrowings from Deere & to renew, Capital Corporation would liquidate the securedCompany. borrowings over time as payments on the retail notes areThe cash provided by operating and financing activities was used collected. At October 29, 2017, $1,549 million of short-termfor investing activities. Cash flows from the financial services’ securitization borrowings was outstanding under the agreement.
25

26
During 2017, the financial services operations issued $1,924 Sales Incentives
million and retired $2,803 million of retail note securitization At the time a sale to a dealer is recognized, the company recordsborrowings. During 2017, the financial services operations also an estimate of the future sales incentive costs for allowancesissued $7,595 million and retired $5,331 million of long-term and financing programs that will be due when the dealer sellsborrowings, which were primarily medium-term notes. the equipment to a retail customer. The estimate is based on
historical data, announced incentive programs, field inventoryOFF-BALANCE-SHEET ARRANGEMENTS
levels, and retail sales volumes. The final cost of these programsAt October 29, 2017, the company had approximately $131 and the amount of accrual required for a specific sale are fullymillion of guarantees issued primarily to banks outside the U.S. determined when the dealer sells the equipment to the retailrelated to third-party receivables for the retail financing of John customer. This is due to numerous programs available at anyDeere equipment. The company may recover a portion of any particular time and new programs that may be announced afterrequired payments incurred under these agreements from the company records the sale. Changes in the mix and types ofrepossession of the equipment collateralizing the receivables. programs affect these estimates, which are reviewed quarterly.The maximum remaining term of the receivables guaranteed at
The sales incentive accruals at October 29, 2017, October 30,October 29, 2017 was approximately five years.2016, and November 1, 2015 were $1,581 million, $1,391
AGGREGATE CONTRACTUAL OBLIGATIONS million, and $1,463 million, respectively. The increase in 2017The payment schedule for the company’s contractual obligations was related primarily to higher sales volumes, while the decreaseat October 29, 2017 in millions of dollars is as follows: in 2016 was due primarily to lower sales volumes.
The estimation of the sales incentive accrual is impacted byLess Moremany assumptions. One of the key assumptions is the historicalthan 2&3 4&5 thanpercent of sales incentive costs to retail sales from dealers. OverTotal 1 year years years 5 yearsthe last five fiscal years, this percent has varied by an average of
On-balance-sheetapproximately plus or minus 1.4 percent, compared to theDebt*average sales incentive costs to retail sales percent during thatEquipment operations ....$ 5,898 $ 376 $ 1,324 $ 1,112 $ 3,086period. Holding other assumptions constant, if this estimatedFinancial services**........ 34,296 11,880 12,177 6,139 4,100cost experience percent were to increase or decrease 1.4Total ....................... 40,194 12,256 13,501 7,251 7,186percent, the sales incentive accrual at October 29, 2017 wouldInterest relating to debt*** 5,800 842 1,658 833 2,467increase or decrease by approximately $93 million.Accounts payable .............. 2,909 2,780 94 32 3
Capital leases ................... 26 10 11 4 1 Product WarrantiesOff-balance-sheet At the time a sale to a dealer is recognized, the company recordsPurchase obligations ......... 2,368 2,309 22 21 16
the estimated future warranty costs. The company generallyOperating leases ............... 371 98 134 83 56
determines its total warranty liability by applying historical claimsTotal ..............................$51,668 $18,295 $15,420 $ 8,224 $ 9,729 rate experience to the estimated amount of equipment that has
been sold and is still under warranty based on dealer inventories* Principal payments.** Payments related to securitization borrowings of $4,123 million classified as and retail sales. The historical claims rate is primarily determined
short-term on the balance sheet related to the securitization of retail notes by a review of five-year claims costs and consideration of currentare included in this table based on the expected payment schedule (see Note
quality developments. Variances in claims experience and the18).type of warranty programs affect these estimates, which are*** Includes projected payments related to interest rate swaps.reviewed quarterly.
The previous table does not include unrecognized tax benefitThe product warranty accruals, excluding extended warranty
liabilities of approximately $221 million at October 29, 2017,unamortized premiums, at October 29, 2017, October 30, 2016,
since the timing of future payments is not reasonably estimableand November 1, 2015 were $1,007 million, $779 million, and
at this time (see Note 8). For additional information regarding$807 million, respectively. The increase in 2017 was due
pension and other postretirement employee benefit obligations,primarily to higher sales volumes and claims experience. The
short-term borrowings, long-term borrowings, and leasedecrease in 2016 was due primarily to lower sales volumes.
obligations, see Notes 7, 18, 20, and 21, respectively.Estimates used to determine the product warranty accruals are
CRITICAL ACCOUNTING POLICIESsignificantly affected by the historical percent of warranty claims
The preparation of the company’s consolidated financial costs to sales. Over the last five fiscal years, this percent hasstatements in conformity with accounting principles generally varied by an average of approximately plus or minus .17 percent,accepted in the U.S. requires management to make estimates compared to the average warranty costs to sales percent duringand assumptions that affect reported amounts of assets, that period. Holding other assumptions constant, if thisliabilities, revenues, and expenses. Changes in these estimates estimated cost experience percent were to increase or decreaseand assumptions could have a significant effect on the financial .17 percent, the warranty accrual at October 29, 2017 wouldstatements. The accounting policies below are those increase or decrease by approximately $49 million.management believes are the most critical to the preparation of
Postretirement Benefit Obligationsthe company’s financial statements and require the mostPension obligations and other postretirement employee benefitdifficult, subjective, or complex judgments. The company’s other(OPEB) obligations are based on various assumptions used byaccounting policies are described in the Notes to thethe company’s actuaries in calculating these amounts. TheseConsolidated Financial Statements.
26

27
assumptions include discount rates, health care cost trend rates, likely than not that the fair value of a reporting unit is reducedexpected return on plan assets, compensation increases, below its carrying amount. The end of the fiscal third quarter isretirement rates, mortality rates, and other factors. Actual results the annual measurement date. To test for goodwill impairment,that differ from the assumptions and changes in assumptions the carrying value of each reporting unit is compared with its fairaffect future expenses and obligations. value. If the carrying value of the goodwill is considered
impaired, a loss is measured as the excess of the reporting unit’sThe pension liabilities, net of pension assets, recognized on thecarrying value over the fair value, with a limit of the goodwillbalance sheet at October 29, 2017, October 30, 2016, andallocated to that reporting unit.November 1, 2015 were $1,073 million, $1,949 million, and
$1,022 million, respectively. The decrease in pension net An estimate of the fair value of the reporting unit is determinedliabilities in 2017 was due primarily to the return on plan assets, through a combination of comparable market values for similarpartially offset by interest on the liabilities and service cost. The businesses and discounted cash flows. These estimates canincrease in pension net liabilities in 2016 was due primarily to change significantly based on such factors as the reportingdecreases in discount rates. The OPEB liabilities, net of OPEB unit’s financial performance, economic conditions, interest rates,assets, at October 29, 2017, October 30, 2016, and November 1, growth rates, pricing, changes in business strategies, and2015 were $5,623 million, $6,065 million, and $5,395 million, competition.respectively. The decrease in OPEB net liabilities in 2017 was due Based on this testing, the company has not identified aprimarily to a contribution to the Voluntary Employees’ reporting unit for which the goodwill was impaired in 2017,Beneficiary Association trust. The increase in OPEB net liabilities 2016, or 2015. A 10 percent decrease in the estimated fair valuein 2016 was due primarily to decreases in discount rates and of the company’s reporting units would have had no impact oninterest on the liabilities (see Note 7). the carrying value of goodwill at the annual measurement dateIn 2016, the company changed the method used to estimate the in 2017.service and interest cost components of the net periodic pension
Allowance for Credit Lossesand postretirement benefits cost. The new method uses the spot The allowance for credit losses represents an estimate of theyield curve approach to estimate the service and interest cost by losses inherent in the company’s receivable portfolio. The levelapplying the specific spot rates along the yield curve used to of the allowance is based on many quantitative and qualitativedetermine the benefit plan obligations to relevant projected cash factors, including historical loss experience by product category,outflows. For 2015, the service and interest cost components portfolio duration, delinquency trends, economic conditions, andwere determined using a single weighted-average discount rate. credit risk quality. The adequacy of the allowance is assessedThe change did not affect the measurement of the total benefit quarterly. Different assumptions or changes in economicplan obligations as the change in service and interest cost conditions would result in changes to the allowance for creditoffsets in the actuarial gains and losses recorded in other losses and the provision for credit losses.comprehensive income.
The total allowance for credit losses at October 29, 2017,The company changed to the new method to provide a more October 30, 2016, and November 1, 2015 was $243 million,precise measure of service and interest cost by improving the $226 million, and $198 million, respectively. The allowancecorrelation between the projected benefit cash flows and the increased in 2017 compared to 2016 due primarily to growth indiscrete spot yield curve rates. The company accounted for this the receivable portfolio, and increased in 2016 compared tochange as a change in estimate prospectively beginning in 2016. 2015 due to higher write-off experience.The effect of hypothetical changes to selected assumptions on The assumptions used in evaluating the company’s exposure tothe company’s major U.S. retirement benefit plans would be as credit losses involve estimates and significant judgment. Thefollows in millions of dollars: historical loss experience on the receivable portfolio represents
one of the key assumptions involved in determining the2018October 29, 2017
allowance for credit losses. Over the last five fiscal years, thisIncrease Increase percent has varied by an average of approximately plus or minus
Percentage (Decrease) (Decrease).07 percent, compared to the average loss experience percent
Assumptions Change PBO/APBO* Expenseduring that period. Holding other assumptions constant, if this
Pension estimated loss experience on the receivable portfolio were toDiscount rate** ................ +/-.5 $ (712)/818 $ (37)/43 increase or decrease .07 percent, the allowance for credit lossesExpected return on assets ... +/-.5 (50)/50
at October 29, 2017 would increase or decrease byOPEB
approximately $24 million.Discount rate** ................ +/-.5 (351)/389 (13)/14Expected return on assets ... +/-.5 (2)/2 Operating Lease Residual ValuesHealth care cost The carrying value of equipment on operating leases is affected
trend rate** ................. +/-1.0 769/(597) 92/(71) by the estimated fair values of the equipment at the end of the* Projected benefit obligation (PBO) for pension plans and accumulated lease (residual values). Upon termination of the lease, the
postretirement benefit obligation (APBO) for OPEB plans.equipment is either purchased by the lessee or sold to a third** Pretax impact on service cost, interest cost, and amortization of gains orparty, in which case the company may record a gain or a loss forlosses.the difference between the estimated residual value and the sale
Goodwill price. The residual values are dependent on current economicGoodwill is not amortized and is tested for impairment annually conditions and are reviewed when events or circumstancesand when events or circumstances change such that it is more necessitate an evaluation. Changes in residual value assumptions
27

28
would affect the amount of depreciation expense and the FINANCIAL INSTRUMENT MARKET RISK INFORMATION
amount of investment in equipment on operating leases. The company is naturally exposed to various interest rate andforeign currency risks. As a result, the company enters intoThe total operating lease residual values at October 29, 2017,derivative transactions to manage certain of these exposuresOctober 30, 2016, and November 1, 2015 were $4,679 million,that arise in the normal course of business and not for the$4,347 million, and $3,603 million, respectively. The changes inpurpose of creating speculative positions or trading. The2017 and 2016 were due primarily to the increasing levels ofcompany’s financial services operations manage the relationshipoperating leases.of the types and amounts of their funding sources to their
Estimates used in determining end of lease market values forreceivable and lease portfolio in an effort to diminish risk due to
equipment on operating leases significantly impact the amountinterest rate and foreign currency fluctuations while responding
and timing of depreciation expense. Hypothetically, if futureto favorable financing opportunities. Accordingly, from time to
market values for this equipment were to decrease 10 percenttime, these operations enter into interest rate swap agreements
from the company’s present estimates, the total impact wouldto manage their interest rate exposure. The company also has
be to increase the company’s annual depreciation for equipmentforeign currency exposures at some of its foreign and domestic
on operating leases by approximately $200 million.operations related to buying, selling, and financing in currencies
Income Taxes other than the functional currencies. The company has enteredThe company’s income tax provision, deferred income tax assets into agreements related to the management of these foreignand liabilities, and liabilities for uncertain tax benefits represent currency transaction risks.the company’s best estimate of current and future income taxes
Interest Rate Riskto be paid. The annual tax rate is based on income tax laws,
Quarterly, the company uses a combination of cash flow modelsstatutory tax rates, taxable income levels, and tax planning
to assess the sensitivity of its financial instruments with interestopportunities available in various jurisdictions where the
rate exposure to changes in market interest rates. The modelscompany operates. These tax laws are complex, and require
calculate the effect of adjusting interest rates as follows: cashsignificant judgment to determine the consolidated provision for
flows for financing receivables are discounted at the currentincome taxes. Changes in tax laws, statutory tax rates, and
prevailing rate for each receivable portfolio, cash flows forestimates of the company’s future taxable income levels could
marketable securities are primarily discounted at the applicableresult in actual realization of deferred taxes being materially
benchmark yield curve plus market credit spreads, cash flows fordifferent from amounts provided for in the consolidated financial
unsecured borrowings are discounted at the applicablestatements.
benchmark yield curve plus market credit spreads for similarlyDeferred income taxes represent temporary differences between rated borrowers, cash flows for securitized borrowings arethe tax and the financial reporting basis of assets and liabilities, discounted at the swap yield curve plus a market credit spreadwhich will result in taxable or deductible amounts in the future. for similarly rated borrowers, and cash flows for interest rateDeferred tax assets also include loss carryforwards and tax swaps are projected and discounted using forward rates fromcredits. These assets are regularly assessed for the likelihood of the swap yield curve at the repricing dates. The net loss in theserecoverability from estimated future taxable income, reversal of financial instruments’ fair values which would be caused bydeferred tax liabilities, and tax planning strategies. To the extent increasing the interest rates by 10 percent from the market ratesthe company determines that it is more likely than not a at October 29, 2017 would have been approximately $4 million.deferred income tax asset will not be realized, a valuation The net loss from increasing the interest rates by 10 percent atallowance is established. The recoverability analysis of the October 30, 2016 would have been approximately $13 million.deferred income tax assets and the related valuation allowances
Foreign Currency Riskrequires significant judgment and relies on estimates.
In the equipment operations, the company’s practice is to hedgeUncertain tax positions are determined based on whether it is significant currency exposures. Worldwide foreign currencymore likely than not the tax positions will be sustained based on exposures are reviewed quarterly. Based on the equipmentthe technical merits of the position. For those positions that operations’ anticipated and committed foreign currency cashmeet the more likely than not criteria, an estimate of the largest inflows, outflows, and hedging policy for the next twelveamount of tax benefit that is greater than 50 percent likely to be months, the company estimates that a hypothetical 10 percentrealized upon ultimate settlement with the related tax authority strengthening of the U.S. dollar relative to other currenciesis recognized. The ultimate resolution of the tax position could through 2018 would decrease the 2018 expected net cashtake many years and result in a payment that is significantly inflows by approximately $78 million. At October 30, 2016, adifferent from the original estimate. hypothetical 10 percent strengthening of the U.S. dollar under
similar assumptions and calculations indicated a potential $77A provision for U.S. income taxes or foreign withholding taxesmillion adverse effect on the 2017 net cash inflows.has not been recorded on undistributed profits of the company’s
non-U.S. subsidiaries that are not currently taxable in the U.S. In the financial services operations, the company’s policy is toand that are determined to be indefinitely reinvested outside the hedge the foreign currency risk if the currency of the borrowingsU.S. If management intentions or U.S. tax law changes in the does not match the currency of the receivable portfolio. As afuture, there may be a significant impact on the provision for result, a hypothetical 10 percent adverse change in the value ofincome taxes in the period the change occurs. For further the U.S. dollar relative to all other foreign currencies would notinformation on income taxes, see Note 8 to the consolidated have a material effect on the financial services cash flows.financial statements.
28

29
MANAGEMENT’S REPORT ON INTERNAL CONTROL OVER the accounting principles used and significant estimates made byFINANCIAL REPORTING management, and evaluating the overall financial statement
presentation. Our audit of internal control over financialThe management of Deere & Company is responsible forreporting included obtaining an understanding of internalestablishing and maintaining adequate internal control overcontrol over financial reporting, assessing the risk that a materialfinancial reporting. Deere & Company’s internal control systemweakness exists, and testing and evaluating the design andwas designed to provide reasonable assurance regarding theoperating effectiveness of internal control based on the assessedpreparation and fair presentation of published financialrisk. Our audits also included performing such other proceduresstatements in accordance with generally accepted accountingas we considered necessary in the circumstances. We believeprinciples.that our audits provide a reasonable basis for our opinions.
All internal control systems, no matter how well designed, haveA company’s internal control over financial reporting is a processinherent limitations. Therefore, even those systems determineddesigned by, or under the supervision of, the company’s principalto be effective can provide only reasonable assurance withexecutive and principal financial officers, or persons performingrespect to financial statement preparation and presentation insimilar functions, and effected by the company’s board ofaccordance with generally accepted accounting principles.directors, management, and other personnel to provide
Management assessed the effectiveness of the Company’s reasonable assurance regarding the reliability of financialinternal control over financial reporting as of October 29, 2017, reporting and the preparation of financial statements forusing the criteria set forth in Internal Control – Integrated external purposes in accordance with generally acceptedFramework (2013) issued by the Committee of Sponsoring accounting principles. A company’s internal control over financialOrganizations of the Treadway Commission. Based on that reporting includes those policies and procedures that (1) pertainassessment, management believes that, as of October 29, 2017, to the maintenance of records that, in reasonable detail,the Company’s internal control over financial reporting was accurately and fairly reflect the transactions and dispositions ofeffective. the assets of the company; (2) provide reasonable assurance thatThe Company’s independent registered public accounting firm transactions are recorded as necessary to permit preparation ofhas issued an audit report on the effectiveness of the Company’s financial statements in accordance with generally acceptedinternal control over financial reporting. This report appears accounting principles, and that receipts and expenditures of thebelow. company are being made only in accordance with authorizations
of management and directors of the company; and (3) provideDecember 18, 2017reasonable assurance regarding prevention or timely detection of
REPORT OF INDEPENDENT unauthorized acquisition, use, or disposition of the company’sREGISTERED PUBLIC ACCOUNTING FIRM assets that could have a material effect on the financialDeere & Company: statements.
We have audited the accompanying consolidated balance sheets Because of the inherent limitations of internal control overof Deere & Company and subsidiaries (the ‘‘Company’’) as of financial reporting, including the possibility of collusion orOctober 29, 2017 and October 30, 2016, and the related improper management override of controls, materialstatements of consolidated income, consolidated comprehensive misstatements due to error or fraud may not be prevented orincome, changes in consolidated stockholders’ equity, and detected on a timely basis. Also, projections of any evaluation ofconsolidated cash flows for each of the three years in the period the effectiveness of the internal control over financial reportingended October 29, 2017. We also have audited the Company’s to future periods are subject to the risk that the controls mayinternal control over financial reporting as of October 29, 2017, become inadequate because of changes in conditions, or thatbased on criteria established in Internal Control – Integrated the degree of compliance with the policies or procedures mayFramework (2013) issued by the Committee of Sponsoring deteriorate.Organizations of the Treadway Commission. The Company’s In our opinion, the consolidated financial statements referred tomanagement is responsible for these financial statements, for above present fairly, in all material respects, the financialmaintaining effective internal control over financial reporting, position of the Company as of October 29, 2017 andand for its assessment of the effectiveness of internal control October 30, 2016, and the results of their operations and theirover financial reporting, included in the accompanying cash flows for each of the three years in the period endedManagement’s Report on Internal Control Over Financial October 29, 2017, in conformity with accounting principlesReporting. Our responsibility is to express an opinion on these generally accepted in the United States of America. Also, in ourfinancial statements and an opinion on the Company’s internal opinion, the Company maintained, in all material respects,control over financial reporting based on our audits. effective internal control over financial reporting as ofWe conducted our audits in accordance with the standards of October 29, 2017, based on the criteria established in Internalthe Public Company Accounting Oversight Board (United States). Control – Integrated Framework (2013) issued by the CommitteeThose standards require that we plan and perform the audit to of Sponsoring Organizations of the Treadway Commission.obtain reasonable assurance about whether the financial DELOITTE & TOUCHE LLPstatements are free of material misstatement and whether Chicago, Illinoiseffective internal control over financial reporting was maintained
December 18, 2017in all material respects. Our audits of the financial statementsincluded examining, on a test basis, evidence supporting theamounts and disclosures in the financial statements, assessing
29

30
DEERE & COMPANYSTATEMENT OF CONSOLIDATED INCOME
For the Years Ended October 29, 2017, October 30, 2016, and November 1, 2015
(In millions of dollars)
2017 2016 2015
Net Sales and Revenues
Net sales .................................................................................................................................. $25,885.1 $23,387.3 $25,775.2Finance and interest income......................................................................................................... 2,731.5 2,511.2 2,381.1Other income ............................................................................................................................ 1,121.1 745.5 706.5
Total ................................................................................................................................ 29,737.7 26,644.0 28,862.8
Costs and Expenses
Cost of sales ............................................................................................................................. 19,933.5 18,248.9 20,143.2Research and development expenses.............................................................................................. 1,367.7 1,389.1 1,425.1Selling, administrative and general expenses .................................................................................... 3,066.6 2,763.7 2,873.3Interest expense ........................................................................................................................ 899.5 763.7 680.0Other operating expenses ............................................................................................................ 1,316.6 1,254.6 961.1
Total ................................................................................................................................ 26,583.9 24,420.0 26,082.7
Income of Consolidated Group before Income Taxes ...................................................................... 3,153.8 2,224.0 2,780.1Provision for income taxes ........................................................................................................... 971.1 700.1 840.1
Income of Consolidated Group .................................................................................................... 2,182.7 1,523.9 1,940.0Equity in income (loss) of unconsolidated affiliates............................................................................ (23.5) (2.4) .9
Net Income .............................................................................................................................. 2,159.2 1,521.5 1,940.9Less: Net income (loss) attributable to noncontrolling interests ..................................................... .1 (2.4) .9
Net Income Attributable to Deere & Company ............................................................................... $ 2,159.1 $ 1,523.9 $ 1,940.0
Per Share Data
Basic ....................................................................................................................................... $ 6.76 $ 4.83 $ 5.81Diluted .................................................................................................................................... $ 6.68 $ 4.81 $ 5.77Dividends declared ..................................................................................................................... $ 2.40 $ 2.40 $ 2.40
Average Shares Outstanding
Basic ....................................................................................................................................... 319.5 315.2 333.6Diluted .................................................................................................................................... 323.3 316.6 336.0
The notes to consolidated financial statements are an integral part of this statement.
30
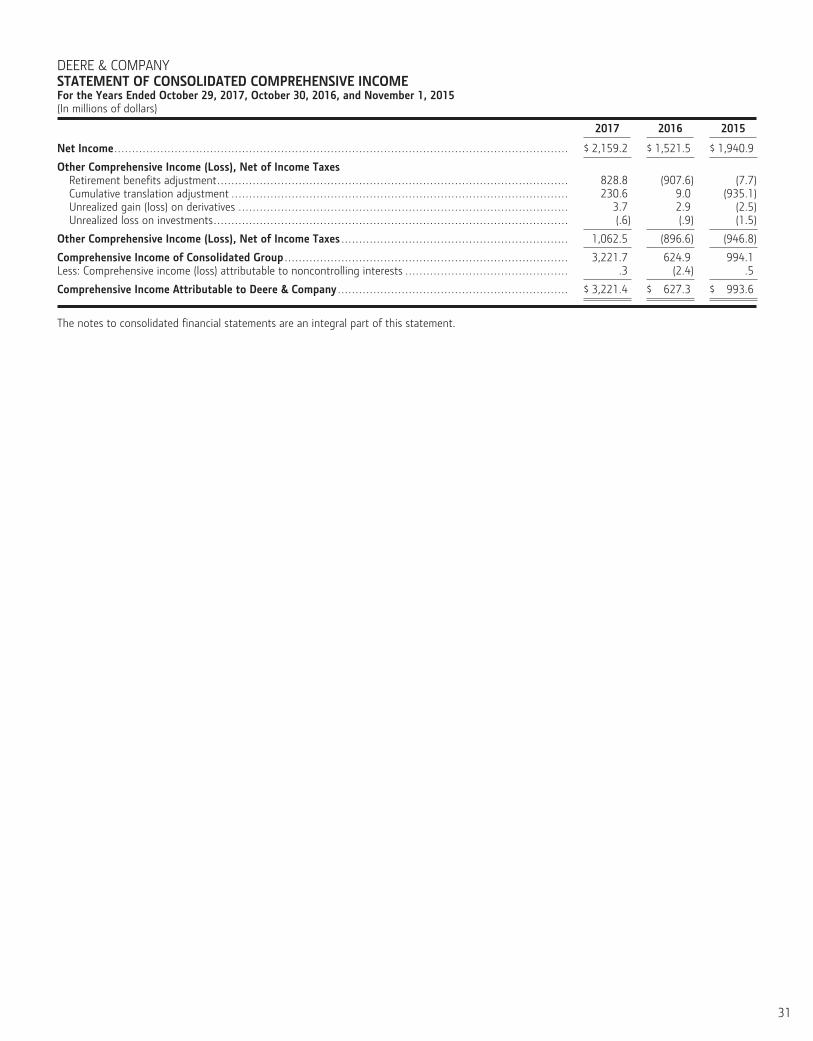
31
DEERE & COMPANYSTATEMENT OF CONSOLIDATED COMPREHENSIVE INCOME
For the Years Ended October 29, 2017, October 30, 2016, and November 1, 2015
(In millions of dollars)
2017 2016 2015
Net Income................................................................................................................................ $ 2,159.2 $ 1,521.5 $ 1,940.9
Other Comprehensive Income (Loss), Net of Income Taxes
Retirement benefits adjustment................................................................................................... 828.8 (907.6) (7.7)Cumulative translation adjustment ............................................................................................... 230.6 9.0 (935.1)Unrealized gain (loss) on derivatives ............................................................................................. 3.7 2.9 (2.5)Unrealized loss on investments.................................................................................................... (.6) (.9) (1.5)
Other Comprehensive Income (Loss), Net of Income Taxes ................................................................ 1,062.5 (896.6) (946.8)
Comprehensive Income of Consolidated Group ................................................................................ 3,221.7 624.9 994.1Less: Comprehensive income (loss) attributable to noncontrolling interests .............................................. .3 (2.4) .5
Comprehensive Income Attributable to Deere & Company ................................................................. $ 3,221.4 $ 627.3 $ 993.6
The notes to consolidated financial statements are an integral part of this statement.
31

32
DEERE & COMPANYCONSOLIDATED BALANCE SHEET
As of October 29, 2017 and October 30, 2016
(In millions of dollars except per share amounts)
2017 2016
ASSETS
Cash and cash equivalents ........................................................................................................................... $ 9,334.9 $ 4,335.8Marketable securities .................................................................................................................................. 451.6 453.5Receivables from unconsolidated affiliates ....................................................................................................... 35.9 16.5Trade accounts and notes receivable – net ...................................................................................................... 3,924.9 3,011.3Financing receivables – net .......................................................................................................................... 25,104.1 23,702.3Financing receivables securitized – net ........................................................................................................... 4,158.8 5,126.5Other receivables ....................................................................................................................................... 1,200.0 1,018.5Equipment on operating leases – net ............................................................................................................. 6,593.7 5,901.5Inventories ............................................................................................................................................... 3,904.1 3,340.5Property and equipment – net ...................................................................................................................... 5,067.7 5,170.6Investments in unconsolidated affiliates .......................................................................................................... 182.5 232.6Goodwill .................................................................................................................................................. 1,033.3 815.7Other intangible assets – net........................................................................................................................ 218.0 104.1Retirement benefits .................................................................................................................................... 538.2 93.6Deferred income taxes ................................................................................................................................ 2,415.0 2,964.4Other assets ............................................................................................................................................. 1,623.6 1,631.1
Total Assets ............................................................................................................................................. $ 65,786.3 $ 57,918.5
LIABILITIES AND STOCKHOLDERS’ EQUITY
LIABILITIES
Short-term borrowings ................................................................................................................................ $ 10,035.3 $ 6,910.7Short-term securitization borrowings.............................................................................................................. 4,118.7 4,997.8Payables to unconsolidated affiliates .............................................................................................................. 121.9 81.6Accounts payable and accrued expenses ......................................................................................................... 8,417.0 7,240.1Deferred income taxes ................................................................................................................................ 209.7 166.0Long-term borrowings ................................................................................................................................ 25,891.3 23,703.0Retirement benefits and other liabilities .......................................................................................................... 7,417.9 8,274.5
Total liabilities .................................................................................................................................... 56,211.8 51,373.7
Commitments and contingencies (Note 22)Redeemable noncontrolling interest (Note 4) ................................................................................................... 14.0 14.0
STOCKHOLDERS’ EQUITY
Common stock, $1 par value (authorized – 1,200,000,000 shares;issued – 536,431,204 shares in 2017 and 2016), at paid-in amount.................................................................. 4,280.5 3,911.8
Common stock in treasury, 214,589,902 shares in 2017 and 221,663,380 shares in 2016, at cost .............................. (15,460.8) (15,677.1)Retained earnings ...................................................................................................................................... 25,301.3 23,911.3Accumulated other comprehensive income (loss)............................................................................................... (4,563.7) (5,626.0)
Total Deere & Company stockholders’ equity.................................................................................................... 9,557.3 6,520.0Noncontrolling interests .............................................................................................................................. 3.2 10.8
Total stockholders’ equity......................................................................................................................... 9,560.5 6,530.8
Total Liabilities and Stockholders’ Equity ..................................................................................................... $ 65,786.3 $ 57,918.5
The notes to consolidated financial statements are an integral part of this statement.
32

33
DEERE & COMPANYSTATEMENT OF CONSOLIDATED CASH FLOWS
For the Years Ended October 29, 2017, October 30, 2016, and November 1, 2015
(In millions of dollars)
2017 2016 2015
Cash Flows from Operating Activities
Net income ........................................................................................................................... $ 2,159.2 $ 1,521.5 $ 1,940.9Adjustments to reconcile net income to net cash provided by operating activities:
Provision for credit losses ..................................................................................................... 98.3 94.3 55.4Provision for depreciation and amortization .............................................................................. 1,715.5 1,559.8 1,382.4Impairment charges ............................................................................................................. 39.8 85.1 34.8Share-based compensation expense ........................................................................................ 68.1 70.6 66.1Gain on sale of unconsolidated affiliates and investments ............................................................ (375.1) (74.5)Undistributed earnings of unconsolidated affiliates .................................................................... (14.4) (1.9) (1.0)Provision (credit) for deferred income taxes .............................................................................. 100.1 282.7 (18.4)Changes in assets and liabilities:
Trade, notes and financing receivables related to sales ............................................................ (838.9) 335.2 811.6Insurance receivables ........................................................................................................ 333.4Inventories ..................................................................................................................... (1,305.3) (106.1) (691.4)Accounts payable and accrued expenses ............................................................................... 968.0 (155.2) (503.6)Accrued income taxes payable/receivable .............................................................................. (84.2) 7.0 (119.1)Retirement benefits .......................................................................................................... (31.9) 238.6 427.5
Other................................................................................................................................ (299.4) (87.4) 40.2
Net cash provided by operating activities ........................................................................... 2,199.8 3,769.7 3,758.8
Cash Flows from Investing Activities
Collections of receivables (excluding receivables related to sales) ...................................................... 14,671.1 14,611.4 14,919.7Proceeds from maturities and sales of marketable securities ............................................................ 404.2 169.4 860.7Proceeds from sales of equipment on operating leases ................................................................... 1,440.8 1,256.2 1,049.4Proceeds from sales of businesses and unconsolidated affiliates, net of cash sold ................................ 113.9 81.1 149.2Cost of receivables acquired (excluding receivables related to sales)................................................... (15,221.8) (13,954.5) (14,996.5)Purchases of marketable securities ............................................................................................. (118.0) (171.2) (154.9)Purchases of property and equipment ......................................................................................... (594.9) (644.4) (694.0)Cost of equipment on operating leases acquired ........................................................................... (1,997.4) (2,310.7) (2,132.1)Acquisitions of businesses, net of cash acquired............................................................................ (284.2) (198.5)Other ................................................................................................................................... (58.0) (16.0) (60.2)
Net cash used for investing activities ................................................................................ (1,644.3) (1,177.2) (1,058.7)
Cash Flows from Financing Activities
Increase (decrease) in total short-term borrowings......................................................................... 1,310.6 (1,213.6) 501.6Proceeds from long-term borrowings .......................................................................................... 8,702.2 5,070.7 5,711.0Payments of long-term borrowings............................................................................................. (5,397.0) (5,267.6) (4,863.2)Proceeds from issuance of common stock.................................................................................... 528.7 36.0 172.1Repurchases of common stock .................................................................................................. (6.2) (205.4) (2,770.7)Dividends paid ....................................................................................................................... (764.0) (761.3) (816.3)Other ................................................................................................................................... (87.8) (64.7) (72.1)
Net cash provided by (used for) financing activities .............................................................. 4,286.5 (2,405.9) (2,137.6)
Effect of Exchange Rate Changes on Cash and Cash Equivalents ................................................... 157.1 (13.0) (187.3)
Net Increase in Cash and Cash Equivalents ................................................................................ 4,999.1 173.6 375.2Cash and Cash Equivalents at Beginning of Year ........................................................................ 4,335.8 4,162.2 3,787.0
Cash and Cash Equivalents at End of Year ................................................................................. $ 9,334.9 $ 4,335.8 $ 4,162.2
The notes to consolidated financial statements are an integral part of this statement.
33

34
DEERE & COMPANYSTATEMENT OF CHANGES IN CONSOLIDATED STOCKHOLDERS’ EQUITY
For the Years Ended November 1, 2015, October 30, 2016, and October 29, 2017
(In millions of dollars)
Total Stockholders’ Equity
Deere & Company Stockholders
Accumulated
Total Other Redeemable
Stockholders’ Common Treasury Retained Comprehensive Noncontrolling Noncontrolling
Equity Stock Stock Earnings Income (Loss) Interests Interest
Balance November 2, 2014 ............. $ 9,065.5 $3,675.4 $(12,834.2) $22,004.4 $ (3,783.0) $ 2.9
Net income ................................... 1,940.9 1,940.0 .9Other comprehensive loss ................ (946.8) (946.4) (.4)Repurchases of common stock .......... (2,770.7) (2,770.7)Treasury shares reissued .................. 107.3 107.3Dividends declared ......................... (800.8) (799.5) (1.3)Stock options and other .................. 162.2 150.2 (.1) 12.1
Balance November 1, 2015 ............. 6,757.6 3,825.6 (15,497.6) 23,144.8 (4,729.4) 14.2
Net income (loss) ........................... 1,521.5 1,523.9 (2.4)Other comprehensive loss ................ (896.6) (896.6)Repurchases of common stock .......... (205.4) (205.4)Treasury shares reissued .................. 25.9 25.9Dividends declared ......................... (758.0) (757.1) (.9)Acquisition (Note 4) ........................ $ 14.0Stock options and other .................. 85.8 86.2 (.3) (.1)
Balance October 30, 2016 .............. 6,530.8 3,911.8 (15,677.1) 23,911.3 (5,626.0) 10.8 14.0
Net income ................................... 2,159.2 2,159.1 .1Other comprehensive income............ 1,062.5 1,062.3 .2Repurchases of common stock .......... (6.2) (6.2)Treasury shares reissued .................. 222.5 222.5Dividends declared ......................... (770.4) (769.2) (1.2)Stock options and other .................. 362.1 368.7 .1 (6.7)
Balance October 29, 2017 .............. $ 9,560.5 $4,280.5 $(15,460.8) $25,301.3 $ (4,563.7) $ 3.2 $ 14.0
The notes to consolidated financial statements are an integral part of this statement.
34

35
NOTES TO CONSOLIDATED FINANCIAL STATEMENTS
1. ORGANIZATION AND CONSOLIDATION sale is recorded by the company, no significant uncertainty existssurrounding the purchaser’s obligation to pay. No right of return
Structure of Operations exists on sales of equipment. Service parts and certainThe information in the notes and related commentary are attachments returns are estimable and accrued at the time a salepresented in a format that includes data grouped as follows: is recognized. The company makes appropriate provisions basedEquipment Operations – Includes the company’s agriculture and on experience for costs such as doubtful receivables, salesturf operations and construction and forestry operations with incentives, and product warranty.financial services reflected on the equity basis. Financing revenue is recorded over the lives of relatedFinancial Services – Includes primarily the company’s financing receivables using the interest method. Extended warrantyoperations. premiums recorded in other income are generally recognized in
proportion to the costs expected to be incurred over theConsolidated – Represents the consolidation of the equipmentcontract period. Deferred costs on the origination of financingoperations and financial services. References to ‘‘Deere &receivables are recognized as a reduction in finance revenue overCompany’’ or ‘‘the company’’ refer to the entire enterprise.the expected lives of the receivables using the interest method.
Principles of Consolidation Income and deferred costs on the origination of operating leasesThe consolidated financial statements represent primarily the are recognized on a straight-line basis over the scheduled leaseconsolidation of all companies in which Deere & Company has a terms in finance revenue.controlling interest. Certain variable interest entities (VIEs) are
Sales Incentivesconsolidated since the company has both the power to directAt the time a sale is recognized, the company records anthe activities that most significantly impact the VIEs’ economicestimate of the future sales incentive costs for allowances andperformance and the obligation to absorb losses or the right tofinancing programs that will be due when a dealer sells thereceive benefits that could potentially be significant to the VIEs.equipment to a retail customer. The estimate is based onDeere & Company records its investment in each unconsolidatedhistorical data, announced incentive programs, field inventoryaffiliated company (generally 20 to 50 percent ownership) at itslevels, and retail sales volumes.related equity in the net assets of such affiliate (see Note 10).
Other investments (less than 20 percent ownership) are recorded Product Warranties
at cost. At the time a sale is recognized, the company records theestimated future warranty costs. These costs are usually
Fiscal Yearestimated based on historical warranty claims and considerationThe company uses a 52/53 week fiscal year ending on the lastof current quality developments (see Note 22).Sunday in the reporting period. The fiscal year ends for 2017,
2016, and 2015 were October 29, 2017, October 30, 2016, and Sales Taxes
November 1, 2015, respectively. All fiscal years contained 52 The company collects and remits taxes assessed by differentweeks. governmental authorities that are both imposed on and
concurrent with revenue producing transactions between theVariable Interest Entities
company and its customers. These taxes may include sales, use,See Note 13 for VIEs related to securitization of financingvalue-added, and some excise taxes. The company reports thereceivables.collection of these taxes on a net basis (excluded from
2. SUMMARY OF SIGNIFICANT ACCOUNTING POLICIES revenues).The following are significant accounting policies in addition to
Shipping and Handling Coststhose included in other notes to the consolidated financial Shipping and handling costs related to the sales of thestatements. company’s equipment are included in cost of sales.Use of Estimates in Financial Statements
Advertising CostsThe preparation of financial statements in conformity with Advertising costs are charged to expense as incurred. Thisaccounting principles generally accepted in the U.S. requires expense was $169 million in 2017, $169 million in 2016, andmanagement to make estimates and assumptions that affect the $157 million in 2015.reported amounts and related disclosures. Actual results could
Depreciation and Amortizationdiffer from those estimates.Property and equipment, capitalized software, and other
Revenue Recognition intangible assets are generally stated at cost less accumulatedSales of equipment and service parts are recorded when the depreciation or amortization. These assets are depreciated oversales price is determinable and the risks and rewards of their estimated useful lives generally using the straight-lineownership are transferred to independent parties based on the method. Equipment on operating leases is depreciated over thesales agreements in effect. In the U.S. and most international terms of the leases using the straight-line method. Property andlocations, this transfer occurs primarily when goods are shipped. equipment expenditures for new and revised products, increasedIn Canada and some other international locations, certain goods capacity, and the replacement or major renewal of significantare shipped to dealers on a consignment basis under which the items are capitalized. Expenditures for maintenance, repairs, andrisks and rewards of ownership are not transferred to the dealer. minor renewals are generally charged to expense as incurred.Accordingly, in these locations, sales are not recorded until aretail customer has purchased the goods. In all cases, when a
35

36
Securitization of Receivables recorded in other comprehensive income and reclassified to theCertain financing receivables are periodically transferred to income statement when the effects of the item being hedgedspecial purpose entities (SPEs) in securitization transactions (see are recognized in the income statement. Changes in the fairNote 13). These securitizations qualify as collateral for secured value of derivatives that are designated and effective as fairborrowings and no gains or losses are recognized at the time of value hedges are recognized currently in net income. Thesesecuritization. The receivables remain on the balance sheet and changes are offset in net income to the extent the hedge wasare classified as ‘‘Financing receivables securitized – net.’’ The effective by fair value changes related to the risk being hedgedcompany recognizes finance income over the lives of these on the hedged item. Changes in the fair value of undesignatedreceivables using the interest method. hedges are recognized currently in the income statement. All
ineffective changes in derivative fair values are recognizedReceivables and Allowances
currently in net income.All financing and trade receivables are reported on the balancesheet at outstanding principal adjusted for any charge-offs, the All designated hedges are formally documented as to theallowance for credit losses, and any deferred fees or costs on relationship with the hedged item as well as the risk-originated financing receivables. Allowances for credit losses are management strategy. Both at inception and on an ongoingmaintained in amounts considered to be appropriate in relation basis the hedging instrument is assessed as to its effectiveness.to the receivables outstanding based on collection experience, If and when a derivative is determined not to be highly effectiveeconomic conditions, and credit risk quality. Receivables are as a hedge, the underlying hedged transaction is no longer likelywritten-off to the allowance when the account is considered to occur, the hedge designation is removed, or the derivative isuncollectible. terminated, the hedge accounting discussed above is
discontinued (see Note 27).Impairment of Long-Lived Assets, Goodwill, and Other
Intangible Assets Foreign Currency Translation
The company evaluates the carrying value of long-lived assets The functional currencies for most of the company’s foreign(including equipment on operating leases, property and operations are their respective local currencies. The assets andequipment, goodwill, and other intangible assets) when events liabilities of these operations are translated into U.S. dollars ator circumstances warrant such a review. Goodwill and intangible the end of the period exchange rates. The revenues andassets with indefinite lives are tested for impairment annually at expenses are translated at weighted-average rates for thethe end of the third quarter of each fiscal year, and more often period. The gains or losses from these translations are recordedif events or circumstances indicate a reduction in the fair value in other comprehensive income. Gains or losses frombelow the carrying value. Goodwill is allocated and reviewed for transactions denominated in a currency other than theimpairment by reporting units, which consist primarily of the functional currency of the subsidiary involved and foreignoperating segments and certain other reporting units. Goodwill exchange forward contracts are included in net income. Theis allocated to the reporting unit in which the business that pretax net gain (loss) for foreign exchange in 2017, 2016, andcreated the goodwill resides. To test for goodwill impairment, 2015 was $(62) million, $(38) million, and $22 million,the carrying value of each reporting unit is compared with its fair respectively.value. If the carrying value of the goodwill is considered
3. NEW ACCOUNTING STANDARDSimpaired, the impairment is measured as the excess of the
New Accounting Standards Adoptedreporting unit’s carrying value over the fair value, with a limit ofIn the first quarter of 2017, the company adopted Financialthe goodwill allocated to that reporting unit. If the carryingAccounting Standards Board (FASB) Accounting Standardsvalue of the long-lived asset is considered impaired, a loss isUpdate (ASU) No. 2015-03, Simplifying the Presentation of Debtrecognized based on the amount by which the carrying valueIssuance Costs, which amends Accounting Standards Codificationexceeds the fair value of the asset (see Notes 5 and 26).(ASC) 835-30, Interest – Imputation of Interest. This ASU
Derivative Financial Instrumentsrequires that debt issuance costs related to borrowings beIt is the company’s policy that derivative transactions arepresented in the balance sheet as a direct deduction from theexecuted only to manage exposures arising in the normal coursecarrying amount of the borrowing. As required, the presentationof business and not for the purpose of creating speculativeand disclosure requirements were adopted through retrospectivepositions or trading. The company’s financial services manageapplication with the consolidated balance sheet and relatedthe relationship of the types and amounts of their fundingnotes in prior periods adjusted for a consistent presentation.sources to their receivable and lease portfolio in an effort toDebt issuance costs of $63 million at October 30, 2016 werediminish risk due to interest rate and foreign currencyreclassified from other assets to borrowings in the consolidatedfluctuations, while responding to favorable financingbalance sheet.opportunities. The company also has foreign currency exposures
at some of its foreign and domestic operations related to In the third quarter of 2017, the company early adopted ASU No.buying, selling, and financing in currencies other than the 2016-09, Improvements to Employee Share-Based Paymentfunctional currencies. Accounting, which amends ASC 718, Compensation – Stock
Compensation. This ASU changes the treatment of share basedAll derivatives are recorded at fair value on the balance sheet.payment transactions by recognizing the impact of excess taxCash collateral received or paid is not offset against thebenefits or deficiencies related to exercised or vested awards inderivative fair values on the balance sheet. Each derivative isincome tax expense in the period of exercise or vesting, insteaddesignated as either a cash flow hedge or a fair value hedge orof common stock. As required, this change was reflected for allremains undesignated. Changes in the fair value of derivativesperiods in fiscal year 2017. Net income increased in fiscal yearthat are designated and effective as cash flow hedges are
36

37
2017 by approximately $30 million. The ASU also modified the arrangements. The company plans to adopt the ASU effectivepresentation of excess tax benefits in the statement of the first quarter of fiscal year 2019 using a modifiedconsolidated cash flows by including that amount with other retrospective method. The company’s evaluation of the ASU isincome tax cash flows as an operating activity and no longer largely complete, with the exception of the Wirtgen acquisitionpresented separately as a financing activity. This change was (see Note 30). The ASU requires that a gross asset and liabilityrecognized through a retrospective application that increased rather than a net liability be recorded for the value of estimatednet cash flow provided by operating activities by approximately service parts returns and the refund liability. The gross asset will$30 million, $5 million, and $19 million in fiscal years 2017, be recorded in other assets and the gross liability will be2016, and 2015. The ASU also requires that cash paid by an recorded in accounts payable and accrued expenses. In addition,employer when directly withholding shares for tax withholding certain revenue disclosures will be expanded. At this point of thepurposes should be presented as a financing activity in the evaluation, the company has not identified an item that will havestatement of consolidated cash flows, which is the company’s a material effect on the company’s consolidated financialexisting presentation. The company will continue to recognize statements. The company continues to evaluate the ASU’sthe impact of share-based payment award forfeitures as the potential effects on the consolidated financial statements.forfeitures occur. In January 2016, the FASB issued ASU No. 2016-01, RecognitionIn the third quarter of 2017, the company early adopted ASU No. and Measurement of Financial Assets and Financial Liabilities,2017-04, Simplifying the Test for Goodwill Impairment, which which amends ASC 825-10, Financial Instruments – Overall. Thisamends ASC 350, Intangibles – Goodwill and Other. This ASU ASU changes the treatment for available-for-sale equitysimplifies the goodwill impairment test by removing the investments by recognizing unrealized fair value changes directlyrequirement to perform a hypothetical purchase price allocation in net income and no longer in other comprehensive income.when the carrying value of a reporting unit exceeds its fair value. The effective date will be the first quarter of fiscal year 2019.This ASU states the impairment is measured as the excess of the Early adoption of the provisions affecting the company is notreporting unit’s carrying value over the fair value, with a limit of permitted. The ASU will be adopted with a cumulative-effectthe goodwill allocated to that reporting unit. The adoption did adjustment to the balance sheet in the year of adoption. Thenot have a material effect on the company’s consolidated company is evaluating the potential effects on the consolidatedfinancial statement. financial statements.
The company also adopted the following standards in the first In February 2016, the FASB issued ASU No. 2016-02, Leasesquarter of 2017, none of which had a material effect on the (Topic 842), which supersedes ASC 840, Leases. The ASU’scompany’s consolidated financial statements: primary change is the requirement for lessee entities to
recognize a lease liability for payments and a right of use assetAccounting Standard Update during the term of operating lease arrangements. The ASU does
not significantly change the lessee’s recognition, measurement,2014-12 – Accounting for Share-Based Payments When the Terms ofand presentation of expenses and cash flows from the previousan Award Provide That a Performance Target Could Be Achieved after
the Requisite Service Period, which amends ASC 718, Compensation – accounting standard. Lessors’ accounting under the ASC isStock Compensation largely unchanged from the previous accounting standard.
2015-05 – Customer’s Accounting for Fees Paid in a Cloud Computing Lessees and lessors will use a modified retrospective transitionArrangement, which amends ASC 350-40, Intangibles – Goodwill and approach. The effective date will be the first quarter of fiscalOther – Internal-Use Software
year 2020 with early adoption permitted. The company is2015-11 – Simplifying the Measurement of Inventory, which amends
evaluating the potential effects on the consolidated financialASC 330, Inventorystatements.2015-15 – Presentation and Subsequent Measurement of Debt
Issuance Costs Associated with Line-of-Credit Arrangements, which In March 2016, the FASB issued ASU No. 2016-07, Simplifyingamends ASC 835-30, Interest – Imputation of Interest the Transition to the Equity Method of Accounting, which
amends ASC 323, Investments – Equity Method and JointNew Accounting Standards to be Adopted
Ventures. This ASU eliminates the requirement to retroactivelyIn May 2014, the FASB issued ASU No. 2014-09, Revenue from
restate the investment, results of operations, and retainedContracts with Customers (Topic 606), which supersedes the
earnings on a step by step basis when an investment qualifiesrevenue recognition requirements in ASC 605, Revenue
for use of the equity method as a result of an increase inRecognition. This ASU is based on the principle that revenue is
ownership or degree of influence. The effective date will be therecognized to depict the transfer of goods or services to
first quarter of fiscal year 2018, with early adoption permitted,customers in an amount that reflects the consideration to which
and will be adopted prospectively. The adoption will not have athe entity expects to be entitled in exchange for those goods or
material effect on the company’s consolidated financialservices. The ASU also requires additional disclosure about the
statements.nature, amount, timing, and uncertainty of revenue. In August
In June 2016, the FASB issued ASU No. 2016-13, Measurement2015, the FASB amended the effective date to be the firstof Credit Losses on Financial Instruments, which establishesquarter of fiscal year 2019 with early adoption permitted in theASC 326, Financial Instruments – Credit Losses. The ASU revisesfirst quarter of fiscal year 2018. The FASB issued severalthe measurement of credit losses for financial assets measuredamendments clarifying various aspects of the ASU, includingat amortized cost from an incurred loss methodology to anrevenue transactions that involve a third party, goods or services
that are immaterial in the context of the contract, and licensing
37

38
expected loss methodology. The ASU affects trade receivables, on a prospective basis for the capitalization of only the servicedebt securities, net investment in leases, and most other cost. The effective date is fiscal year 2019, with early adoptionfinancial assets that represent a right to receive cash. Additional permitted. The company will adopt the ASU in the first quarter
of fiscal year 2018. If adopted in fiscal year 2017, operatingdisclosures about significant estimates and credit quality are alsoprofit would have increased by approximately $31 million. Therequired. The effective date will be the first quarter of fiscal yearadoption is estimated to improve operating profit in fiscal year2021, with early adoption permitted beginning in fiscal year2018 by approximately $25 million.2020. The ASU will be adopted using a modified-retrospective
approach. The company is evaluating the potential effects on In March 2017, the FASB issued ASU No. 2017-08, Premiumthe consolidated financial statements. Amortization on Purchased Callable Debt Securities, which
amends ASC 310-20, Receivables – Nonrefundable Fees andIn August 2016, the FASB issued ASU No. 2016-15, ClassificationOther Costs. This ASU reduces the amortization period forof Certain Cash Receipts and Cash Payments, which amendscertain callable debt securities held at a premium to the earliestASC 230, Statement of Cash Flows. This ASU provides guidancecall date. The treatment of securities held at a discount ison the statement of cash flows presentation of certainunchanged. The effective date is the first quarter of fiscal yeartransactions where diversity in practice exists. The effective date2020, with early adoption permitted. The adoption will not havewill be the first quarter of fiscal year 2019, with early adoptiona material effect on the company’s consolidated financialpermitted. The ASU will be adopted using a retrospectivestatements.transition approach. The adoption will not have a material effect
on the company’s consolidated financial statements. In May 2017, the FASB issued ASU No. 2017-09, Scope ofModification Accounting, which amends ASC 718,In October 2016, the FASB issued ASU No. 2016-16, Intra-EntityCompensation – Stock Compensation. This ASU providesTransfers of Assets Other Than Inventory, which amendsguidance about which changes to the terms of a share-basedASC 740, Income Taxes. This ASU requires that the income taxpayment award should be accounted for as a modification. Aconsequences of an intra-entity asset transfer other thanchange to an award should be accounted for as a modificationinventory are recognized at the time of the transfer. Theunless the fair value of the modified award is the same as theeffective date will be the first quarter of fiscal year 2019, withoriginal award, the vesting conditions do not change, and theearly adoption permitted. The ASU will be adopted using aclassification as an equity or liability instrument does notmodified-retrospective transition approach. The adoption willchange. The ASU will be adopted on a prospective basis. Thenot have a material effect on the company’s consolidatedeffective date is the first quarter of fiscal year 2019, with earlyfinancial statements.adoption permitted. The adoption will not have a material effect
In November 2016, the FASB issued ASU No. 2016-18, Restrictedon the company’s consolidated financial statements.
Cash, which amends ASC 230, Statement of Cash Flows. ThisIn August 2017, the FASB issued ASU No. 2017-12, TargetedASU requires that a statement of cash flows explain the changeImprovements to Accounting for Hedging Activities, whichduring the reporting period in the total of cash, cashamends ASC 815, Derivatives and Hedging. The purpose of thisequivalents, and restricted cash or restricted cash equivalents.ASU is to better align a company’s risk management activitiesThe effective date will be the first quarter of fiscal year 2019,and financial reporting for hedging relationships, simplify thewith early adoption permitted, and will be adopted using ahedge accounting requirements, and improve the disclosures ofretrospective transition approach. The adoption will not have ahedging arrangements. The effective date is fiscal year 2020,material effect on the company’s consolidated financialwith early adoption permitted. The company is evaluating thestatements.potential effects on the consolidated financial statements.
In January 2017, the FASB issued ASU No. 2017-01, Clarifying4. ACQUISITIONS AND DISPOSITIONSthe Definition of a Business, which amends ASC 805, Business
Combinations. This ASU provides further guidance on the In September 2017, the company acquired Blue River Technologydefinition of a business to determine whether transactions (Blue River), which is based in Sunnyvale, California for anshould be accounted for as acquisitions of assets or businesses. acquisition cost of approximately $284 million, net of cashThe effective date will be the first quarter of fiscal year 2019, acquired of $4 million and $21 million funded to escrow forwith early adoption permitted in certain cases. The ASU will be post-acquisition expenses. Blue River has designed andadopted on a prospective basis and will not have a material integrated computer vision and machine learning technology toeffect on the company’s consolidated financial statements. optimize the use of farm inputs. Machine learning technologies
could eventually be applied to a wide range of the company’sIn March 2017, the FASB issued ASU No. 2017-07, Improvingproducts. The preliminary fair values assigned to the assets andthe Presentation of Net Periodic Pension Cost and Net Periodicliabilities related to the acquired entity were approximately $1Postretirement Benefit Cost, which amends ASC 715,million of trade receivables, $2 million of property andCompensation – Retirement Benefits. This ASU requires thatequipment, $193 million of goodwill, $125 million of identifiableemployers report only the service cost component of the totalintangible assets, $1 million of accounts payable and accrueddefined benefit pension and postretirement benefit cost in theexpenses, and $36 million of deferred tax liabilities. Thesame income statement lines as compensation for theidentifiable intangibles were primarily related to in-processparticipating employees. The other components of these benefitresearch and development, which will not be amortized until thecosts are reported outside of income from operations. Inresearch and development efforts are complete or end. Theaddition, only the service cost component of the benefit costs isgoodwill is not expected to be deducted for tax purposes. Blueeligible for capitalization. The ASU will be adopted on aRiver is included in the company’s agriculture and turf operatingretrospective basis for the presentation of the benefit costs andsegment.
38

39
In March 2016, the company acquired an 80 percent interest in 5. SPECIAL ITEMS
Hagie Manufacturing Company, LLC, the U.S. market leader inImpairmentshigh-clearance sprayers located in Clarion, Iowa, for a cost ofIn the fourth quarter of 2017, the company recorded a non-cashapproximately $53 million, net of cash acquired of $3 million.charge of $40 million pretax in equity in loss of unconsolidatedThe fair values assigned to the assets and liabilities related toaffiliates for an other than temporary decline in value of anthe acquired entity were approximately $2 million of tradeinvestment in an international construction equipmentreceivables, $33 million of inventories, $17 million of propertymanufacturer with a $14 million income tax benefit recorded inand equipment, $33 million of goodwill, $22 million ofthe provision for income taxes (see Note 26).identifiable intangible assets, $3 million of other assets, and $43In the fourth quarter of 2016, the company recorded a non-cashmillion of accounts payable and accrued expenses, with a $14charge in cost of sales for the impairment of long-lived assets ofmillion redeemable noncontrolling interest. The identifiable$13 million pretax and after-tax. The assets are part of theintangibles were primarily related to technology, trade name andcompany’s construction and forestry operations in China. Thecustomer relationships, which have a weighted averageimpairment is the result of a decline in forecasted financialamortization period of eight years. The goodwill is deductible forperformance that indicated it was probable the future cash flowstax purposes. If certain events occur, the minority interest holderwould not cover the carrying amount of assets used tohas the right to exercise a put option that would require themanufacture construction equipment in that country. Incompany to purchase the holder’s membership interest. Theaddition, the company recorded a non-cash charge of $12company also has a call option exercisable after a certain periodmillion pretax and after-tax, in equity in loss of unconsolidatedof time. The put and call options cannot be separated from theaffiliates for an other than temporary decline in value of annoncontrolling interest. Due to the redemption features, theinvestment in a construction equipment joint venture in Brazilminority interest holder’s value is classified as a redeemable(see Note 26).noncontrolling interest in the company’s consolidated balance
sheet. In 2016, the company recorded non-cash charges in otheroperating expenses of approximately $31 million pretax for theIn February 2016, the company acquired Monosem for a cost ofimpairment of equipment on operating leases and approximatelyapproximately $146 million, net of cash acquired of $20 million.$29 million pretax on matured operating lease inventoryMonosem, with four facilities in France and two in the U.S., isrecorded in other assets. The impairment was the result of lowerthe European market leader in precision planters. The fair valuesestimated values of used agriculture and construction equipmentassigned to the assets and liabilities related to the acquiredthan originally estimated with the probable effect that the futureentity were approximately $5 million of trade receivables, $2cash flows would not cover the carrying amount of the netmillion of other receivables, $29 million of inventories, $24assets. The assets are part of the financial services operationsmillion of property and equipment, $62 million of goodwill, $42(see Note 26).million of identifiable intangible assets, $23 million of other
assets, $22 million of accounts payable and accrued expenses,Voluntary Employee-Separation Programs
and $19 million of deferred tax liabilities. The identifiable During the fourth quarter of 2016, the company announcedintangibles were primarily related to trade name, customer voluntary employee-separation programs as part of its effort torelationships and technology, which have a weighted average reduce operating costs. The programs provided for cashamortization period of nine years. The goodwill is not deductible payments based on previous years of service. The expense wasfor tax purposes. recorded in the period the employees accepted the separation
offer. The programs’ total pretax expenses were $113 million, ofFor the 2017 and 2016 acquisitions, the entities werewhich $11 million was recorded in the fourth quarter of 2016consolidated and the results of these operations have beenand $102 million in 2017. The total 2017 expenses wereincluded in the company’s consolidated financial statements inallocated approximately 30 percent cost of sales, 16 percentthe agriculture and turf operating segment since the dates ofresearch and development, and 54 percent selling, administrativeacquisition. The pro forma results of operations as if theand general. In addition, the expenses were allocated 75 percentacquisitions had occurred at the beginning of the current orto agriculture and turf operations, 17 percent to thecomparative fiscal year would not differ significantly from theconstruction and forestry operations, and 8 percent to thereported results.financial services operations. Savings from these programs wereIn March 2015, the company closed the sale of all of the stockestimated to be approximately $70 million in 2017.of its wholly-owned subsidiaries, John Deere Insurance CompanySale of Investment in Unconsolidated Affiliateand John Deere Risk Protection, Inc. to Farmers Mutual HailIn December 2016, the company sold approximately 38 percentInsurance Company of Iowa. These operations were included inof its interest in SiteOne Landscape Supply, Inc. (SiteOne)the company’s financial services operating segment. The totalresulting in gross proceeds of $114 million and a gain of $105amount of proceeds from the sale was approximately $154million pretax or $66 million after-tax. In April 2017, themillion, including $5 million of cash and cash equivalents sold,company sold an additional 68 percent of its then remainingwith a gain recorded in other income of $42 million pretax andinterest in SiteOne resulting in gross proceeds of $184 million$40 million after-tax. The tax expense was partially offset by aand a gain of $176 million pretax or $111 million after-tax. Inchange in a valuation allowance on a capital loss carryforward.July 2017, the company sold its remaining interest in SiteOneThe company provided certain business services for a fee duringresulting in gross proceeds of $98 million and a gain of $94a transition period.million pretax or $59 million after-tax. The gains were recordedin other income in the agriculture and turf operating segment.
39

40
After the December 2016 sale, the company retained Cash payments for interest and income taxes consisted of theapproximately a 15 percent ownership interest in SiteOne and following in millions of dollars:approximately a 5 percent ownership interest after the April sale.
2017 2016 2015Prior to April 2017, the company’s representation on the SiteOneboard of directors allowed the company to exercise significant Interest:
Equipment operations ..................... $ 506 $ 442 $ 471influence, and therefore, the investment in SiteOne wasFinancial services ............................ 665 524 443accounted for using the equity method. In March 2017, theIntercompany eliminations ................ (268) (240) (253)company reduced its representation on the SiteOne board of
directors. As a result, beginning April 2017 the investment in Consolidated .................................... $ 903 $ 726 $ 661SiteOne was recorded as an available-for-sale security and
Income taxes:presented in marketable securities. Equipment operations ..................... $ 898 $ 314 $ 828
Financial services ............................ 92 (26) 190In May 2016, the company received a distribution of $60 millionIntercompany eliminations ................ (9) 104 (117)from SiteOne that reduced the company’s investment in
unconsolidated affiliates. The distribution included $4 million of Consolidated .................................... $ 981 $ 392 $ 901a return on investment, which is shown in the statement ofconsolidated cash flows in undistributed earnings of 7. PENSION AND OTHER POSTRETIREMENT BENEFITSunconsolidated affiliates in net cash provided by operating
The company has several defined benefit pension plans andactivities and $56 million of a return of investment shown in
postretirement health care and life insurance plans covering itsother cash flows from investing activities. In May 2016, the
U.S. employees and employees in certain foreign countries. Thecompany also sold approximately 30 percent of its interest in
company uses an October 31 measurement date for these plans.SiteOne in an initial public offering and terminated a service
The components of net periodic pension cost and theagreement resulting in gross proceeds of approximately $81assumptions related to the cost consisted of the following inmillion with a total gain of $75 million pretax or $47 millionmillions of dollars and in percents:after-tax. The gain was recorded in other income in the
agriculture and turf operating segment. The company retained2017 2016 2015
approximately a 24 percent ownership interest in SiteOne afterPensionsthe May 2016 sale.Service cost ...................................... $ 274 $ 254 $ 282
6. CASH FLOW INFORMATION Interest cost ..................................... 361 391 474For purposes of the statement of consolidated cash flows, the Expected return on plan assets ............. (790) (775) (769)
Amortization of actuarial loss ............... 247 211 223company considers investments with purchased maturities ofAmortization of prior service cost .......... 12 16 25three months or less to be cash equivalents. Substantially all ofOther postemployment benefits ............ 2 1the company’s short-term borrowings, excluding the currentSettlements/curtailments ..................... 2 11 11maturities of long-term borrowings, mature or may requireNet cost .......................................... $ 106 $ 110 $ 247payment within three months or less.
The equipment operations sell a significant portion of their trade Weighted-average assumptions
Discount rates – service cost ................ 3.5% 4.3% 4.0%receivables to financial services. These intercompany cash flowsDiscount rates – interest cost ............... 3.0% 3.4% 4.0%are eliminated in the consolidated cash flows.Rate of compensation increase ............. 3.8% 3.8% 3.8%
All cash flows from the changes in trade accounts and notes Expected long-term rates of return ........ 7.3% 7.3% 7.3%receivable (see Note 12) are classified as operating activities inthe statement of consolidated cash flows as these receivables The components of net periodic postretirement benefits costarise from sales to the company’s customers. Cash flows from and the assumptions related to the cost consisted of thefinancing receivables that are related to sales to the company’s following in millions of dollars and in percents:customers (see Note 12) are also included in operating activities.
2017 2016 2015The remaining financing receivables are related to the financingof equipment sold by independent dealers and are included in Health care and life insurance
Service cost ......................................... $ 42 $ 38 $ 46investing activities.Interest cost......................................... 194 204 259
The company had the following non-cash operating and Expected return on plan assets ................ (17) (35) (55)investing activities that were not included in the statement of Amortization of actuarial loss................... 99 73 91consolidated cash flows. The company transferred inventory to Amortization of prior service credit ........... (77) (78) (77)equipment on operating leases of $801 million, $685 million, and Settlements/curtailments ........................ 1$674 million in 2017, 2016, and 2015, respectively. The
Net cost ............................................. $ 241 $ 202 $ 265company also had accounts payable related to purchases of
Weighted-average assumptionsproperty and equipment of $108 million, $114 million, andDiscount rates – service cost ................... 4.7% 5.0% 4.2%$89 million at October 29, 2017, October 30, 2016, andDiscount rates – interest cost .................. 3.2% 3.5% 4.2%November 1, 2015, respectively.Expected long-term rates of return ........... 6.3% 6.6% 7.0%
40

41
In 2016, the company changed the method used to estimate the The benefit plan obligations, funded status, and the assumptionsservice and interest cost components of the net periodic pension related to the obligations at October 29, 2017 and October 30,and postretirement benefits cost. This method uses the spot 2016, respectively, in millions of dollars follow:yield curve approach to estimate the service and interest cost by
Health Careapplying the specific spot rates along the yield curve used toand
determine the benefit plan obligations to relevant projected cash Pensions Life Insuranceoutflows. For 2015, the service and interest cost components
2017 2016 2017 2016were determined using a single weighted-average discount rate.Change in benefit obligationsThe change did not affect the measurement of the total benefitBeginning of year balance............. $(13,086) $(12,186) $(6,500) $(6,084)plan obligations as the change in service and interest costService cost ............................... (274) (254) (42) (38)offsets in the actuarial gains and losses recorded in otherInterest cost .............................. (361) (391) (194) (204)comprehensive income. The spot yield curve approach provides aActuarial gain (loss) ..................... (35) (1,001) 280 (478)
more precise measure of service and interest cost by improving Amendments .............................. (1) 3the correlation between the projected benefit cash flows and the Benefits paid.............................. 704 702 312 321discrete spot yield curve rates. The company accounted for this Health care subsidies ................... (9) (16)change as a change in estimate prospectively beginning in 2016. Other postemployment benefits ..... (2)
Settlements/curtailments .............. 2 6The decrease in the 2016 total service and interest cost wasForeign exchange and other .......... (116) 41 (9) (4)approximately $175 million compared to the previous method.End of year balance ..................... (13,166) (13,086) (6,162) (6,500)The previous pension cost in net income and other changes inChange in plan assets (fair value)plan assets and benefit obligations in other comprehensiveBeginning of year balance............. 11,137 11,164 435 689income in millions of dollars were as follows:Actual return on plan assets .......... 1,517 628 46 17Employer contribution.................. 62 80 366 472017 2016 2015
Benefits paid.............................. (704) (702) (312) (321)Pensions Settlements ............................... (2) (3)Net cost .............................................. $ 106 $ 110 $ 247 Foreign exchange and other .......... 83 (30) 4 3Retirement benefit adjustments included in
End of year balance ..................... 12,093 11,137 539 435other comprehensive (income) loss:Net actuarial (gain) loss ................... (702) 1,140 361 Funded status ........................... $ (1,073) $ (1,949) $(5,623) $(6,065)Prior service cost ............................ 1 66
Weighted-average assumptionsAmortization of actuarial loss ............ (247) (211) (223)Discount rates ............................ 3.6% 3.6% 3.7% 3.8%
Amortization of prior service cost....... (12) (16) (25)Rate of compensation increase ...... 3.8% 3.8%
Settlements/curtailments ................. (2) (14) (11)
Total (gain) loss recognized in other In the fourth quarter of 2015, the company decided tocomprehensive (income) loss ...... (963) 900 168 transition Medicare eligible wage and certain Medicare eligible
salaried retirees to a Medicare Advantage plan offered by aTotal recognized in comprehensiveprivate insurance company effective in January 2016. This(income) loss .................................... $ (857) $ 1,010 $ 415change did not affect the participants’ level of benefits andresulted in cost savings for the company.The previous postretirement benefits cost in net income and
other changes in plan assets and benefit obligations in other The mortality assumptions for the 2017 and 2016 benefit plancomprehensive income in millions of dollars were as follows: obligations reflect the most recent tables issued by the Society
of Actuaries at that time.2017 2016 2015
The amounts recognized at October 29, 2017 and October 30,Health care and life insurance 2016, respectively, in millions of dollars consist of the following:Net cost .............................................. $ 241 $ 202 $ 265Retirement benefit adjustments included in Health Care
other comprehensive (income) loss: andNet actuarial (gain) loss ................... (309) 496 (141) Pensions Life InsurancePrior service credit .......................... (3) (3)
2017 2016 2017 2016Amortization of actuarial loss ............ (99) (73) (91)Amortization of prior service credit..... 77 78 77 Amounts recognized in
Settlements/curtailments ................. (2) balance sheet
Noncurrent asset ........................ $ 538 $ 94Total (gain) loss recognized in otherCurrent liability ........................... (40) (33) $ (63) $ (32)comprehensive (income) loss ...... (331) 498 (160)Noncurrent liability ...................... (1,571) (2,010) (5,560) (6,033)
Total recognized in comprehensiveTotal......................................... $(1,073) $(1,949) $(5,623) $(6,065)(income) loss .................................... $ (90) $ 700 $ 105
Amounts recognized in accumulated other
comprehensive income – pretax
Net actuarial loss ........................ $ 4,358 $ 5,309 $ 1,457 $ 1,865Prior service cost (credit)............... 55 67 (182) (259)
Total......................................... $ 4,413 $ 5,376 $ 1,275 $ 1,606
41

42
The total accumulated benefit obligations for all pension plans the 2017 actuarial valuation, the weighted-average compositeat October 29, 2017 and October 30, 2016, was $12,416 million trend rates for these obligations were assumed to be an 8.9and $12,410 million, respectively. percent increase from 2017 to 2018, gradually decreasing
to 4.8 percent from 2024 to 2025 and all future years. TheThe accumulated benefit obligations and fair value of plan2016 obligations and the cost in 2017 assumed an 8.3 percentassets for pension plans with accumulated benefit obligations inincrease from 2016 to 2017, gradually decreasing to 4.8excess of plan assets were $8,234 million and $7,345 million,percent from 2024 to 2025 and all future years. An increase ofrespectively, at October 29, 2017 and $8,402 million and $7,016one percentage point in the assumed health care cost trend ratemillion, respectively, at October 30, 2016. The projected benefitwould increase the accumulated postretirement benefitobligations and fair value of plan assets for pension plans withobligations by $791 million and the aggregate of service andprojected benefit obligations in excess of plan assets wereinterest cost component of net periodic postretirement benefits$9,059 million and $7,448 million, respectively, at October 29,cost for the year by $36 million. A decrease of one percentage2017 and $9,157 million and $7,114 million, respectively, atpoint would decrease the obligations by $615 million and theOctober 30, 2016.cost by $27 million.
The amounts in accumulated other comprehensive income thatThe discount rate assumptions used to determine theare expected to be amortized as net expense (income) andpostretirement obligations for all periods presented were basedreported outside of income from operations during fiscal 2018on hypothetical AA yield curves represented by a series ofin millions of dollars follow:annualized individual discount rates. These discount ratesrepresent the rates at which the company’s benefit obligationsHealth Care
and could effectively be settled at the October 31 measurementPensions Life Insurance dates.
Net actuarial loss..................................... $ 225 $ 67 Fair value measurement levels in the following tables arePrior service cost (credit) ........................... 12 (77) defined in Note 26.Total ..................................................... $ 237 $ (10) The fair values of the pension plan assets at October 29, 2017
follow in millions of dollars:Actuarial gains and losses are recorded in accumulated other
Total Level 1 Level 2comprehensive income (loss). To the extent unamortized gains
Cash and short-term investments.............. $ 618 $ 349 $ 269and losses exceed 10% of the higher of the market-related valueEquity:of assets or the benefit obligation, the excess is amortized as a
U.S. equity securities ....................... 1,871 1,850 21component of net periodic cost over the remaining serviceInternational equity securities ........... 1,551 1,541 10period of the active participants. For plans in which all or almost
Fixed Income:all of the plan’s participants are inactive, the amortizationGovernment and agency securities ..... 483 241 242
period is the remaining life expectancy of the inactive Corporate debt securities ................. 1,285 1,285participants. Mortgage-backed securities .............. 42 42
Real estate ........................................... 103 101 2The company expects to contribute approximately $63 million toDerivative contracts – assets* .................. 159 28 131its pension plans and approximately $74 million to its healthDerivative contracts – liabilities** ............. (76) (2) (74)care and life insurance plans in 2018, which are primarily directReceivables, payables, and other............... 1 1benefit payments for unfunded plans.Securities lending collateral ..................... 420 420
The benefits expected to be paid from the benefit plans, which Securities lending liability ........................ (420) (420)Securities sold short............................... (379) (375) (4)reflect expected future years of service, are as follows in millions
of dollars: Total of Level 1 and Level 2 assets ..... 5,658 $3,734 $1,924
Investments at net asset value:Health CareShort-term investments ....................... 203andU.S. equity funds ............................... 1,704Pensions Life Insurance*International equity funds .................... 921
2018 .................................................. $ 721 $ 334 Corporate debt funds.......................... 282019 .................................................. 726 337 Fixed income funds ............................ 7722020 .................................................. 713 342 Real estate........................................ 5672021 .................................................. 701 346 Hedge funds ..................................... 6512022 .................................................. 693 352 Private equity/venture capital ............... 1,5602023 to 2027....................................... 3,458 1,758 Other investments .............................. 29* Net of prescription drug group benefit subsidy under Medicare Part D.
Total net assets............................. $12,093
* Includes contracts for interest rates of $79 million, foreign currency ofThe annual rates of increase in the per capita cost of covered$49 million, equity of $27 million, and other of $4 million.health care benefits (the health care cost trend rates) used to
** Includes contracts for interest rates of $48 million, foreign currency ofdetermine accumulated postretirement benefit obligations were$26 million, and other of $2 million.
based on the trends for medical and prescription drug claims forpre- and post-65 age groups due to the effects of Medicare. For
42

43
The fair values of the health care assets at October 29, 2017 The fair values of the health care assets at October 30, 2016follow in millions of dollars: follow in millions of dollars:
Total Level 1 Level 2 Total Level 1 Level 2
Cash and short-term investments .............. $ 30 $ 28 $ 2 Cash and short-term investments ............... $ 32 $ 27 $ 5Equity: Equity:
U.S. equity securities and funds.......... 42 42 U.S. equity securities and funds........... 138 138International equity securities................ 9 9 International equity securities and funds ... 25 25
Fixed Income: Fixed Income:Government and agency securities ...... 40 37 3 Government and agency securities ....... 43 40 3Corporate debt securities .................. 21 21 Corporate debt securities ................... 30 30Mortgage-backed securities ............... 10 10 Mortgage-backed securities................ 11 11
Real estate............................................ 1 1 Real estate ............................................ 2 2Interest rate derivative contracts – assets .... 1 1 Derivative contracts – assets* .................... 3 3Securities lending collateral ...................... 25 25 Securities lending collateral ....................... 48 11 37Securities lending liability ......................... (25) (25) Securities lending liability.......................... (48) (11) (37)Securities sold short................................ (2) (2) Securities sold short ................................ (5) (5)
Total of Level 1 and Level 2 assets ...... 152 $ 115 $ 37 Total of Level 1 and Level 2 assets ....... 279 $ 227 $ 52
Investments at net asset value: Investments at net asset value:Short-term investments ........................ 1 Short-term investments......................... 3U.S. equity funds ................................ 164 International equity funds ..................... 60International equity funds ..................... 117 Fixed income funds .............................. 20Fixed income funds ............................. 87 Real estate funds................................. 7Real estate funds ................................ 4 Hedge funds....................................... 44Hedge funds ...................................... 4 Private equity/venture capital ................. 22Private equity/venture capital ................ 10
Total net assets .............................. $ 435Total net assets ............................. $ 539
* Includes contracts for interest rates of $2 million and foreign currency of $1million.
The fair values of the pension plan assets at October 30, 2016follow in millions of dollars: Investments at net asset value in the preceeding tables are
measured at fair value using net asset value per share, andTotal Level 1 Level 2therefore, are not classified in the fair value hierarchy.
Cash and short-term investments............... $ 684 $ 322 $ 362Fair values are determined as follows:Equity:
U.S. equity securities and funds .......... 3,000 2,965 35 Cash and Short-Term Investments – Includes accounts that areInternational equity securities and funds .... 1,711 1,697 14 valued based on the account value, which approximates fair
Fixed Income: value, and investment funds that are valued on the fund’s netGovernment and agency securities ...... 440 224 216 asset value (NAV) based on the fair value of the underlyingCorporate debt securities .................. 1,205 1,205 securities. Also included are securities that are valued using aMortgage-backed securities ............... 39 39
market approach (matrix pricing model) in which all significantFixed income funds .......................... 20 20inputs are observable or can be derived from or corroborated byReal estate............................................ 121 118 3observable market data.Derivative contracts – assets* ................... 191 3 188
Derivative contracts – liabilities** .............. (59) (14) (45) Equity Securities and Funds – The values are determinedReceivables, payables, and other ................ 6 5 1 primarily by closing prices in the active market in which theSecurities lending collateral ...................... 693 108 585 equity investment trades, or the fund’s NAV, based on the fairSecurities lending liability ......................... (693) (108) (585)
value of the underlying securities.Securities sold short................................ (338) (333) (5)Fixed Income Securities and Funds – The securities are valuedTotal of Level 1 and Level 2 assets ...... 7,020 $5,007 $2,013using either a market approach (matrix pricing model) in which
Investments at net asset value: all significant inputs are observable or can be derived from orShort-term investments ........................ 216 corroborated by observable market data such as interest rates,U.S. equity funds ................................ 30
yield curves, volatilities, credit risk, and prepayment speeds, orInternational equity funds ..................... 595
they are valued using the closing prices in the active market inCorporate debt funds........................... 25which the fixed income investment trades. Fixed income fundsFixed income funds ............................. 482are valued using the fund’s NAV, based on the fair value of theReal estate ........................................ 515underlying securities or closing prices in the active market inHedge funds ...................................... 624
Private equity/venture capital ................ 1,603 which the investment trades.Other investments............................... 27
Total net assets ............................. $11,137
* Includes contracts for interest rates of $125 million, foreign currency of $59million, equity of $4 million, and other of $3 million.
** Includes contracts for interest rates of $19 million, foreign currency of$33 million, equity of $6 million, and other of $1 million.
43

44
Real Estate, Venture Capital, Private Equity, Hedge Funds, and The average annual return of the company’s U.S. pension fundOther – The investments that are structured as limited was approximately 7.2 percent during the past ten years andpartnerships are valued at estimated fair value based on their approximately 8.3 percent during the past 20 years. Since returnproportionate share of the limited partnership’s fair value that is premiums over inflation and total returns for major asset classesdetermined by the respective general partner. These investments vary widely even over ten-year periods, recent history is notare valued using a combination of NAV, an income approach necessarily indicative of long-term future expected returns. The(primarily estimated cash flows discounted over the expected company’s systematic methodology for determining the long-holding period), or market approach (primarily the valuation of term rate of return for the company’s investment strategiessimilar securities and properties). Real estate investment trusts supports its long-term expected return assumptions.are primarily valued at the closing prices in the active markets in The company has created certain Voluntary Employees’which the investment trades. Real estate funds and other Beneficiary Association trusts (VEBAs) for the funding ofinvestments are primarily valued at NAV, based on the fair value postretirement health care benefits. The future expected assetof the underlying securities. returns for these VEBAs are lower than the expected return onInterest Rate, Foreign Currency, and Other Derivative the other pension and health care plan assets due to investmentInstruments – The derivatives are valued using either an income in a higher proportion of liquid securities. These assets are inapproach (discounted cash flow) using market observable inputs, addition to the other postretirement health care plan assets thatincluding swap curves and both forward and spot exchange have been funded under Section 401(h) of the U.S. Internalrates, or a market approach (closing prices in the active market Revenue Code and maintained in a separate account in thein which the derivative instrument trades). company’s pension plan trust.
The primary investment objective for the pension and health care The company has defined contribution plans related to employeeplans assets is to maximize the growth of these assets to investment and savings plans primarily in the U.S. The company’ssupport the projected obligations to the beneficiaries over a long contributions and costs under these plans were $188 million inperiod of time, and to do so in a manner that is consistent with 2017, $193 million in 2016, and $185 million in 2015. Thethe company’s risk tolerance. The asset allocation policy is the contribution rate varies primarily based on the company’smost important decision in managing the assets and it is performance in the prior year and employee participation in thereviewed regularly. The asset allocation policy considers the plans.company’s long-term asset class risk/return expectations since
8. INCOME TAXESthe obligations are long-term in nature. The current target
The provision for income taxes by taxing jurisdiction and byallocations for pension assets are approximately 49 percent forsignificant component consisted of the following in millions ofequity securities, 27 percent for debt securities, 5 percent fordollars:real estate, and 19 percent for other investments. The target
allocations for health care assets are approximately 59 percent2017 2016 2015
for equity securities, 29 percent for debt securities, 1 percent forCurrent:real estate, and 11 percent for other investments. The allocation
U.S.:percentages above include the effects of combining derivativesFederal ............................................ $ 360 $ 51 $ 377with other investments to manage asset allocations andState .............................................. 48 26 32exposures to interest rates and foreign currency exchange. The
Foreign............................................... 463 340 449assets are well diversified and are managed by professional
Total current ................................. 871 417 858investment firms as well as by investment professionals who arecompany employees. As a result of the company’s diversified Deferred:
U.S.:investment policy, there were no significant concentrations ofFederal ............................................ 59 297 21risk.State .............................................. 7 11 4
The expected long-term rate of return on plan assets reflects Foreign............................................... 34 (25) (43)management’s expectations of long-term average rates of return
Total deferred ............................... 100 283 (18)on funds invested to provide for benefits included in theProvision for income taxes ....................... $ 971 $ 700 $ 840projected benefit obligations. A market related value of plan
assets is used to calculate the expected return on assets. Themarket related value recognizes changes in the fair value of Based upon the location of the company’s operations, thepension plan assets systematically over a five-year period. The consolidated income before income taxes in the U.S. in 2017,market related value of the health care plan assets equals fair 2016, and 2015 was $1,607 million, $967 million, andvalue. The expected return is based on the outlook for inflation $1,838 million, respectively, and in foreign countries wasand for returns in multiple asset classes, while also considering $1,547 million, $1,257 million, and $942 million, respectively.historical returns, asset allocation, and investment strategy. The Certain foreign operations are branches of Deere & Companycompany’s approach has emphasized the long-term nature of and are subject to U.S. as well as foreign income tax regulations.the return estimate such that the return assumption is not The pretax income by location and the preceding analysis of thechanged significantly unless there are fundamental changes in income tax provision by taxing jurisdiction are not directlycapital markets that affect the company’s expectations for related.returns over an extended period of time (i.e., 10 to 20 years).
44

45
A comparison of the statutory and effective income tax provision Deere & Company files a consolidated federal income tax returnand reasons for related differences in millions of dollars follow: in the U.S., which includes the wholly-owned financial services
subsidiaries. These subsidiaries account for income taxes2017 2016 2015 generally as if they filed separate income tax returns.
U.S. federal income tax provision at a At October 29, 2017, certain tax loss and tax creditstatutory rate of 35 percent .................. $1,104 $ 778 $ 973 carryforwards of $677 million were available with $209 million
Increase (decrease) resulting from:expiring from 2018 through 2037 and $468 million with an
State and local income taxes, net of federalindefinite carryforward period.income tax benefit ................................ 35 26 23
Differences in taxability of foreign earnings ... (83) (107) (449) A reconciliation of the total amounts of unrecognized taxNondeductible impairment charges .............. 4 benefits at October 29, 2017, October 30, 2016, andResearch and business tax credits ................ (63) (57) (76) November 1, 2015 in millions of dollars follows:Tax rates on foreign earnings...................... (86) (27) (36)Valuation allowance on deferred taxes .......... 89 79 384 2017 2016 2015Other-net ............................................... (25) 4 21
Beginning of year balance ........................ $198 $229 $213Provision for income taxes ....................... $ 971 $ 700 $ 840 Increases to tax positions taken
during the current year .......................... 35 14 32Increases to tax positions takenAt October 29, 2017, accumulated earnings in certain
during prior years ................................. 13 11 29subsidiaries outside the U.S. totaled $5,961 million for which noDecreases to tax positions takenprovision for U.S. income taxes or foreign withholding taxes has
during prior years ................................. (17) (36) (15)been made because it is expected that such earnings will beDecreases due to lapse of statutereinvested outside the U.S. indefinitely. Determination of the
of limitations ....................................... (11) (7) (11)amount of unrecognized deferred tax liability on these
Settlements ............................................ (1) (5) (6)unremitted earnings is not practicable. At October 29, 2017, the Foreign exchange..................................... 4 (8) (13)amount of cash and cash equivalents and marketable securities
End of year balance................................. $221 $198 $229held by these foreign subsidiaries, in which earnings areconsidered indefinitely reinvested, was $3,386 million.
The amount of unrecognized tax benefits at October 29, 2017Deferred income taxes arise because there are certain items that
and October 30, 2016 that would affect the effective tax rate ifare treated differently for financial accounting than for income
the tax benefits were recognized was $86 million andtax reporting purposes. An analysis of the deferred income tax
$81 million, respectively. The remaining liability was related toassets and liabilities at October 29, 2017 and October 30, 2016
tax positions for which there are offsetting tax receivables, orin millions of dollars follows:
the uncertainty was only related to timing. The company expectsthat any reasonably possible change in the amounts of
2017 2016 unrecognized tax benefits in the next twelve months would notDeferred Deferred Deferred Deferred be significant.
Tax Tax Tax TaxThe company files its tax returns according to the tax laws of the
Assets Liabilities Assets Liabilitiesjurisdictions in which it operates, which includes the U.S. federal
Other postretirement jurisdiction and various state and foreign jurisdictions. The U.S.benefit liabilities ................. $2,011 $ 2,191 Internal Revenue Service has completed the examination of the
Lease transactions.................. $ 933 $ 817 company’s federal income tax returns for periods prior to 2009.Tax loss and tax credit
The years 2009 through 2014 federal income tax returns arecarryforwards...................... 677 661
currently under examination. Various state and foreign incomeAccrual for sales allowances ..... 680 592tax returns, including major tax jurisdictions in Canada andTax over book depreciation ...... 569 578Germany, also remain subject to examination by taxingPension liability – net ............. 420 706authorities.Foreign unrealized losses......... 7 472
Accrual for employee benefits... 141 133 The company’s policy is to recognize interest related to incomeShare-based compensation ...... 116 152
taxes in interest expense and interest income and recognizeGoodwill and other
penalties in selling, administrative and general expenses. Duringintangible assets ................ 130 892017, 2016, and 2015, the total amount of expense fromAllowance for credit losses....... 107 88interest and penalties was $6 million, none, and $23 million andDeferred compensation ........... 59 50the interest income was $6 million, none, and $3 million,Undistributed foreign earnings... 21 30
Other items .......................... 432 172 471 175 respectively. At October 29, 2017 and October 30, 2016, theLess valuation allowances ........ (620) (1,029) liability for accrued interest and penalties totaled $66 million and
$68 million, respectively, and there was no receivable for interestDeferred income tax assets
at either year-end.and liabilities .................... $4,030 $1,825 $ 4,487 $1,689
45

46
9. OTHER INCOME AND OTHER OPERATING EXPENSES Consolidated retained earnings at October 29, 2017 includeundistributed earnings of the unconsolidated affiliates ofThe major components of other income and other operating$123 million. Dividends from unconsolidated affiliates wereexpenses consisted of the following in millions of dollars:$4 million in 2017, $64 million in 2016 (see Note 5), and$1 million in 2015.2017 2016 2015
In the ordinary course of business, the company purchases andOther income
Revenues from services ........................ $ 288 $ 270 $ 280 sells components and finished goods to the unconsolidatedInsurance premiums and fees earned** ... 211 195 173 affiliated companies. Transactions with unconsolidated affiliatedSiteOne investment gains* ................... 375 75 companies reported in the statement of consolidated income inInvestment income.............................. 17 16 26 millions of dollars follow:Other ............................................... 230 190 228
2017 2016 2015Total ............................................ $1,121 $ 746 $ 707
Net sales .......................................... $ 84 $ 45 $ 37Other operating expenses
Purchases ......................................... 1,331 1,016 1,284Depreciation of equipment on operatingleases ........................................... $ 853 $ 742 $ 577
11. MARKETABLE SECURITIESInsurance claims and expenses** ........... 187 188 183Cost of services .................................. 168 162 160 All marketable securities are classified as available-for-sale, withOther ............................................... 109 163 41 unrealized gains and losses shown as a component of
stockholders’ equity. Realized gains or losses from the sales ofTotal ............................................ $1,317 $1,255 $ 961marketable securities are based on the specific identification
* See Note 5.method.** Primarily related to extended warranties (see Note 22).
The amortized cost and fair value of marketable securities at10. UNCONSOLIDATED AFFILIATED COMPANIES
October 29, 2017 and October 30, 2016 in millions of dollarsUnconsolidated affiliated companies are companies in which follow:Deere & Company generally owns 20 percent to 50 percent ofthe outstanding voting shares. Deere & Company does not Gross Gross
Amortized Unrealized Unrealized Faircontrol these companies and accounts for its investments inCost Gains Losses Valuethem on the equity basis. The investments in these companies
primarily consist of Bell Equipment Limited (31 percent 2017
ownership), Deere-Hitachi Construction Machinery Corporation Equity fund ....................... $ 37 $ 11 $ 48(50 percent ownership), and Deere-Hitachi Maquinas de Fixed income fund.............. 15 15
U.S. government debtConstrucao do Brasil S.A. (50 percent ownership). In 2017, thesecurities ...................... 76 1 77company sold its interest in SiteOne (see Note 5). The
Municipal debt securities ..... 39 1 $ 1 39unconsolidated affiliated companies primarily manufacture orCorporate debt securities ..... 133 3 1 135market equipment. Deere & Company’s share of the income orInternational debt securities 22 2 20loss of these companies is reported in the consolidated incomeMortgage-backed securities* 119 1 2 118
statement under ‘‘Equity in income (loss) of unconsolidatedMarketable securities ........ $ 441 $ 17 $ 6 $ 452affiliates.’’ The investment in these companies is reported in the
consolidated balance sheet under ‘‘Investments in 2016
unconsolidated affiliates.’’ Equity fund ....................... $ 40 $ 5 $ 45Fixed income fund.............. 15 15Combined financial information of the unconsolidated affiliatedU.S. government debtcompanies in millions of dollars follows:
securities ...................... 85 3 88Municipal debt securities ..... 41 2 43
Operations 2017 2016 2015Corporate debt securities ..... 113 5 118International debt securities 39 $ 5 34Sales ............................................... $2,638 $3,206 $3,290Mortgage-backed securities* 109 2 111Net income ...................................... 7 30 23
Deere & Company’s equity inMarketable securities ........ $ 442 $ 17 $ 5 $ 454
net income (loss) ............................ (24) (2) 1* Primarily issued by U.S. government sponsored enterprises.
Financial Position 2017 2016
Total assets .................................................... $1,488 $2,201Total external borrowings .................................. 451 909Total net assets ............................................... 542 677Deere & Company’s share of the net assets ........... 182 233
46

47
The contractual maturities of debt securities at October 29, retail customers. The interest-free periods are determined based2017 in millions of dollars follow: on the type of equipment sold and the time of year of the sale.
These periods range from one to twelve months for mostAmortized Fair equipment. Interest-free periods may not be extended. Interest
Cost Value charged may not be forgiven and the past due interest ratesexceed market rates. The company evaluates and assessesDue in one year or less .................................. $ 26 $ 25dealers on an ongoing basis as to their creditworthiness andDue after one through five years...................... 111 110
Due after five through 10 years ....................... 83 84 generally retains a security interest in the goods associated withDue after 10 years ........................................ 50 52 the trade receivables. In certain jurisdictions, the company isMortgage-backed securities ............................ 119 118 obligated to repurchase goods sold to a dealer upon cancellation
or termination of the dealer’s contract for such causes asDebt securities ............................................ $ 389 $ 389change in ownership and closeout of the business.
Actual maturities may differ from contractual maturities because Trade accounts and notes receivable have significantsome securities may be called or prepaid. Because of the concentrations of credit risk in the agriculture and turf sectorpotential for prepayment on mortgage-backed securities, they and construction and forestry sector as shown in the previousare not categorized by contractual maturity. Proceeds from the table. On a geographic basis, there is not a disproportionatesales of available-for-sale securities were $403 million in 2017, concentration of credit risk in any area.$62 million in 2016, and $120 million in 2015. Realized gains
Financing Receivableswere $275 million in 2017 (see Note 5), and not significant in
Financing receivables at October 29, 2017 and October 30, 20162016 and 2015. Realized losses, the increase (decrease) in net
in millions of dollars follow:unrealized gains or losses, and unrealized losses that have beencontinuous for over twelve months were not significant in 2017,
2017 20162016, and 2015. Unrealized losses at October 29, 2017 and
Unrestricted/Securitized Unrestricted/SecuritizedOctober 30, 2016 were primarily the result of an increase in
Retail notes:interest rates and were not recognized in income due to theAgriculture and turf .......... $15,200 $ 3,651 $14,152 $4,615ability and intent to hold to maturity. There were no significantConstruction and forestry... 2,297 599 2,201 620impairment write-downs in the periods reported.
Total .......................... 17,497 4,250 16,353 5,23512. RECEIVABLES Wholesale notes.................. 3,653 3,971Trade Accounts and Notes Receivable Revolving charge accounts..... 3,629 3,135
Financing leases (direct andTrade accounts and notes receivable at October 29, 2017 andsales-type) ...................... 1,613 1,326October 30, 2016 in millions of dollars follows:
Total financing receivables 26,392 4,250 24,785 5,2352017 2016
Less:Trade accounts and notes: Unearned finance income:
Agriculture and turf....................................... $2,991 $2,438 Retail notes ................. 972 78 812 94Construction and forestry ............................... 934 573 Financing leases ........... 142 109
Trade accounts and notes receivable – net .......... $3,925 $3,011 Total....................... 1,114 78 921 94
Allowance for credit losses 174 13 162 14At October 29, 2017 and October 30, 2016, dealer notes
Financing receivables – net $25,104 $ 4,159 $23,702 $5,127included in the previous table were $140 million and$143 million, and the allowance for credit losses was $56 million
The residual values for investments in financing leases atand $50 million, respectively.October 29, 2017 and October 30, 2016 totaled $244 million
The equipment operations sell a significant portion of their trade and $156 million, respectively.receivables to financial services and provide compensation to
Financing receivables have significant concentrations of creditthese operations at approximate market rates of interest.risk in the agriculture and turf sector and construction and
Trade accounts and notes receivable primarily arise from sales of forestry sector as shown in the previous table. On a geographicgoods to independent dealers. Under the terms of the sales to basis, there is not a disproportionate concentration of credit riskdealers, interest is primarily charged to dealers on outstanding in any area. The company generally retains as collateral abalances, from the earlier of the date when goods are sold to security interest in the equipment associated with retail notes,retail customers by the dealer or the expiration of certain wholesale notes, and financing leases.interest-free periods granted at the time of the sale to thedealer, until payment is received by the company. Dealers cannotcancel purchases after the equipment is shipped and areresponsible for payment even if the equipment is not sold to
47

48
Financing receivables at October 29, 2017 and October 30, 2016 contractual payment due date. Non-performing financingrelated to the company’s sales of equipment that were included receivables represent loans for which the company has ceasedin the table above consisted of the following in millions of accruing finance income. These receivables are generallydollars: 120 days delinquent and the estimated uncollectible amount,
after charging the dealer’s withholding account, has been2017 2016 written off to the allowance for credit losses. Finance income for
Unrestricted Unrestricted non-performing receivables is recognized on a cash basis.Accrual of finance income is generally resumed when theRetail notes*:receivable becomes contractually current and collections areAgriculture and turf......................... $2,099 $1,896reasonably assured.Construction and forestry ................. 368 336
Total......................................... 2,467 2,232 An age analysis of past due financing receivables that are stillWholesale notes ................................ 3,653 3,971 accruing interest and non-performing financing receivables atSales-type leases................................ 763 648 October 29, 2017 and October 30, 2016 follows in millions of
dollars:Total......................................... 6,883 6,851
Less:30-59 60-89 90 Days
Unearned finance income:Days Days or Greater Total
Retail notes................................ 231 202Past Due Past Due Past Due Past Due
Sales-type leases ......................... 53 422017Total ..................................... 284 244Retail Notes:
Financing receivables related to the Agriculture and turf ........ $118 $ 54 $49 $221company’s sales of equipment ......... $6,599 $6,607 Construction and forestry 75 33 39 147
Other:* These retail notes generally arise from sales of equipment by company-ownedAgriculture and turf ........ 27 14 7 48dealers or through direct sales.Construction and forestry 11 6 2 19
Financing receivable installments, including unearned financeTotal .............................. $231 $107 $97 $435
income, at October 29, 2017 and October 30, 2016 arescheduled as follows in millions of dollars: Total Total
Total Non- Financing2017 2016 Past Due Performing Current Receivables
Unrestricted/Securitized Unrestricted/SecuritizedRetail Notes:
Agriculture and turf ......... $221 $173 $17,508 $17,902Due in months:Construction and forestry 147 30 2,618 2,7950 – 12 ...................... $13,237 $ 2,027 $12,835 $ 2,269
Other:13 – 24 .................... 5,056 1,256 4,760 1,536Agriculture and turf ......... 48 12 7,610 7,67025 – 36 .................... 3,708 672 3,386 931Construction and forestry 19 5 1,059 1,08337 – 48 .................... 2,518 243 2,219 408
49 – 60 .................... 1,398 50 1,181 84 Total ......................... $435 $220 $28,795 29,450Thereafter ................. 475 2 404 7
Less allowance for credit losses ...................................... 187Total ........................... $26,392 $ 4,250 $24,785 $ 5,235
Total financing receivables – net .................................... $29,263
The maximum terms for retail notes are generally seven years for 30-59 60-89 90 Daysagriculture and turf equipment and five years for construction Days Days or Greater Totaland forestry equipment. The maximum term for financing leases Past Due Past Due Past Due Past Dueis generally five years, while the average term for wholesale
2016notes is less than twelve months.
Retail Notes:Agriculture and turf........ $115 $ 57 $ 65 $237At October 29, 2017 and October 30, 2016, the unpaid balancesConstruction and forestry 78 32 25 135of receivables administered but not owned were $10 million and
Other:$15 million, respectively. At October 29, 2017 and October 30,Agriculture and turf........ 26 11 6 432016, worldwide financing receivables administered, whichConstruction and forestry 10 5 4 19include financing receivables administered but not owned,
Total .............................. $229 $105 $100 $434totaled $29,273 million and $28,844 million, respectively.
Past due balances of financing receivables still accruing finance (continued)income represent the total balance held (principal plus accruedinterest) with any payment amounts 30 days or more past the
48

49
receivables outstanding at October 29, 2017 and October 30,Total Total2016, respectively. In addition, at October 29, 2017 andTotal Non- FinancingOctober 30, 2016, the company’s financial services operationsPast Due Performing Current Receivableshad $155 million and $162 million, respectively, of deposits
Retail Notes: primarily withheld from dealers and merchants available forAgriculture and turf......... $237 $191 $17,526 $17,954
potential credit losses.Construction and forestry 135 35 2,558 2,728
Other: Financing receivables are considered impaired when it isAgriculture and turf......... 43 9 7,286 7,338 probable the company will be unable to collect all amounts dueConstruction and forestry 19 9 957 985 according to the contractual terms. Receivables reviewed for
impairment generally include those that are either past due, orTotal......................... $434 $244 $28,327 29,005have provided bankruptcy notification, or require significant
Less allowance for credit losses ..................................... 176collection efforts. Receivables that are impaired are generally
Total financing receivables – net .................................... $28,829 classified as non-performing.
An analysis of the impaired financing receivables at October 29,An analysis of the allowance for credit losses and investment in 2017 and October 30, 2016 follows in millions of dollars:financing receivables follows in millions of dollars:
Unpaid AverageRevolving Recorded Principal Specific Recorded
Retail Charge Investment Balance Allowance InvestmentNotes Accounts Other Total
2017*
2017 Receivables with specificAllowance: allowance** ................ $ 36 $ 33 $ 10 $ 30Beginning of year balance ........ $ 113 $ 40 $ 23 $ 176 Receivables without a
Provision ........................... 46 33 9 88 specific allowance*** .... 28 27 24Write-offs .......................... (56) (53) (7) (116)
Total ............................. $ 64 $ 60 $ 10 $ 54Recoveries ......................... 20 20 1 41Translation adjustments........ (2) (2) Agriculture and turf ...... $ 49 $ 46 $ 10 $ 38
End of year balance* ............... $ 121 $ 40 $ 26 $ 187 Construction andforestry ................... $ 15 $ 14 $ 16Financing receivables:
End of year balance................. $20,697 $3,629 $5,124 $29,450 2016*
Receivables with specificBalance individually evaluated ... $ 86 $ 3 $ 20 $ 109allowance** ................ $ 31 $ 28 $ 9 $ 29
2016 Receivables without aAllowance: specific allowance*** .... 29 27 26Beginning of year balance ........ $ 95 $ 40 $ 22 $ 157
Total ............................. $ 60 $ 55 $ 9 $ 55Provision ........................... 43 36 5 84
Agriculture and turf ...... $ 33 $ 30 $ 8 $ 27Write-offs .......................... (43) (55) (5) (103)Recoveries ......................... 11 19 1 31
Construction andTranslation adjustments........ 7 7
forestry ................... $ 27 $ 25 $ 1 $ 28End of year balance* ............... $ 113 $ 40 $ 23 $ 176
* Finance income recognized was not material.** Primarily retail notes.Financing receivables:*** Primarily retail notes and wholesale receivables.End of year balance................. $20,682 $3,135 $5,188 $29,005
Balance individually evaluated ... $ 108 $ 8 $ 20 $ 136 A troubled debt restructuring is generally the modification ofdebt in which a creditor grants a concession it would not
2015otherwise consider to a debtor that is experiencing financialAllowance:difficulties. These modifications may include a reduction of theBeginning of year balance ........ $ 109 $ 41 $ 25 $ 175stated interest rate, an extension of the maturity dates, aProvision ........................... 22 21 3 46reduction of the face amount or maturity amount of the debt,Write-offs .......................... (26) (37) (4) (67)
Recoveries ......................... 10 15 1 26 or a reduction of accrued interest. During 2017, 2016, andTranslation adjustments........ (20) (3) (23) 2015, the company identified 474, 167, and 107 financing
receivable contracts, primarily retail notes, as troubled debtEnd of year balance* ............... $ 95 $ 40 $ 22 $ 157restructurings with aggregate balances of $16 million,
Financing receivables: $19 million, and $8 million pre-modification and $15 million,End of year balance................. $21,567 $2,740 $5,494 $29,801
$18 million, and $7 million post-modification, respectively. InBalance individually evaluated ... $ 40 $ 6 $ 46 2017, there were $3 million of troubled debt restructurings that
subsequently defaulted and were written off. In 2016 and 2015,* Individual allowances were not significant.there were no significant troubled debt restructurings that
Past-due amounts over 30 days represented 1.48 percent and subsequently defaulted and were written off. At October 29,1.50 percent of the receivables financed at October 29, 2017 2017, the company had commitments to lend approximatelyand October 30, 2016, respectively. The allowance for credit $12 million to borrowers whose accounts were modified inlosses represented .64 percent and .61 percent of financing troubled debt restructurings.
49

50
Other Receivables In certain securitizations, the company transfers retail notes tonon-VIE banking operations, which are not consolidated sinceOther receivables at October 29, 2017 and October 30, 2016the company does not have a controlling interest in the entities.consisted of the following in millions of dollars:The company’s carrying values and interests related to the
2017 2016 securitizations with the unconsolidated non-VIEs were restrictedassets (retail notes securitized, allowance for credit losses andTaxes receivable .............................................. $ 876 $ 702other assets) of $478 million and $663 million at October 29,Other ............................................................ 324 3172017 and October 30, 2016, respectively. The liabilities
Other receivables............................................ $1,200 $1,019(short-term securitization borrowings and accrued interest) were$454 million and $616 million at October 29, 2017 and
13. SECURITIZATION OF FINANCING RECEIVABLES October 30, 2016, respectively.The company, as a part of its overall funding strategy, In certain securitizations, the company transfers retail notes intoperiodically transfers certain financing receivables (retail notes) bank-sponsored, multi-seller, commercial paper conduits, whichinto VIEs that are SPEs, or non-VIE banking operations, as part are SPEs that are not consolidated. The company does notof its asset-backed securities programs (securitizations). The service a significant portion of the conduits’ receivables, andstructure of these transactions is such that the transfer of the therefore, does not have the power to direct the activities thatretail notes did not meet the accounting criteria for sales of most significantly impact the conduits’ economic performance.receivables, and is, therefore, accounted for as a secured These conduits provide a funding source to the company (asborrowing. SPEs utilized in securitizations of retail notes differ well as other transferors into the conduit) as they fund the retailfrom other entities included in the company’s consolidated notes through the issuance of commercial paper. The company’sstatements because the assets they hold are legally isolated. carrying values and variable interest related to these conduitsUse of the assets held by the SPEs or the non-VIEs is restricted were restricted assets (retail notes securitized, allowance forby terms of the documents governing the securitization credit losses, and other assets) of $1,155 million andtransactions. $1,861 million at October 29, 2017 and October 30, 2016,
respectively. The liabilities (short-term securitization borrowingsIn these securitizations, the retail notes are transferred toand accrued interest) related to these conduits were $1,096certain SPEs or to non-VIE banking operations, which in turnmillion and $1,729 million at October 29, 2017 and October 30,issue debt to investors. The debt securities issued to the third2016, respectively.party investors result in secured borrowings, which are recorded
as ‘‘Short-term securitization borrowings’’ on the consolidated The company’s carrying amount of the liabilities to thebalance sheet. The securitized retail notes are recorded as unconsolidated conduits, compared to the maximum exposure‘‘Financing receivables securitized – net’’ on the balance sheet. to loss related to these conduits, which would only be incurred
in the event of a complete loss on the restricted assets, was asThe total restricted assets on the balance sheet related to thesefollows at October 29 in millions of dollars:securitizations include the financing receivables securitized less
an allowance for credit losses, and other assets primarily2017representing restricted cash. For those securitizations in which
retail notes are transferred into SPEs, the SPEs supporting the Carrying value of liabilities ............................................... $1,096Maximum exposure to loss .............................................. 1,155secured borrowings are consolidated unless the company does
not have both the power to direct the activities that mostThe total assets of unconsolidated VIEs related to securitizationssignificantly impact the SPEs’ economic performance and thewere approximately $40 billion at October 29, 2017.obligation to absorb losses or the right to receive benefits thatThe components of consolidated restricted assets related tocould potentially be significant to the SPEs. No additionalsecured borrowings in securitization transactions at October 29,support to these SPEs beyond what was previously contractually2017 and October 30, 2016 were as follows in millions ofrequired has been provided during the reporting periods.dollars:
In certain securitizations, the company consolidates the SPEssince it has both the power to direct the activities that most 2017 2016
significantly impact the SPEs’ economic performance through itsFinancing receivables securitized (retail notes) ..... $4,172 $5,141role as servicer of all the receivables held by the SPEs, and theAllowance for credit losses ............................... (13) (14)
obligation through variable interests in the SPEs to absorbOther assets.................................................. 105 115
losses or receive benefits that could potentially be significant toTotal restricted securitized assets ................... $4,264 $5,242the SPEs. The restricted assets (retail notes securitized,
allowance for credit losses, and other assets) of theThe components of consolidated secured borrowings and otherconsolidated SPEs totaled $2,631 million and $2,718 million atliabilities related to securitizations at October 29, 2017 andOctober 29, 2017 and October 30, 2016, respectively. TheOctober 30, 2016 were as follows in millions of dollars:liabilities (short-term securitization borrowings and accrued
interest) of these SPEs totaled $2,571 million and $2,655 million2017 2016
at October 29, 2017 and October 30, 2016, respectively. TheShort-term securitization borrowings ..................... $4,119 $4,998credit holders of these SPEs do not have legal recourse to theAccrued interest on borrowings ............................ 2 2company’s general credit.Total liabilities related to
restricted securitized assets ............................ $4,121 $5,000
50

51
The secured borrowings related to these restricted securitized and October 30, 2016 in millions of dollars would have been asretail notes are obligations that are payable as the retail notes follows:are liquidated. Repayment of the secured borrowings depends
2017 2016primarily on cash flows generated by the restricted assets. Dueto the company’s short-term credit rating, cash collections from Raw materials and supplies .................................... $1,688 $1,369these restricted assets are not required to be placed into a Work-in-process .................................................. 495 453
Finished goods and parts ...................................... 3,182 2,976segregated collection account until immediately prior to the timepayment is required to the secured creditors. At October 29, Total FIFO value ............................................... 5,365 4,7982017, the maximum remaining term of all securitized retail notes Less adjustment to LIFO value ................................ 1,461 1,457was approximately five years.
Inventories ........................................................ $3,904 $3,34114. EQUIPMENT ON OPERATING LEASES
Operating leases arise primarily from the leasing of John Deere 16. PROPERTY AND DEPRECIATION
equipment to retail customers. Initial lease terms generally range A summary of property and equipment at October 29, 2017 andfrom 12 to 60 months. Net equipment on operating leases at October 30, 2016 in millions of dollars follows:October 29, 2017 and October 30, 2016 consisted of the
Useful Lives*following in millions of dollars:(Years) 2017 2016
2017 2016Equipment Operations
Land .............................................. $ 122 $ 119Equipment on operating leases:Buildings and building equipment ........ 22 3,396 3,230Agriculture and turf....................................... $5,385 $4,758Machinery and equipment .................. 11 5,378 5,180Construction and forestry ............................... 1,209 1,144Dies, patterns, tools, etc. ................... 8 1,647 1,604
Equipment on operating leases – net ................. $6,594 $5,902All other ......................................... 5 942 893Construction in progress .................... 358 370
The equipment is depreciated on a straight-line basis over theTotal at cost................................. 11,843 11,396
term of the lease. The accumulated depreciation on this Less accumulated depreciation ............ 6,826 6,277equipment was $1,315 million and $1,054 million at October 29,
Total........................................... 5,017 5,1192017 and October 30, 2016, respectively. The correspondingFinancial Servicesdepreciation expense was $853 million in 2017, $742 million inLand .............................................. 4 42016, and $577 million in 2015.Buildings and building equipment ........ 26 74 73
Future payments to be received on operating leases totaled All other ......................................... 6 38 36$2,051 million at October 29, 2017 and are scheduled in millions
Total at cost................................. 116 113of dollars as follows: 2018 – $878, 2019 – $602, 2020 – $347,Less accumulated depreciation ............ 65 612021 – $182, and 2022 – $42.
Total........................................... 51 52At October 29, 2017 and October 30, 2016, the company’sProperty and equipment-net ............. $ 5,068 $ 5,171financial services operations had $52 million and $68 million,
respectively, of deposits withheld from dealers available for * Weighted-averagespotential losses on residual values.
Total property and equipment additions in 2017, 2016, and15. INVENTORIES
2015 were $602 million, $674 million, and $666 million andMost inventories owned by Deere & Company and its U.S. depreciation was $726 million, $701 million, and $692 million,equipment subsidiaries are valued at cost, on the ‘‘last-in, respectively. Capitalized interest was $3 million, $3 million, andfirst-out’’ (LIFO) basis. Remaining inventories are generally valued $6 million in the same periods, respectively. The cost of leasedat the lower of cost, on the ‘‘first-in, first-out’’ (FIFO) basis, or property and equipment under capital leases of $40 million andnet realizable value. The value of gross inventories on the LIFO $33 million and accumulated depreciation of $15 million andbasis represented 61 percent of worldwide gross inventories at $16 million at October 29, 2017 and October 30, 2016,FIFO value at both October 29, 2017 and October 30, 2016, respectively, is included in property and equipment.respectively. The pretax favorable income effect from the
Capitalized software has an estimated useful life of three years.liquidation of LIFO inventory during 2016 was approximatelyThe amounts of total capitalized software costs, including$4 million. If all inventories had been valued on a FIFO basis,purchased and internally developed software, classified asestimated inventories by major classification at October 29, 2017‘‘Other Assets’’ at October 29, 2017 and October 30, 2016 were$1,078 million and $1,035 million, less accumulated amortizationof $826 million and $770 million, respectively. Capitalizedinterest on software was $1 million and $3 million at October 29,2017 and October 30, 2016, respectively. Amortization of thesesoftware costs in 2017, 2016, and 2015 was $118 million,$102 million, and $103 million, respectively.
The cost of compliance with foreseeable environmentalrequirements has been accrued and did not have a materialeffect on the company’s consolidated financial statements.
51

52
17. GOODWILL AND OTHER INTANGIBLE ASSETS – NET 18. TOTAL SHORT-TERM BORROWINGS
The changes in amounts of goodwill by operating segments Total short-term borrowings at October 29, 2017 andwere as follows in millions of dollars: October 30, 2016 consisted of the following in millions of
dollars:Agriculture Construction
and Turf and Forestry Total 2017 2016
Goodwill at November 1, 2015 ......... $ 227 $ 499 $ 726 Equipment Operations
Acquisitions* ................................ 95 95 Notes payable to banks ........................................ $ 221 $ 164Translation adjustments and other .... 1 (6) (5) Long-term borrowings due within one year ............... 154 85
Goodwill at October 30, 2016 .......... 323 493 816 Total ............................................................. 375 249Acquisitions* ................................ 193 193
Financial ServicesTranslation adjustments and other .... 5 19 24 Commercial paper................................................ 3,439 1,253Goodwill at October 29, 2017 ........ $ 521 $ 512 $ 1,033 Notes payable to banks ........................................ 157 151
Long-term borrowings due within one year* ............. 6,064 5,258* See Note 4.
Total ............................................................. 9,660 6,662There were no accumulated impairment losses in the reported
Short-term borrowings ....................................... 10,035 6,911periods.
Financial ServicesThe components of other intangible assets are as follows in
Short-term securitization borrowings**.................... 4,119 4,998millions of dollars:
Total short-term borrowings................................ $14,154 $11,909Useful Lives*
* Includes unamortized fair value adjustments related to interest rate swaps.(Years) 2017 2016
Unamortized debt issuance costs were $2 million and $1 million, respectively.** Includes unamortized debt issuance costs of $4 million and $5 million,Amortized intangible assets:
respectively.Customer lists and relationships ............... 11 $ 42 $ 42Technology, patents, trademarks, and other 13 139 131 The short-term securitization borrowings for financial services
Total at cost ..................................... 181 173 are secured by financing receivables (retail notes) on the balanceLess accumulated amortization** ............. 86 69 sheet (see Note 13). Although these securitization borrowings
are classified as short-term since payment is required if the retailTotal ............................................... 95 104notes are liquidated early, the payment schedule for theseUnamortized intangible assets:borrowings of $4,119 million, which are net of debt acquisitionIn-process research and development*** ... 123costs, at October 29, 2017 based on the expected liquidation of
Other intangible assets – net .................... $218 $104the retail notes in millions of dollars is as follows:
* Weighted-averages 2018 – $2,234, 2019 – $1,249, 2020 – $489, 2021 – $146, and** Accumulated amortization at 2017 and 2016 for customer lists and 2022 – $5.
relationships was $17 million and $11 million and technology, patents,The weighted-average interest rates on total short-termtrademarks, and other was $69 million and $58 million, respectively.
***See Note 4. borrowings, excluding current maturities of long-termborrowings, at October 29, 2017 and October 30, 2016 were
Other intangible assets are stated at cost less accumulated1.8 percent and 1.6 percent, respectively.
amortization. The amortization of other intangible assets inLines of credit available from U.S. and foreign banks were $7,8782017, 2016, and 2015 was $18 million, $15 million, andmillion at October 29, 2017. At October 29, 2017, $4,061 million of$10 million, respectively. The estimated amortization expense forthese worldwide lines of credit were unused. For the purpose ofthe next five years is as follows in millions of dollars: 2018 – $16,computing the unused credit lines, commercial paper, and2019 – $15, 2020 – $12, 2021 – $9, and 2022 – $9.short-term bank borrowings, excluding secured borrowings and thecurrent portion of long-term borrowings, were primarily consideredto constitute utilization. Included in the total credit lines atOctober 29, 2017 were 364-day credit facility agreements of$1,750 million, expiring in February 2018, and $750 million, expiringin October 2018. In addition, total credit lines included long-termcredit facility agreements of $2,500 million, expiring in April 2021,and $2,500 million, expiring in April 2022. The agreements aremutually extendable and the annual facility fees are not significant.These credit agreements require Capital Corporation to maintain itsconsolidated ratio of earnings to fixed charges at not less than 1.05to 1 for each fiscal quarter and the ratio of senior debt, excludingsecuritization indebtedness, to capital base (total subordinated debtand stockholder’s equity excluding accumulated othercomprehensive income (loss)) at not more than 11 to 1 at the endof any fiscal quarter. The credit agreements also require theequipment operations to maintain a ratio of total debt to totalcapital (total debt and stockholders’ equity excluding accumulated
52

53
other comprehensive income (loss)) of 65 percent or less at the end 20. LONG-TERM BORROWINGS
of each fiscal quarter. Under this provision, the company’s excess Long-term borrowings at October 29, 2017 and October 30,equity capacity and retained earnings balance free of restriction at 2016 consisted of the following in millions of dollars:October 29, 2017 was $10,965 million. Alternatively under this
2017 2016provision, the equipment operations had the capacity to incurEquipment Operationsadditional debt of $20,364 million at October 29, 2017. All of theseU.S. dollar notes and debentures:requirements of the credit agreements have been met during the
4.375% notes due 2019 .................................... $ 750 $ 750periods included in the consolidated financial statements.8-1/2% debentures due 2022 ............................. 105 105
Deere & Company has an agreement with Capital Corporation 2.60% notes due 2022 ...................................... 1,000 1,000pursuant to which it has agreed to continue to own, directly or 6.55% debentures due 2028 .............................. 200 200through one or more wholly-owned subsidiaries, at least 51 percent 5.375% notes due 2029 .................................... 500 500of the voting shares of capital stock of Capital Corporation and to 8.10% debentures due 2030 .............................. 250 250
7.125% notes due 2031 .................................... 300 300maintain Capital Corporation’s consolidated tangible net worth at not3.90% notes due 2042 ...................................... 1,250 1,250less than $50 million. This agreement also obligates Deere &
Euro notes:Company to make payments to Capital Corporation such that itsMedium-term notes due 2020 – 2023: (principalconsolidated ratio of earnings to fixed charges is not less than 1.05e850 - 2017) Average interest rate ofto 1 for each fiscal quarter. Deere & Company’s obligations to make.3% - 2017 .................................................. 990
payments to Capital Corporation under the agreement areOther notes .................................................... 166 231
independent of whether Capital Corporation is in default on its Less debt issuance costs ................................... 20 21indebtedness, obligations or other liabilities. Further, Deere &
Total ......................................................... 5,491 4,565Company’s obligations under the agreement are not measured by theFinancial Servicesamount of Capital Corporation’s indebtedness, obligations or otherNotes and debentures:liabilities. Deere & Company’s obligations to make payments under
Medium-term notes due 2018 – 2027: (principalthis agreement are expressly stated not to be a guaranty of any$18,678 - 2017, $17,203 - 2016) Averagespecific indebtedness, obligation or liability of Capital Corporation andinterest rates of 2.0% - 2017, 1.7% - 2016......... 18,601* 17,434*are enforceable only by or in the name of Capital Corporation. No
2.75% senior note due 2022: ($500 principal)payments were required under this agreement during the periods Swapped $500 to variable interest rate ofincluded in the consolidated financial statements. 2.0% - 2017, 1.6% - 2016............................... 502* 519*
Other notes .................................................... 1,339 1,22119. ACCOUNTS PAYABLE AND ACCRUED EXPENSES
Less debt issuance costs ................................... 42 36Accounts payable and accrued expenses at October 29, 2017Total ......................................................... 20,400 19,138and October 30, 2016 consisted of the following in millions of
dollars: Long-term borrowings**..................................... $25,891 $23,703
2017 2016 * Includes unamortized fair value adjustments related to interest rate swaps.** All interest rates are as of year end.
Equipment Operations
Accounts payable: The approximate principal amounts of the equipment operations’Trade payables.................................................... $2,069 $1,598 long-term borrowings maturing in each of the next five years inDividends payable................................................ 194 189
millions of dollars are as follows: 2018 – $154, 2019 – $873,Other ................................................................ 164 193
2020 – $451, 2021 – $4 and 2022 – $1,108. The approximateAccrued expenses:principal amounts of the financial services’ long-term borrowingsDealer sales discounts .......................................... 1,559 1,371maturing in each of the next five years in millions of dollars areProduct warranties .............................................. 1,007 779as follows: 2018 – $6,050, 2019 – $5,383, 2020 – $5,056,Employee benefits ............................................... 861 861
Unearned revenue ............................................... 520 401 2021 – $2,486, and 2022 – $3,502.Other ................................................................ 1,344 1,269
21. LEASES
Total ............................................................. 7,718 6,661 At October 29, 2017, future minimum lease payments underFinancial Services capital leases amounted to $26 million as follows: 2018 – $10,Accounts payable: 2019 – $6, 2020 – $5, 2021 – $3, 2022 – $1, and later years $1.
Deposits withheld from dealers and merchants .......... 207 230 Total rental expense for operating leases was $167 million inOther ................................................................ 275 268 2017, $185 million in 2016, and $200 million in 2015. At
Accrued expenses:October 29, 2017, future minimum lease payments under
Unearned revenue ............................................... 797 735operating leases amounted to $371 million as follows:Accrued interest .................................................. 148 1252018 – $98, 2019 – $76, 2020 – $58, 2021 – $44, 2022 – $39,Employee benefits ............................................... 55 52and later years $56.Other ................................................................ 345 185
22. COMMITMENTS AND CONTINGENCIESTotal ............................................................. 1,827 1,595
The company generally determines its warranty liability byEliminations* ......................................................... 1,128 1,016applying historical claims rate experience to the estimated
Accounts payable and accrued expenses .................... $8,417 $7,240amount of equipment that has been sold and is still under
* Primarily trade receivable valuation accounts which are reclassified as accrued warranty based on dealer inventories and retail sales. Theexpenses by the equipment operations as a result of their trade receivablesbeing sold to financial services.
53

54
historical claims rate is primarily determined by a review of 23. CAPITAL STOCK
five-year claims costs and current quality developments. Changes in the common stock account in millions were as follows:The premiums for the company’s extended warranties are primarily
Number ofrecognized in income in proportion to the costs expected to be
Shares Issued Amountincurred over the contract period. The unamortized extended
Balance at November 2, 2014 .................. 536.4 $ 3,675warranty premiums (unearned revenue) included in the followingStock options and other ......................... 151table totaled $461 million and $447 million at October 29, 2017Balance at November 1, 2015 .................. 536.4 3,826and October 30, 2016, respectively.Stock options and other ......................... 86A reconciliation of the changes in the warranty liability andBalance at October 30, 2016 ................... 536.4 3,912unearned premiums in millions of dollars follows:Stock options and other ......................... 369
Warranty Liability/Balance at October 29, 2017 .................. 536.4 $ 4,281Unearned Premiums
2017 2016The number of common shares the company is authorized to
Beginning of year balance ............................. $1,226 $1,261 issue is 1,200 million. The number of authorized preferredPayments ..................................................... (743) (783) shares, none of which has been issued, is nine million.Amortization of premiums received.................... (207) (202)
The Board of Directors at its meeting in December 2013Accruals for warranties ................................... 959 758authorized the repurchase of up to $8,000 million of commonPremiums received ......................................... 224 181stock (60.0 million shares based on the fiscal year end closingForeign exchange .......................................... 9 11common stock price of $133.25 per share). At the end of the
End of year balance ...................................... $1,468 $1,226fiscal year, this repurchase program had $3,260 million(24.5 million shares at the same price) remaining to be
At October 29, 2017, the company had approximately $131 repurchased. Repurchases of the company’s common stockmillion of guarantees issued primarily to banks outside the U.S. under this plan will be made from time to time, at the company’srelated to third-party receivables for the retail financing of John discretion, in the open market.Deere equipment. The company may recover a portion of any
A reconciliation of basic and diluted net income per sharerequired payments incurred under these agreements fromattributable to Deere & Company follows in millions, except perrepossession of the equipment collateralizing the receivables. Atshare amounts:October 29, 2017, the company had accrued losses of
approximately $4 million under these agreements. The maximum2017 2016 2015
remaining term of the receivables guaranteed at October 29,Net income attributable to2017 was approximately five years.
Deere & Company.............................. $2,159.1 $1,523.9 $1,940.0At October 29, 2017, the company had commitments of Less income allocable toapproximately $170 million for the construction and acquisition participating securities ....................... .6 .7 .8of property and equipment. At October 29, 2017, the company
Income allocable to common stock ........... $2,158.5 $1,523.2 $1,939.2also had pledged or restricted assets of $122 million, primarily as
Average shares outstanding .................... 319.5 315.2 333.6collateral for borrowings and restricted other assets. In addition,see Note 13 for restricted assets associated with borrowings
Basic per share.................................... $ 6.76 $ 4.83 $ 5.81related to securitizations.
Average shares outstanding .................... 319.5 315.2 333.6The company also had other miscellaneous contingencies Effect of dilutive stock options ................ 3.8 1.4 2.4totaling approximately $70 million at October 29, 2017, for
Total potential shares outstanding ........ 323.3 316.6 336.0which it believes the probability for payment is substantiallyremote. The accrued liability for these contingencies was not Diluted per share................................. $ 6.68 $ 4.81 $ 5.77material at October 29, 2017.
All stock options outstanding were included in the computationThe company is subject to various unresolved legal actions whichduring 2017, 2016, and 2015, except .2 million in 2017 andarise in the normal course of its business, the most prevalent of9.9 million in 2016 that had an antidilutive effect under thewhich relate to product liability (including asbestos relatedtreasury stock method.liability), retail credit, employment, software licensing, patent,
trademark, and environmental matters. The company believes 24. STOCK OPTION AND RESTRICTED STOCK AWARDSthe reasonably possible range of losses for these unresolved
The company issues stock options and restricted stock awards tolegal actions in addition to the amounts accrued would not have
key employees under plans approved by stockholders. Restricteda material effect on its financial statements.
stock is also issued to nonemployee directors for their servicesas directors under a plan approved by stockholders. Options areawarded with the exercise price equal to the market price andbecome exercisable in one to three years after grant. Optionsexpire ten years after the date of grant. Restricted stock awardsgenerally vest after three years. The compensation cost for stockoptions, service based restricted stock units, and market/servicebased restricted stock units, which is based on the fair value at
54

55
the grant date, is recognized on a straight-line basis over the $98 million, respectively. During 2017, 2016, and 2015, cashrequisite period the employee is required to render service. The received from stock option exercises was $529 million,compensation cost for performance/service based units, which is $36 million, and $172 million with tax benefits of $83 million,based on the fair value at the grant date, is recognized over the $8 million, and $36 million, respectively.employees’ requisite service period and periodically adjusted for The company granted 579 thousand, 255 thousand, andthe probable number of shares to be awarded. According to 248 thousand restricted stock units to employees andthese plans at October 29, 2017, the company is authorized to nonemployee directors in 2017, 2016, and 2015, of which 465grant an additional 11.3 million shares related to stock options thousand, 113 thousand, and 122 thousand are subject toor restricted stock. service based only conditions, 57 thousand, 71 thousand, andThe fair value of each option award was estimated on the date 63 thousand are subject to performance/service basedof grant using a binomial lattice option valuation model. conditions, 57 thousand, 71 thousand, and 63 thousand areExpected volatilities are based on implied volatilities from traded subject to market/service based conditions, respectively. Thecall options on the company’s stock. The expected volatilities are service based only units award one share of common stock forconstructed from the following three components: the starting each unit at the end of the vesting period and include dividendimplied volatility of short-term call options traded within a few equivalent payments.days of the valuation date; the predicted implied volatility of The performance/service based units are subject to along-term call options; and the trend in implied volatilities over performance metric based on the company’s compound annualthe span of the call options’ time to maturity. The company uses revenue growth rate, compared to a benchmark group ofhistorical data to estimate option exercise behavior and companies over the vesting period. The market/service basedemployee termination within the valuation model. The expected units are subject to a market related metric based on totalterm of options granted is derived from the output of the option shareholder return, compared to the same benchmark group ofvaluation model and represents the period of time that options companies over the vesting period. The performance/servicegranted are expected to be outstanding. The risk-free rates based units and the market/service based units both awardutilized for periods throughout the contractual life of the common stock in a range of zero to 200 percent for each unitoptions are based on U.S. Treasury security yields at the time of granted based on the level of the metric achieved and do notgrant. include dividend equivalent payments over the vesting period.The assumptions used for the binomial lattice model to The weighted-average fair values of the service based only unitsdetermine the fair value of options follow: at the grant dates during 2017, 2016, and 2015 were $101.03,
$79.84, and $88.66 per unit, respectively, based on the market2017 2016 2015 price of a share of underlying common stock. The fair value of
the performance/service based units at the grant date duringRisk-free interest rate ...... .88% – 2.5% .23% – 2.3% .04% – 2.3%2017, 2016, and 2015 were $93.86, $72.93, and $81.78 perExpected dividends ......... 2.4% 2.8% 2.5%
Expected volatility........... 24.0% – 24.8% 25.2% – 29.0% 23.4% – 25.7% unit, respectively, based on the market price of a share ofWeighted-average underlying common stock excluding dividends. The fair value of
volatility .................... 24.5% 26.5% 25.6% the market/service based units at the grant date during 2017,Expected term (in years) ... 7.8 – 8.6 7.0 – 8.6 7.2 – 8.2 2016, and 2015 were $129.70, $103.66, and $113.97 per unit,
respectively, based on a lattice valuation model excludingStock option activity at October 29, 2017 and changes duringdividends.2017 in millions of dollars and shares follow:The company’s restricted shares at October 29, 2017 and
Remaining changes during 2017 in millions of shares follow:Contractual Aggregate
Exercise Term Intrinsic Grant-DateShares Price* (Years) Value Shares Fair Value*
Outstanding at beginning of Service based only
year ................................ 17.5 $ 78.73 Nonvested at beginning of year ........................ .3 $ 84.86Granted ............................... .7 100.55 Granted....................................................... .5 101.03Exercised.............................. (6.9) 76.56 Vested ........................................................ (.1) 86.40Expired or forfeited ................ (.1) 86.81
Nonvested at end of year ................................ .7 95.90Outstanding at end of year .... 11.2 81.39 6.17 $581.6
Performance/service and market/service based
Exercisable at end of year ...... 7.8 79.64 5.34 418.9 Nonvested at beginning of year ........................ .4 $ 94.88* Weighted-averages Granted....................................................... .1 111.78
Performance change ...................................... (.1) 81.53The weighted-average grant-date fair values of options granted
Nonvested at end of year ................................ .4 98.46during 2017, 2016, and 2015 were $24.46, $16.88, and $19.67,respectively. The total intrinsic values of options exercised during * Weighted-averages2017, 2016, and 2015 were $225 million, $23 million, and
55

56
During 2017, 2016, and 2015, the total share-based Following are amounts recorded in and reclassifications out ofcompensation expense was $68 million, $71 million, and other comprehensive income (loss), and the income tax effects,$66 million, respectively, with recognized income tax benefits of in millions of dollars:$25 million, $26 million, and $25 million, respectively. At
Before Tax AfterOctober 29, 2017, there was $46 million of total unrecognizedTax (Expense) Tax
compensation cost from share-based compensationAmount Credit Amount
arrangements granted under the plans, which is related to2017restricted shares and options. This compensation is expected toCumulative translation adjustment ............. $ 232 $ (2) $ 230be recognized over a weighted-average period of approximately
two years. The total grant-date fair values of stock options and Unrealized gain (loss) on derivatives:Unrealized hedging gain (loss) ............... 3 (1) 2restricted shares vested during 2017, 2016, and 2015 wereReclassification of realized (gain) loss to:$72 million, $69 million, and $74 million, respectively.
Interest rate contracts – Interest expense... 2 (1) 1The company currently uses shares that have been repurchased Foreign exchange contracts – Otherthrough its stock repurchase programs to satisfy share option operating expenses ...................... 1 1exercises. At fiscal year end, the company had 215 million shares
Net unrealized gain (loss) on derivatives 6 (2) 4in treasury stock and 24 million shares remaining to be
Unrealized gain (loss) on investments:repurchased under its current publicly announced repurchaseUnrealized holding gain (loss) ................ 274 (101) 173program (see Note 23).Reclassification of realized (gain) loss –
25. OTHER COMPREHENSIVE INCOME ITEMS Other income ................................. (275) 101 (174)
The after-tax changes in accumulated other comprehensive Net unrealized gain (loss) on investments (1) (1)income at November 2, 2014, November 1, 2015, October 30,
Retirement benefits adjustment:2016, and October 29, 2017 in millions of dollars follow: Pensions
Net actuarial gain (loss) .................... 702 (248) 454Total
Reclassification through amortizationAccumulated
of actuarial (gain) loss and priorUnrealized Unrealized Other
service (credit) cost to net income:*Retirement Cumulative Gain (Loss) Gain (Loss) Comprehensive
Actuarial (gain) loss ...................... 247 (89) 158Benefits Translation on on Income
Prior service (credit) cost ............... 12 (4) 8Adjustment Adjustment Derivatives Investments (Loss)
Settlements/curtailments............... 2 (1) 12014..... $(3,493) $ (303) $ 13 $(3,783) Health care and life insurancePeriod Net actuarial gain (loss) .................... 309 (115) 194Change (8) (935) $ (2) (1) (946) Reclassification through amortization of
actuarial (gain) loss and prior service2015..... (3,501) (1,238) (2) 12 (4,729)
(credit) cost to net income:*PeriodActuarial (gain) loss ................... 99 (36) 63Change (908) 9 3 (1) (897)Prior service (credit) cost ............ (77) 28 (49)
2016..... (4,409) (1,229) 1 11 (5,626)Net unrealized gain (loss) on retirementPeriod
benefits adjustment ......................... 1,294 (465) 829Change 829 230 4 (1) 1,062Total other comprehensive income (loss) ..... $ 1,531 $ (469) $ 1,062
2017..... $(3,580) $ (999) $ 5 $ 10 $(4,564)* These accumulated other comprehensive income amounts are included in net
periodic pension and postretirement costs. See Note 7 for additional detail.
56

57
Before Tax After Before Tax AfterTax (Expense) Tax Tax (Expense) Tax
Amount Credit Amount Amount Credit Amount
2016 2015
Cumulative translation adjustment ............ $ 8 $ 1 $ 9 Cumulative translation adjustment .............. $(938) $ 3 $(935)
Unrealized gain (loss) on derivatives: Unrealized gain (loss) on derivatives:Unrealized hedging gain (loss)............... (2) 1 (1) Unrealized hedging gain (loss) ................ (12) 4 (8)Reclassification of realized (gain) loss to: Reclassification of realized (gain) loss to:
Interest rate contracts – Interest expense 7 (2) 5 Interest rate contracts – Interest expense ... 12 (4) 8Foreign exchange contracts – Other Foreign exchange contracts – Other
operating expenses ...................... (1) (1) operating expenses ....................... (4) 2 (2)
Net unrealized gain (loss) on derivatives 4 (1) 3 Net unrealized gain (loss) on derivatives ... (4) 2 (2)
Unrealized gain (loss) on investments: Unrealized gain (loss) on investments:Unrealized holding gain (loss) ............... 2 2 Unrealized holding gain (loss) ................. 12 (4) 8Reclassification of realized (gain) Reclassification of realized (gain)
loss – Other income ........................ (4) 1 (3) loss – Other income .......................... (14) 5 (9)
Net unrealized gain (loss) on investments (2) 1 (1) Net unrealized gain (loss) on investments (2) 1 (1)
Retirement benefits adjustment: Retirement benefits adjustment:Pensions Pensions
Net actuarial gain (loss) and prior Net actuarial gain (loss) and priorservice credit (cost) ...................... (1,141) 397 (744) service credit (cost)........................ (427) 151 (276)
Reclassification through amortization of Reclassification through amortization ofactuarial (gain) loss and prior service actuarial (gain) loss and prior service(credit) cost to net income:* (credit) cost to net income:*
Actuarial (gain) loss .................. 211 (77) 134 Actuarial (gain) loss .................... 223 (81) 142Prior service (credit) cost............ 16 (6) 10 Prior service (credit) cost ............. 25 (9) 16Settlements/curtailments ........... 14 (4) 10 Settlements/curtailments ............ 11 (4) 7
Health care and life insurance Health care and life insuranceNet actuarial gain (loss) and prior Net actuarial gain (loss) and prior
service credit (cost) ...................... (493) 178 (315) service credit (cost)........................ 145 (52) 93Reclassification through amortization of Reclassification through amortization of
actuarial (gain) loss and prior service actuarial (gain) loss and prior service(credit) cost to net income:* (credit) cost to net income:*
Actuarial (gain) loss .................. 73 (27) 46 Actuarial (gain) loss .................... 91 (34) 57Prior service (credit) cost............ (78) 29 (49) Prior service (credit) cost ............. (77) 29 (48)
Settlements/curtailments ............ 1 1Net unrealized gain (loss) on retirementbenefits adjustment ........................ (1,398) 490 (908) Net unrealized gain (loss) on retirement
benefits adjustment .......................... (8) (8)Total other comprehensive income (loss) .... $(1,388) $ 491 $ (897)Total other comprehensive income (loss) ...... $(952) $ 6 $(946)
* These accumulated other comprehensive income amounts are included in netperiodic pension and postretirement costs. See Note 7 for additional detail. * These accumulated other comprehensive income amounts are included in net
periodic pension and postretirement costs. See Note 7 for additional detail.
The noncontrolling interests’ comprehensive income (loss) was$.3 million in 2017, $(2.4) million in 2016, and $.5 million in2015, which consisted of net income (loss) of $.1 million in2017, $(2.4) million in 2016, and $.9 million in 2015 andcumulative translation adjustments of $.2 million in 2017, nonein 2016, and $(.4) million in 2015.
57

58
26. FAIR VALUE MEASUREMENTS interest rates. Certain long-term borrowings have been swappedto current variable interest rates. The carrying values of theseFair value is defined as the price that would be received to selllong-term borrowings included adjustments related to fair valuean asset or paid to transfer a liability in an orderly transactionhedges.between market participants at the measurement date. To
determine fair value, the company uses various methods Assets and liabilities measured at October 29, 2017 andincluding market and income approaches. The company utilizes October 30, 2016 at fair value on a recurring basis in millions ofvaluation models and techniques that maximize the use of dollars follow:observable inputs. The models are industry-standard models that
2017* 2016*consider various assumptions including time values and yieldcurves as well as other economic measures. These valuation Marketable securitiestechniques are consistently applied. Equity fund ................................................ $ 48 $ 45
Fixed income fund ....................................... 15 15Level 1 measurements consist of quoted prices in active marketsU.S. government debt securities...................... 77 88
for identical assets or liabilities. Level 2 measurements includeMunicipal debt securities............................... 39 43
significant other observable inputs such as quoted prices for Corporate debt securities .............................. 135 118similar assets or liabilities in active markets; identical assets or International debt securities........................... 20 34liabilities in inactive markets; observable inputs such as interest Mortgage-backed securities** ........................ 118 111rates and yield curves; and other market-corroborated inputs.
Total marketable securities................................ 452 454Level 3 measurements include significant unobservable inputs. Other assets
Derivatives:The fair values of financial instruments that do not approximateInterest rate contracts .................................. 116 294the carrying values at October 29, 2017 and October 30, 2016 inForeign exchange contracts ........................... 108 60millions of dollars follow:Cross-currency interest rate contracts .............. 11 21
2017 2016 Total assets*** .................................................. $ 687 $ 829
Carrying Fair Carrying Fair Accounts payable and accrued expensesValue Value* Value Value* Derivatives:
Interest rate contracts .................................. $ 131 $ 29Financing receivables – net ......... $ 25,104 $ 24,946 $ 23,702 $ 23,564Foreign exchange contracts ........................... 26 43
Financing receivables Cross-currency interest rate contracts .............. 1securitized – net.................... $ 4,159 $ 4,130 $ 5,127 $ 5,114
Total liabilities ................................................... $ 158 $ 72Short-term securitization
* All measurements above were Level 2 measurements except for Level 1borrowings........................... $ 4,119 $ 4,118 $ 4,998 $ 5,005measurements of the equity fund of $48 million and $45 million at October 29,2017 and October 30, 2016, respectively, the fixed income fund of $15 millionLong-term borrowings due withinand $15 million at October 29, 2017 and October 30, 2016, respectively, andone year:U.S. government debt securities of $44 million and $53 million at October 29,Equipment operations ............ $ 154 $ 154 $ 85 $ 802017 and October 30, 2016, respectively. In addition, $17 million and $28 millionFinancial services ................... 6,064 6,079 5,258 5,259of the international debt securities were Level 3 measurements at October 29,2017 and October 30, 2016, respectively. There were no transfers betweenTotal ............................... $ 6,218 $ 6,233 $ 5,343 $ 5,339Level 1 and Level 2 during 2017 and 2016.
Long-term borrowings: ** Primarily issued by U.S. government sponsored enterprises.Equipment operations ............ $ 5,491 $ 6,026 $ 4,565 $ 5,184 *** Excluded from this table were cash equivalents, which were carried at costFinancial services ................... 20,400 20,606 19,138 19,273 that approximates fair value. The cash equivalents consist primarily of money
market funds that were Level 1 measurements.Total ............................... $ 25,891 $ 26,632 $ 23,703 $ 24,457
Fair value, recurring Level 3 measurements from* Fair value measurements above were Level 3 for all financing receivables andLevel 2 for all borrowings. available-for-sale marketable securities at October 29, 2017 and
October 30, 2016 in millions of dollars follow:Fair values of the financing receivables that were issuedlong-term were based on the discounted values of their related 2017 2016
cash flows at interest rates currently being offered by theBeginning of period balance .................................. $ 28 $ 29
company for similar financing receivables. The fair values of the Purchases.......................................................... 25remaining financing receivables approximated the carrying Principal payments .............................................. (13) (22)amounts. Change in unrealized gain (loss) ............................. 2 (4)
Fair values of long-term borrowings and short-term End of period balance .......................................... $ 17 $ 28securitization borrowings were based on current market quotesfor identical or similar borrowings and credit risk, or on thediscounted values of their related cash flows at current market
58

59
Fair value, nonrecurring measurements from impairments at determined by an income approach (discounted cash flows),October 29, 2017 and October 30, 2016 in millions of dollars which includes inputs such as interest rates and margins. Thefollow: fair value for publicly traded entities is the share price multiplied
by the shares owned (see Note 5).Fair Value* Losses*
Other Assets – The impairments are measured at the lower of2017 2016 2017 2016 2015
the carrying amount, or fair value. The valuations were based onEquipment on operating leases – net .... $ 654 $ 31 $ 10 a market approach. The inputs include sales of comparable
assets (see Note 5).Property and equipment – net ........... $ 31 $ 13 $ 10
27. DERIVATIVE INSTRUMENTSInvestments in unconsolidatedaffiliates .................................... $ 28 $ 1 $ 40 $ 12 Cash Flow Hedges
Certain interest rate and cross-currency interest rate contractsOther assets .................................. $ 184 $ 29 $ 15(swaps) were designated as hedges of future cash flows from
* Fair value at October 29, 2017 was a Level 1 measurement, while fair valuesborrowings. The total notional amounts of the receive-variable/at October 30, 2016 were Level 3 measurements. See financing receivablespay-fixed interest rate contracts at October 29, 2017 andwith specific allowances in Note 12 that were not significant. See Note 5 for
impairments. October 30, 2016 were $1,700 million and $1,600 million,respectively. The total notional amounts of the cross-currency
The following is a description of the valuation methodologies interest rate contracts were $22 million and $42 million atthe company uses to measure certain financial instruments on October 29, 2017 and October 30, 2016, respectively. Thethe balance sheet and nonmonetary assets at fair value: effective portions of the fair value gains or losses on these cashMarketable Securities – The portfolio of investments, except for flow hedges were recorded in other comprehensive income (OCI)the Level 3 measurement international debt securities, is and subsequently reclassified into interest expense or otherprimarily valued on a market approach (matrix pricing model) in operating expenses (foreign exchange) in the same periodswhich all significant inputs are observable or can be derived from during which the hedged transactions affected earnings. Theseor corroborated by observable market data such as interest amounts offset the effects of interest rate or foreign currencyrates, yield curves, volatilities, credit risk, and prepayment exchange rate changes on the related borrowings. Anyspeeds. Funds are primarily valued using the fund’s net asset ineffective portions of the gains or losses on all cash flowvalue, based on the fair value of the underlying securities. The interest rate contracts designated as cash flow hedges wereLevel 3 measurement international debt securities are primarily recognized currently in interest expense or other operatingvalued using an income approach based on discounted cash expenses (foreign exchange) and were not material during anyflows using yield curves derived from limited, observable market years presented. The cash flows from these contracts weredata. recorded in operating activities in the statement of consolidated
cash flows.Derivatives – The company’s derivative financial instrumentsconsist of interest rate swaps and caps, foreign currency futures, The amount of gain recorded in OCI at October 29, 2017 that isforwards and swaps, and cross-currency interest rate swaps. The expected to be reclassified to interest expense or otherportfolio is valued based on an income approach (discounted operating expenses in the next twelve months if interest rates orcash flow) using market observable inputs, including swap curves exchange rates remain unchanged is approximately $2 millionand both forward and spot exchange rates for currencies. after-tax. These contracts mature in up to 28 months. There
were no gains or losses reclassified from OCI to earnings basedFinancing Receivables – Specific reserve impairments are basedon the probability that the original forecasted transaction wouldon the fair value of the collateral, which is measured using anot occur.market approach (appraisal values or realizable values). Inputs
include a selection of realizable values (see Note 12). Fair Value Hedges
Certain interest rate contracts (swaps) were designated as fairEquipment on Operating Leases-Net – The impairments are basedvalue hedges of borrowings. The total notional amounts of theon an income approach (discounted cash flow), using thereceive-fixed/pay-variable interest rate contracts at October 29,contractual payments, plus an estimate of equipment sale price at2017 and October 30, 2016 were $8,661 million andlease maturity. Inputs include realized sales values (see Note 5).$8,844 million, respectively. The effective portions of the fair
Property and Equipment-Net – The impairments are measured at value gains or losses on these contracts were offset by fair valuethe lower of the carrying amount, or fair value. The valuations gains or losses on the hedged items (fixed-rate borrowings). Anywere based on a cost approach. The inputs include replacement ineffective portions of the gains or losses were recognizedcost estimates adjusted for physical deterioration and economic currently in interest expense. The ineffective portions were aobsolescence (see Note 5). gain of $3 million and loss of $2 million in 2017 and 2016,
respectively. The cash flows from these contracts were recordedInvestment in Unconsolidated Affiliates – Other than temporaryin operating activities in the statement of consolidated cashimpairments for investments are measured as the differenceflows.between the implied fair value and the carrying value of the
investments. The estimated fair value for privately held entities is
59

60
The gains (losses) on these contracts and the underlying borrowings Fair values of derivative instruments in the consolidated balancerecorded in interest expense follow in millions of dollars: sheet at October 29, 2017 and October 30, 2016 in millions of
dollars follow:2017 2016
2017 2016Interest rate contracts* ........................................ $ (284) $ 7Borrowings** ..................................................... 287 (9) Other Assets* Includes changes in fair values of interest rate contracts excluding net Designated as hedging instruments:
accrued interest income of $79 million and $146 million during 2017 and Interest rate contracts ......................................... $ 74 $ 2682016, respectively. Cross-currency interest rate contracts ..................... 5 11
** Includes adjustments for fair values of hedged borrowings excluding accruedinterest expense of $243 million and $290 million during 2017 and 2016, Total designated ............................................. 79 279respectively.
Not designated as hedging instruments:Interest rate contracts ......................................... 42 26
Derivatives Not Designated as Hedging InstrumentsForeign exchange contracts .................................. 108 60
The company has certain interest rate contracts (swaps andCross-currency interest rate contracts ..................... 6 10
caps), foreign exchange contracts (futures, forwards and swaps),Total not designated ....................................... 156 96and cross-currency interest rate contracts (swaps), which were
not formally designated as hedges. These derivatives were held Total derivative assets ......................................... $ 235 $ 375as economic hedges for underlying interest rate or foreign
Accounts Payable and Accrued Expensescurrency exposures primarily for certain borrowings and Designated as hedging instruments:purchases or sales of inventory. The total notional amounts of Interest rate contracts ......................................... $ 112 $ 10the interest rate swaps at October 29, 2017 and October 30,
Total designated ............................................. 112 102016 were $6,757 million and $6,060 million, the foreign
Not designated as hedging instruments:exchange contracts were $8,499 million and $3,919 million, andInterest rate contracts ......................................... 19 19the cross-currency interest rate contracts were $66 million andForeign exchange contracts .................................. 26 43$63 million, respectively. The increase in the total notionalCross-currency interest rate contracts ..................... 1
amounts of foreign exchange contracts primarily relates to theTotal not designated ....................................... 46 62Wirtgen acquisition, which closed on December 1, 2017 (see
Note 30). At October 29, 2017 and October 30, 2016, there Total derivative liabilities ...................................... $ 158 $ 72were also $253 million and $579 million, respectively, of interestrate caps purchased and the same amounts sold at the same The classification and gains (losses) including accrued interestcapped interest rate to facilitate borrowings through expense related to derivative instruments on the statement ofsecuritization of retail notes. The fair value gains or losses from consolidated income consisted of the following in millions ofthe interest rate contracts were recognized currently in interest dollars:expense and the gains or losses from foreign exchange contracts
2017 2016 2015in cost of sales or other operating expenses, generally offsettingover time the expenses on the exposures being hedged. The
Fair Value Hedgescash flows from these non-designated contracts were recorded Interest rate contracts – Interest expense .......... $ (205) $ 153 $ 277in operating activities in the statement of consolidated cash
Cash Flow Hedgesflows.Recognized in OCI(Effective Portion):Interest rate contracts – OCI (pretax)*............... 4 (3) (16)Foreign exchange contracts – OCI (pretax)* ....... (1) 1 4
Reclassified from OCI(Effective Portion):Interest rate contracts – Interest expense* ........ (2) (7) (12)Foreign exchange contracts – Other expense* .... (1) 1 4
Recognized Directly in Income(Ineffective Portion) ...................................... ** ** **
Not Designated as Hedges
Interest rate contracts – Interest expense* ........ $ 11 $ (1) $ (17)Foreign exchange contracts – Cost of sales........ (12) (15) 97Foreign exchange contracts – Other expense* .... (106) 74 304
Total not designated ................................. $ (107) $ 58 $ 384
* Includes interest and foreign exchange gains (losses) from cross-currencyinterest rate contracts.
** The amounts are not significant.
Counterparty Risk and Collateral
Certain of the company’s derivative agreements contain creditsupport provisions that may require the company to postcollateral based on the size of the net liability positions and
60

61
credit ratings. The aggregate fair value of all derivatives with The construction and forestry segment primarily manufacturescredit-risk-related contingent features that were in a net liability and distributes a broad range of machines and service partsposition at October 29, 2017 and October 30, 2016, was used in construction, earthmoving, material handling, and timber$132 million and $29 million, respectively. The company, due to harvesting – including backhoe loaders; crawler dozers andits credit rating and amounts of net liability position, has not loaders; four-wheel-drive loaders; excavators; motor graders;posted any collateral. If the credit-risk-related contingent articulated dump trucks; landscape loaders; skid-steer loaders;features were triggered, the company would be required to post and log skidders, feller bunchers, log loaders, log forwarders, logcollateral up to an amount equal to this liability position prior to harvesters, and related attachments.considering applicable netting provisions. The products and services produced by the segments above areDerivative instruments are subject to significant concentrations marketed primarily through independent retail dealer networksof credit risk to the banking sector. The company manages and major retail outlets.individual counterparty exposure by setting limits that consider The financial services segment primarily finances sales and leasesthe credit rating of the counterparty, the credit default swap by John Deere dealers of new and used agriculture and turfspread of the counterparty, and other financial commitments equipment and construction and forestry equipment. In addition,and exposures between the company and the counterparty the financial services segment provides wholesale financing tobanks. All interest rate derivatives are transacted under dealers of the foregoing equipment, finances retail revolvingInternational Swaps and Derivatives Association (ISDA) charge accounts, and offers extended equipment warranties.documentation. Some of these agreements include credit
Because of integrated manufacturing operations and commonsupport provisions. Each master agreement permits the netadministrative and marketing support, a substantial number ofsettlement of amounts owed in the event of default orallocations must be made to determine operating segment andtermination.geographic area data. Intersegment sales and revenues represent
Derivatives are recorded without offsetting for netting sales of components and finance charges, which are generallyarrangements or collateral. The impact on the derivative assets based on market prices.and liabilities related to netting arrangements and any collateral
Information relating to operations by operating segment inreceived or paid at October 29, 2017 and October 30, 2016 inmillions of dollars follows for the years ended October 29, 2017,millions of dollars follows:October 30, 2016, and November 1, 2015. In addition to the
Gross Amounts Netting Collateral Net following unaffiliated sales and revenues by segment,Recognized Arrangements Received Amount intersegment sales and revenues in 2017, 2016, and 2015 were
as follows: agriculture and turf net sales of $39 million,2017
$31 million, and $49 million, construction and forestry net salesAssets ............. $ 235 $ (65) $ 170of $1 million, $1 million, and $1 million, and financial servicesLiabilities ......... 158 (65) 93
2016 revenues of $244 million, $225 million, and $225 million,Assets ............. $ 375 $ (32) $ (6) $ 337 respectively.Liabilities ......... 72 (32) 40
OPERATING SEGMENTS 2017 2016 2015
28. SEGMENT AND GEOGRAPHIC AREA DATANet sales and revenues
The company’s operations are presently organized and reported Unaffiliated customers:in three major business segments described as follows: Agriculture and turf net sales............... $20,167 $18,487 $19,812
Construction and forestry net sales ....... 5,718 4,900 5,963The agriculture and turf segment primarily manufactures andTotal net sales............................... 25,885 23,387 25,775distributes a full line of agriculture and turf equipment and
Financial services revenues ..................... 2,935 2,694 2,591related service parts – including large, medium and utilityOther revenues* ................................... 918 563 497tractors; tractor loaders; combines, cotton pickers, cotton
strippers, and sugarcane harvesters; related harvesting front-end Total .................................................. $29,738 $26,644 $28,863equipment; sugarcane loaders and pull-behind scrapers; tillage,
* Other revenues are primarily the equipment operations’ revenues for financeseeding and application equipment, including sprayers, nutrient and interest income, and other income as disclosed in Note 31, net of certainmanagement and soil preparation machinery; hay and forage intercompany eliminations.
equipment, including self-propelled forage harvesters and (continued)attachments, balers and mowers; turf and utility equipment,including riding lawn equipment and walk-behind mowers, golfcourse equipment, utility vehicles, and commercial mowingequipment, along with a broad line of associated implements;integrated agricultural management systems technology andsolutions; and other outdoor power products.
61

62
OPERATING SEGMENTS 2017 2016 2015 OPERATING SEGMENTS 2017 2016 2015
Operating profit Identifiable operating assets
Agriculture and turf .............................. $ 2,484 $ 1,700 $ 1,649 Agriculture and turf ......................... $ 9,359 $ 8,405 $ 8,332Construction and forestry ....................... 337 180 528 Construction and forestry .................. 3,212 3,017 3,295Financial services* ................................ 722 709 963 Financial services ............................. 42,596 40,837 40,866
Corporate*..................................... 10,619 5,659 5,390Total operating profit ......................... 3,543 2,589 3,140Total ......................................... $ 65,786 $ 57,918 $ 57,883Interest income .................................... 55 48 61
Interest expense ................................... (264) (251) (273) * Corporate assets are primarily the equipment operations’ retirement benefits,deferred income tax assets, marketable securities, and cash and cashForeign exchange gains (losses) fromequivalents as disclosed in Note 31, net of certain intercompany eliminations.equipment operations’ financing activities (12) (12) 13
Corporate expenses – net ....................... (192) (153) (160)Capital additionsIncome taxes ....................................... (971) (700) (840)Agriculture and turf .............................. $ 485 $ 556 $ 522
Total .............................................. (1,384) (1,068) (1,199) Construction and forestry ....................... 114 115 138Financial services .................................. 3 3 6Net income ......................................... 2,159 1,521 1,941
Less: Net income (loss) attributable to Total .............................................. $ 602 $ 674 $ 666noncontrolling interests...................... (3) 1
Net income attributable to Deere & Investments in unconsolidated affiliatesCompany ......................................... $ 2,159 $ 1,524 $ 1,940 Agriculture and turf .............................. $ 25 $ 56 $ 116
Construction and forestry ....................... 143 165 177* Operating profit of the financial services business segment includes the effectFinancial services .................................. 14 12 10of its interest expense and foreign exchange gains or losses.
Total .............................................. $ 182 $ 233 $ 303Interest income*
Agriculture and turf .............................. $ 16 $ 12 $ 14The company views and has historically disclosed its operationsConstruction and forestry ....................... 1 1 2
Financial services .................................. 1,771 1,650 1,687 as consisting of two geographic areas, the U.S. and Canada, andCorporate ........................................... 55 48 61 outside the U.S. and Canada, shown below in millions of dollars.Intercompany....................................... (268) (240) (253) No individual foreign country’s net sales and revenues were
material for disclosure purposes.Total .............................................. $ 1,575 $ 1,471 $ 1,511
* Does not include finance rental income for equipment on operating leases. GEOGRAPHIC AREAS 2017 2016 2015
Net sales and revenuesInterest expense
Unaffiliated customers:Agriculture and turf .............................. $ 182 $ 173 $ 160U.S. and Canada:Construction and forestry ....................... 53 44 45
Equipment operations net sales (88%)* $15,031 $14,376 $16,498Financial services .................................. 669 536 455Financial services revenues (79%)* ..... 2,526 2,366 2,252Corporate ........................................... 264 251 273
Intercompany....................................... (268) (240) (253) Total........................................ 17,557 16,742 18,750Total .............................................. $ 900 $ 764 $ 680 Outside U.S. and Canada:
Equipment operations net sales ........ 10,854 9,011 9,277Depreciation* and amortization expense Financial services revenues............... 409 328 339Agriculture and turf .............................. $ 695 $ 667 $ 659 Total........................................ 11,263 9,339 9,616Construction and forestry ....................... 145 136 133
Other revenues .................................... 918 563 497Financial services .................................. 876 757 590
Total .................................................. $29,738 $26,644 $28,863Total .............................................. $ 1,716 $ 1,560 $ 1,382
* The percentages indicate the approximate proportion of each amount that* Includes depreciation for equipment on operating leases.relates to the U.S. only and are based upon a three-year average for 2017,2016, and 2015.Equity in income (loss) of
unconsolidated affiliates (continued)Agriculture and turf .............................. $ 2 $ 9 $ 7Construction and forestry ....................... (27) (13) (7)Financial services .................................. 1 2 1
Total .............................................. $ (24) $ (2) $ 1
(continued)
62

63
GEOGRAPHIC AREAS 2017 2016 2015 First Second Third FourthQuarter Quarter Quarter Quarter
Operating profit
U.S. and Canada: 2016*
Equipment operations..................... $ 1,724 $ 1,305 $ 1,643 Net sales and revenues ................. $ 5,525 $ 7,875 $ 6,724 $ 6,520Financial services ........................... 523 551 802 Net sales ................................... 4,769 7,107 5,861 5,650
Gross profit ................................ 929 1,575 1,367 1,267Total........................................ 2,247 1,856 2,445Income before income taxes .......... 351 733 705 435
Outside U.S. and Canada: Net income attributable to Deere &Equipment operations..................... 1,097 575 534 Company ................................ 254 496 489 285Financial services ........................... 199 158 161 Per share data:
Basic ..................................... .80 1.57 1.55 .91Total........................................ 1,296 733 695Diluted................................... .80 1.56 1.55 .90
Total .................................................. $ 3,543 $ 2,589 $ 3,140 Dividends declared ................... .60 .60 .60 .60Dividends paid ......................... .60 .60 .60 .60
Property and equipmentNet income per share for each quarter must be computed independently. As aU.S. .................................................. $ 2,976 $ 3,077 $ 3,098result, their sum may not equal the total net income per share for the year.Germany ............................................. 598 569 568* See Note 5 for ‘‘Special Items.’’
Other countries .................................... 1,494 1,525 1,515** Presents restated first and second quarter values for the adoption of FASB
ASU No. 2016-09, Improvements to Employee Share-Based PaymentTotal .............................................. $ 5,068 $ 5,171 $ 5,181Accounting. Net income attributable to Deere & Company was $194 millionand $802 million, respectively. Adjustments to basic and diluted per share
29. SUPPLEMENTAL INFORMATION (UNAUDITED) data were not significant.
Common stock per share sales prices from New York Stock30. SUBSEQUENT EVENTSExchange composite transactions quotations follow:A quarterly dividend of $.60 per share was declared at the Board
First Second Third Fourth of Directors meeting on December 6, 2017, payable onQuarter Quarter Quarter Quarter February 1, 2018 to stockholders of record on December 29,
2017.2017 Market price
High ...................................... $108.06 $113.15 $128.91 $133.25 On December 1, 2017, the company acquired the stock andLow ....................................... $ 88.06 $107.05 $110.79 $115.44
certain assets of substantially all of Wirtgen Group2016 Market price
Holding GmbH’s (Wirtgen) business operations. Wirtgen, whichHigh ...................................... $ 80.19 $ 85.68 $ 87.48 $ 88.09was a privately-held international company, is the leadingLow ....................................... $ 71.78 $ 74.58 $ 77.71 $ 76.83manufacturer worldwide of road construction equipment.
At October 29, 2017, there were 21,242 holders of record of the Headquartered in Germany, Wirtgen has six brands across thecompany’s $1 par value common stock. road construction sector spanning processing, mixing, paving,
compaction, and rehabilitation. Wirtgen sells products in moreQuarterly information with respect to net sales and revenues andthan 100 countries and has approximately 8,200 employees. Theearnings is shown in the following schedule. The company’stotal cash purchase price was e4,475 million (or approximatelyfiscal year ends in October and its interim periods (quarters) endUS $5,327 million based on the exchange rate at the closingin January, April, and July. Such information is shown in millionsdate), a portion of which has been held in escrow to secureof dollars except for per share amounts.certain indemnity obligations of Wirtgen. In addition to the cash
First Second Third Fourth purchase price, the company assumed substantially all liabilitiesQuarter Quarter Quarter Quarter of Wirtgen. The company financed the acquisition and the
transaction expenses from a combination of cash and new debt2017*
financing. Wirtgen will be included in the company’sNet sales and revenues ................. $ 5,625 $ 8,287 $ 7,808 $ 8,018construction and forestry operating segment. Due to the recentNet sales ................................... 4,698 7,260 6,833 7,094
Gross profit ................................ 901 1,815 1,568 1,668 closing of the acquisition, the formal process necessary toIncome before income taxes .......... 328 1,169 890 767 allocate the purchase price to the acquired assets and liabilitiesNet income attributable to Deere & has not been completed. The purchase price allocation and
Company** ............................. 199 808 642 510 proforma results of operations will be completed as soon asPer share data: practicable within the measurement period.
Basic** .................................. .63 2.53 2.00 1.59In November 2017, the company’s financial services operationsDiluted** ............................... .62 2.50 1.97 1.57
Dividends declared ................... .60 .60 .60 .60 entered into a retail note securitization using its bank conduitDividends paid ......................... .60 .60 .60 .60 facility that resulted in securitization borrowings of
approximately $985 million.(continued)
63

64
31. SUPPLEMENTAL CONSOLIDATING DATA
INCOME STATEMENT
For the Years Ended October 29, 2017, October 30, 2016, and November 1, 2015
(In millions of dollars)
EQUIPMENT OPERATIONS* FINANCIAL SERVICES
2017 2016 2015 2017 2016 2015
Net Sales and Revenues
Net sales .................................................................................. $ 25,885.1 $ 23,387.3 $ 25,775.2Finance and interest income ......................................................... 71.7 61.1 77.0 $ 2,928.2 $ 2,690.1 $ 2,557.0Other income ............................................................................ 1,065.0 653.7 602.7 250.9 229.0 258.9
Total .................................................................................... 27,021.8 24,102.1 26,454.9 3,179.1 2,919.1 2,815.9
Costs and Expenses
Cost of sales ............................................................................. 19,935.2 18,250.8 20,145.2Research and development expenses .............................................. 1,367.7 1,389.1 1,425.1Selling, administrative and general expenses .................................... 2,530.7 2,262.5 2,393.8 542.3 508.5 487.3Interest expense......................................................................... 263.7 250.5 272.8 669.2 536.5 455.0Interest compensation to Financial Services ..................................... 234.5 216.6 204.8Other operating expenses ............................................................ 257.0 215.7 195.0 1,246.8 1,167.0 911.7
Total .................................................................................... 24,588.8 22,585.2 24,636.7 2,458.3 2,212.0 1,854.0
Income of Consolidated Group before Income Taxes ....................... 2,433.0 1,516.9 1,818.2 720.8 707.1 961.9Provision for income taxes ........................................................... 726.0 459.0 509.9 245.1 241.1 330.2
Income of Consolidated Group .................................................... 1,707.0 1,057.9 1,308.3 475.7 466.0 631.7
Equity in Income (Loss) of Unconsolidated Subsidiaries and Affiliates
Financial Services .................................................................... 476.9 467.6 632.9 1.2 1.6 1.2Other ................................................................................... (24.7) (4.0) (.3)
Total................................................................................. 452.2 463.6 632.6 1.2 1.6 1.2
Net Income .............................................................................. 2,159.2 1,521.5 1,940.9 476.9 467.6 632.9
Less: Net income (loss) attributable to noncontrolling interests ............ .1 (2.4) .9
Net Income Attributable to Deere & Company ............................... $ 2,159.1 $ 1,523.9 $ 1,940.0 $ 476.9 $ 467.6 $ 632.9
* Deere & Company with Financial Services on the equity basis.
The supplemental consolidating data is presented for informational purposes. The ‘‘Equipment Operations’’ reflect the basis of consolidation described in Note 1 tothe consolidated financial statements. The consolidated group data in the ‘‘Equipment Operations’’ income statement reflect the results of the agriculture and turfoperations and construction and forestry operations. Transactions between the ‘‘Equipment Operations’’ and ‘‘Financial Services’’ have been eliminated to arrive atthe consolidated financial statements.
64

65
31. SUPPLEMENTAL CONSOLIDATING DATA (continued)
BALANCE SHEET
As of October 29, 2017 and October 30, 2016
(In millions of dollars except per share amounts)
EQUIPMENT OPERATIONS* FINANCIAL SERVICES
2017 2016 2017 2016
ASSETS
Cash and cash equivalents............................................................................ $ 8,168.4 $ 3,140.5 $ 1,166.5 $ 1,195.3Marketable securities .................................................................................. 20.2 34.2 431.4 419.3Receivables from unconsolidated subsidiaries and affiliates ................................. 1,032.1 3,150.1Trade accounts and notes receivable – net ...................................................... 876.3 654.2 4,134.1 3,370.5Financing receivables – net........................................................................... .4 25,104.1 23,701.9Financing receivables securitized – net............................................................ 4,158.8 5,126.5Other receivables........................................................................................ 1,045.6 855.4 195.5 164.0Equipment on operating leases – net.............................................................. 6,593.7 5,901.5Inventories ................................................................................................ 3,904.1 3,340.5Property and equipment – net....................................................................... 5,017.3 5,118.5 50.4 52.1Investments in unconsolidated subsidiaries and affiliates .................................... 4,812.3 4,697.0 13.8 11.9Goodwill ................................................................................................... 1,033.3 815.7Other intangible assets – net ........................................................................ 218.0 104.1Retirement benefits .................................................................................... 538.1 93.6 16.9 20.5Deferred income taxes ................................................................................. 3,098.8 3,556.0 79.8 75.5Other assets .............................................................................................. 973.9 834.9 651.4 798.1
Total Assets.............................................................................................. $ 30,738.4 $ 26,395.1 $42,596.4 $40,837.1
LIABILITIES AND STOCKHOLDERS’ EQUITY
LIABILITIES
Short-term borrowings ................................................................................ $ 375.5 $ 249.0 $ 9,659.8 $ 6,661.7Short-term securitization borrowings.............................................................. 4,118.7 4,997.8Payables to unconsolidated subsidiaries and affiliates ........................................ 121.9 81.5 996.2 3,133.6Accounts payable and accrued expenses ......................................................... 7,718.1 6,661.2 1,827.1 1,595.2Deferred income taxes ................................................................................. 115.6 87.3 857.7 745.9Long-term borrowings ................................................................................. 5,490.9 4,565.3 20,400.4 19,137.7Retirement benefits and other liabilities .......................................................... 7,341.9 8,206.0 92.9 89.0
Total liabilities ................................................................................. 21,163.9 19,850.3 37,952.8 36,360.9
Commitments and contingencies (Note 22)Redeemable noncontrolling interest (Note 4) ................................................... 14.0 14.0
STOCKHOLDERS’ EQUITY
Common stock, $1 par value (authorized – 1,200,000,000 shares;issued – 536,431,204 shares in 2017 and 2016), at paid-in amount.................. 4,280.5 3,911.8 2,099.1 2,079.1
Common stock in treasury, 214,589,902 shares in 2017and 221,663,380 shares in 2016, at cost ..................................................... (15,460.8) (15,677.1)
Retained earnings....................................................................................... 25,301.3 23,911.3 2,782.0 2,670.3Accumulated other comprehensive income (loss)............................................... (4,563.7) (5,626.0) (237.5) (273.2)
Total Deere & Company stockholders’ equity .................................................... 9,557.3 6,520.0 4,643.6 4,476.2Noncontrolling interests .............................................................................. 3.2 10.8
Total stockholders’ equity...................................................................... 9,560.5 6,530.8 4,643.6 4,476.2
Total Liabilities and Stockholders’ Equity ..................................................... $ 30,738.4 $ 26,395.1 $42,596.4 $40,837.1
* Deere & Company with Financial Services on the equity basis.
The supplemental consolidating data is presented for informational purposes. The ‘‘Equipment Operations’’ reflect the basis of consolidation described in Note 1to the consolidated financial statements. Transactions between the ‘‘Equipment Operations’’ and ‘‘Financial Services’’ have been eliminated to arrive at theconsolidated financial statements.
65

66
31. SUPPLEMENTAL CONSOLIDATING DATA (continued)
STATEMENT OF CASH FLOWS
For the Years Ended October 29, 2017, October 30, 2016, and November 1, 2015
(In millions of dollars)
EQUIPMENT OPERATIONS* FINANCIAL SERVICES
2017 2016 2015 2017 2016 2015
Cash Flows from Operating Activities
Net income............................................................................. $ 2,159.2 $ 1,521.5 $ 1,940.9 $ 476.9 $ 467.6 $ 632.9Adjustments to reconcile net income to net cash provided by
operating activities:Provision for credit losses ....................................................... 9.9 8.2 5.5 88.4 86.1 49.9Provision for depreciation and amortization ............................... 839.3 803.4 791.8 984.3 846.7 688.5Impairment charges .............................................................. 39.8 25.4 15.3 59.7 19.5Gain on sale of unconsolidated affiliates and investments ............. (375.1) (74.5)Undistributed earnings of unconsolidated subsidiaries and affiliates (125.0) 94.0 46.6 (1.1) (1.5) (1.0)Provision (credit) for deferred income taxes ................................ (6.7) 13.2 (139.8) 106.8 269.5 121.4Changes in assets and liabilities:
Trade receivables............................................................... (243.9) (175.3) 113.4Insurance receivables ......................................................... 333.4Inventories....................................................................... (504.3) 578.4 (17.0)Accounts payable and accrued expenses ................................ 946.2 (169.6) (253.8) 93.9 40.6 (245.4)Accrued income taxes payable/receivable................................ (122.7) 18.2 (114.5) 38.5 (11.2) (4.6)Retirement benefits ........................................................... (39.2) 232.4 414.3 7.3 6.2 13.2
Other ................................................................................. (139.5) 36.5 271.1 81.5 97.1 (25.7)
Net cash provided by operating activities ............................ 2,438.0 2,911.8 3,073.8 1,876.5 1,860.8 1,582.1
Cash Flows from Investing Activities
Collections of receivables (excluding trade and wholesale) ................ 15,963.2 15,831.4 16,266.1Proceeds from maturities and sales of marketable securities ............. 297.9 81.9 700.1 106.3 87.5 160.6Proceeds from sales of equipment on operating leases .................... 1,440.8 1,256.2 1,049.4Proceeds from sales of businesses and unconsolidated
affiliates, net of cash sold....................................................... 113.9 81.1 149.2Cost of receivables acquired (excluding trade and wholesale) ............. (16,799.9) (15,168.2) (16,327.8)Purchases of marketable securities .............................................. (59.4) (60.0) (118.0) (111.8) (94.9)Purchases of property and equipment .......................................... (591.4) (641.8) (688.1) (3.5) (2.6) (5.9)Cost of equipment on operating leases acquired............................. (3,079.8) (3,235.7) (3,043.6)Increase in investment in Financial Services ................................... (20.0) (28.2) (27.4)Acquisitions of businesses, net of cash acquired ............................. (284.2) (198.5)Decrease (increase) in trade and wholesale receivables ..................... (379.9) 492.5 657.0Other .................................................................................... (32.7) (55.2) 6.8 (26.5) 24.6 (45.1)
Net cash used for investing activities ................................. (516.5) (820.1) (68.6) (2,897.3) (826.1) (1,235.0)
Cash Flows from Financing Activities
Increase (decrease) in total short-term borrowings .......................... 64.5 (207.2) 211.9 1,246.1 (1,006.4) 289.7Change in intercompany receivables/payables ................................ 2,142.0 (756.0) 928.6 (2,142.0) 756.0 (928.6)Proceeds from long-term borrowings ........................................... 1,107.0 173.4 6.2 7,595.2 4,897.3 5,704.8Payments of long-term borrowings .............................................. (66.3) (72.8) (214.2) (5,330.7) (5,194.8) (4,649.0)Proceeds from issuance of common stock ..................................... 528.7 36.0 172.1Repurchases of common stock.................................................... (6.2) (205.4) (2,770.7)Capital investment from Equipment Operations .............................. 20.0 28.2 27.4Dividends paid......................................................................... (764.0) (761.3) (816.3) (365.2) (562.1) (679.6)Other .................................................................................... (54.4) (36.7) (45.4) (33.4) (28.0) (26.7)
Net cash provided by (used for) financing activities ............... 2,951.3 (1,830.0) (2,527.8) 990.0 (1,109.8) (262.0)
Effect of Exchange Rate Changes on Cash and Cash Equivalents .... 155.1 (21.2) (146.6) 2.0 8.2 (40.7)
Net Increase (Decrease) in Cash and Cash Equivalents .................. 5,027.9 240.5 330.8 (28.8) (66.9) 44.4Cash and Cash Equivalents at Beginning of Year .......................... 3,140.5 2,900.0 2,569.2 1,195.3 1,262.2 1,217.8
Cash and Cash Equivalents at End of Year .................................. $ 8,168.4 $ 3,140.5 $ 2,900.0 $ 1,166.5 $ 1,195.3 $ 1,262.2
* Deere & Company with Financial Services on the equity basis.
The supplemental consolidating data is presented for informational purposes. The ‘‘Equipment Operations’’ reflect the basis of consolidation described in Note 1 tothe consolidated financial statements. Transactions between the ‘‘Equipment Operations’’ and ‘‘Financial Services’’ have been eliminated to arrive at theconsolidated financial statements.
66

In observance of the 100th anniversary of
producing tractors, John Deere is connecting
the pride of the past with the promise of
the future.
The Waterloo Boy tractor (shown on the cover
AND�BELOW�WAS�+OHN�%EERElS��RST�TRACTOR�
and a key part of the company’s acquisition of
the Waterloo Gasoline Engine Company in 1918.
The tractor continued to be sold under
the Waterloo Boy name until the John Deere
Model D tractor was introduced in 1923.
The 100-year legacy of the John Deere
tractor is one of evolution and innovation.
Today, leading-edge products such as the
9620RX tractor (shown on the cover and below)
further advance that legacy. Our largest
row-crop tractors, the 9-Series boost farmers’
productivity by combining high horsepower
with advanced technology.
From the Waterloo Boy to the next generation
of tractors, John Deere has focused on
delivering products that connect directly with
our customers’ work and have a meaningful
role in their lives.
100 Years of John Deere Tractors
The new C850 air seeding cart is THE�LARGEST�IN�%EERElS�ΈEET�AND�CAN�ACCURATELY�COVER�����ACRES�PER��LL��Its large 850-bushel capacity meets the needs of grain farmers with lots of ground to cover.
2 67
DEERE & COMPANYSELECTED FINANCIAL DATA
(Dollars in millions except per share amounts)
2017 2016 2015 2014 2013 2012 2011 2010 2009 2008
Net sales and revenues................................. $29,738 $26,644 $28,863 $36,067 $37,795 $36,157 $32,013 $26,005 $23,112 $28,438
Net sales ................................................... 25,885 23,387 25,775 32,961 34,998 33,501 29,466 23,573 20,756 25,803
Finance and interest income .......................... 2,732 2,511 2,381 2,282 2,115 1,981 1,923 1,825 1,842 2,068
Research and development expenses ............... 1,368 1,389 1,425 1,452 1,477 1,434 1,226 1,052 977 943
Selling, administrative and general expenses ..... 3,067 2,764 2,873 3,284 3,606 3,417 3,169 2,969 2,781 2,960
Interest expense.......................................... 900 764 680 664 741 783 759 811 1,042 1,137
Net income* .............................................. 2,159 1,524 1,940 3,162 3,537 3,065 2,800 1,865 873 2,053
Return on net sales ..................................... 8.3% 6.5% 7.5% 9.6% 10.1% 9.1% 9.5% 7.9% 4.2% 8.0%
Return on beginning Deere & Companystockholders’ equity ................................. 33.1% 22.6% 21.4% 30.8% 51.7% 45.1% 44.5% 38.7% 13.4% 28.7%
Comprehensive income (loss)*........................ 3,221 627 994 2,072 5,416 2,171 2,502 2,079 (1,333) 1,303
Net income per share – basic* ....................... $ 6.76 $ 4.83 $ 5.81 $ 8.71 $ 9.18 $ 7.72 $ 6.71 $ 4.40 $ 2.07 $ 4.76
– diluted*..................... 6.68 4.81 5.77 8.63 9.09 7.63 6.63 4.35 2.06 4.70
Dividends declared per share ......................... 2.40 2.40 2.40 2.22 1.99 1.79 1.52 1.16 1.12 1.06
Dividends paid per share ............................... 2.40 2.40 2.40 2.13 1.94 1.74 1.41 1.14 1.12 1.03
Average number of commonshares outstanding (in millions) – basic......... 319.5 315.2 333.6 363.0 385.3 397.1 417.4 424.0 422.8 431.1
– diluted ...... 323.3 316.6 336.0 366.1 389.2 401.5 422.4 428.6 424.4 436.3
Total assets** ............................................ $65,786 $57,918 $57,883 $61,267 $59,454 $56,193 $48,146 $43,186 $41,023 $38,696
Trade accounts and notes receivable – net ....... 3,925 3,011 3,051 3,278 3,758 3,799 3,295 3,464 2,617 3,235
Financing receivables – net ........................... 25,104 23,702 24,809 27,422 25,633 22,159 19,924 17,682 15,255 16,017
Financing receivables securitized – net............. 4,159 5,127 4,835 4,602 4,153 3,618 2,905 2,238 3,108 1,645
Equipment on operating leases – net .............. 6,594 5,902 4,970 4,016 3,152 2,528 2,150 1,936 1,733 1,639
Inventories................................................. 3,904 3,341 3,817 4,210 4,935 5,170 4,371 3,063 2,397 3,042
Property and equipment – net ....................... 5,068 5,171 5,181 5,578 5,467 5,012 4,352 3,791 4,532 4,128
Short-term borrowings:**Equipment operations............................... 375 249 464 434 1,080 425 529 85 490 218Financial services ..................................... 9,660 6,662 7,961 7,584 7,707 5,966 6,307 5,239 3,535 6,619
Total.................................................. 10,035 6,911 8,425 8,018 8,787 6,391 6,836 5,324 4,025 6,837
Short-term securitization borrowings:**Financial services ..................................... 4,119 4,998 4,585 4,553 4,103 3,569 2,773 2,204 3,126 1,679
Long-term borrowings:**Equipment operations............................... 5,491 4,565 4,439 4,619 4,845 5,418 3,155 3,316 3,058 1,984Financial services ..................................... 20,400 19,138 19,336 19,699 16,673 16,970 13,764 13,424 14,232 11,880
Total.................................................. 25,891 23,703 23,775 24,318 21,518 22,388 16,919 16,740 17,290 13,864
Total Deere & Company stockholders’ equity ..... 9,557 6,520 6,743 9,063 10,266 6,842 6,800 6,290 4,819 6,533
Book value per share* .................................. $ 29.70 $ 20.71 $ 21.29 $ 26.23 $ 27.46 $ 17.64 $ 16.75 $ 14.90 $ 11.39 $ 15.47
Capital expenditures .................................... $ 586 $ 668 $ 655 $ 1,004 $ 1,132 $ 1,360 $ 1,050 $ 795 $ 767 $ 1,117
Number of employees (at year end) ................. 60,476 56,767 57,180 59,623 67,044 66,859 61,278 55,650 51,262 56,653
* Attributable to Deere & Company.** Restated balances for adoption of FASB ASU No. 2015-03, Simplifying the Presentation of Debt Issuance Costs. See Note 3.
67
2017AnnualReport_Cover_F.indd 2 12/22/17 8:35 AM
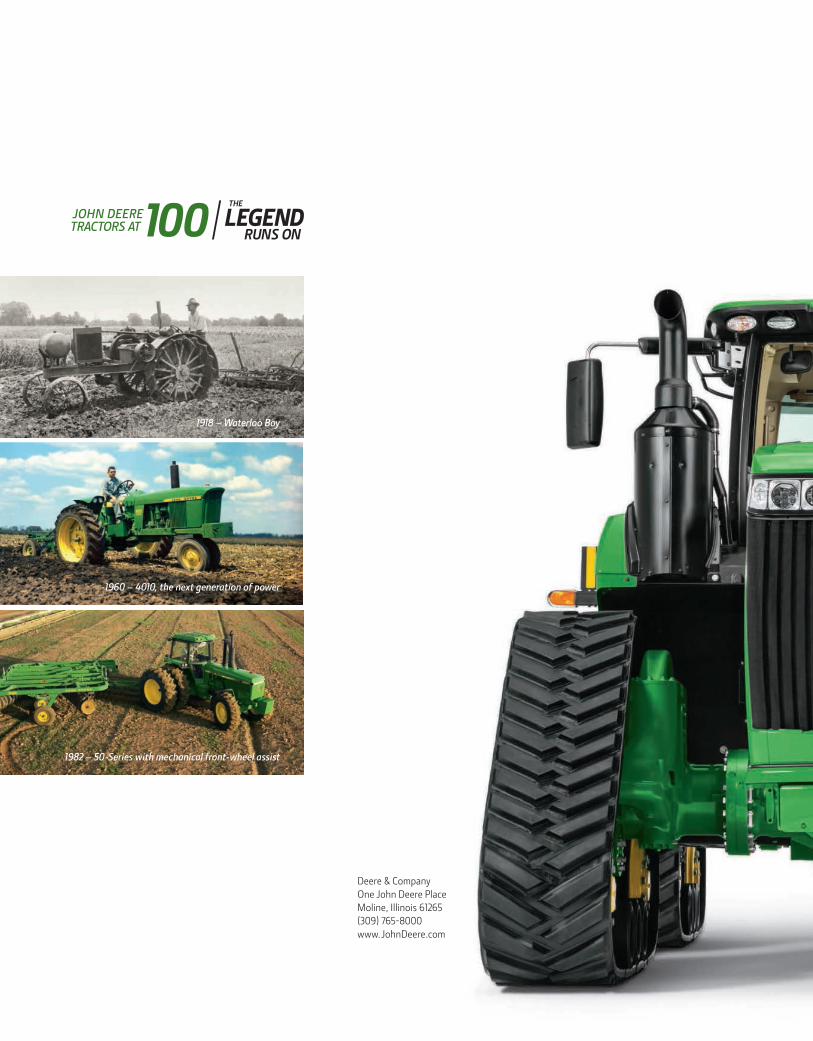
DEERE & COMPANY 2017 ANNUAL REPORT
Deere & CompanyOne John Deere Place Moline, Illinois 61265 (309) 765-8000 www.JohnDeere.com
1918 – Waterloo Boy
DE
ER
E &
CO
MP
AN
Y 20
17 AN
NU
AL R
EP
OR
T
1960 – 4010, the next generation of power
1982 – 50-Series with mechanical front-wheel assist
2017AnnualReport_Cover_F.indd 1 12/22/17 10:09 AM