Embed Size (px)
DESCRIPTION
Deer Valley Real Estate Report-2 Qtr-2014
Citation preview
Mark Sletten435.640.0930
Robin Sletten435.640.0218
Kimberlee Porter435.640.5445
Deer Valley Real Estate ReportQ2 2014
www .SREGParkCityProperties. com
1
Deer Valley Real Estate Report
Q2 2014This report for the first six months of 2014 addresses both: (i) closed transactions; and (ii) all transactions, including closed, properties which went under contract during the period with the respective closing still pending (under contract), plus active listings of homes, condominiums, and building lots. The reason for the dual reporting format, is that this year in particular, there are a quite a number of under contract transactions in new developments that when included in the data paint quite a different picture. Undisclosed transactions were omitted altogether in that we can’t verify the actual price, as were Private Residence Clubs given the limited number of transactions and properties in that sector.
For all three real estate types (homes, condominiums and building lots) in Deer Valley, the closed volume, again as measured in dollars, increased by approximately 22% for the first half of 2014 as compared to the same period of 2013, from $148,418,825 to $180,641,550. Interestingly the number of transactions comprising 2014’s volume decreased by 4.88%, from 86 transactions in the first half of 2013, to 82 in 2014. When you include under contract transactions in the data, the closed volume, again as measured in dollars, increased from 2013 by approximately 48% to $335,699,549 and the number of transactions increased to 126. Over $100,000,000 of that increase occurred in the Upper Deer Valley area and Empire Pass and we will explain those particular market factors when we focus on those particular sections later in this Report.
As was discussed in the 2013 Year End Report, the trends with respect to real estate in Deer Valley, and Park City as a whole for that matter, are positive and are generally attributable to:
Data indicating we are now past the bottom of the market; Interest rates being at an all-time low; The anticipation that inflation and its upward effect on the value of hard assets such asreal estate
will occur; Time with the family is slipping away and a mountain vacation home is a place where the
extended family can meet; and The property becomes a legacy asset for future generations.
These five points we hear consistently from our clients and their impacts are evident in the data.
Now onto the geographical breakdown for closed transactions for the period January 1st through June 30th
of 2043. As you can imagine, the data itself is voluminous and it was not practical to include every detail within this Report. Should you want to see specific information by area, property type, or in total, just let us know and we’ll send a copy to you. Or just stop by our Deer Valley office in The Lodges at Deer Valley and pick up a copy there. We’ll start the geographical breakdown from high to low elevation-wise, leading off with Empire Pass.
2
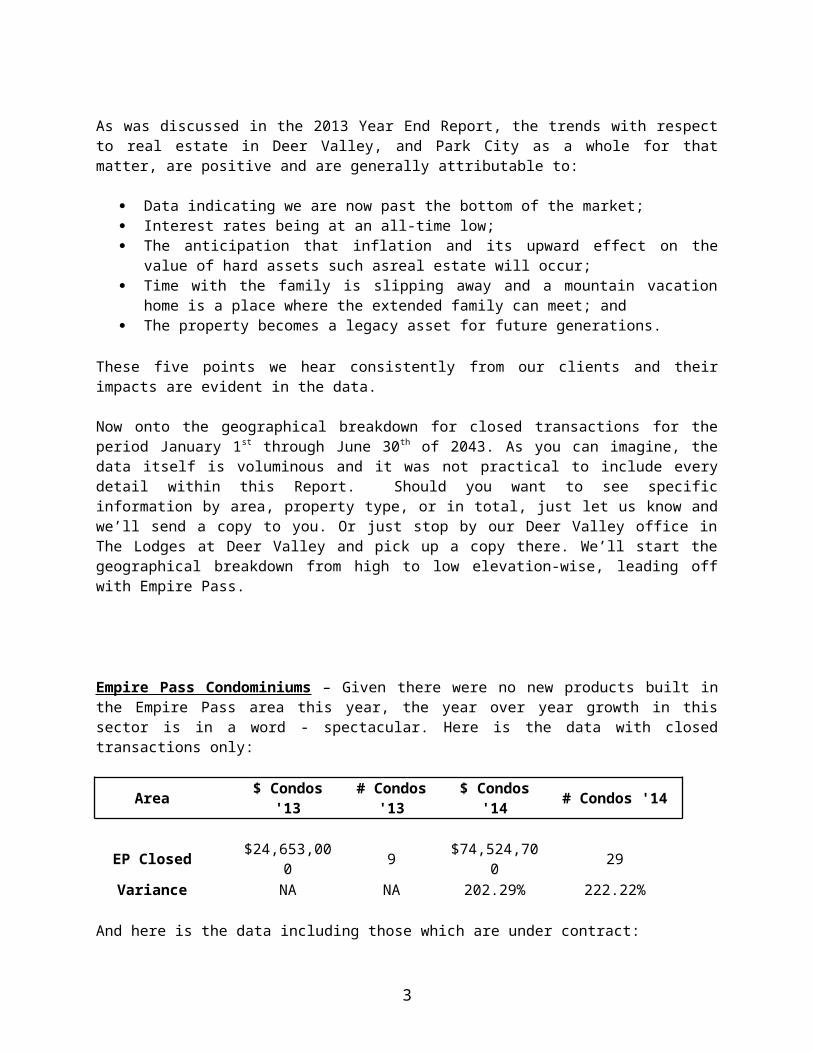
Empire Pass Condominiums – Given there were no new products built in the Empire Pass area this year, the year over year growth in this sector is in a word - spectacular. Here is the data with closed transactions only:
Area $ Condos '13 # Condos '13 $ Condos '14 # Condos '14
EP Closed $24,653,000 9 $74,524,700 29Variance NA NA 202.29% 222.22%
And here is the data including those which are under contract:
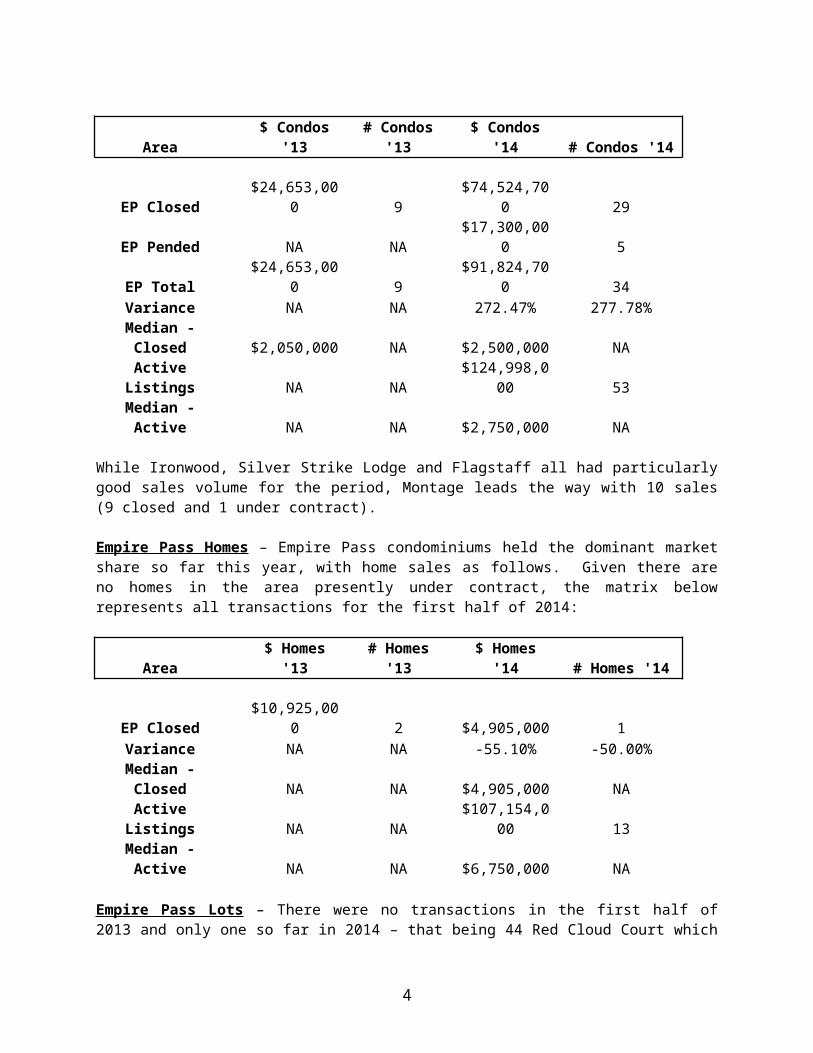
Area $ Condos '13 # Condos '13 $ Condos '14 # Condos '14
EP Closed $24,653,000 9 $74,524,700 29EP Pended NA NA $17,300,000 5EP Total $24,653,000 9 $91,824,700 34Variance NA NA 272.47% 277.78%
Median - Closed $2,050,000 NA $2,500,000 NAActive Listings NA NA $124,998,000 53Median - Active NA NA $2,750,000 NA
While Ironwood, Silver Strike Lodge and Flagstaff all had particularly good sales volume for the period, Montage leads the way with 10 sales (9 closed and 1 under contract).
Empire Pass Homes – Empire Pass condominiums held the dominant market share so far this year, with home sales as follows. Given there are no homes in the area presently under contract, the matrix below represents all transactions for the first half of 2014:
Area $ Homes '13 # Homes '13 $ Homes '14 # Homes '14
EP Closed $10,925,000 2 $4,905,000 1Variance NA NA -55.10% -50.00%
Median - Closed NA NA $4,905,000 NAActive Listings NA NA $107,154,000 13Median - Active NA NA $6,750,000 NA
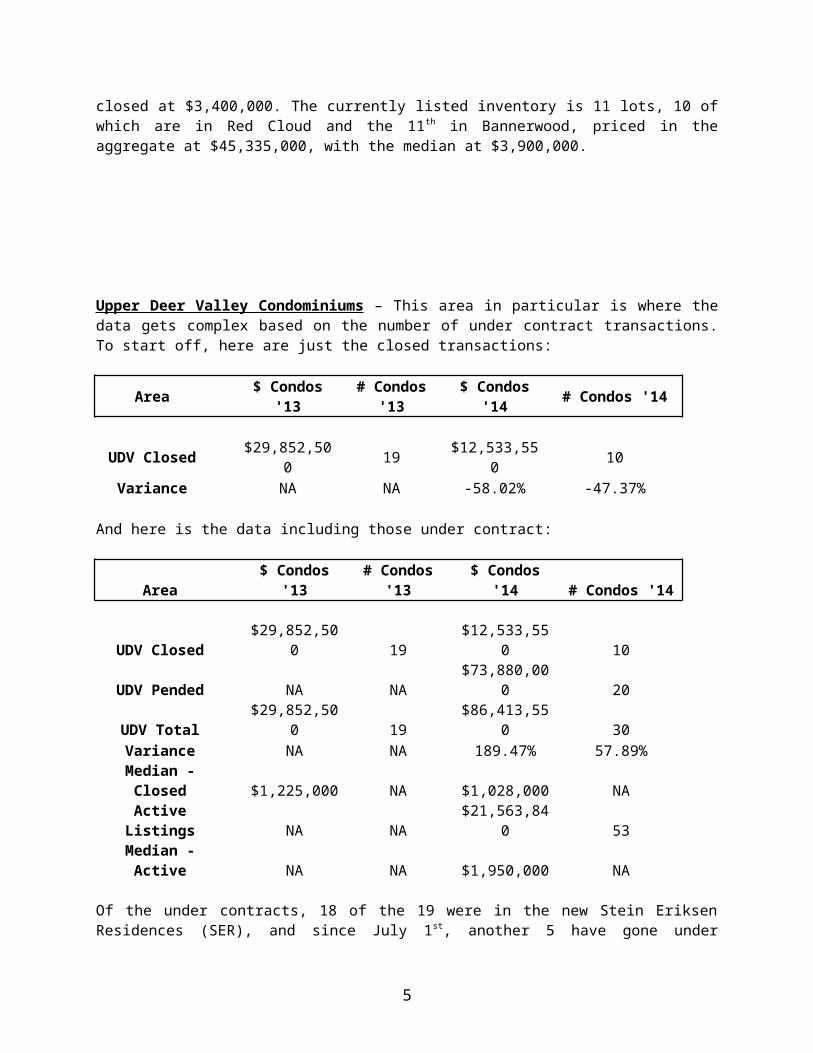
Empire Pass Lots – There were no transactions in the first half of 2013 and only one so far in 2014 – that being 44 Red Cloud Court which closed at $3,400,000. The currently listed inventory is 11 lots, 10 of which are in Red Cloud and the 11th in Bannerwood, priced in the aggregate at $45,335,000, with the median at $3,900,000.
3
Upper Deer Valley Condominiums – This area in particular is where the data gets complex based on the number of under contract transactions. To start off, here are just the closed transactions:
Area $ Condos '13 # Condos '13 $ Condos '14 # Condos '14
UDV Closed $29,852,500 19 $12,533,550 10Variance NA NA -58.02% -47.37%
And here is the data including those under contract:
Area $ Condos '13 # Condos '13 $ Condos '14 # Condos '14
UDV Closed $29,852,500 19 $12,533,550 10UDV Pended NA NA $73,880,000 20UDV Total $29,852,500 19 $86,413,550 30Variance NA NA 189.47% 57.89%
Median - Closed $1,225,000 NA $1,028,000 NAActive Listings NA NA $21,563,840 53Median - Active NA NA $1,950,000 NA
Of the under contracts, 18 of the 19 were in the new Stein Eriksen Residences (SER), and since July 1 st, another 5 have gone under contract. The success of both SER and Montage is noteworthy (Montage is discussed in the Empire Pass section above). These two luxury properties both hit it out of the ball park so far this year sales wise. What’s especially interesting is Stein Eriksen Residences (SER) and Montage are very similar in terms of amenities and services so it really points out that many buyers today are looking for properties that provide both luxury and onsite amenities (restaurants, spas, etc.). The only real differences between the two are that SER has no pure hotel component (although like Montage, the individual unit owners can elect to place their property into a rental program), and SER has a number of standalone homes in addition to condominiums (that data is covered below in this Report). Montage prices ranged from $2,500,000 to $6,000,000 and at SER their condominiums sold at prices ranging from $2,225,000 to $5,550,000, and SER’s homes sold at prices between $5,900,000 and $8,800,000.
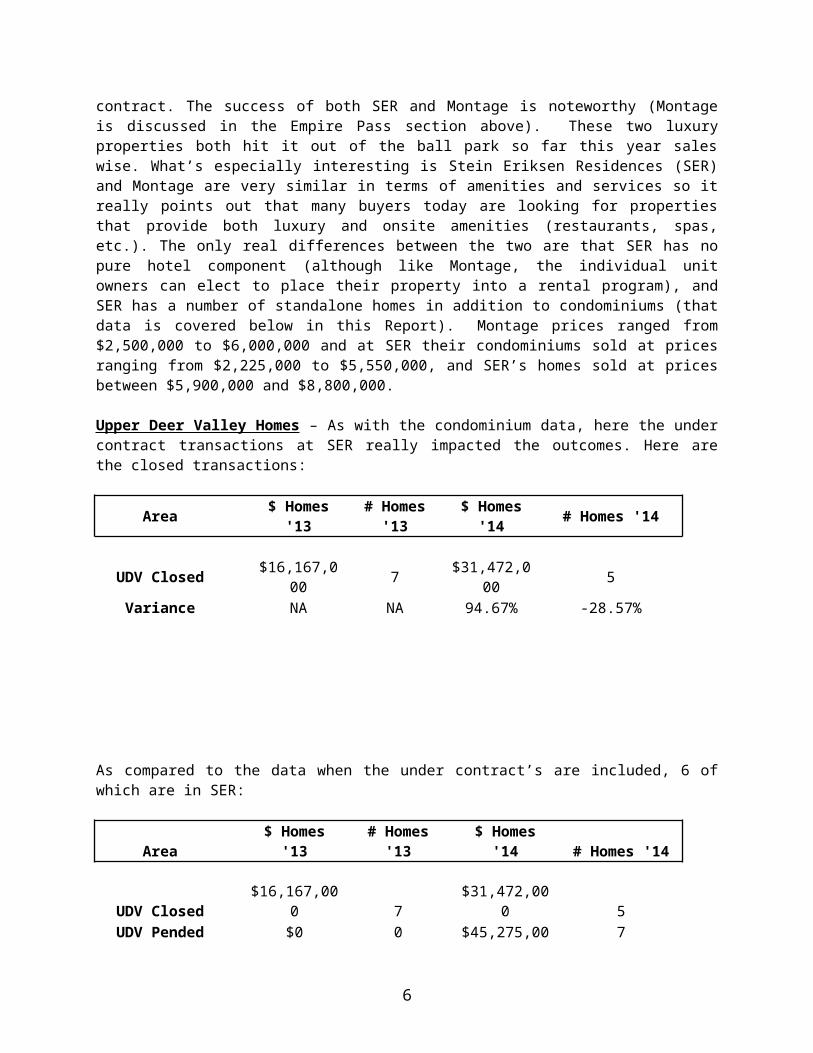
Upper Deer Valley Homes – As with the condominium data, here the under contract transactions at SER really impacted the outcomes. Here are the closed transactions:
Area $ Homes '13 # Homes '13 $ Homes '14 # Homes '14
UDV Closed $16,167,000 7 $31,472,000 5Variance NA NA 94.67% -28.57%
4
As compared to the data when the under contract’s are included, 6 of which are in SER:
Area $ Homes '13 # Homes '13 $ Homes '14 # Homes '14
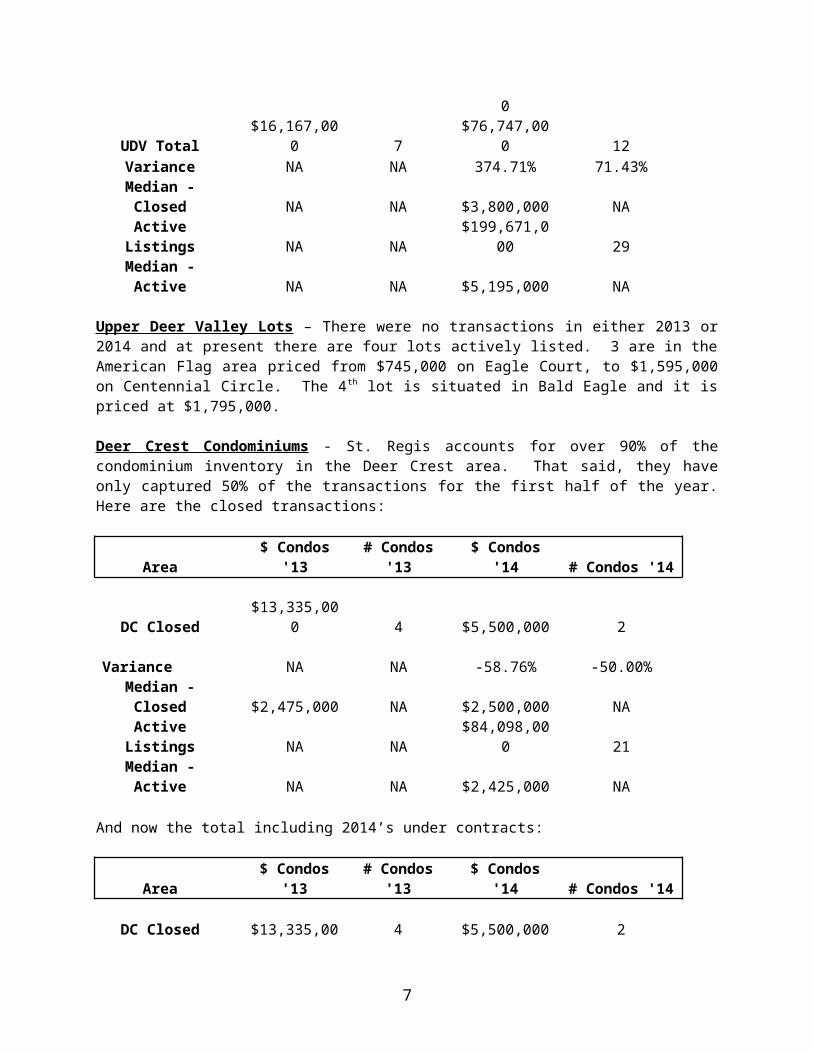
UDV Closed $16,167,000 7 $31,472,000 5UDV Pended $0 0 $45,275,000 7UDV Total $16,167,000 7 $76,747,000 12Variance NA NA 374.71% 71.43%
Median - Closed NA NA $3,800,000 NAActive Listings NA NA $199,671,000 29Median - Active NA NA $5,195,000 NA
Upper Deer Valley Lots – There were no transactions in either 2013 or 2014 and at present there are four lots actively listed. 3 are in the American Flag area priced from $745,000 on Eagle Court, to $1,595,000 on Centennial Circle. The 4th lot is situated in Bald Eagle and it is priced at $1,795,000.
Deer Crest Condominiums - St. Regis accounts for over 90% of the condominium inventory in the Deer Crest area. That said, they have only captured 50% of the transactions for the first half of the year. Here are the closed transactions:
Area $ Condos '13 # Condos '13 $ Condos '14 # Condos '14
DC Closed $13,335,000 4 $5,500,000 2 Variance NA NA -58.76% -50.00%Median - Closed $2,475,000 NA $2,500,000 NAActive Listings NA NA $84,098,000 21Median - Active NA NA $2,425,000 NA
And now the total including 2014’s under contracts:
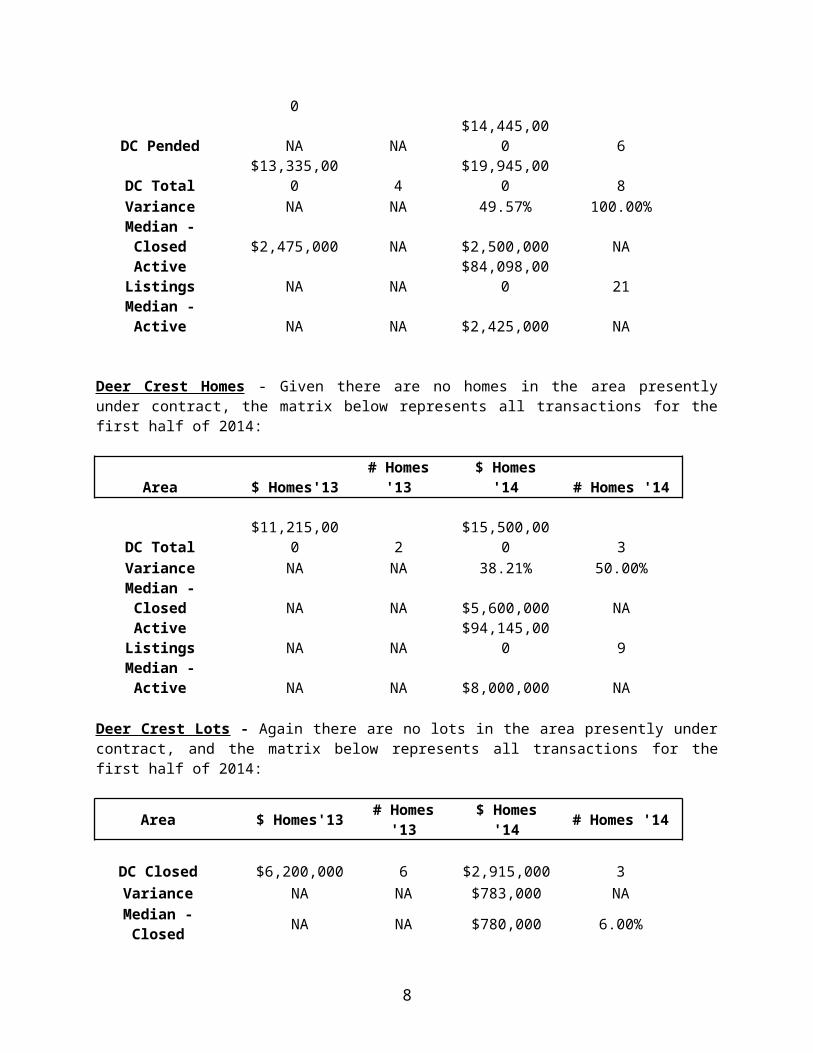
Area $ Condos '13 # Condos '13 $ Condos '14 # Condos '14
DC Closed $13,335,000 4 $5,500,000 2DC Pended NA NA $14,445,000 6DC Total $13,335,000 4 $19,945,000 8Variance NA NA 49.57% 100.00%
Median - Closed $2,475,000 NA $2,500,000 NAActive Listings NA NA $84,098,000 21Median - Active NA NA $2,425,000 NA
Deer Crest Homes - Given there are no homes in the area presently under contract, the matrix below represents all transactions for the first half of 2014:
5
Area $ Homes'13 # Homes '13 $ Homes '14 # Homes '14
DC Total $11,215,000 2 $15,500,000 3Variance NA NA 38.21% 50.00%
Median - Closed NA NA $5,600,000 NAActive Listings NA NA $94,145,000 9Median - Active NA NA $8,000,000 NA
Deer Crest Lots - Again there are no lots in the area presently under contract, and the matrix below represents all transactions for the first half of 2014:
Area $ Homes'13 # Homes '13 $ Homes '14 # Homes '14
DC Closed $6,200,000 6 $2,915,000 3Variance NA NA $783,000 NA
Median - Closed NA NA $780,000 6.00%Active Listings NA NA $24,228,000 NAMedian - Active NA NA $1,495,000 NA
2 of the 3 sales in 2014 were in the Snow Top area which is not ski-in/ski-out. The third lot is located in Deer Crest proper and therefor is ski-in/ski-out. It Closed at $1,425,000.
Lower Deer Valley Condominiums – The number of closed transactions for the first half of 2014 was quite comparable to the prior year. Three of those exceeded $1,000,000 in price where in past years, the only properties which exceeded $1,000,000 were in the 3 ski/in-ski/out developments of Black Diamond, Trails End and Pine Inn. Here are the closed transactions:
Area $ Condos'13 # Condos '13 $ Condos '14 # Condos '14
LDV Closed $14,228,000 18 $14,171,300 19Variance NA NA -0.40% 5.56%
Median - Closed $615,000 NA $640,000 NAActive Listings NA NA $42,698,800 41Median - Active NA NA $865,000 NA
And here are all transactions, including those which were under contract:
6
Area $ Condos '13 # Condos '13 $ Condos '14 # Condos '14
LDV Closed $14,228,000 18 $14,171,300 19LDV Pended NA NA $3,782,999 5LDV Total $14,228,000 18 $17,954,299 24Variance NA NA 26.19% 33.33%
Median - Closed $615,000 NA $640,000 NAActive Listings NA NA $42,698,800 41Median - Active NA NA $865,000 NA
Lower Deer Valley Homes – The downturn in home sales in the Lower Deer Valley area has more to do with dwindling supply and the removal of most all of the distressed inventory rather than diminished market conditions. There are no under contracts in the pipeline so here is all data for the period:
Area $ Homes'13 # Homes '13 $ Homes '14 # Homes '14
LDV Closed $18,480,000 13 $15,025,000 7Variance NA NA -18.70% -46.15%
Median - Closed NA NA $2,040,000 NAActive Listings NA NA $32,375,888 14Median - Active NA NA $2,195,000 NA
Lower Deer Valley Lots – The decrease in lot sales in Lower Deer Valley is once again a result of a diminishing inventory. Here is the closed data:
Area $ Lots'13 # Lots '13 $ Lots '14 # Lots '14
LDV Closed $3,363,325 6 $695,000 2Variance NA NA -79.34% -66.67%
Median - Closed NA NA $300,000 NAActive Listings NA NA $9,371,500 14Median - Active NA NA $615,000 NA
And now the combined data including one which is under contract:
7
Area $ Lots'13 # Lots '13 $ Lots '14 # Lots '14
LDV Closed $3,363,325 6 $695,000 2UDV Pended $0 0 $375,000 1UDV Total $3,363,325 6 $1,070,000 3Variance NA NA -68.19% -50.00%
Median - Closed NA NA $300,000 NAActive Listings NA NA $9,371,500 $14Median - Active NA NA $615,000 NA
Park City Market Overall - Taking a step back and looking at the greater Park City Market, the number of Closed transactions (homes condominiums, and lots) as a whole dropped 9% in the second quarter, although the median prices continued to trend upwards, albeit slowly. By property type, the number of single family home sales within the City limits of Park City this includes Empire Pass, Upper Deer Valley and Lower Deer Valley but not Deer Crest) was down 29% compared with the same period in 2013, although the median price was up by 36%. Condominium sales in the City limits were up 8% and the median price in that sector was up by 11%. Lots sales were down as well with the number of transactions off by 34% but the median price up by 33%. This data demonstrates diminishing inventories and rising prices.
8