Embed Size (px)
Citation preview
Offering Memorandum
Deer Creek PlazaCrowley, TX (DFW)
The information contained in the following Marketing Brochure is proprietary and strictly confidential. It is intended to be reviewed only by the party receiving it from Marcus & Millichap and should not be made available to any other person or entity without the written consent of Marcus & Millichap. This Marketing Brochure has been prepared to provide summary, unverified information to prospective purchasers, and to establish only a preliminary level of interest in the subject property. The information contained herein is not a substitute for a thorough due diligence investigation. Marcus & Millichap has not made any investigation, and makes no warranty or representation, with respect to the income or expenses for the subject property, the future projected financial performance of the property, the size and square footage of the property and improvements, the presence or absence of contaminating substances, PCB’s or asbestos, the compliance with State and Federal regulations, the physical condition of the improvements thereon, or the financial condition or business prospects of any tenant, or any tenant’s plans or intentions to continue its occupancy of the subject property. The information contained in this Marketing Brochure has been obtained from sources we believe to be reliable; however, Marcus & Millichap has not verified, and will not verify, any of the information contained herein, nor has Marcus & Millichap conducted any investigation regarding these matters and makes no warranty or representation whatsoever regarding the accuracy or completeness of the information provided. All potential buyers must take appropriate measures to verify all of the information set forth herein.
Marcus & Millichap is not affiliated with, sponsored by, or endorsed by any commercial tenant or lessee identified in this marketing package. The presence of any corporation’s logo or name is not intended to indicate or imply affiliation with, or sponsorship or endorsement by, said corporation of Marcus & Millichap, its affiliates or subsidiaries, or any agent, product, service, or commercial listing of Marcus & Millichap, and is solely included for the purpose of providing tenant lessee information about this listing to prospective customers.
Marcus & Millichap Real Estate Investment Services, Inc. (“M&M”) is not affiliated with, sponsored by, or endorsed by any commercial tenant or lessee identified in this marketing package. The presence of any corporation’s logo or name is not intended to indicate or imply affiliation with, or sponsorship or endorsement by, said corporation of M&M, its affiliates or subsidiaries, or any agent, product, service, or commercial listing of M&M, and is solely included for the purpose of providing tenant lessee information about this listing to prospec-tive customers.
NON-ENDORSEMENT NOTICE
ALL PROPERTY SHOWINGS ARE BY APPOINTMENT ONLY. PLEASE CONSULT YOURMARCUS & MILLICHAP AGENT FOR MORE DETAILS.
CONFIDENTIALITY AND DISCLAIMER
exclusively listedOFFICES NATIONWIDEwww.marcusmillichap.com
Exclusively listed by: Investment Sales:
Philip LevySenior Managing Director FORT WORTH OFFICETel: (817) 932-6123Fax: (817) [email protected] License: TX 522087
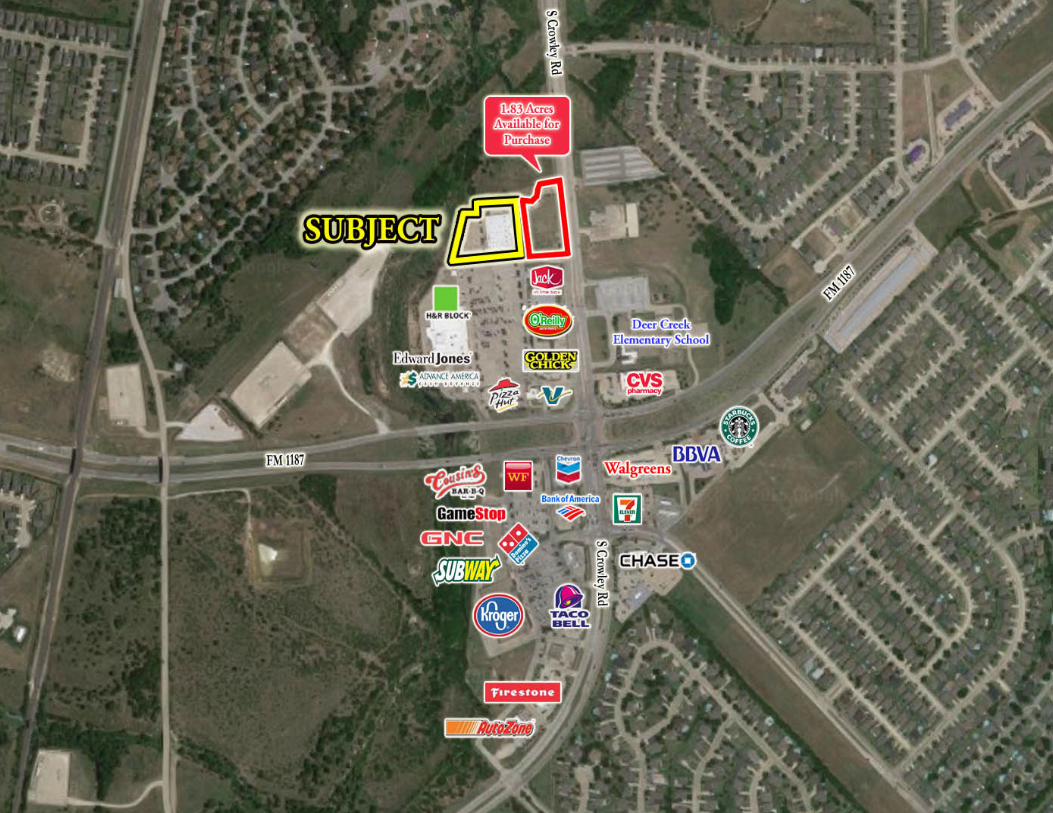
Table of Contents
EXECUTIVE SUMMARYOffering Highlights . . . . . . . . . . . . . . . . . . . . . . . . . . . . . . . . . . . . . . . . . . . . . . . . . . . . . . . . . . . . . . . . . . . . . . . . . . . . . . . . . . . . . . . . . . . . . . . . . . . . . . . . . . . . . . 2
Investment Overview . . . . . . . . . . . . . . . . . . . . . . . . . . . . . . . . . . . . . . . . . . . . . . . . . . . . . . . . . . . . . . . . . . . . . . . . . . . . . . . . . . . . . . . . . . . . . . . . . . . . . . . . . . . . . 3
PROPERTY PHOTOSRegional Map . . . . . . . . . . . . . . . . . . . . . . . . . . . . . . . . . . . . . . . . . . . . . . . . . . . . . . . . . . . . . . . . . . . . . . . . . . . . . . . . . . . . . . . . . . . . . . . . . . . . . . . . . . . . . . . . . . . 5
Local Map . . . . . . . . . . . . . . . . . . . . . . . . . . . . . . . . . . . . . . . . . . . . . . . . . . . . . . . . . . . . . . . . . . . . . . . . . . . . . . . . . . . . . . . . . . . . . . . . . . . . . . . . . . . . . . . . . . . . . 6
Aerial Photo . . . . . . . . . . . . . . . . . . . . . . . . . . . . . . . . . . . . . . . . . . . . . . . . . . . . . . . . . . . . . . . . . . . . . . . . . . . . . . . . . . . . . . . . . . . . . . . . . . . . . . . . . . . . . . . . . . . . 7
FINANCIAL ANALYSISFinancing and Expenses . . . . . . . . . . . . . . . . . . . . . . . . . . . . . . . . . . . . . . . . . . . . . . . . . . . . . . . . . . . . . . . . . . . . . . . . . . . . . . . . . . . . . . . . . . . . . . . . . . . . . . . . . . 11
Income & Expenses . . . . . . . . . . . . . . . . . . . . . . . . . . . . . . . . . . . . . . . . . . . . . . . . . . . . . . . . . . . . . . . . . . . . . . . . . . . . . . . . . . . . . . . . . . . . . . . . . . . . . . . . . . . . . 12
Tenant Summary . . . . . . . . . . . . . . . . . . . . . . . . . . . . . . . . . . . . . . . . . . . . . . . . . . . . . . . . . . . . . . . . . . . . . . . . . . . . . . . . . . . . . . . . . . . . . . . . . . . . . . . . . . . . . . . 13
Lease Expiration Schedule . . . . . . . . . . . . . . . . . . . . . . . . . . . . . . . . . . . . . . . . . . . . . . . . . . . . . . . . . . . . . . . . . . . . . . . . . . . . . . . . . . . . . . . . . . . . . . . . . . . . . . . . 14
MARKET OVERVIEWDemographic Summary . . . . . . . . . . . . . . . . . . . . . . . . . . . . . . . . . . . . . . . . . . . . . . . . . . . . . . . . . . . . . . . . . . . . . . . . . . . . . . . . . . . . . . . . . . . . . . . . . . . . . . . . . . 16
Table of Contents
Deer Creek Plaza

summaryE X E C U T I V E S U M M A R Y

EXECUTIVE SUMMARY
EX
EC
UT
IVE
SU
MM
AR
YP
RO
PE
RT
YP
HO
TO
SFI
NA
NC
IAL
AN
ALY
SIS
MA
RK
ET
OV
ER
VIE
W
This information has been secured from sources we believe to be reliable, but we make no representations or warranties, expressed or implied, as to the accuracy of the information. References to square footage or age are approximate. Buyer must verify the information and bears all risk for any inaccuracies. Any projections, opinions, assumptions or estimates used herein are for example purposes only and do not represent the current or future performance of the property. Marcus & Millichap Real Estate Investment Services is a service mark of Marcus & Millichap Real Estate Investment Services, Inc. © 2014 Marcus & Millichap
2
DemographicsMajor Employers Major Tenants
Offering Highlights
ACT ID
Deer Creek Plaza
Deer Creek Plaza740 South Crowley RoadCrowley, TX 76036
Offering SummaryPrice $2,750,000
Cap Rate - Current 9.14%
Current NOI $251,251
Current Occupancy 100%
Gross Leasable Area (GLA) 26,500
Price/SF $103.77
Year Built 2007
Lot Size 2.477 Acres
MAJOR EMPLOYERS EMPLOYEES
Walmart 500
Harbison-Fischer Manu. 280
H & R Block 262
Crowley Masonic Lodge 228
Fire Department 217
Huguley Nursing Center 200
North Crowley High School 200
TENANT GLA LEASE EXPLEASE TYPE
Nails Plus 1,500 1/31/21 Gross
Diet Solutions 1,500 9/30/21 Gross
iFit Elite Tanning 1,500 1/01/22 Gross
iFit Elite 17,500 1/01/22 Gross
Inspire Salon 3,000 8/31/18 Gross
eRepair 1,500 9/30/21 Gross
1-MILE 3-MILES 5-MILES
2014 Population 8,462 51,530 124,357
2019 Population 9,814 60,707 144,366
2014 Households 2,893 17,617 41,758
2019 Households 3,369 20,666 48,539
Median HH Income $68,374 $63,195 $63,442
Per Capita HH In-come
$27,070 $25,184 $25,895
Average HH Income $79,176 $73,602 $76,963
EXECUTIVE SUMMARY
EX
EC
UT
IVE
SU
MM
AR
YP
RO
PE
RT
YP
HO
TO
SFIN
AN
CIA
LA
NA
LYS
ISM
AR
KE
TO
VE
RV
IEW
3This information has been secured from sources we believe to be reliable, but we make no representations or warranties, expressed or implied, as to the accuracy of the information. References to square footage or age are approximate. Buyer must verify the information and bears all risk for any inaccuracies. Any projections, opinions, assumptions or estimates used herein are for example purposes only and do not represent the current or future performance of the property. Marcus & Millichap Real Estate Investment Services is a service mark of Marcus & Millichap Real Estate Investment Services, Inc. © 2014 Marcus & Millichap
Investment Overview
ACT ID
Deer Creek Plaza
Investment Highlights
■■ 26,500-Square Foot Multi-Tenant Retail Center
■■ 100 Percent Occupied with Gross Leases
■■ 66 Percent of the GLA is leased to iFit Elite Fitness Center | iFit Elite Recently Executed a Five-Year Lease Extension
■■ New Roof to be Installed Prior to Closing
■■ Located on South Crowley Road Near the Intersection with FM 1187 | Traffic Counts are Approximately 14,000-VPD
■■ Densely Populated Area with Over 124,300 Residents Within Five Miles
■■ Crowley is 15 Miles South of Downtown Fort Worth
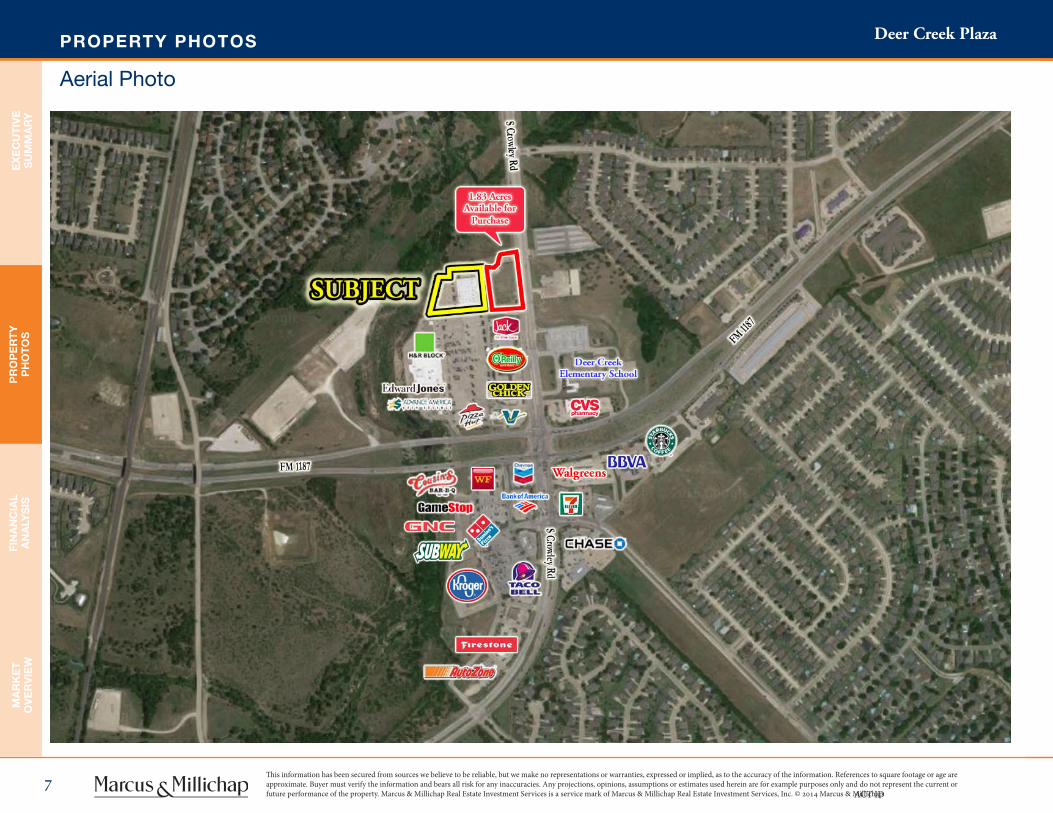
■■ Possible Sale Opportunity of Adjacent 1.83 Acres of Future Developed Commercial Land
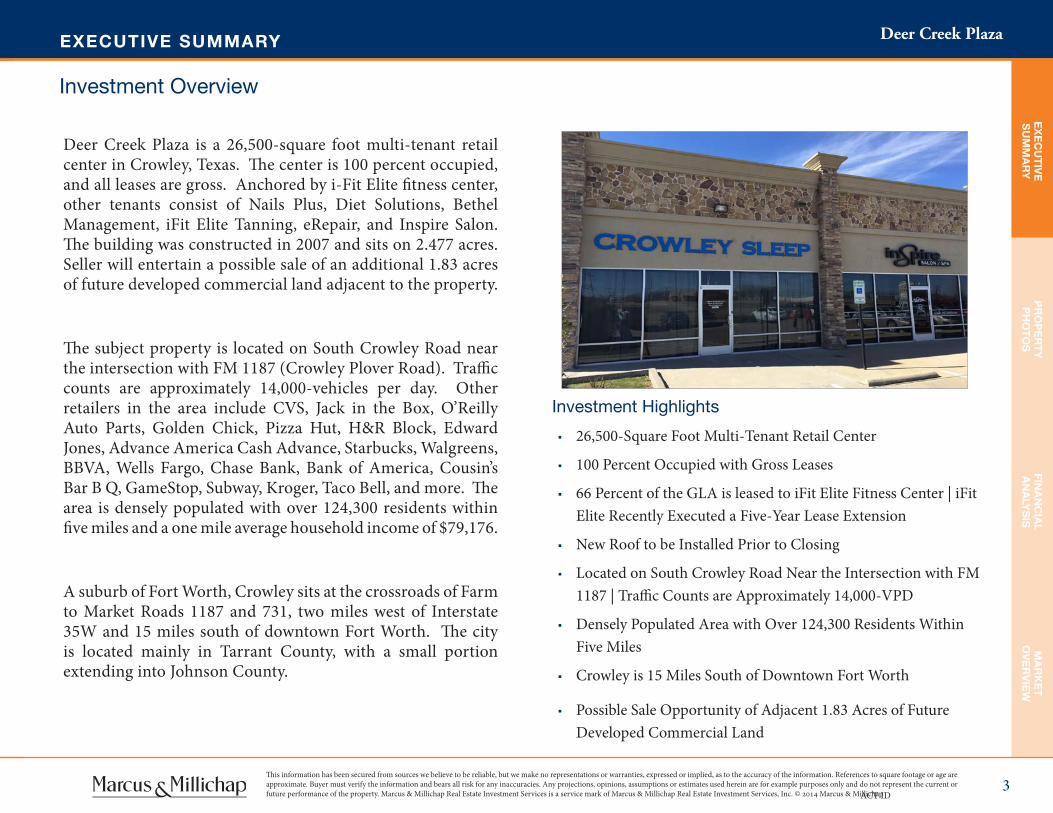
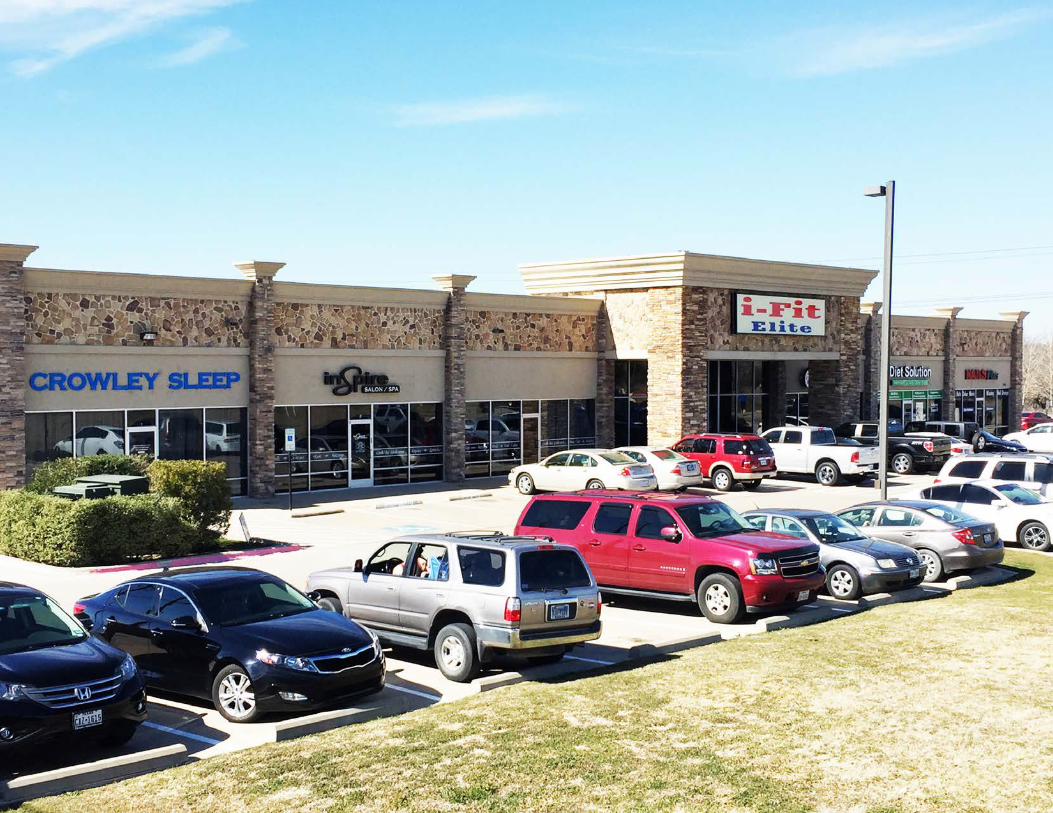
Deer Creek Plaza is a 26,500-square foot multi-tenant retail center in Crowley, Texas. The center is 100 percent occupied, and all leases are gross. Anchored by i-Fit Elite fitness center, other tenants consist of Nails Plus, Diet Solutions, Bethel Management, iFit Elite Tanning, eRepair, and Inspire Salon. The building was constructed in 2007 and sits on 2.477 acres. Seller will entertain a possible sale of an additional 1.83 acres of future developed commercial land adjacent to the property.
The subject property is located on South Crowley Road near the intersection with FM 1187 (Crowley Plover Road). Traffic counts are approximately 14,000-vehicles per day. Other retailers in the area include CVS, Jack in the Box, O’Reilly Auto Parts, Golden Chick, Pizza Hut, H&R Block, Edward Jones, Advance America Cash Advance, Starbucks, Walgreens, BBVA, Wells Fargo, Chase Bank, Bank of America, Cousin’s Bar B Q, GameStop, Subway, Kroger, Taco Bell, and more. The area is densely populated with over 124,300 residents within five miles and a one mile average household income of $79,176.
A suburb of Fort Worth, Crowley sits at the crossroads of Farm to Market Roads 1187 and 731, two miles west of Interstate 35W and 15 miles south of downtown Fort Worth. The city is located mainly in Tarrant County, with a small portion extending into Johnson County.

descriptionP R O P E R T Y P H O T O S

PROPERTY PHOTOS
This information has been secured from sources we believe to be reliable, but we make no representations or warranties, expressed or implied, as to the accuracy of the information. References to square footage or age are approximate. Buyer must verify the information and bears all risk for any inaccuracies. Any projections, opinions, assumptions or estimates used herein are for example purposes only and do not represent the current or future performance of the property. Marcus & Millichap Real Estate Investment Services is a service mark of Marcus & Millichap Real Estate Investment Services, Inc. © 2014 Marcus & Millichap
5
EX
EC
UT
IVE
SU
MM
AR
YP
RO
PE
RT
YP
HO
TO
SFI
NA
NC
IAL
AN
ALY
SIS
MA
RK
ET
OV
ER
VIE
W
Regional Map
Deer Creek Plaza
ACT ID
PROPERTY PHOTOS
6This information has been secured from sources we believe to be reliable, but we make no representations or warranties, expressed or implied, as to the accuracy of the information. References to square footage or age are approximate. Buyer must verify the information and bears all risk for any inaccuracies. Any projections, opinions, assumptions or estimates used herein are for example purposes only and do not represent the current or future performance of the property. Marcus & Millichap Real Estate Investment Services is a service mark of Marcus & Millichap Real Estate Investment Services, Inc. © 2014 Marcus & Millichap
EX
EC
UT
IVE
SU
MM
AR
YP
RO
PE
RT
YP
HO
TO
SFIN
AN
CIA
LA
NA
LYS
ISM
AR
KE
TO
VE
RV
IEW
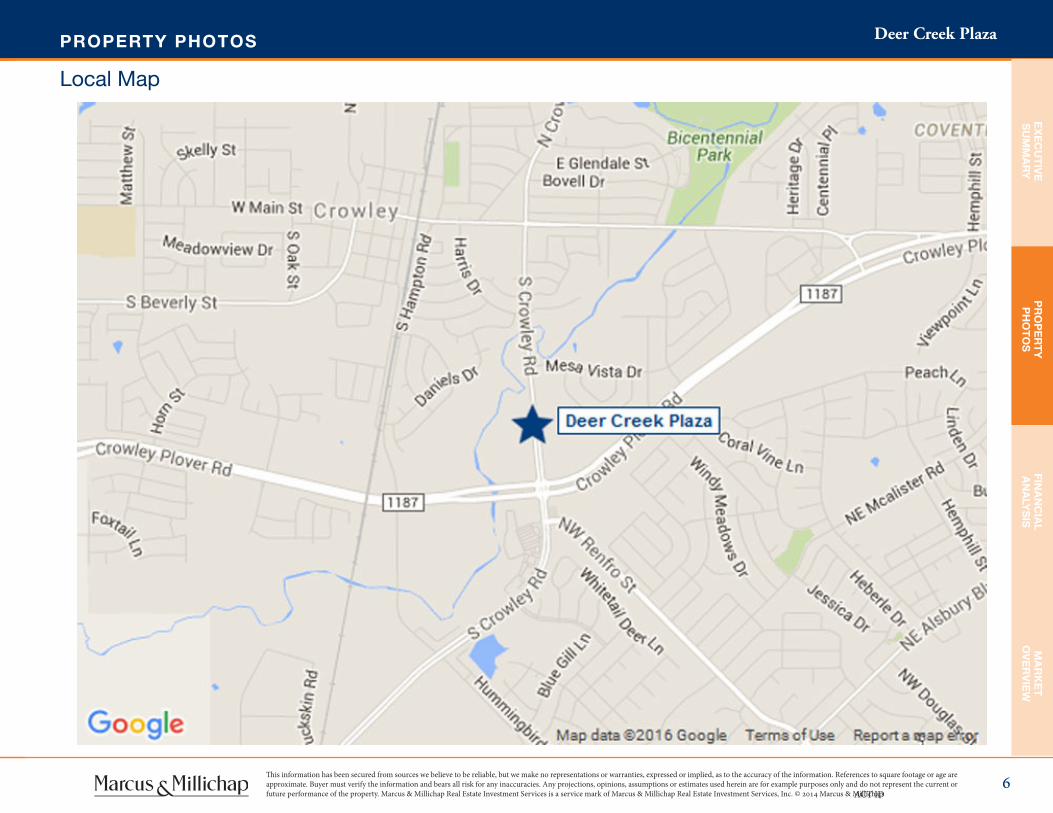
Local Map
Deer Creek Plaza
ACT ID
PROPERTY PHOTOS
This information has been secured from sources we believe to be reliable, but we make no representations or warranties, expressed or implied, as to the accuracy of the information. References to square footage or age are approximate. Buyer must verify the information and bears all risk for any inaccuracies. Any projections, opinions, assumptions or estimates used herein are for example purposes only and do not represent the current or future performance of the property. Marcus & Millichap Real Estate Investment Services is a service mark of Marcus & Millichap Real Estate Investment Services, Inc. © 2014 Marcus & Millichap
7
EX
EC
UT
IVE
SU
MM
AR
YP
RO
PE
RT
YP
HO
TO
SFI
NA
NC
IAL
AN
ALY
SIS
MA
RK
ET
OV
ER
VIE
W
Aerial Photo
Deer Creek Plaza
ACT ID

analysisF I N A N C I A L A N A LY S I S
This information has been secured from sources we believe to be reliable, but we make no representations or warranties, expressed or implied, as to the accuracy of the information. References to square footage or age are approximate. Buyer must verify the information and bears all risk for any inaccuracies. Any projections, opinions, assumptions or estimates used herein are for example purposes only and do not represent the current or future performance of the property. Marcus & Millichap Real Estate Investment Services is a service mark of Marcus & Millichap Real Estate Investment Services, Inc. © 2014 Marcus & Millichap
11
FINANCIAL ANALYSIS
EX
EC
UT
IVE
SU
MM
AR
YP
RO
PE
RT
YP
HO
TO
SFI
NA
NC
IAL
AN
ALY
SIS
MA
RK
ET
OV
ER
VIE
W
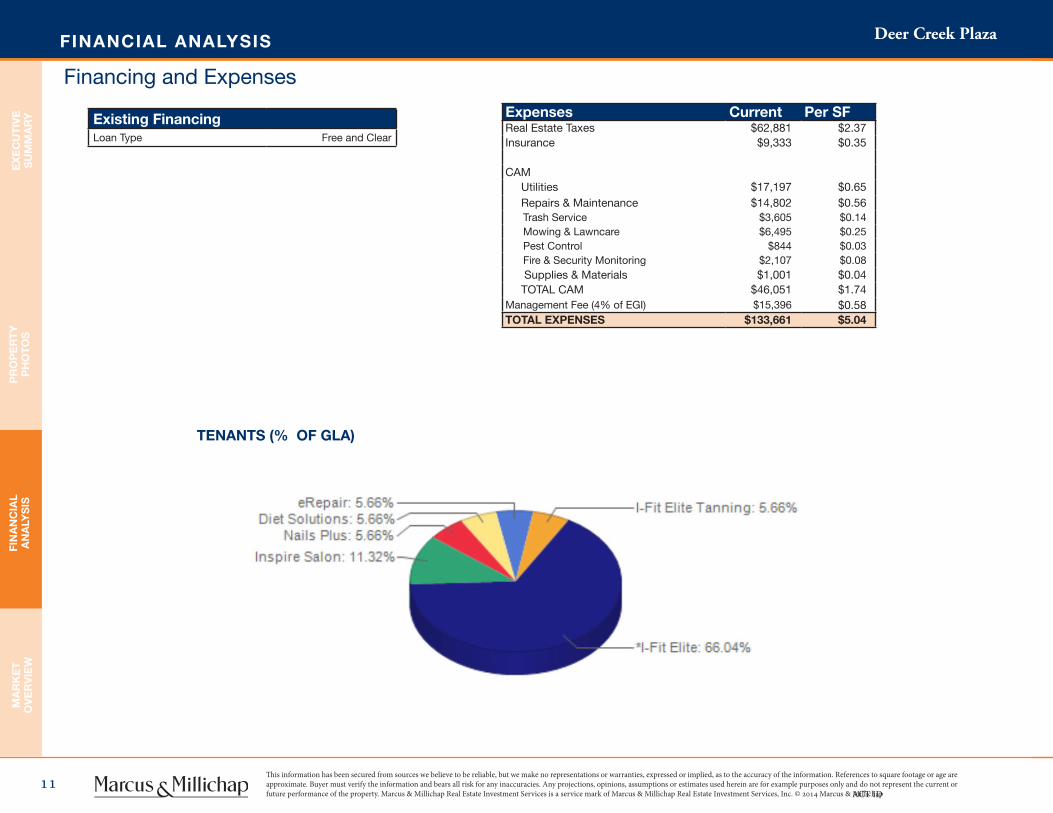
Financing and Expenses
Existing FinancingLoan Type Free and Clear
Expenses Current Per SFReal Estate Taxes $62,881 $2.37Insurance $9,333 $0.35
CAM Utilities $17,197 $0.65 Repairs & Maintenance $14,802 $0.56 Trash Service $3,605 $0.14 Mowing & Lawncare $6,495 $0.25 Pest Control $844 $0.03 Fire & Security Monitoring $2,107 $0.08 Supplies & Materials $1,001 $0.04 TOTAL CAM $46,051 $1.74Management Fee (4% of EGI) $15,396 $0.58TOTAL EXPENSES $133,661 $5.04
TENANTS (% OF GLA)
Deer Creek Plaza
ACT ID

12This information has been secured from sources we believe to be reliable, but we make no representations or warranties, expressed or implied, as to the accuracy of the information. References to square footage or age are approximate. Buyer must verify the information and bears all risk for any inaccuracies. Any projections, opinions, assumptions or estimates used herein are for example purposes only and do not represent the current or future performance of the property. Marcus & Millichap Real Estate Investment Services is a service mark of Marcus & Millichap Real Estate Investment Services, Inc. © 2014 Marcus & Millichap
FINANCIAL ANALYSIS
EX
EC
UT
IVE
SU
MM
AR
YP
RO
PE
RT
YP
HO
TO
SFIN
AN
CIA
LA
NA
LYS
ISM
AR
KE
TO
VE
RV
IEW
Income & Expenses
Current Per SFBase Rent
Occupied Space $384,912 $14.52GROSS POTENTIAL RENT $384,912 $14.52
GROSS POTENTIAL INCOME $384,912 $14.52EFFECTIVE GROSS INCOME $384,912 $14.52
Total Expenses $133,661 $5.04
NET OPERATING INCOME $251,251 $9.48
Deer Creek Plaza
ACT ID
This information has been secured from sources we believe to be reliable, but we make no representations or warranties, expressed or implied, as to the accuracy of the information. References to square footage or age are approximate. Buyer must verify the information and bears all risk for any inaccuracies. Any projections, opinions, assumptions or estimates used herein are for example purposes only and do not represent the current or future performance of the property. Marcus & Millichap Real Estate Investment Services is a service mark of Marcus & Millichap Real Estate Investment Services, Inc. © 2014 Marcus & Millichap
13
FINANCIAL ANALYSIS
EX
EC
UT
IVE
SU
MM
AR
YP
RO
PE
RT
YP
HO
TO
SFI
NA
NC
IAL
AN
ALY
SIS
MA
RK
ET
OV
ER
VIE
W
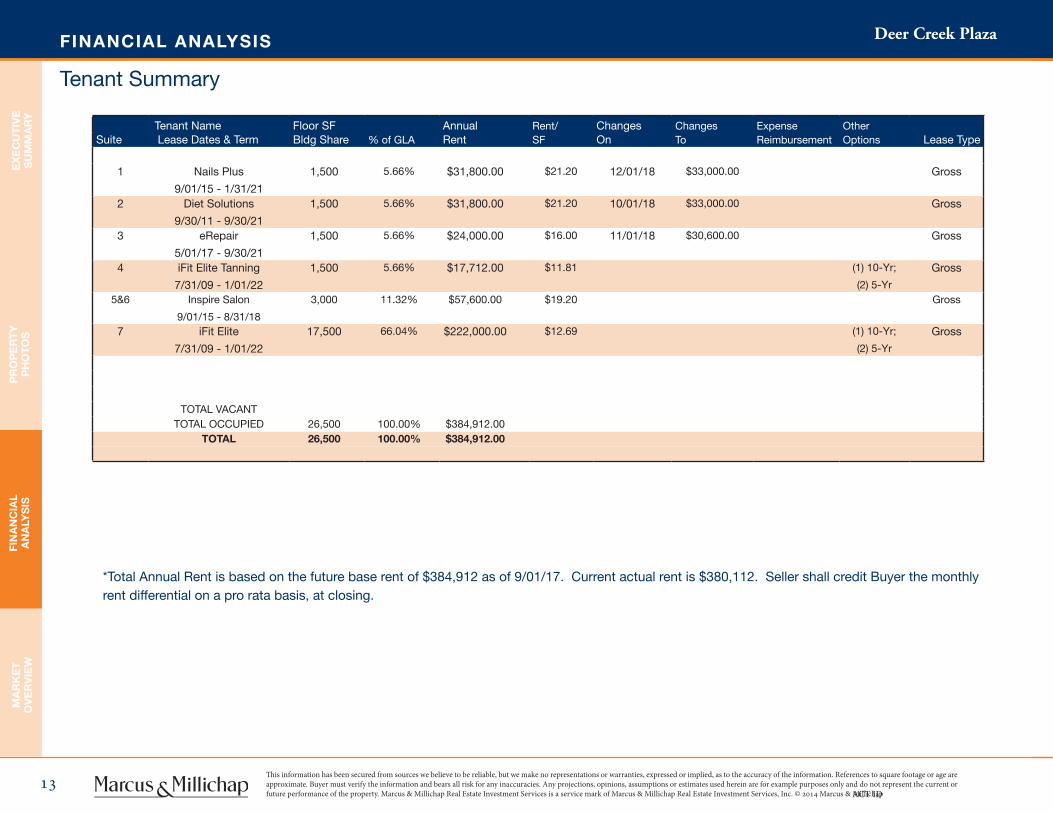
Tenant Summary
Deer Creek Plaza
ACT ID
Tenant Name Lease Dates & Term
Floor SFBldg Share % of GLA
AnnualRent
Rent/SF
Changes On
Changes To
ExpenseReimbursement
Other Options Lease TypeSuite
1 Nails Plus
9/01/15 - 1/31/21
1,500 5.66% $31,800.00 $21.20 12/01/18 $33,000.00 Gross
2 Diet Solutions
9/30/11 - 9/30/21
1,500 5.66% $31,800.00 $21.20 10/01/18 $33,000.00 Gross
3 eRepair
5/01/17 - 9/30/21
1,500 5.66% $24,000.00 $16.00 11/01/18 $30,600.00 Gross
4 iFit Elite Tanning
7/31/09 - 1/01/22
1,500 5.66% $17,712.00 $11.81 (1) 10-Yr;
(2) 5-Yr
Gross
5&6 Inspire Salon
9/01/15 - 8/31/18
3,000 11.32% $57,600.00 $19.20 Gross
7 iFit Elite
7/31/09 - 1/01/22
17,500 66.04% $222,000.00 $12.69 (1) 10-Yr;
(2) 5-Yr
Gross
TOTAL VACANTTOTAL OCCUPIED 26,500 100.00% $384,912.00
TOTAL 26,500 100.00% $384,912.00
*Total Annual Rent is based on the future base rent of $384,912 as of 9/01/17. Current actual rent is $380,112. Seller shall credit Buyer the monthly rent differential on a pro rata basis, at closing.
14This information has been secured from sources we believe to be reliable, but we make no representations or warranties, expressed or implied, as to the accuracy of the information. References to square footage or age are approximate. Buyer must verify the information and bears all risk for any inaccuracies. Any projections, opinions, assumptions or estimates used herein are for example purposes only and do not represent the current or future performance of the property. Marcus & Millichap Real Estate Investment Services is a service mark of Marcus & Millichap Real Estate Investment Services, Inc. © 2014 Marcus & Millichap
FINANCIAL ANALYSIS
EX
EC
UT
IVE
SU
MM
AR
YP
RO
PE
RT
YP
HO
TO
SFIN
AN
CIA
LA
NA
LYS
ISM
AR
KE
TO
VE
RV
IEW
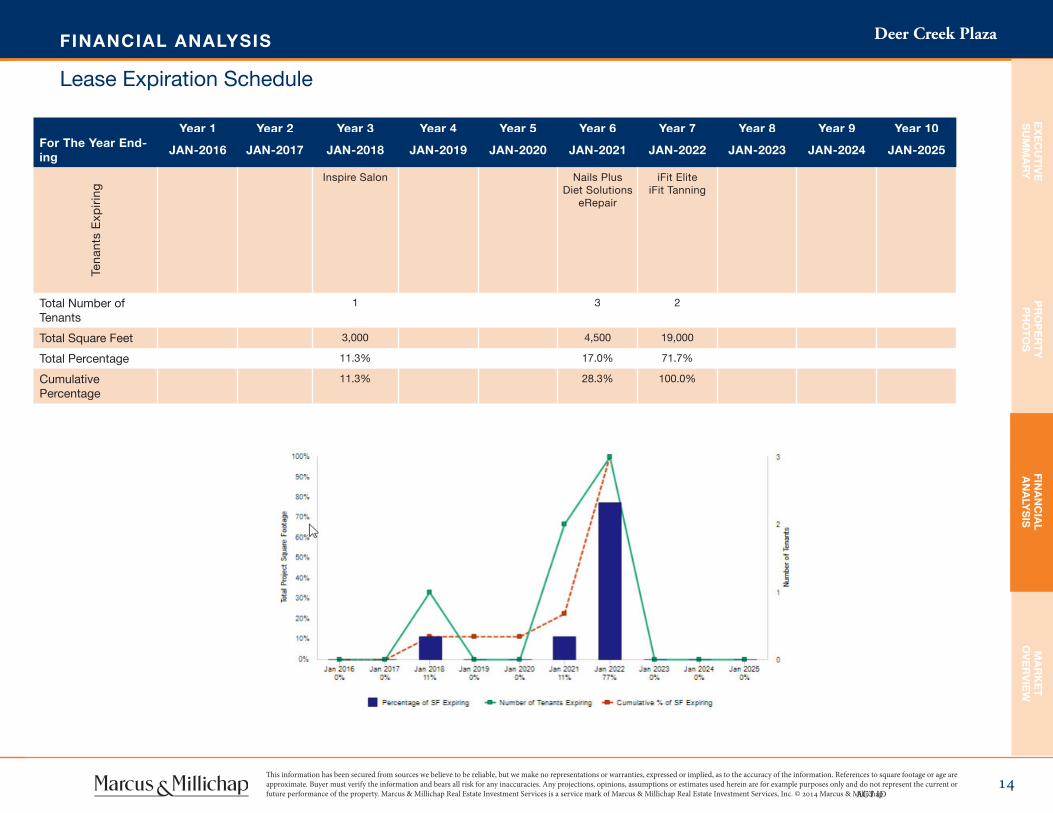
Lease Expiration Schedule
Deer Creek Plaza
ACT ID
Year 1 Year 2 Year 3 Year 4 Year 5 Year 6 Year 7 Year 8 Year 9 Year 10For The Year End-ing
JAN-2016 JAN-2017 JAN-2018 JAN-2019 JAN-2020 JAN-2021 JAN-2022 JAN-2023 JAN-2024 JAN-2025
Tena
nts
Exp
irin
g
Inspire Salon Nails PlusDiet Solutions
eRepair
iFit EliteiFit Tanning
Total Number of Tenants
1 3 2
Total Square Feet 3,000 4,500 19,000
Total Percentage 11.3% 17.0% 71.7%
Cumulative Percentage
11.3% 28.3% 100.0%

overviewM A R K E T O V E R V I E W
MARKET OVERVIEW
16
EX
EC
UT
IVE
SU
MM
AR
YP
RO
PE
RT
YP
HO
TO
SFI
NA
NC
IAL
AN
ALY
SIS
MA
RK
ET
OV
ER
VIE
W
This information has been secured from sources we believe to be reliable, but we make no representations or warranties, expressed or implied, as to the accuracy of the information. References to square footage or age are approximate. Buyer must verify the information and bears all risk for any inaccuracies. Any projections, opinions, assumptions or estimates used herein are for example purposes only and do not represent the current or future performance of the property. Marcus & Millichap Real Estate Investment Services is a service mark of Marcus & Millichap Real Estate Investment Services, Inc. © 2014 Marcus & Millichap
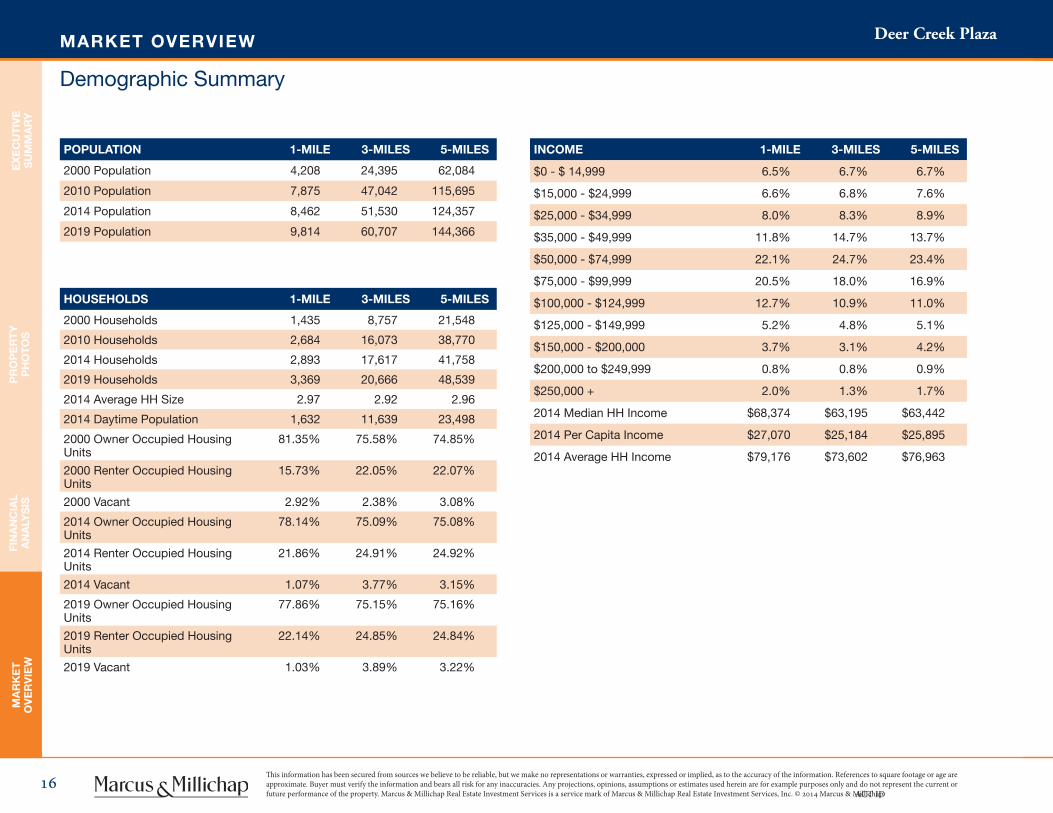
Demographic Summary
Deer Creek Plaza
ACT ID
INCOME 1-MILE 3-MILES 5-MILES
$0 - $ 14,999 6.5% 6.7% 6.7%
$15,000 - $24,999 6.6% 6.8% 7.6%
$25,000 - $34,999 8.0% 8.3% 8.9%
$35,000 - $49,999 11.8% 14.7% 13.7%
$50,000 - $74,999 22.1% 24.7% 23.4%
$75,000 - $99,999 20.5% 18.0% 16.9%
$100,000 - $124,999 12.7% 10.9% 11.0%
$125,000 - $149,999 5.2% 4.8% 5.1%
$150,000 - $200,000 3.7% 3.1% 4.2%
$200,000 to $249,999 0.8% 0.8% 0.9%
$250,000 + 2.0% 1.3% 1.7%
2014 Median HH Income $68,374 $63,195 $63,442
2014 Per Capita Income $27,070 $25,184 $25,895
2014 Average HH Income $79,176 $73,602 $76,963
HOUSEHOLDS 1-MILE 3-MILES 5-MILES
2000 Households 1,435 8,757 21,548
2010 Households 2,684 16,073 38,770
2014 Households 2,893 17,617 41,758
2019 Households 3,369 20,666 48,539
2014 Average HH Size 2.97 2.92 2.96
2014 Daytime Population 1,632 11,639 23,498
2000 Owner Occupied Housing Units
81.35% 75.58% 74.85%
2000 Renter Occupied Housing Units
15.73% 22.05% 22.07%
2000 Vacant 2.92% 2.38% 3.08%
2014 Owner Occupied Housing Units
78.14% 75.09% 75.08%
2014 Renter Occupied Housing Units
21.86% 24.91% 24.92%
2014 Vacant 1.07% 3.77% 3.15%
2019 Owner Occupied Housing Units
77.86% 75.15% 75.16%
2019 Renter Occupied Housing Units
22.14% 24.85% 24.84%
2019 Vacant 1.03% 3.89% 3.22%
POPULATION 1-MILE 3-MILES 5-MILES
2000 Population 4,208 24,395 62,084
2010 Population 7,875 47,042 115,695
2014 Population 8,462 51,530 124,357
2019 Population 9,814 60,707 144,366
MARKET OVERVIEW
17
EX
EC
UT
IVE
SU
MM
AR
YP
RO
PE
RT
YP
HO
TO
SFIN
AN
CIA
LA
NA
LYS
ISM
AR
KE
TO
VE
RV
IEW
This information has been secured from sources we believe to be reliable, but we make no representations or warranties, expressed or implied, as to the accuracy of the information. References to square footage or age are approximate. Buyer must verify the information and bears all risk for any inaccuracies. Any projections, opinions, assumptions or estimates used herein are for example purposes only and do not represent the current or future performance of the property. Marcus & Millichap Real Estate Investment Services is a service mark of Marcus & Millichap Real Estate Investment Services, Inc. © 2014 Marcus & Millichap
Demographic data © 2010 by Experian/Applied Geographic Solutions.
Deer Creek Plaza
ACT ID
.Race and Ethnicity
The current year racial makeup of your selected area is as follows: 64.47% White, 21.70% Black, 0.05% Native American and 3.14% Asian/Pacific Islander. Compare these to Entire US averages which are: 71.60% White, 12.70% Black, 0.18% Native American and 5.02% Asian/Pacific Islander.
People of Hispanic origin are counted independently of race. People of Hispanic origin make up 20.33% of the current year population in your selected area. Compare this to the Entire US average of 17.13%.
Housing In 2000, there were 16,641 owner occupied housing units in your area and there were 4,906 renter occupied housing units in your area. The median rent at the time was $550.
Employment In 2014, there are 23,497 employees in your selected area, this is also known as the daytime population. The 2000 Census revealed that 65.12% of employees are employed in white-collar occupations in this geography, and 34.61% are employed in blue-collar occupations. In 2014, unemployment in this area is 4.46%. In 2000, the average time traveled to work was 30.3 minutes.
PopulationIn 2014, the population in your selected geography is 124,356. The population has changed by 100.30% since 2000. It is estimated that the population in your area will be 144,365 five years from now, which represents a change of 16.08% from the current year. The current population is 48.12% male and 51.87% female. The median age of the population in your area is 32.3, compare this to the Entire US average which is 37.3. The population density in your area is 1,583.62 people per square mile.
Households There are currently 41,758 households in your selected geography. The number of households has changed by 93.79% since 2000. It is estimated that the number of households in your area will be 48,538 five years from now, which represents a change of 16.23% from the current year. The average household size in your area is 2.96 persons.
Income In 2014, the median household income for your selected geography is $63,442, compare this to the Entire US average which is currently $51,972. The median household income for your area has changed by 20.96% since 2000. It is estimated that the median household income in your area will be $72,702 five years from now, which represents a change of 14.59% from the current year.
The current year per capita income in your area is $25,895, compare this to the Entire US average, which is $28,599. The current year average household income in your area is $76,962, compare this to the Entire US average which is $74,533.
Geography: 5 Miles
Demographic Summary
exclusively listedPhilip LevySenior Managing DirectorFORT WORTH OFFICETel: (817) 932-6123Fax: (817) [email protected] License: TX 522087
Investment Sales:
OFFICES NATIONWIDEwww.marcusmillichap.com
Exclusively listed by:


![Home [] · 2021. 2. 24. · samsung samsung samsung samsung samsung advance advance advance advance advance advance advance advance advance advance 223sw 2233sw 2233sw 2233sw 933sn](https://img.pdfslide.us/doc/110x75/613cd1974c23507cb6359ff0/home-2021-2-24-samsung-samsung-samsung-samsung-samsung-advance-advance.jpg)