Embed Size (px)
Citation preview
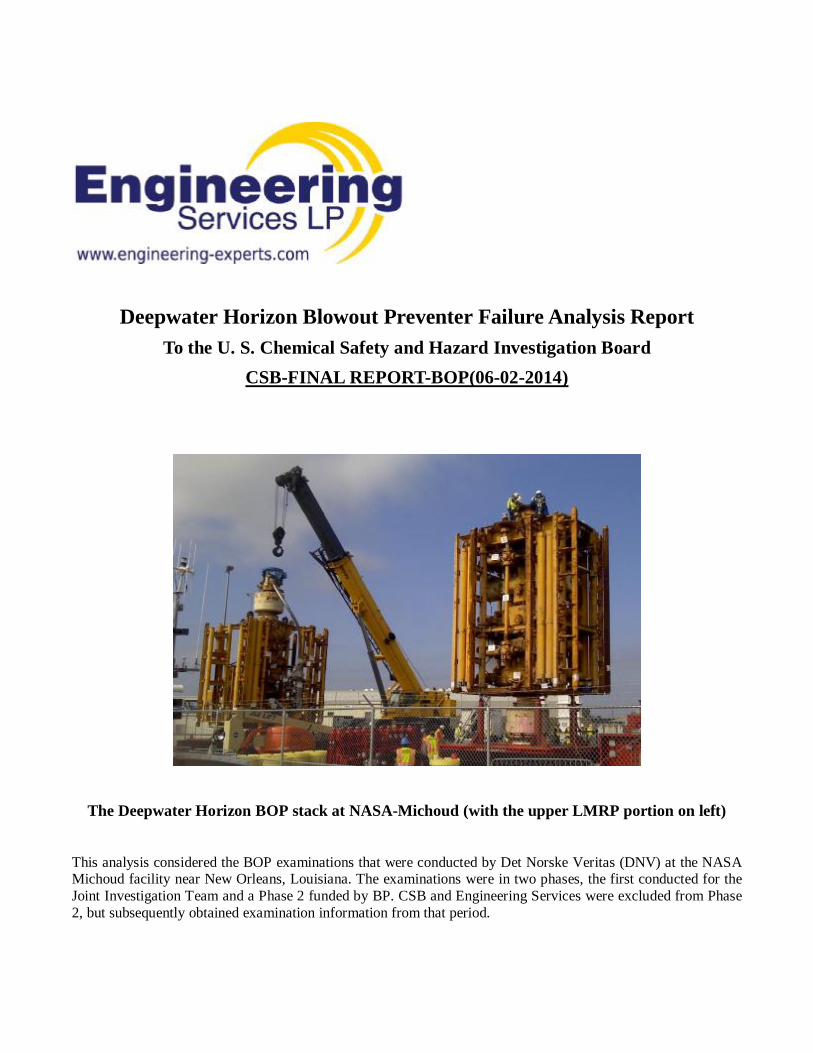
Deepwater Horizon Blowout Preventer Failure Analysis Report To the U. S. Chemical Safety and Hazard Investigation Board
CSB-FINAL REPORT-BOP(06-02-2014)
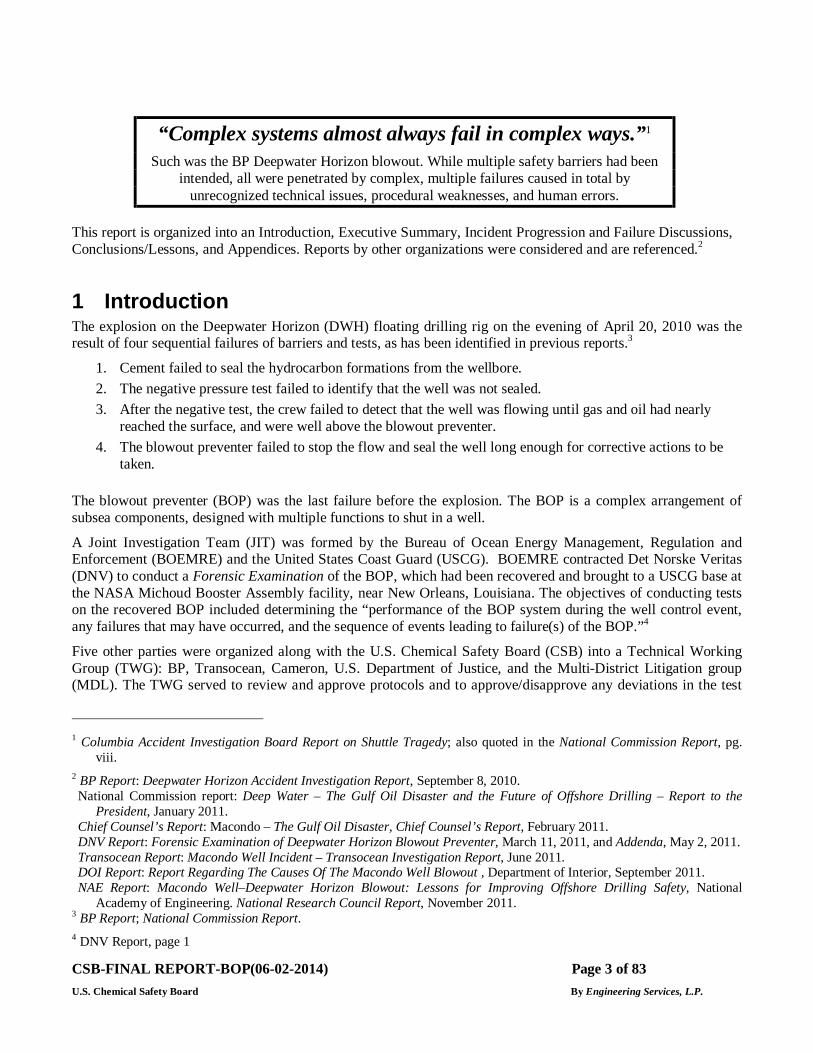
The Deepwater Horizon BOP stack at NASA-Michoud (with the upper LMRP portion on left)
This analysis considered the BOP examinations that were conducted by Det Norske Veritas (DNV) at the NASA Michoud facility near New Orleans, Louisiana. The examinations were in two phases, the first conducted for the Joint Investigation Team and a Phase 2 funded by BP. CSB and Engineering Services were excluded from Phase 2, but subsequently obtained examination information from that period.
CSB-FINAL REPORT-BOP(06-02-2014) Page 2 of 83 U.S. Chemical Safety Board By Engineering Services, L.P.
Contents 1. Introduction...............................................................................................................................3
2. Summary of incident failures and new opinions.......................................................................4
3. Incident summary timeline .......................................................................................................8
4. Incident progression: initial fluid displacement for the negative pressure test .....................13
5. Incident progression: negative pressure test ..........................................................................14
6. Incident progression: final displacement and initial oil flow starts .......................................18
7. Incident progression: oil flow increases ..................................................................................20
8. Failure of the upper annular and sealing by a VBR...............................................................22
9. Incident progression: riser unloading and the explosion .......................................................22
10. BSR failure to seal ...................................................................................................................23
11. Pipe buckling at the Macondo well – effective compression...................................................24
12. VBR friction ............................................................................................................................31
13. Blind shear ram failure ...........................................................................................................32
14. Results of drill pipe shearing using the FEA model ...............................................................37
15. Blind shear ram capability during drilling .............................................................................38
16. BOP accumulator capacity......................................................................................................39
17. Pressure sensors in the BOP....................................................................................................39
18. Conclusions/Lessons to be learned to avoid similar incidents................................................40
Appendices ......................................................................................................................................44
A. Incident Post-Explosion Events...............................................................................................44
B. BOP Stack Components ..........................................................................................................45
C. Condition of BOP as Found ....................................................................................................51
D. VBR Closing Force Calculations on the Bowed Drill Pipe.....................................................53
E. FEA Modeling of BSR.............................................................................................................58
F. Control System: BSR Actuation Scenarios.............................................................................61
G. Temporary abandonment draft procedures illuminate the differences for various options .61
H. BOP Accumulator System.......................................................................................................63
I. Location of Drill Pipe Within BOP .........................................................................................78
J. Top Drive Position at Time of Explosion ................................................................................80
K. Change in Length for Drill Pipe Buckling Above the BOP....................................................80
L. Drill Pipe Separation Above the Upper Annular ...................................................................81
M. Rig Movement After Explosion...............................................................................................83
CSB-FINAL REPORT-BOP(06-02-2014) Page 3 of 83 U.S. Chemical Safety Board By Engineering Services, L.P.
“Complex systems almost always fail in complex ways.”1 Such was the BP Deepwater Horizon blowout. While multiple safety barriers had been
intended, all were penetrated by complex, multiple failures caused in total by unrecognized technical issues, procedural weaknesses, and human errors.
This report is organized into an Introduction, Executive Summary, Incident Progression and Failure Discussions, Conclusions/Lessons, and Appendices. Reports by other organizations were considered and are referenced.2
1 Introduction The explosion on the Deepwater Horizon (DWH) floating drilling rig on the evening of April 20, 2010 was the result of four sequential failures of barriers and tests, as has been identified in previous reports.3
1. Cement failed to seal the hydrocarbon formations from the wellbore. 2. The negative pressure test failed to identify that the well was not sealed. 3. After the negative test, the crew failed to detect that the well was flowing until gas and oil had nearly
reached the surface, and were well above the blowout preventer. 4. The blowout preventer failed to stop the flow and seal the well long enough for corrective actions to be
taken.
The blowout preventer (BOP) was the last failure before the explosion. The BOP is a complex arrangement of subsea components, designed with multiple functions to shut in a well.
A Joint Investigation Team (JIT) was formed by the Bureau of Ocean Energy Management, Regulation and Enforcement (BOEMRE) and the United States Coast Guard (USCG). BOEMRE contracted Det Norske Veritas (DNV) to conduct a Forensic Examination of the BOP, which had been recovered and brought to a USCG base at the NASA Michoud Booster Assembly facility, near New Orleans, Louisiana. The objectives of conducting tests on the recovered BOP included determining the “performance of the BOP system during the well control event, any failures that may have occurred, and the sequence of events leading to failure(s) of the BOP.”4
Five other parties were organized along with the U.S. Chemical Safety Board (CSB) into a Technical Working Group (TWG): BP, Transocean, Cameron, U.S. Department of Justice, and the Multi-District Litigation group (MDL). The TWG served to review and approve protocols and to approve/disapprove any deviations in the test
1 Columbia Accident Investigation Board Report on Shuttle Tragedy; also quoted in the National Commission Report, pg.
viii. 2 BP Report: Deepwater Horizon Accident Investigation Report, September 8, 2010. National Commission report: Deep Water – The Gulf Oil Disaster and the Future of Offshore Drilling – Report to the
President, January 2011. Chief Counsel’s Report: Macondo – The Gulf Oil Disaster, Chief Counsel’s Report, February 2011. DNV Report: Forensic Examination of Deepwater Horizon Blowout Preventer, March 11, 2011, and Addenda, May 2, 2011. Transocean Report: Macondo Well Incident – Transocean Investigation Report, June 2011. DOI Report: Report Regarding The Causes Of The Macondo Well Blowout , Department of Interior, September 2011. NAE Report: Macondo Well–Deepwater Horizon Blowout: Lessons for Improving Offshore Drilling Safety, National
Academy of Engineering. National Research Council Report, November 2011. 3 BP Report; National Commission Report. 4 DNV Report, page 1
CSB-FINAL REPORT-BOP(06-02-2014) Page 4 of 83 U.S. Chemical Safety Board By Engineering Services, L.P.
procedures as the need arose. The TWG members had a closer level of access than other party representatives in witnessing the actual testing. In addition, USCG, FBI, NASA, and EPA had various responsibilities at the test site.
CSB contracted Engineering Services LP (ES) to assist in the BOP examination and analysis. An ES engineer usually served as the CSB TWG representative, although CSB staff also served in this role at times.
After a testing plan was approved by the participants, the physical testing started November 15, 2010 at the NASA Michoud Booster Assembly Facility, outside of New Orleans. Testing was largely suspended from December 27 until January 28 for protective building construction. The site work, which was later referred to as Phase 1 BOP testing, was declared over by DNV and BOEMRE representatives on March 4, 2011.
ES had a representative onsite along with a CSB investigator for essentially all Phase 1 BOP testing. ES provided advice to CSB and the TWG regarding test protocols and implementation. Some materials testing of samples from the recovered drill pipe was performed at the DNV Columbus, Ohio laboratory. An ES engineer monitored that testing.
ES also provided ongoing interpretation of the examination results to CSB and to the TWG. For this report, the test results were analyzed along with various documents from CSB and public sources to further assess the incident failures and their technical and operational root causes.
There was a Phase 2 of the BOP examination that excluded CSB and ES, but Phase 2 documents, photos, and videos were subsequently made available and considered in this report. In this phase, additional tests were conducted and some components further disassembled.
In analyzing the BOP examination information, it was necessary to also study the incident well flow and the production casing loading. As a result, this report makes findings not only about the BOP equipment and well control procedures, but also about the negative pressure test and a likely wiper plug or production casing failure.
2 Summary of Incident Failures and New Opinions At least seven equipment and procedural failures occurred, listed below in chronological order. While ES agrees with many of the findings in prior incident reports, it notes important differences, with five new opinions on technical and operational aspects.
Failures #1 and #2: The production casing cement and the cementing float valves. Both failures have been described in previous reports5. ES has nothing to add to these reports, which addressed why the cement sealed neither the annular space nor the casing shoe, and that the dual float valves also did not prevent flow from the casing shoe. The negative pressure test that was performed should have helped prevent these failures from leading to a well control event
Failure #3: Negative pressure test. A negative pressure test of the wellbore identified the lack of integrity, but the crew failed to interpret it correctly due to are several contributing causes, summarized next in chronological sequence. These are ES opinions, many of which have been also identified in one or more of the prior reports. New opinions are identified.
Cause: Under-displacement of test fluid. The spacer fluid was under-displaced, leaving part of the spacer below the BOP and adversely affecting the test interpretation.6 The calculated under-displacement of 65 bbls of dense spacer left below the BOP would have a height of about 1500 feet and increase the annular
5 BP report, pg. 54+; National Commission report, pg. 95+; Chief Counsel’s report, pg. 67+, Transocean Report, pg. 27+, DOI report, pg. 41+. 6 Transocean Report, Appendix G, iii.
CSB-FINAL REPORT-BOP(06-02-2014) Page 5 of 83 U.S. Chemical Safety Board By Engineering Services, L.P.
hydrostatic pressure in the annulus, substantially reducing surface kill line pressure. The kill line pressure would be later used to interpret the test results.
Analysis of the real time data indicates that measured returns flow rates during the second displacement were substantially less than rates calculated from pump strokes. An attempt to account for this with a reduced pump efficiency resulted in a mismatch of standpipe pressures. ES believes that the cause might have been a loss of well integrity, either past a failed wiper plug in the casing shoe or an unidentified casing leak. Either of these would be counter to the positive pressure test of the casing earlier in the day.7
Cause: Failure to recognize improper drill pipe pressure at the end of the displacement of test fluid. When displacement pumping stopped, the crew apparently did not recognize that the drill pipe pressure was substantially higher than a correct displacement should have indicated (2,325 psig vs. 1,600 psig). This higher pressure was caused by the volume of spacer fluid that was left in the small annulus below the BOP. Because this annulus was smaller than the intended riser location, its height was increased, causing the greater U-tube pressure on the drill pipe.
Cause: Bleed volume was too large. The crew did not behave as if they were aware that the negative test bleed volumes were substantially greater than compressibility of the well fluid would explain. The excess bleed volume was an indicator of either a well integrity or test setup problem.
Cause: Misinterpretation of drill pipe and kill pressures as indicating a successful test. In the final negative pressure test, the crew incorrectly interpreted the lack of kill line pressure and flow as a successful test, even though the drill pipe pressure was 1,500 psig. It should have also been zero if the test was successful. The drill pipe pressure is a strong indicator of a failed or at least an inconclusive test. ES simulation calculates that the dense spacer fluid extended about 600 feet up into the kill line (from calculated kill line bleed volume). Adding that increased head to the calculated dense fluid below the BOP, the calculated kill pressure is only about 800 psi.
As no kill line pressure was observed at the surface, ES theorizes that the viscous, gelling nature of the spacer fluid could have plugged the kill line, preventing this pressure from reaching the surface.8,9 The absence of kill line pressure gave the decision makers a flawed foundation for a positive test decision.
Cause (new opinion): Did not utilize BOP pressure sensor data to aid in test interpretation. The DWH was equipped with two BOP pressure transducers that could be read by the driller. If checked, they should have shown the crew that the BOP pressure was consistent with the high drill pipe pressure, indicating a failed negative pressure test. There is no evidence that the crew looked at the BOP pressure sensor readings during the test. These sensor pressures had been recorded by the crew earlier in the well during a well control event a month earlier.10
Failure #4: Well influx detection. Starting about 8:50 p.m. during the final displacement, ES calculates that the well became underbalanced and began flowing through casing shoe via the failed cement job and float valves. By about 9:10 p.m., the calculated flow was 9 BPM (bbls/minute), and the calculated pit level had gained about 60
7 Transocean Report,pg. 91; Appendix G, 73-74; came to similar conclusions regarding lost pump volume, and the leakage location being either past the wiper plug or an unidentified casing leak. 8 National Commission Report, 106, 324, note 82. Chief Counsel Report, 151. The CC Report also noted that this material had never been tested for this application, that there was no operational reason to use this spacer, and that the lost circulation material spacer was pumped into the well to avoid disposal of the material as a hazardous waste pursuant to the Resource Conservation and Recovery Act (RCRA). 9 It also possible that a kill line valve on the BOP was accidentally closed during the test, but this is speculation with no evidence. 10 DNV Report, Vol. 2 (March 10, 2010), F-57 to F-61.
CSB-FINAL REPORT-BOP(06-02-2014) Page 6 of 83 U.S. Chemical Safety Board By Engineering Services, L.P.
bbls (over prior 16 minutes).11 The crew did not identify a problem with the returns rate or pit level, likely for reasons discussed in other reports.12
At this time, believing that the water-base spacer had reached the surface13 and no further synthetic oil mud remained, the crew diverted the well returns overboard to dispose of the spacer fluid. This action effectively removed any further measurement of pit gain, an important measurement in monitoring well control
By the time the crew detected the well flow by mud erupting through the rig floor, the well flow rate had reached 40-100 BPM, setting up a highly unusual, extreme flow condition that the BOP would be asked to stop and seal.
Failure #5: Diverter system did not redirect gas and oil flow away from the crew and the rig: The crew had set the diverter to flow the mud-gas separator, which was overwhelmed by the high rate. As a result, gas engulfed the rig floor and the rig generally. The gas quickly reached an ignition source for the explosion. One of the issues is why the diverter flow was not set up to go directly overboard instead of the separator, which may have prevented or delayed the explosion. This failure, its consequences, and causes have been well covered in previous reports.14,15,16
Failure #6: The BOP upper annular (UA) preventer did not seal the well flow. If it had sealed, the amount of oil and gas entering the riser and then escaping at the surface would have been substantially less, reducing the severity and probability of the explosion. As discussed in the Transocean report, the failure was likely caused by erosion of the preventer rubber.17 Later a VBR with similar finger design and rubber components successfully sealed the flow, until BSR failure (next item) opened a new leak path. A VBR closes more rapidly than an annular, reducing erosion potential.
Failure #7: The BOP blind shear ram (BSR) did not seal. Whether actuated by the AMF/deadman at the time of the incident, or the later autoshear ROV intervention, BSR failure led to the protracted release of oil and gas. The BSR failure to seal was caused by the drill pipe being off-center, due to buckling from compressive load, leaving it partially outside the cutting blades and preventing full closure.18
Cause (new opinion): High internal pressure contributed to buckling the drill pipe. ES believes that pressure differential between the inside and outside of the drill pipe must be considered in assessing buckling loads and the amount of drill pipe deflection within the BSR. This engineering principle, often known as “effective compression,” is well recognized in many petroleum industry contexts.19
Force to buckle pipe: ES calculations indicate that well flow axial forces alone were insufficient to buckle the pipe at any time until the vessel sank. However, for a proper analysis, pressure must be also considered; doing so reveals that the DWH drill pipe could be buckled by flow rates within the assumed Macondo flow and
11 Flow rate and pit gain are from the ES simulation calculations. 12 BP report, pg. 93+; National Commission report, pg. 110+; Chief Counsel’s report, pg. 165+, Transocean Report, pg. 103+, DOI report, pg. 99+ 13 Chief Counsel Report, 179 14 Ibid, 194, 199, 237 15 BP Report, 112-122, 128-129, 138 16 Transocean Report, 31, 106, 144, 155, 174, 177, 193 17 Ibid, 154 18 Initially identified in DNV Report, 6, and supported by this study. 19 The concept was considered in the Transocean Report (Appendix M analysis, pages 1 and 28), but was not explicitly cited in the main report. The fluid mechanics concept was also cited in the NAE report (page 53), but was not pursued further. Also, the DNV Report (page 8) recommends additional study of “Computational Fluid Dynamic simulation of the flow through the drill pipe.”
CSB-FINAL REPORT-BOP(06-02-2014) Page 7 of 83 U.S. Chemical Safety Board By Engineering Services, L.P.
pressure envelope, as determined from simulation matching to real time data. The engineering concept to consider pressure is called ‘effective compression’, which this report discusses and applies to the Macondo BSR failure analysis.
While not previously recognized in any published material (that ES could locate), effective compression can affect BOP performance due to buckling-related off-center pipe under high drill pipe pressure conditions.
Drill pipe compressive buckling load from above and the potential impact of Variable Bore Ram (VBR) friction on the incident: An alternative method for the buckling load to have been applied is by the weight of the drill pipe above. This requires (a) that the pipe connection and support by the top drive fails (unknown, but possible by the time of the autoshear actuation) and (b) that the closed VBR develops enough friction to support the net weight of the drill string, about 178,000 lbs.20
(ES analysis indicates that low friction is not an essential assumption for buckling during the AMF/deadman timeframe (near the time of the explosion) because differential pressure dominates the causes of buckling load at that time. This analysis is discussed in the body of this report.)
ES could not find documented test information on VBR friction. Undocumented anecdotal field experiences support low friction (10,000 to 30,000 lbs.),21 but are not conclusive for the DWH situation of high well pressure and offsetting zero closing pressure.
Well control manuals describe a procedure for closing a VBR as a designated hang-off rams and then lowering the drill pipe to mechanically hang it by a tool joint on a pipe ram/VBR.22 This procedure is often employed in response to a kick and requires that VBR friction be low enough for the pipe weight to pull the pipe down through the closed ram until the tool joint makes contact. If the friction is too high for the available weight, the tool joint would be left some distance above the VBR, an undesirable and risky situation. If actual test data were to reveal that VBR friction can be high enough to defeat this hang off procedure, an industry safety improvement would be to inform drilling personnel of friction/weight limitations and alternative response steps.
Other items relating to the BSR
1. New opinion. Which VBR ram(s) were closed by the crew? ES believes that the crew closed only the middle VBR ram and not the upper one. ES calculations reveal that the buckling deflection at the BSR from two closed VBRs was too small compared with what was actually determined by the BOP examination. The deflection from only the middle VBR being closed essentially matches the actual drill pipe position found in during post-incident examination. In the analysis, the upper VBR was subsequently closed by external sea water pressure being higher than VBR wellbore pressure, causing a closing force, and fully closing after the BSR sheared the drill pipe.
2. Precharge pressure in the BOP accumulators (which supply power hydraulic fluid to the AMF/deadman and autoshear systems): The precharge pressure met API standards. A higher precharge could have been used and would have provided a greater margin of reserve power than the API design factor of 1.10,
20 The VBR friction would have needed to support the entire string net weight (above and below the BOP). Air weight was about 208 kips (1000 lbs). Part of this weight was supported by the buoyancy/well pressure effect, which ES calculates at 22-30 kips for an assumed range of 22-29 BPM blowout flow rates, leaving a net load of 186,000 to 178,000 lbs. (String weight is without the lower 3 ½” section, which ES believes may have fallen off during the final displacement – See report section 6 - Incident progression: final displacement). 21 Various personal recollections reported to ES. 22 Examples include Transocean Well Control Handbook, Section 5.3: 1 (BP-HZN-CSB00079189) and BP Well Control Manual Table 4.2.2 (BP-HZN-CSB00163461).
CSB-FINAL REPORT-BOP(06-02-2014) Page 8 of 83 U.S. Chemical Safety Board By Engineering Services, L.P.
giving a somewhat higher final closing force on the BSR. However, FEA analyses by both DNV and an ES contractor indicated the additional force, by itself, would have been unlikely to seal the BSR.23
3. New opinion. Shearing capability of the BSR shear packer, model SBR: ES calculations show that the SBR model packer used in the DWH BOP did not meet Cameron’s published design bulletin on shearing the 6 5/8" drill pipe that was used for essentially all of the DWH drilling at Macondo.24 While 6 5/8" pipe was successfully sheared by the BSR in a 2003 DWH incident,25 this singular case (without a documented actual shear pressure safety margin) does not establish reliability, especially considering Cameron’s product advisory and revised ratings issued in 2007-2008. (The Cameron basis was met for 5½" pipe that was in the BOP at the time of the incident.) A more efficient shear packer, the DVS, was available, which was rated for the 6 5/8" pipe, and shears 5½" pipe at a lower power fluid pressure.26 It is not known if the DVS would have had a better chance of completing shear and sealing with the drill pipe in the buckled location at the time of the explosion.
ES concludes that the BOP AMF/deadman system likely actuated the BSR. The details of this opinion are contained in the separate ES Deepwater Horizon RBS 8D BOP MUX Control System Report.
3 Incident Summary Timeline27
Activities leading up to loss of well control and a fatal explosion April 20, 2010. Operations to temporarily abandon the Macondo well included a negative pressure test, whose purpose was to determine if the recently installed production casing and cement job adequately sealed against flow from the oil reservoir.28 While the negative pressure test was not a regulatory requirement, BP elected to perform it before setting a cement plug inside the casing for the temporary abandonment.29 See Appendix E for a discussion on the risk associated with various iterations of test procedure considered by BP.
Earlier in the day, a positive pressure test of 2,520 psig was successfully held under closed blind rams for 30 minutes, demonstrating outward pressure integrity of the production casing down to the wiper plug located at the top of the float collar. However, the positive pressure test could not verify integrity below the wiper plug where the shoe cement was set.30
BP engineering developed a general procedure during the few days before the test,31 and the rig-site team (BP, Transocean, and M-I SWACO) developed the specific operational steps.32 A portion of the well drilling mud (14 23 DNV report, Appendix G: 14. 24 IADC Daily Drilling Reports, Deepwater Horizon, February 16, 2010 to April 8, 2010. 25 BP Report, Appendix H, p. 234 26 The NAE Report discusses the differences in SBR and DVS shearing efficiency and centering capability, 42, 47 27 Clock times, displacement volumes, and other data from the BP Deepwater Horizon Investigation Report. Appendix D is the source of real-time data used in this report. 28 When a rig disconnects from a deepwater well, the hydrostatic pressure contribution by the riser fluid is replaced by the lower sea water density, resulting in a pressure reduction. Often the resulting hydrostatic pressure is less than the formation pressures, thus losing a barrier against flow. 29 BP Report, 39. 30 Transocean Daily Drilling Report for April 20, 2010, between 10:30 a.m. and 12:00 p.m. (TRN-USCG_MMS-00011646). 31 An email of April 20, 2010 (10:43 a.m.) from Brian Morel to Vadrine, Kaluza, et.al. contained plans for the next few days’ activities, including a negative test procedure: “RIH [run in hole] to 8367'; Displace to seawater from there to above the wellhead; With seawater in the kill close annular and do a negative test ~2350 psi differential.” BP-HZN-CEC008574.
CSB-FINAL REPORT-BOP(06-02-2014) Page 9 of 83 U.S. Chemical Safety Board By Engineering Services, L.P.
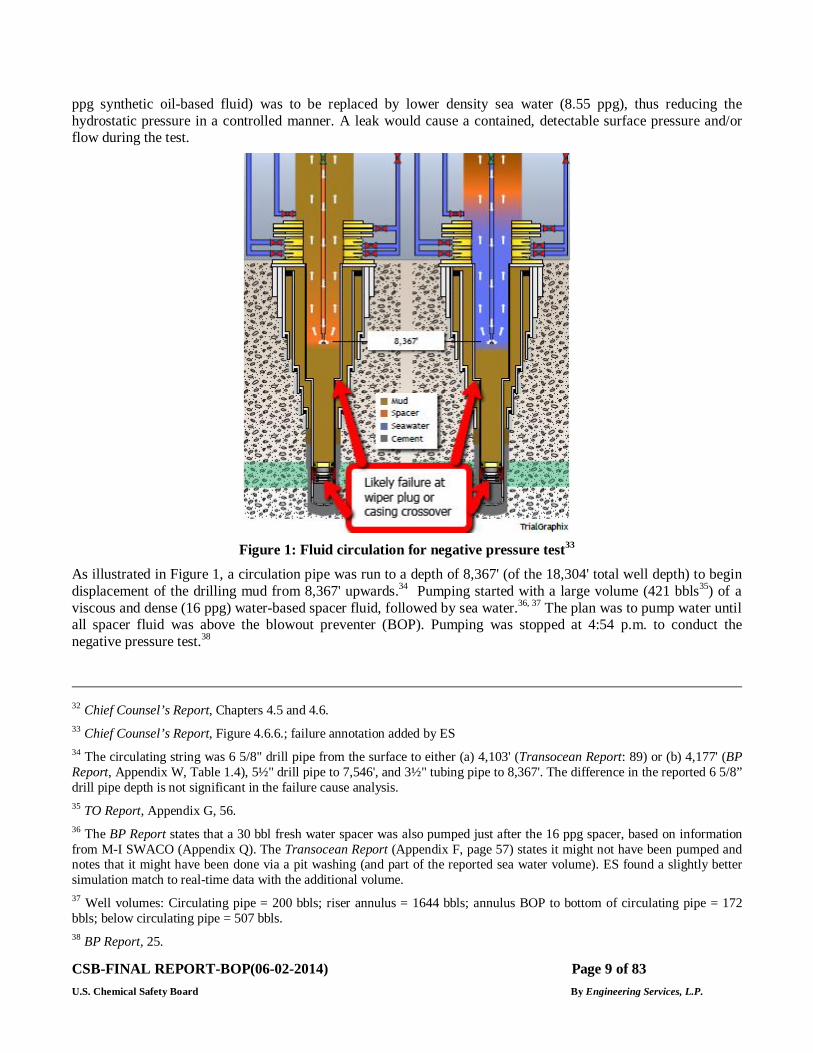
ppg synthetic oil-based fluid) was to be replaced by lower density sea water (8.55 ppg), thus reducing the hydrostatic pressure in a controlled manner. A leak would cause a contained, detectable surface pressure and/or flow during the test.
Figure 1: Fluid circulation for negative pressure test33
As illustrated in Figure 1, a circulation pipe was run to a depth of 8,367' (of the 18,304' total well depth) to begin displacement of the drilling mud from 8,367' upwards.34 Pumping started with a large volume (421 bbls35) of a viscous and dense (16 ppg) water-based spacer fluid, followed by sea water.36, 37 The plan was to pump water until all spacer fluid was above the blowout preventer (BOP). Pumping was stopped at 4:54 p.m. to conduct the negative pressure test.38
32 Chief Counsel’s Report, Chapters 4.5 and 4.6. 33 Chief Counsel’s Report, Figure 4.6.6.; failure annotation added by ES 34 The circulating string was 6 5/8" drill pipe from the surface to either (a) 4,103' (Transocean Report: 89) or (b) 4,177' (BP Report, Appendix W, Table 1.4), 5½" drill pipe to 7,546', and 3½" tubing pipe to 8,367'. The difference in the reported 6 5/8” drill pipe depth is not significant in the failure cause analysis. 35 TO Report, Appendix G, 56. 36 The BP Report states that a 30 bbl fresh water spacer was also pumped just after the 16 ppg spacer, based on information from M-I SWACO (Appendix Q). The Transocean Report (Appendix F, page 57) states it might not have been pumped and notes that it might have been done via a pit washing (and part of the reported sea water volume). ES found a slightly better simulation match to real-time data with the additional volume. 37 Well volumes: Circulating pipe = 200 bbls; riser annulus = 1644 bbls; annulus BOP to bottom of circulating pipe = 172 bbls; below circulating pipe = 507 bbls. 38 BP Report, 25.
CSB-FINAL REPORT-BOP(06-02-2014) Page 10 of 83 U.S. Chemical Safety Board By Engineering Services, L.P.
ES concludes that much of the spacer did not clear the BOP as planned.39 A portion of pumped both spacer and water volume apparently went below the drill pipe, replacing mud that leaked out of the wellbore, as indicated by ES simulations to match real time measured drill pipe pressures. These pressures are driven by both flow rate and wellbore fluid type locations. The leak possibilities were in either the casing or the wiper plug in the lower shoe. ES could find no evidence or technical reason why either of these should have leaked, but a leak assumption was necessary to match the real time data. For the ES simulation figures presented later, it was assumed that the leakage occurred at the casing shoe, but leakage at the casing crossover (12,488 ft.) also provided a good simulation match and led to similar calculation results for the wellbore pressures but with slightly lower flow rates at the possible times of BSR actuation.
An annular preventer was closed to conduct the negative pressure test, initially using the drill pipe to sense pressure down the well. After attempts to bleed the drill pipe pressure to zero failed, the test was switched to the kill line, where a no-pressure/no-flow condition was achieved. Not reconciling the kill line pressure with the high drill pressure, the crew erroneously judged the test successful.
At 8:00 p.m., displacement of the remaining drill mud with water resumed. Soon, as planned, the well hydrostatic pressure on bottom fell below the reservoir pressure. At about 8:51 p.m. (from ES computer simulation), reservoir flow into the wellbore through the casing shoe began at a slow rate. As time progressed, the oil and gas level rose in the well as depicted in Figure 2.
39 BP Report, Appendix W pg. 19; Transocean Report, 91, and Appendix G 73-74 and Item 5.1.1, 145
CSB-FINAL REPORT-BOP(06-02-2014) Page 11 of 83 U.S. Chemical Safety Board By Engineering Services, L.P.
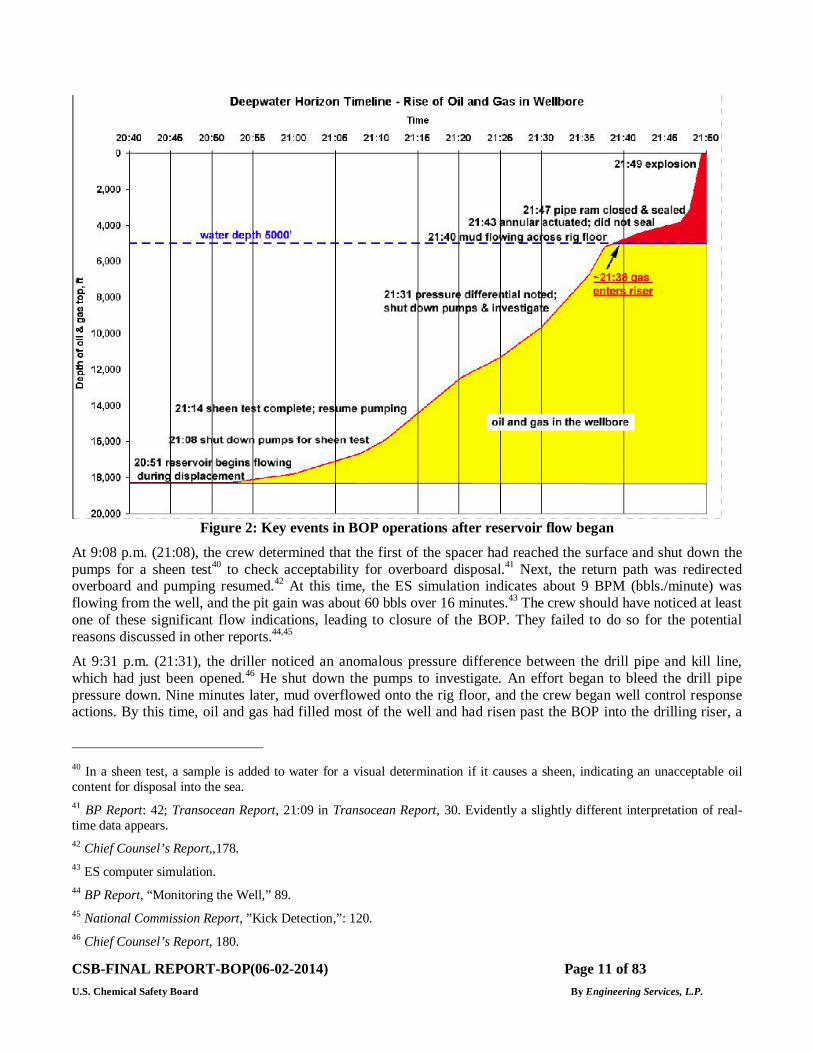
Figure 2: Key events in BOP operations after reservoir flow began
At 9:08 p.m. (21:08), the crew determined that the first of the spacer had reached the surface and shut down the pumps for a sheen test40 to check acceptability for overboard disposal.41 Next, the return path was redirected overboard and pumping resumed.42 At this time, the ES simulation indicates about 9 BPM (bbls./minute) was flowing from the well, and the pit gain was about 60 bbls over 16 minutes.43 The crew should have noticed at least one of these significant flow indications, leading to closure of the BOP. They failed to do so for the potential reasons discussed in other reports.44,45
At 9:31 p.m. (21:31), the driller noticed an anomalous pressure difference between the drill pipe and kill line, which had just been opened.46 He shut down the pumps to investigate. An effort began to bleed the drill pipe pressure down. Nine minutes later, mud overflowed onto the rig floor, and the crew began well control response actions. By this time, oil and gas had filled most of the well and had risen past the BOP into the drilling riser, a
40 In a sheen test, a sample is added to water for a visual determination if it causes a sheen, indicating an unacceptable oil content for disposal into the sea. 41 BP Report: 42; Transocean Report, 21:09 in Transocean Report, 30. Evidently a slightly different interpretation of real-time data appears. 42 Chief Counsel’s Report,,178. 43 ES computer simulation. 44 BP Report, “Monitoring the Well,” 89. 45 National Commission Report, ”Kick Detection,”: 120. 46 Chief Counsel’s Report, 180.
CSB-FINAL REPORT-BOP(06-02-2014) Page 12 of 83 U.S. Chemical Safety Board By Engineering Services, L.P.
serious danger since it will be able to rise and expand rapidly to the surface. The BOP could only stop more gas from entering the riser.
Activation of the BOP, explosion, and operation of BOP emergency systems
Even with the late detection, the BOP faced pressures that were within its design pressure capability, but other aspects created a situation that it failed to handle for reasons that will be discussed.
Four of the Deepwater Horizon BOP shut-in functions were summoned, each of which might have been able to stop the well flow at the BOP:
1. At about 9:43 p.m., the upper annular was actuated by the crew but failed to seal or materially reduce the well flow.47
2. At 9:47 p.m., the crew closed the middle VBR48 and obtained a seal. A large amount of gas and oil had already passed the BOP into the riser. The riser flow accelerated that was powered by a rapid gas expansion flow blowing mud up into the derrick. Gas and oil quickly followed, exploding at 9:49 p.m.
3. After the explosion, the emergency disconnect system (EDS) button was pressed on the bridge at 9:56 p.m.49 The EDS should close the BSR and then disconnect the riser from the BOP, allowing the rig to move away from the location. Both surface instrumentation and the failure of the riser to disconnect indicated a non-function of the EDS, attributable to the explosion severing the MUX (electrical communication) line to the BOP.
4. In the aftermath of the explosion, fire and heat apparently also failed the hydraulic fluid supply to the BOP. With this, the AMF/deadman50 back-up system should have self-triggered to close the BSR. ES believes that the AMF system did actuate the BSR in spite of problems in this control system. But the BSR did not completely close and did not stop the flow.
Computer dynamic flow simulation and analysis of the incident
ES used dynamic flow computer simulations of the Macondo well flow for the time frame beginning with the displacement of the drilling mud, about 4 p.m., up to the surface blowout that occurred near 10 p.m.51
Input pump rates were calculated from the real time pump stroke rate with a pump volumetric efficiency (91%) that gave the best match for measured drill pipe pressures and returns flow rate. Pressure drop was calculated using the Bingham plastic/Moody turbulent models, viscosities being selected to maximize a match with the measured pressures.
There is considerable uncertainty in such calculations, particularly the two-phase pressure drop and at the high Macondo flow rates as the oil and gas neared the surface. Other uncertainties are mixing effects of the various fluids and the wellbore fluid temperatures versus time. To align with the real time data, the simulation scenario 47 The BP Report has the lower annular being closed at this time, based on witness statements about indicator lights in the surface remote control panel. After that report was prepared, examination of the BOP presented evidence proving near certainty that the upper annular was closed. The inconsistency with the witness statement is unexplained. 48 Transocean Report, Vol.1: 153, 155, and other reports conclude that the upper pipe ram was also closed. ES analysis indicates the unlikelihood that the crew closed it, but rather it closed itself later in the incident, as discussed later in this report. 49 BP Report, 29. 50 ‘deadman’ is defined by API Specification 16D: a BOP safety system that is designed to automatically close the wellbore in the event of a simultaneous absence of hydraulic supply and signal transmission capacity in both subsea control pods. (5.9.3). AMF (Automatic Mode Function) is Cameron’s version of a deadman system. 51 ES Report, “Well Flow and BOP Ram Computer Simulations,” April 2, 2013.
CSB-FINAL REPORT-BOP(06-02-2014) Page 13 of 83 U.S. Chemical Safety Board By Engineering Services, L.P.
presented assumes that the wiper plug failed, as discussed earlier. Therefore, while the results were calibrated to real time measured properties, there may be other solutions that also match the real data. The ES model was used to explore different scenarios in the wellbore to help arrive at the opinions in this report.
The computer program was also used to calculate information and figures for the incident sequence descriptions that follow next in this report.
4 Incident Progression: Initial Fluid Displacement for the Negative Pressure Test
Displace mud with spacer fluid and water
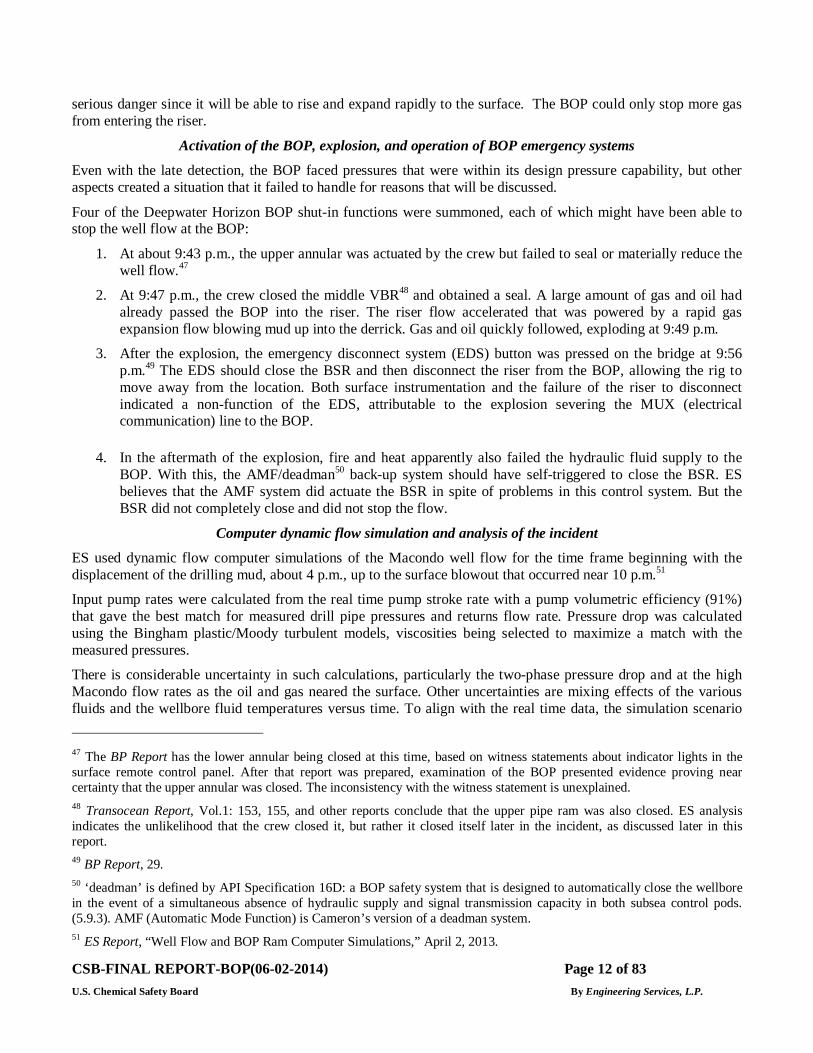
Referring to Figure 3, at 3:56 p.m., pumping began with 421 bbls52 of a 16 ppg spacer fluid down the drill pipe, taking fluid returns from the marine riser at the surface. This spacer was special lost-circulation fluid left over from the drilling phase and had a high effective viscosity.53
3:56 p.m. 4:12 p.m.
start pumping spacer at bottom of drill pipe Figure 3: Initial displacement
52 TO Report Appendix G, 56. 53 BP Report, Appendix W, Section 1.6, states that the spacer fluid was pumped into the well so that it could be legally disposed overboard instead of being shipped back to shore for disposal, per EPA permit criteria.
CSB-FINAL REPORT-BOP(06-02-2014) Page 14 of 83 U.S. Chemical Safety Board By Engineering Services, L.P.
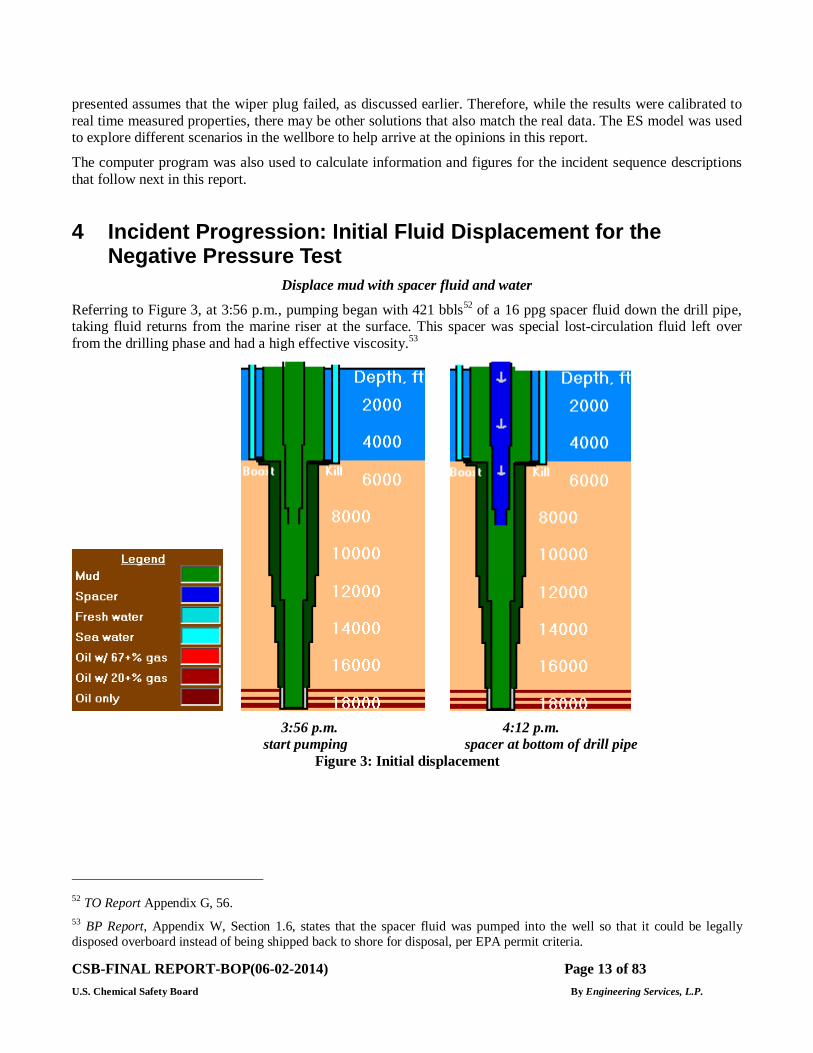
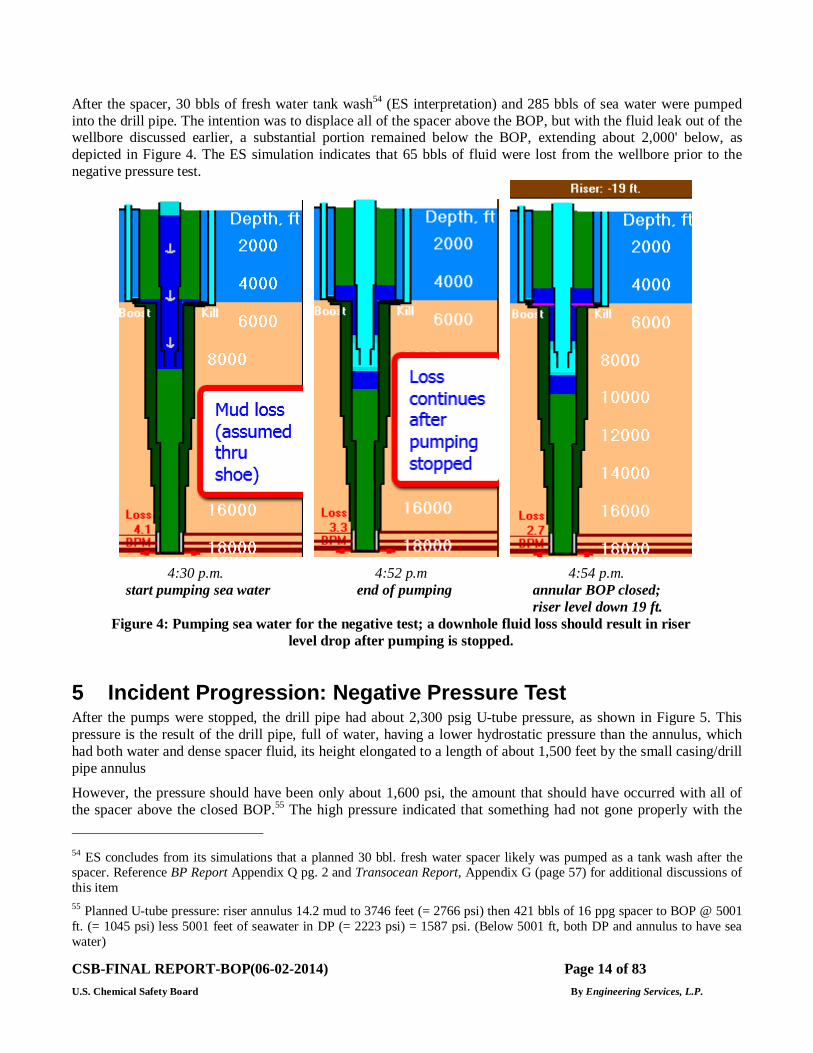
After the spacer, 30 bbls of fresh water tank wash54 (ES interpretation) and 285 bbls of sea water were pumped into the drill pipe. The intention was to displace all of the spacer above the BOP, but with the fluid leak out of the wellbore discussed earlier, a substantial portion remained below the BOP, extending about 2,000' below, as depicted in Figure 4. The ES simulation indicates that 65 bbls of fluid were lost from the wellbore prior to the negative pressure test.
4:30 p.m. 4:52 p.m 4:54 p.m.
start pumping sea water end of pumping annular BOP closed; riser level down 19 ft. Figure 4: Pumping sea water for the negative test; a downhole fluid loss should result in riser
level drop after pumping is stopped.
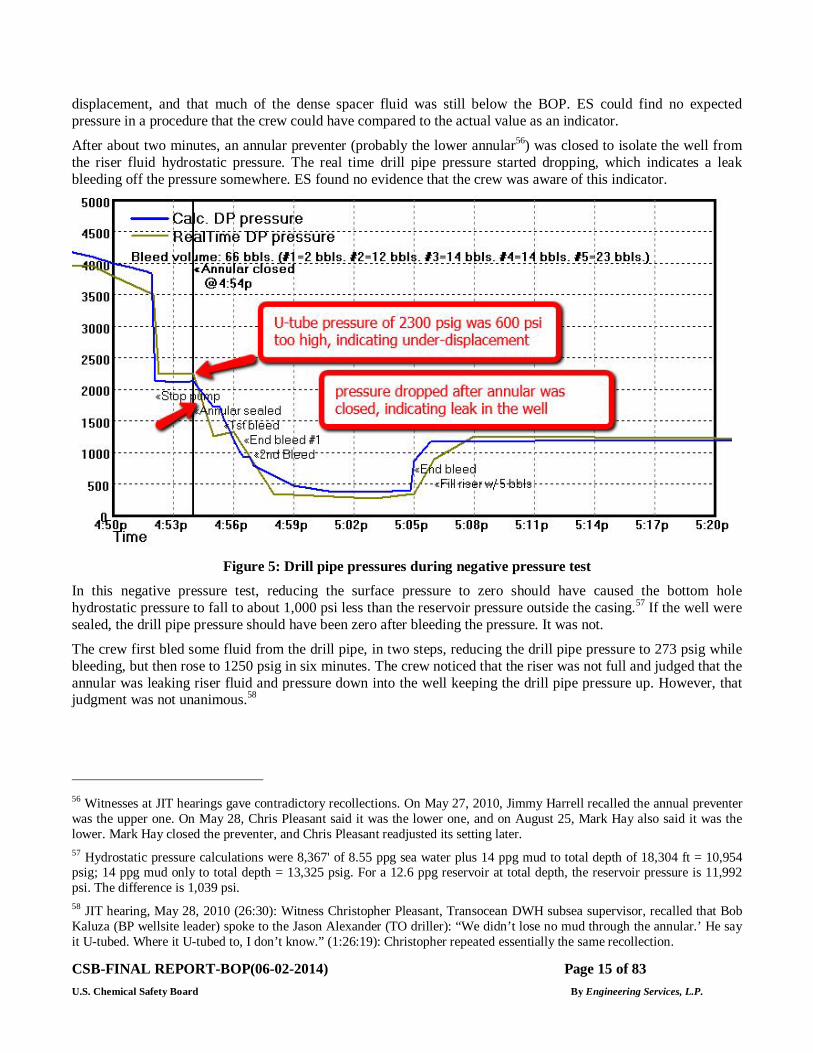
5 Incident Progression: Negative Pressure Test After the pumps were stopped, the drill pipe had about 2,300 psig U-tube pressure, as shown in Figure 5. This pressure is the result of the drill pipe, full of water, having a lower hydrostatic pressure than the annulus, which had both water and dense spacer fluid, its height elongated to a length of about 1,500 feet by the small casing/drill pipe annulus
However, the pressure should have been only about 1,600 psi, the amount that should have occurred with all of the spacer above the closed BOP.55 The high pressure indicated that something had not gone properly with the 54 ES concludes from its simulations that a planned 30 bbl. fresh water spacer likely was pumped as a tank wash after the spacer. Reference BP Report Appendix Q pg. 2 and Transocean Report, Appendix G (page 57) for additional discussions of this item 55 Planned U-tube pressure: riser annulus 14.2 mud to 3746 feet (= 2766 psi) then 421 bbls of 16 ppg spacer to BOP @ 5001 ft. (= 1045 psi) less 5001 feet of seawater in DP (= 2223 psi) = 1587 psi. (Below 5001 ft, both DP and annulus to have sea water)
CSB-FINAL REPORT-BOP(06-02-2014) Page 15 of 83 U.S. Chemical Safety Board By Engineering Services, L.P.
displacement, and that much of the dense spacer fluid was still below the BOP. ES could find no expected pressure in a procedure that the crew could have compared to the actual value as an indicator.
After about two minutes, an annular preventer (probably the lower annular56) was closed to isolate the well from the riser fluid hydrostatic pressure. The real time drill pipe pressure started dropping, which indicates a leak bleeding off the pressure somewhere. ES found no evidence that the crew was aware of this indicator.
Figure 5: Drill pipe pressures during negative pressure test
In this negative pressure test, reducing the surface pressure to zero should have caused the bottom hole hydrostatic pressure to fall to about 1,000 psi less than the reservoir pressure outside the casing.57 If the well were sealed, the drill pipe pressure should have been zero after bleeding the pressure. It was not.
The crew first bled some fluid from the drill pipe, in two steps, reducing the drill pipe pressure to 273 psig while bleeding, but then rose to 1250 psig in six minutes. The crew noticed that the riser was not full and judged that the annular was leaking riser fluid and pressure down into the well keeping the drill pipe pressure up. However, that judgment was not unanimous.58
56 Witnesses at JIT hearings gave contradictory recollections. On May 27, 2010, Jimmy Harrell recalled the annual preventer was the upper one. On May 28, Chris Pleasant said it was the lower one, and on August 25, Mark Hay also said it was the lower. Mark Hay closed the preventer, and Chris Pleasant readjusted its setting later. 57 Hydrostatic pressure calculations were 8,367' of 8.55 ppg sea water plus 14 ppg mud to total depth of 18,304 ft = 10,954 psig; 14 ppg mud only to total depth = 13,325 psig. For a 12.6 ppg reservoir at total depth, the reservoir pressure is 11,992 psi. The difference is 1,039 psi. 58 JIT hearing, May 28, 2010 (26:30): Witness Christopher Pleasant, Transocean DWH subsea supervisor, recalled that Bob Kaluza (BP wellsite leader) spoke to the Jason Alexander (TO driller): “We didn’t lose no mud through the annular.’ He say it U-tubed. Where it U-tubed to, I don’t know.” (1:26:19): Christopher repeated essentially the same recollection.
CSB-FINAL REPORT-BOP(06-02-2014) Page 16 of 83 U.S. Chemical Safety Board By Engineering Services, L.P.
The crew increased the closing pressure of the annular from 1,500 psig to 1,900 psig to improve the seal. The riser was refilled with an estimated 20-25 bbls of mud (value not certain)59 and stayed full, which the crew interpreted as success in correcting a leak.60
The ES simulation indicates that there is another reasonable explanation.61 Losses through a failed wiper plug or casing, as discussed earlier, likely continued after pumping stopped. If so, as discussed earlier, the fluid level in the riser should drop during the two minutes between pump shutdown and annular closure. ES simulations calculate a loss of 5-15 bbls. This suggests that the observed riser loss may not have been due to an annular leak but rather that the riser loss had already occurred before it was closed.
There is no evidence that any crew member checked the riser level before closing the annular (a common practice with at least one operator,62 but not a documented industry standard). A low level would have indicated a casing, riser, or other leak, which could be diagnosed and lead to remedial steps instead of proceeding with the negative pressure test.
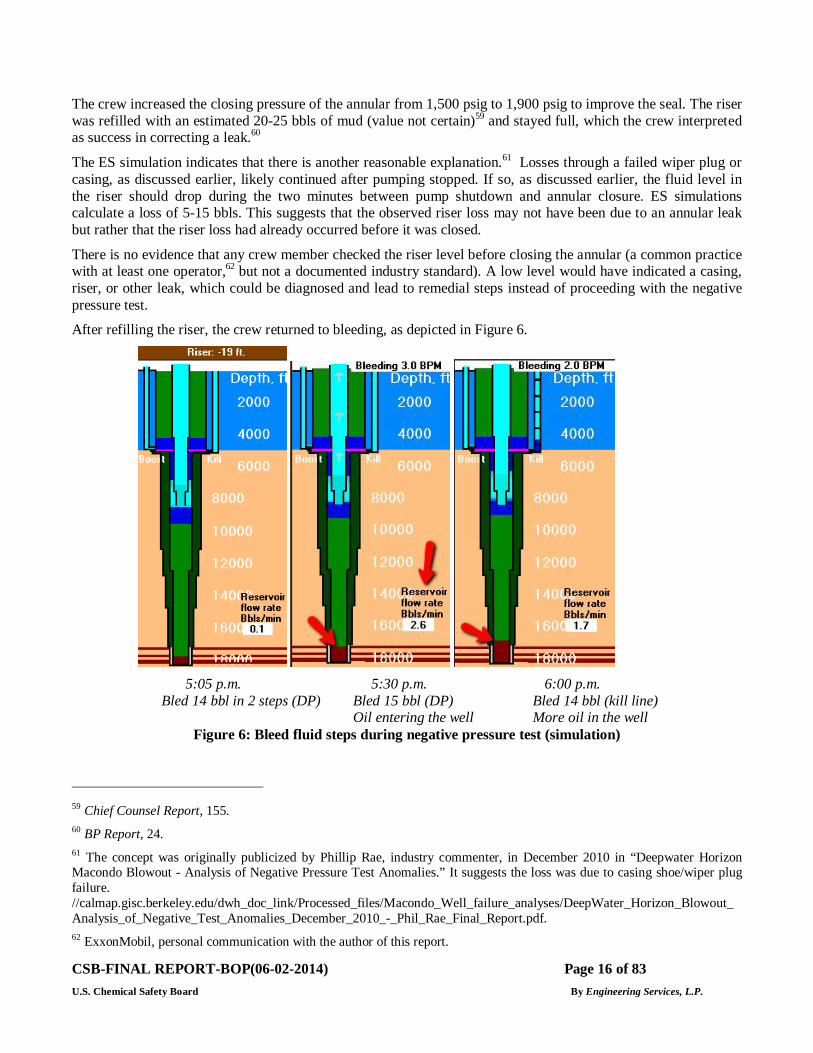
After refilling the riser, the crew returned to bleeding, as depicted in Figure 6.
5:05 p.m. 5:30 p.m. 6:00 p.m.
Bled 14 bbl in 2 steps (DP) Bled 15 bbl (DP) Bled 14 bbl (kill line) Oil entering the well More oil in the well
Figure 6: Bleed fluid steps during negative pressure test (simulation)
59 Chief Counsel Report, 155. 60 BP Report, 24. 61 The concept was originally publicized by Phillip Rae, industry commenter, in December 2010 in “Deepwater Horizon Macondo Blowout - Analysis of Negative Pressure Test Anomalies.” It suggests the loss was due to casing shoe/wiper plug failure. //calmap.gisc.berkeley.edu/dwh_doc_link/Processed_files/Macondo_Well_failure_analyses/DeepWater_Horizon_Blowout_Analysis_of_Negative_Test_Anomalies_December_2010_-_Phil_Rae_Final_Report.pdf. 62 ExxonMobil, personal communication with the author of this report.
CSB-FINAL REPORT-BOP(06-02-2014) Page 17 of 83 U.S. Chemical Safety Board By Engineering Services, L.P.
The supervisors discussed the results thus far, and a BP well site leader decided to change the procedure to test on the kill line, a relatively small diameter pipe that connects to the well directly at the BOP. This decision was based, at least in part, on the kill line being the test point mentioned in the MMS permit.63
Starting 5:52 p.m., the crew bled 3-15 bbls of sea water from the kill line over several minutes. Drill pipe pressure fell to about 200 psi. A witness reported continuous flow from the kill line that spurted and was still flowing when instructions were given to shut in the line.64 Meanwhile, the drill pipe pressure gradually rose to 1,400 psig and leveled off by 6:35 p.m. After discussion, the crew pumped sea water into the kill line to ensure it was full. Upon reopening, the crew bled only 0.2 bbl pressure followed by no flow for about 30 minutes.65
Discussions ensued concerning the 1,400 psig on the drill pipe versus the lack of pressure or flow on the kill line. At 7:55 p.m., the decision was that the test succeeded and that the production casing was sound.66 This ultimately proved to be an erroneous judgment.
Dense spacer remaining below the BOP from the under-displacement would have increased the annular hydrostatic pressure, substantially reducing the surface kill line pressure and adversely affecting the test interpretation.
Also, some of the viscous spacer had moved into the kill line during its bleed. Several reports note that this viscous, gelling fluid might have clogged the kill line.67,68 The ES simulation indicates that there were about 600 feet of the spacer in the kill line. The simulation calculated about 800 psig of pressure, which could be plausibly blocked by thickened spacer. The mud company (M-I SWACO) had earlier advised BP that this spacer had a risk of congealing in “small restrictions.”69
The absence of final kill line pressure and flow was the basis of the crew’s erroneous judgment of success.
Overall between 5:08 p.m. and 7:55 p.m., the crew bled a total of 33 to 55 bbls70 from the well (simulation gives 41 bbls.), including perhaps 25 bbls that the crew had attributed to the annular leaking riser mud.71 These volumes are substantially greater than the 3.7 bbls fluid compressibility would explain,72 likely meaning that some external fluid had entered the well. The crew did not behave as they were aware that the total bleed volume was much too high.
63 National Commission Report, 107-108. 64 BP Report, 25. 65 Ibid 66 Ibid 67 National Commission Report, note 82, 324. Chief Counsel Report, 151 The GC Report also noted that this material had never been tested for this application, that there was no operational reason to use this spacer, and that it was pumped into the well to exploit an EPA RCRA provision to avoid shore disposal costs. BP Report, 40. Transocean Report, 99. 68 BP Report, Appendix Q, 3: concluded “Solids from the spacer could have plugged the kill line, or the viscosity or gel strength of the spacer could have been too high to allow pressure to be transmitted through the kill line. 69 Chief Counsel’s Report, 151. 70 Range of volumes come from different sources, both reported and computer simulation. 71 The riser fill volume is not accurately known, with wide range from various accounts. Chief Counsel’s Report, 152. 72 BP Report, Appendix R: 1.
CSB-FINAL REPORT-BOP(06-02-2014) Page 18 of 83 U.S. Chemical Safety Board By Engineering Services, L.P.
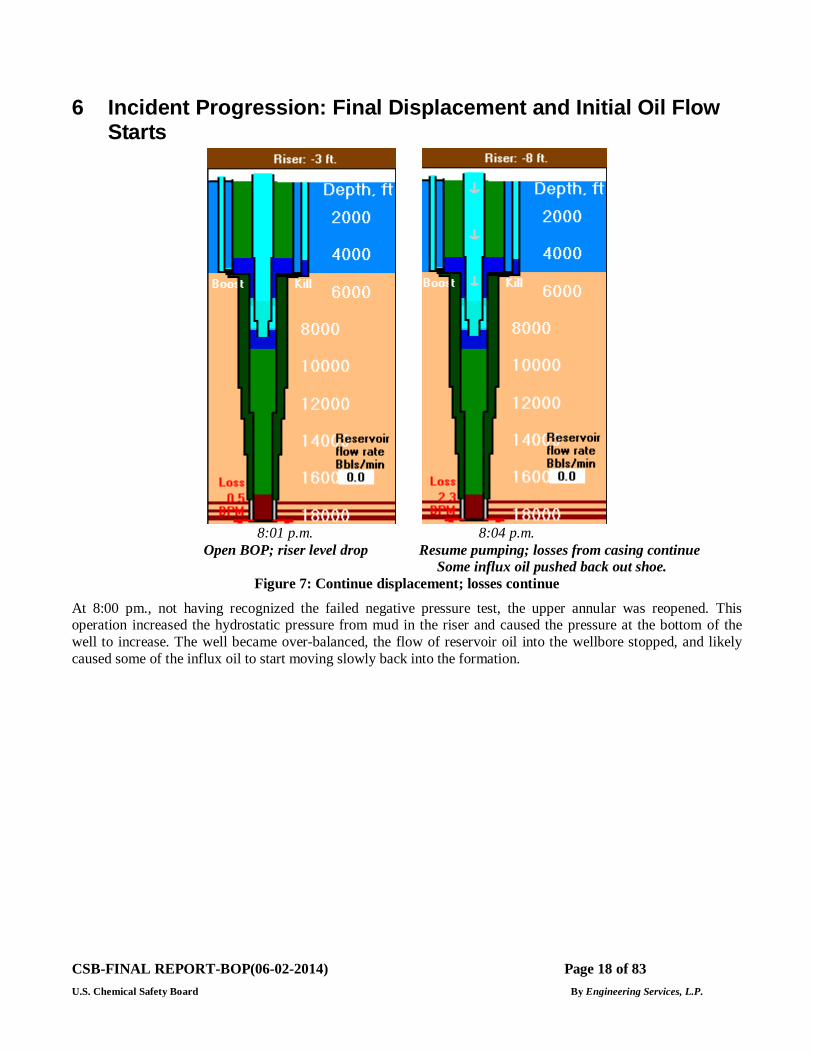
6 Incident Progression: Final Displacement and Initial Oil Flow Starts
8:01 p.m. 8:04 p.m.
Open BOP; riser level drop Resume pumping; losses from casing continue Some influx oil pushed back out shoe.
Figure 7: Continue displacement; losses continue
At 8:00 pm., not having recognized the failed negative pressure test, the upper annular was reopened. This operation increased the hydrostatic pressure from mud in the riser and caused the pressure at the bottom of the well to increase. The well became over-balanced, the flow of reservoir oil into the wellbore stopped, and likely caused some of the influx oil to start moving slowly back into the formation.
CSB-FINAL REPORT-BOP(06-02-2014) Page 19 of 83 U.S. Chemical Safety Board By Engineering Services, L.P.
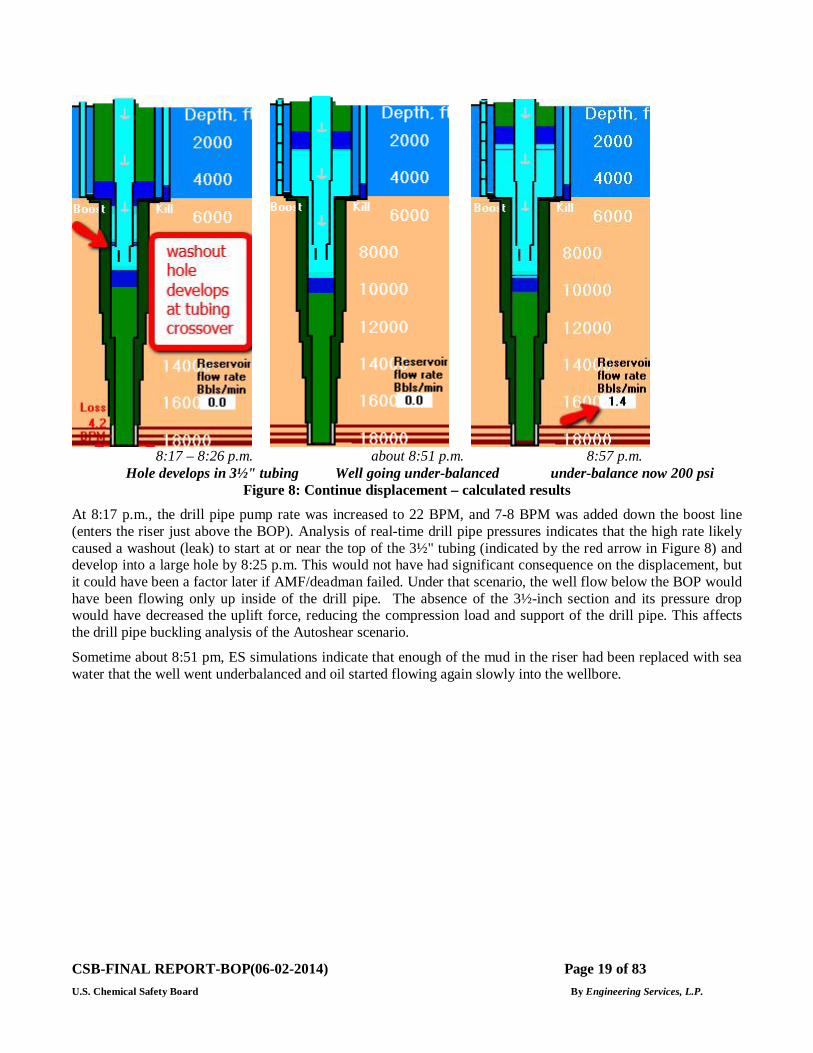
8:17 – 8:26 p.m. about 8:51 p.m. 8:57 p.m.
Hole develops in 3½" tubing Well going under-balanced under-balance now 200 psi Figure 8: Continue displacement – calculated results
At 8:17 p.m., the drill pipe pump rate was increased to 22 BPM, and 7-8 BPM was added down the boost line (enters the riser just above the BOP). Analysis of real-time drill pipe pressures indicates that the high rate likely caused a washout (leak) to start at or near the top of the 3½" tubing (indicated by the red arrow in Figure 8) and develop into a large hole by 8:25 p.m. This would not have had significant consequence on the displacement, but it could have been a factor later if AMF/deadman failed. Under that scenario, the well flow below the BOP would have been flowing only up inside of the drill pipe. The absence of the 3½-inch section and its pressure drop would have decreased the uplift force, reducing the compression load and support of the drill pipe. This affects the drill pipe buckling analysis of the Autoshear scenario.
Sometime about 8:51 pm, ES simulations indicate that enough of the mud in the riser had been replaced with sea water that the well went underbalanced and oil started flowing again slowly into the wellbore.
CSB-FINAL REPORT-BOP(06-02-2014) Page 20 of 83 U.S. Chemical Safety Board By Engineering Services, L.P.
7 Incident Progression: Oil Flow Increases
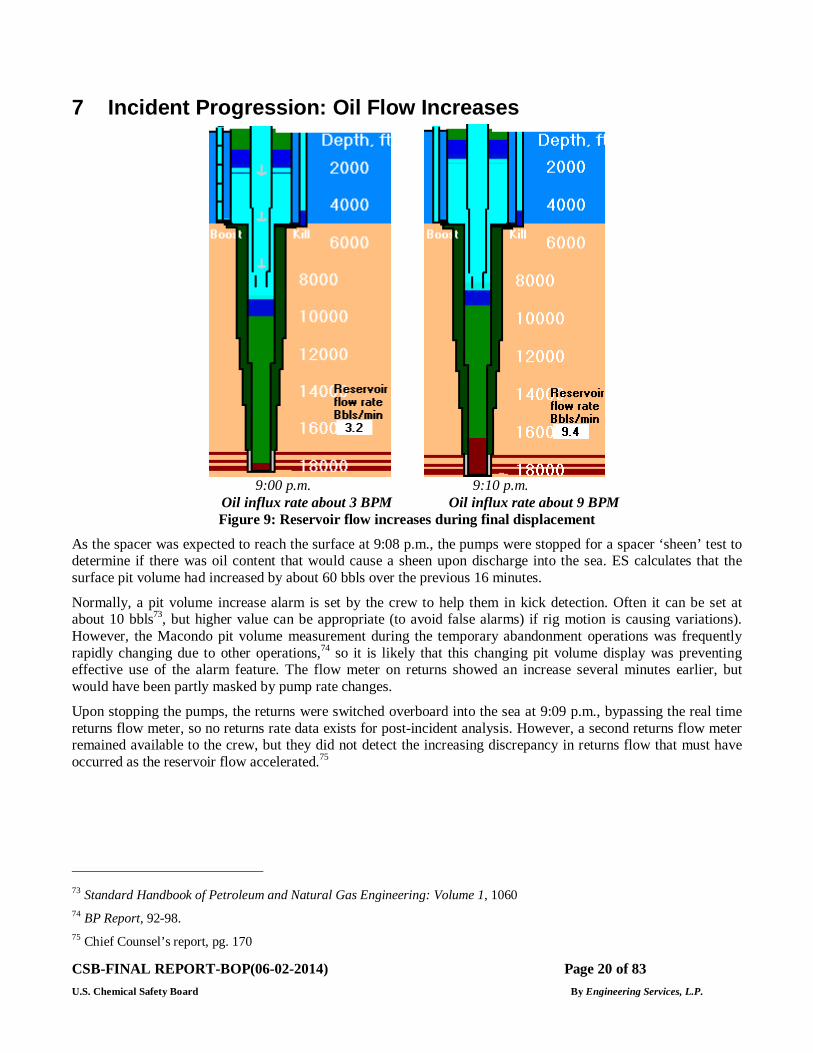
9:00 p.m. 9:10 p.m. Oil influx rate about 3 BPM Oil influx rate about 9 BPM
Figure 9: Reservoir flow increases during final displacement
As the spacer was expected to reach the surface at 9:08 p.m., the pumps were stopped for a spacer ‘sheen’ test to determine if there was oil content that would cause a sheen upon discharge into the sea. ES calculates that the surface pit volume had increased by about 60 bbls over the previous 16 minutes.
Normally, a pit volume increase alarm is set by the crew to help them in kick detection. Often it can be set at about 10 bbls73, but higher value can be appropriate (to avoid false alarms) if rig motion is causing variations). However, the Macondo pit volume measurement during the temporary abandonment operations was frequently rapidly changing due to other operations,74 so it is likely that this changing pit volume display was preventing effective use of the alarm feature. The flow meter on returns showed an increase several minutes earlier, but would have been partly masked by pump rate changes.
Upon stopping the pumps, the returns were switched overboard into the sea at 9:09 p.m., bypassing the real time returns flow meter, so no returns rate data exists for post-incident analysis. However, a second returns flow meter remained available to the crew, but they did not detect the increasing discrepancy in returns flow that must have occurred as the reservoir flow accelerated.75
73 Standard Handbook of Petroleum and Natural Gas Engineering: Volume 1, 1060 74 BP Report, 92-98. 75 Chief Counsel’s report, pg. 170
CSB-FINAL REPORT-BOP(06-02-2014) Page 21 of 83 U.S. Chemical Safety Board By Engineering Services, L.P.
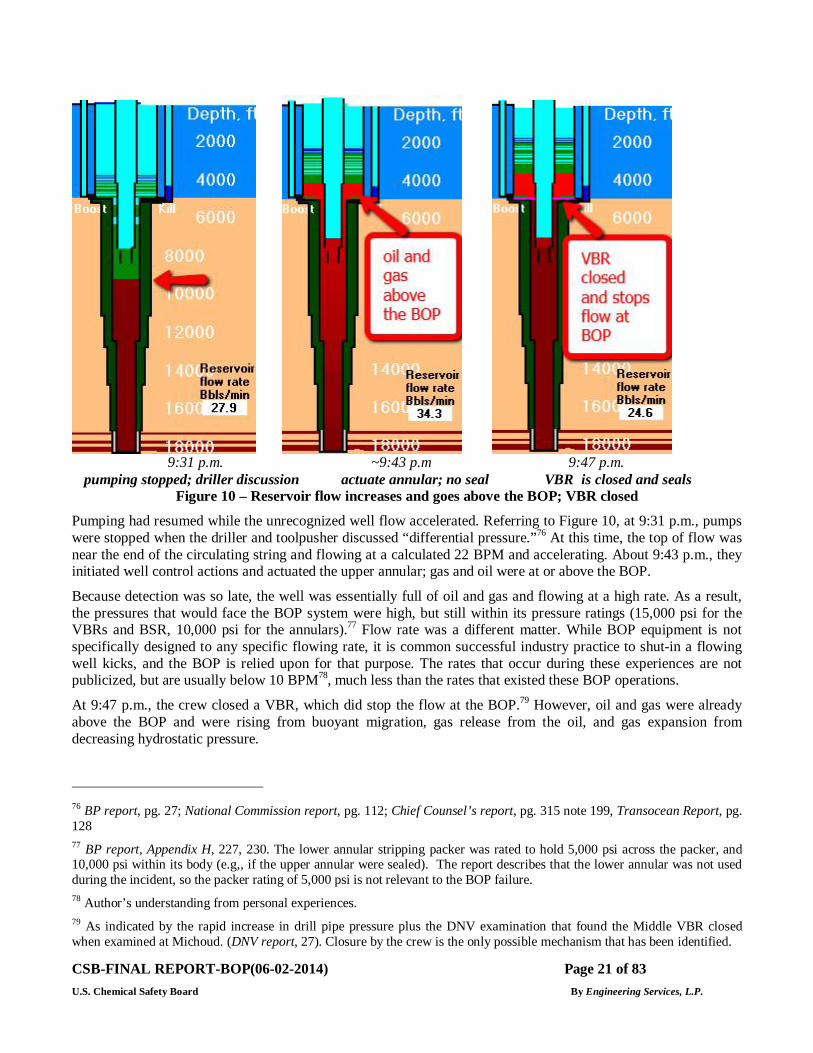
9:31 p.m. ~9:43 p.m 9:47 p.m.
pumping stopped; driller discussion actuate annular; no seal VBR is closed and seals Figure 10 – Reservoir flow increases and goes above the BOP; VBR closed
Pumping had resumed while the unrecognized well flow accelerated. Referring to Figure 10, at 9:31 p.m., pumps were stopped when the driller and toolpusher discussed “differential pressure.”76 At this time, the top of flow was near the end of the circulating string and flowing at a calculated 22 BPM and accelerating. About 9:43 p.m., they initiated well control actions and actuated the upper annular; gas and oil were at or above the BOP.
Because detection was so late, the well was essentially full of oil and gas and flowing at a high rate. As a result, the pressures that would face the BOP system were high, but still within its pressure ratings (15,000 psi for the VBRs and BSR, 10,000 psi for the annulars).77 Flow rate was a different matter. While BOP equipment is not specifically designed to any specific flowing rate, it is common successful industry practice to shut-in a flowing well kicks, and the BOP is relied upon for that purpose. The rates that occur during these experiences are not publicized, but are usually below 10 BPM78, much less than the rates that existed these BOP operations.
At 9:47 p.m., the crew closed a VBR, which did stop the flow at the BOP.79 However, oil and gas were already above the BOP and were rising from buoyant migration, gas release from the oil, and gas expansion from decreasing hydrostatic pressure.
76 BP report, pg. 27; National Commission report, pg. 112; Chief Counsel’s report, pg. 315 note 199, Transocean Report, pg. 128 77 BP report, Appendix H, 227, 230. The lower annular stripping packer was rated to hold 5,000 psi across the packer, and 10,000 psi within its body (e.g,, if the upper annular were sealed). The report describes that the lower annular was not used during the incident, so the packer rating of 5,000 psi is not relevant to the BOP failure. 78 Author’s understanding from personal experiences. 79 As indicated by the rapid increase in drill pipe pressure plus the DNV examination that found the Middle VBR closed when examined at Michoud. (DNV report, 27). Closure by the crew is the only possible mechanism that has been identified.
CSB-FINAL REPORT-BOP(06-02-2014) Page 22 of 83 U.S. Chemical Safety Board By Engineering Services, L.P.
8 Failure of the Upper Annular and Sealing by a VBR Transocean’s customary response to a flowing well (well kick) with drill pipe in the hole is to actuate an annular preventer, preferably the upper.80 Witness accounts said that the bridge remote control panel indicated that the lower annular (LA) was closed.81 However, upon DNV examination at Michoud, the LA was found open and the upper annular closed.82 Based on simulation matching with the real time data, ES believes that the upper annular (UA) was actuated at 9:43 p.m., but it did not seal.83 If it had sealed, the drill pipe pressure at the surface would have rapidly increased to 5000+ psig (as it did when a VBR sealed a short time later at 9:47 p.m.). Rather the drill pipe pressure fluctuated between 1,800 and 400 psig in this period.84
Failure of the Upper Annular
The upper annular failed to seal against the high flow rate encountered at Macondo. While closing, the flow rate through the upper annular was calculated to be about 35 BPM (bbls/minute).85 After closing, the calculated flow rate through the annular reduced by only a small amount to 20-25 BPM.
ES attributes the annular failure to high-velocity flow within the annular, eroding the sealing rubber and possibly some of the drill pipe to create a flow path.
It should also be recognized that annulars can usually seal with some flow, as proven by years of various industry experience.
VBR Actuation and temporary successful sealing of the well ES believes that the crew closed at least one VBR at 9:47 p.m., and that it sealed the well, holding a pressure of about 9,000 psia (about 8,000 psi differential).86
While the VBR has a roughly similar metal fingered and sealing rubber design as the annular, it successfully sealed the well about 4 minutes later, when the flow rate was about the same. ES hypothesizes that the faster closing rate of the VBR helped give it a higher flow rate capability.
During ensuing weeks of the blowout, the VBR lost its annular seal, likely due to its rubber sealing element failing due to extended high temperature. The temperature inside the BOP during these weeks was estimated by BP to be 180-220ºF.87 The Cameron rated operating range is 70-180ºF.88 While there must also be limits to the VBR ability to seal on high flow, this experience also demonstrates that a VBR can have higher high-flow capability than an annular.
80 Transocean Well Control Handbook 5.3.3 81 DNV Report, Vol. 2, F-102. 82 Ibid, Vol. 1, 27 83 To obtain a match with real time data, the annular had to be moved to 95% closed starting at 9:43 pm. (95% reflecting the deduced leak condition). The upper annular was found closed at Michoud, and the lower found open. See Appendix C, Condition of BOP as found 84 BP Report, Appendix Z, Figure 1. 85 ES simulation (volume rate in the BOP). 86 ES calculation using real time drill pipe pressure adjusted for water in the drill pipe and riser fluid density from simulation. 87 Flow Rates from the Macondo MC252 Well by Dr. R. C. Dykhuizen, Sandia Labs; 7 TREX-001452 88 Cameron bulletin 833D, 8/21/2006
CSB-FINAL REPORT-BOP(06-02-2014) Page 23 of 83 U.S. Chemical Safety Board By Engineering Services, L.P.
9 Incident Progression: Riser Unloading and the Explosion At 9:40 pm, water and mud were coming up through the rotary table spilling onto the rig floor. ES estimates that by 9:47pm, when a VBR sealed the well at the BOP, the riser was 10-20 percent filled with oil and evolving gas, possibly much more. Eventually, Mud and water shot up through the derrick.
After gas surfaced, the flow would surge and belch as gas bubbles surfaced, but would have decreased as the riser gas became exhausted, within 10-20 minutes.89 The source of oil and gas had been stopped by the closed VBR. The initial gas release rates were likely in the 100-400 mmcf/day range for 7-8 minutes.90 The rate and duration dispersed the gas to ignition sources in sufficient concentrations for the initial explosions to occur.
At 9:56 p.m., the EDS (Emergency Disconnect System) button was pushed on the bridge and should have closed the BSR and disconnected the riser.91 However, there was no indication of actuation, e.g., riser disconnecting, and the low accumulator alarm was sounding, indicating loss of surface hydraulic power. It is likely that MUX communication was also lost in the initial explosion.92 These events would have satisfied the criteria for automatic activation of the AMF/deadman backup system within 1-2 minutes of their loss, i.e., before 9:58 p.m.
10 BSR Failure to Seal With its triggering conditions met, the AMF/deadman system is designed to automatically close the BSR. Despite likely actuation of the AMF/deadman at Macondo, the BSR was unable to fully close and seal the well.
The DNV forensic analysis revealed that when the BSR activated, the drill pipe was positioned off-center near the inside wall of the BOP, partly outside of the range of the BSR cutting blades.93
89 BP Report, Appendix W, 56; Figure 3.35 shows calculated pressure above BOP fell from 2500 psi to 800 psia in ten minutes, and to 100 psia in another 10 minutes. 90 BP report, Appendix V, pg. ii, Figure ES-1 91 Chief Counsel’s report, pg. 198. 92 Ibid. 93 DNV report, 53-56, 100
CSB-FINAL REPORT-BOP(06-02-2014) Page 24 of 83 U.S. Chemical Safety Board By Engineering Services, L.P.
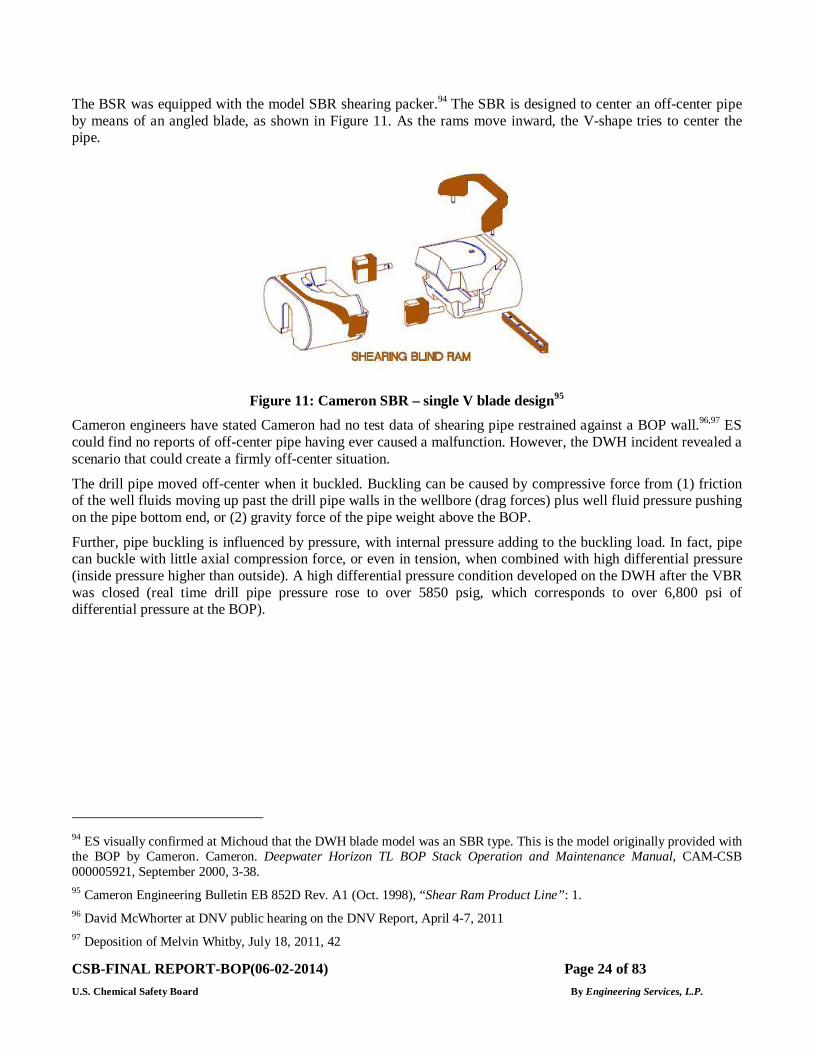
The BSR was equipped with the model SBR shearing packer.94 The SBR is designed to center an off-center pipe by means of an angled blade, as shown in Figure 11. As the rams move inward, the V-shape tries to center the pipe.
Figure 11: Cameron SBR – single V blade design95
Cameron engineers have stated Cameron had no test data of shearing pipe restrained against a BOP wall.96,97 ES could find no reports of off-center pipe having ever caused a malfunction. However, the DWH incident revealed a scenario that could create a firmly off-center situation.
The drill pipe moved off-center when it buckled. Buckling can be caused by compressive force from (1) friction of the well fluids moving up past the drill pipe walls in the wellbore (drag forces) plus well fluid pressure pushing on the pipe bottom end, or (2) gravity force of the pipe weight above the BOP.
Further, pipe buckling is influenced by pressure, with internal pressure adding to the buckling load. In fact, pipe can buckle with little axial compression force, or even in tension, when combined with high differential pressure (inside pressure higher than outside). A high differential pressure condition developed on the DWH after the VBR was closed (real time drill pipe pressure rose to over 5850 psig, which corresponds to over 6,800 psi of differential pressure at the BOP).
94 ES visually confirmed at Michoud that the DWH blade model was an SBR type. This is the model originally provided with the BOP by Cameron. Cameron. Deepwater Horizon TL BOP Stack Operation and Maintenance Manual, CAM-CSB 000005921, September 2000, 3-38. 95 Cameron Engineering Bulletin EB 852D Rev. A1 (Oct. 1998), “Shear Ram Product Line”: 1. 96 David McWhorter at DNV public hearing on the DNV Report, April 4-7, 2011 97 Deposition of Melvin Whitby, July 18, 2011, 42
CSB-FINAL REPORT-BOP(06-02-2014) Page 25 of 83 U.S. Chemical Safety Board By Engineering Services, L.P.
11 Pipe Buckling at the Macondo Well – Effective Compression A differential pressure effect to promote pipe buckling is a consequence of fluid mechanics and physics, well documented in published professional engineering society papers.98 The phenomenon is also included in a DNV offshore code for submarine pipelines.99 Internal pressure does not create compressive force in the conventional sense, but rather creates bending moments that lead to buckling just as actual compression force can. As a result, higher internal pressure increases the buckling tendency of a pipe. An engineering parameter for this effect can be calculated and is termed effective compression.100
Differential pressure should be considered in assessing the amount of drill pipe deflection in the Deepwater Horizon BOP. As will be discussed next, axial forces alone were likely insufficient to buckle the pipe at any time until the vessel sank.
Furthermore, and while perhaps not immediately obvious, an analysis of effective compression experienced by the drill pipe addresses the DNV recommendation to further study conditions leading to pipe buckling.101 The recommendation is important because as the effective compression analysis presented here demonstrates, pipe buckling conditions can exist even if timely well control actions initially shut in a well. The potential for drill pipe to buckle within the BSR during a shut-in well situation reveals previously unrecognized, credible scenarios in which a BSR could fail to seal.
98 A. Lubinski, W.S.Althouse, and J.L. Logan, Helical Buckling of Tubing Sealed in Packers, JPT (1962); A.J. Chesney Jr. and Juan Garcia, Load and Stability Analysis of Tubular Strings, 69-PET-15, ASME Petroleum Mechanical Engineering Conference, Tulsa, OK (1969); Stan A. Christman, Casing Stresses Caused by Buckling of Concentric Pipes, SPE 6059 (1976); R.F. Mitchell, Fluid Momentum Balance Defines the Effective Force, SPE/IADC 119954 (2009); R.F. Mitchell, Casing Design with Flowing Fluids, SPE/IADC 139829 (2011); A.C. Palmer, J.A.S. Baldry, Lateral Buckling of Axially Constrained Pipelines. University of Cambridge, JPT (1974); C.P, Sparks, “The Influence of Tension, Pressure and Weight on Pipe and Riser Deformations and Stresses,” Journal of Energy Resources Technology, ASME, (1980); Charles Sparks, “Effective Tension in Pipes and Risers: A Bold but Simple Concept World Oil, December 2012. 99 Submarine Pipeline Systems, DNV-OS-F101 Standard (2010), Section 4 G 300, 40. 100 Stress Engineering Services (SES), serving under contract from Transocean, did suggest effective compression to explain the pipe buckling. [Transocean, 2011, Appendix M] However, Transocean did not use the SES explanation in their investigation report. The National Academy of Engineering report notes the differences between the results of Transocean and of their contractor SES, but NAE does not acknowledge that SES is presenting effective compression values which include the effects of a pressure differential between the inside and outside of the pipe and accounts for the weight of the drill string and buoyancy forces [see NAE 2011, page 50]. 101 DNV Report, “Supplement the Finite Element Analysis buckling model with a Computational Fluid Dynamic simulation of the flow through the drill pipe”: 8.
CSB-FINAL REPORT-BOP(06-02-2014) Page 26 of 83 U.S. Chemical Safety Board By Engineering Services, L.P.
Pipe buckling equations
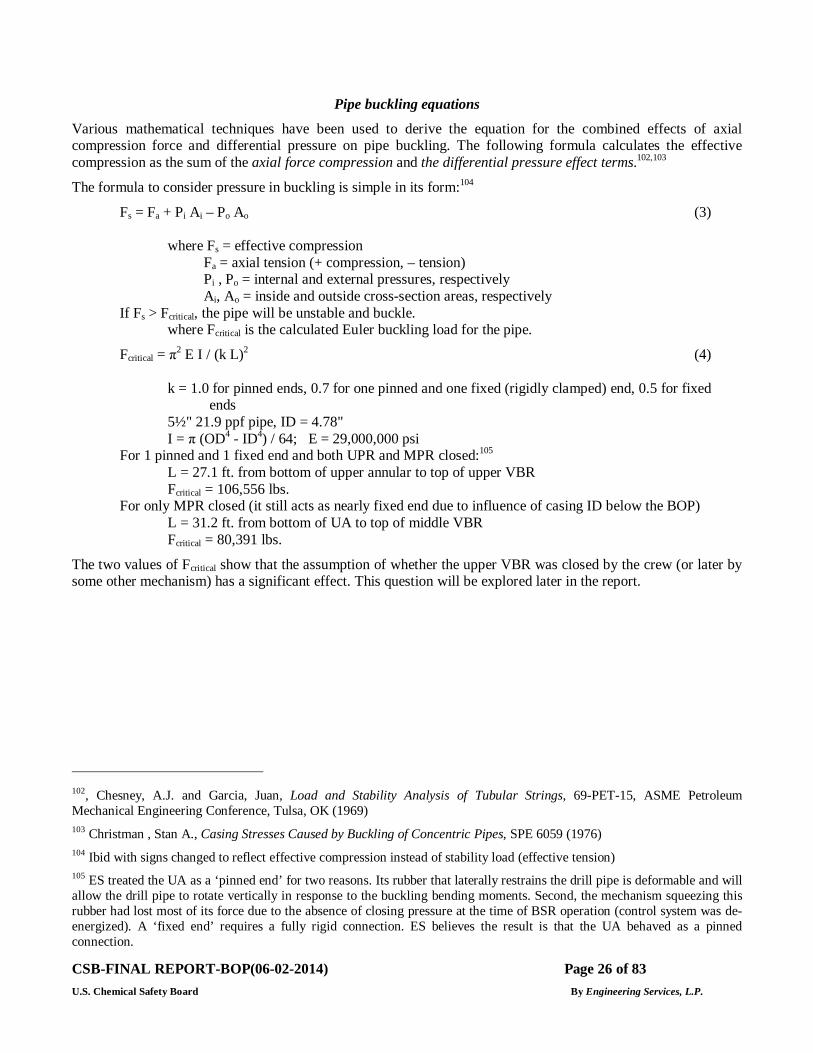
Various mathematical techniques have been used to derive the equation for the combined effects of axial compression force and differential pressure on pipe buckling. The following formula calculates the effective compression as the sum of the axial force compression and the differential pressure effect terms.102,103
The formula to consider pressure in buckling is simple in its form:104
Fs = Fa + Pi Ai – Po Ao (3)
where Fs = effective compression Fa = axial tension (+ compression, – tension) Pi , Po = internal and external pressures, respectively Ai, Ao = inside and outside cross-section areas, respectively
If Fs > Fcritical, the pipe will be unstable and buckle. where Fcritical is the calculated Euler buckling load for the pipe.
Fcritical = π2 E I / (k L)2 (4)
k = 1.0 for pinned ends, 0.7 for one pinned and one fixed (rigidly clamped) end, 0.5 for fixed ends
5½" 21.9 ppf pipe, ID = 4.78" I = π (OD4 - ID4) / 64; E = 29,000,000 psi
For 1 pinned and 1 fixed end and both UPR and MPR closed:105 L = 27.1 ft. from bottom of upper annular to top of upper VBR
Fcritical = 106,556 lbs. For only MPR closed (it still acts as nearly fixed end due to influence of casing ID below the BOP)
L = 31.2 ft. from bottom of UA to top of middle VBR Fcritical = 80,391 lbs.
The two values of Fcritical show that the assumption of whether the upper VBR was closed by the crew (or later by some other mechanism) has a significant effect. This question will be explored later in the report.
102, Chesney, A.J. and Garcia, Juan, Load and Stability Analysis of Tubular Strings, 69-PET-15, ASME Petroleum Mechanical Engineering Conference, Tulsa, OK (1969) 103 Christman , Stan A., Casing Stresses Caused by Buckling of Concentric Pipes, SPE 6059 (1976) 104 Ibid with signs changed to reflect effective compression instead of stability load (effective tension) 105 ES treated the UA as a ‘pinned end’ for two reasons. Its rubber that laterally restrains the drill pipe is deformable and will allow the drill pipe to rotate vertically in response to the buckling bending moments. Second, the mechanism squeezing this rubber had lost most of its force due to the absence of closing pressure at the time of BSR operation (control system was de-energized). A ‘fixed end’ requires a fully rigid connection. ES believes the result is that the UA behaved as a pinned connection.
CSB-FINAL REPORT-BOP(06-02-2014) Page 27 of 83 U.S. Chemical Safety Board By Engineering Services, L.P.
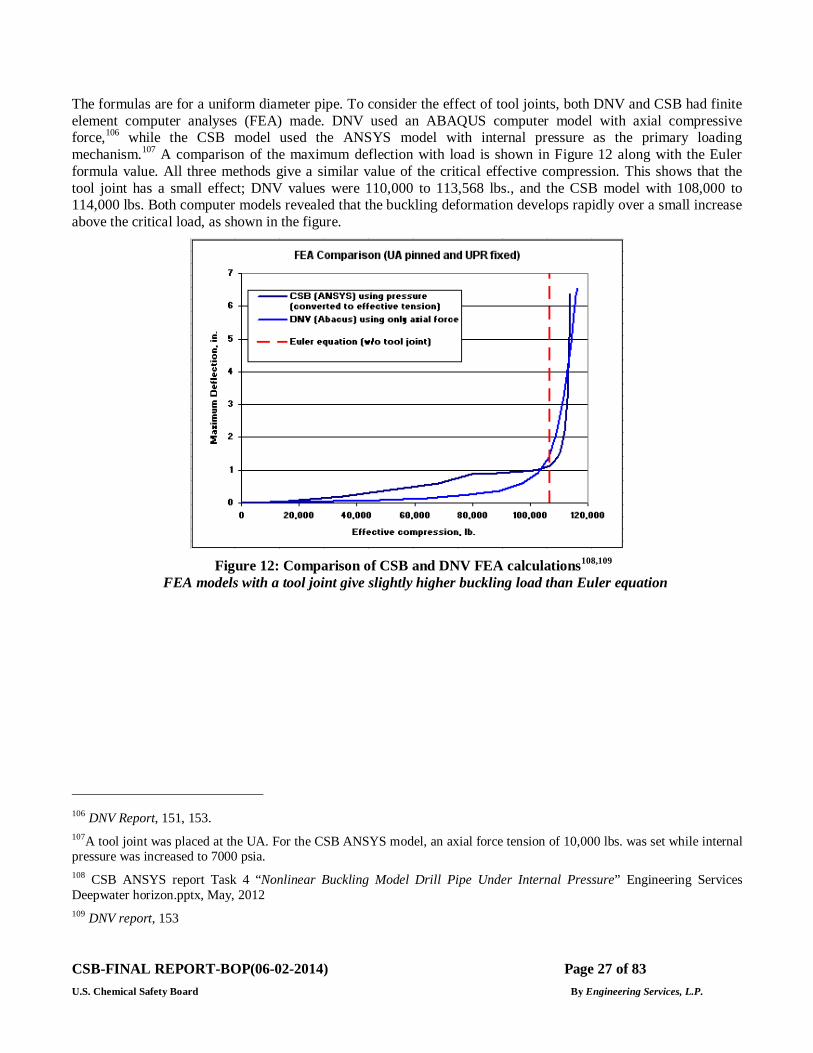
The formulas are for a uniform diameter pipe. To consider the effect of tool joints, both DNV and CSB had finite element computer analyses (FEA) made. DNV used an ABAQUS computer model with axial compressive force,106 while the CSB model used the ANSYS model with internal pressure as the primary loading mechanism.107 A comparison of the maximum deflection with load is shown in Figure 12 along with the Euler formula value. All three methods give a similar value of the critical effective compression. This shows that the tool joint has a small effect; DNV values were 110,000 to 113,568 lbs., and the CSB model with 108,000 to 114,000 lbs. Both computer models revealed that the buckling deformation develops rapidly over a small increase above the critical load, as shown in the figure.
Figure 12: Comparison of CSB and DNV FEA calculations108,109
FEA models with a tool joint give slightly higher buckling load than Euler equation
106 DNV Report, 151, 153. 107A tool joint was placed at the UA. For the CSB ANSYS model, an axial force tension of 10,000 lbs. was set while internal pressure was increased to 7000 psia. 108 CSB ANSYS report Task 4 “Nonlinear Buckling Model Drill Pipe Under Internal Pressure” Engineering Services Deepwater horizon.pptx, May, 2012 109 DNV report, 153
CSB-FINAL REPORT-BOP(06-02-2014) Page 28 of 83 U.S. Chemical Safety Board By Engineering Services, L.P.
Shape of the buckled drill pipe and implications on which VBRs were closed by the crew
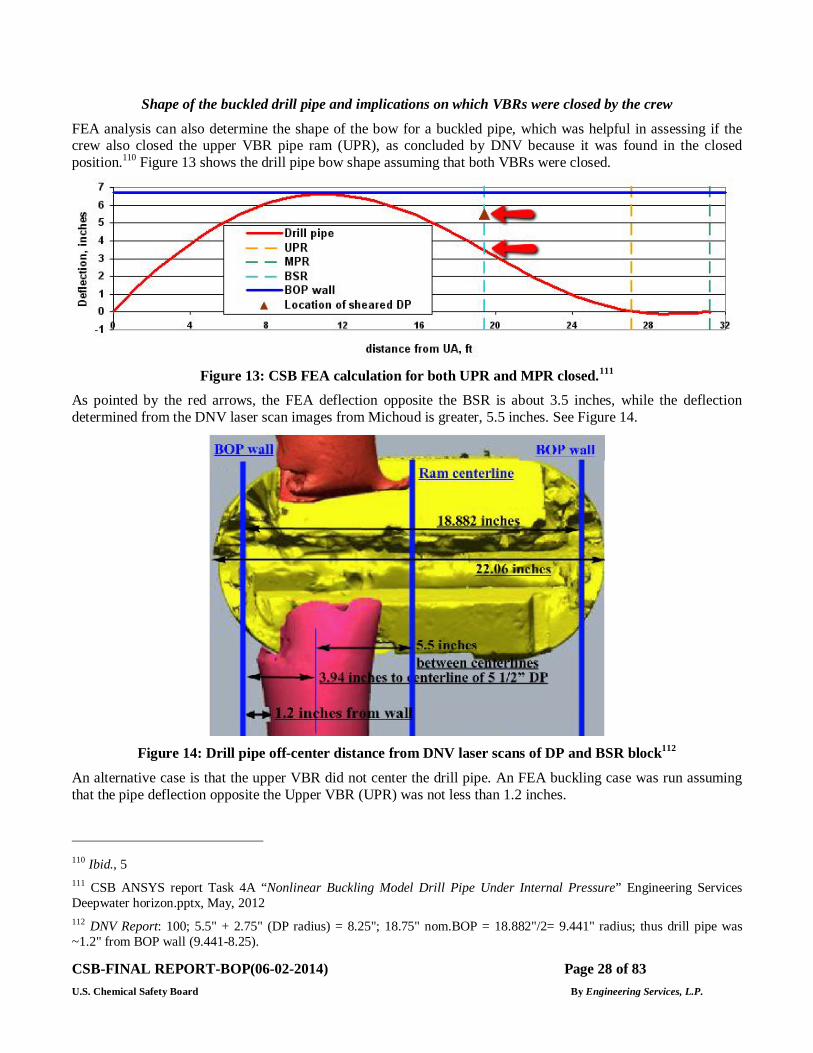
FEA analysis can also determine the shape of the bow for a buckled pipe, which was helpful in assessing if the crew also closed the upper VBR pipe ram (UPR), as concluded by DNV because it was found in the closed position.110 Figure 13 shows the drill pipe bow shape assuming that both VBRs were closed.
Figure 13: CSB FEA calculation for both UPR and MPR closed.111
As pointed by the red arrows, the FEA deflection opposite the BSR is about 3.5 inches, while the deflection determined from the DNV laser scan images from Michoud is greater, 5.5 inches. See Figure 14.
Figure 14: Drill pipe off-center distance from DNV laser scans of DP and BSR block112
An alternative case is that the upper VBR did not center the drill pipe. An FEA buckling case was run assuming that the pipe deflection opposite the Upper VBR (UPR) was not less than 1.2 inches.
110 Ibid., 5 111 CSB ANSYS report Task 4A “Nonlinear Buckling Model Drill Pipe Under Internal Pressure” Engineering Services Deepwater horizon.pptx, May, 2012 112 DNV Report: 100; 5.5" + 2.75" (DP radius) = 8.25"; 18.75" nom.BOP = 18.882"/2= 9.441" radius; thus drill pipe was ~1.2" from BOP wall (9.441-8.25).
CSB-FINAL REPORT-BOP(06-02-2014) Page 29 of 83 U.S. Chemical Safety Board By Engineering Services, L.P.
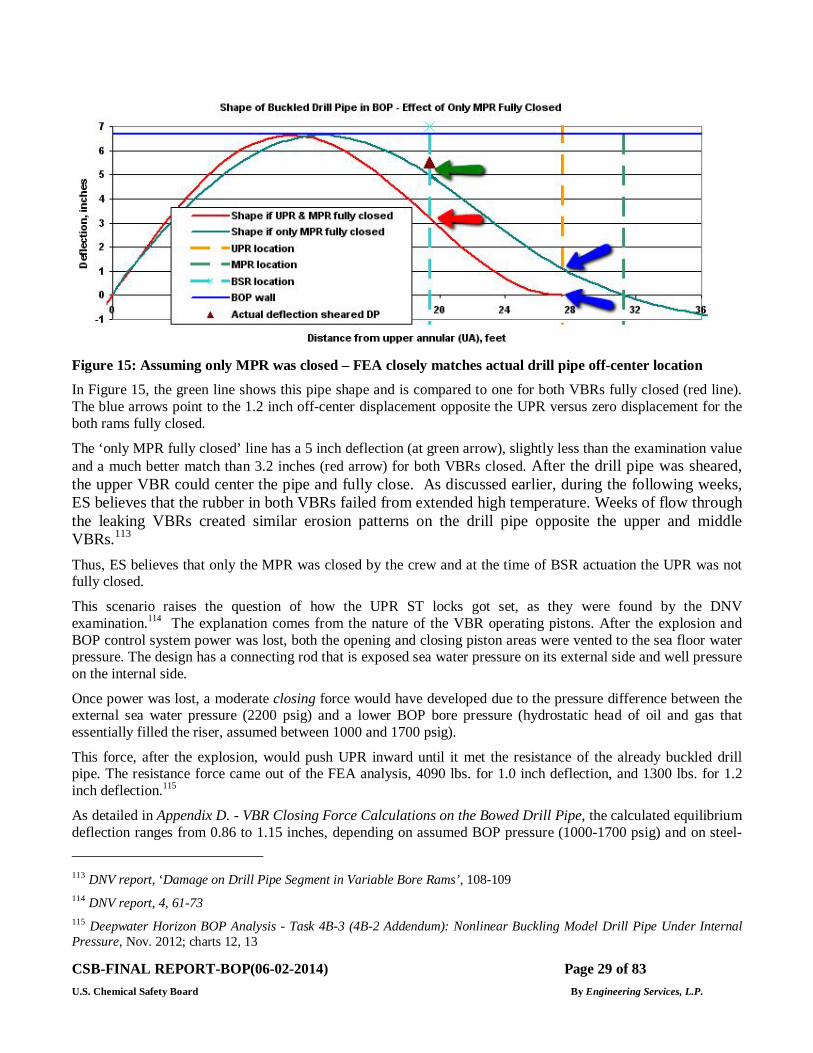
Figure 15: Assuming only MPR was closed – FEA closely matches actual drill pipe off-center location In Figure 15, the green line shows this pipe shape and is compared to one for both VBRs fully closed (red line). The blue arrows point to the 1.2 inch off-center displacement opposite the UPR versus zero displacement for the both rams fully closed.
The ‘only MPR fully closed’ line has a 5 inch deflection (at green arrow), slightly less than the examination value and a much better match than 3.2 inches (red arrow) for both VBRs closed. After the drill pipe was sheared, the upper VBR could center the pipe and fully close. As discussed earlier, during the following weeks, ES believes that the rubber in both VBRs failed from extended high temperature. Weeks of flow through the leaking VBRs created similar erosion patterns on the drill pipe opposite the upper and middle VBRs.113
Thus, ES believes that only the MPR was closed by the crew and at the time of BSR actuation the UPR was not fully closed.
This scenario raises the question of how the UPR ST locks got set, as they were found by the DNV examination.114 The explanation comes from the nature of the VBR operating pistons. After the explosion and BOP control system power was lost, both the opening and closing piston areas were vented to the sea floor water pressure. The design has a connecting rod that is exposed sea water pressure on its external side and well pressure on the internal side.
Once power was lost, a moderate closing force would have developed due to the pressure difference between the external sea water pressure (2200 psig) and a lower BOP bore pressure (hydrostatic head of oil and gas that essentially filled the riser, assumed between 1000 and 1700 psig).
This force, after the explosion, would push UPR inward until it met the resistance of the already buckled drill pipe. The resistance force came out of the FEA analysis, 4090 lbs. for 1.0 inch deflection, and 1300 lbs. for 1.2 inch deflection.115
As detailed in Appendix D. - VBR Closing Force Calculations on the Bowed Drill Pipe, the calculated equilibrium deflection ranges from 0.86 to 1.15 inches, depending on assumed BOP pressure (1000-1700 psig) and on steel- 113 DNV report, ‘Damage on Drill Pipe Segment in Variable Bore Rams’, 108-109 114 DNV report, 4, 61-73 115 Deepwater Horizon BOP Analysis - Task 4B-3 (4B-2 Addendum): Nonlinear Buckling Model Drill Pipe Under Internal Pressure, Nov. 2012; charts 12, 13
CSB-FINAL REPORT-BOP(06-02-2014) Page 30 of 83 U.S. Chemical Safety Board By Engineering Services, L.P.
on-steel friction factor (0.2-0.3) between the EAP fingers as they move past each other. The modeling assumed that the BOP packer rubber offered no resistance to EAP finger rotation; it must have to some degree, making the calculated deflection numbers somewhat low. However, the pipe could not have been deflected by more than 1.3 inches due to the design of the ram block, which inherently has a much higher centering force up to that value.
ES concludes that drill pipe was centered at the middle VBR (not the upper VBR) and at the upper annular.
Lower critical buckling load: An important consequence of this result is that the Macondo critical buckling load was less than it would have been with the both rams fully closed. From FEA analysis, the critical effective compression load was about 75,000 lbs., not 110,000 lbs.
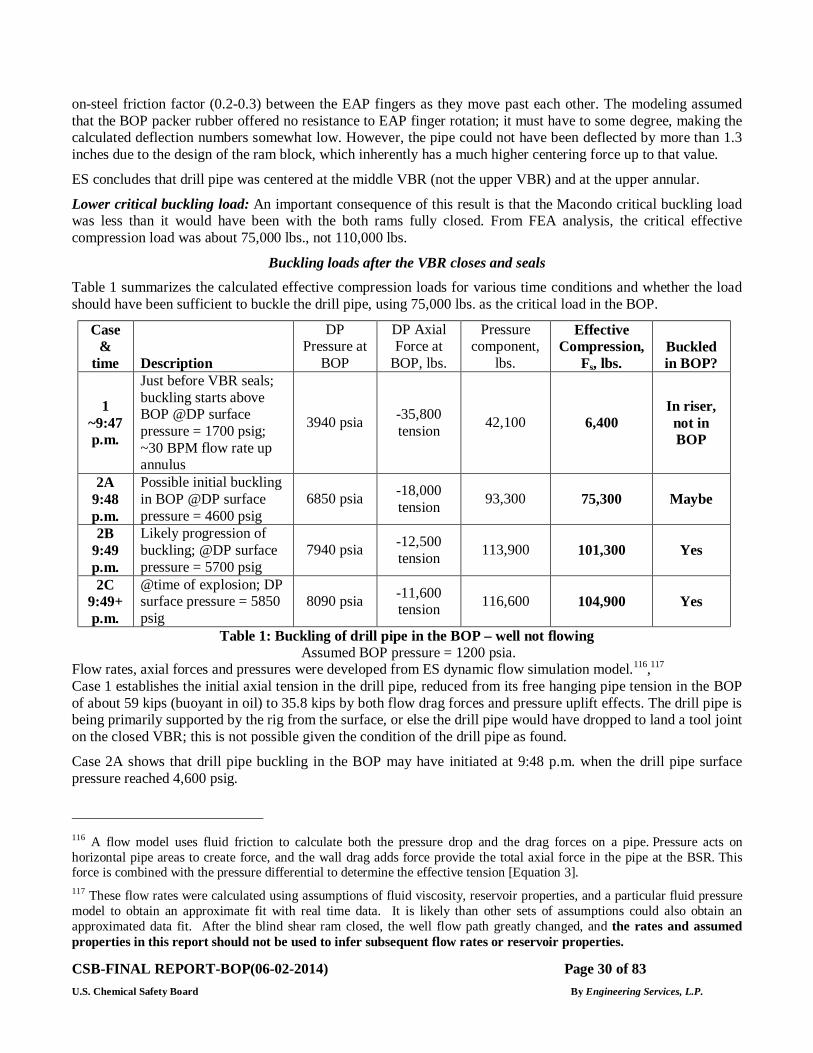
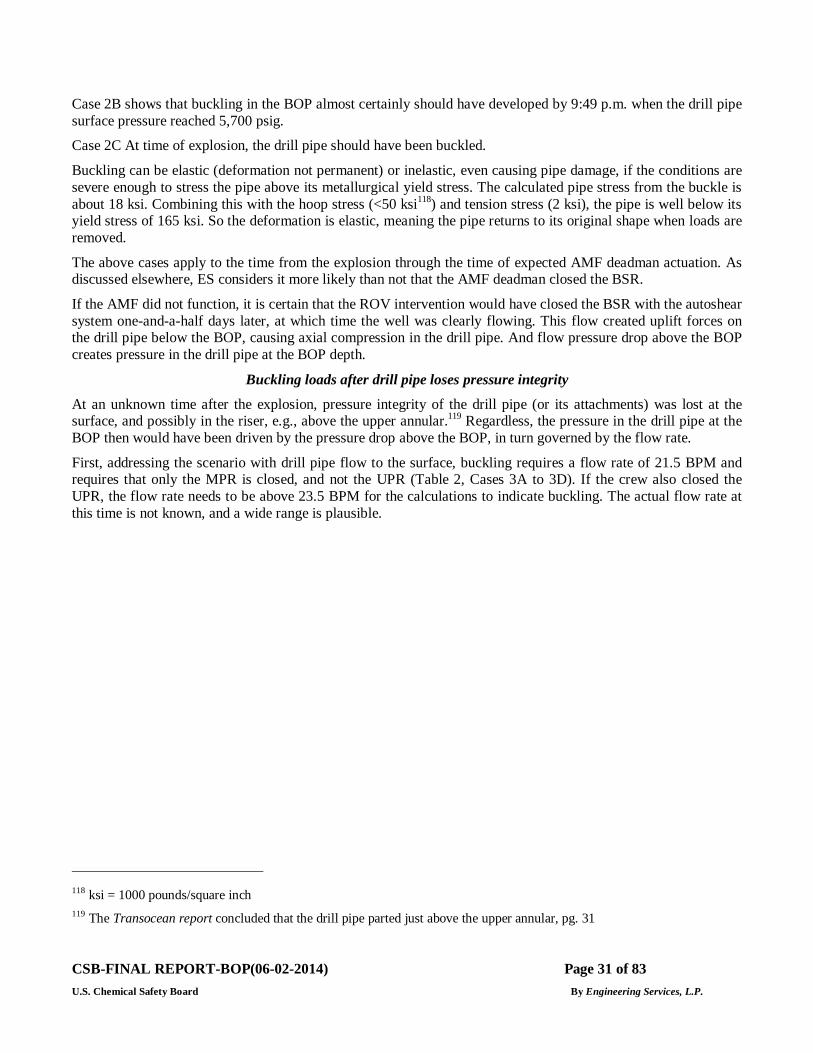
Buckling loads after the VBR closes and seals Table 1 summarizes the calculated effective compression loads for various time conditions and whether the load should have been sufficient to buckle the drill pipe, using 75,000 lbs. as the critical load in the BOP.
Case &
time Description
DP Pressure at
BOP
DP Axial Force at
BOP, lbs.
Pressure component,
lbs.
Effective Compression,
Fs, lbs. Buckled in BOP?
1 ~9:47 p.m.
Just before VBR seals; buckling starts above BOP @DP surface pressure = 1700 psig; ~30 BPM flow rate up annulus
3940 psia -35,800 tension 42,100 6,400
In riser, not in BOP
2A 9:48 p.m.
Possible initial buckling in BOP @DP surface pressure = 4600 psig
6850 psia -18,000 tension 93,300 75,300 Maybe
2B 9:49 p.m.
Likely progression of buckling; @DP surface pressure = 5700 psig
7940 psia -12,500 tension 113,900 101,300 Yes
2C 9:49+ p.m.
@time of explosion; DP surface pressure = 5850 psig
8090 psia -11,600 tension 116,600 104,900 Yes
Table 1: Buckling of drill pipe in the BOP – well not flowing Assumed BOP pressure = 1200 psia.
Flow rates, axial forces and pressures were developed from ES dynamic flow simulation model.116,117 Case 1 establishes the initial axial tension in the drill pipe, reduced from its free hanging pipe tension in the BOP of about 59 kips (buoyant in oil) to 35.8 kips by both flow drag forces and pressure uplift effects. The drill pipe is being primarily supported by the rig from the surface, or else the drill pipe would have dropped to land a tool joint on the closed VBR; this is not possible given the condition of the drill pipe as found.
Case 2A shows that drill pipe buckling in the BOP may have initiated at 9:48 p.m. when the drill pipe surface pressure reached 4,600 psig.
116 A flow model uses fluid friction to calculate both the pressure drop and the drag forces on a pipe. Pressure acts on horizontal pipe areas to create force, and the wall drag adds force provide the total axial force in the pipe at the BSR. This force is combined with the pressure differential to determine the effective tension [Equation 3]. 117 These flow rates were calculated using assumptions of fluid viscosity, reservoir properties, and a particular fluid pressure model to obtain an approximate fit with real time data. It is likely than other sets of assumptions could also obtain an approximated data fit. After the blind shear ram closed, the well flow path greatly changed, and the rates and assumed properties in this report should not be used to infer subsequent flow rates or reservoir properties.
CSB-FINAL REPORT-BOP(06-02-2014) Page 31 of 83 U.S. Chemical Safety Board By Engineering Services, L.P.
Case 2B shows that buckling in the BOP almost certainly should have developed by 9:49 p.m. when the drill pipe surface pressure reached 5,700 psig.
Case 2C At time of explosion, the drill pipe should have been buckled.
Buckling can be elastic (deformation not permanent) or inelastic, even causing pipe damage, if the conditions are severe enough to stress the pipe above its metallurgical yield stress. The calculated pipe stress from the buckle is about 18 ksi. Combining this with the hoop stress (<50 ksi118) and tension stress (2 ksi), the pipe is well below its yield stress of 165 ksi. So the deformation is elastic, meaning the pipe returns to its original shape when loads are removed.
The above cases apply to the time from the explosion through the time of expected AMF deadman actuation. As discussed elsewhere, ES considers it more likely than not that the AMF deadman closed the BSR.
If the AMF did not function, it is certain that the ROV intervention would have closed the BSR with the autoshear system one-and-a-half days later, at which time the well was clearly flowing. This flow created uplift forces on the drill pipe below the BOP, causing axial compression in the drill pipe. And flow pressure drop above the BOP creates pressure in the drill pipe at the BOP depth.
Buckling loads after drill pipe loses pressure integrity
At an unknown time after the explosion, pressure integrity of the drill pipe (or its attachments) was lost at the surface, and possibly in the riser, e.g., above the upper annular.119 Regardless, the pressure in the drill pipe at the BOP then would have been driven by the pressure drop above the BOP, in turn governed by the flow rate.
First, addressing the scenario with drill pipe flow to the surface, buckling requires a flow rate of 21.5 BPM and requires that only the MPR is closed, and not the UPR (Table 2, Cases 3A to 3D). If the crew also closed the UPR, the flow rate needs to be above 23.5 BPM for the calculations to indicate buckling. The actual flow rate at this time is not known, and a wide range is plausible.
118 ksi = 1000 pounds/square inch 119 The Transocean report concluded that the drill pipe parted just above the upper annular, pg. 31
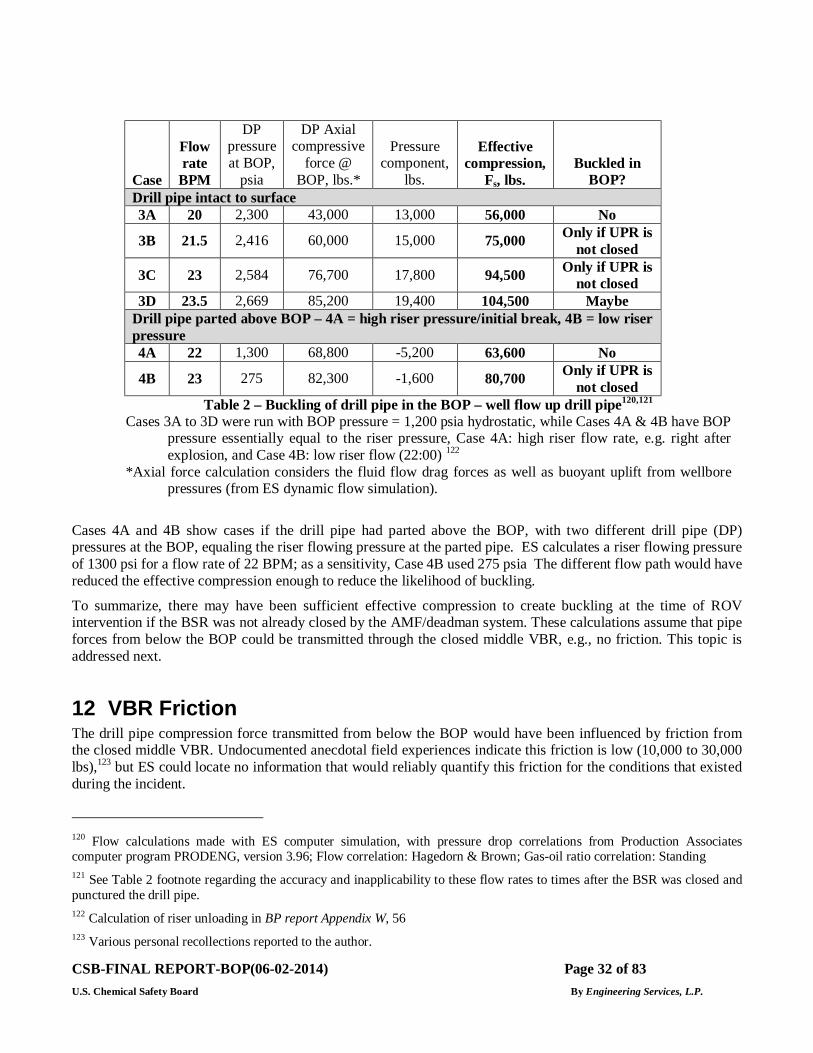
CSB-FINAL REPORT-BOP(06-02-2014) Page 32 of 83 U.S. Chemical Safety Board By Engineering Services, L.P.
Case
Flow rate
BPM
DP pressure at BOP,
psia
DP Axial compressive
force @ BOP, lbs.*
Pressure component,
lbs.
Effective compression,
Fs, lbs. Buckled in
BOP? Drill pipe intact to surface 3A 20 2,300 43,000 13,000 56,000 No
3B 21.5 2,416 60,000 15,000 75,000 Only if UPR is not closed
3C 23 2,584 76,700 17,800 94,500 Only if UPR is not closed
3D 23.5 2,669 85,200 19,400 104,500 Maybe Drill pipe parted above BOP – 4A = high riser pressure/initial break, 4B = low riser pressure 4A 22 1,300 68,800 -5,200 63,600 No
4B 23 275 82,300 -1,600 80,700 Only if UPR is not closed
Table 2 – Buckling of drill pipe in the BOP – well flow up drill pipe120,121 Cases 3A to 3D were run with BOP pressure = 1,200 psia hydrostatic, while Cases 4A & 4B have BOP
pressure essentially equal to the riser pressure, Case 4A: high riser flow rate, e.g. right after explosion, and Case 4B: low riser flow (22:00) 122
*Axial force calculation considers the fluid flow drag forces as well as buoyant uplift from wellbore pressures (from ES dynamic flow simulation).
Cases 4A and 4B show cases if the drill pipe had parted above the BOP, with two different drill pipe (DP) pressures at the BOP, equaling the riser flowing pressure at the parted pipe. ES calculates a riser flowing pressure of 1300 psi for a flow rate of 22 BPM; as a sensitivity, Case 4B used 275 psia The different flow path would have reduced the effective compression enough to reduce the likelihood of buckling.
To summarize, there may have been sufficient effective compression to create buckling at the time of ROV intervention if the BSR was not already closed by the AMF/deadman system. These calculations assume that pipe forces from below the BOP could be transmitted through the closed middle VBR, e.g., no friction. This topic is addressed next.
12 VBR Friction The drill pipe compression force transmitted from below the BOP would have been influenced by friction from the closed middle VBR. Undocumented anecdotal field experiences indicate this friction is low (10,000 to 30,000 lbs),123 but ES could locate no information that would reliably quantify this friction for the conditions that existed during the incident.
120 Flow calculations made with ES computer simulation, with pressure drop correlations from Production Associates computer program PRODENG, version 3.96; Flow correlation: Hagedorn & Brown; Gas-oil ratio correlation: Standing 121 See Table 2 footnote regarding the accuracy and inapplicability to these flow rates to times after the BSR was closed and punctured the drill pipe. 122 Calculation of riser unloading in BP report Appendix W, 56 123 Various personal recollections reported to the author.
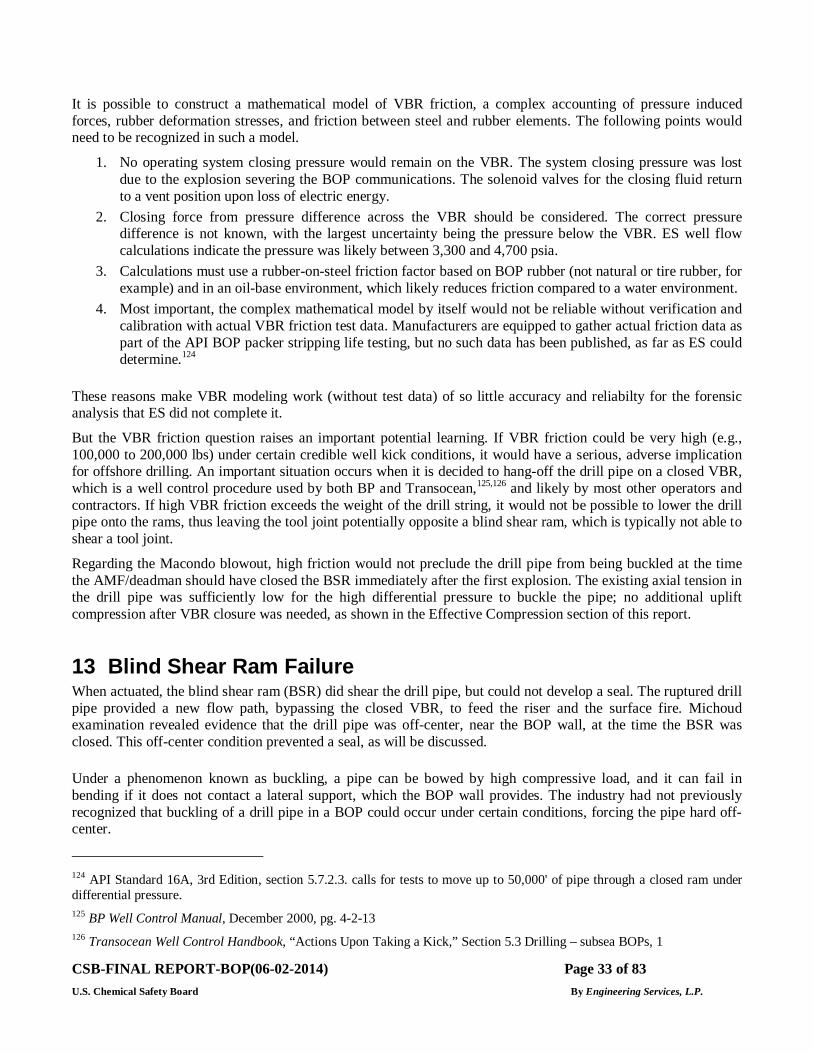
CSB-FINAL REPORT-BOP(06-02-2014) Page 33 of 83 U.S. Chemical Safety Board By Engineering Services, L.P.
It is possible to construct a mathematical model of VBR friction, a complex accounting of pressure induced forces, rubber deformation stresses, and friction between steel and rubber elements. The following points would need to be recognized in such a model.
1. No operating system closing pressure would remain on the VBR. The system closing pressure was lost due to the explosion severing the BOP communications. The solenoid valves for the closing fluid return to a vent position upon loss of electric energy.
2. Closing force from pressure difference across the VBR should be considered. The correct pressure difference is not known, with the largest uncertainty being the pressure below the VBR. ES well flow calculations indicate the pressure was likely between 3,300 and 4,700 psia.
3. Calculations must use a rubber-on-steel friction factor based on BOP rubber (not natural or tire rubber, for example) and in an oil-base environment, which likely reduces friction compared to a water environment.
4. Most important, the complex mathematical model by itself would not be reliable without verification and calibration with actual VBR friction test data. Manufacturers are equipped to gather actual friction data as part of the API BOP packer stripping life testing, but no such data has been published, as far as ES could determine.124
These reasons make VBR modeling work (without test data) of so little accuracy and reliabilty for the forensic analysis that ES did not complete it.
But the VBR friction question raises an important potential learning. If VBR friction could be very high (e.g., 100,000 to 200,000 lbs) under certain credible well kick conditions, it would have a serious, adverse implication for offshore drilling. An important situation occurs when it is decided to hang-off the drill pipe on a closed VBR, which is a well control procedure used by both BP and Transocean,125,126 and likely by most other operators and contractors. If high VBR friction exceeds the weight of the drill string, it would not be possible to lower the drill pipe onto the rams, thus leaving the tool joint potentially opposite a blind shear ram, which is typically not able to shear a tool joint.
Regarding the Macondo blowout, high friction would not preclude the drill pipe from being buckled at the time the AMF/deadman should have closed the BSR immediately after the first explosion. The existing axial tension in the drill pipe was sufficiently low for the high differential pressure to buckle the pipe; no additional uplift compression after VBR closure was needed, as shown in the Effective Compression section of this report.
13 Blind Shear Ram Failure When actuated, the blind shear ram (BSR) did shear the drill pipe, but could not develop a seal. The ruptured drill pipe provided a new flow path, bypassing the closed VBR, to feed the riser and the surface fire. Michoud examination revealed evidence that the drill pipe was off-center, near the BOP wall, at the time the BSR was closed. This off-center condition prevented a seal, as will be discussed.
Under a phenomenon known as buckling, a pipe can be bowed by high compressive load, and it can fail in bending if it does not contact a lateral support, which the BOP wall provides. The industry had not previously recognized that buckling of a drill pipe in a BOP could occur under certain conditions, forcing the pipe hard off-center.
124 API Standard 16A, 3rd Edition, section 5.7.2.3. calls for tests to move up to 50,000' of pipe through a closed ram under differential pressure. 125 BP Well Control Manual, December 2000, pg. 4-2-13 126 Transocean Well Control Handbook, “Actions Upon Taking a Kick,” Section 5.3 Drilling – subsea BOPs, 1
CSB-FINAL REPORT-BOP(06-02-2014) Page 34 of 83 U.S. Chemical Safety Board By Engineering Services, L.P.
At Macondo, upward forces were developed from below by pressure and flow forces, with a restraint being provided by the tool joint that was up against the closed upper annular.127 These compressive forces, by themselves, were not sufficient to buckle the pipe, based on ES calculation of Macondo pressure and flow at the times of possible BSR actuations.
Alternatively, buckling can be caused by weight of drill pipe from above. At Macondo, this may have occurred after the rig support was lost, e.g., by parting of the drill pipe at the surface. This from-above scenario assumes that the AMF/deadman did not already shear the pipe and that the closed VBR(s) could have applied sufficient pipe friction to support the resulting weight.
In addition, it is a known physical principle that internal pressure can create and augment the compressive load,128 and this is an important factor in this incident. It is now clear how buckling can happen during a well control operation.
This report considers both the “from below” and “from above” scenarios and includes the pressure effect on buckling.
Model of shear ram packer: The Cameron BSR has a design feature (Figure 16 shows a V-shape in one of the blades) that tends to center pipe, but it could not handle the high lateral force that buckling created.
Figure 16: Drill pipe off-center in blind shear ram with V-shape blade129
Cameron had not ever tested shearing an off-center pipe.130 API BOP standards are silent on the topic of an off-center pipe and do not provide a design standard, a testing protocol, nor service condition recommendations.131
127 DNV Report, 4 128 See footnote 98 129 Ibid, 15. 130 Cameron testimony by David McWhorter at JIT hearing, New Orleans, April 8, 2011. 131 API Specification 16A Drill Through Equipment, 3rd Edition (2004); API RP 53, Blowout Prevention Equipment Systems for Drilling Wells, 3rd Edition (1997), 4th Edition (2012); API RP 59 Well Control Operations, 2nd Edition (2006).
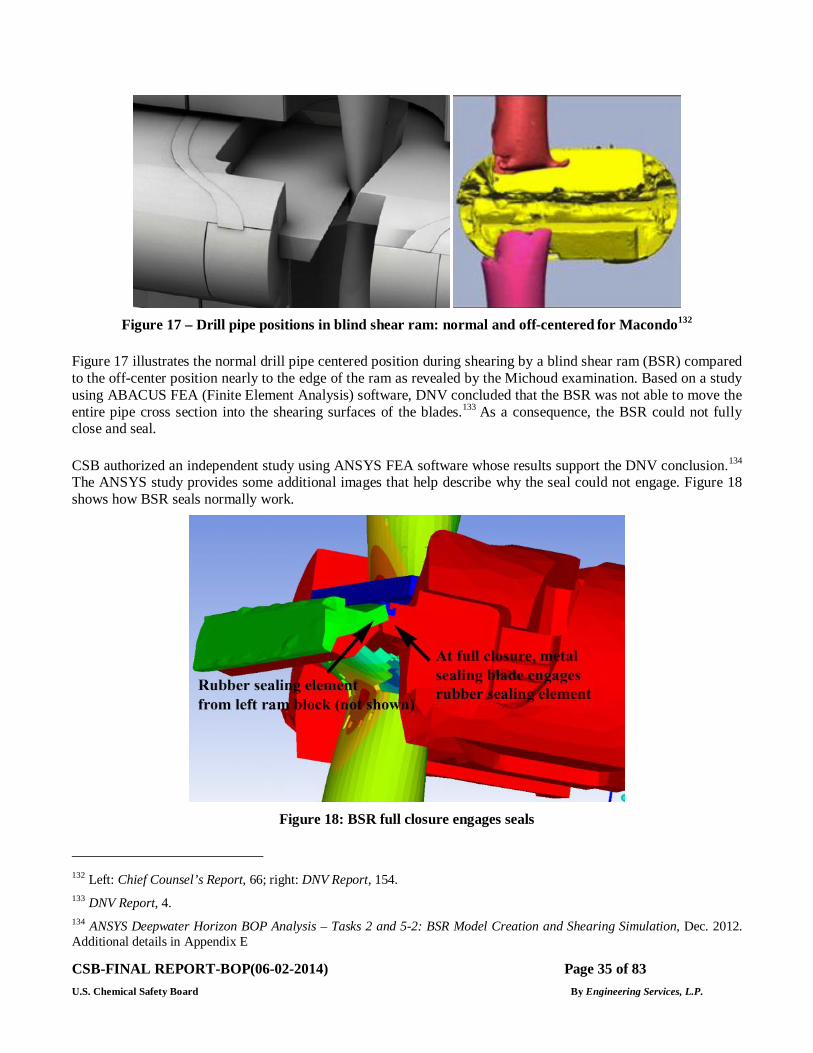
CSB-FINAL REPORT-BOP(06-02-2014) Page 35 of 83 U.S. Chemical Safety Board By Engineering Services, L.P.
Figure 17 – Drill pipe positions in blind shear ram: normal and off-centered for Macondo132
Figure 17 illustrates the normal drill pipe centered position during shearing by a blind shear ram (BSR) compared to the off-center position nearly to the edge of the ram as revealed by the Michoud examination. Based on a study using ABACUS FEA (Finite Element Analysis) software, DNV concluded that the BSR was not able to move the entire pipe cross section into the shearing surfaces of the blades.133 As a consequence, the BSR could not fully close and seal.
CSB authorized an independent study using ANSYS FEA software whose results support the DNV conclusion.134 The ANSYS study provides some additional images that help describe why the seal could not engage. Figure 18 shows how BSR seals normally work.
Figure 18: BSR full closure engages seals
132 Left: Chief Counsel’s Report, 66; right: DNV Report, 154. 133 DNV Report, 4. 134 ANSYS Deepwater Horizon BOP Analysis – Tasks 2 and 5-2: BSR Model Creation and Shearing Simulation, Dec. 2012. Additional details in Appendix E
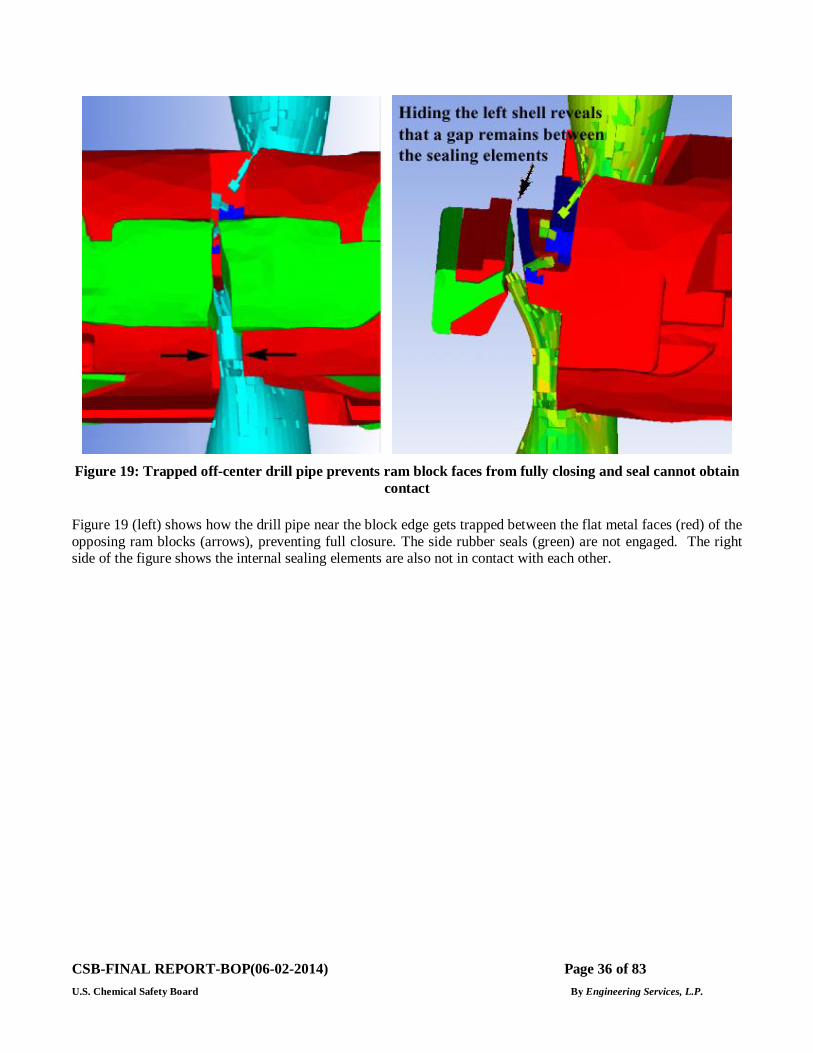
CSB-FINAL REPORT-BOP(06-02-2014) Page 36 of 83 U.S. Chemical Safety Board By Engineering Services, L.P.
Figure 19: Trapped off-center drill pipe prevents ram block faces from fully closing and seal cannot obtain
contact
Figure 19 (left) shows how the drill pipe near the block edge gets trapped between the flat metal faces (red) of the opposing ram blocks (arrows), preventing full closure. The side rubber seals (green) are not engaged. The right side of the figure shows the internal sealing elements are also not in contact with each other.
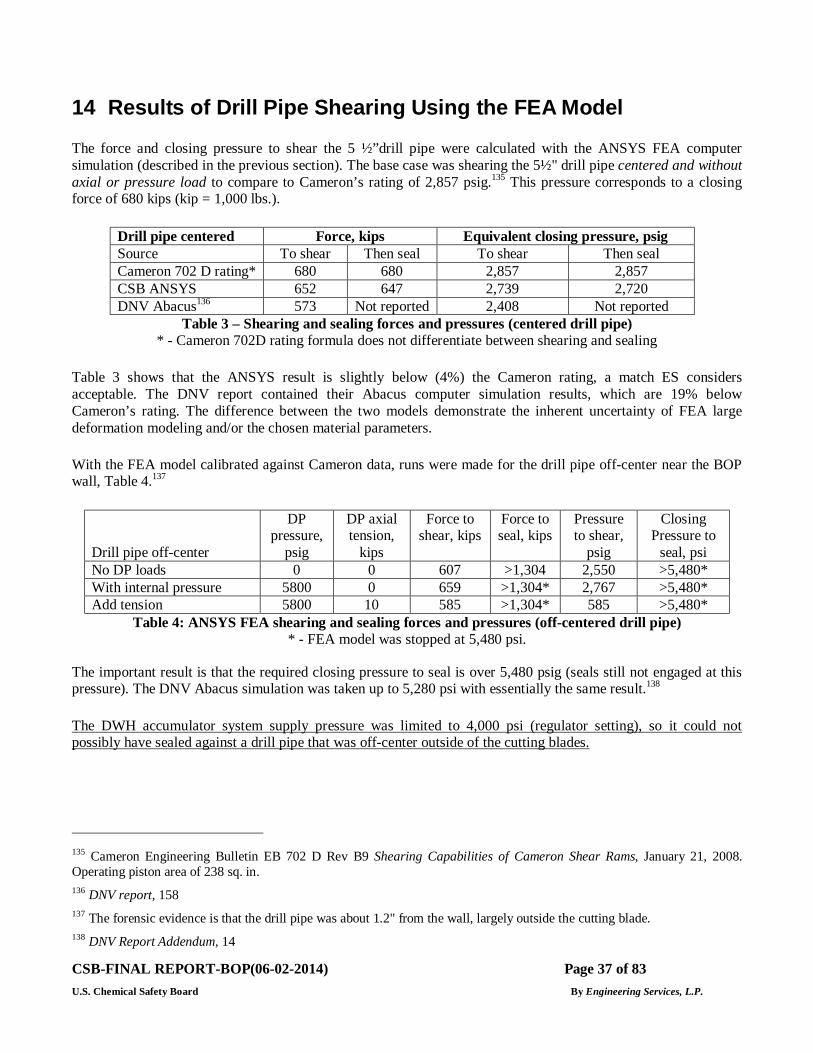
CSB-FINAL REPORT-BOP(06-02-2014) Page 37 of 83 U.S. Chemical Safety Board By Engineering Services, L.P.
14 Results of Drill Pipe Shearing Using the FEA Model
The force and closing pressure to shear the 5 ½”drill pipe were calculated with the ANSYS FEA computer simulation (described in the previous section). The base case was shearing the 5½" drill pipe centered and without axial or pressure load to compare to Cameron’s rating of 2,857 psig.135 This pressure corresponds to a closing force of 680 kips (kip = 1,000 lbs.).
Drill pipe centered Force, kips Equivalent closing pressure, psig Source To shear Then seal To shear Then seal Cameron 702 D rating* 680 680 2,857 2,857 CSB ANSYS 652 647 2,739 2,720 DNV Abacus136 573 Not reported 2,408 Not reported
Table 3 – Shearing and sealing forces and pressures (centered drill pipe) * - Cameron 702D rating formula does not differentiate between shearing and sealing
Table 3 shows that the ANSYS result is slightly below (4%) the Cameron rating, a match ES considers acceptable. The DNV report contained their Abacus computer simulation results, which are 19% below Cameron’s rating. The difference between the two models demonstrate the inherent uncertainty of FEA large deformation modeling and/or the chosen material parameters.
With the FEA model calibrated against Cameron data, runs were made for the drill pipe off-center near the BOP wall, Table 4.137
Drill pipe off-center
DP pressure,
psig
DP axial tension,
kips
Force to shear, kips
Force to seal, kips
Pressure to shear,
psig
Closing Pressure to
seal, psi No DP loads 0 0 607 >1,304 2,550 >5,480* With internal pressure 5800 0 659 >1,304* 2,767 >5,480* Add tension 5800 10 585 >1,304* 585 >5,480*
Table 4: ANSYS FEA shearing and sealing forces and pressures (off-centered drill pipe) * - FEA model was stopped at 5,480 psi.
The important result is that the required closing pressure to seal is over 5,480 psig (seals still not engaged at this pressure). The DNV Abacus simulation was taken up to 5,280 psi with essentially the same result.138
The DWH accumulator system supply pressure was limited to 4,000 psi (regulator setting), so it could not possibly have sealed against a drill pipe that was off-center outside of the cutting blades.
135 Cameron Engineering Bulletin EB 702 D Rev B9 Shearing Capabilities of Cameron Shear Rams, January 21, 2008. Operating piston area of 238 sq. in. 136 DNV report, 158 137 The forensic evidence is that the drill pipe was about 1.2" from the wall, largely outside the cutting blade. 138 DNV Report Addendum, 14
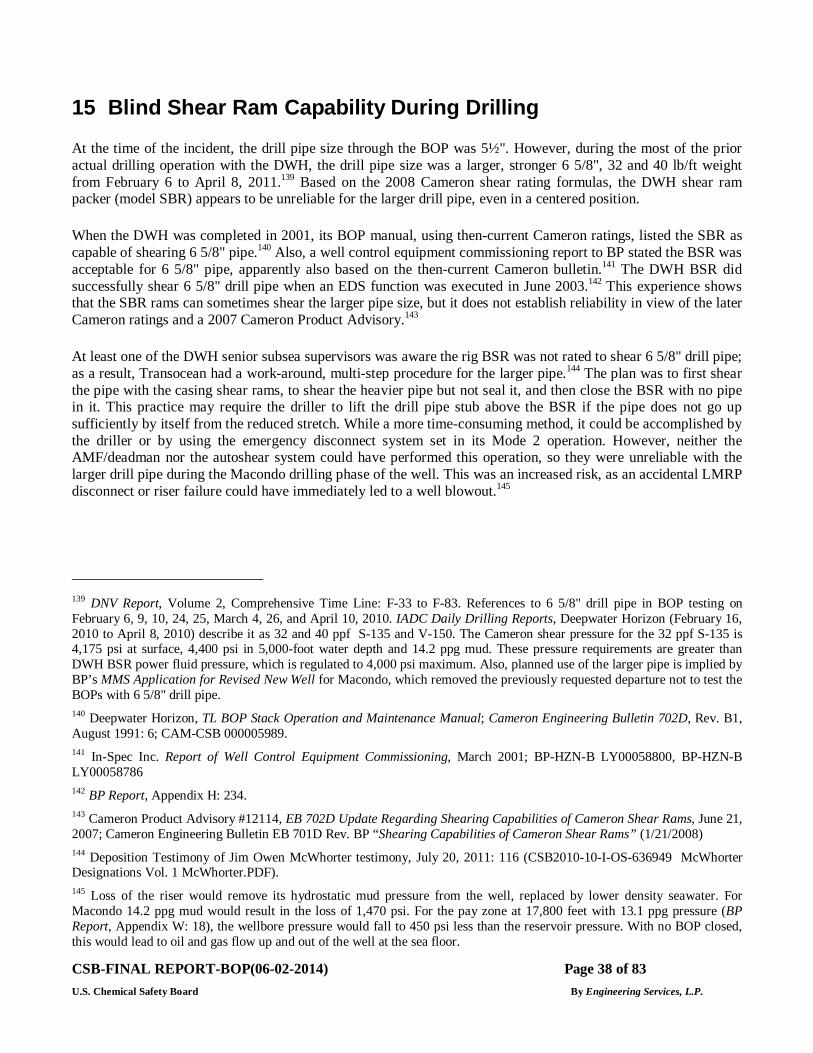
CSB-FINAL REPORT-BOP(06-02-2014) Page 38 of 83 U.S. Chemical Safety Board By Engineering Services, L.P.
15 Blind Shear Ram Capability During Drilling
At the time of the incident, the drill pipe size through the BOP was 5½". However, during the most of the prior actual drilling operation with the DWH, the drill pipe size was a larger, stronger 6 5/8", 32 and 40 lb/ft weight from February 6 to April 8, 2011.139 Based on the 2008 Cameron shear rating formulas, the DWH shear ram packer (model SBR) appears to be unreliable for the larger drill pipe, even in a centered position.
When the DWH was completed in 2001, its BOP manual, using then-current Cameron ratings, listed the SBR as capable of shearing 6 5/8" pipe.140 Also, a well control equipment commissioning report to BP stated the BSR was acceptable for 6 5/8" pipe, apparently also based on the then-current Cameron bulletin.141 The DWH BSR did successfully shear 6 5/8" drill pipe when an EDS function was executed in June 2003.142 This experience shows that the SBR rams can sometimes shear the larger pipe size, but it does not establish reliability in view of the later Cameron ratings and a 2007 Cameron Product Advisory.143
At least one of the DWH senior subsea supervisors was aware the rig BSR was not rated to shear 6 5/8" drill pipe; as a result, Transocean had a work-around, multi-step procedure for the larger pipe.144 The plan was to first shear the pipe with the casing shear rams, to shear the heavier pipe but not seal it, and then close the BSR with no pipe in it. This practice may require the driller to lift the drill pipe stub above the BSR if the pipe does not go up sufficiently by itself from the reduced stretch. While a more time-consuming method, it could be accomplished by the driller or by using the emergency disconnect system set in its Mode 2 operation. However, neither the AMF/deadman nor the autoshear system could have performed this operation, so they were unreliable with the larger drill pipe during the Macondo drilling phase of the well. This was an increased risk, as an accidental LMRP disconnect or riser failure could have immediately led to a well blowout.145
139 DNV Report, Volume 2, Comprehensive Time Line: F-33 to F-83. References to 6 5/8" drill pipe in BOP testing on February 6, 9, 10, 24, 25, March 4, 26, and April 10, 2010. IADC Daily Drilling Reports, Deepwater Horizon (February 16, 2010 to April 8, 2010) describe it as 32 and 40 ppf S-135 and V-150. The Cameron shear pressure for the 32 ppf S-135 is 4,175 psi at surface, 4,400 psi in 5,000-foot water depth and 14.2 ppg mud. These pressure requirements are greater than DWH BSR power fluid pressure, which is regulated to 4,000 psi maximum. Also, planned use of the larger pipe is implied by BP’s MMS Application for Revised New Well for Macondo, which removed the previously requested departure not to test the BOPs with 6 5/8" drill pipe. 140 Deepwater Horizon, TL BOP Stack Operation and Maintenance Manual; Cameron Engineering Bulletin 702D, Rev. B1, August 1991: 6; CAM-CSB 000005989. 141 In-Spec Inc. Report of Well Control Equipment Commissioning, March 2001; BP-HZN-B LY00058800, BP-HZN-B LY00058786 142 BP Report, Appendix H: 234. 143 Cameron Product Advisory #12114, EB 702D Update Regarding Shearing Capabilities of Cameron Shear Rams, June 21, 2007; Cameron Engineering Bulletin EB 701D Rev. BP “Shearing Capabilities of Cameron Shear Rams” (1/21/2008) 144 Deposition Testimony of Jim Owen McWhorter testimony, July 20, 2011: 116 (CSB2010-10-I-OS-636949 McWhorter Designations Vol. 1 McWhorter.PDF). 145 Loss of the riser would remove its hydrostatic mud pressure from the well, replaced by lower density seawater. For Macondo 14.2 ppg mud would result in the loss of 1,470 psi. For the pay zone at 17,800 feet with 13.1 ppg pressure (BP Report, Appendix W: 18), the wellbore pressure would fall to 450 psi less than the reservoir pressure. With no BOP closed, this would lead to oil and gas flow up and out of the well at the sea floor.
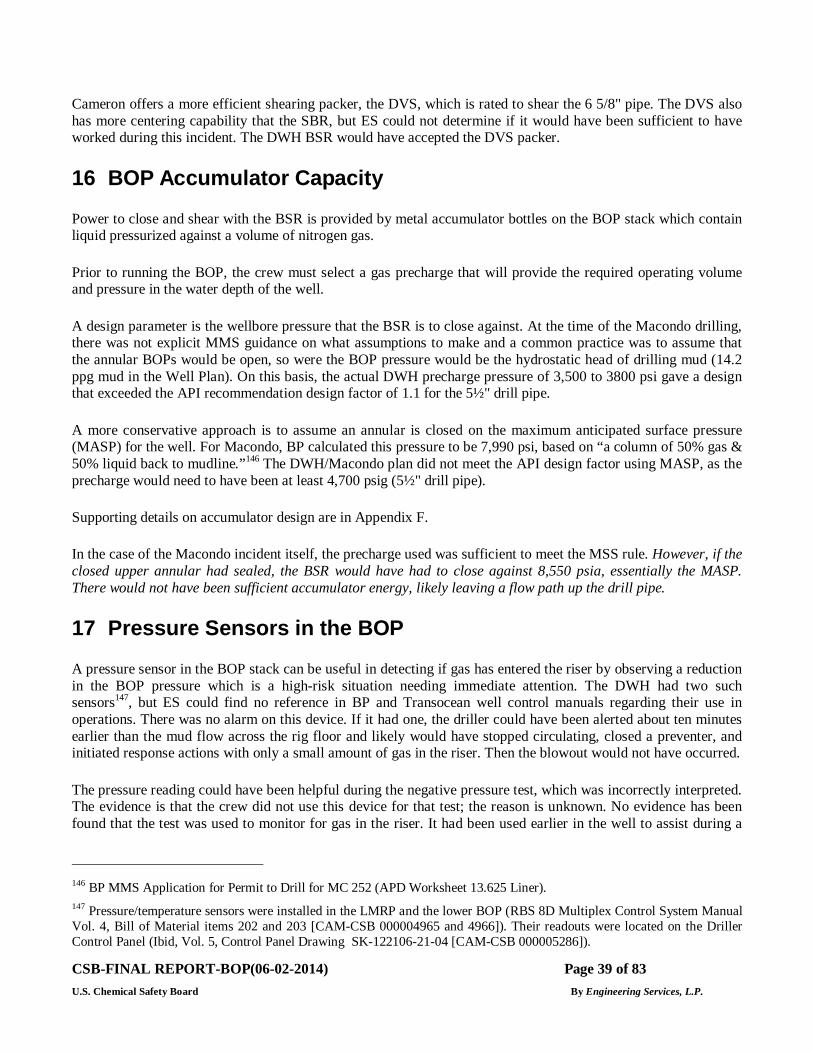
CSB-FINAL REPORT-BOP(06-02-2014) Page 39 of 83 U.S. Chemical Safety Board By Engineering Services, L.P.
Cameron offers a more efficient shearing packer, the DVS, which is rated to shear the 6 5/8" pipe. The DVS also has more centering capability that the SBR, but ES could not determine if it would have been sufficient to have worked during this incident. The DWH BSR would have accepted the DVS packer.
16 BOP Accumulator Capacity
Power to close and shear with the BSR is provided by metal accumulator bottles on the BOP stack which contain liquid pressurized against a volume of nitrogen gas.
Prior to running the BOP, the crew must select a gas precharge that will provide the required operating volume and pressure in the water depth of the well.
A design parameter is the wellbore pressure that the BSR is to close against. At the time of the Macondo drilling, there was not explicit MMS guidance on what assumptions to make and a common practice was to assume that the annular BOPs would be open, so were the BOP pressure would be the hydrostatic head of drilling mud (14.2 ppg mud in the Well Plan). On this basis, the actual DWH precharge pressure of 3,500 to 3800 psi gave a design that exceeded the API recommendation design factor of 1.1 for the 5½" drill pipe.
A more conservative approach is to assume an annular is closed on the maximum anticipated surface pressure (MASP) for the well. For Macondo, BP calculated this pressure to be 7,990 psi, based on “a column of 50% gas & 50% liquid back to mudline.”146 The DWH/Macondo plan did not meet the API design factor using MASP, as the precharge would need to have been at least 4,700 psig (5½" drill pipe).
Supporting details on accumulator design are in Appendix F.
In the case of the Macondo incident itself, the precharge used was sufficient to meet the MSS rule. However, if the closed upper annular had sealed, the BSR would have had to close against 8,550 psia, essentially the MASP. There would not have been sufficient accumulator energy, likely leaving a flow path up the drill pipe.
17 Pressure Sensors in the BOP
A pressure sensor in the BOP stack can be useful in detecting if gas has entered the riser by observing a reduction in the BOP pressure which is a high-risk situation needing immediate attention. The DWH had two such sensors147, but ES could find no reference in BP and Transocean well control manuals regarding their use in operations. There was no alarm on this device. If it had one, the driller could have been alerted about ten minutes earlier than the mud flow across the rig floor and likely would have stopped circulating, closed a preventer, and initiated response actions with only a small amount of gas in the riser. Then the blowout would not have occurred.
The pressure reading could have been helpful during the negative pressure test, which was incorrectly interpreted. The evidence is that the crew did not use this device for that test; the reason is unknown. No evidence has been found that the test was used to monitor for gas in the riser. It had been used earlier in the well to assist during a
146 BP MMS Application for Permit to Drill for MC 252 (APD Worksheet 13.625 Liner). 147 Pressure/temperature sensors were installed in the LMRP and the lower BOP (RBS 8D Multiplex Control System Manual Vol. 4, Bill of Material items 202 and 203 [CAM-CSB 000004965 and 4966]). Their readouts were located on the Driller Control Panel (Ibid, Vol. 5, Control Panel Drawing SK-122106-21-04 [CAM-CSB 000005286]).
CSB-FINAL REPORT-BOP(06-02-2014) Page 40 of 83 U.S. Chemical Safety Board By Engineering Services, L.P.
well control operation;148 the reported data suggest an accuracy of only +/- 400 psi, but their precision (sensitivity to change in pressure) appeared to be +/- 10 psi.
Also, the pressure data has potential value in detecting gas in the drilling riser (by pressure falling). An improvement might be the development and installation of an alarm.
18 Conclusions/Lessons to be Learned to Avoid Similar Incidents
Upper Annular Failure
1. If the upper annular had sealed, considerably less gas and oil would have entered the riser. This smaller volume should have had a lower likelihood of (or delayed) explosion, and the explosion could have been less severe.
2. The annular failure probably was due to an inability to close and seal under high flow rate, likely due to erosion of its rubber packer sealing material.
3. BOP Phase 2 results did not find any damage in the operating mechanism, ruling out such a cause.
Lesson: Consider closing in a preventer other than the annular immediately after closing in on a high flow rate. Annular preventers may not seal when closing in on a high flow rate of some unknown threshold value.
VBR Pipe Rams
4. The middle VBR pipe ram successfully stopped a high flow rate and sealed the well. 5. Ram type preventers probably have higher flow rate capability than annulars, but their use as a default
first shut-in device is impaired by their design pipe size restrictions (including tool joints). 6. ES believes that the crew likely closed only the middle VBR, and not the upper VBR. 7. The seal of the closed VBR was lost at some point later, likely to due to high temperature from the
flowing fluid, which approached the rating working temperature of the VBR rubber. There are conflicting goals in the selection of BOP elastomers, specifically to be flexible at low temperatures, but not extrude out at high temperature. Elastomers become more fluid with increasing temperature, so it should be recognized that sustained high flow may ultimately cause wellhead temperature to exceed elastomer capability and lead to failure.
Blind Shear Ram Failure 8. ES concludes that the AMF/deadman system probably functioned to close the blind shear ram on the loss
of surface utilities, including electrical power, communications, and hydraulic pressure. 9. The autoshear system149 was functioned by ROV intervention and closed the BSR, if it had not been
already closed by the AMF/deadman. 10. The DWH drill pipe was located off-center nearly against the BOP wall at the time of BSR actuation. Its
position prevented the BSR from closing enough to seal with the available closing energy. The BSR did, however, rupture the drill pipe, releasing its shut-in pressure and providing a new flow path for reservoir fluids to the surface.
148 DNV Report, Volume 2, Timeline, March 10, 2010, F-57 to F-61 149 Autoshear is defined by API Specification 16D as “a safety system that is designed to automatically shut in the wellbore in the event of a disconnect of the LMRP. When the autoshear is armed, a disconnect of the LMRP closes the shear rams.”
CSB-FINAL REPORT-BOP(06-02-2014) Page 41 of 83 U.S. Chemical Safety Board By Engineering Services, L.P.
11. The drill pipe was off-center due to buckling by a combination of axial force and internal pressure. Industry had not previously recognized that drill pipe would buckle in a BOP under certain high pressure conditions.
12. The location of closed middle VBR determined how far off-center the buckled drill pipe was at the BSR. If the upper VBR, which was closer to the BSR, had been closed by the crew, the drill pipe would have been substantially less off-center and the BSR might have been able to seal.
Lesson: Investigate the conditions for pipe buckling in the BOP during well control to develop recommendations for BOP arrangement considerations and well control procedures.
13. A higher accumulator precharge would have increased the available shearing pressure, but FEA computer modeling concluded that the required shearing pressure was far beyond even a maximized accumulator capability.
14. A higher capacity shear packer was available and was Cameron-rated to shear the larger drill pipe. It is not known if this packer would have sheared and sealed the off-center 5½" pipe. (See near-miss learning on this topic below.)
Blind Shear Ram – Near-miss lessons
15. The blind shear ram packer did not have a Cameron shear rating suitable for the 6 5/8" drill pipe that was used for most of the Macondo drilling. It is unknown if BP or Transocean was aware of this discrepancy or had other reasons to believe the BOP could reliably shear and seal the 6 5/8" drill pipe actually used.
Lesson: Check for suitable BSR capability before each well and again during any rig or major well design changes.
16. If the closed annular had sealed as designed, gas already in the riser could have surfaced and led to an explosion and triggered the AMF deadman to close the BSR. However, in this scenario, the accumulator system might not have been capable of providing sufficient BSR operator energy to overcome the increased wellbore pressure that would have occurred. A partial closure would have created a flow path up the drill pipe. The Bureau of Safety and Environmental Enforcement rules now require that the blind shear ram be able to shear against maximum anticipated surface pressure (MASP).150
Lesson: Check for suitable BOP accumulator capacity to close the BSR under MASP conditions. Assess if the MASP basis is consistent with risk assessment scenarios for the well.
Controls (in separate ES report on the MUX control system)
17. Based on testing and evaluation of the BOP MUX control system, the AMF/deadman probably functioned correctly even though several known deficiencies existed in the AMF and SEM (Subsea Electronics Module).151
Accumulator capacity 18. The BSR was powered by an accumulator system which met API, BP, and Transocean standards for the
5½" drill pipe in the BOP at the time of the incident.
150 CFR § 250.416(e). 151 See separate ES report on MUX Control System.
CSB-FINAL REPORT-BOP(06-02-2014) Page 42 of 83 U.S. Chemical Safety Board By Engineering Services, L.P.
Lesson: Engineering should determine and rig crews should verify correct LMRP and BOP accumulator precharge pressures, meeting or exceeding API standard 16D criteria, including the volume for all ram locking and valve closing mechanisms that may be operated by deadman and autoshear systems.
19. The BOP accumulator design depends on the pressure needed to operate the BSR. If the DWH upper annular had sealed, the accumulator and BSR would not shear even a centered 5 ½” drill pipe. A higher precharge of 5000 psig, instead of 3700 psig, would have been needed. The MMS rule on the BOP pressure basis for BSRs was not clear prior to the incident.
Lesson: Designing the BSR and accumulators to shear pipe with a maximum anticipated wellhead/BOP pressure would reduce risk. Since the incident, BSEE has adopted this requirement.
Negative Pressure Test
20. While not directly related to failure of the BOP, the negative pressure test was inadequate both in the level of detail in the procedure and in the execution by the rig crew. The procedure did not contain sufficient information on steps, expected pressures at key points in the displacement and bleeding, expected bleed volumes, and criteria for a positive test. The inclusion of a large volume of dense, thick spacer made the test more complex and difficult to interpret pressures, especially if under-displaced and the pressure test point changed to the kill line. The Chief Counsel Report contains additional information and discussion.152
Lesson: Leaving negative test key steps and expected volume/pressure parameters to on-site, same day development increases the risk of incorrect test interpretation.
Crew monitoring
21. The DWH crew decision to close a preventer came only after a dangerous amount of oil and gas had already entered the riser and flow rates had become very high. The well flow could have been detected much earlier when rates were much lower and likely to been within equipment capability to handle (e.g., annular preventer and diverter system).
Lesson: Rig floor crews should always check that riser stays full after shutting off pumps, including during negative pressure tests.
Lesson: Even after casing is in place and cemented, rig crews should continuously monitor both return circulation flow rates (in versus out) and pit levels, to detect a possible loss of well integrity.
BOP pressure sensor 22. The BOP stack contained a pressure sensor that, if used, could have led to better crew decision on the
negative pressure test.153 The instrument was operable, and ES could not determine why it was not used during the negative pressure test as a check against the conflicting drill pipe and kill line pressure
152 Chief Counsel Report, Section 4.6, pg. 143 153 These sensors were used a month earlier to monitor BOP pressures during the well control event on March 10, 2010; DNV Report, Volume 2: F-57 to F-61. The accuracy (report correct pressure) of these gauges is suspect, and the two differed by 700 psi in their readings. Even so, it appears that their precision (ability to detect changes in pressure) was good; therefore, they have operational value. The BOP sensor was to be checked in Phase 2 Testing.
CSB-FINAL REPORT-BOP(06-02-2014) Page 43 of 83 U.S. Chemical Safety Board By Engineering Services, L.P.
measurements. Also, equipping the measurement with an alarm could have automatically warned of gas in the riser (reduced pressure), enabling an earlier crew response.
Lesson: Drilling contractors should develop and implement crew training on the various uses of any BOP pressure and temperature sensors. Industry should consider alarm settings for BOP pressure falling below mud hydrostatic or recent pressure history.
Report prepared under CSB contract with
Engineering Services, LP P.O. Box 5811 Kingwood, Texas 77325-5811
Caveat and Disclaimer All opinions and conclusions stated in this report are based upon information as ES had at the time that this report was prepared. A change in any fact or circumstance upon which this report is based may affect what is expressed in this report.
NO IMPLIED WARRANTY OF MERCHANTABILITY OR FITNESS FOR A PARTICULAR PURPOSE SHALL APPLY. ENGINEERING SERVICES, LP MAKES NO REPRESENTATION OR WARRANTY THAT THE IMPLEMENTATION OR USE OF THE OPINIONS OR CONCLUSIONS OF THIS REPORT WILL RESULT IN COMPLIANCE WITH APPLICABLE LAWS OR PERFECT RESULTS.
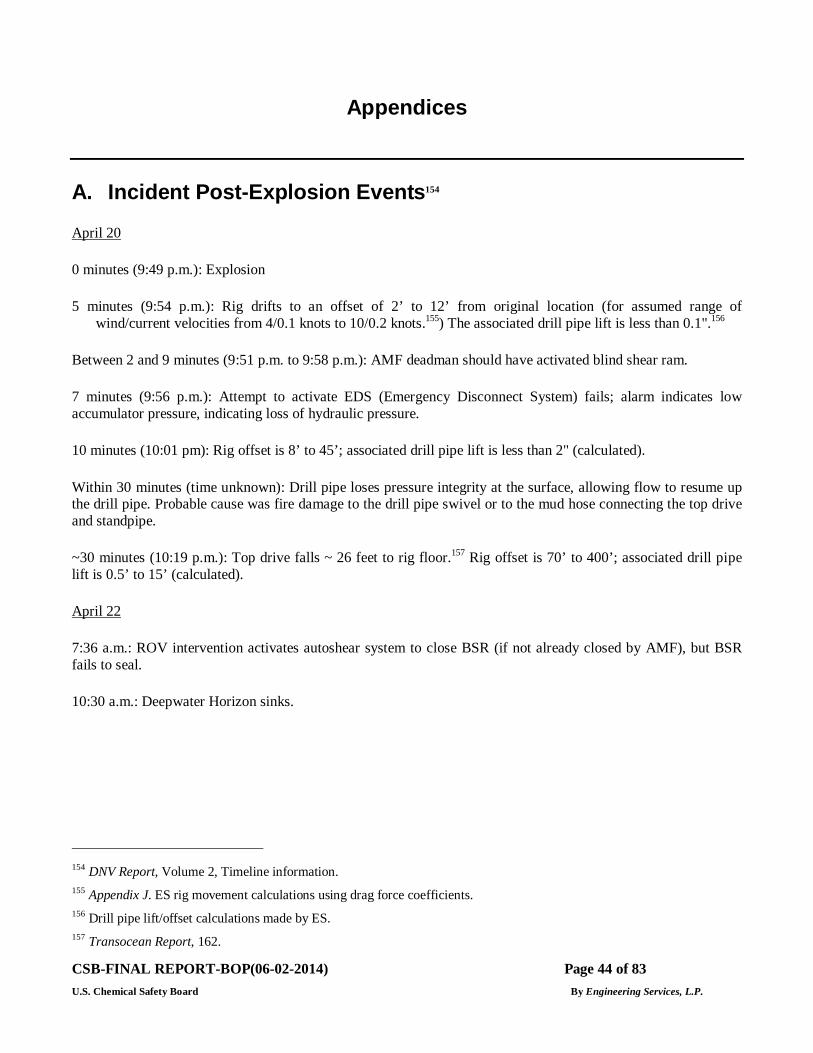
CSB-FINAL REPORT-BOP(06-02-2014) Page 44 of 83 U.S. Chemical Safety Board By Engineering Services, L.P.
Appendices
A. Incident Post-Explosion Events154
April 20
0 minutes (9:49 p.m.): Explosion
5 minutes (9:54 p.m.): Rig drifts to an offset of 2’ to 12’ from original location (for assumed range of wind/current velocities from 4/0.1 knots to 10/0.2 knots.155) The associated drill pipe lift is less than 0.1".156
Between 2 and 9 minutes (9:51 p.m. to 9:58 p.m.): AMF deadman should have activated blind shear ram.
7 minutes (9:56 p.m.): Attempt to activate EDS (Emergency Disconnect System) fails; alarm indicates low accumulator pressure, indicating loss of hydraulic pressure.
10 minutes (10:01 pm): Rig offset is 8’ to 45’; associated drill pipe lift is less than 2" (calculated).
Within 30 minutes (time unknown): Drill pipe loses pressure integrity at the surface, allowing flow to resume up the drill pipe. Probable cause was fire damage to the drill pipe swivel or to the mud hose connecting the top drive and standpipe.
~30 minutes (10:19 p.m.): Top drive falls ~ 26 feet to rig floor.157 Rig offset is 70’ to 400’; associated drill pipe lift is 0.5’ to 15’ (calculated).
April 22
7:36 a.m.: ROV intervention activates autoshear system to close BSR (if not already closed by AMF), but BSR fails to seal.
10:30 a.m.: Deepwater Horizon sinks.
154 DNV Report, Volume 2, Timeline information. 155 Appendix J. ES rig movement calculations using drag force coefficients. 156 Drill pipe lift/offset calculations made by ES. 157 Transocean Report, 162.
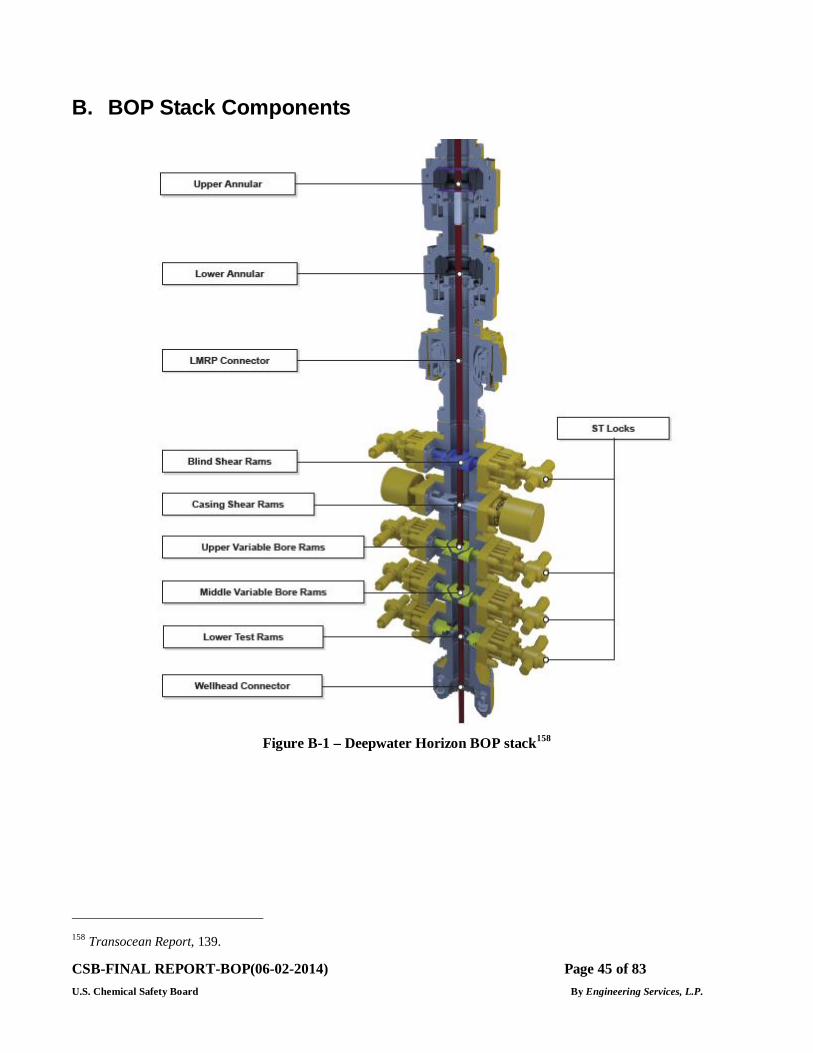
CSB-FINAL REPORT-BOP(06-02-2014) Page 45 of 83 U.S. Chemical Safety Board By Engineering Services, L.P.
B. BOP Stack Components
Figure B-1 – Deepwater Horizon BOP stack158
158 Transocean Report, 139.
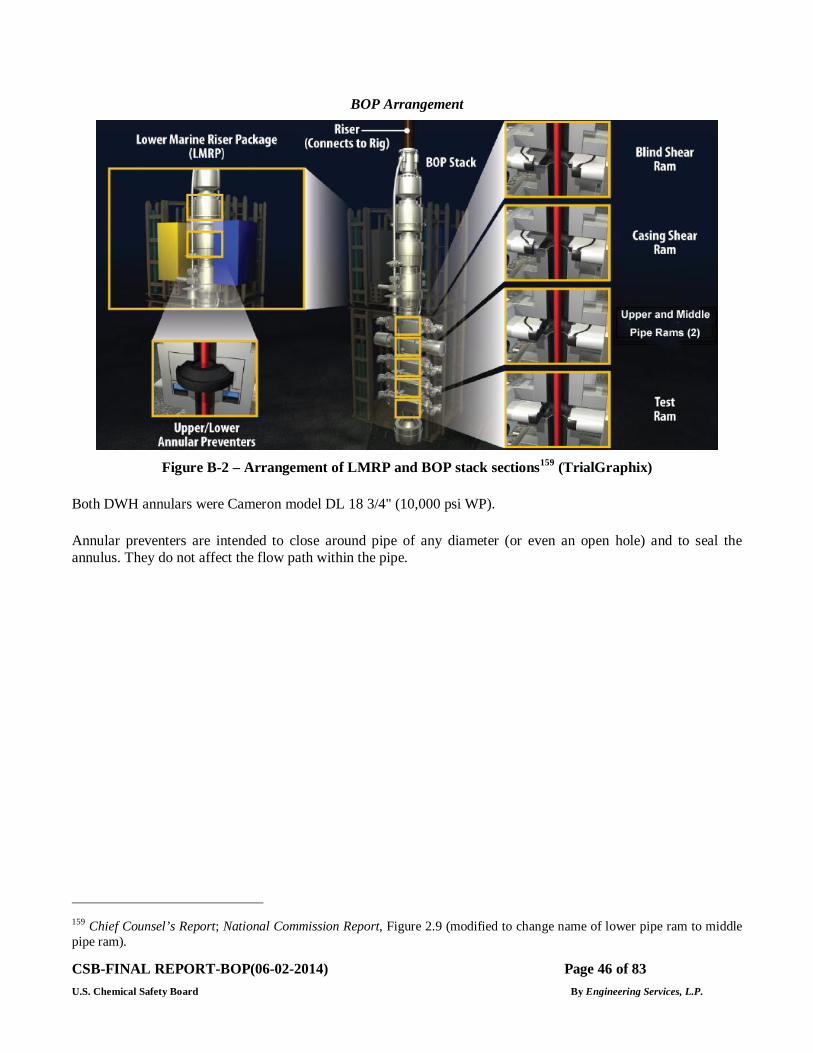
CSB-FINAL REPORT-BOP(06-02-2014) Page 46 of 83 U.S. Chemical Safety Board By Engineering Services, L.P.
BOP Arrangement
Figure B-2 – Arrangement of LMRP and BOP stack sections159 (TrialGraphix)
Both DWH annulars were Cameron model DL 18 3/4" (10,000 psi WP).
Annular preventers are intended to close around pipe of any diameter (or even an open hole) and to seal the annulus. They do not affect the flow path within the pipe.
159 Chief Counsel’s Report; National Commission Report, Figure 2.9 (modified to change name of lower pipe ram to middle pipe ram).
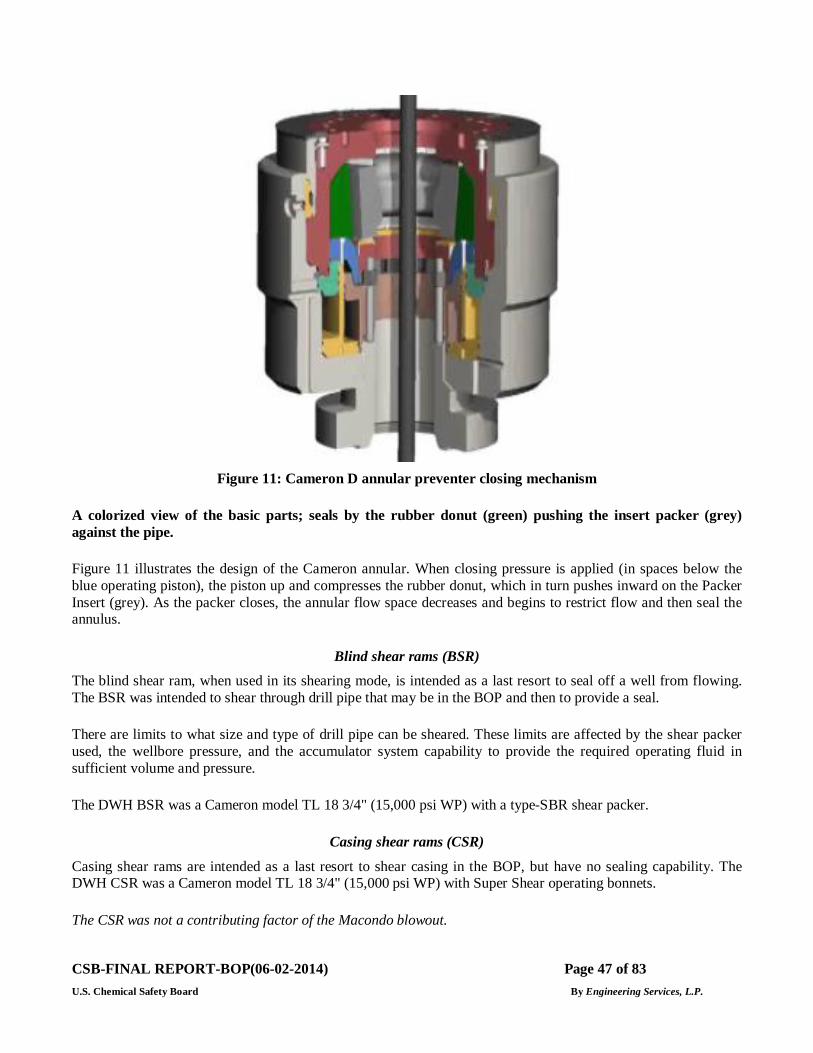
CSB-FINAL REPORT-BOP(06-02-2014) Page 47 of 83 U.S. Chemical Safety Board By Engineering Services, L.P.
Figure 11: Cameron D annular preventer closing mechanism
A colorized view of the basic parts; seals by the rubber donut (green) pushing the insert packer (grey) against the pipe.
Figure 11 illustrates the design of the Cameron annular. When closing pressure is applied (in spaces below the blue operating piston), the piston up and compresses the rubber donut, which in turn pushes inward on the Packer Insert (grey). As the packer closes, the annular flow space decreases and begins to restrict flow and then seal the annulus.
Blind shear rams (BSR) The blind shear ram, when used in its shearing mode, is intended as a last resort to seal off a well from flowing. The BSR was intended to shear through drill pipe that may be in the BOP and then to provide a seal.
There are limits to what size and type of drill pipe can be sheared. These limits are affected by the shear packer used, the wellbore pressure, and the accumulator system capability to provide the required operating fluid in sufficient volume and pressure.
The DWH BSR was a Cameron model TL 18 3/4" (15,000 psi WP) with a type-SBR shear packer.
Casing shear rams (CSR)
Casing shear rams are intended as a last resort to shear casing in the BOP, but have no sealing capability. The DWH CSR was a Cameron model TL 18 3/4" (15,000 psi WP) with Super Shear operating bonnets.
The CSR was not a contributing factor of the Macondo blowout.
CSB-FINAL REPORT-BOP(06-02-2014) Page 48 of 83 U.S. Chemical Safety Board By Engineering Services, L.P.
Variable Bore Ram (VBR) pipe rams
VBRs are a type of pipe ram that can close on a range of pipe sizes. Pipe rams are intended to close around drill pipe and provide seal of the annulus (e.g., to prevent a well from flowing). They do not affect flow within the drill pipe.
The DWH BOP had four Cameron model TL 18 3/4" (15,000 psi WP) with standard operating bonnets. All were equipped with VBR packers to close against a range of pipe outside diameters, 3½" to 6-5/8".
Pipe rams and VBRs are designed to hold a pressure differential only from one direction, usually from below. The DWH VBR in the lowest BOP position was installed intentionally upside down to hold pressure from above, and it was designated as a Test Ram. This arrangement saves time in conducting the periodic subsea pressure tests of the BOP stack. In this role, it served no purpose in dealing with a well control event. It was not counted in meeting regulations or industry standards for BOP equipment.
ST Locks
The BSR and all VBRs were equipped with ST Locks. These devices can be actuated to keep a VBR closed even if operating pressure is lost. (Loss of MUX communication will vent all operating closing pressures.) The locks require a certain operating volume and pressure as well, but they will remain in the locked position even if operating closing pressure is then lost.
BOP accumulators
The DWH had two subsea accumulator banks. The accumulator bank of primary interest, located in the lower BOP section, provided a self-sufficient operating fluid source for the blind shear ram (BSR) and certain other functions.
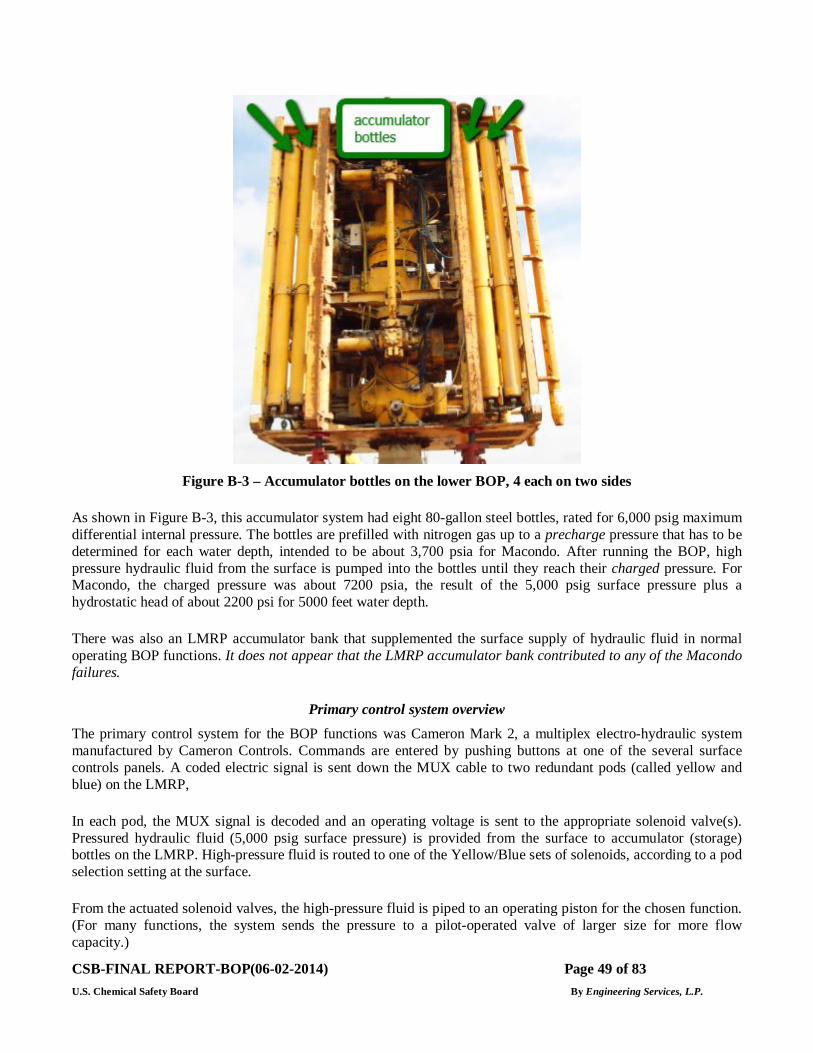
CSB-FINAL REPORT-BOP(06-02-2014) Page 49 of 83 U.S. Chemical Safety Board By Engineering Services, L.P.
Figure B-3 – Accumulator bottles on the lower BOP, 4 each on two sides
As shown in Figure B-3, this accumulator system had eight 80-gallon steel bottles, rated for 6,000 psig maximum differential internal pressure. The bottles are prefilled with nitrogen gas up to a precharge pressure that has to be determined for each water depth, intended to be about 3,700 psia for Macondo. After running the BOP, high pressure hydraulic fluid from the surface is pumped into the bottles until they reach their charged pressure. For Macondo, the charged pressure was about 7200 psia, the result of the 5,000 psig surface pressure plus a hydrostatic head of about 2200 psi for 5000 feet water depth.
There was also an LMRP accumulator bank that supplemented the surface supply of hydraulic fluid in normal operating BOP functions. It does not appear that the LMRP accumulator bank contributed to any of the Macondo failures.
Primary control system overview The primary control system for the BOP functions was Cameron Mark 2, a multiplex electro-hydraulic system manufactured by Cameron Controls. Commands are entered by pushing buttons at one of the several surface controls panels. A coded electric signal is sent down the MUX cable to two redundant pods (called yellow and blue) on the LMRP,
In each pod, the MUX signal is decoded and an operating voltage is sent to the appropriate solenoid valve(s). Pressured hydraulic fluid (5,000 psig surface pressure) is provided from the surface to accumulator (storage) bottles on the LMRP. High-pressure fluid is routed to one of the Yellow/Blue sets of solenoids, according to a pod selection setting at the surface.
From the actuated solenoid valves, the high-pressure fluid is piped to an operating piston for the chosen function. (For many functions, the system sends the pressure to a pilot-operated valve of larger size for more flow capacity.)
CSB-FINAL REPORT-BOP(06-02-2014) Page 50 of 83 U.S. Chemical Safety Board By Engineering Services, L.P.
The solenoid valves have a non-energized, spring-return position. In the non-energized position, most functions are vented (i.e., bleed the function fluid). Also, most functions require a separate command operation to open and to close. Exceptions to this include the choke and kill valves which have a fail-safe spring to close in addition to the hydraulic close.
The hydraulic fluid was water-based, and the system was not closed loop, with used fluid being discharged to the sea.
Back-up BOP control systems: EDS, deadman, autoshear, & ROV
The DWH BOP had four back-up control systems:
The EDS (Emergency Disconnect Sequence): Operated from any of several control stations at the rig, including the rig floor and bridge. The EDS performs a pre-programmed sequence of BOP functions, including actuation of the BSR followed by disconnect of the LMRP from the BOP.
The AMF/deadman (Automatic Mode Function): If the subsea pods detect that electric signal and hydraulic supply are both lost to both control pods, each pod will activate its deadman function. This simultaneously closes all choke & kill valves, sets all VBR locks, and closes the BSR.
Autoshear: A trigger valve sensor was installed in the BOP stack to detect an accidental disconnect of the LMRP, at which time it initiates the same functions as the deadman system (close BSR and set ST Locks).
ROV panel (Remotely Operated Vehicle): Intervention with an ROV connects to subsea stabs to activate certain BOP functions.
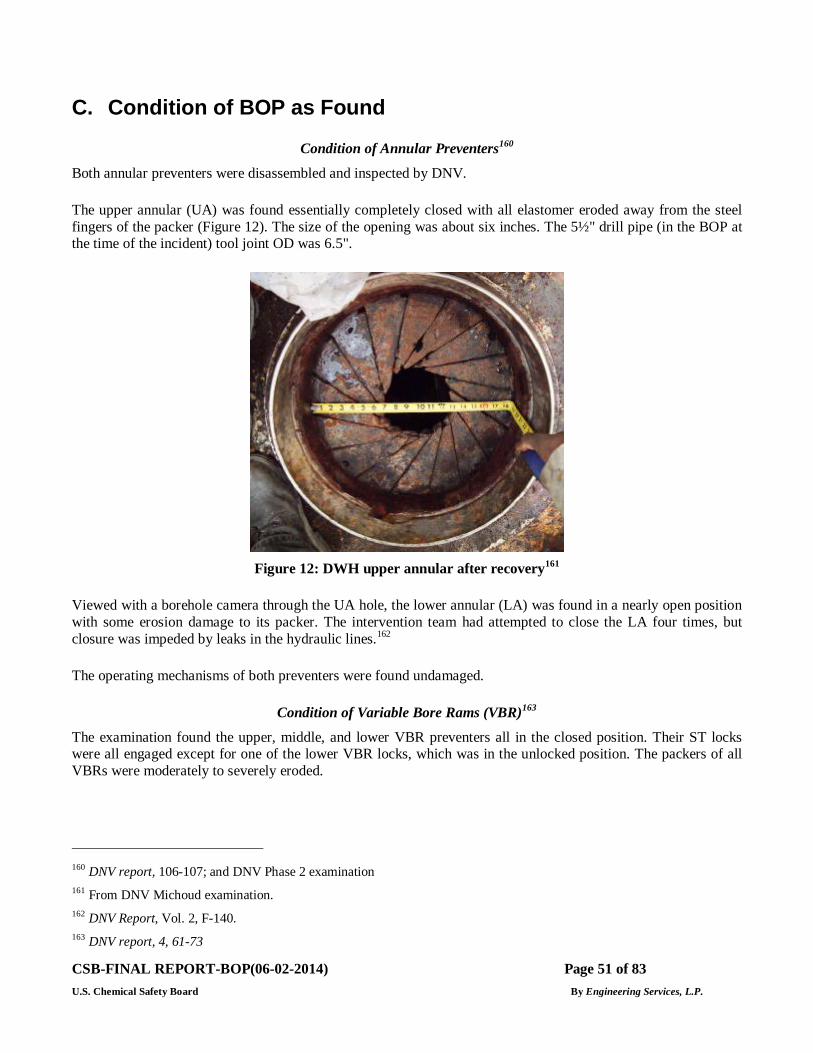
CSB-FINAL REPORT-BOP(06-02-2014) Page 51 of 83 U.S. Chemical Safety Board By Engineering Services, L.P.
C. Condition of BOP as Found
Condition of Annular Preventers160
Both annular preventers were disassembled and inspected by DNV.
The upper annular (UA) was found essentially completely closed with all elastomer eroded away from the steel fingers of the packer (Figure 12). The size of the opening was about six inches. The 5½" drill pipe (in the BOP at the time of the incident) tool joint OD was 6.5".
Figure 12: DWH upper annular after recovery161
Viewed with a borehole camera through the UA hole, the lower annular (LA) was found in a nearly open position with some erosion damage to its packer. The intervention team had attempted to close the LA four times, but closure was impeded by leaks in the hydraulic lines.162
The operating mechanisms of both preventers were found undamaged.
Condition of Variable Bore Rams (VBR)163
The examination found the upper, middle, and lower VBR preventers all in the closed position. Their ST locks were all engaged except for one of the lower VBR locks, which was in the unlocked position. The packers of all VBRs were moderately to severely eroded.
160 DNV report, 106-107; and DNV Phase 2 examination 161 From DNV Michoud examination. 162 DNV Report, Vol. 2, F-140. 163 DNV report, 4, 61-73
CSB-FINAL REPORT-BOP(06-02-2014) Page 52 of 83 U.S. Chemical Safety Board By Engineering Services, L.P.
Condition of Blind Shear Ram (BSR)164
The BSR was found closed during initial recovery on the Q4000 rig.165 The BSR and the adjacent BOP wall had major erosion and almost all of its elastomeric components were eroded.
The forensic evidence revealed that the drill pipe was off-center in the BSR (5.5 inches, or 1.2 inches from the BOP wall) at the time of attempted shearing.166
164 Ibid, 53-56, 100 165 YouTube, “Deepwater Horizon BOP secrets” video from Q4000 166 See Figure 14: Drill pipe off-center distance from DNV laser scans of DP and BSR block, pg. 28 in this report
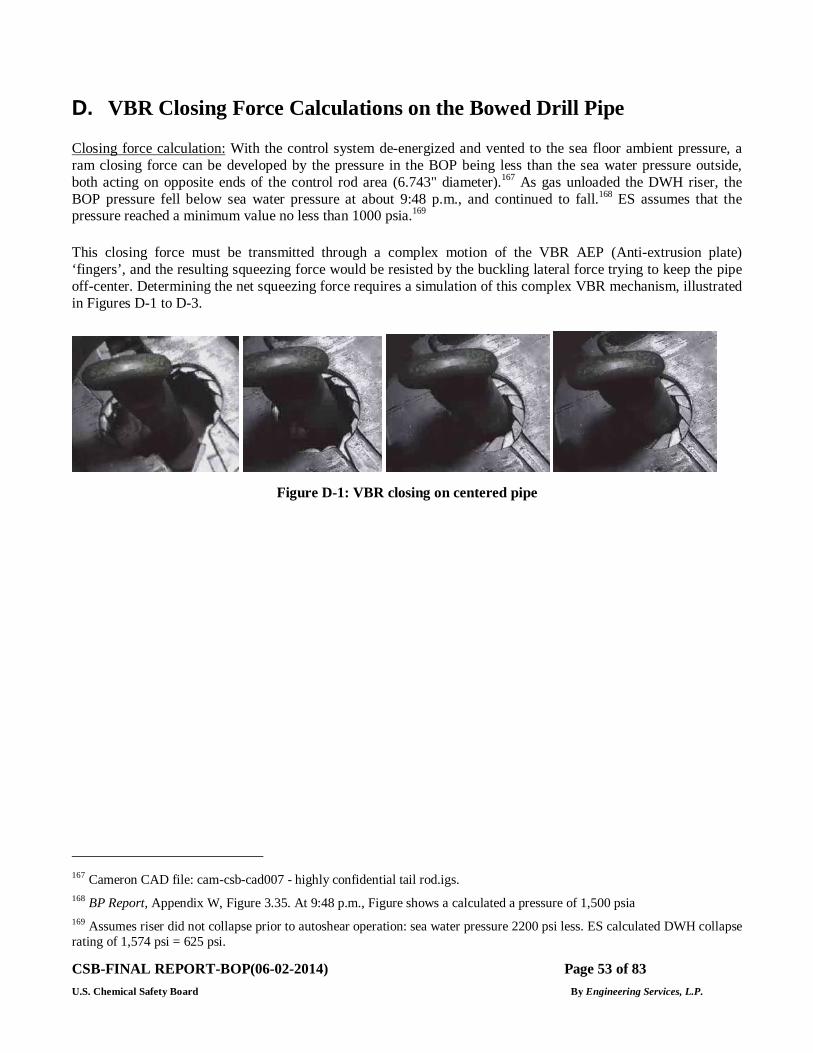
CSB-FINAL REPORT-BOP(06-02-2014) Page 53 of 83 U.S. Chemical Safety Board By Engineering Services, L.P.
D. VBR Closing Force Calculations on the Bowed Drill Pipe
Closing force calculation: With the control system de-energized and vented to the sea floor ambient pressure, a ram closing force can be developed by the pressure in the BOP being less than the sea water pressure outside, both acting on opposite ends of the control rod area (6.743" diameter).167 As gas unloaded the DWH riser, the BOP pressure fell below sea water pressure at about 9:48 p.m., and continued to fall.168 ES assumes that the pressure reached a minimum value no less than 1000 psia.169
This closing force must be transmitted through a complex motion of the VBR AEP (Anti-extrusion plate) ‘fingers’, and the resulting squeezing force would be resisted by the buckling lateral force trying to keep the pipe off-center. Determining the net squeezing force requires a simulation of this complex VBR mechanism, illustrated in Figures D-1 to D-3.
Figure D-1: VBR closing on centered pipe
167 Cameron CAD file: cam-csb-cad007 - highly confidential tail rod.igs. 168 BP Report, Appendix W, Figure 3.35. At 9:48 p.m., Figure shows a calculated a pressure of 1,500 psia 169 Assumes riser did not collapse prior to autoshear operation: sea water pressure 2200 psi less. ES calculated DWH collapse rating of 1,574 psi = 625 psi.
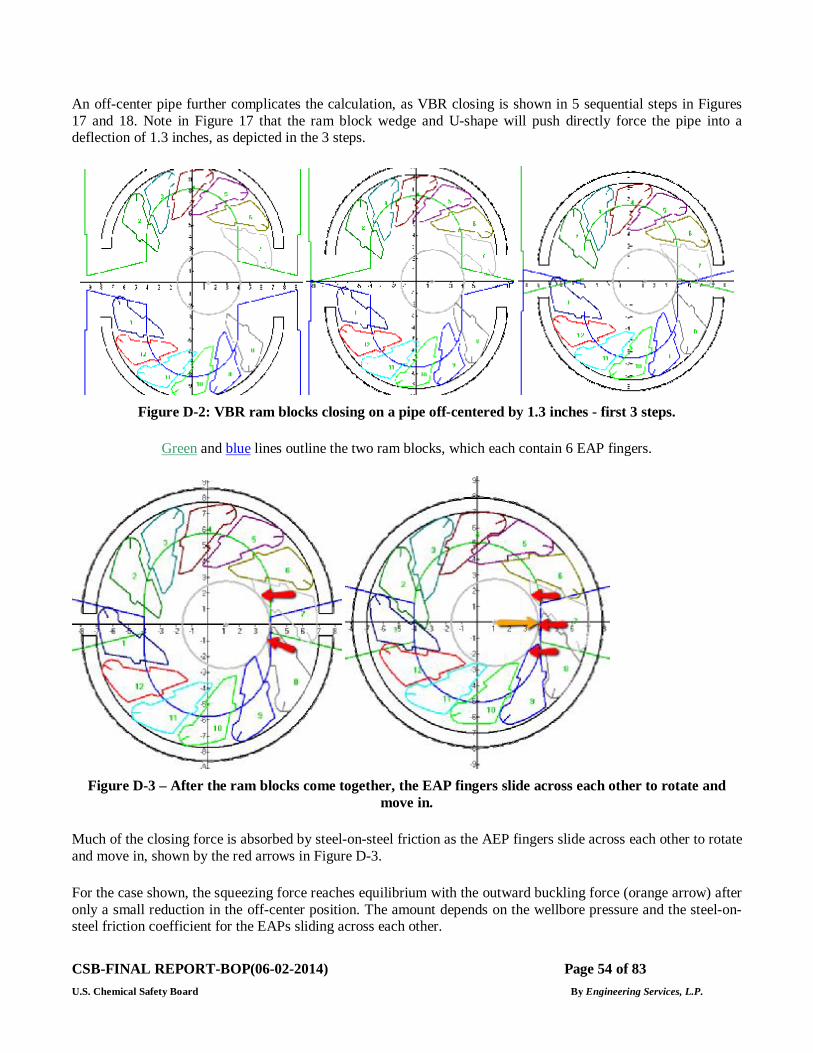
CSB-FINAL REPORT-BOP(06-02-2014) Page 54 of 83 U.S. Chemical Safety Board By Engineering Services, L.P.
An off-center pipe further complicates the calculation, as VBR closing is shown in 5 sequential steps in Figures 17 and 18. Note in Figure 17 that the ram block wedge and U-shape will push directly force the pipe into a deflection of 1.3 inches, as depicted in the 3 steps.
Figure D-2: VBR ram blocks closing on a pipe off-centered by 1.3 inches - first 3 steps.
Green and blue lines outline the two ram blocks, which each contain 6 EAP fingers.
Figure D-3 – After the ram blocks come together, the EAP fingers slide across each other to rotate and
move in.
Much of the closing force is absorbed by steel-on-steel friction as the AEP fingers slide across each other to rotate and move in, shown by the red arrows in Figure D-3.
For the case shown, the squeezing force reaches equilibrium with the outward buckling force (orange arrow) after only a small reduction in the off-center position. The amount depends on the wellbore pressure and the steel-on-steel friction coefficient for the EAPs sliding across each other.
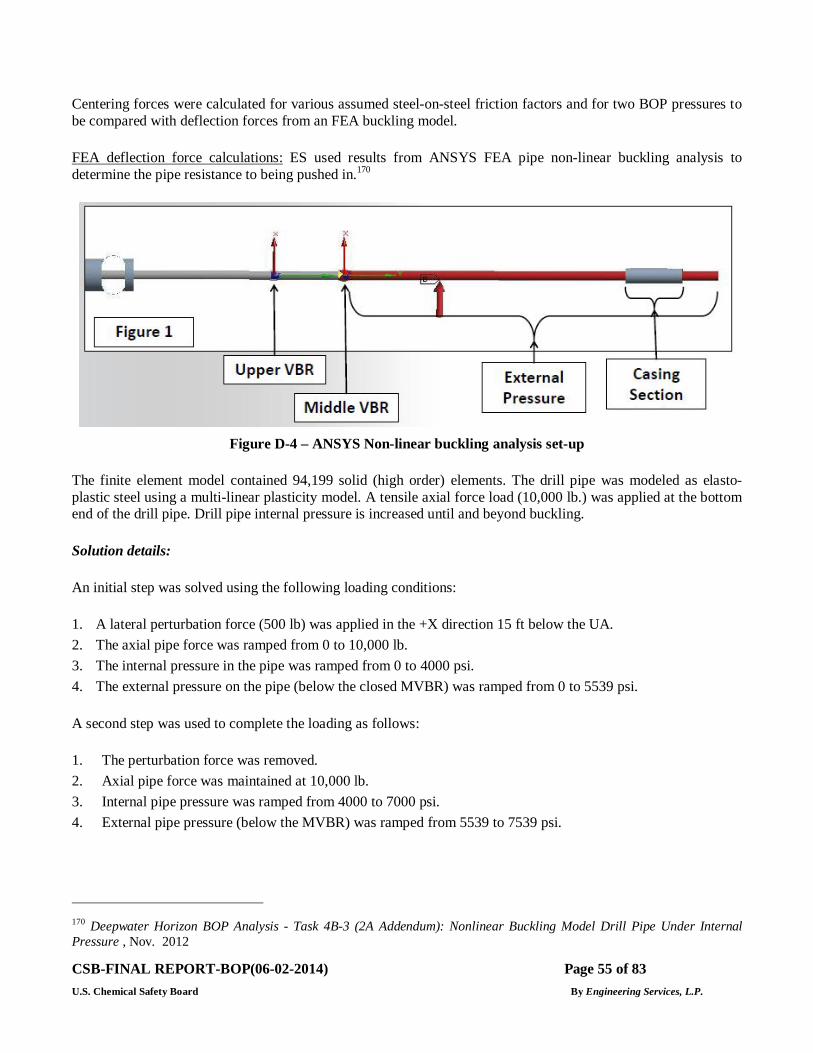
CSB-FINAL REPORT-BOP(06-02-2014) Page 55 of 83 U.S. Chemical Safety Board By Engineering Services, L.P.
Centering forces were calculated for various assumed steel-on-steel friction factors and for two BOP pressures to be compared with deflection forces from an FEA buckling model.
FEA deflection force calculations: ES used results from ANSYS FEA pipe non-linear buckling analysis to determine the pipe resistance to being pushed in.170
Figure D-4 – ANSYS Non-linear buckling analysis set-up
The finite element model contained 94,199 solid (high order) elements. The drill pipe was modeled as elasto-plastic steel using a multi-linear plasticity model. A tensile axial force load (10,000 lb.) was applied at the bottom end of the drill pipe. Drill pipe internal pressure is increased until and beyond buckling.
Solution details:
An initial step was solved using the following loading conditions:
1. A lateral perturbation force (500 lb) was applied in the +X direction 15 ft below the UA. 2. The axial pipe force was ramped from 0 to 10,000 lb. 3. The internal pressure in the pipe was ramped from 0 to 4000 psi. 4. The external pressure on the pipe (below the closed MVBR) was ramped from 0 to 5539 psi.
A second step was used to complete the loading as follows:
1. The perturbation force was removed. 2. Axial pipe force was maintained at 10,000 lb. 3. Internal pipe pressure was ramped from 4000 to 7000 psi. 4. External pipe pressure (below the MVBR) was ramped from 5539 to 7539 psi.
170 Deepwater Horizon BOP Analysis - Task 4B-3 (2A Addendum): Nonlinear Buckling Model Drill Pipe Under Internal Pressure , Nov. 2012
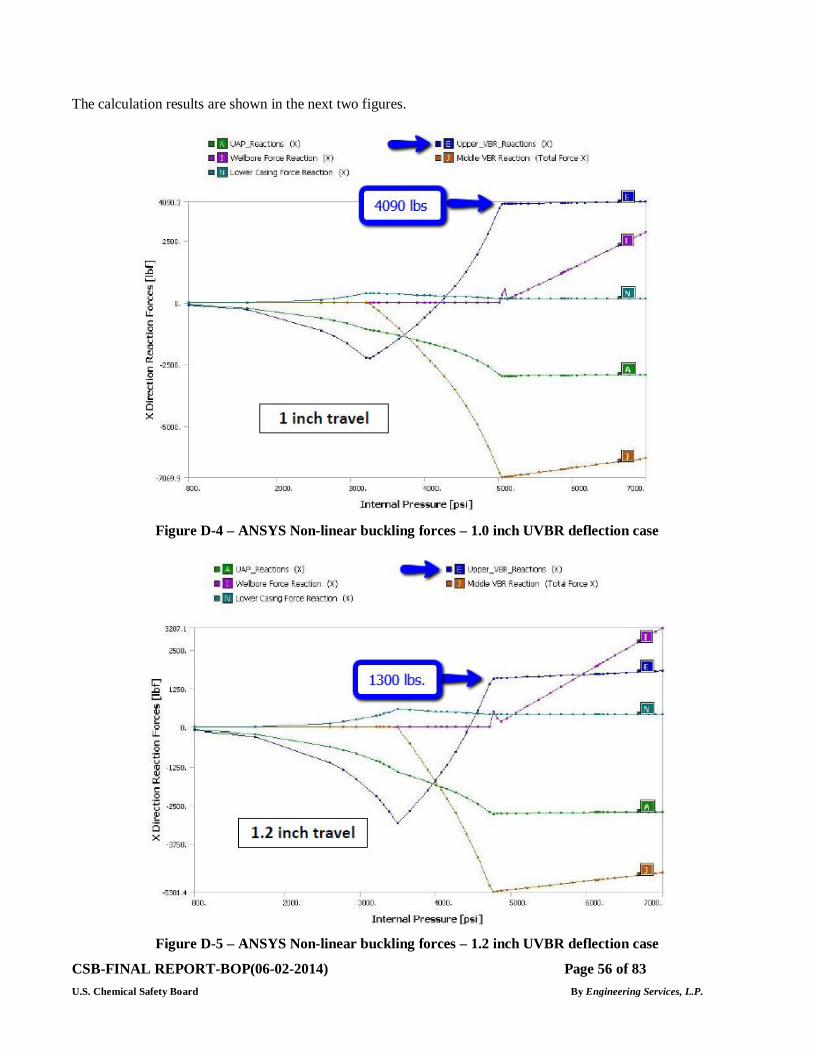
CSB-FINAL REPORT-BOP(06-02-2014) Page 56 of 83 U.S. Chemical Safety Board By Engineering Services, L.P.
The calculation results are shown in the next two figures.
Figure D-4 – ANSYS Non-linear buckling forces – 1.0 inch UVBR deflection case
Figure D-5 – ANSYS Non-linear buckling forces – 1.2 inch UVBR deflection case
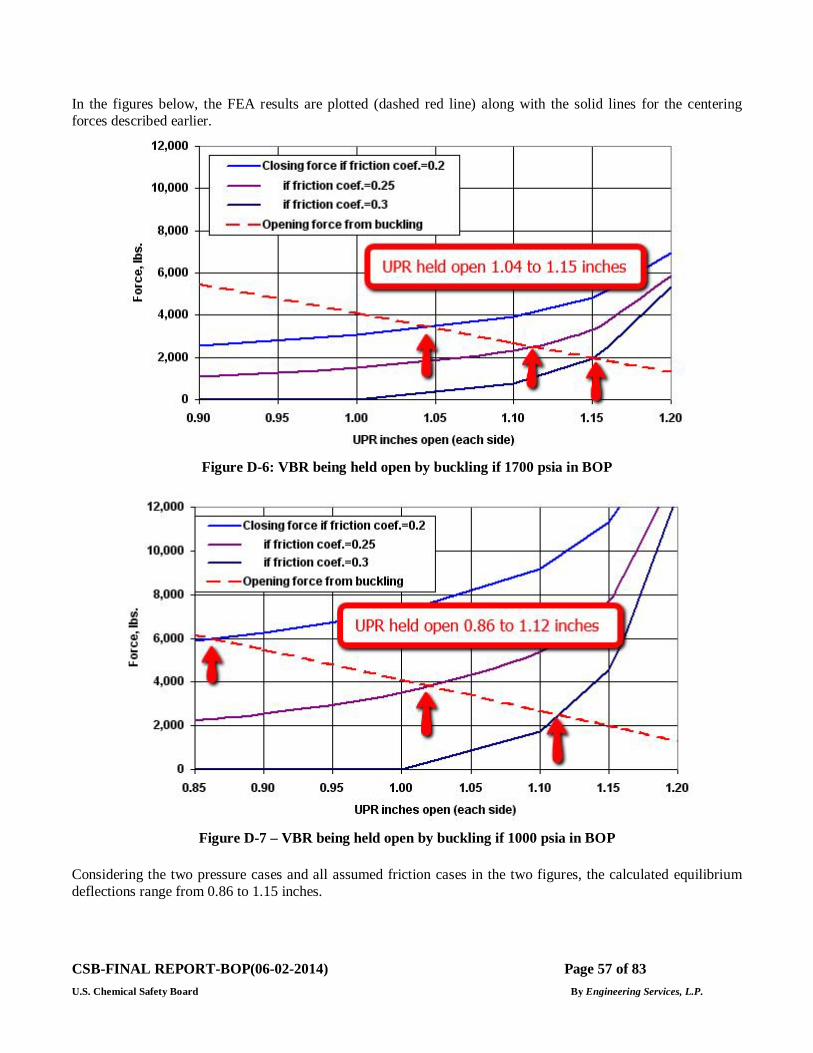
CSB-FINAL REPORT-BOP(06-02-2014) Page 57 of 83 U.S. Chemical Safety Board By Engineering Services, L.P.
In the figures below, the FEA results are plotted (dashed red line) along with the solid lines for the centering forces described earlier.
Figure D-6: VBR being held open by buckling if 1700 psia in BOP
Figure D-7 – VBR being held open by buckling if 1000 psia in BOP
Considering the two pressure cases and all assumed friction cases in the two figures, the calculated equilibrium deflections range from 0.86 to 1.15 inches.
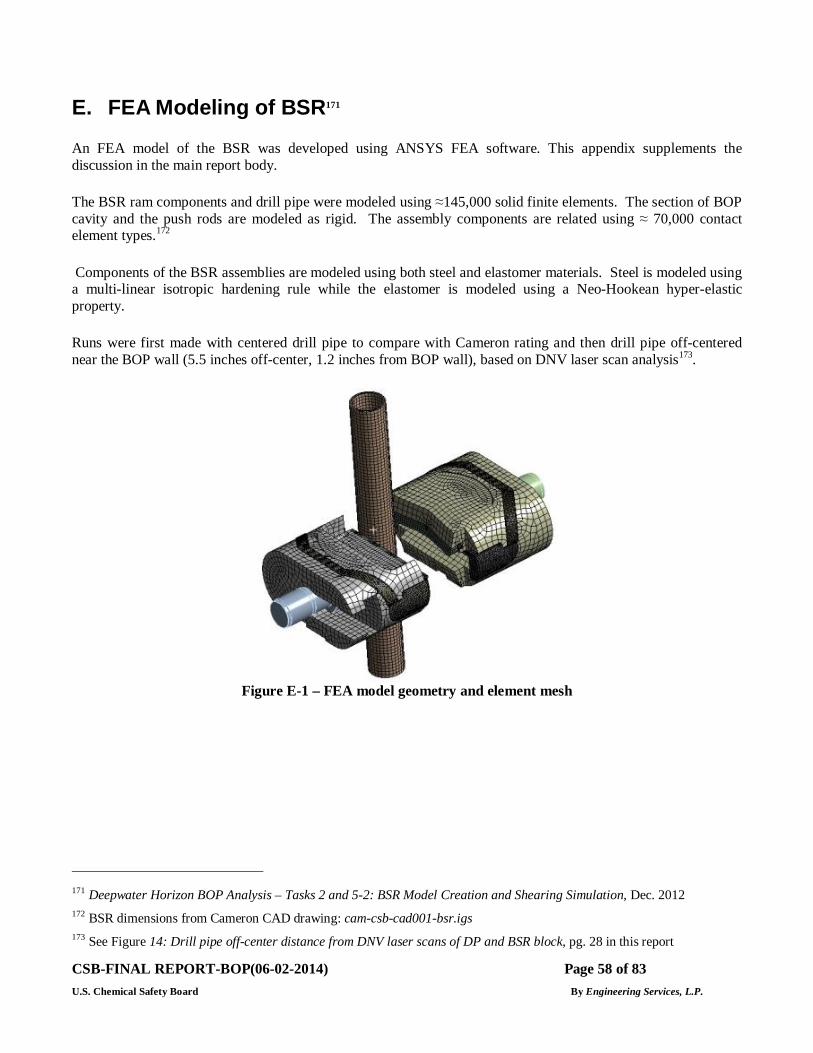
CSB-FINAL REPORT-BOP(06-02-2014) Page 58 of 83 U.S. Chemical Safety Board By Engineering Services, L.P.
E. FEA Modeling of BSR171
An FEA model of the BSR was developed using ANSYS FEA software. This appendix supplements the discussion in the main report body.
The BSR ram components and drill pipe were modeled using ≈145,000 solid finite elements. The section of BOP cavity and the push rods are modeled as rigid. The assembly components are related using ≈ 70,000 contact element types.172
Components of the BSR assemblies are modeled using both steel and elastomer materials. Steel is modeled using a multi-linear isotropic hardening rule while the elastomer is modeled using a Neo-Hookean hyper-elastic property.
Runs were first made with centered drill pipe to compare with Cameron rating and then drill pipe off-centered near the BOP wall (5.5 inches off-center, 1.2 inches from BOP wall), based on DNV laser scan analysis173.
Figure E-1 – FEA model geometry and element mesh
171 Deepwater Horizon BOP Analysis – Tasks 2 and 5-2: BSR Model Creation and Shearing Simulation, Dec. 2012 172 BSR dimensions from Cameron CAD drawing: cam-csb-cad001-bsr.igs 173 See Figure 14: Drill pipe off-center distance from DNV laser scans of DP and BSR block, pg. 28 in this report
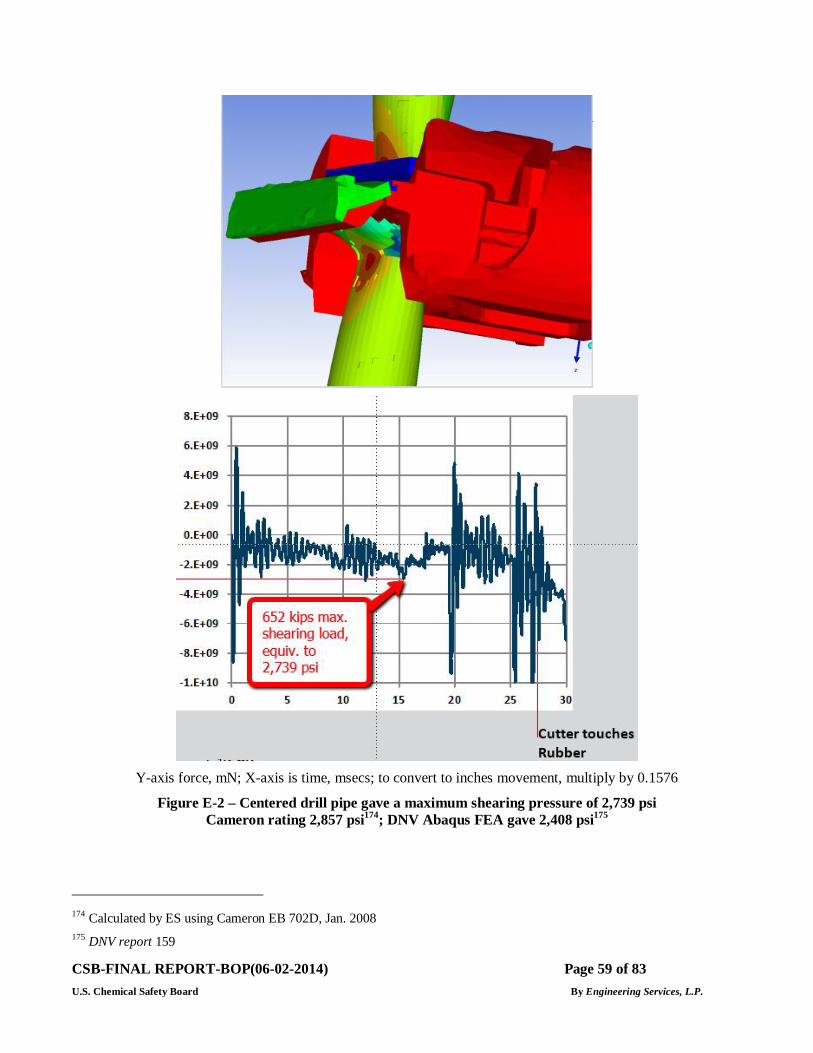
CSB-FINAL REPORT-BOP(06-02-2014) Page 59 of 83 U.S. Chemical Safety Board By Engineering Services, L.P.
Y-axis force, mN; X-axis is time, msecs; to convert to inches movement, multiply by 0.1576
Figure E-2 – Centered drill pipe gave a maximum shearing pressure of 2,739 psi Cameron rating 2,857 psi174; DNV Abaqus FEA gave 2,408 psi175
174 Calculated by ES using Cameron EB 702D, Jan. 2008 175 DNV report 159
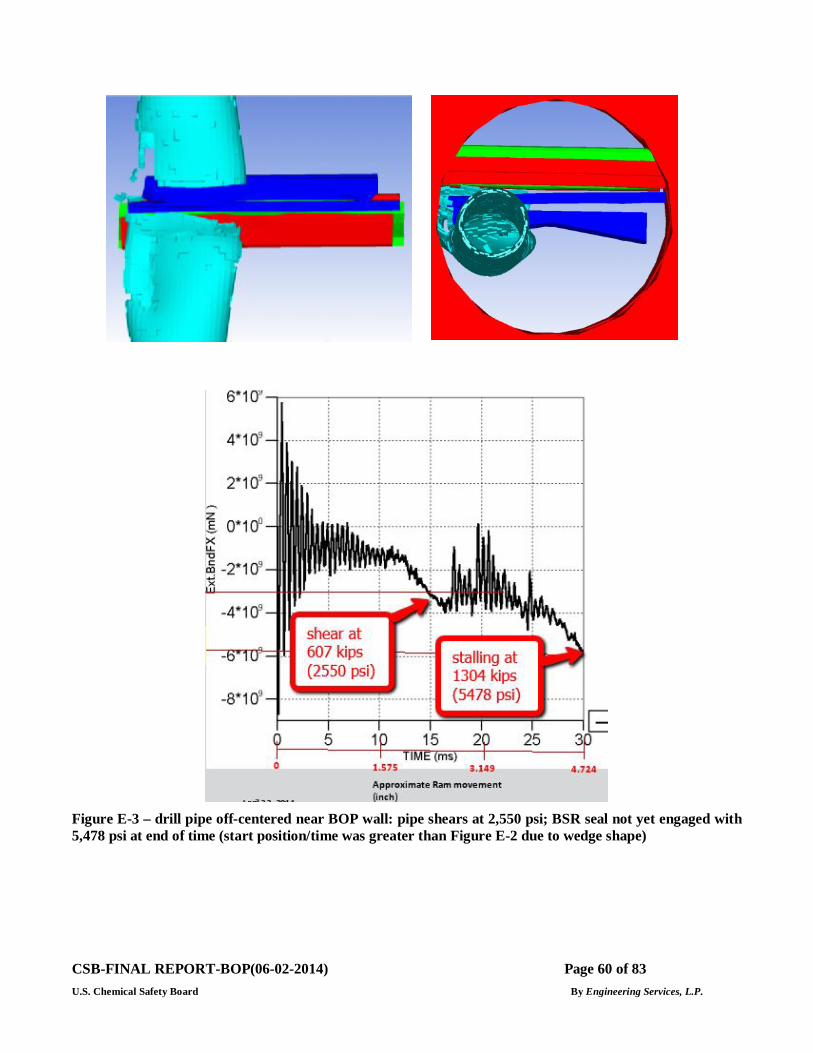
CSB-FINAL REPORT-BOP(06-02-2014) Page 60 of 83 U.S. Chemical Safety Board By Engineering Services, L.P.
Figure E-3 – drill pipe off-centered near BOP wall: pipe shears at 2,550 psi; BSR seal not yet engaged with 5,478 psi at end of time (start position/time was greater than Figure E-2 due to wedge shape)
CSB-FINAL REPORT-BOP(06-02-2014) Page 61 of 83 U.S. Chemical Safety Board By Engineering Services, L.P.
F. Control System: BSR Actuation Scenarios
There are two moments during the incident when the BSR could have been initially closed. (It is generally agreed that the crew did not actuate the BSR, as it would not be consistent with their training176 or industry guidelines.177)
BSR was closed by AMF/deadman control system When the MUX and hydraulic supply communication were lost, the AMF/deadman should have initiated. Within about a minute, hydraulic fluid should go simultaneously to the ST Locks (closing the locks on the already closed UPR), the choke & kill valves (were already closed by fail-safe springs), and the BSR.
Or AMF/deadman failed to trigger, and BSR was closed by ROV initiation of the autoshear control About 32 hours after the initial explosion, an ROV cut a rod to actuate the autoshear, a back-up system to close the BSR. No change in flow was observed, indicating that any change was too small to observe and that the BSR did not seal.178
G. Temporary abandonment draft procedures illuminate the differences for various options
In this section, the various procedure options that were considered for the Macondo well are reviewed and compared to the negative test objectives in order to illustrate both the range of the options and the decision process that was used. There are many variations possible in performing such a test, each with its advantages and disadvantages affected by the particular well characteristics, such as water depth and fluid densities. While these steps improved the procedure, ES found no explicit risk assessment step for the approved procedure.
About April 14, the temporary abandonment plans were changed to include a negative pressure test; the original version appears to be based on one planned for another BP rig, the Discoverer Enterprise.179 The Discoverer procedure used the kill line by replacing its mud with low density base oil. Then with an annular closed to isolate the well, the kill line was bled and checked for no pressure and no flow. The tested negative pressure using this procedure was 1,844 psi,180 which would have been greater than the 1,755 psi181 value that would occur with a wellbore cement plug at 1000 feet (the usual MMS limit) and then the mud above the plug removed. However at Macondo, the cement plug was being planned for 3,300 feet below the seafloor, which increased the necessary
176 Transocean report, 177 177 IADC Deepwater Well Control Guidelines, section 2.6, “Gas in Rise Riser Diverter” 2-29 178 DNV report, 139 179 2/28/2010 e-mail, Discoverer Negative test of liner top discussion: Fowler to Stoltz, et al.; BP-HZN-BLY00062447; CSB2010-10-I-OS-51888. 180 Test negative pressure using 7 ppg base oil to seafloor = (water depth + rig floor height) x (mud density – test fluid density) = 0.052 (units conversion) x (4992’ + 75’) x (14 - 7 ppg) = 1844 psi. 181 Needed test negative pressure value using water to cement plug at 1000’ below seafloor = (cement plug + water depth + rig floor height) x mud density – (cement plug + water depth) x sea water density = 0.052 (units conversion) x (1000’ + 4992’ + 75’) x 14 ppg – (1000’ + 4992’) x 8.55 ppg = 1755 psi.
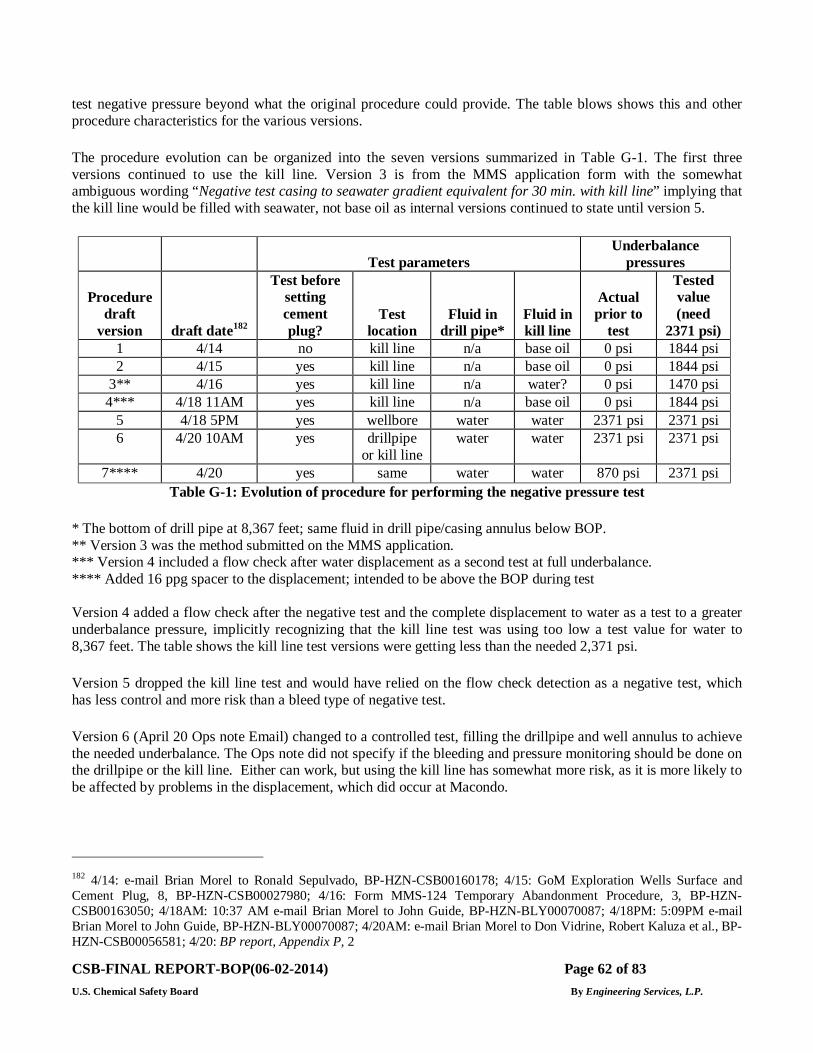
CSB-FINAL REPORT-BOP(06-02-2014) Page 62 of 83 U.S. Chemical Safety Board By Engineering Services, L.P.
test negative pressure beyond what the original procedure could provide. The table blows shows this and other procedure characteristics for the various versions.
The procedure evolution can be organized into the seven versions summarized in Table G-1. The first three versions continued to use the kill line. Version 3 is from the MMS application form with the somewhat ambiguous wording “Negative test casing to seawater gradient equivalent for 30 min. with kill line” implying that the kill line would be filled with seawater, not base oil as internal versions continued to state until version 5.
Test parameters
Underbalance pressures
Procedure draft
version draft date182
Test before setting cement plug?
Test location
Fluid in drill pipe*
Fluid in kill line
Actual prior to
test
Tested value (need
2371 psi) 1 4/14 no kill line n/a base oil 0 psi 1844 psi 2 4/15 yes kill line n/a base oil 0 psi 1844 psi
3** 4/16 yes kill line n/a water? 0 psi 1470 psi 4*** 4/18 11AM yes kill line n/a base oil 0 psi 1844 psi
5 4/18 5PM yes wellbore water water 2371 psi 2371 psi 6 4/20 10AM yes drillpipe
or kill line water water 2371 psi 2371 psi
7**** 4/20 yes same water water 870 psi 2371 psi Table G-1: Evolution of procedure for performing the negative pressure test
* The bottom of drill pipe at 8,367 feet; same fluid in drill pipe/casing annulus below BOP. ** Version 3 was the method submitted on the MMS application. *** Version 4 included a flow check after water displacement as a second test at full underbalance. **** Added 16 ppg spacer to the displacement; intended to be above the BOP during test Version 4 added a flow check after the negative test and the complete displacement to water as a test to a greater underbalance pressure, implicitly recognizing that the kill line test was using too low a test value for water to 8,367 feet. The table shows the kill line test versions were getting less than the needed 2,371 psi.
Version 5 dropped the kill line test and would have relied on the flow check detection as a negative test, which has less control and more risk than a bleed type of negative test.
Version 6 (April 20 Ops note Email) changed to a controlled test, filling the drillpipe and well annulus to achieve the needed underbalance. The Ops note did not specify if the bleeding and pressure monitoring should be done on the drillpipe or the kill line. Either can work, but using the kill line has somewhat more risk, as it is more likely to be affected by problems in the displacement, which did occur at Macondo.
182 4/14: e-mail Brian Morel to Ronald Sepulvado, BP-HZN-CSB00160178; 4/15: GoM Exploration Wells Surface and Cement Plug, 8, BP-HZN-CSB00027980; 4/16: Form MMS-124 Temporary Abandonment Procedure, 3, BP-HZN-CSB00163050; 4/18AM: 10:37 AM e-mail Brian Morel to John Guide, BP-HZN-BLY00070087; 4/18PM: 5:09PM e-mail Brian Morel to John Guide, BP-HZN-BLY00070087; 4/20AM: e-mail Brian Morel to Don Vidrine, Robert Kaluza et al., BP-HZN-CSB00056581; 4/20: BP report, Appendix P, 2
CSB-FINAL REPORT-BOP(06-02-2014) Page 63 of 83 U.S. Chemical Safety Board By Engineering Services, L.P.
This version called for displacing water all the way back up the annulus to the BOP. This condition allows for the test to be conducted on the kill line or the drillpipe, but it has the disadvantage of under-balancing the well prior to the test, as indicated in the table, much like Version 5. If the well does not have integrity and the underbalance is below reservoir pressure, the well will kick (take an influx) during the displacement, requiring crew detection and well control response.
A kick did not actually occur because an insufficient displacement left 2,000 feet of spacer below the BOP,183 so that only about a 380 psi underbalance was actually achieved on the annulus side, leaving wellbore pressure above bottom hole reservoir pressure.
A variation to avoid under-balancing the annulus would have been to displace only the drill pipe with water and limit the test to the drill pipe side. There is no evidence this was considered.
Version 7 included a large volume (over 400 bbls) of 16 ppg spacer fluid in the displacement, whose hydrostatic head in the riser reduced the amount of underbalance before and immediately after the test. As long as the dense spacer was completely in the riser, it should not have affected the test. As it turned out, spacer was in the BOP and the wellbore below, significantly affecting pressure and flow measurements on the kill line.
H. BOP Accumulator System
The DWH lower BOP accumulator system provided high pressure power fluid (4000 psig) for manual high-pressure (HP) BSR functions (including EDS) and for both the AMF and autoshear automatic emergency systems to close the BSR as well as any unset ST locks and any open choke and kill inner valves.184 This system had eight 80-gallon bottles and, once initiated, was designed to operate without assistance from surface hydraulic power. A smaller separate accumulator system of four 60-gallon bottles was on the LMRP to enhance the surface source for normal functions at a lower operating pressure (1500 psig).
How an accumulator works An accumulator system consists of multiple metallic bottles. Each bottle has an internal piston that separates its nitrogen gas precharge from subsequently pumped in high-pressure hydraulic fluid. Based on planned service conditions, the precharge pressure is calculated, and nitrogen gas is added or removed to set this pressure in each bottle before the BOP is run to the seafloor.
183 Estimates are based on an ES simulation. 184 Although DWH drawings indicate that only the BSR and ST-Locks are operated, examination of the BOP stack at Michoud revealed that all four inner CHOKE & KILL valves were also hooked up the AMF/deadman and autoshear systems.
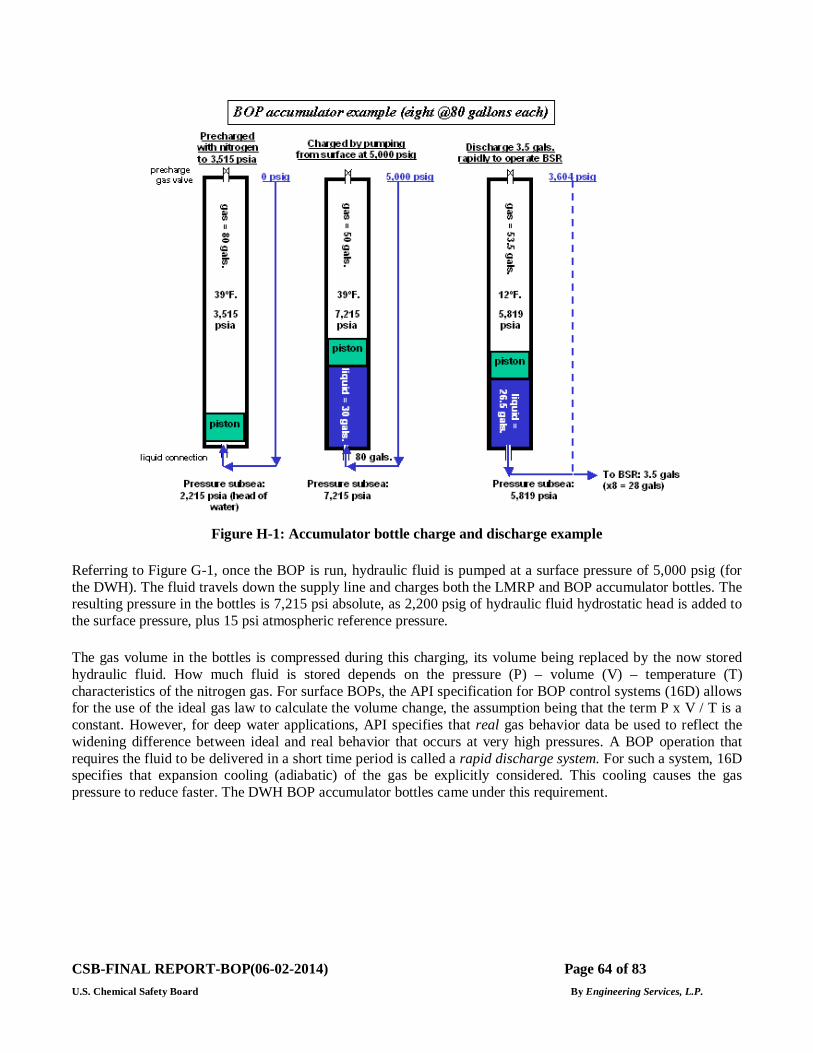
CSB-FINAL REPORT-BOP(06-02-2014) Page 64 of 83 U.S. Chemical Safety Board By Engineering Services, L.P.
Figure H-1: Accumulator bottle charge and discharge example
Referring to Figure G-1, once the BOP is run, hydraulic fluid is pumped at a surface pressure of 5,000 psig (for the DWH). The fluid travels down the supply line and charges both the LMRP and BOP accumulator bottles. The resulting pressure in the bottles is 7,215 psi absolute, as 2,200 psig of hydraulic fluid hydrostatic head is added to the surface pressure, plus 15 psi atmospheric reference pressure.
The gas volume in the bottles is compressed during this charging, its volume being replaced by the now stored hydraulic fluid. How much fluid is stored depends on the pressure (P) – volume (V) – temperature (T) characteristics of the nitrogen gas. For surface BOPs, the API specification for BOP control systems (16D) allows for the use of the ideal gas law to calculate the volume change, the assumption being that the term P x V / T is a constant. However, for deep water applications, API specifies that real gas behavior data be used to reflect the widening difference between ideal and real behavior that occurs at very high pressures. A BOP operation that requires the fluid to be delivered in a short time period is called a rapid discharge system. For such a system, 16D specifies that expansion cooling (adiabatic) of the gas be explicitly considered. This cooling causes the gas pressure to reduce faster. The DWH BOP accumulator bottles came under this requirement.
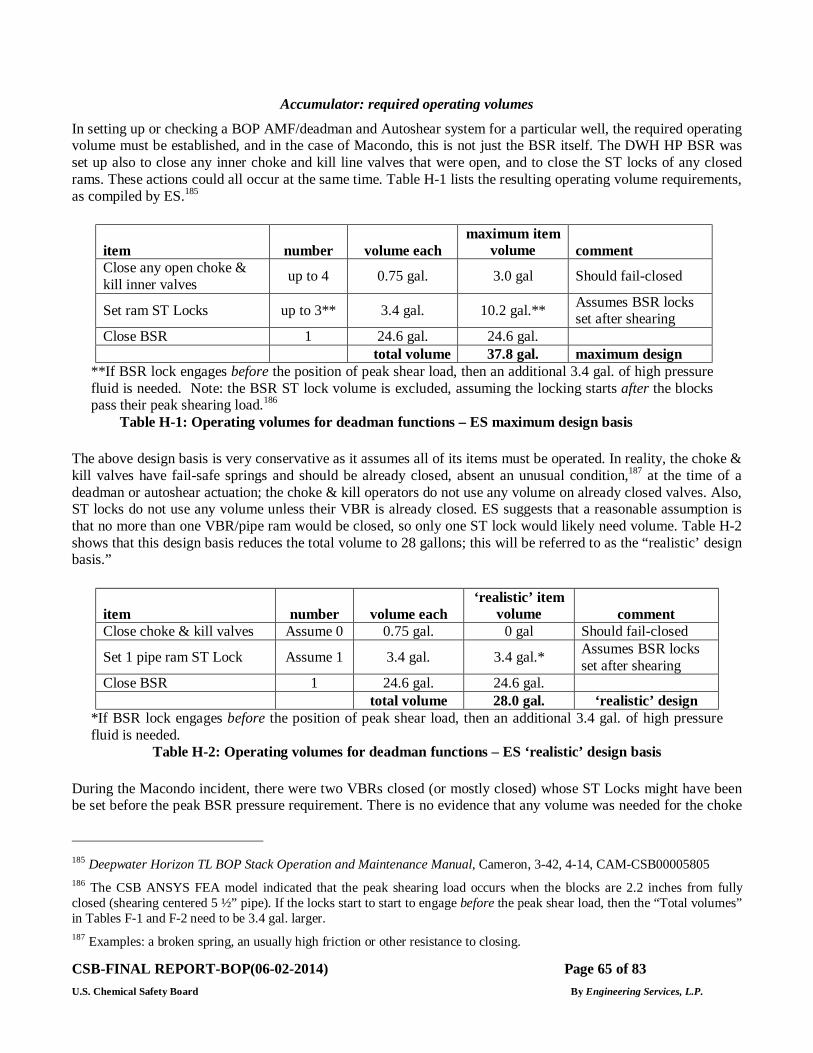
CSB-FINAL REPORT-BOP(06-02-2014) Page 65 of 83 U.S. Chemical Safety Board By Engineering Services, L.P.
Accumulator: required operating volumes
In setting up or checking a BOP AMF/deadman and Autoshear system for a particular well, the required operating volume must be established, and in the case of Macondo, this is not just the BSR itself. The DWH HP BSR was set up also to close any inner choke and kill line valves that were open, and to close the ST locks of any closed rams. These actions could all occur at the same time. Table H-1 lists the resulting operating volume requirements, as compiled by ES.185
item number volume each maximum item
volume comment Close any open choke & kill inner valves up to 4 0.75 gal. 3.0 gal Should fail-closed
Set ram ST Locks up to 3** 3.4 gal. 10.2 gal.** Assumes BSR locks set after shearing
Close BSR 1 24.6 gal. 24.6 gal. total volume 37.8 gal. maximum design
**If BSR lock engages before the position of peak shear load, then an additional 3.4 gal. of high pressure fluid is needed. Note: the BSR ST lock volume is excluded, assuming the locking starts after the blocks pass their peak shearing load.186
Table H-1: Operating volumes for deadman functions – ES maximum design basis
The above design basis is very conservative as it assumes all of its items must be operated. In reality, the choke & kill valves have fail-safe springs and should be already closed, absent an unusual condition,187 at the time of a deadman or autoshear actuation; the choke & kill operators do not use any volume on already closed valves. Also, ST locks do not use any volume unless their VBR is already closed. ES suggests that a reasonable assumption is that no more than one VBR/pipe ram would be closed, so only one ST lock would likely need volume. Table H-2 shows that this design basis reduces the total volume to 28 gallons; this will be referred to as the “realistic’ design basis.”
item number volume each ‘realistic’ item
volume comment Close choke & kill valves Assume 0 0.75 gal. 0 gal Should fail-closed
Set 1 pipe ram ST Lock Assume 1 3.4 gal. 3.4 gal.* Assumes BSR locks set after shearing
Close BSR 1 24.6 gal. 24.6 gal. total volume 28.0 gal. ‘realistic’ design
*If BSR lock engages before the position of peak shear load, then an additional 3.4 gal. of high pressure fluid is needed.
Table H-2: Operating volumes for deadman functions – ES ‘realistic’ design basis
During the Macondo incident, there were two VBRs closed (or mostly closed) whose ST Locks might have been be set before the peak BSR pressure requirement. There is no evidence that any volume was needed for the choke
185 Deepwater Horizon TL BOP Stack Operation and Maintenance Manual, Cameron, 3-42, 4-14, CAM-CSB00005805 186 The CSB ANSYS FEA model indicated that the peak shearing load occurs when the blocks are 2.2 inches from fully closed (shearing centered 5 ½” pipe). If the locks start to start to engage before the peak shear load, then the “Total volumes” in Tables F-1 and F-2 need to be 3.4 gal. larger. 187 Examples: a broken spring, an usually high friction or other resistance to closing.
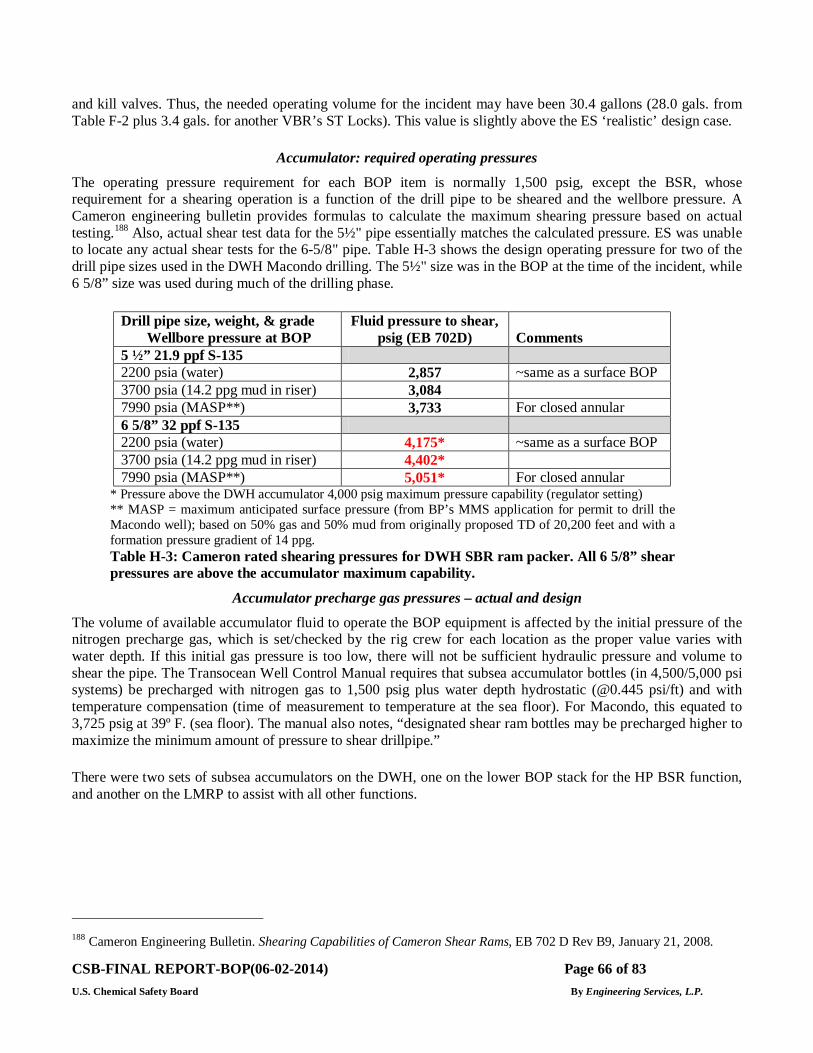
CSB-FINAL REPORT-BOP(06-02-2014) Page 66 of 83 U.S. Chemical Safety Board By Engineering Services, L.P.
and kill valves. Thus, the needed operating volume for the incident may have been 30.4 gallons (28.0 gals. from Table F-2 plus 3.4 gals. for another VBR’s ST Locks). This value is slightly above the ES ‘realistic’ design case.
Accumulator: required operating pressures
The operating pressure requirement for each BOP item is normally 1,500 psig, except the BSR, whose requirement for a shearing operation is a function of the drill pipe to be sheared and the wellbore pressure. A Cameron engineering bulletin provides formulas to calculate the maximum shearing pressure based on actual testing.188 Also, actual shear test data for the 5½" pipe essentially matches the calculated pressure. ES was unable to locate any actual shear tests for the 6-5/8" pipe. Table H-3 shows the design operating pressure for two of the drill pipe sizes used in the DWH Macondo drilling. The 5½" size was in the BOP at the time of the incident, while 6 5/8” size was used during much of the drilling phase.
Drill pipe size, weight, & grade Wellbore pressure at BOP
Fluid pressure to shear, psig (EB 702D) Comments
5 ½” 21.9 ppf S-135 2200 psia (water) 2,857 ~same as a surface BOP 3700 psia (14.2 ppg mud in riser) 3,084 7990 psia (MASP**) 3,733 For closed annular 6 5/8” 32 ppf S-135 2200 psia (water) 4,175* ~same as a surface BOP 3700 psia (14.2 ppg mud in riser) 4,402* 7990 psia (MASP**) 5,051* For closed annular
* Pressure above the DWH accumulator 4,000 psig maximum pressure capability (regulator setting) ** MASP = maximum anticipated surface pressure (from BP’s MMS application for permit to drill the Macondo well); based on 50% gas and 50% mud from originally proposed TD of 20,200 feet and with a formation pressure gradient of 14 ppg. Table H-3: Cameron rated shearing pressures for DWH SBR ram packer. All 6 5/8” shear pressures are above the accumulator maximum capability.
Accumulator precharge gas pressures – actual and design
The volume of available accumulator fluid to operate the BOP equipment is affected by the initial pressure of the nitrogen precharge gas, which is set/checked by the rig crew for each location as the proper value varies with water depth. If this initial gas pressure is too low, there will not be sufficient hydraulic pressure and volume to shear the pipe. The Transocean Well Control Manual requires that subsea accumulator bottles (in 4,500/5,000 psi systems) be precharged with nitrogen gas to 1,500 psig plus water depth hydrostatic (@0.445 psi/ft) and with temperature compensation (time of measurement to temperature at the sea floor). For Macondo, this equated to 3,725 psig at 39º F. (sea floor). The manual also notes, “designated shear ram bottles may be precharged higher to maximize the minimum amount of pressure to shear drillpipe.”
There were two sets of subsea accumulators on the DWH, one on the lower BOP stack for the HP BSR function, and another on the LMRP to assist with all other functions.
188 Cameron Engineering Bulletin. Shearing Capabilities of Cameron Shear Rams, EB 702 D Rev B9, January 21, 2008.
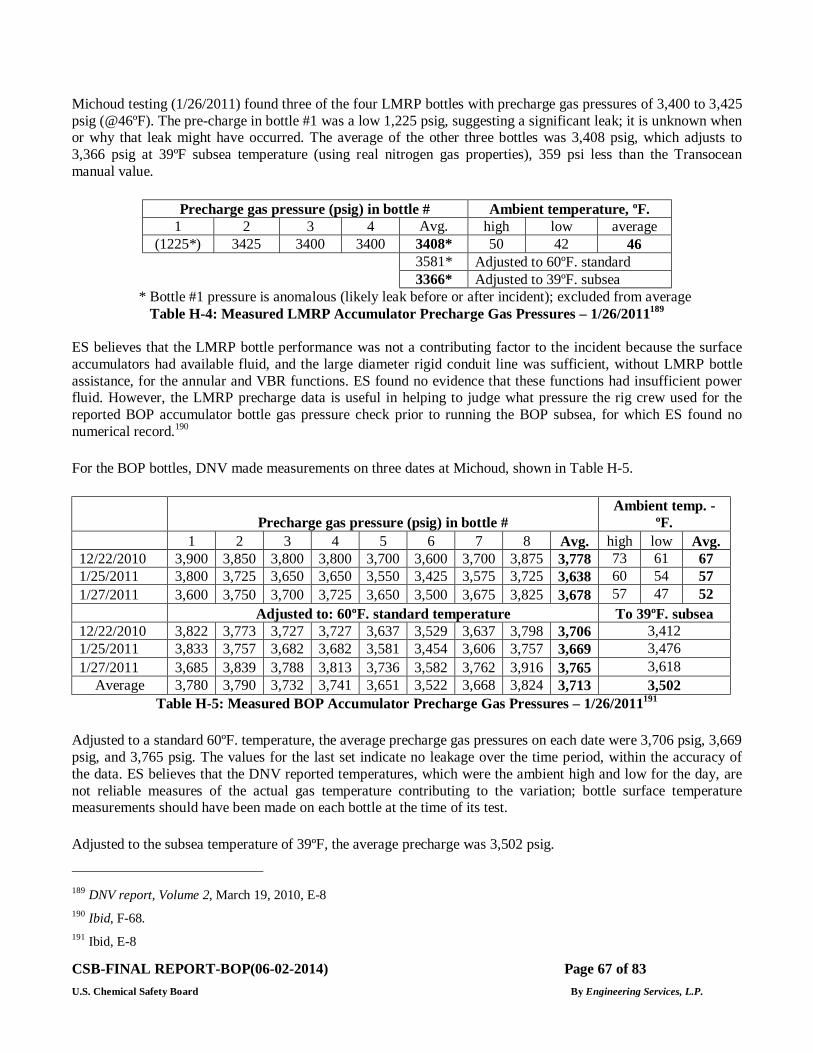
CSB-FINAL REPORT-BOP(06-02-2014) Page 67 of 83 U.S. Chemical Safety Board By Engineering Services, L.P.
Michoud testing (1/26/2011) found three of the four LMRP bottles with precharge gas pressures of 3,400 to 3,425 psig (@46ºF). The pre-charge in bottle #1 was a low 1,225 psig, suggesting a significant leak; it is unknown when or why that leak might have occurred. The average of the other three bottles was 3,408 psig, which adjusts to 3,366 psig at 39ºF subsea temperature (using real nitrogen gas properties), 359 psi less than the Transocean manual value.
Precharge gas pressure (psig) in bottle # Ambient temperature, ºF. 1 2 3 4 Avg. high low average
(1225*) 3425 3400 3400 3408* 50 42 46 3581* Adjusted to 60ºF. standard 3366* Adjusted to 39ºF. subsea
* Bottle #1 pressure is anomalous (likely leak before or after incident); excluded from average Table H-4: Measured LMRP Accumulator Precharge Gas Pressures – 1/26/2011189
ES believes that the LMRP bottle performance was not a contributing factor to the incident because the surface accumulators had available fluid, and the large diameter rigid conduit line was sufficient, without LMRP bottle assistance, for the annular and VBR functions. ES found no evidence that these functions had insufficient power fluid. However, the LMRP precharge data is useful in helping to judge what pressure the rig crew used for the reported BOP accumulator bottle gas pressure check prior to running the BOP subsea, for which ES found no numerical record.190
For the BOP bottles, DNV made measurements on three dates at Michoud, shown in Table H-5.
Precharge gas pressure (psig) in bottle # Ambient temp. -
ºF. 1 2 3 4 5 6 7 8 Avg. high low Avg. 12/22/2010 3,900 3,850 3,800 3,800 3,700 3,600 3,700 3,875 3,778 73 61 67 1/25/2011 3,800 3,725 3,650 3,650 3,550 3,425 3,575 3,725 3,638 60 54 57 1/27/2011 3,600 3,750 3,700 3,725 3,650 3,500 3,675 3,825 3,678 57 47 52 Adjusted to: 60ºF. standard temperature To 39ºF. subsea 12/22/2010 3,822 3,773 3,727 3,727 3,637 3,529 3,637 3,798 3,706 3,412 1/25/2011 3,833 3,757 3,682 3,682 3,581 3,454 3,606 3,757 3,669 3,476 1/27/2011 3,685 3,839 3,788 3,813 3,736 3,582 3,762 3,916 3,765 3,618
Average 3,780 3,790 3,732 3,741 3,651 3,522 3,668 3,824 3,713 3,502 Table H-5: Measured BOP Accumulator Precharge Gas Pressures – 1/26/2011191
Adjusted to a standard 60ºF. temperature, the average precharge gas pressures on each date were 3,706 psig, 3,669 psig, and 3,765 psig. The values for the last set indicate no leakage over the time period, within the accuracy of the data. ES believes that the DNV reported temperatures, which were the ambient high and low for the day, are not reliable measures of the actual gas temperature contributing to the variation; bottle surface temperature measurements should have been made on each bottle at the time of its test.
Adjusted to the subsea temperature of 39ºF, the average precharge was 3,502 psig.
189 DNV report, Volume 2, March 19, 2010, E-8 190 Ibid, F-68. 191 Ibid, E-8
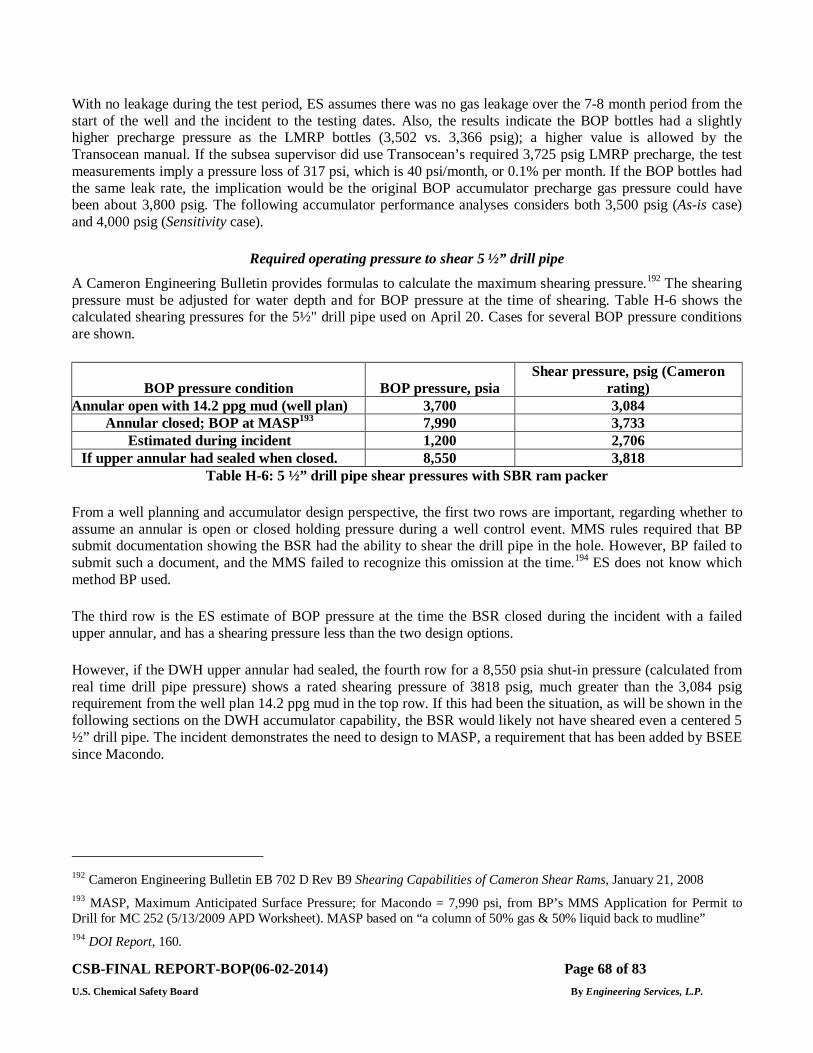
CSB-FINAL REPORT-BOP(06-02-2014) Page 68 of 83 U.S. Chemical Safety Board By Engineering Services, L.P.
With no leakage during the test period, ES assumes there was no gas leakage over the 7-8 month period from the start of the well and the incident to the testing dates. Also, the results indicate the BOP bottles had a slightly higher precharge pressure as the LMRP bottles (3,502 vs. 3,366 psig); a higher value is allowed by the Transocean manual. If the subsea supervisor did use Transocean’s required 3,725 psig LMRP precharge, the test measurements imply a pressure loss of 317 psi, which is 40 psi/month, or 0.1% per month. If the BOP bottles had the same leak rate, the implication would be the original BOP accumulator precharge gas pressure could have been about 3,800 psig. The following accumulator performance analyses considers both 3,500 psig (As-is case) and 4,000 psig (Sensitivity case).
Required operating pressure to shear 5 ½” drill pipe
A Cameron Engineering Bulletin provides formulas to calculate the maximum shearing pressure.192 The shearing pressure must be adjusted for water depth and for BOP pressure at the time of shearing. Table H-6 shows the calculated shearing pressures for the 5½" drill pipe used on April 20. Cases for several BOP pressure conditions are shown.
BOP pressure condition BOP pressure, psia Shear pressure, psig (Cameron
rating) Annular open with 14.2 ppg mud (well plan) 3,700 3,084
Annular closed; BOP at MASP193 7,990 3,733 Estimated during incident 1,200 2,706
If upper annular had sealed when closed. 8,550 3,818 Table H-6: 5 ½” drill pipe shear pressures with SBR ram packer
From a well planning and accumulator design perspective, the first two rows are important, regarding whether to assume an annular is open or closed holding pressure during a well control event. MMS rules required that BP submit documentation showing the BSR had the ability to shear the drill pipe in the hole. However, BP failed to submit such a document, and the MMS failed to recognize this omission at the time.194 ES does not know which method BP used.
The third row is the ES estimate of BOP pressure at the time the BSR closed during the incident with a failed upper annular, and has a shearing pressure less than the two design options.
However, if the DWH upper annular had sealed, the fourth row for a 8,550 psia shut-in pressure (calculated from real time drill pipe pressure) shows a rated shearing pressure of 3818 psig, much greater than the 3,084 psig requirement from the well plan 14.2 ppg mud in the top row. If this had been the situation, as will be shown in the following sections on the DWH accumulator capability, the BSR would likely not have sheared even a centered 5 ½” drill pipe. The incident demonstrates the need to design to MASP, a requirement that has been added by BSEE since Macondo.
192 Cameron Engineering Bulletin EB 702 D Rev B9 Shearing Capabilities of Cameron Shear Rams, January 21, 2008 193 MASP, Maximum Anticipated Surface Pressure; for Macondo = 7,990 psi, from BP’s MMS Application for Permit to Drill for MC 252 (5/13/2009 APD Worksheet). MASP based on “a column of 50% gas & 50% liquid back to mudline” 194 DOI Report, 160.
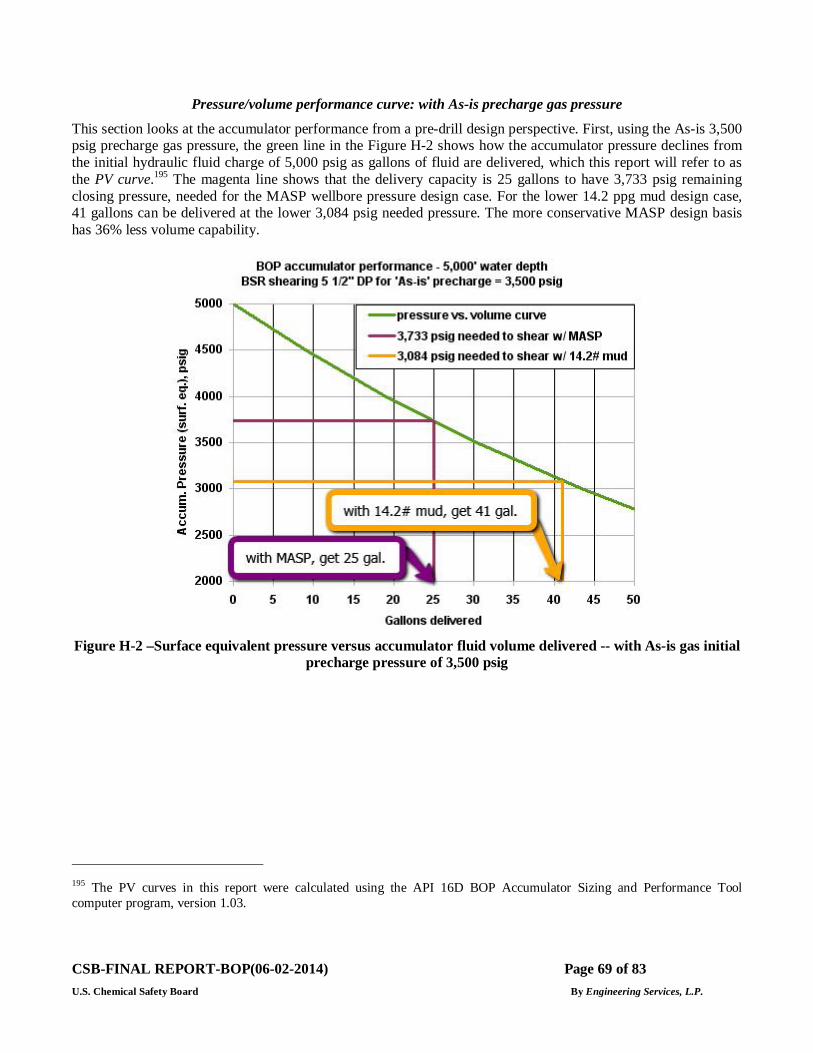
CSB-FINAL REPORT-BOP(06-02-2014) Page 69 of 83 U.S. Chemical Safety Board By Engineering Services, L.P.
Pressure/volume performance curve: with As-is precharge gas pressure
This section looks at the accumulator performance from a pre-drill design perspective. First, using the As-is 3,500 psig precharge gas pressure, the green line in the Figure H-2 shows how the accumulator pressure declines from the initial hydraulic fluid charge of 5,000 psig as gallons of fluid are delivered, which this report will refer to as the PV curve.195 The magenta line shows that the delivery capacity is 25 gallons to have 3,733 psig remaining closing pressure, needed for the MASP wellbore pressure design case. For the lower 14.2 ppg mud design case, 41 gallons can be delivered at the lower 3,084 psig needed pressure. The more conservative MASP design basis has 36% less volume capability.
Figure H-2 –Surface equivalent pressure versus accumulator fluid volume delivered -- with As-is gas initial
precharge pressure of 3,500 psig
195 The PV curves in this report were calculated using the API 16D BOP Accumulator Sizing and Performance Tool computer program, version 1.03.
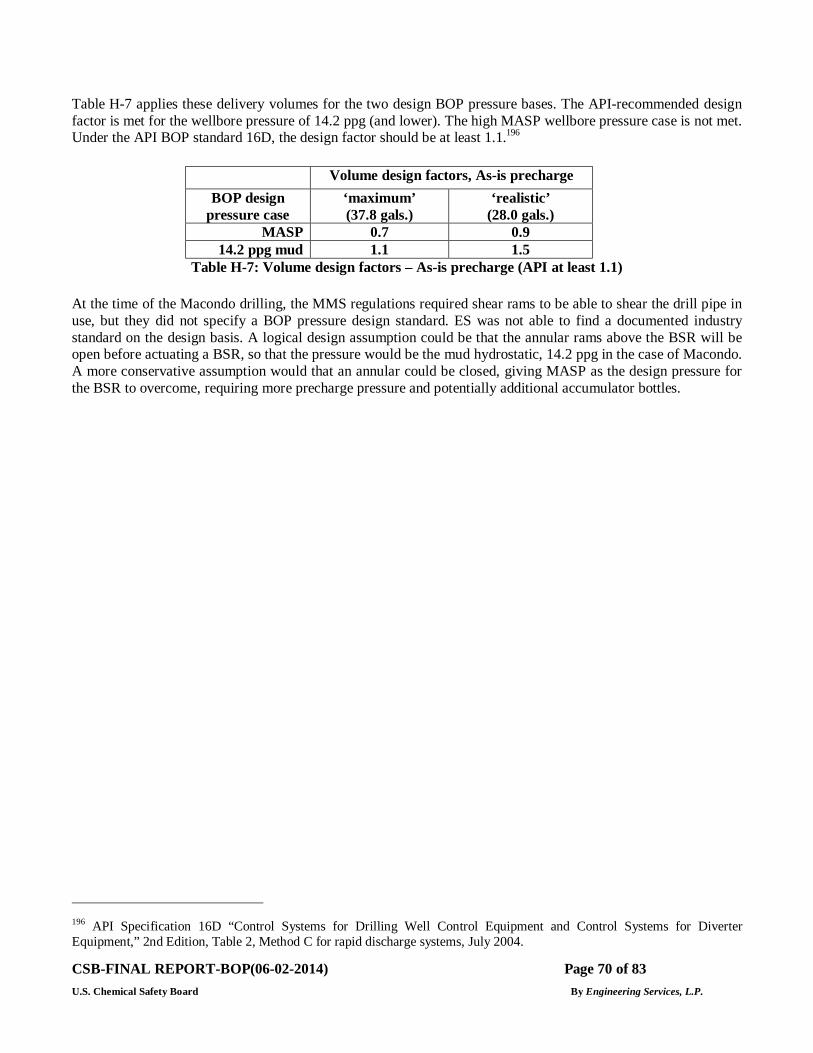
CSB-FINAL REPORT-BOP(06-02-2014) Page 70 of 83 U.S. Chemical Safety Board By Engineering Services, L.P.
Table H-7 applies these delivery volumes for the two design BOP pressure bases. The API-recommended design factor is met for the wellbore pressure of 14.2 ppg (and lower). The high MASP wellbore pressure case is not met. Under the API BOP standard 16D, the design factor should be at least 1.1.196
Volume design factors, As-is precharge BOP design
pressure case ‘maximum’ (37.8 gals.)
‘realistic’ (28.0 gals.)
MASP 0.7 0.9 14.2 ppg mud 1.1 1.5
Table H-7: Volume design factors – As-is precharge (API at least 1.1)
At the time of the Macondo drilling, the MMS regulations required shear rams to be able to shear the drill pipe in use, but they did not specify a BOP pressure design standard. ES was not able to find a documented industry standard on the design basis. A logical design assumption could be that the annular rams above the BSR will be open before actuating a BSR, so that the pressure would be the mud hydrostatic, 14.2 ppg in the case of Macondo. A more conservative assumption would that an annular could be closed, giving MASP as the design pressure for the BSR to overcome, requiring more precharge pressure and potentially additional accumulator bottles.
196 API Specification 16D “Control Systems for Drilling Well Control Equipment and Control Systems for Diverter Equipment,” 2nd Edition, Table 2, Method C for rapid discharge systems, July 2004.
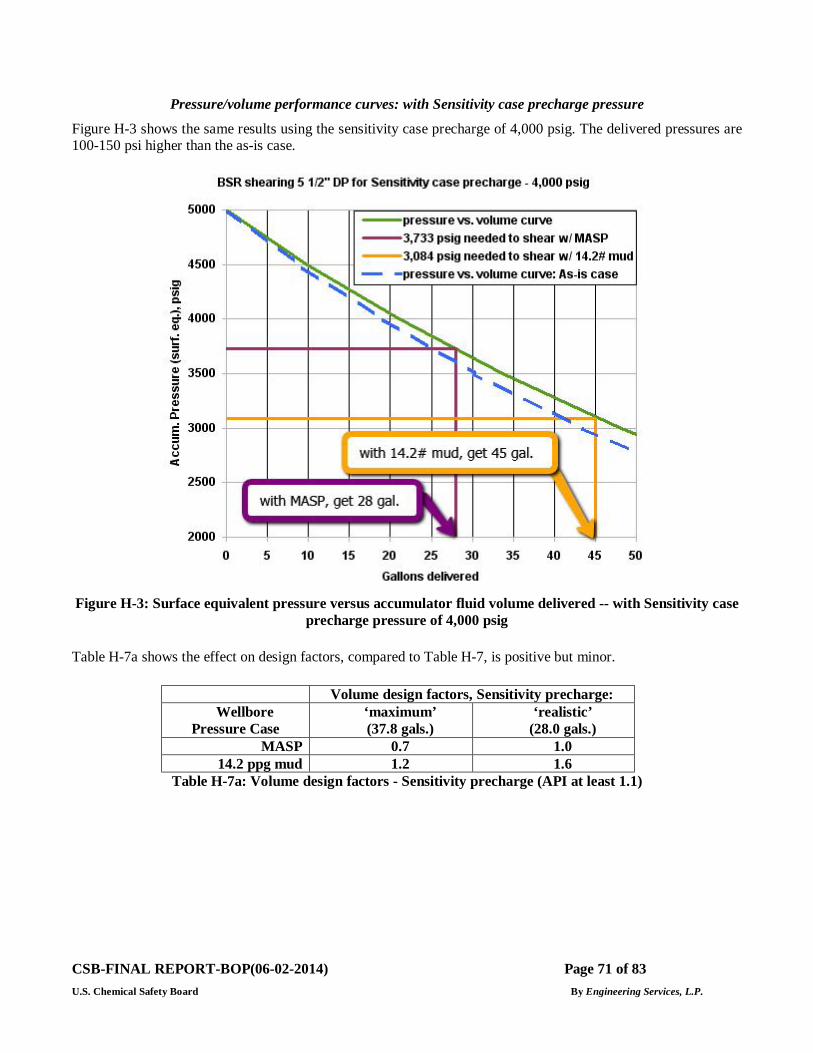
CSB-FINAL REPORT-BOP(06-02-2014) Page 71 of 83 U.S. Chemical Safety Board By Engineering Services, L.P.
Pressure/volume performance curves: with Sensitivity case precharge pressure
Figure H-3 shows the same results using the sensitivity case precharge of 4,000 psig. The delivered pressures are 100-150 psi higher than the as-is case.
Figure H-3: Surface equivalent pressure versus accumulator fluid volume delivered -- with Sensitivity case
precharge pressure of 4,000 psig
Table H-7a shows the effect on design factors, compared to Table H-7, is positive but minor.
Volume design factors, Sensitivity precharge: Wellbore
Pressure Case ‘maximum’ (37.8 gals.)
‘realistic’ (28.0 gals.)
MASP 0.7 1.0 14.2 ppg mud 1.2 1.6
Table H-7a: Volume design factors - Sensitivity precharge (API at least 1.1)
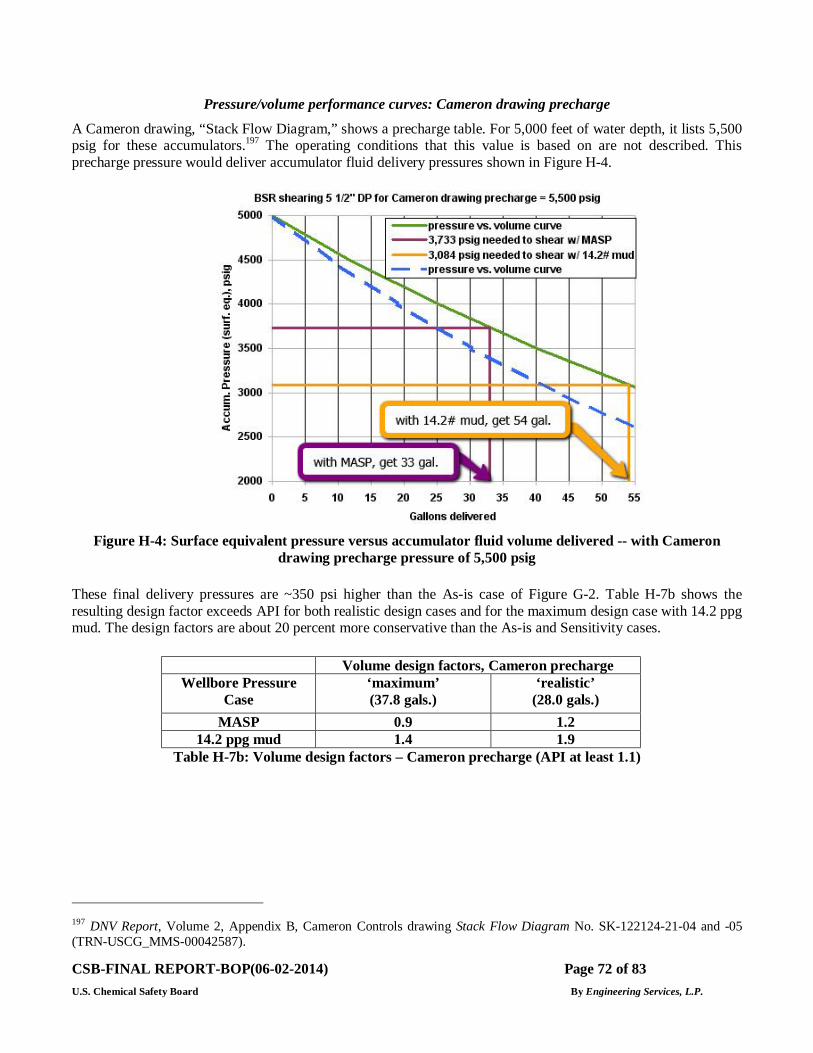
CSB-FINAL REPORT-BOP(06-02-2014) Page 72 of 83 U.S. Chemical Safety Board By Engineering Services, L.P.
Pressure/volume performance curves: Cameron drawing precharge
A Cameron drawing, “Stack Flow Diagram,” shows a precharge table. For 5,000 feet of water depth, it lists 5,500 psig for these accumulators.197 The operating conditions that this value is based on are not described. This precharge pressure would deliver accumulator fluid delivery pressures shown in Figure H-4.
Figure H-4: Surface equivalent pressure versus accumulator fluid volume delivered -- with Cameron
drawing precharge pressure of 5,500 psig
These final delivery pressures are ~350 psi higher than the As-is case of Figure G-2. Table H-7b shows the resulting design factor exceeds API for both realistic design cases and for the maximum design case with 14.2 ppg mud. The design factors are about 20 percent more conservative than the As-is and Sensitivity cases.
Volume design factors, Cameron precharge Wellbore Pressure
Case ‘maximum’ (37.8 gals.)
‘realistic’ (28.0 gals.)
MASP 0.9 1.2 14.2 ppg mud 1.4 1.9
Table H-7b: Volume design factors – Cameron precharge (API at least 1.1)
197 DNV Report, Volume 2, Appendix B, Cameron Controls drawing Stack Flow Diagram No. SK-122124-21-04 and -05 (TRN-USCG_MMS-00042587).
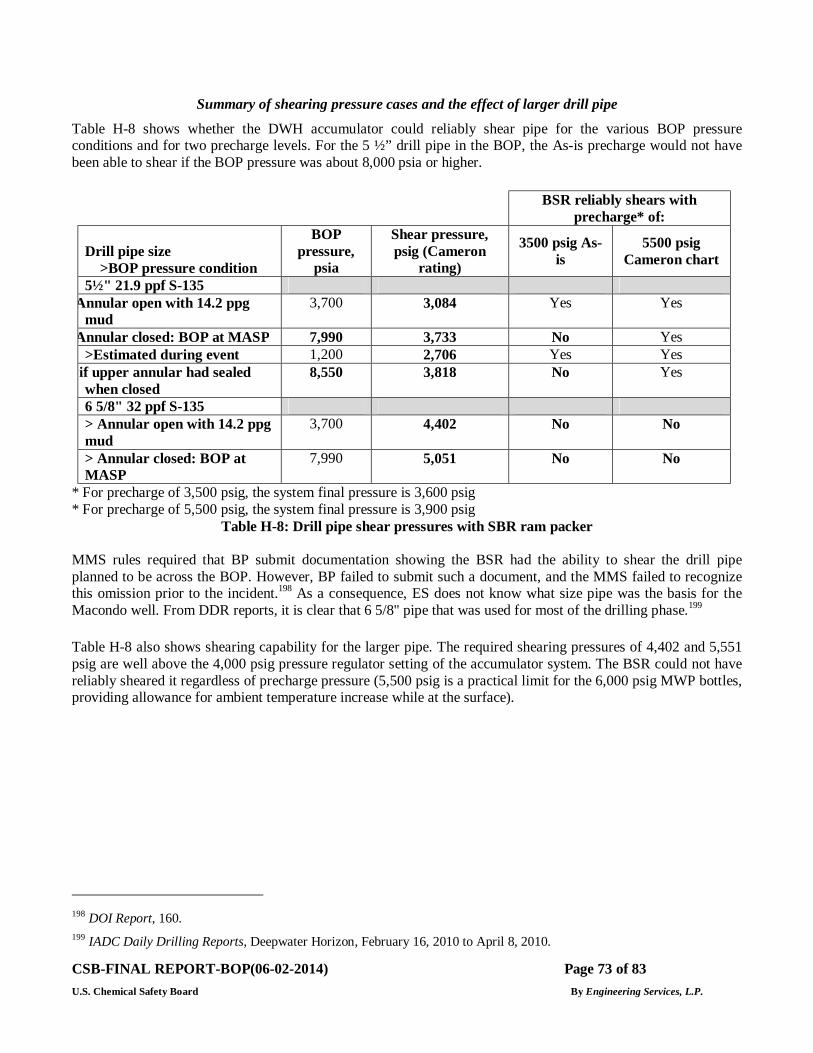
CSB-FINAL REPORT-BOP(06-02-2014) Page 73 of 83 U.S. Chemical Safety Board By Engineering Services, L.P.
Summary of shearing pressure cases and the effect of larger drill pipe
Table H-8 shows whether the DWH accumulator could reliably shear pipe for the various BOP pressure conditions and for two precharge levels. For the 5 ½” drill pipe in the BOP, the As-is precharge would not have been able to shear if the BOP pressure was about 8,000 psia or higher.
BSR reliably shears with precharge* of:
Drill pipe size >BOP pressure condition
BOP pressure,
psia
Shear pressure, psig (Cameron
rating)
3500 psig As-is
5500 psig Cameron chart
5½" 21.9 ppf S-135 Annular open with 14.2 ppg
mud 3,700 3,084 Yes Yes
Annular closed: BOP at MASP 7,990 3,733 No Yes >Estimated during event 1,200 2,706 Yes Yes
> if upper annular had sealed when closed
8,550 3,818 No Yes
6 5/8" 32 ppf S-135 > Annular open with 14.2 ppg mud
3,700 4,402 No No
> Annular closed: BOP at MASP
7,990 5,051 No No
* For precharge of 3,500 psig, the system final pressure is 3,600 psig * For precharge of 5,500 psig, the system final pressure is 3,900 psig
Table H-8: Drill pipe shear pressures with SBR ram packer
MMS rules required that BP submit documentation showing the BSR had the ability to shear the drill pipe planned to be across the BOP. However, BP failed to submit such a document, and the MMS failed to recognize this omission prior to the incident.198 As a consequence, ES does not know what size pipe was the basis for the Macondo well. From DDR reports, it is clear that 6 5/8" pipe that was used for most of the drilling phase.199
Table H-8 also shows shearing capability for the larger pipe. The required shearing pressures of 4,402 and 5,551 psig are well above the 4,000 psig pressure regulator setting of the accumulator system. The BSR could not have reliably sheared it regardless of precharge pressure (5,500 psig is a practical limit for the 6,000 psig MWP bottles, providing allowance for ambient temperature increase while at the surface).
198 DOI Report, 160. 199 IADC Daily Drilling Reports, Deepwater Horizon, February 16, 2010 to April 8, 2010.
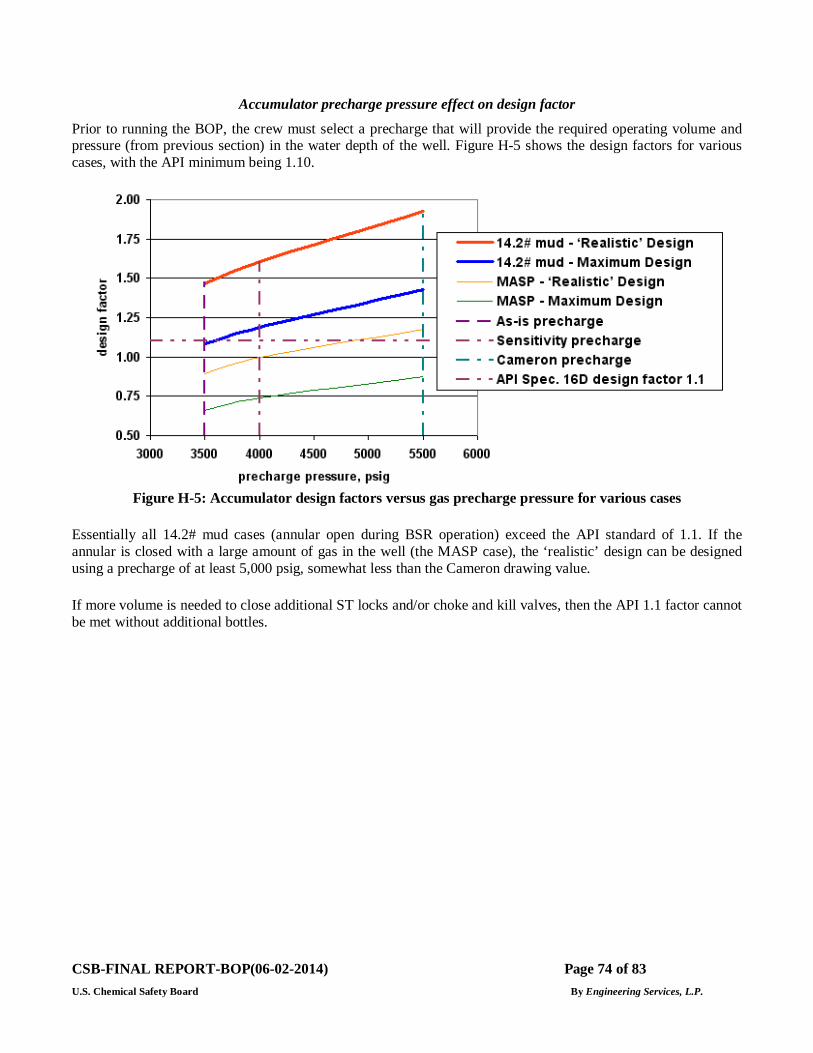
CSB-FINAL REPORT-BOP(06-02-2014) Page 74 of 83 U.S. Chemical Safety Board By Engineering Services, L.P.
Accumulator precharge pressure effect on design factor
Prior to running the BOP, the crew must select a precharge that will provide the required operating volume and pressure (from previous section) in the water depth of the well. Figure H-5 shows the design factors for various cases, with the API minimum being 1.10.
Figure H-5: Accumulator design factors versus gas precharge pressure for various cases
Essentially all 14.2# mud cases (annular open during BSR operation) exceed the API standard of 1.1. If the annular is closed with a large amount of gas in the well (the MASP case), the ‘realistic’ design can be designed using a precharge of at least 5,000 psig, somewhat less than the Cameron drawing value.
If more volume is needed to close additional ST locks and/or choke and kill valves, then the API 1.1 factor cannot be met without additional bottles.
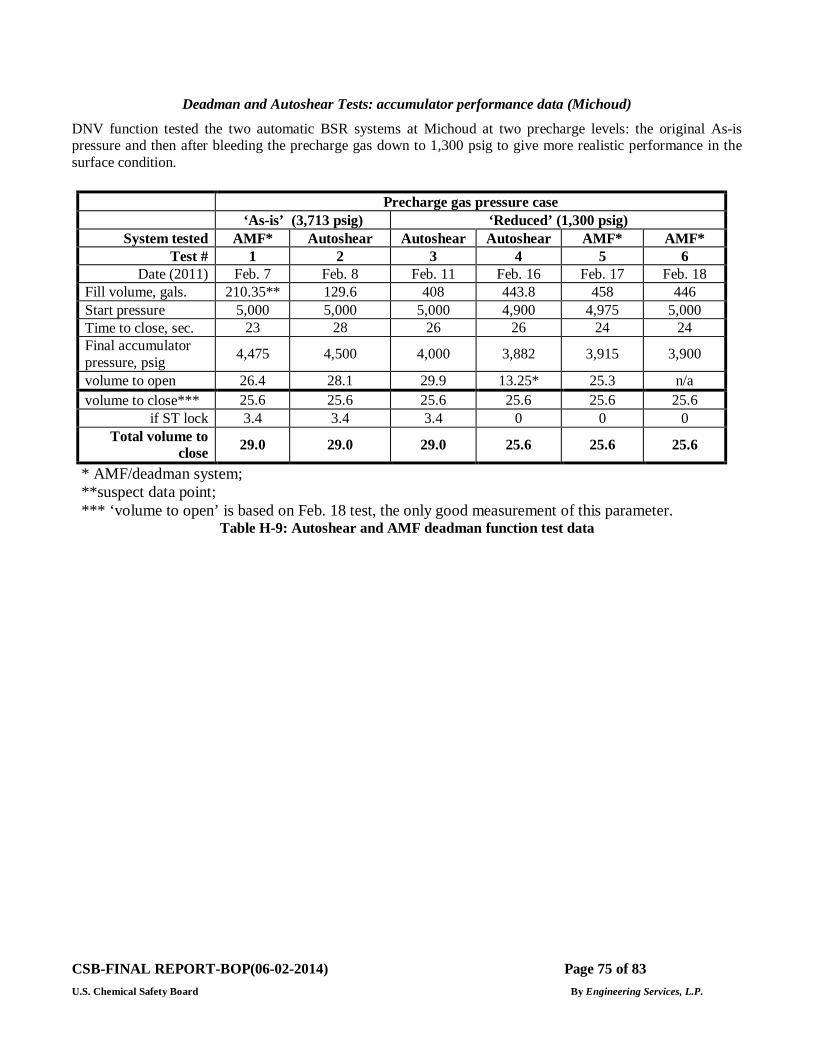
CSB-FINAL REPORT-BOP(06-02-2014) Page 75 of 83 U.S. Chemical Safety Board By Engineering Services, L.P.
Deadman and Autoshear Tests: accumulator performance data (Michoud)
DNV function tested the two automatic BSR systems at Michoud at two precharge levels: the original As-is pressure and then after bleeding the precharge gas down to 1,300 psig to give more realistic performance in the surface condition.
Precharge gas pressure case ‘As-is’ (3,713 psig) ‘Reduced’ (1,300 psig)
System tested AMF* Autoshear Autoshear Autoshear AMF* AMF* Test # 1 2 3 4 5 6
Date (2011) Feb. 7 Feb. 8 Feb. 11 Feb. 16 Feb. 17 Feb. 18 Fill volume, gals. 210.35** 129.6 408 443.8 458 446 Start pressure 5,000 5,000 5,000 4,900 4,975 5,000 Time to close, sec. 23 28 26 26 24 24 Final accumulator pressure, psig 4,475 4,500 4,000 3,882 3,915 3,900
volume to open 26.4 28.1 29.9 13.25* 25.3 n/a volume to close*** 25.6 25.6 25.6 25.6 25.6 25.6
if ST lock 3.4 3.4 3.4 0 0 0 Total volume to
close 29.0 29.0 29.0 25.6 25.6 25.6
* AMF/deadman system; **suspect data point; *** ‘volume to open’ is based on Feb. 18 test, the only good measurement of this parameter.
Table H-9: Autoshear and AMF deadman function test data
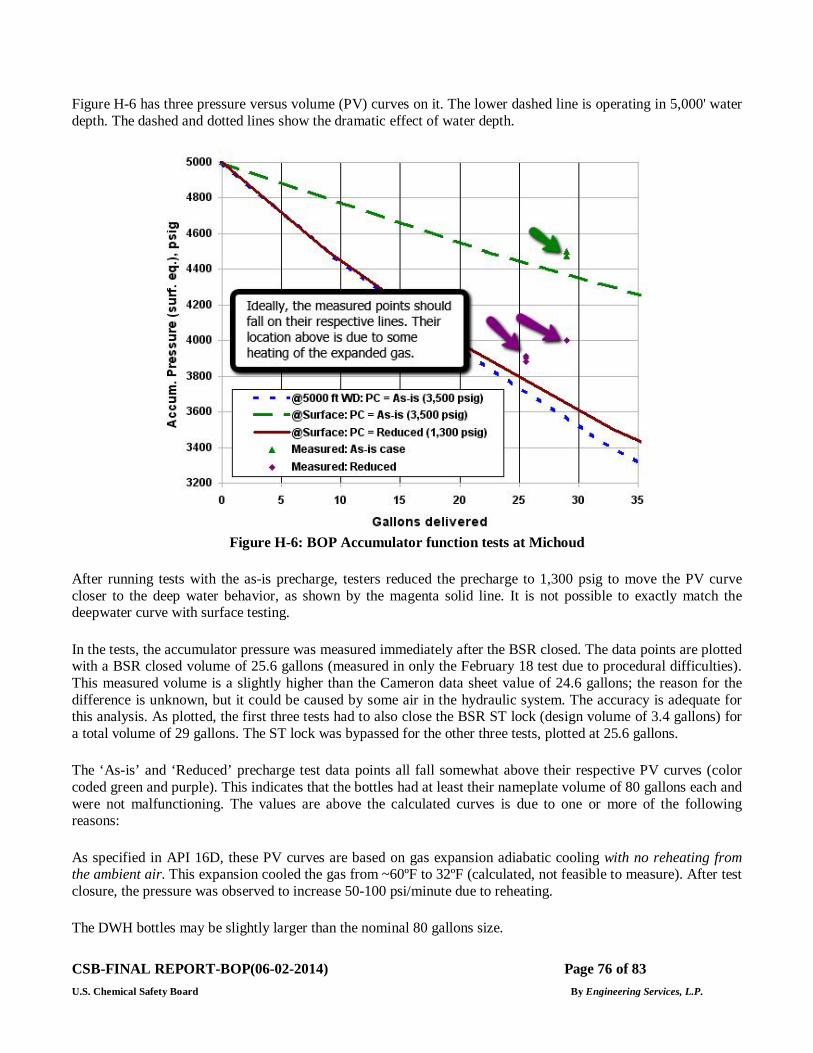
CSB-FINAL REPORT-BOP(06-02-2014) Page 76 of 83 U.S. Chemical Safety Board By Engineering Services, L.P.
Figure H-6 has three pressure versus volume (PV) curves on it. The lower dashed line is operating in 5,000' water depth. The dashed and dotted lines show the dramatic effect of water depth.
Figure H-6: BOP Accumulator function tests at Michoud
After running tests with the as-is precharge, testers reduced the precharge to 1,300 psig to move the PV curve closer to the deep water behavior, as shown by the magenta solid line. It is not possible to exactly match the deepwater curve with surface testing.
In the tests, the accumulator pressure was measured immediately after the BSR closed. The data points are plotted with a BSR closed volume of 25.6 gallons (measured in only the February 18 test due to procedural difficulties). This measured volume is a slightly higher than the Cameron data sheet value of 24.6 gallons; the reason for the difference is unknown, but it could be caused by some air in the hydraulic system. The accuracy is adequate for this analysis. As plotted, the first three tests had to also close the BSR ST lock (design volume of 3.4 gallons) for a total volume of 29 gallons. The ST lock was bypassed for the other three tests, plotted at 25.6 gallons.
The ‘As-is’ and ‘Reduced’ precharge test data points all fall somewhat above their respective PV curves (color coded green and purple). This indicates that the bottles had at least their nameplate volume of 80 gallons each and were not malfunctioning. The values are above the calculated curves is due to one or more of the following reasons:
As specified in API 16D, these PV curves are based on gas expansion adiabatic cooling with no reheating from the ambient air. This expansion cooled the gas from ~60ºF to 32ºF (calculated, not feasible to measure). After test closure, the pressure was observed to increase 50-100 psi/minute due to reheating.
The DWH bottles may be slightly larger than the nominal 80 gallons size.
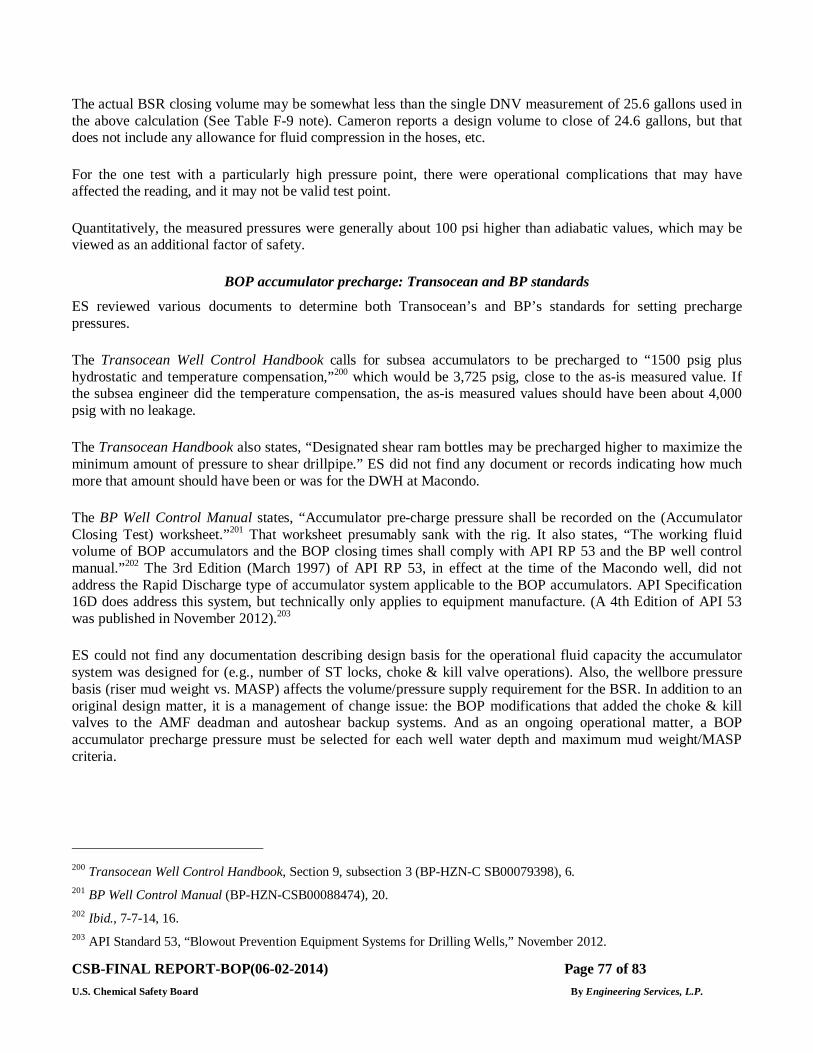
CSB-FINAL REPORT-BOP(06-02-2014) Page 77 of 83 U.S. Chemical Safety Board By Engineering Services, L.P.
The actual BSR closing volume may be somewhat less than the single DNV measurement of 25.6 gallons used in the above calculation (See Table F-9 note). Cameron reports a design volume to close of 24.6 gallons, but that does not include any allowance for fluid compression in the hoses, etc.
For the one test with a particularly high pressure point, there were operational complications that may have affected the reading, and it may not be valid test point.
Quantitatively, the measured pressures were generally about 100 psi higher than adiabatic values, which may be viewed as an additional factor of safety.
BOP accumulator precharge: Transocean and BP standards
ES reviewed various documents to determine both Transocean’s and BP’s standards for setting precharge pressures.
The Transocean Well Control Handbook calls for subsea accumulators to be precharged to “1500 psig plus hydrostatic and temperature compensation,”200 which would be 3,725 psig, close to the as-is measured value. If the subsea engineer did the temperature compensation, the as-is measured values should have been about 4,000 psig with no leakage.
The Transocean Handbook also states, “Designated shear ram bottles may be precharged higher to maximize the minimum amount of pressure to shear drillpipe.” ES did not find any document or records indicating how much more that amount should have been or was for the DWH at Macondo.
The BP Well Control Manual states, “Accumulator pre-charge pressure shall be recorded on the (Accumulator Closing Test) worksheet.”201 That worksheet presumably sank with the rig. It also states, “The working fluid volume of BOP accumulators and the BOP closing times shall comply with API RP 53 and the BP well control manual.”202 The 3rd Edition (March 1997) of API RP 53, in effect at the time of the Macondo well, did not address the Rapid Discharge type of accumulator system applicable to the BOP accumulators. API Specification 16D does address this system, but technically only applies to equipment manufacture. (A 4th Edition of API 53 was published in November 2012).203
ES could not find any documentation describing design basis for the operational fluid capacity the accumulator system was designed for (e.g., number of ST locks, choke & kill valve operations). Also, the wellbore pressure basis (riser mud weight vs. MASP) affects the volume/pressure supply requirement for the BSR. In addition to an original design matter, it is a management of change issue: the BOP modifications that added the choke & kill valves to the AMF deadman and autoshear backup systems. And as an ongoing operational matter, a BOP accumulator precharge pressure must be selected for each well water depth and maximum mud weight/MASP criteria.
200 Transocean Well Control Handbook, Section 9, subsection 3 (BP-HZN-C SB00079398), 6. 201 BP Well Control Manual (BP-HZN-CSB00088474), 20. 202 Ibid., 7-7-14, 16. 203 API Standard 53, “Blowout Prevention Equipment Systems for Drilling Wells,” November 2012.
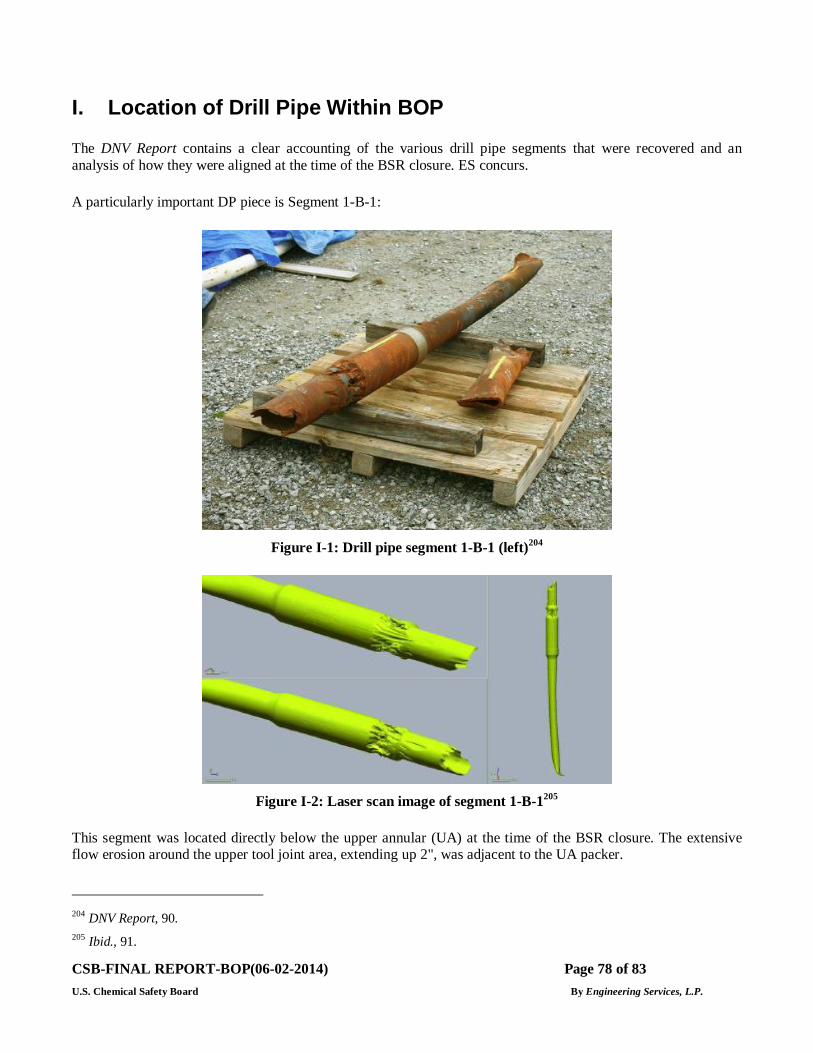
CSB-FINAL REPORT-BOP(06-02-2014) Page 78 of 83 U.S. Chemical Safety Board By Engineering Services, L.P.
I. Location of Drill Pipe Within BOP
The DNV Report contains a clear accounting of the various drill pipe segments that were recovered and an analysis of how they were aligned at the time of the BSR closure. ES concurs.
A particularly important DP piece is Segment 1-B-1:
Figure I-1: Drill pipe segment 1-B-1 (left)204
Figure I-2: Laser scan image of segment 1-B-1205
This segment was located directly below the upper annular (UA) at the time of the BSR closure. The extensive flow erosion around the upper tool joint area, extending up 2", was adjacent to the UA packer.
204 DNV Report, 90. 205 Ibid., 91.
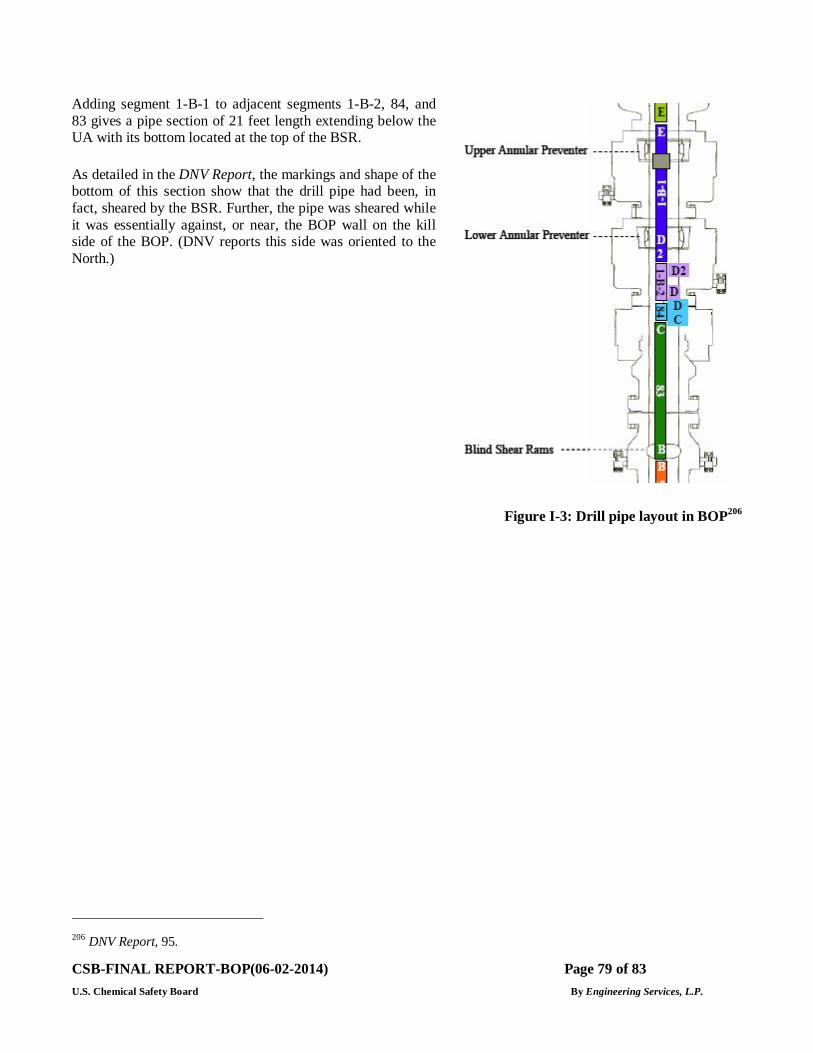
CSB-FINAL REPORT-BOP(06-02-2014) Page 79 of 83 U.S. Chemical Safety Board By Engineering Services, L.P.
Adding segment 1-B-1 to adjacent segments 1-B-2, 84, and 83 gives a pipe section of 21 feet length extending below the UA with its bottom located at the top of the BSR.
As detailed in the DNV Report, the markings and shape of the bottom of this section show that the drill pipe had been, in fact, sheared by the BSR. Further, the pipe was sheared while it was essentially against, or near, the BOP wall on the kill side of the BOP. (DNV reports this side was oriented to the North.)
Figure I-3: Drill pipe layout in BOP206
206 DNV Report, 95.
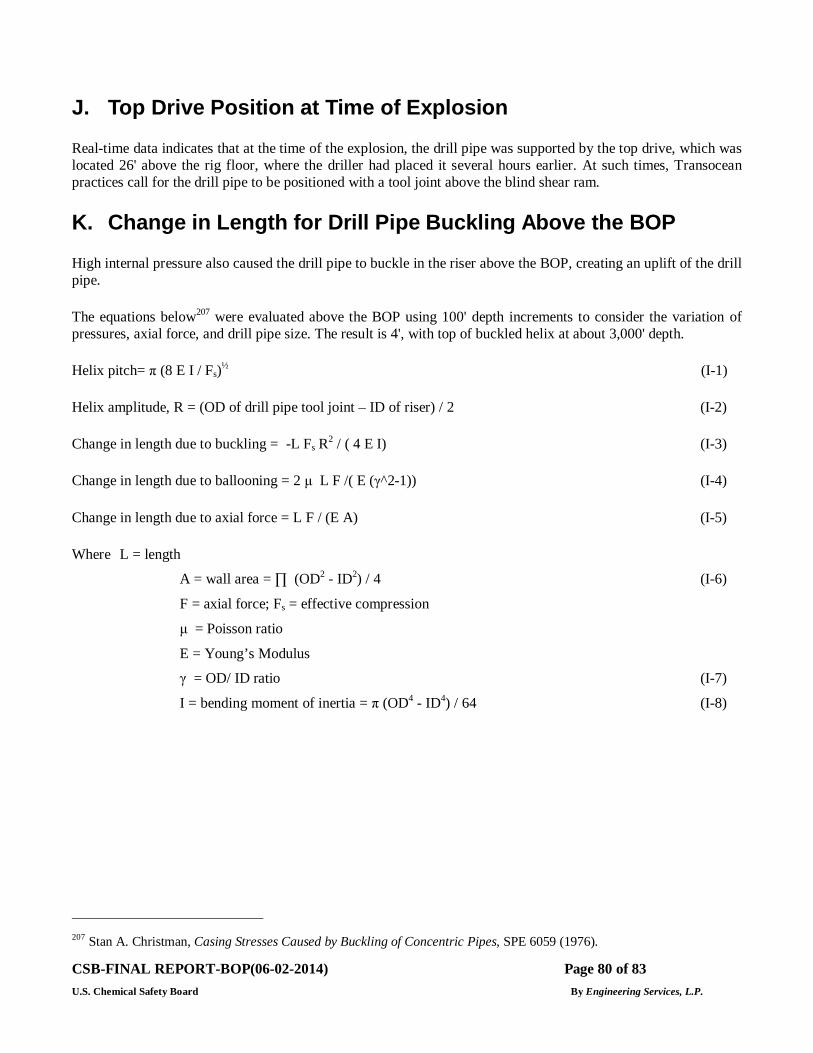
CSB-FINAL REPORT-BOP(06-02-2014) Page 80 of 83 U.S. Chemical Safety Board By Engineering Services, L.P.
J. Top Drive Position at Time of Explosion
Real-time data indicates that at the time of the explosion, the drill pipe was supported by the top drive, which was located 26' above the rig floor, where the driller had placed it several hours earlier. At such times, Transocean practices call for the drill pipe to be positioned with a tool joint above the blind shear ram.
K. Change in Length for Drill Pipe Buckling Above the BOP
High internal pressure also caused the drill pipe to buckle in the riser above the BOP, creating an uplift of the drill pipe.
The equations below207 were evaluated above the BOP using 100' depth increments to consider the variation of pressures, axial force, and drill pipe size. The result is 4', with top of buckled helix at about 3,000' depth.
Helix pitch= π (8 E I / Fs)½ (I-1)
Helix amplitude, R = (OD of drill pipe tool joint – ID of riser) / 2 (I-2)
Change in length due to buckling = -L Fs R2 / ( 4 E I) (I-3)
Change in length due to ballooning = 2 μ L F /( E (γ^2-1)) (I-4)
Change in length due to axial force = L F / (E A) (I-5)
Where L = length
A = wall area = ∏ (OD2 - ID2) / 4 (I-6)
F = axial force; Fs = effective compression
μ = Poisson ratio
E = Young’s Modulus
γ = OD/ ID ratio (I-7)
I = bending moment of inertia = π (OD4 - ID4) / 64 (I-8)
207 Stan A. Christman, Casing Stresses Caused by Buckling of Concentric Pipes, SPE 6059 (1976).
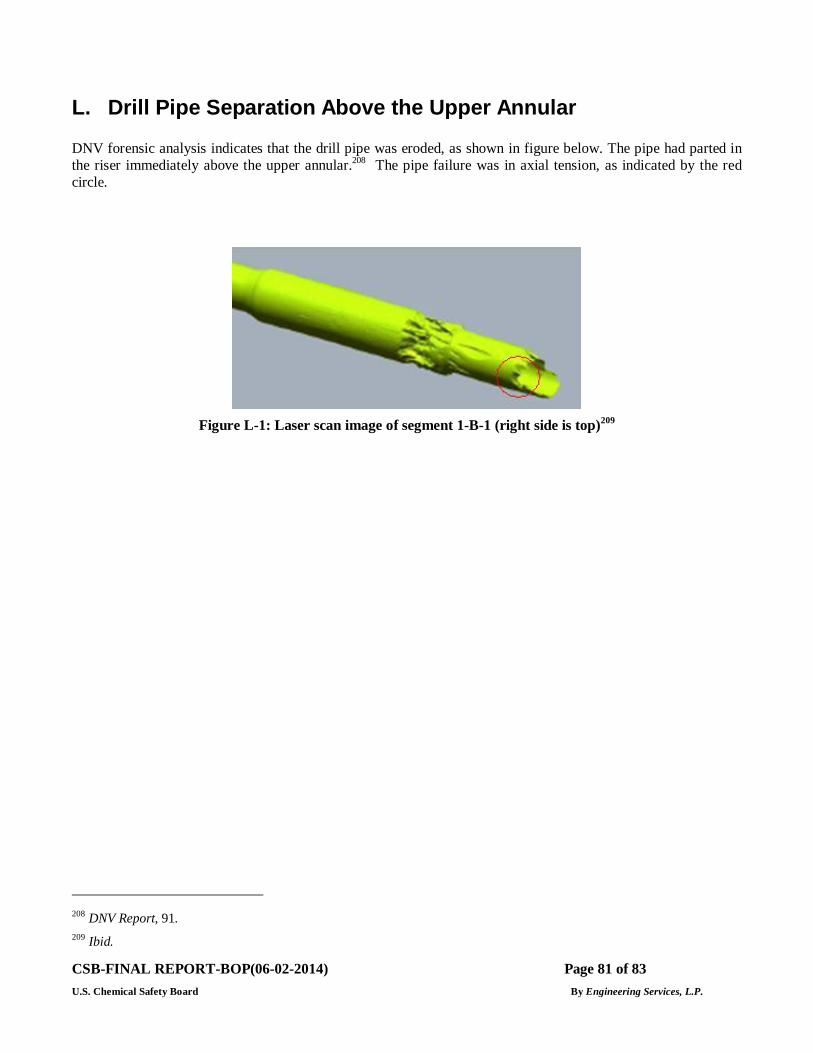
CSB-FINAL REPORT-BOP(06-02-2014) Page 81 of 83 U.S. Chemical Safety Board By Engineering Services, L.P.
L. Drill Pipe Separation Above the Upper Annular
DNV forensic analysis indicates that the drill pipe was eroded, as shown in figure below. The pipe had parted in the riser immediately above the upper annular.208 The pipe failure was in axial tension, as indicated by the red circle.
Figure L-1: Laser scan image of segment 1-B-1 (right side is top)209
208 DNV Report, 91. 209 Ibid.
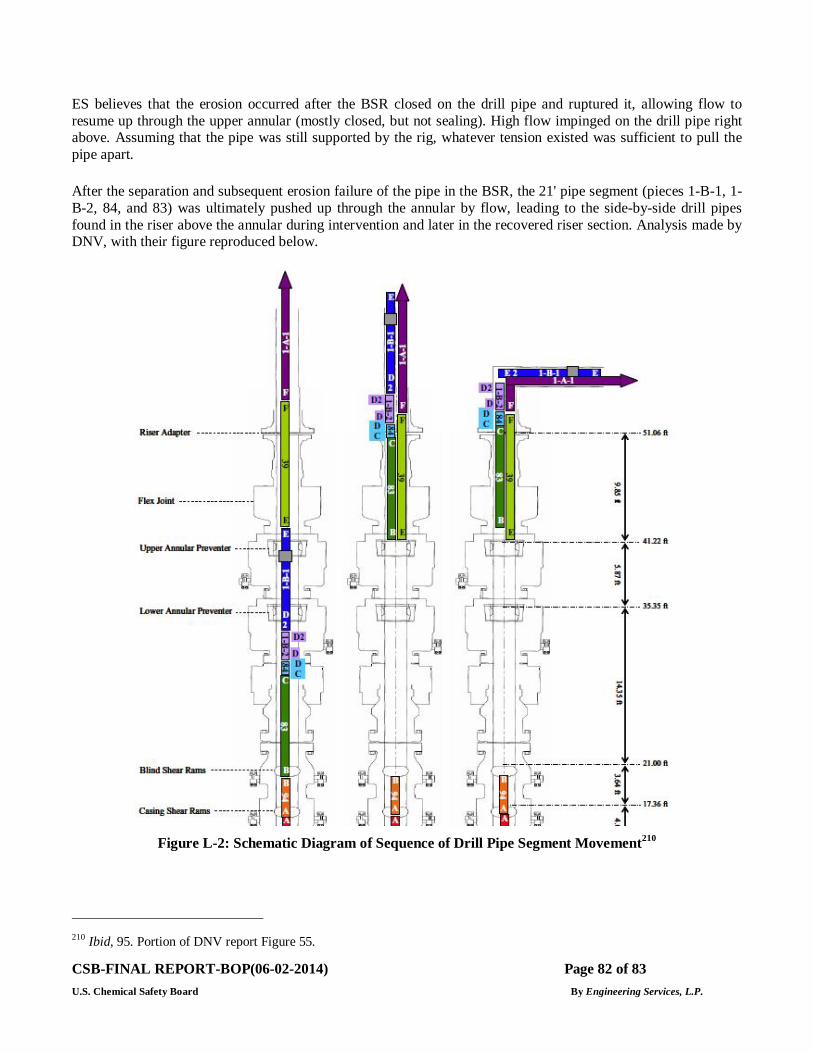
CSB-FINAL REPORT-BOP(06-02-2014) Page 82 of 83 U.S. Chemical Safety Board By Engineering Services, L.P.
ES believes that the erosion occurred after the BSR closed on the drill pipe and ruptured it, allowing flow to resume up through the upper annular (mostly closed, but not sealing). High flow impinged on the drill pipe right above. Assuming that the pipe was still supported by the rig, whatever tension existed was sufficient to pull the pipe apart.
After the separation and subsequent erosion failure of the pipe in the BSR, the 21' pipe segment (pieces 1-B-1, 1-B-2, 84, and 83) was ultimately pushed up through the annular by flow, leading to the side-by-side drill pipes found in the riser above the annular during intervention and later in the recovered riser section. Analysis made by DNV, with their figure reproduced below.
Figure L-2: Schematic Diagram of Sequence of Drill Pipe Segment Movement210
210 Ibid, 95. Portion of DNV report Figure 55.
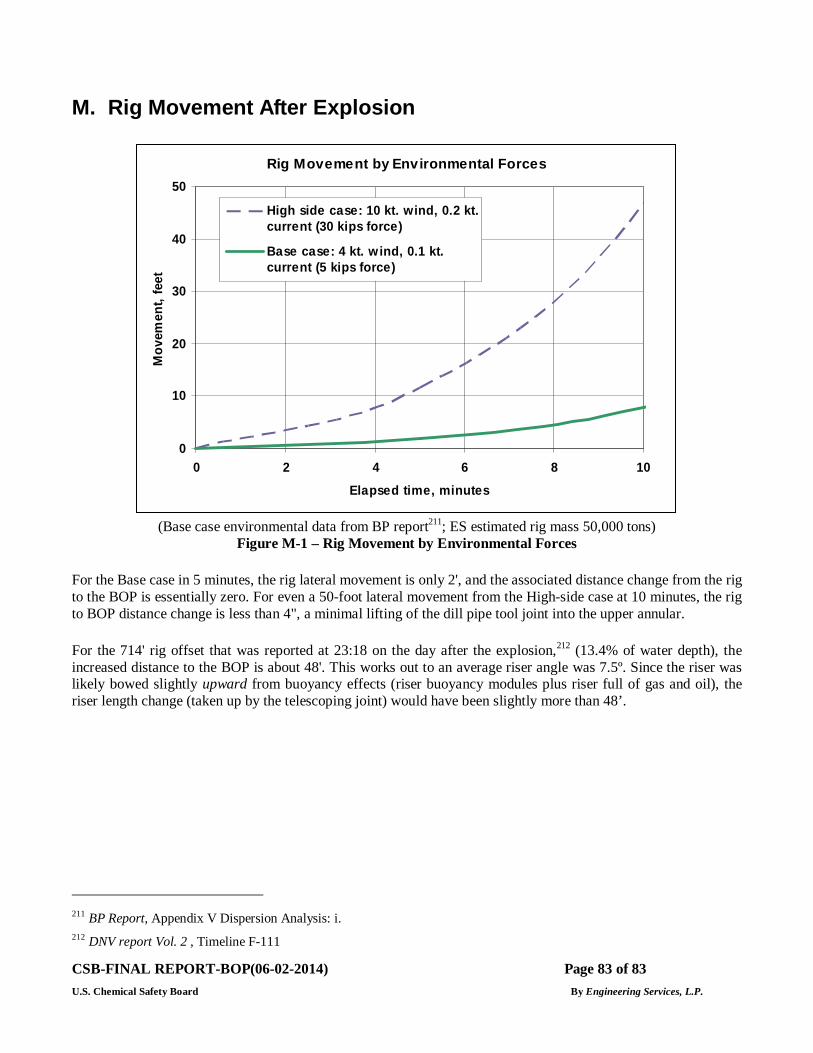
CSB-FINAL REPORT-BOP(06-02-2014) Page 83 of 83 U.S. Chemical Safety Board By Engineering Services, L.P.
M. Rig Movement After Explosion
Rig Movement by Environmental Forces
0
10
20
30
40
50
0 2 4 6 8 10
Elapsed time, minutes
Mov
emen
t, fe
et
High side case: 10 kt. wind, 0.2 kt.current (30 kips force)
Base case: 4 kt. wind, 0.1 kt.current (5 kips force)
(Base case environmental data from BP report211; ES estimated rig mass 50,000 tons)
Figure M-1 – Rig Movement by Environmental Forces
For the Base case in 5 minutes, the rig lateral movement is only 2', and the associated distance change from the rig to the BOP is essentially zero. For even a 50-foot lateral movement from the High-side case at 10 minutes, the rig to BOP distance change is less than 4", a minimal lifting of the dill pipe tool joint into the upper annular.
For the 714' rig offset that was reported at 23:18 on the day after the explosion,212 (13.4% of water depth), the increased distance to the BOP is about 48'. This works out to an average riser angle was 7.5º. Since the riser was likely bowed slightly upward from buoyancy effects (riser buoyancy modules plus riser full of gas and oil), the riser length change (taken up by the telescoping joint) would have been slightly more than 48’.
211 BP Report, Appendix V Dispersion Analysis: i. 212 DNV report Vol. 2 , Timeline F-111