Embed Size (px)
Citation preview
1
Please note that this is an author-produced PDF of an article accepted for publication following peer review. The definitive publisher-authenticated version is available on the publisher Web site.
Deep-sea Research Part I-oceanographic Research Papers November 2014, Volume 93 Pages 83-90 http://dx.doi.org/10.1016/j.dsr.2014.07.013 http://archimer.ifremer.fr/doc/00206/31745/ © 2014 Elsevier Ltd. All rights reserved.
Achimer http://archimer.ifremer.fr
Deep-towed High Resolution multichannel seismic imaging
Marsset Bruno 1, *, Menut Eric 2, Ker Stephan 1, Thomas Yannick 1, Regnault Jean-Pierre 2, Leon Pierre 3, Martinossi Henri 3, Artzner Laurent 4, Chenot Damien 3, Dentrecolas Stephane 3,
Spychalski B. 5, Mellier G. 6, Sultan Nabil 1
1 IFREMER, REM GM, Ctr Brest, F-29280 Plouzane, France. 2 IFREMER, REM RDT, Ctr Brest, F-29280 Plouzane, France. 3 IFREMER, ISM SM S3E, ZP Bregaillon, F-83507 La Seyne Sur Mer, France. 4 IFREMER, ISM SM IIDM, ZP Bregaillon, F-83507 La Seyne Sur Mer, France. 5 High Tech Inc, Long Beach, MS 39560 USA. 6 Sercel, F-44470 Carquefou, France.
* Corresponding author : Bruno Marsset, email address : [email protected]
Abstract : High Resolution (220–1050 Hz) seismic acquisition performed in deep water using deep-towed systems provides unrivalled lateral resolution when compared to conventional surface seismic. The lateral resolution of these acquisitions is controlled by the width of the first Fresnel zone, taking advantage of their positions close to the sea bottom. No current existing deep towed equipment can benefit from seismic imaging processing techniques to improve this resolution as a consequence of positioning inaccuracies. The technological developments of a digital deep-towed multichannel streamer are presented with a particular attention to positioning: each hydrophone incorporates a pitch, roll and heading sensor in order to monitor the constant deformation of the streamer in operation. The sea trials took place in July 2013 in the Mediterranean Sea. Pre-stack depth migration applied to the deep-towed multichannel data illustrates the potential of this emerging methodology in terms of penetration (12 dB improvement in Signal/Noise) and lateral resolution (mean signal wavelength: 3 m) when compared with deep-towed single-channel acquisition.
Highlights
► Perform deep towed High Resolution multichannel seismic imaging. ► Design of pressure-resistant digital hydrophones. ► Monitor the streamer deformation with pitch, roll, and heading sensors.
Keywords : Deep-towed seismics, Multichannel streamer, Seismic imaging
2
Please note that this is an author-produced PDF of an article accepted for publication following peer review. The definitive publisher-authenticated version is available on the publisher Web site.
1. Introduction
High Resolution (220–1050 Hz) seismic acquisition performed in great water depth using deep-towed systems arouses interest, because of its ability to provide detailed information on the sub-surface. Fields of interest include seabed instability, gas and gas-hydrate studies, and high-resolution seismic stratigraphy. The relatively low frequency content of such a system and the high Sound Level, compared to standard AUV-borne sub-bottom profilers, enable it to provide deeper penetration (hundreds of metres) and to explore rougher terrains where higher frequencies are ineffective. The keystone of this emerging
2
technology is the Janus-Helmholtz piezoelectric transducer, a mature development designed for wide-band frequency 38
modulated signals, which provides a hydrostatic pressure-independent seismic source down to 6000 meters water depth (Ker 39
et al., 2010; Leon et al., 2009; Marsset T. et al., 2010; Riboulot et al., 2013; Rowe et al., 1993; Sultan et al., 2010, 2011) 40
41
The US Naval Research Laboratory (NRL) has pioneered the use of deep-towed high-resolution multichannel seismic 42
acquisition. The NRL Deep Towed Acoustics Geophysics System (DTAGS) has successfully determined P-wave velocity 43
distribution and thus acoustically characterized the medium (Chapman et al., 2002; Gettrust et al., 2004; He et al., 2002; 44
Walia and Hannay, 1999; Wood et al., 2003, 2008). Yet, due to inadequate spatial sampling, the DTAGS could not benefit 45
fully from the multichannel receivers for seismic imaging. Moreover, the DTAGS streamer lacks positioning accuracy to 46
meet high-resolution seismic imaging requirements (Asakawa et al., 2009). 47
48
Taking advantages of its existing SYSIF (Deep Towed Seismic System) technology in deep-towed seismic source and 49
single-channel data acquisition, IFREMER (French research institute for exploitation of the sea) has recently developed a 50
multichannel streamer. This contribution presents the technological challenges of deep-towed seismic imaging issues, the 51
technological developments need to meet these challenges and the first seismic imaging results of this emerging 52
methodology. 53
II. IMAGING REQUIREMENTS 54 55 Adequate spatial sampling is required to avoid spatial aliasing and thus to benefit from seismic imaging. Given the high 56
frequency content of the Janus-Helmholtz seismic source (220-1050 Hz), a trade-off has to be found between the maximum 57
dip that can be imaged and practical technological considerations. The prototype streamer was developed with a 2 meter 58
inter-trace spacing, which prevents spatial aliasing for dips up to 10°. 59
60
Velocity analysis as well as the imaging process rely on the source - receiver offset range, thus on the number of seismic 61
channels and on the streamer length. The prototype streamer was developed with 52 seismic channels (offset : 10-112 62
metres) which enables velocity analysis within the upper sedimentary layers (Normal Move Out of 10 ms at sea floor for an 63
altitude of 100 meters for the maximum offset). The streamer length therefore complies with the up-to 40° from-vertical 64
directivity of the Janus-Helmholtz transducer for a minimum towing altitude of 50 meters. 65
66
Operating at great water depth (over 500 meters), positioning becomes an issue, not only for relative positioning, i.e. source 67
to receiver geometry but also for absolute positioning, i.e. geographical positioning. Considering the high-resolution imaging 68
objective, optimal positioning accuracy should therefore reach a horizontal and vertical precisions of 2 and 0.2 meters, 69
respectively. 70
3
III. TECHNOLOGICAL DEVELOPMENTS 71 72
The hydrophones should withstand high hydrostatic pressure without a loss of sensitivity. The actual hydrophones consist of 73
piezoelectric ceramic cylinders with end caps, this technology is capable to withstanding pressure to 700 bars and was used 74
in most places in the design of deep towed streamers (Breitzke and Bialas, 2003, Leon et al., 2009, Rowe and Gettrust, 1993, 75
Wood et al., 2008). 76
77
Given the exceptionally low noise level of the environment in deep-towed acquisition, each seismic trace consists in a single 78
hydrophone. Because of the number of hydrophones and thus to the number of electrical wires, it is not possible to use 79
analog technology, therefore digital hydrophones were designed taking advantage of Ethernet transfer protocol. Ethernet 80
switches are included throughout the streamer to reduce the number of electrical wires. 81
82
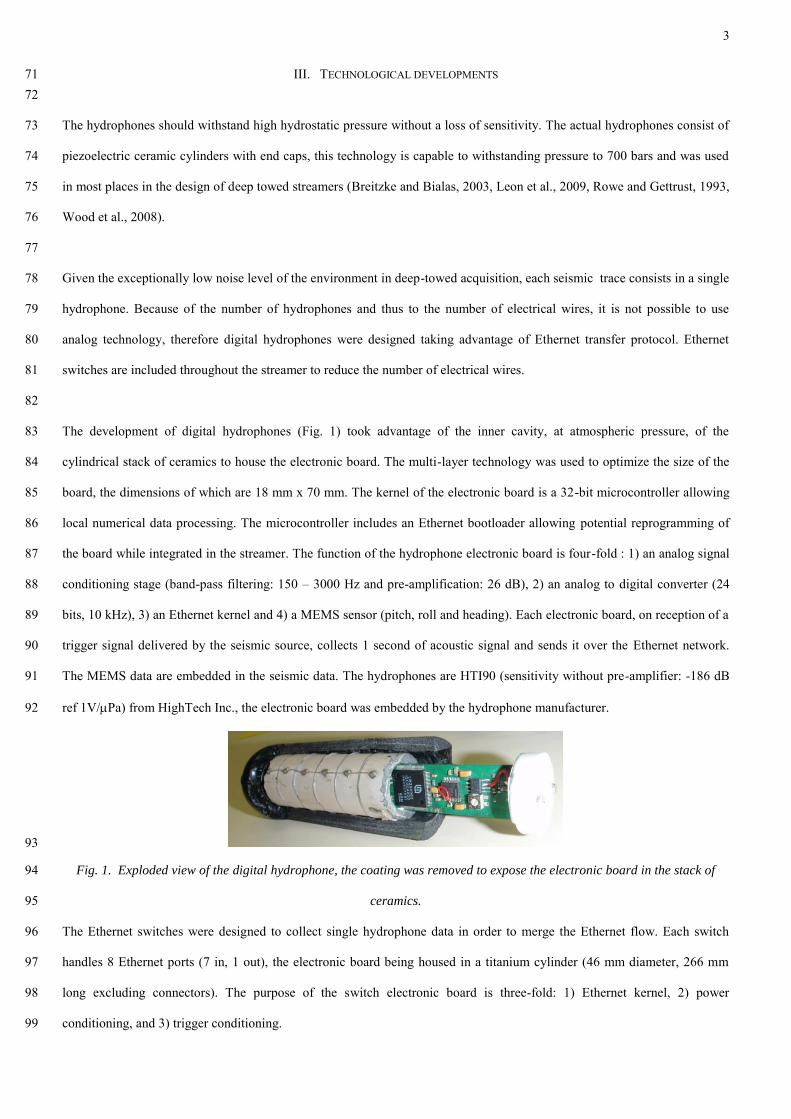
The development of digital hydrophones (Fig. 1) took advantage of the inner cavity, at atmospheric pressure, of the 83
cylindrical stack of ceramics to house the electronic board. The multi-layer technology was used to optimize the size of the 84
board, the dimensions of which are 18 mm x 70 mm. The kernel of the electronic board is a 32-bit microcontroller allowing 85
local numerical data processing. The microcontroller includes an Ethernet bootloader allowing potential reprogramming of 86
the board while integrated in the streamer. The function of the hydrophone electronic board is four-fold : 1) an analog signal 87
conditioning stage (band-pass filtering: 150 – 3000 Hz and pre-amplification: 26 dB), 2) an analog to digital converter (24 88
bits, 10 kHz), 3) an Ethernet kernel and 4) a MEMS sensor (pitch, roll and heading). Each electronic board, on reception of a 89
trigger signal delivered by the seismic source, collects 1 second of acoustic signal and sends it over the Ethernet network. 90
The MEMS data are embedded in the seismic data. The hydrophones are HTI90 (sensitivity without pre-amplifier: -186 dB 91
ref 1V/Pa) from HighTech Inc., the electronic board was embedded by the hydrophone manufacturer. 92
93
Fig. 1. Exploded view of the digital hydrophone, the coating was removed to expose the electronic board in the stack of 94
ceramics. 95
The Ethernet switches were designed to collect single hydrophone data in order to merge the Ethernet flow. Each switch 96
handles 8 Ethernet ports (7 in, 1 out), the electronic board being housed in a titanium cylinder (46 mm diameter, 266 mm 97
long excluding connectors). The purpose of the switch electronic board is three-fold: 1) Ethernet kernel, 2) power 98
conditioning, and 3) trigger conditioning. 99
4
The prototype streamer is made of 4 independent acoustic sections of 13 hydrophones and 2 Ethernet switches each, the 100
individual electrical scheme of these sections includes 8 wires (i.e. 32 wires for the whole streamer) : 2 wires for power, 2 101
wires for trigger and 4 wires for the Ethernet connection (Rx+, Rx-, Tx+, Tx-). 102
103
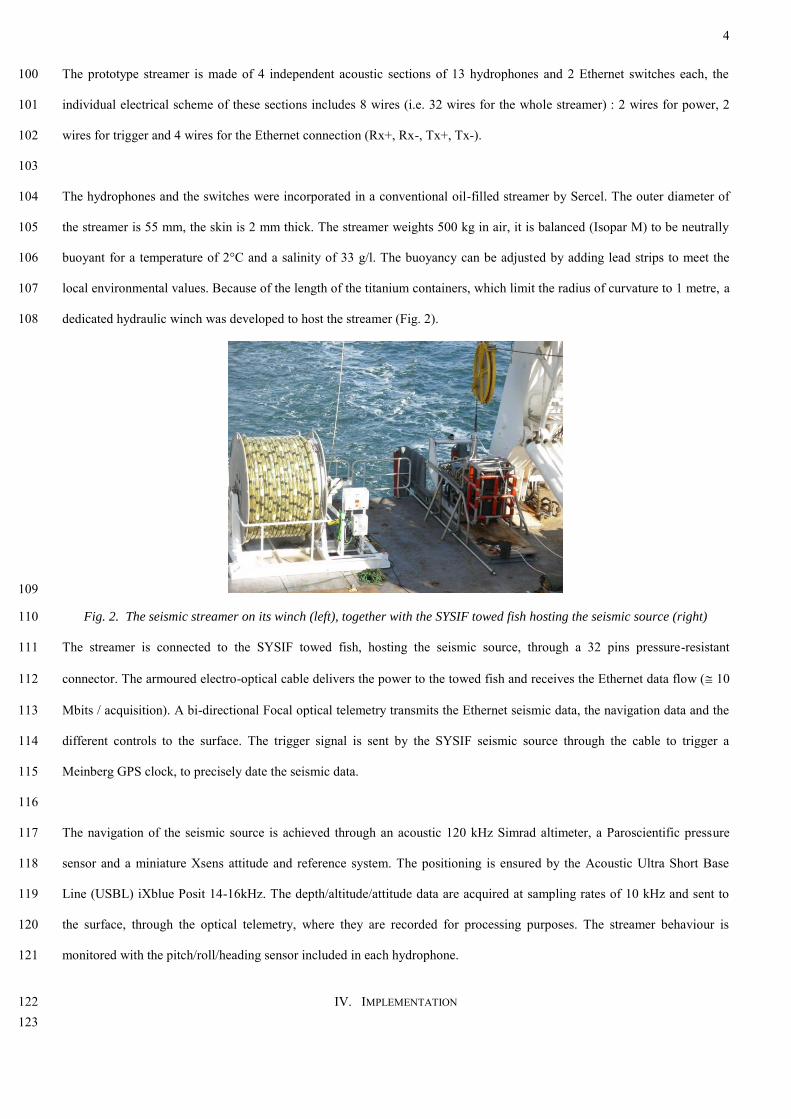
The hydrophones and the switches were incorporated in a conventional oil-filled streamer by Sercel. The outer diameter of 104
the streamer is 55 mm, the skin is 2 mm thick. The streamer weights 500 kg in air, it is balanced (Isopar M) to be neutrally 105
buoyant for a temperature of 2°C and a salinity of 33 g/l. The buoyancy can be adjusted by adding lead strips to meet the 106
local environmental values. Because of the length of the titanium containers, which limit the radius of curvature to 1 metre, a 107
dedicated hydraulic winch was developed to host the streamer (Fig. 2). 108
109
Fig. 2. The seismic streamer on its winch (left), together with the SYSIF towed fish hosting the seismic source (right) 110
The streamer is connected to the SYSIF towed fish, hosting the seismic source, through a 32 pins pressure-resistant 111
connector. The armoured electro-optical cable delivers the power to the towed fish and receives the Ethernet data flow ( 10 112
Mbits / acquisition). A bi-directional Focal optical telemetry transmits the Ethernet seismic data, the navigation data and the 113
different controls to the surface. The trigger signal is sent by the SYSIF seismic source through the cable to trigger a 114
Meinberg GPS clock, to precisely date the seismic data. 115
116
The navigation of the seismic source is achieved through an acoustic 120 kHz Simrad altimeter, a Paroscientific pressure 117
sensor and a miniature Xsens attitude and reference system. The positioning is ensured by the Acoustic Ultra Short Base 118
Line (USBL) iXblue Posit 14-16kHz. The depth/altitude/attitude data are acquired at sampling rates of 10 kHz and sent to 119
the surface, through the optical telemetry, where they are recorded for processing purposes. The streamer behaviour is 120
monitored with the pitch/roll/heading sensor included in each hydrophone. 121
IV. IMPLEMENTATION 122 123
5
Operating a deep-towed high-resolution seismic is significantly different from conventional surface-towed seismic systems 124
(Marsset T. et al., 2010; Leon et al., 2009). The towing depth, and thus the altitude, of the source is controlled by an electro-125
optical tow-cable. The cable is paid out or hauled in order to maintain a constant altitude above the sea floor. Every action of 126
the winch changes the geometry of the acquisition as any displacement of the seismic source will impact on the streamer 127
shape. The attitude sensors within the hydrophones in the streamer are recorded at the same rate as the shooting rate, i.e. 128
between 1 and 3 seconds, according to the bathymetry. Therefore, high-frequency streamer motion cannot be properly 129
monitored and the instructions are to minimize actions on the winch during the acquisition of a seismic profile. The 130
maximum towing speed is 2 knots. 131
132
The shooting rate and the recording time window are calculated using a ray tracing algorithm in order to avoid multiple 133
reflections from the sea surface. Given the frequency content of the seismic source, the sea-surface roughness distorts the 134
signal, making it impossible for the processing to remove multiple rays. 135
136
The frequency of the acoustic USBL beacon is 14-16 kHz. This frequency is well outside the frequency bandwidth of the 137
seismic source, nevertheless it produces bursts of noise on the seismic records: the USBL transmitting rate is therefore 138
synchronised with the seismic-source trigger to prevent interference in the recording window. An OSEA acoustic 139
synchronisation tool controls all acoustic equipment, the seismic source being the master and all other equipment having 140
their own dedicated time slot. 141
142
The acquisition system monitors seismic data through a simple correlation / amplitude retrieval processing in order to 143
provide a seismic section of a selected hydrophone, the data being uncorrected from source and streamer motions. This acts 144
as a Quality Control (QC) tool to detect any failure in the acquisition chain, either seismic source, streamer or GPS clock 145
malfunctions. Depth and altitude information are used to drive the winch to maintain the system at the target depth / altitude. 146
V. SEA TRIALS 147 148 During the scientific « Prisme 2» cruise onboard French R/V « L’Atalante », in August 2013, 250 miles of multichannel 149
deep-towed seismic data were successfully acquired off Corsica (water depth 600-900 m) and in the Gulf of Lion (water 150
depth 2000 m). Additional single-channel deep-towed seismic data were acquired on the Ligurian margin (water depth 500-151
2000 m). One of the aims of the « Prisme 2 » cruise was to study and to analyse some massive submarine landslides present 152
in the western Mediterranean sea. 153
154
The following sections will focus on the presentation of a short seismic profile (2 miles), where there is much evidence of 155
geological features such as slides or fluid chimneys. The data set consists of 1500 records acquired with a shooting rate of 156
6
one per 2.5 seconds. The water depth was between 850 and 875 m. At this early stage of development of the multichannel 157
streamer, its altitude was kept conservatively high, at 150 m above the sea floor, in the absence of experience of its 158
behaviour behind the towed-fish. Although this altitude allowed us to assess for the feasibility of deep-towed high-resolution 159
seismic imaging, a lack of precision in the determination of seismic velocity was anticipated. 160
VI. DATA PROCESSING 161 162
The processing sequence is split into two distinct flows: positioning processing and seismic processing 163
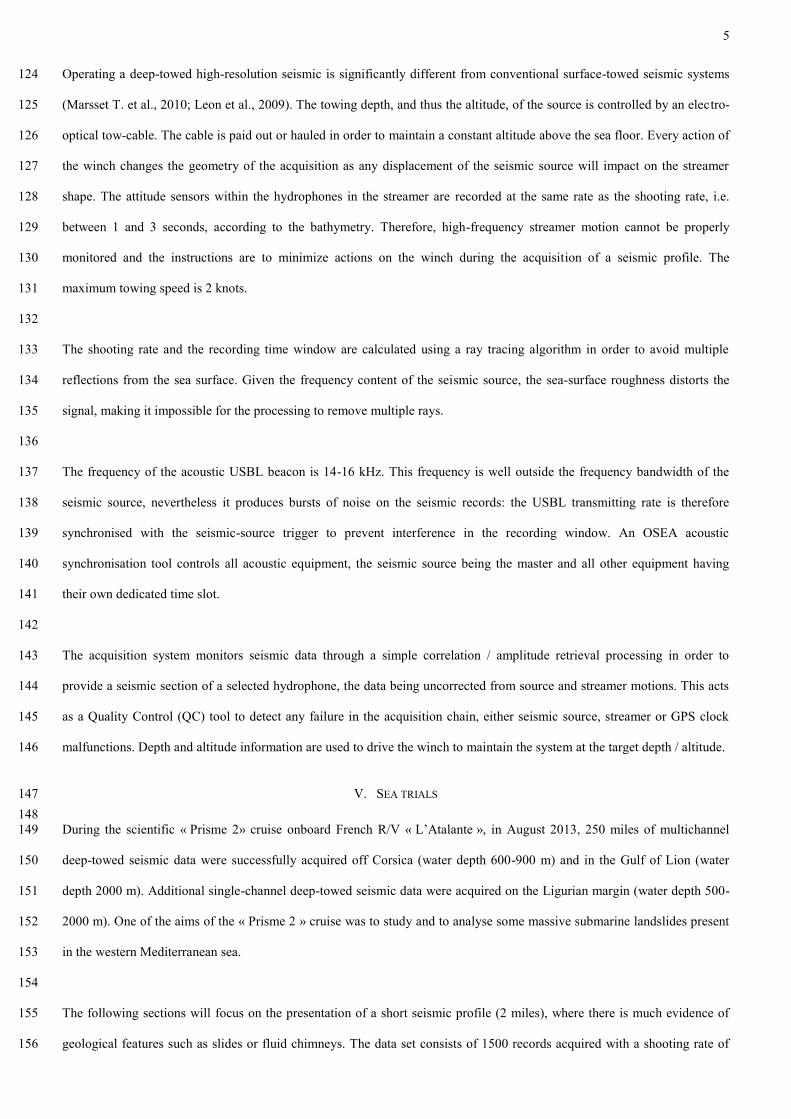
A. Positioning processing 164 165 The positioning workflow aims at obtaining the absolute positions of both source and receivers (Fig. 3). Each sensor comes 166
with its own acquisition rate. The raw data are processed at their own rates, the processed data are then interpolated at the 167
proper trigger times. 168
169
Fig. 3. Positioning workflow. 170
The altitude data are not accurate enough to be used for geometry processing (Fig. 4, left). The half-power beam width of the 171
Simrad altimeter is 15° (diameter 40 m at sea floor), thus 3D effects cannot be avoided in the detection of the seabed. The 172
altitude is used in combination with the depth and compared with additional multibeam bathymetry to assess eventual 173
positioning error. 174
7
175
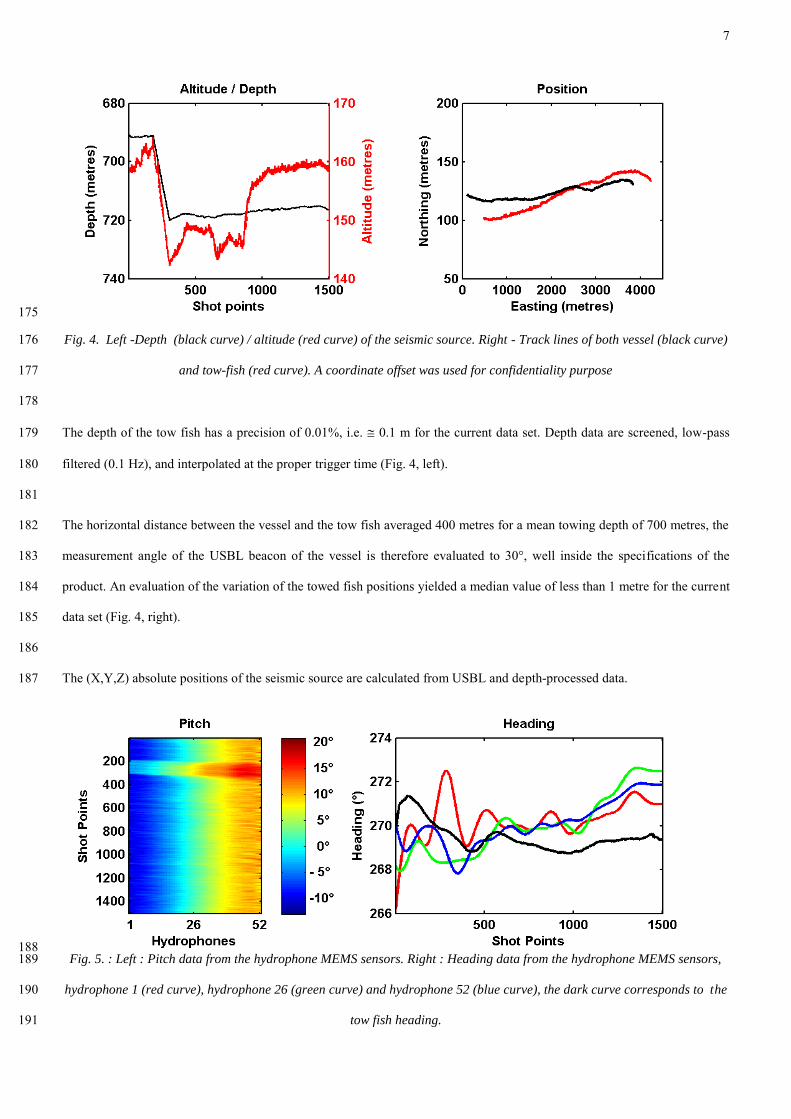
Fig. 4. Left -Depth (black curve) / altitude (red curve) of the seismic source. Right - Track lines of both vessel (black curve) 176
and tow-fish (red curve). A coordinate offset was used for confidentiality purpose 177
178
The depth of the tow fish has a precision of 0.01%, i.e. 0.1 m for the current data set. Depth data are screened, low-pass 179
filtered (0.1 Hz), and interpolated at the proper trigger time (Fig. 4, left). 180
181
The horizontal distance between the vessel and the tow fish averaged 400 metres for a mean towing depth of 700 metres, the 182
measurement angle of the USBL beacon of the vessel is therefore evaluated to 30°, well inside the specifications of the 183
product. An evaluation of the variation of the towed fish positions yielded a median value of less than 1 metre for the current 184
data set (Fig. 4, right). 185
186
The (X,Y,Z) absolute positions of the seismic source are calculated from USBL and depth-processed data. 187
188 Fig. 5. : Left : Pitch data from the hydrophone MEMS sensors. Right : Heading data from the hydrophone MEMS sensors, 189
hydrophone 1 (red curve), hydrophone 26 (green curve) and hydrophone 52 (blue curve), the dark curve corresponds to the 190
tow fish heading. 191
8
192
The pitch values of the 52 hydrophones are extracted from the seismic data. The pitch raw data displays the presence of the 193
sensors offsets biases. These offsets were previously measured in laboratory and are removed from the pitch data. A smooth 194
low-pass filter (0.05 m-1) is applied on a Common Shot Gather basis to remove unreliable, high wave number variations (Fig. 195
5, left). 196
197
It appears that the mean streamer shape is driven by the local weight of the electronic equipment inside the streamer: the 198
streamer is neutrally buoyant as a whole, nevertheless the number of electrical wires is much higher toward the head of the 199
streamer. The first half of the streamer is gently dipping downward (-10°), whereas the tail is gently rising (+15°). The 200
mean vertical depth-range of the streamer, therefore lies between -5 m (middle) and +10 m (tail) with respect to the 201
seismic source. Figure 4 (left) depicts a sharp action on the winch between shot 200 and shot 300: the impact on the streamer 202
shape is clearly observable on the pitch values with the propagation of the deformation along the streamer (Fig. 5, left). 203
204
The processing of the MEMS heading sensors is similar to the former sequence. The heading values of the different 205
hydrophones are extracted and corrected from their offsets measured in laboratory. The heading data are far more noisy than 206
pitch data. The impact of vertical motion of the streamer on the near-offset heading sensors can be observed by comparing 207
pitch data (Fig 5, left) and heading data (Fig 5, right, hydrophone 1, red curve) between shot number 200 and shot number 208
300. A 0.2 Hz low-pass filter was applied on a common-receiver basis to look for the presence of streamer feathering. The 209
mean calculated absolute drift angle is 2°, i.e. 4 metres of lateral offset for the far hydrophone, and therefore it was not taken 210
into account in the processing of the present data set. 211
212
The relative (X,Z) hydrophones positions, with respect to the tow fish, are calculated using the processed pitch values and 213
the hydrophones offsets (Fig 7, upper). 214
215
The absolute (X,Y,Z) hydrophones positions are calculated by projecting their relative positions in a 2D plane behind the 216
towed fish absolute positions. 217
B. Seismic processing 218 219
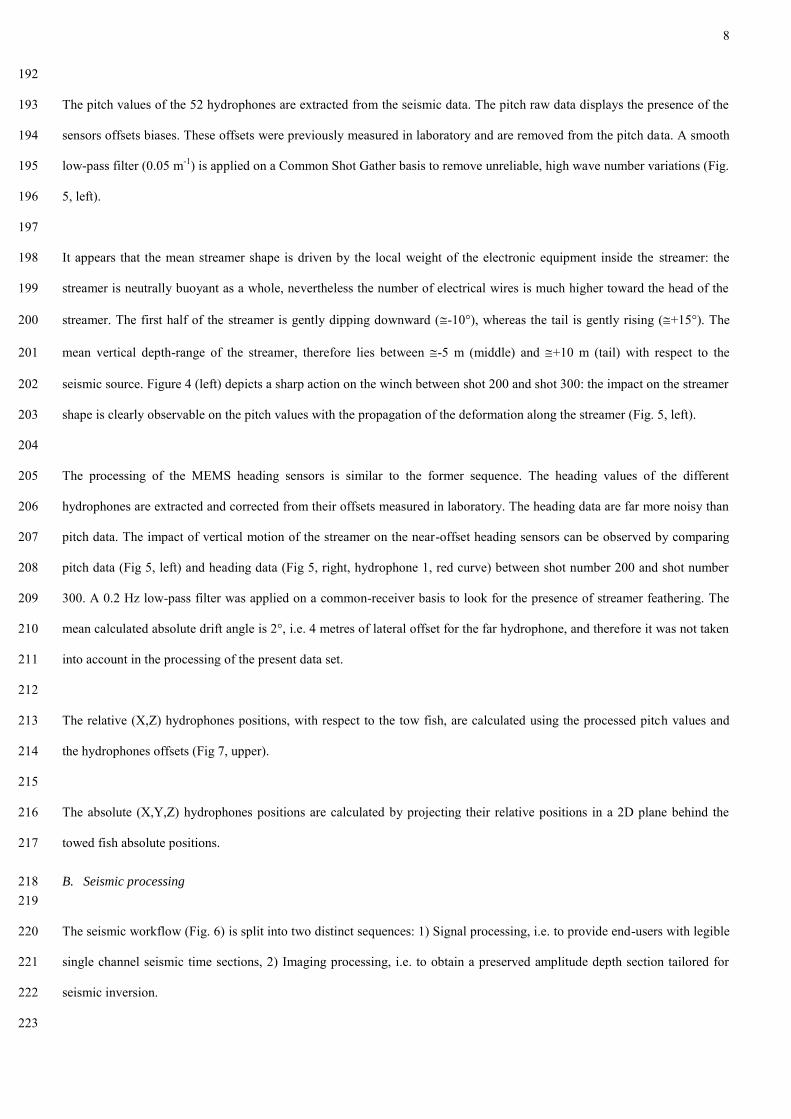
The seismic workflow (Fig. 6) is split into two distinct sequences: 1) Signal processing, i.e. to provide end-users with legible 220
single channel seismic time sections, 2) Imaging processing, i.e. to obtain a preserved amplitude depth section tailored for 221
seismic inversion. 222
223
9
224
Fig. 6. Seismic processing workflow 225
1) Signal processing 226 227
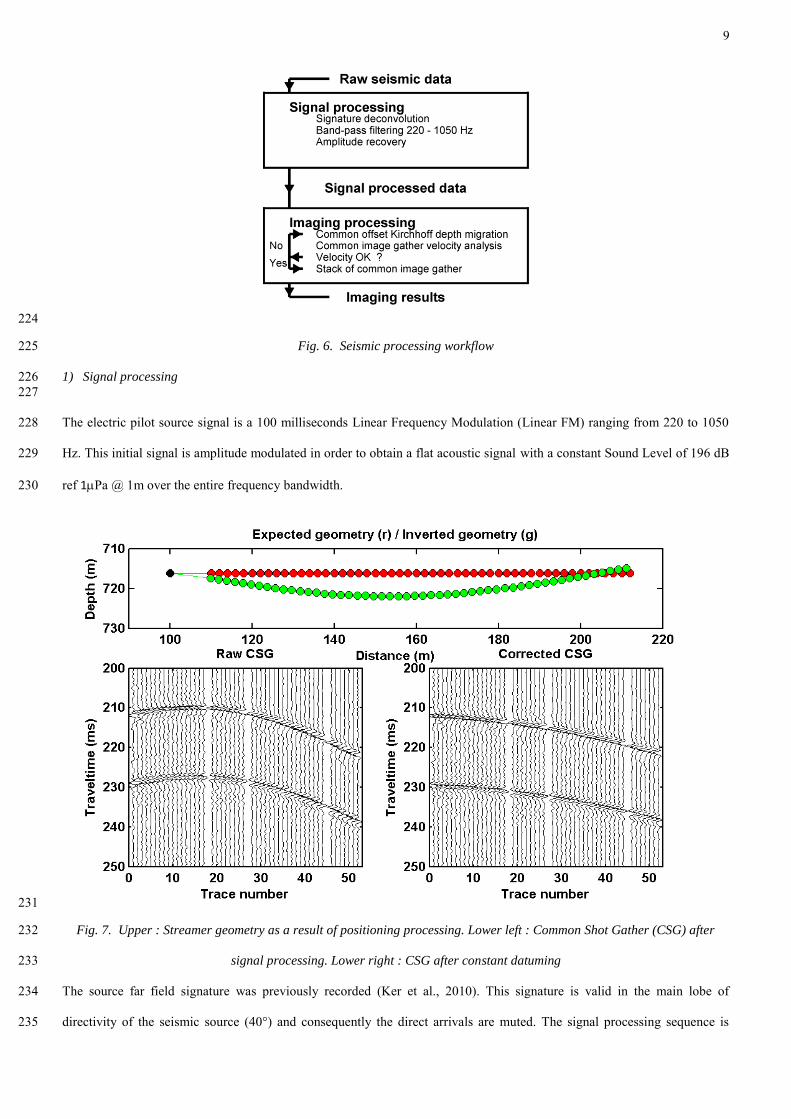
The electric pilot source signal is a 100 milliseconds Linear Frequency Modulation (Linear FM) ranging from 220 to 1050 228
Hz. This initial signal is amplitude modulated in order to obtain a flat acoustic signal with a constant Sound Level of 196 dB 229
ref 1Pa @ 1m over the entire frequency bandwidth. 230
231
Fig. 7. Upper : Streamer geometry as a result of positioning processing. Lower left : Common Shot Gather (CSG) after 232
signal processing. Lower right : CSG after constant datuming 233
The source far field signature was previously recorded (Ker et al., 2010). This signature is valid in the main lobe of 234
directivity of the seismic source (40°) and consequently the direct arrivals are muted. The signal processing sequence is 235
10
limited to signature deconvolution / band pass (220-1050 Hz) filtering / amplitude recovery. A signal processed Common 236
Shot Gather (CSG) is presented Fig 7 (lower left) where the shape of the sea-bottom reflection reflects the geometry of the 237
streamer. A constant datum shift is calculated based on the results of the positioning processing (Fig 7, upper) and applied to 238
the CSG (Fig 7, lower right) to illustrate the validity of the streamer geometry inversion. 239
240
2) Seismic imaging processing 241 242
The particular geometry of the acquisition where the source receiver geometry is perpetually changing, does not allow the 243
seismic data to be processed in a “conventional” marine sequence: Common Mid Point sorting – Normal Move Out – Stack 244
(Asakawa et al., 2009). We adapted a pre-stack processing approach in order to take into account the real (X,Y,Z) positions 245
of both sources and receivers in the imaging process. The approach applies Kirchhoff depth migration to each Common 246
Receiver Gather (CRG or Common Offset Gather). The different migrated sections are then sorted into Common Image 247
Gathers (CIG), i.e. to build an image of the same terrain location obtained from the different source-receiver offsets. If the 248
migrated traces of a CIG are identical for the different offsets this will confirm the validity of the velocity model. This 249
approach is commonly carried out in a layer-stripping iterative scheme to obtain, simultaneously, the variation of P-wave 250
velocity with depth and the imaging result. 251
252
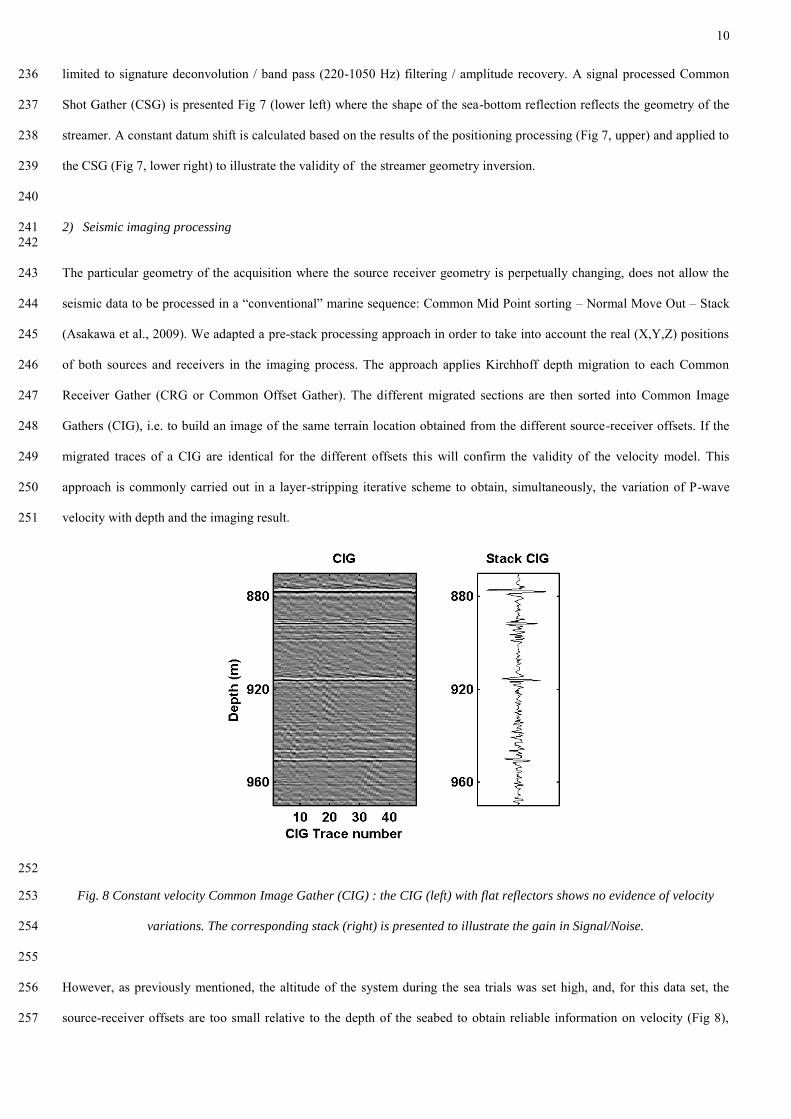
Fig. 8 Constant velocity Common Image Gather (CIG) : the CIG (left) with flat reflectors shows no evidence of velocity 253
variations. The corresponding stack (right) is presented to illustrate the gain in Signal/Noise. 254
255
However, as previously mentioned, the altitude of the system during the sea trials was set high, and, for this data set, the 256
source-receiver offsets are too small relative to the depth of the seabed to obtain reliable information on velocity (Fig 8), 257
11
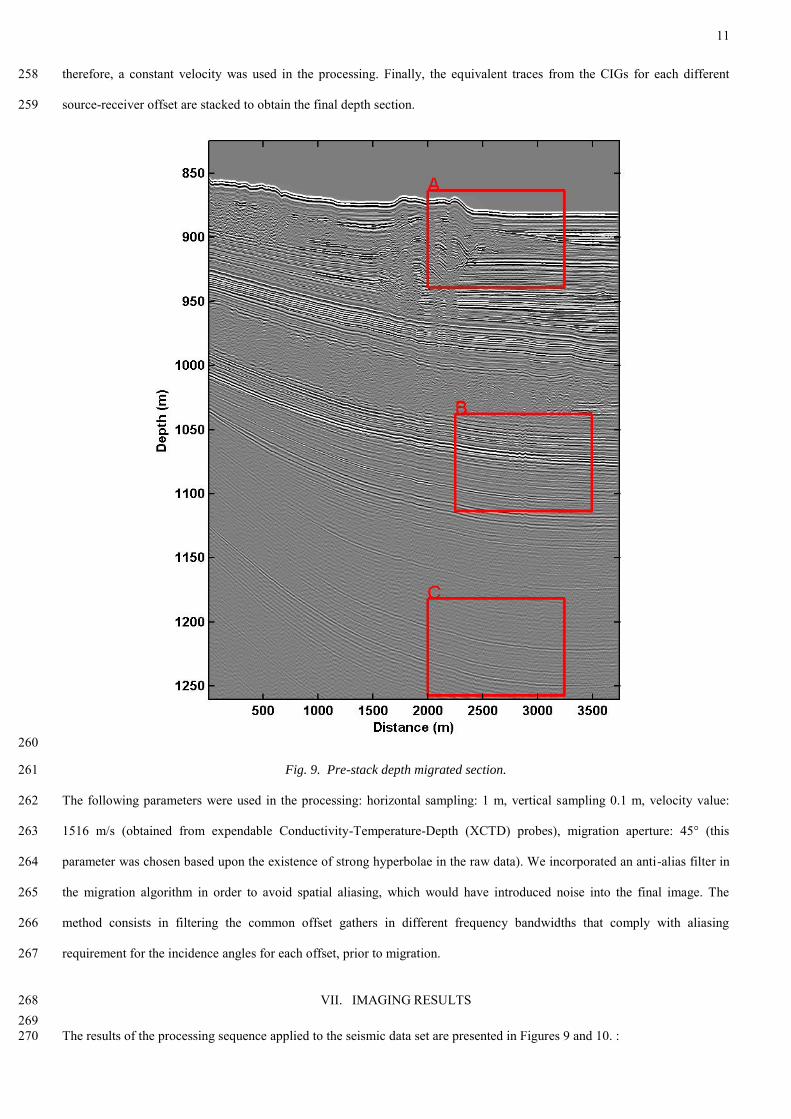
therefore, a constant velocity was used in the processing. Finally, the equivalent traces from the CIGs for each different 258
source-receiver offset are stacked to obtain the final depth section. 259
260
Fig. 9. Pre-stack depth migrated section. 261
The following parameters were used in the processing: horizontal sampling: 1 m, vertical sampling 0.1 m, velocity value: 262
1516 m/s (obtained from expendable Conductivity-Temperature-Depth (XCTD) probes), migration aperture: 45° (this 263
parameter was chosen based upon the existence of strong hyperbolae in the raw data). We incorporated an anti-alias filter in 264
the migration algorithm in order to avoid spatial aliasing, which would have introduced noise into the final image. The 265
method consists in filtering the common offset gathers in different frequency bandwidths that comply with aliasing 266
requirement for the incidence angles for each offset, prior to migration. 267
VII. IMAGING RESULTS 268 269 The results of the processing sequence applied to the seismic data set are presented in Figures 9 and 10. : 270
12
271
- Figure 9 presents the entire depth section where the penetration reaches 400 metres below sea floor (the vertical 272
exaggeration of the figure is 15). The image features a sedimentary basin filled with turbiditic, hemipelagic and mass-273
transport deposits. Two massive submarine landslides, 30 to 40 meters thick, recognizable with their chaotic seismic pattern, 274
extend from left to right. The youngest landslide is believed to have formed a so-called "compression ridge" which affects 275
the sea floor topography as well as the upper sedimentary layers in the middle of the section. 276
277
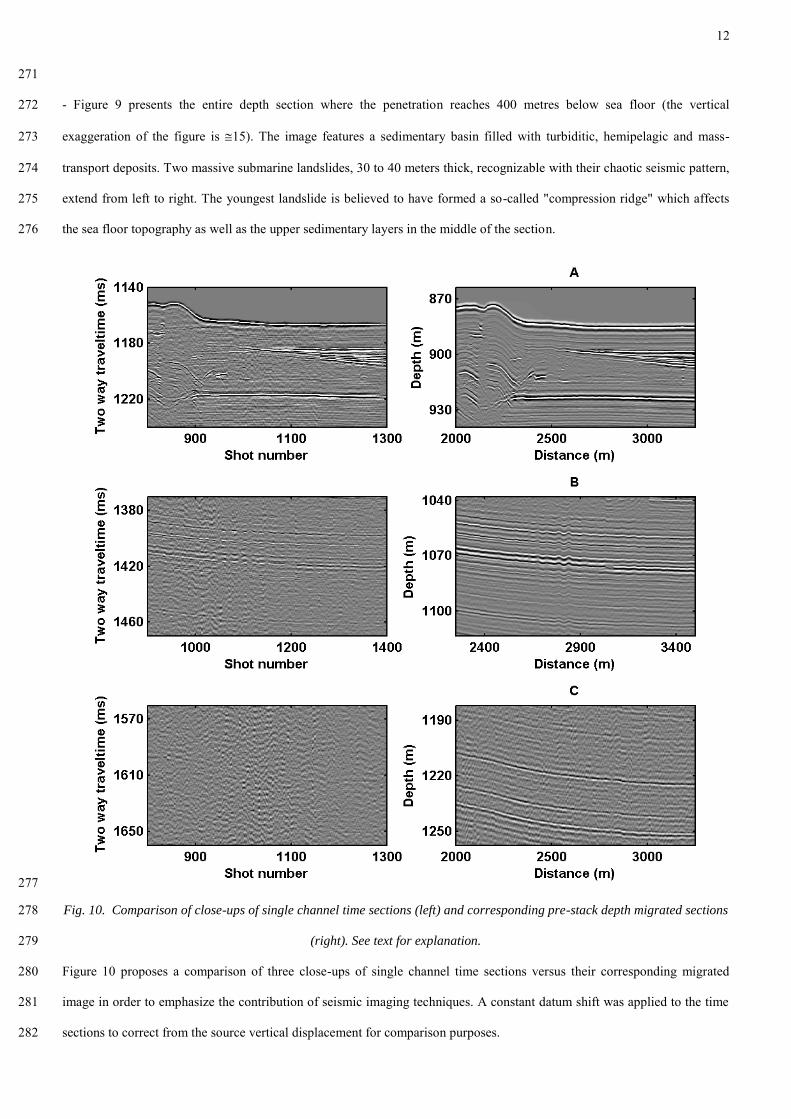
Fig. 10. Comparison of close-ups of single channel time sections (left) and corresponding pre-stack depth migrated sections 278
(right). See text for explanation. 279
Figure 10 proposes a comparison of three close-ups of single channel time sections versus their corresponding migrated 280
image in order to emphasize the contribution of seismic imaging techniques. A constant datum shift was applied to the time 281
sections to correct from the source vertical displacement for comparison purposes. 282
13
- Figure 10 A illustrates the gain in Signal to Noise ratio (S/N). The Signal and Noise attributes are evaluated in selected 283
windows on the sections envelope. The difference in S/N between time and depth sections is evaluated to 12 dB whereas the 284
theoretical gain, defined as the square root of the main fold, is 17 dB. 285
- Figure 10 B illustrates the gain in lateral resolution. The migrated section displays reflectors undulations with an average 286
wavelength of 60 meters. The theoretical lateral resolution of a monostatic monochromatic acquisition is limited by the 287
width of the first Fresnel zone (70 metres for the current feature) and, consequently these undulations are barely observable 288
on the time section. The theoretical lateral resolution of the migrated section is equal to the mean wavelength of the seismic 289
signal (3 metres), but cannot be demonstrated on this data set. 290
- Figure 10 C illustrates the gain in penetration. As a consequence of S/N improvement, the penetration achieved on the 291
depth migrated section reaches twice the one observed on the time section. 292
VIII. CONCLUSION 293 294 A prototype of a digital deep-towed multichannel streamer has been developed and the feasibility of performing high-295
resolution multi-channel seismic imaging in deep water has been demonstrated. The gain in signal-to-noise ratio (S/N) 296
doubles the penetration achieved in single-channel acquisition. The migration processing sequence improves the lateral 297
resolution to 3 meters (mean wavelength of the signal), quadrupling the resolution achieved in single channel acquisition. 298
299
The ability to perform accurate velocity analysis has still to be demonstrated, which requires the streamer to be towed closer 300
to the sea bottom. The excellent behavior of the streamer and the quality of the positioning equipment will make this 301
possible during the next sea trials scheduled in 2014. 302
303
The development of an operational streamer will be started, taking into account the experience gained during the project. 304
305
Acknowledgments: 306
The development of the multichannel streamer was funded by Institut Carnot Ifremer EDROME. 307 308
The authors are indebted to the scientific party and to the crew of the “Prisme 2” cruise, onboard French R/V L'Atalante, for 309
their permission to perform these sea trials during a scientific survey. The GENAVIR operating team of the SYSIF source is 310
warmly thanked for their skill as well as for their kindness. 311
312
Reference: 313
Asakawa, E., Mizohata, S., Inamori, T., Saeki T., 2009. "High resolution, deep-tow seismic survey to investigate methane 314
hydrate-bearing sediments, Nankai Trough, Offshore Japan", presented at OCEANS 2009 - Europe, Bremen 11-14 may 2009 315
14
Breitzke, M., Bialas, J., 2003. A deep-towed multichannel seismic streamer for very high-resolution surveys in full ocean 316
depth First Break, 21, 59-65. 317
Chapman, N.R., Gettrust, J.F., Walia, R., Hannay, D., Spence, G.T., Wood, W.T., Hyndman, R.D., 2002, "High Resolution 318
deep-towed multichannel seismic survey of deep sea gas hydrates off western Canada", Geophysics, 67, 1038-1047 319
Gettrust, J.F., Wood, W., Spychalski, S., 2004, "High-resolution MCS in deepwater", The leading Edge, 23, 374-377 320
W. Wood, P. Hart, D. Hutchinson, N. Dutta., F. Snyder, R. Coffin, and J. Gettrust, 2008. "Gas and gas hydrate distribution 321
He, T., Spence, G., Wood, W., Riedel, M., Hyndman, R., 2002, "Imaging a hydrate-related cold vent offshore Vancouver 322
Island from deep-towed multichannel seismic data", Geophysics, 74, B23-B26 323
Ker, S., Marsset, B., Garziglia, S., Le Gonidec, Y., Gibert, D., Voisset, M., Adamy J., 2010, " High-resolution seismic 324
imaging in deep sea from a joint deep-towed/OBH reflection experiment: application to a Mass Transport Complex offshore 325
Nigeria", Geophys. J. Int., 182, 1524-1542. 326
Leon, P., Ker, S., Marsset, B., Le Gall, Y., Voisset M., 2009, " SYSIF a New Seismic Tool for Near Bottom very High 327
Resolution Profiling in Deep Water” ", presented at OCEANS 2009 - Europe, Bremen 11-14 may 2009 328
Marsset, T., Marsset, B., Ker, S., Thomas, Y., Le Gall, Y., 2010, "High and very high resolution deep-towed seismic system: 329
Performance and examples from deepwater geohazard studies", Deep-Sea Research Part I, 57(4), 628-637 330
Riboulot, V., Cattaneo, A., Sultan, S., Garziglia, S., Ker, S., Imbert, P., Voisset, M., 2013, "Sea-level change and free gas 331
occurrence influencing a submarine landslide and pockmark formation and distribution in deepwater Nigeria", Earth and 332
Planetary Science Letters, 375, 78–91 333
Rowe, M., Gettrust, JF., 1993, "Fine structure of methane hydrate-bearing sediments on the Blake outer ridge as determined 334
from deep-towed multichannel seismic data", J. Geophys. Res., 98, 463-473 335
Sultan, N., Marsset, B., Ker, S., Marsset, T., Voisset, M., Vernant, AM.,. Bayon, G., Cauquil, E., Adamy, J., Colliat, JL., 336
Drapeau, D., 2010, "Hydrate dissolution as a potential mechanism for pockmark formation in the Niger delta", J. Geophys. 337
Res., 115, B8 338
Sultan, N., Riboulot, V., Ker, S., Marsset, B., Géli, L., Tary, JB., Klingelhoefer, F., Voisset, M., Lanfumey, V., Colliat, JL., 339
Adamy, J., Grimaud, S., 2011, " Dynamics of fault-fluid-hydrate system around a shale-cored anticline in deepwater Nigeria 340
", J. Geophys. Res., 116, B12 341
Walia, R., Hannay, D., 1999, "Source and receiver geometry corrections for deep-towed multi-channel seismic data", 342
Geophys. Res. Lett., 26, 1993-1999 343
Wood, W., Gettrust, JF., Spychalski, S., 2003, "A new deep-towed, multi-channel seismic system". Sea Technology, 44, 44-344
49, 345

15
Wood, W., Hart, P., Hutchinson, D., Dutta., N., Snyder, F., Coffin, R., Gettrust, J., 2008, "Gas and gas hydrate distribution 346
around seafloor seeps in Mississipi Canyon, Nothern Gulf of Mexico, using multi-resolution seismic imagery", Marine and 347
Petroleum Geology, 25, 952-959 348
349