Embed Size (px)
Citation preview

Deep-Time Data Infrastructure: A DCO Legacy Program
Robert M. Hazen—Geophysical Lab, Carnegie InstitutionDCO Data Science Day—RPI—June 5, 2014

Conclusions
Vast, largely untapped, data resources inform our view of Earth’s dynamic
history over 4.5 billion years.
Combining those deep-time data resources into a single infrastructure
represents an opportunity for accelerated “abductive” discovery.

Deep-Time Data CollaboratorsCarnegie Institution Robert Hazen Xiaoming Liu Anat ShaharRutgers Paul FalkowskiRPI Peter FoxUniv. of Arizona Robert Downs Mihei Ducea Grethe Hystad Barbara Lafuente Hexiong Yang Alex Pires Joaquin Ruiz Joshua Golden Melissa McMillan Shaunna Morrison
CalTech Ralph MillikenUniv. of Maine Edward GrewSmithsonian Inst. Timothy McCoyUniv. of Manitoba Andrey BekkerMINDAT.ORG Jolyon RalphColorado State Holly Stein Aaron ZimmermanUniv. of Tennessee Linda KahUniv College London Dominic PapineauGeorge Mason Univ. Stephen Elmore
Johns Hopkins Univ. Dimitri Sverjensky Charlene Estrada John Ferry Namhey LeeHarvard University Andrew KnollIndiana University David BishUniv. of Michigan Rodney EwingUniv. of Maryland James Farquhar John NanceUniv. of Wisconsin John ValleyGeol. Survey Canada Wouter Bleeker

Deep-Time Data ResourcesMineralogy and petrology data:
Mineral species and assemblages
Compositions (including isotopes)
Age (ages)
Geographic location; tectonic setting
Crystal size; morphology; twinning
Solid and fluid inclusions; defects; Magnetic domains; zoning; exsolution
Surface properties; grain boundaries

Mineralogy and petrology data
Paleobiology data
Fossil species and assemblages
Age
Biominerals; isotopic composition
Molecular biomarkers
Host lithology
Geological/tectonic context
Deep-Time Data Resources

Mineralogy and petrology data
Paleobiology data
Proteomics data
Enzyme structure and function
Age (from phylogenetics)
Active site composition
Microbial context
Deep-Time Data Resources
Mineralogy and petrology data
Paleobiology data
Proteomics data
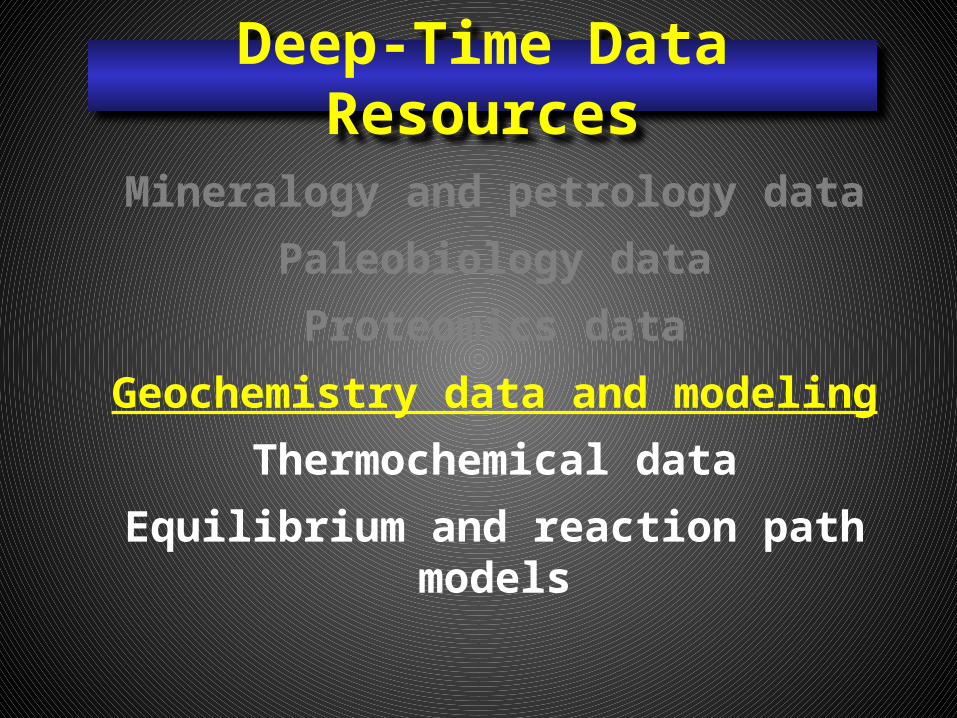
Geochemistry data and modeling
Thermochemical data
Equilibrium and reaction path models
Deep-Time Data Resources

Mineralogy and petrology data
Paleobiology data
Proteomics data
Geochemistry data and modeling
Paleotectonic & Paleomagnetic Data
Age
Deep-Time Data Resources

This is the IMA Mineral Database website, with a direct link to the Mineral
Evolution Database.

This map displays the localities. The popup demonstrates metadata for a given locality.

The Premise: Rocks, minerals, fossils, and life’s biochemistry hold
clues to significant changes in Earth’s near-surface environment
through 4.5 billion years of history.
The Potential of Deep-Time Data

The Rise of Atmospheric Oxygen
Lyons et al. (2014) Nature 506, 307-314.
D.E.Canfield (2014) Oxygen. Princeton Univ. Press

The Rise of Atmospheric Oxygen
Kump (2008) Nature 451, 277-278.
?

The Rise of Atmospheric Oxygen
D.E.Canfield (2014) Oxygen. Princeton Univ. Press.
Lyons et al. (2014) Nature 506, 307-314.

= Major metal element
= Major non-metal element
= Trace element
The Rise of Oxygen: Evidence from redox-sensitive elements

log fO2 ~ -72
Geochemical modeling is key.
The Rise of Subsurface Oxygen

SideriteFeCO3
log fO2 < -68
The Rise of Subsurface Oxygen

Azurite&
Malachite
log fO2 > -43
The Rise of Subsurface Oxygen

Reaction path calculations reveal changes in mineralogy as fluids and rocks not in equilibrium react with each
other. Data from Sverjensky et al. (in prep)
The Rise of Subsurface Oxygen:Basalt weathering before/after the GOE

Reaction path calculations reveal changes in mineralogy as fluids and rocks not in equilibrium react with each
other. Data from Sverjensky et al. (in prep)
The Rise of Subsurface Oxygen:Basalt weathering before/after the GOE
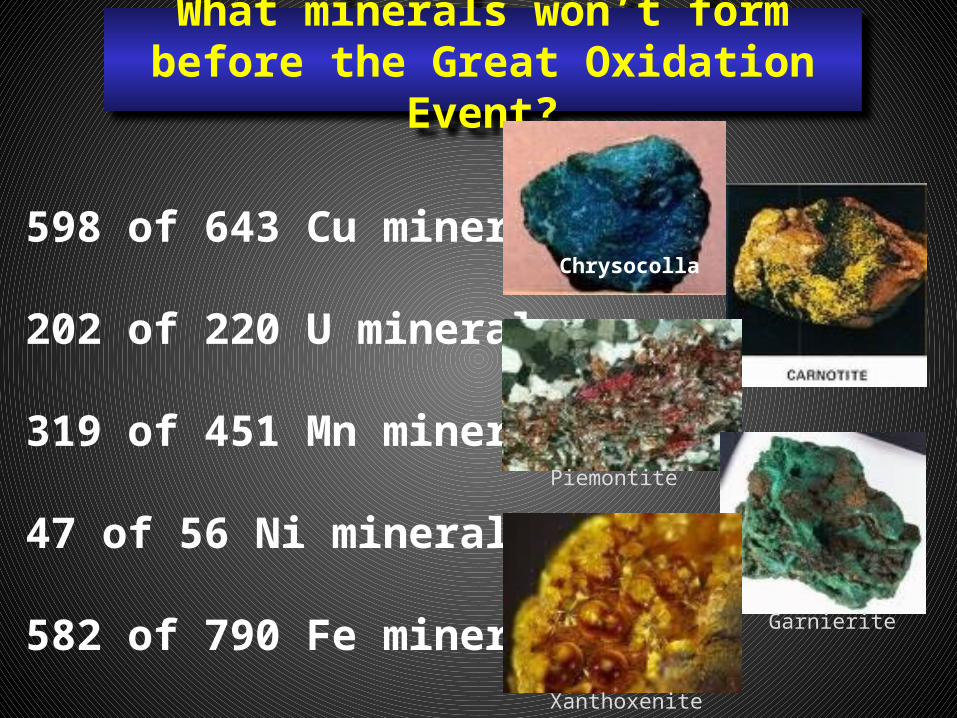
What minerals won’t form before the Great Oxidation Event?
598 of 643 Cu minerals
202 of 220 U minerals
319 of 451 Mn minerals
47 of 56 Ni minerals
582 of 790 Fe minerals
Piemontite
Garnierite
Xanthoxenite
Chrysocolla

Co-evolution of the geosphere and biosphere
Biologically mediated changes in Earth’s atmospheric composition
at ~2.4 to 2.2 Ga represent the single most significant factor in Earth’s mineralogical diversity.

Enzymes reveal Earth’s geochemical history.
Ferredoxin (before the GOE)

Nitrogenase (after the GOE)
Enzymes reveal Earth’s geochemical history.

The Rise of Subsurface Oxygen

Golden et al. (2013), EPSL
GOE HERE
SE HERE
The Rise of Subsurface Oxygen

Kump (2008) Nature 451, 277-278.
The Rise of Subsurface Oxygen

Hypothesis: There was a protracted “Great Subsurface
Oxidation Interval” that postdated the GOE by a billion
years. This interval was the single most significant factor in Earth’s
mineralogical diversification.
The Rise of Subsurface Oxygen

Most of what scientists do most of the time is start with a known phenomenon, and then collect
relevant data and develop explanatory hypotheses.
Data-Driven Discovery Data-Driven Discovery

Earth’s atmospheric oxidation influenced the partitioning of
redox-sensitive elements.
Mo, Re, Ni, and Co are redox-sensitive elements.
Therefore, we deduce that atmospheric oxidation influenced the
partitioning of Mo, Re, Ni, and Co.
DeductionDeduction

RESULTS: Molybdenite (MoS2) through Time
GOE HERE
SE HERE
Golden et al. (2013) EPSL 366:1-5.

RESULTS: Cu/Ni in carbonates vs. time
SE HERE GOE HERE
Xiaoming Liu et al. (2013)

Each of the last 5 supercontinent cycles led to episodes of enhanced mineralization
during intervals of continental convergence.
Mo, Be, B, and Hg are mineral-forming elements.
Therefore, we predict by induction that Mo, Be, B, and Hg minerals will display
enhanced mineralization during intervals of continental convergence.
InductionInduction

The Supercontinent Cycle

The Supercontinent CycleSUPERCONTINENT STAGE INTERVAL DURATION
Kenorland (Superia) Assembly 2.8-2.5 300Stable 2.5-2.4 100Breakup 2.4-2.0 400
Columbia (Nuna) Assembly 2.0-1.8 200Stable 1.8-1.6 200Breakup 1.6-1.2 400
Rodinia Assembly 1.2-1.0 200Stable 1.0-0.75 250Breakup 0.75-0.6 150
Pannotia Assembly 0.6-0.56 40Stable 0.56-0.54 20Breakup 0.54-0.43 110
Pangaea Assembly 0.43-0.25 180Stable 0.25-0.175 75Breakup 0.175-present 175

RESULTS: The Supercontinent
CYCLE
The distribution of zircon crystals through time
correlates with the supercontinent cycle over the past 3 billion years.
(Condie & Aster 2010; Hawksworth et al. 2010)

RESULTS: Mo Mineral Evolution
Temporal distribution of molybdenite (MoS2)Golden et al. (2013) EPSL 366:1-5.

Hg Mineral Evolution
The distribution of mercury (Hg) minerals through time correlates with the SC cycle
over the past 3 billion years, but there’s a gap
during Rodinia asembly.
Hazen et al. (2012) Amer. Mineral. 97:1013.

Abduction is a form of logical inference that goes from reliable data (i.e., observations), to a hypothesis that seeks to explain those data.
(Paraphrased from Wikipedia)
AbductionAbduction

Observations lead to new hypotheses.
We have vast amounts of data on mineral species, compositions, isotopes, petrologic
context, thermochemical parameters, tectonic settings, and the co-evolving
biosphere through deep time.
Previously unrecognized patterns and correlations will emerge from the
integration and evaluation of those data.
AbductionAbduction

THE CHALLENGE: Recognizing statistically meaningful patterns in
large data resources:
1. Correlations among many variables
Data-Driven DiscoveryData-Driven Discovery

Large integrated data resources can be explored with multivariate techniques (i.e., principal component analysis).
DATA-DRIVEN DISCOVERYDATA-DRIVEN DISCOVERY
Search for highly correlated patterns
among linear combinations of many different
variables.

THE CHALLENGE: Recognizing statistically meaningful patterns in
large data resources:
2. Meaningful trends in data vs. time
Data-Driven DiscoveryData-Driven Discovery

RESULTS: Molybdenite (MoS2) through Time
Golden et al. (2013) EPSL 366:1-5.
432 molybdenite samples

• Analyze equal sized bins.
• Apply statistical tests: linear regression of log Re
content vs. time. (Montgomery et al. 2006)
Are these trends statistically significant?
Are these trends statistically significant?

THE CHALLENGE: Recognizing statistically meaningful patterns
in large data resources:
3. Peak-to-noise problem
Data-Driven DiscoveryData-Driven Discovery

Peaks in ages of ~40,000 zircon crystalsPeaks in ages of ~40,000 zircon crystals
Condie & Aster (2010) Precambrian Research 180:227-236.

Condie & Aster (2010) Precambrian Research 180:227-236.
Monte Carlo Mean Kernal Density AnalysisMonte Carlo Mean Kernal Density Analysis

THE CHALLENGE: Recognizing statistically meaningful patterns
in large data resources:
4. Visualization opportunities
Data-Driven DiscoveryData-Driven Discovery
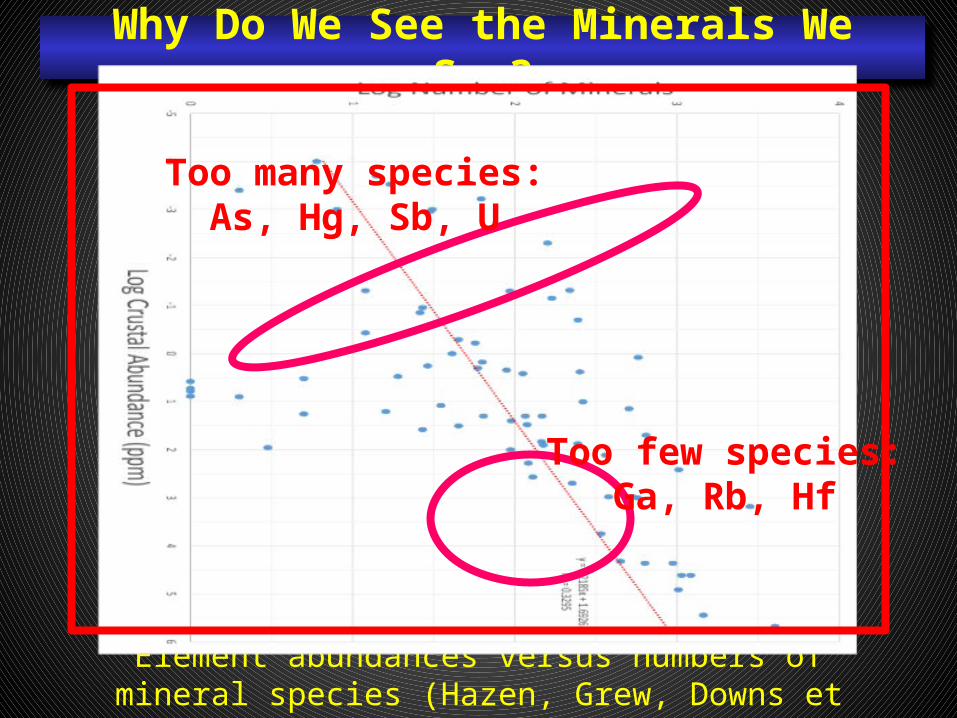
Element abundances versus numbers of mineral species (Hazen, Grew, Downs et al.)
Why Do We See the Minerals We See?
Too few species:Ga, Rb, Hf
Too many species:As, Hg, Sb, U
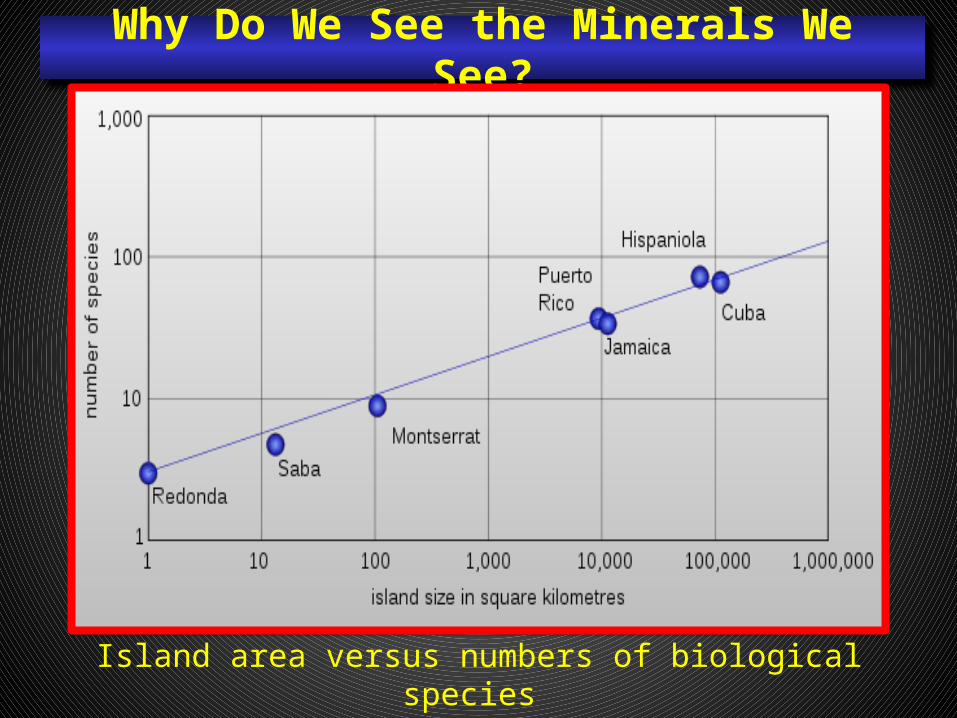
Island area versus numbers of biological species (MacArthur and Wilson, 1967)
Why Do We See the Minerals We See?

What percentage of minerals incorporating element X, also incorporates element Y? (Hazen, Fox, Downs et al.)
Cobalt minerals that also incorporate arsenic
Why Do We See the Minerals We See?

Frequency distributions of 4933 mineral species: 22% of mineral species are known from only one locality.
Why Do We See the Minerals We See?

Frequency distributions of 4933 mineral species: 22% of mineral species are known from only one locality.
Therefore:
(1) Numerous additional minerals exist on Earthbut as yet remain undescribed.
(2) Numerous other plausible minerals do not now exist on Earth, but might have in the past,
or might occur on other Earth-like planets.
(3) If we “played the tape over again,” then the first 4933 minerals to be found would likely
differ by ~1000 mineral species.
Why Do We See the Minerals We See?

Conclusions
Vast, largely untapped, data resources inform our view of Earth’s dynamic
history over 4.5 billion years.
Combining those deep-time data resources into a single infrastructure
represents an opportunity for accelerated “abductive” discovery.

CONCLUSIONS
We are poised to make fundamental discoveries about our planetary home through development, integration, and
exploration of deep-time data resources.
Data-Driven Discovery

Please join this effort:• Archive your data
• Release “dark data”• Help us build this resource

Statistical tests: linear regression of log Re content vs. time
(Montgomery et al. 2006):
Log(Re) = β0+β1t+β2x2+β3x3+β4x4+β5x5+β6x6
[t = time; βi = regression parameters; xi = indicator variables]
β0=0; β1=0.0059(8); β2=4.6(7); β3=12(2); β4=15(2); β5=18(2); β6=19(2)
Are these trends statistically significant?
Are these trends statistically significant?

Enzymes reveal Earth’s geochemical history.
David & Alm (2011) “Rapid evolutionary innovation during an Archean genetic expansion.” Nature 469,93-96.