Embed Size (px)
Citation preview
19. BASALTS FROM THE ATLANTIC CRUST WEST OF THE BARBADOS RIDGE (SITE 543,LEG 78A): GEOCHEMISTRY AND MINERALOGY1
H. Bougault, J. L. Joron, R. C. Maury, M. Bohn, M. Tardy, and B. Biju-Duval2
ABSTRACT
The upper part of the basaltic substratum of the Atlantic abyssal plain, approaching subduction beneath the Barba-dos Ridge and thus presumably beneath the Lesser Antilles island arc, is made of typical LREE-depleted oceanic tho-leiites. Mineralogical (microprobe) and geochemical (X-ray fluorescence, neutron activation analyses) data are given for12 samples from the bottom of Hole 543A, which is 3.5 km seaward of the deformation front of the Barbados Ridgecomplex. These basalts are overlain by a Quaternary to Maestrichtian-Campanian sedimentary sequence. Most of thebasalts are relatively fresh (in spite of the alteration of olivine and development of some celadonite, clays, and chloritein their groundmass), and their mineralogical and geochemical compositions are similar to those of LREE-depleted re-cent basalts from the Mid-Atlantic Ridge. The most altered samples occur at the top of the basaltic sequence, and showtrends of enrichment in alkali metals typical of altered oceanic tholeiites.
INTRODUCTION
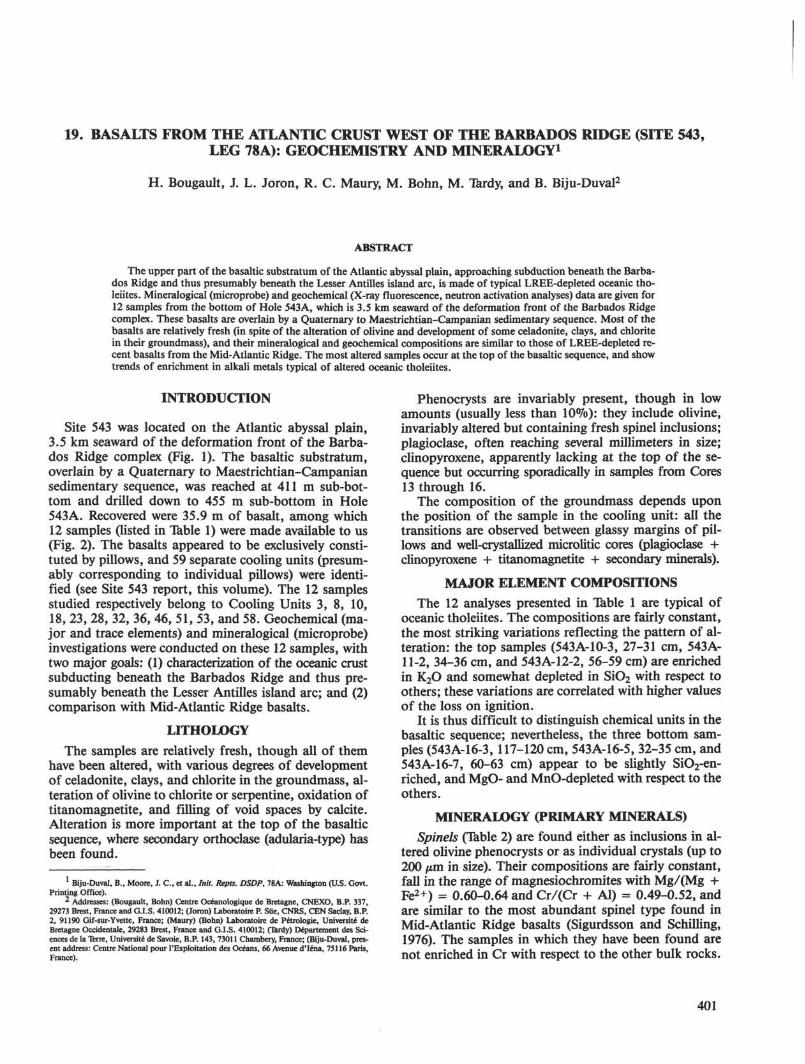
Site 543 was located on the Atlantic abyssal plain,3.5 km seaward of the deformation front of the Barba-dos Ridge complex (Fig. 1). The basaltic substratum,overlain by a Quaternary to Maestrichtian-Campaniansedimentary sequence, was reached at 411 m sub-bot-tom and drilled down to 455 m sub-bottom in Hole543A. Recovered were 35.9 m of basalt, among which12 samples (listed in Table 1) were made available to us(Fig. 2). The basalts appeared to be exclusively consti-tuted by pillows, and 59 separate cooling units (presum-ably corresponding to individual pillows) were identi-fied (see Site 543 report, this volume). The 12 samplesstudied respectively belong to Cooling Units 3, 8, 10,18, 23, 28, 32, 36, 46, 51, 53, and 58. Geochemical (ma-jor and trace elements) and mineralogical (microprobe)investigations were conducted on these 12 samples, withtwo major goals: (1) characterization of the oceanic crustsubducting beneath the Barbados Ridge and thus pre-sumably beneath the Lesser Antilles island arc; and (2)comparison with Mid-Atlantic Ridge basalts.
LITHOLOGYThe samples are relatively fresh, though all of them
have been altered, with various degrees of developmentof celadonite, clays, and chlorite in the groundmass, al-teration of olivine to chlorite or serpentine, oxidation oftitanomagnetite, and filling of void spaces by calcite.Alteration is more important at the top of the basalticsequence, where secondary orthoclase (adularia-type) hasbeen found.
Biju-Duval, B., Moore, J. C , et al., Init. Repts. DSDP, 78A: Washington (U.S. Govt.Printing Office).
2 Addresses: (Bougault, Bohn) Centre Océanologique de Bretagne, CNEXO, B.P. 337,29273 Brest, France and CLS. 410012; (Joron) Laboratoire P. Sue, CNRS, CEN Saclay, B.P.2, 91190 Gif-sur-Yvette, France; (Maury) (Bohn) Laboratoire de Pétrologie, Université deBretagne Occidentale, 29283 Brest, France and G.I.S. 410012; (lardy) Département des Sci-ences de la lerre, Université de Savoie, B.P. 143, 73011 Chambery, France; (Biju-Duval, pres-ent address: Centre National pour PExploitation des Oceans, 66 Avenue d'Iéna, 75116 Paris,France).
Phenocrysts are invariably present, though in lowamounts (usually less than 10%): they include olivine,invariably altered but containing fresh spinel inclusions;Plagioclase, often reaching several millimeters in size;clinopyroxene, apparently lacking at the top of the se-quence but occurring sporadically in samples from Cores13 through 16.
The composition of the groundmass depends uponthe position of the sample in the cooling unit: all thetransitions are observed between glassy margins of pil-lows and well-crystallized microlitic cores (Plagioclase +clinopyroxene + titanomagnetite + secondary minerals).
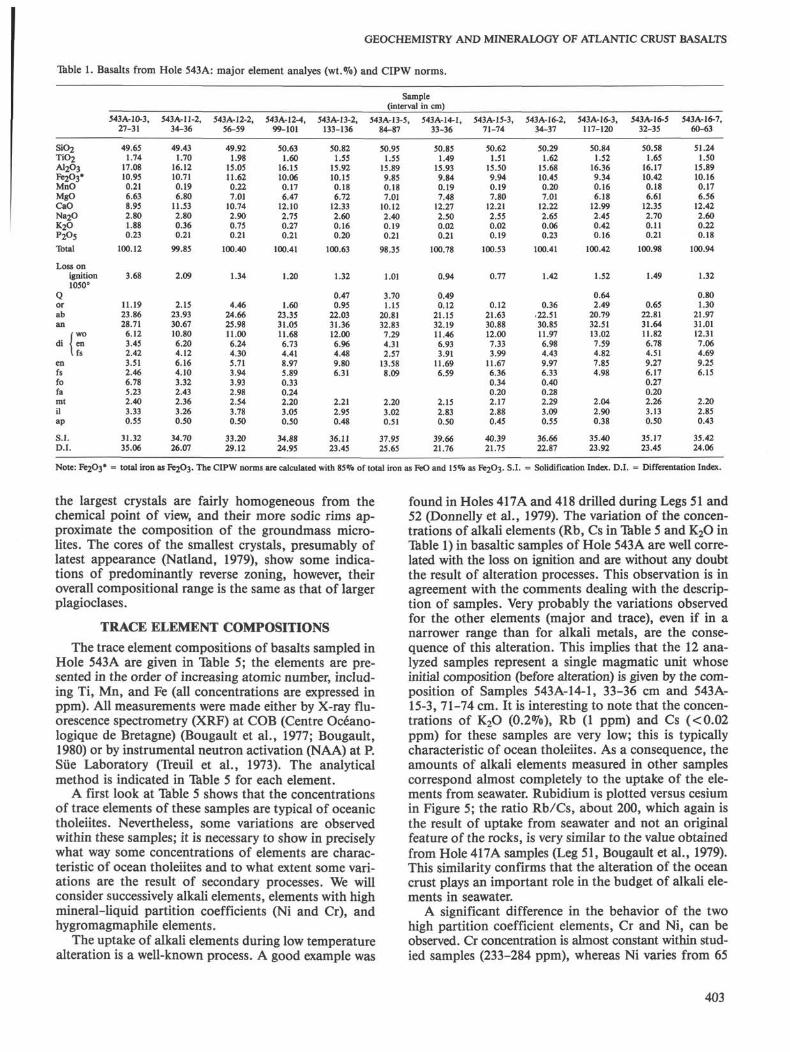
MAJOR ELEMENT COMPOSITIONSThe 12 analyses presented in Table 1 are typical of
oceanic tholeiites. The compositions are fairly constant,the most striking variations reflecting the pattern of al-teration: the top samples (543A-1O-3, 27-31 cm, 543A-11-2, 34-36 cm, and 543A-12-2, 56-59 cm) are enrichedin K2O and somewhat depleted in SiO2 with respect toothers; these variations are correlated with higher valuesof the loss on ignition.
It is thus difficult to distinguish chemical units in thebasaltic sequence; nevertheless, the three bottom sam-ples (543A-16-3, 117-120 cm, 543A-16-5, 32-35 cm, and543A-16-7, 60-63 cm) appear to be slightly SiO2-en-riched, and MgO- and MnO-depleted with respect to theothers.
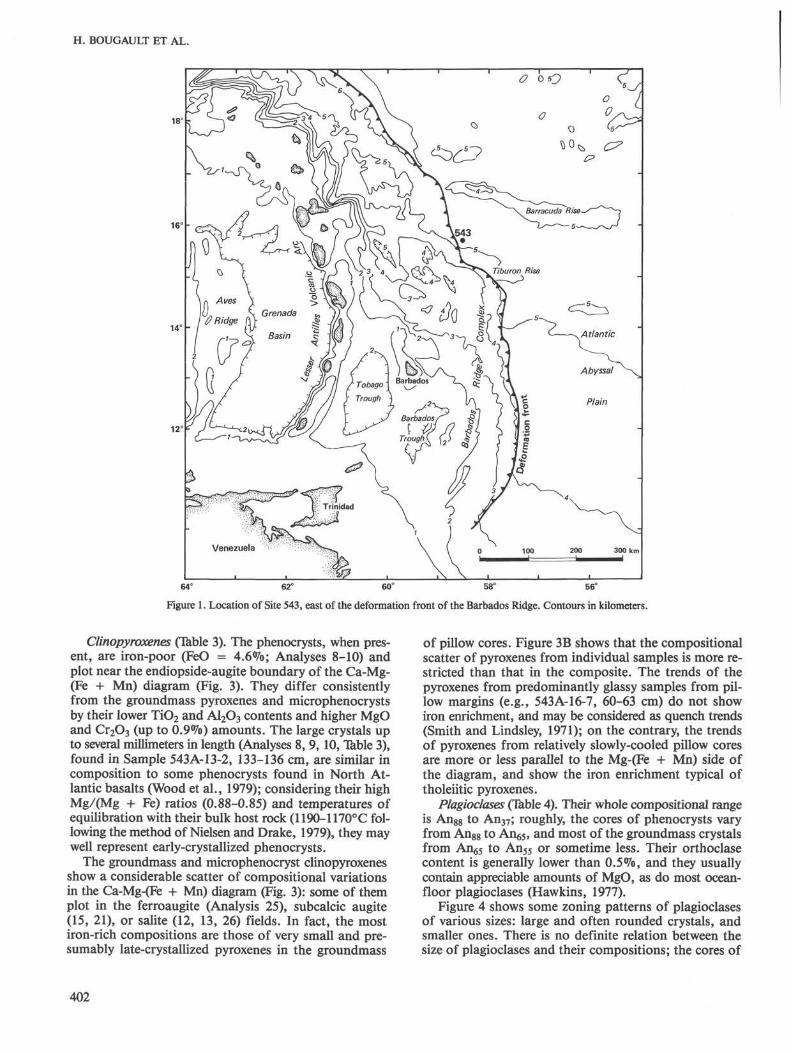
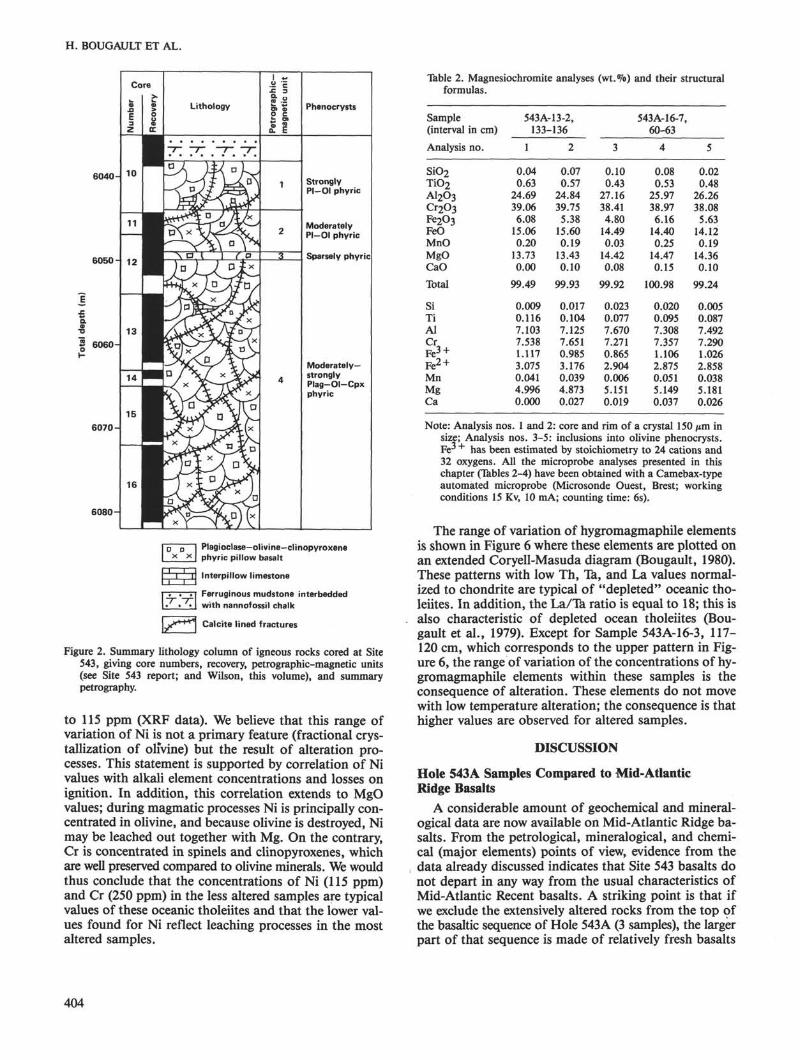
MINERALOGY (PRIMARY MINERALS)Spinels (Table 2) are found either as inclusions in al-
tered olivine phenocrysts or as individual crystals (up to200 µm in size). Their compositions are fairly constant,fall in the range of magnesiochromites with Mg/(Mg +Fe2*) = 0.60-0.64 and Cr/(Cr + Al) = 0.49-0.52, andare similar to the most abundant spinel type found inMid-Atlantic Ridge basalts (Sigurdsson and Schilling,1976). The samples in which they have been found arenot enriched in Cr with respect to the other bulk rocks.
401
H. BOUGAULT ET AL.
64° 62° 60° 58° 56°
Figure 1. Location of Site 543, east of the deformation front of the Barbados Ridge. Contours in kilometers.
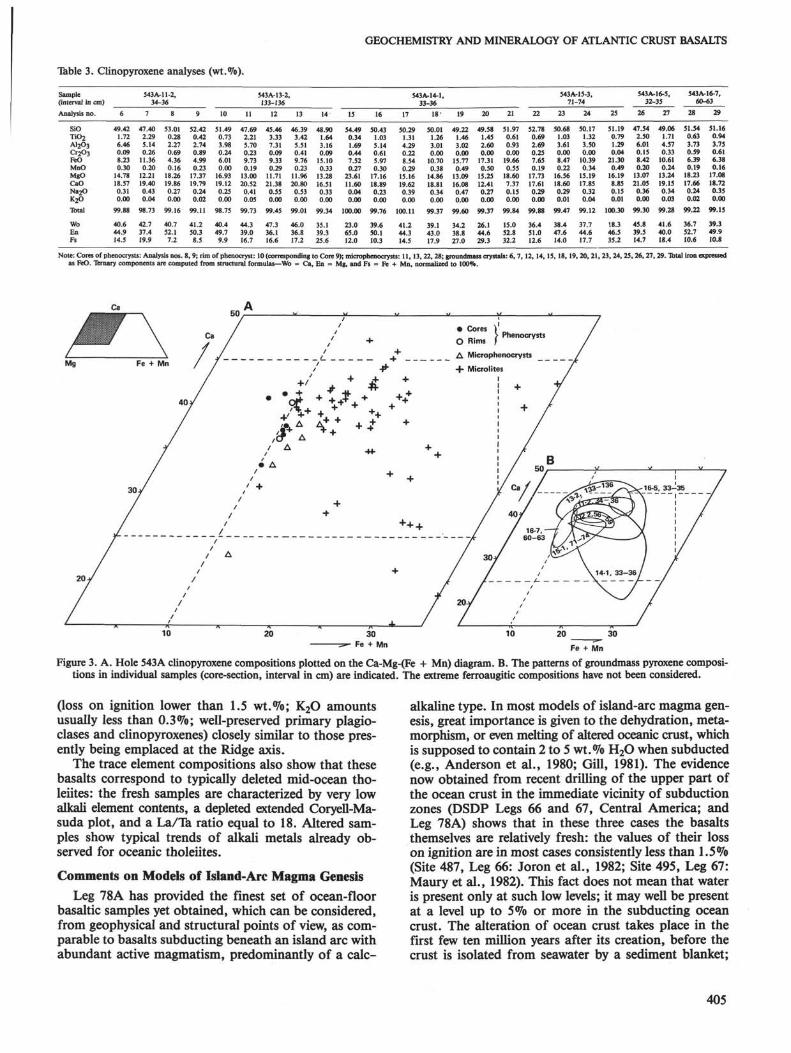
Clinopyroxenes (Table 3). The phenocrysts, when pres-ent, are iron-poor (FeO = 4.6%; Analyses 8-10) andplot near the endiopside-augite boundary of the Ca-Mg-(Fe + Mn) diagram (Fig. 3). They differ consistentlyfrom the groundmass pyroxenes and microphenocrystsby their lower TiO2 and A12O3 contents and higher MgOand Cr2O3 (up to 0.9%) amounts. The large crystals upto several millimeters in length (Analyses 8, 9, 10, Table 3),found in Sample 543A-13-2, 133-136 cm, are similar incomposition to some phenocrysts found in North At-lantic basalts (Wood et al., 1979); considering their highMg/(Mg + Fe) ratios (0.88-0.85) and temperatures ofequilibration with their bulk host rock (1190-1170°C fol-lowing the method of Nielsen and Drake, 1979), they maywell represent early-crystallized phenocrysts.
The groundmass and microphenocryst clinopyroxenesshow a considerable scatter of compositional variationsin the Ca-Mg-(Fe + Mn) diagram (Fig. 3): some of themplot in the ferroaugite (Analysis 25), subcalcic augite(15, 21), or salite (12, 13, 26) fields. In fact, the mostiron-rich compositions are those of very small and pre-sumably late-crystallized pyroxenes in the groundmass
of pillow cores. Figure 3B shows that the compositionalscatter of pyroxenes from individual samples is more re-stricted than that in the composite. The trends of thepyroxenes from predominantly glassy samples from pil-low margins (e.g., 543A-16-7, 60-63 cm) do not showiron enrichment, and may be considered as quench trends(Smith and Lindsley, 1971); on the contrary, the trendsof pyroxenes from relatively slowly-cooled pillow coresare more or less parallel to the Mg-(Fe + Mn) side ofthe diagram, and show the iron enrichment typical oftholeiitic pyroxenes.
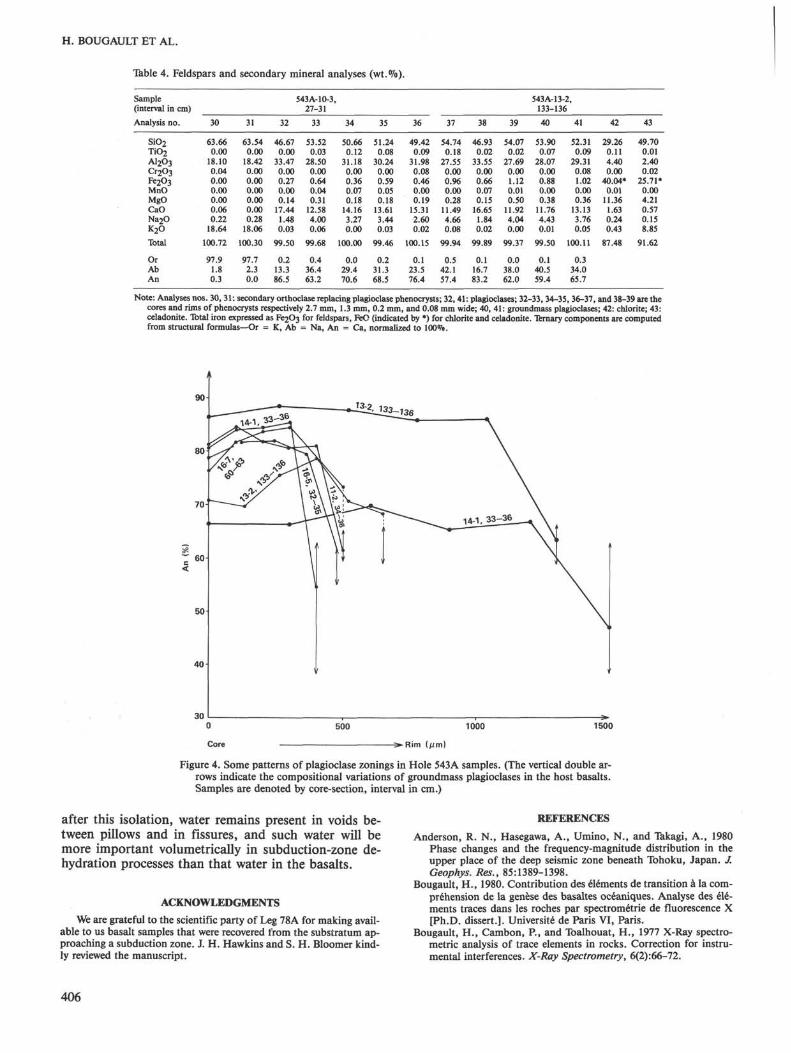
Plagioclase (Table 4). Their whole compositional rangeis An88 to An37; roughly, the cores of phenocrysts varyfrom An88 to An65, and most of the groundmass crystalsfrom An65 to An55 or sometime less. Their orthoclasecontent is generally lower than 0.5%, and they usuallycontain appreciable amounts of MgO, as do most ocean-floor plagioclases (Hawkins, 1977).
Figure 4 shows some zoning patterns of plagioclasesof various sizes: large and often rounded crystals, andsmaller ones. There is no definite relation between thesize of plagioclases and their compositions; the cores of
402
GEOCHEMISTRY AND MINERALOGY OF ATLANTIC CRUST BASALTS
Table 1. Basalts from Hole 543A: major element analyes (wt.%) and CIPW norms.
SiO2
Tiθ2A12O3
Fe2O3*MnOMgOCaONa2OK2OP2O5
Total
Loss onignition1050°
Qoraban
1 wodi < en
Ifsenfsfofamtilap
S.I.D.I.
543A-10-3,27-31
49.651.74
17.0810.950.216.638.952.801.880.23
100.12
3.68
11.1923.8628.71
6.123.452.423.512.466.785.232.403.330.55
31.3235.06
543A-11-2,34-36
49.431.70
16.1210.710.196.80
11.532.800.360.21
99.85
2.09
2.1523.9330.6710.806.204.126.164.103.322.432.363.260.50
34.7026.07
543A-12-2,56-59
49.921.98
15.0511.620.227.01
10.742.900.750.21
100.40
1.34
4.4624.6625.9811.006.244.305.713.943.932.982.543.780.50
33.2029.12
543A-12-4,99-101
50.631.60
16.1510.060.176.47
12.102.750.270.21
100.41
1.20
1.6023.3531.0511.686.734.418.975.890.330.242.203.050.50
34.8824.95
543A-13-2,133-136
50.821.55
15.9210.150.186.72
12.332.600.160.20
100.63
1.32
0.470.95
22.0331.3612.006.964.489.806.31
2.212.950.48
36.1123.45
Sample(interval in cm)
543A-13-5,84-87
50.951.55
15.899.850.187.01
10.122.400.190.21
98.35
1.01
3.701.15
20.8132.83
7.294.312.57
13.588.09
2.203.020.51
37.9525.65
543A-14-1,33-36
50.851.49
15.939.840.197.48
12.272.500.020.21
100.78
0.94
0.490.12
21.1532.1911.466.933.91
11.696.59
2.152.830.50
39.6621.76
543A-15-3,71-74
50.621.51
15.509.940.197.80
12.212.550.020.19
100.53
0.77
0.1221.6330.8812.007.333.99
11.676.360.340.202.172.880.45
40.3921.75
543A-16-2,34-37
50.291.62
15.6810.450.207.01
12.222.650.060.23
100.41
1.42
0.36.22.5130.8511.976.984.439.976.330.400.282.293.090.55
36.6622.87
543A-16-3,117-120
50.841.52
16.369.340.166.18
12.992.450.420.16
100.42
1.52
0.642.49
20.7932.5113.027.594.827.854.98
2.042.900.38
35.4023.92
543A-16-532-35
50.581.65
16.1710.420.186.61
12.352.700.110.21
100.98
1.49
0.6522.8131.6411.826.784.519.276.170.270.202.263.130.50
35.1723.45
543A-16-7,60-63
51.241.50
15.8910.160.176.56
12.422.600.220.18
100.94
1.32
0.801.30
21.9731.0112.317.064.699.256.15
2.202.850.43
35.4224.06
Note: Fβ2θ3* = total iron as Fe2θ3 The CIPW norms are calculated with 85% of total iron as FeO and 15<% as Fe2θ3• S.I. = Solidification Index. D.I. = Differentation Index.
the largest crystals are fairly homogeneous from thechemical point of view, and their more sodic rims ap-proximate the composition of the groundmass micro-lites. The cores of the smallest crystals, presumably oflatest appearance (Natland, 1979), show some indica-tions of predominantly reverse zoning, however, theiroverall compositional range is the same as that of largerplagioclases.
TRACE ELEMENT COMPOSITIONS
The trace element compositions of basalts sampled inHole 543A are given in Table 5; the elements are pre-sented in the order of increasing atomic number, includ-ing Ti, Mn, and Fe (all concentrations are expressed inppm). All measurements were made either by X-ray flu-orescence spectrometry (XRF) at COB (Centre Océano-logique de Bretagne) (Bougault et al., 1977; Bougault,1980) or by instrumental neutron activation (NAA) at P.Sue Laboratory (Treuil et al., 1973). The analyticalmethod is indicated in Table 5 for each element.
A first look at Table 5 shows that the concentrationsof trace elements of these samples are typical of oceanictholeiites. Nevertheless, some variations are observedwithin these samples; it is necessary to show in preciselywhat way some concentrations of elements are charac-teristic of ocean tholeiites and to what extent some vari-ations are the result of secondary processes. We willconsider successively alkali elements, elements with highmineral-liquid partition coefficients (Ni and Cr), andhygromagmaphile elements.
The uptake of alkali elements during low temperaturealteration is a well-known process. A good example was
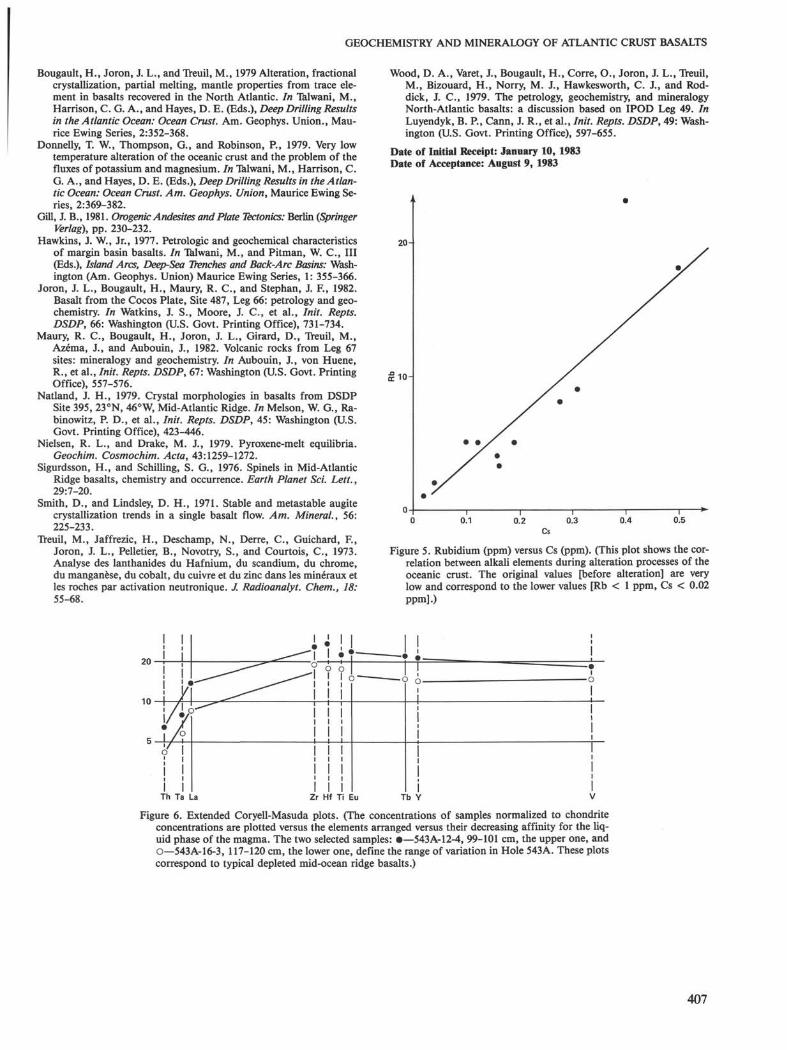
found in Holes 417A and 418 drilled during Legs 51 and52 (Donnelly et al., 1979). The variation of the concen-trations of alkali elements (Rb, Cs in Table 5 and K2O inTable 1) in basaltic samples of Hole 543 A are well corre-lated with the loss on ignition and are without any doubtthe result of alteration processes. This observation is inagreement with the comments dealing with the descrip-tion of samples. Very probably the variations observedfor the other elements (major and trace), even if in anarrower range than for alkali metals, are the conse-quence of this alteration. This implies that the 12 ana-lyzed samples represent a single magmatic unit whoseinitial composition (before alteration) is given by the com-position of Samples 543A-14-1, 33-36 cm and 543A-15-3, 71-74 cm. It is interesting to note that the concen-trations of K2O (0.2%), Rb (1 ppm) and Cs (<0.02ppm) for these samples are very low; this is typicallycharacteristic of ocean tholeiites. As a consequence, theamounts of alkali elements measured in other samplescorrespond almost completely to the uptake of the ele-ments from seawater. Rubidium is plotted versus cesiumin Figure 5; the ratio Rb/Cs, about 200, which again isthe result of uptake from seawater and not an originalfeature of the rocks, is very similar to the value obtainedfrom Hole 417A samples (Leg 51, Bougault et al., 1979).This similarity confirms that the alteration of the oceancrust plays an important role in the budget of alkali ele-ments in seawater.
A significant difference in the behavior of the twohigh partition coefficient elements, Cr and Ni, can beobserved. Cr concentration is almost constant within stud-ied samples (233-284 ppm), whereas Ni varies from 65
403
H. BOUGAULT ET AL.
6040-
6050-
2 6060-
6070-
6080-
Core
Nu
mb
er
10
11
12
-
13
14
15
-
16
Re
co
very
1
111
"cf
-–)
34+
-<
%3D
i
α
×
Lithology
" T- -7- "
\ D I I r-
× y^T—rf̂ Cf-
7 "
fσ- ×
°/\K
X
Tv
ihic
—u
nit
Pβ
tro
gra
f
ma
gn
eti
c
1
2
3
Phenocrysts
StronglyPI—Ol phyric
ModeratelyPI-OI phyric
Sparsely phyric
Moderately—stronglyPlag—Ol—Cpxphyric
Table 2. Magnesiochromite analyses (wt.%) and their structuralformulas.
1 0 I Plagioclase—olivine—clinopyroxene× I phyric pillow basalt
Interpillow limestone
Ferruginous mudstone interbeddedwith nannofossil chalk
Calcite lined fractures
Figure 2. Summary lithology column of igneous rocks cored at Site543, giving core numbers, recovery, petrographic-magnetic units(see Site 543 report; and Wilson, this volume), and summarypetrography.
to 115 ppm (XRF data). We believe that this range ofvariation of Ni is not a primary feature (fractional crys-tallization of olivine) but the result of alteration pro-cesses. This statement is supported by correlation of Nivalues with alkali element concentrations and losses onignition. In addition, this correlation extends to MgOvalues; during magmatic processes Ni is principally con-centrated in olivine, and because olivine is destroyed, Nimay be leached out together with Mg. On the contrary,Cr is concentrated in spinels and clinopyroxenes, whichare well preserved compared to olivine minerals. We wouldthus conclude that the concentrations of Ni (115 ppm)and Cr (250 ppm) in the less altered samples are typicalvalues of these oceanic tholeiites and that the lower val-ues found for Ni reflect leaching processes in the mostaltered samples.
Sample(interval in cm)
Analysis no.
SiO2
Tiθ2A12O3
Cr 2 O 3
Fe 2 O 3
FeOMnOMgOCaO
Total
SiTiAlC r ^Fe3 +
Fe2 +
MnMgCa
543A-13-2,133-136
1
0.040.63
24.6939.066.08
15.060.20
13.730.00
99.49
0.0090.1167.1037.5381.1173.0750.0414.9960.000
2
0.070.57
24.8439.75
5.3815.600.19
13.430.10
99.93
0.0170.1047.1257.6510.9853.1760.0394.8730.027
3
0.100.43
27.1638.414.80
14.490.03
14.420.08
99.92
0.0230.0777.6707.2710.8652.9040.0065.1510.019
543A-16-7,60-63
4
0.080.53
25.9738.97
6.1614.400.25
14.470.15
100.98
0.0200.0957.3087.3571.1062.8750.0515.1490.037
5
0.020.48
26.2638.08
5.6314.120.19
14.360.10
99.24
0.0050.0877.4927.2901.0262.8580.0385.1810.026
Note: Analysis nos. 1 and 2: core and rim of a crystal 150 µm insize; Analysis nos. 3-5: inclusions into olivine phenocrysts.Fe-*+ has been estimated by stoichiometry to 24 cations and32 oxygens. All the microprobe analyses presented in thischapter (Tables 2-4) have been obtained with a Camebax-typeautomated microprobe (Microsonde Ouest, Brest; workingconditions 15 Kv, 10 mA; counting time: 6s).
The range of variation of hygromagmaphile elementsis shown in Figure 6 where these elements are plotted onan extended Coryell-Masuda diagram (Bougault, 1980).These patterns with low Th, Ta, and La values normal-ized to chondrite are typical of "depleted" oceanic tho-leiites. In addition, the La/Ta ratio is equal to 18; this isalso characteristic of depleted ocean tholeiites (Bou-gault et al., 1979). Except for Sample 543A-16-3, 117-120 cm, which corresponds to the upper pattern in Fig-ure 6, the range of variation of the concentrations of hy-gromagmaphile elements within these samples is theconsequence of alteration. These elements do not movewith low temperature alteration; the consequence is thathigher values are observed for altered samples.
DISCUSSION
Hole 543A Samples Compared to Mid-Atlantic
Ridge Basalts
A considerable amount of geochemical and mineral-ogical data are now available on Mid-Atlantic Ridge ba-salts. From the petrological, mineralogical, and chemi-cal (major elements) points of view, evidence from thedata already discussed indicates that Site 543 basalts donot depart in any way from the usual characteristics ofMid-Atlantic Recent basalts. A striking point is that ifwe exclude the extensively altered rocks from the top ofthe basaltic sequence of Hole 543A (3 samples), the largerpart of that sequence is made of relatively fresh basalts
404
GEOCHEMISTRY AND MINERALOGY OF ATLANTIC CRUST BASALTS
Table 3. Clinopyroxene analyses (wt.%).
Sample(interval in cm)
Analysis no.
SiOTiO2
AI2O3
c r 2 o 3FeOMnOMgOCaONa2θK2O
Total
WoEnFs
6
49.421.726.460.098.230.30
14.7818.570.310.00
99.88
40.644.914.5
543A-U-2,34-36
7
47.402.295.140.26
11.360.20
12.2119.400.430.04
98.73
42.737.419.9
8
53.010.282.270.694.360.16
18.2619.860.270.00
99.16
40.752.1
7.2
9
52.420.422.740.894.990.23
17.3719.790.240.02
99.11
41.250.3
8.5
10
51.490.733.980.246.010.00
16.9319.120.250.00
98.75
40.449.7
9.9
11
47.692.215.700.239.730.19
13.0020.52
0.410.05
99.73
44.339.016.7
543A-13-2,133-136
12
45.463.337.310.099.330.29
11.7121.38
0.550.00
99.45
47.336.116.6
13
46.393.425.510.419.760.23
11.9620.80
0.530.00
99.01
46.036.817.2
14
48.901.643.160.09
15.100.33
13.2816.510.330.00
99.34
35.139.325.6
15
54.490.341.690.447.520.27
23.6111.600.040.00
100.00
23.065.012.0
16
50.431.035.140.615.970.30
17.1618.890.230.00
99.76
39.650.110.3
543A-14-1,:
17
50.291.314.290.228.540.29
15.1619.620.390.00
100.11
41.244.314.5
13-36
18'
50.011.263.010.00
10.700.38
14.8618.810.340.00
99.37
39.143.017.9
19
49.221.463.020.00
15.770.49
13.0916.080.470.00
99.60
34.238.827.0
20
49.581.452.600.00
17.310.50
15.2512.410.270.00
99.37
26.144.629.3
21
51.970.610.930.00
19.660.55
18.607.370.150.00
99.84
15.052.832.2
22
52.780.692.690.257.650.19
17.7317.610.290.00
99.88
36.451.012.6
543A-15-3,71-74
23
50.681.033.610.008.470.22
16.5618.600.290.01
99.47
38.447.614.0
24
50.171.323.500.00
10.390.34
15.1917.850.320.04
99.12
37.744.617.7
25
51.190.791.290.04
21.300.49
16.198.850.150.01
100.30
!8.346.535.2
543A-16-5,32-35
26
47.542.506.010.158.420.20
13.0721.05
0.360.00
99.30
45.839.514.7
27
49.061.714.570.33
10.610.24
13.2419.150.340.03
99.28
41.640.018.4
543A-16-7,60-63
28
51.540.633.730.596.390.19
18.2317.660.240.02
99.22
36.752.710.6
29
51.160.943.750.616.380.16
17.0818.720.350.00
99.15
39.349.910.8
Note: Cores of phenocrysts: Analysis nos. 8, 9; rim of phenocryst: 10 (corresponding to Core 9); microphenocrysts: 11,13,22,28; groundmass crystals: 6,7, 12,14,15, 18,19,20,21,23, 24,25,26,27, 29. Total iron expressedas FeO. Ternary components are computed from structural formulas—Wo = Ca, En = Mg, and Fs = Fe + Mn, normalized to 100%.
20 30
Fe + Mn
Figure 3. A. Hole 543A clinopyroxene compositions plotted on the Ca-Mg-(Fe + Mn) diagram. B. The patterns of groundmass pyroxene composi-tions in individual samples (core-section, interval in cm) are indicated. The extreme ferroaugitic compositions have not been considered.
(loss on ignition lower than 1.5 wt.%; K2O amountsusually less than 0.3%; well-preserved primary plagio-clases and clinopyroxenes) closely similar to those pres-ently being emplaced at the Ridge axis.
The trace element compositions also show that thesebasalts correspond to typically deleted mid-ocean tho-leiites: the fresh samples are characterized by very lowalkali element contents, a depleted extended Coryell-Ma-suda plot, and a La/Ik ratio equal to 18. Altered sam-ples show typical trends of alkali metals already ob-served for oceanic tholeiites.
Comments on Models of Island-Arc Magma Genesis
Leg 78A has provided the finest set of ocean-floorbasaltic samples yet obtained, which can be considered,from geophysical and structural points of view, as com-parable to basalts subducting beneath an island arc withabundant active magmatism, predominantly of a calc-
alkaline type. In most models of island-arc magma gen-esis, great importance is given to the dehydration, meta-morphism, or even melting of altered oceanic crust, whichis supposed to contain 2 to 5 wt.% H2O when subducted(e.g., Anderson et al., 1980; Gill, 1981). The evidencenow obtained from recent drilling of the upper part ofthe ocean crust in the immediate vicinity of subductionzones (DSDP Legs 66 and 67, Central America; andLeg 78A) shows that in these three cases the basaltsthemselves are relatively fresh: the values of their losson ignition are in most cases consistently less than 1.5%(Site 487, Leg 66: Joron et al., 1982; Site 495, Leg 67:Maury et al., 1982). This fact does not mean that wateris present only at such low levels; it may well be presentat a level up to 5% or more in the subducting oceancrust. The alteration of ocean crust takes place in thefirst few ten million years after its creation, before thecrust is isolated from seawater by a sediment blanket;
405
H. BOUGAULT ET AL.
Table 4. Feldspars and secondary mineral analyses (wt.%).
Sample(interval in cm)
Analysis no.
Siθ2Tiθ2A12O3
Cr 2 O 3
Fe2O3
MnOMgOCaONa2OK2O
Total
OrAbAn
30
63.660.00
18.100.040.000.000.000.060.22
18.64
100.72
97.91.80.3
31
63.540.00
18.420.000.000.000.000.000.28
18.06
100.30
97.72.30.0
32
46.670.00
33.470.000.270.000.14
17.441.480.03
99.50
0.213.386.5
543A-10-3,27-31
33
53.520.03
28.500.000.640.040.31
12.584.000.06
99.68
0.436.463.2
34
50.660.12
31.180.000.360.070.18
14.163.270.00
100.00
0.029.470.6
35
51.240.08
30.240.000.590.050.18
13.613.440.03
99.46
0.231.368.5
36
49.420.09
31.980.080.460.000.19
15.312.600.02
100.15
0.123.576.4
37
54.740.18
27.550.000.960.000.28
11.494.660.08
99.94
0.542.157.4
38
46.930.02
33.550.000.660.070.15
16.651.840.02
99.89
0.116.783.2
39
54.070.02
27.690.001.120.010.50
11.924.040.00
99.37
0.038.062.0
543A-13-2,133-136
40
53.900.07
28.070.000.880.000.38
11.764.430.01
99.50
0.140.559.4
41
52.310.09
29.310.081.020.000.36
13.133.760.05
100.11
0.334.065.7
42
29.260.114.400.00
40.04*0.01
11.361.630.240.43
87.48
43
49.700.012.400.02
25.71*0.004.210.570.158.85
91.62
Note: Analyses nos. 30, 31: secondary orthoclase replacing Plagioclase phenocrysts; 32,41: plagioclases; 32-33, 34-35, 36-37, and 38-39 are thecores and rims of phenocrysts respectively 2.7 mm, 1.3 mm, 0.2 mm, and 0.08 mm wide; 40, 41: groundmass plagioclases; 42: chlorite; 43:celadonite. Total iron expressed as Fe 2θ3 for feldspars, FeO (indicated by *) for chlorite and celadonite. Ternary components are computedfrom structural formulas—Or = K, Ab = Na, An = Ca, normalized to 100%.
1500
•> Rim (µm)
Figure 4. Some patterns of Plagioclase zonings in Hole 543A samples. (The vertical double ar-rows indicate the compositional variations of groundmass plagioclases in the host basalts.Samples are denoted by core-section, interval in cm.)
after this isolation, water remains present in voids be-tween pillows and in fissures, and such water will bemore important volumetrically in subduction-zone de-hydration processes than that water in the basalts.
ACKNOWLEDGMENTS
We are grateful to the scientific party of Leg 78A for making avail-able to us basalt samples that were recovered from the substratum ap-proaching a subduction zone. J. H. Hawkins and S. H. Bloomer kind-ly reviewed the manuscript.
REFERENCES
Anderson, R. N., Hasegawa, A., Umino, N., and Takagi, A., 1980Phase changes and the frequency-magnitude distribution in theupper place of the deep seismic zone beneath Tohoku, Japan. J.Geophys. Res., 85:1389-1398.
Bougault, H., 1980. Contribution des elements de transition à la com-prehension de la genèse des basaltes océaniques. Analyse des ele-ments traces dans les roches par spectrométrie de fluorescence X[Ph.D. dissert.]. Université de Paris VI, Paris.
Bougault, H., Cambon, P., and Toalhouat, H., 1977 X-Ray spectro-métrie analysis of trace elements in rocks. Correction for instru-mental interferences. X-Ray Spectrometry, 6(2):66-72.
406
GEOCHEMISTRY AND MINERALOGY OF ATLANTIC CRUST BASALTS
Bougault, H., Joron, J. L., and Treuil, M., 1979 Alteration, fractionalcrystallization, partial melting, mantle properties from trace ele-ment in basalts recovered in the North Atlantic. In Talwani, M.,Harrison, C. G. A., and Hayes, D. E. (Eds.), Deep Drilling Resultsin the Atlantic Ocean: Ocean Crust. Am. Geophys. Union., Mau-rice Ewing Series, 2:352-368.
Donnelly, T. W., Thompson, G., and Robinson, P., 1979. Very lowtemperature alteration of the oceanic crust and the problem of thefluxes of potassium and magnesium. In Talwani, M., Harrison, C.G. A., and Hayes, D. E. (Eds.), Deep Drilling Results in the Atlan-tic Ocean: Ocean Crust. Am. Geophys. Union, Maurice Ewing Se-ries, 2:369-382.
Gill, J. B., 1981. Orogenic Andesites and Plate Tectonics: Berlin (SpringerVerlag), pp. 230-232.
Hawkins, J. W., Jr., 1977. Petrologic and geochemical characteristicsof margin basin basalts. In Talwani, M., and Pitman, W. C , III(Eds.), Island Arcs, Deep-Sea Tbenches and Back-Arc Basins: Wash-ington (Am. Geophys. Union) Maurice Ewing Series, 1: 355-366.
Joron, J. L., Bougault, H., Maury, R. C , and Stephan, J. F., 1982.Basalt from the Cocos Plate, Site 487, Leg 66: petrology and geo-chemistry. In Watkins, J. S., Moore, J. C , et al., Init. Repts.DSDP, 66: Washington (U.S. Govt. Printing Office), 731-734.
Maury, R. C , Bougault, H., Joron, J. L., Girard, D., Treuil, M.,Azema, J., and Aubouin, J., 1982. Volcanic rocks from Leg 67sites: mineralogy and geochemistry. In Aubouin, J., von Huene,R., et al., Init. Repts. DSDP, 67: Washington (U.S. Govt. PrintingOffice), 557-576.
Natland, J. H., 1979. Crystal morphologies in basalts from DSDPSite 395, 23°N, 46°W, Mid-Atlantic Ridge. In Melson, W. G., Ra-binowitz, P. D., et al., Init. Repts. DSDP, 45: Washington (U.S.Govt. Printing Office), 423-446.
Nielsen, R. L., and Drake, M. J., 1979. Pyroxene-melt equilibria.Geochim. Cosmochim. Acta, 43:1259-1272.
Sigurdsson, H., and Schilling, S. G., 1976. Spinels in Mid-AtlanticRidge basalts, chemistry and occurrence. Earth Planet Sci. Lett.,29:7-20.
Smith, D., and Lindsley, D. H., 1971. Stable and metastable augitecrystallization trends in a single basalt flow. Am. Mineral., 56:225-233.
Treuil, M., Jaffrezic, H., Deschamp, N., Derre, C , Guichard, F.,Joron, J. L., Pelletier, B., Novotry, S., and Courtois, C , 1973.Analyse des lanthanides du Hafnium, du scandium, du chrome,du manganese, du cobalt, du cuivre et du zinc dans les minéraux etles roches par activation neutronique. J. Radioanalyt. Chern., 18:55-68.
Wood, D. A., Varet, J., Bougault, H., Corre, O., Joron, J. L., Treuil,M., Bizouard, H., Norry, M. J., Hawkesworth, C. J., and Rod-dick, J. C , 1979. The petrology, geochemistry, and mineralogyNorth-Atlantic basalts: a discussion based on IPOD Leg 49. InLuyendyk, B. P., Cann, J. R., et al., Init. Repts. DSDP, 49: Wash-ington (U.S. Govt. Printing Office), 597-655.
Date of Initial Receipt: January 10, 1983Date of Acceptance: August 9, 1983
20-
•0.1 0.2 0.3 0.4 0.5
Cs
Figure 5. Rubidium (ppm) versus Cs (ppm). (This plot shows the cor-relation between alkali elements during alteration processes of theoceanic crust. The original values [before alteration] are verylow and correspond to the lower values [Rb < 1 ppm, Cs < 0.02ppm].)
I ITh Ta La
Figure 6. Extended Coryell-Masuda plots. (The concentrations of samples normalized to chondriteconcentrations are plotted versus the elements arranged versus their decreasing affinity for the liq-uid phase of the magma. The two selected samples: •—543A-12-4, 99-101 cm, the upper one, ando—543A-16-3, 117-120 cm, the lower one, define the range of variation in Hole 543A. These plotscorrespond to typical depleted mid-ocean ridge basalts.)
407
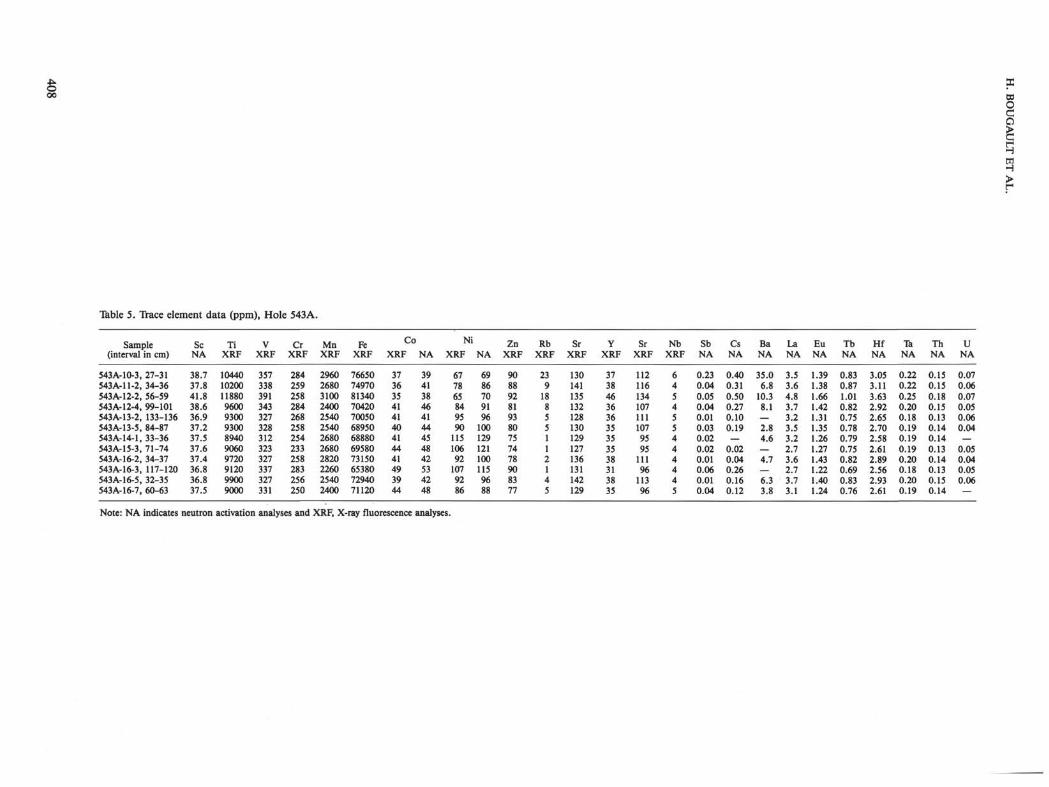
Table 5. Trace element data (ppm), Hole 543A.
Sample(interval in cm)
543A-1O-3, 27-31543A-11-2, 34-36543A-12-2, 56-59543A-12-4, 99-101543A-13-2, 133-136543A-13-5, 84-87543A-14-1, 33-36543A-15-3, 71-74543A-16-2, 34-37543A-16-3, 117-120543A-16-5, 32-35543A-16-7, 60-63
SeNA
38.737.841.838.636.937.237.537.637.436.836.837.5
TiXRF
104401020011880960093009300894090609720912099009000
VXRF
357338391343327328312323327337327331
CrXRF
284259258284268258254233258283256250
MnXRF
296026803100240025402540268026802820226025402400
FeXRF
766507497081340704207005068950688806958073150653807294071120
Co
XRF
373635414140414441493944
NA
394138464144454842534248
Ni
XRF
677865849590
11510692
1079286
NA
6986709196
1001291211001159688
ZnXRF
908892819380757478908377
RbXRF
239
18855112145
SrXRF
130141135132128130129127136131142129
YXRF
373846363635353538313835
SrXRF
1121161341071111079595
11196
11396
NbXRF
645455444445
SbNA
0.230.040.050.040.010.030.020.020.010.060.010.04
CsNA
0.400.310.500.270.100.19_
0.020.040.260.160.12
BaNA
35.06.8
10.38.1—2.84.6
4.7
6.33.8
LaNA
3.53.64.83.73.23.53.22.73.62.73.73.1
EuNA
1.391.38.66.42.31.35.26.27.43.22.40.24
TbNA
0.830.871.010.820.750.780.790.750.820.690.830.76
HfNA
3.053.113.632.922.652.702.582.612.892.562.932.61
IkNA
0.220.220.250.200.180.190.190.190.200.180.200.19
ThNA
0.150.150.180.150.130.140.140.130.140.130.150.14
UNA
0.070.060.070.050.060.04—
0.050.040.050.06—
Note: NA indicates neutron activation analyses and XRF, X-ray fluorescence analyses.