Embed Size (px)
Citation preview
Page 1 of 31
DEEP MININGOF
DATA WAREHOUSETRANSFORMS
WCB THINKING AND OPERATIONS

Page 2 of 31
Section 1.0INTRODUCTION
The Workers’ Compensation Board (WCB) of British Columbia serves nearlytwo million workers and about 170,000 employers in Canada’s third largest andwesternmost province. In 2001, more than 172,000 claims were first reported tothe Board, of which about 130,000 were paid for the first time. Of that total, 62,000were health-care-only claims, 64,000 were short-term disability claims, and 4000were long-term disability claims. The Board accepted 168 fatal claims in 2001.On a daily and a cumulative basis, this amounts to a massive amount of informationthat must be collected, coded, and organized efficiently.
If managing the data is an exacting science, then its utilization and application is anart, with the latter, especially, requiring creativity and a desire for exploration.
For years, the WCB has relied on data to analyze patterns, identify trends,and set priorities and strategic directions for the organization. Monitoring of claimsinformation through the 1980s, for example, brought to light an unsettling trend;the rate of on-the-job injuries among young workers, especially young males,was showing to be consistently higher than the rate for workers as a whole.This information compelled the Board to make young workers a focus of injuryprevention efforts beginning in 1989.
Through the early to mid-1990s, the WCB’s data management system yielded mainlyhigh-level information about young worker claims. Initiatives aimed at reducingyoung worker injuries were correspondingly broad-based and generalized. With theintroduction in 1997 of a powerful new information system — the Data Warehouse,for the first time the WCB had viable access to a potential goldmine of in-depthdata. Yet the potential was not completely explored until, in 2000, the WCB’sPrevention Division established a Strategic Initiatives section to focus intensivelyon young workers.
This report tells the story of how Strategic Initiatives mined the rich resources of thenew Data Warehouse to transform the Board’s strategic approach to young workers.By delving through multiple layers and interconnections, Strategic Initiativesconfirmed hunches and revealed surprising facets of the young worker issue.The data nuggets brought from the Data Warehouse afforded the impetus for a newyoung worker strategy — a targeted, tactical approach to young worker injuries.

Page 3 of 31
The methodology of the Strategic Initiatives section, coined the “Hierarchy Tree”,elevated awareness throughout the organization of the latent power of the DataWarehouse, and became the model for other Prevention Division sections anddepartments to access and utilize data in a more strategic way. Other elementsof the Strategic Initiatives process, including an inter-departmental Young WorkerTeam, created new ways to approach strategic issues within the organization.By forging a new path through data exploration and its application, and a teamapproach to a macro issue, Strategic Initiatives has left a beneficial, lasting markon the WCB’s operations.

Page 4 of 31
Section 2.0SUB-SURFACE MINING, BROAD-BRUSH STRATEGY
Collection and coding of claims data for management information and trend analysishas been a standard part of the WCB’s operations for decades. Claims have beenentered with a variety of code categories for potential cross-referencing and analysis,such as age, gender, occupation, industry sector, source and type of injury, and losttime. However, during the 1970s through to the mid-1990s, the WCB’s variousdivisions tended to develop separate applications that met their specific needs,and the systems could not interact with each other. It could take months to getanswers to questions, and even then, the answers were problematic becausedefinitions sometimes varied from division to division. Accordingly, for the purposeof strategic planning, the tendency was to mine just below the surface of the datamountain for basic information on age, gender, and industry sector.
This approach yielded sufficient information and rationale for setting broad strategicdirections. Postulating that injury rates varied between age cohorts, for example, thePrevention Division began to request breakdowns by demographics. The breakdownconfirmed the intuition that compared to workers as a whole, young workers agedfrom 15–24 years were sustaining higher injury rates. This triggered a trend lineanalysis that confirmed higher injury rates as a consistent pattern. Accordingly,in 1989, the Division made young workers a focus of injury prevention efforts.
Figure 1: Provincial and Young Worker Injury Rates in BC, 1989–2000
*Bill 63 was introduced in British Columbia in 1994. Bill 63 included new categories of employees tobe covered under The Workers Compensation Act. Therefore, injury rates pre-1993 & post-1994 arenot comparable.
Data Source: WCB Statistical Services, April 2002
7.37.6
6.86.5 6.3
5.7
4.9 4.9 4.8 4.74.1 4.2
6.6 6.76.3
6.0 5.85.2
4.8 4.6 4.5 4.3 4.1 3.9
1989* 1990* 1991* 1992* 1993* 1994 1995 1996 1997 1998 1999 2000
15-24 yrs
All Ages
42% decrease in the young worker injury rate from 1989–2000
Page 5 of 31
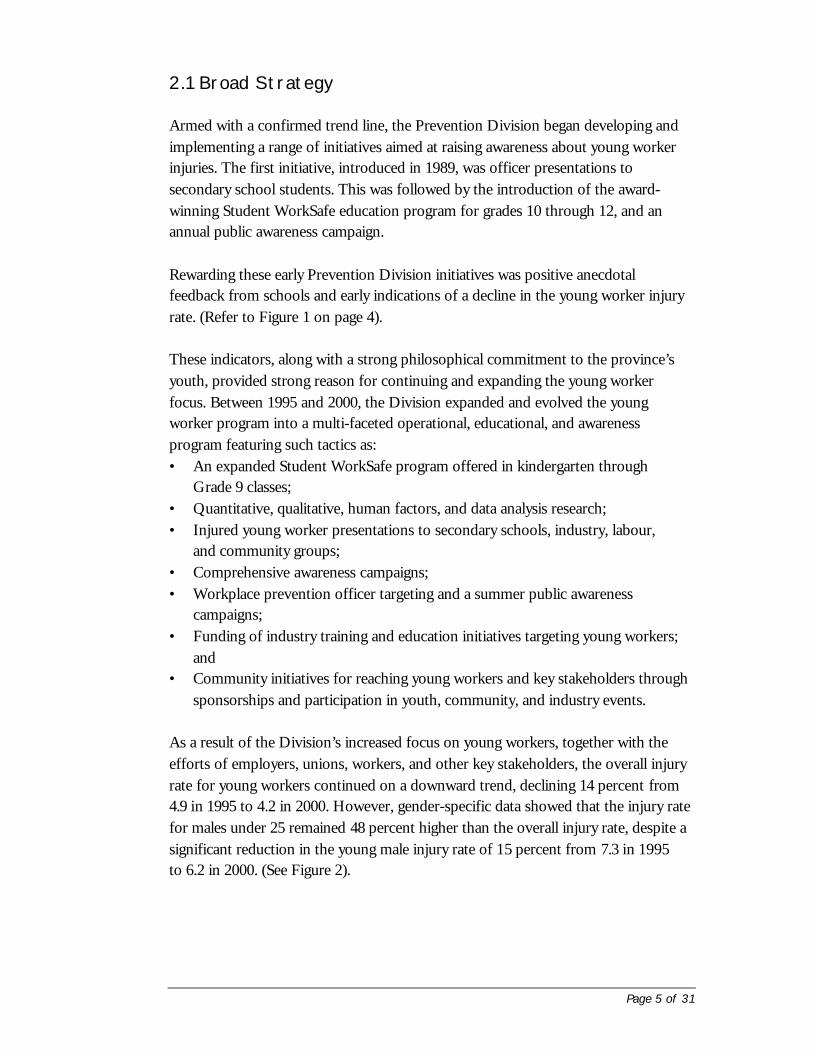
2.1 Broad Strategy
Armed with a confirmed trend line, the Prevention Division began developing andimplementing a range of initiatives aimed at raising awareness about young workerinjuries. The first initiative, introduced in 1989, was officer presentations tosecondary school students. This was followed by the introduction of the award-winning Student WorkSafe education program for grades 10 through 12, and anannual public awareness campaign.
Rewarding these early Prevention Division initiatives was positive anecdotalfeedback from schools and early indications of a decline in the young worker injuryrate. (Refer to Figure 1 on page 4).
These indicators, along with a strong philosophical commitment to the province’syouth, provided strong reason for continuing and expanding the young workerfocus. Between 1995 and 2000, the Division expanded and evolved the youngworker program into a multi-faceted operational, educational, and awarenessprogram featuring such tactics as:• An expanded Student WorkSafe program offered in kindergarten through
Grade 9 classes;• Quantitative, qualitative, human factors, and data analysis research;• Injured young worker presentations to secondary schools, industry, labour,
and community groups;• Comprehensive awareness campaigns;• Workplace prevention officer targeting and a summer public awareness
campaigns;• Funding of industry training and education initiatives targeting young workers;
and• Community initiatives for reaching young workers and key stakeholders through
sponsorships and participation in youth, community, and industry events.
As a result of the Division’s increased focus on young workers, together with theefforts of employers, unions, workers, and other key stakeholders, the overall injuryrate for young workers continued on a downward trend, declining 14 percent from4.9 in 1995 to 4.2 in 2000. However, gender-specific data showed that the injury ratefor males under 25 remained 48 percent higher than the overall injury rate, despite asignificant reduction in the young male injury rate of 15 percent from 7.3 in 1995to 6.2 in 2000. (See Figure 2).
Page 6 of 31
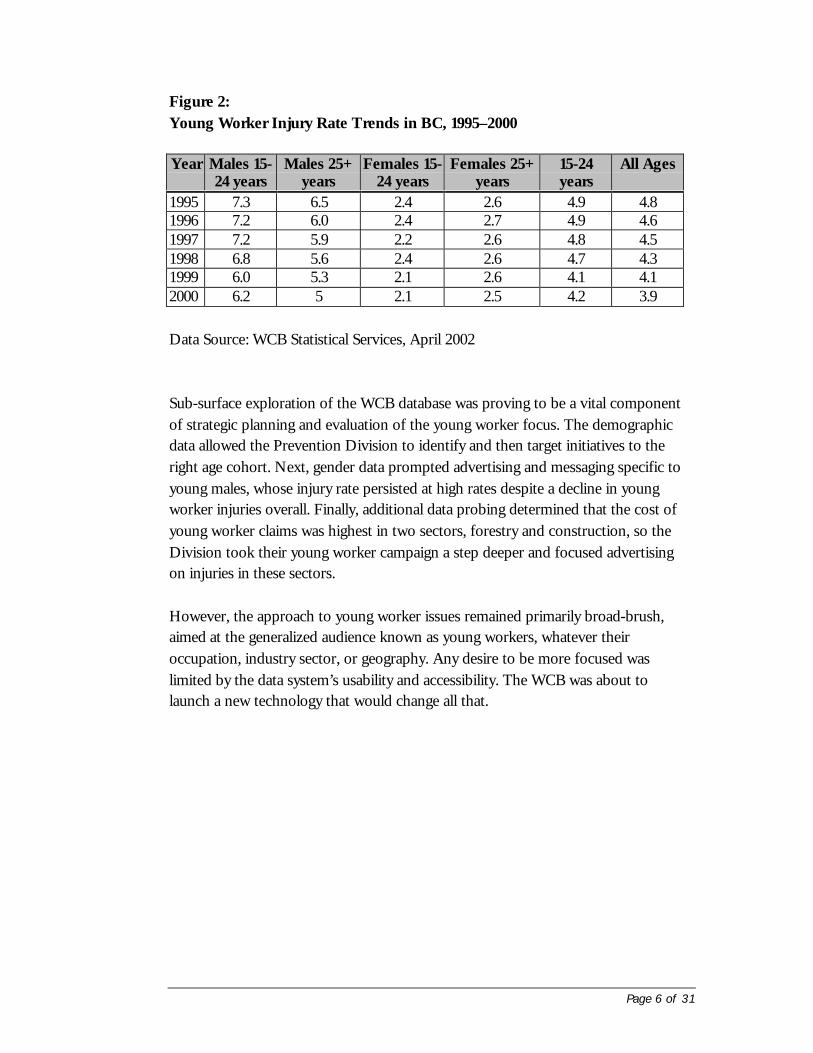
Figure 2:Young Worker Injury Rate Trends in BC, 1995–2000
Year Males 15-24 years
Males 25+years
Females 15-24 years
Females 25+years
15-24years
All Ages
1995 7.3 6.5 2.4 2.6 4.9 4.81996 7.2 6.0 2.4 2.7 4.9 4.61997 7.2 5.9 2.2 2.6 4.8 4.51998 6.8 5.6 2.4 2.6 4.7 4.31999 6.0 5.3 2.1 2.6 4.1 4.12000 6.2 5 2.1 2.5 4.2 3.9
Data Source: WCB Statistical Services, April 2002
Sub-surface exploration of the WCB database was proving to be a vital componentof strategic planning and evaluation of the young worker focus. The demographicdata allowed the Prevention Division to identify and then target initiatives to theright age cohort. Next, gender data prompted advertising and messaging specific toyoung males, whose injury rate persisted at high rates despite a decline in youngworker injuries overall. Finally, additional data probing determined that the cost ofyoung worker claims was highest in two sectors, forestry and construction, so theDivision took their young worker campaign a step deeper and focused advertisingon injuries in these sectors.
However, the approach to young worker issues remained primarily broad-brush,aimed at the generalized audience known as young workers, whatever theiroccupation, industry sector, or geography. Any desire to be more focused waslimited by the data system’s usability and accessibility. The WCB was about tolaunch a new technology that would change all that.
Page 7 of 31
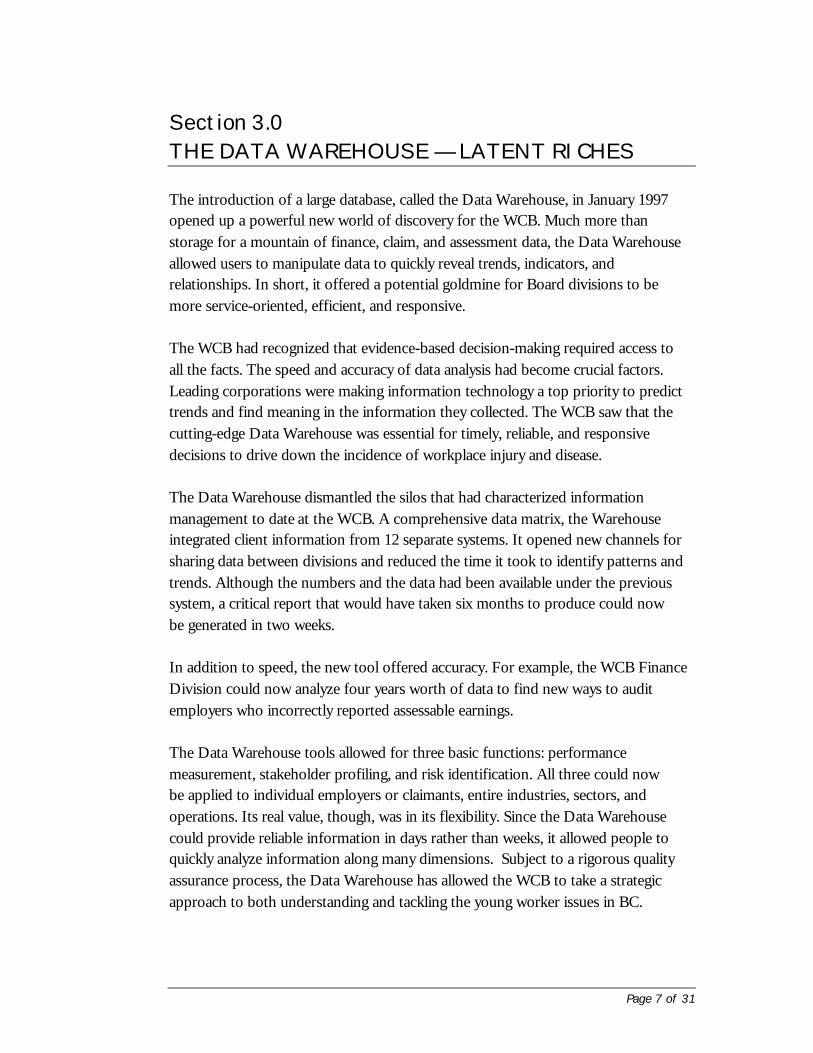
Section 3.0THE DATA WAREHOUSE — LATENT RICHES
The introduction of a large database, called the Data Warehouse, in January 1997opened up a powerful new world of discovery for the WCB. Much more thanstorage for a mountain of finance, claim, and assessment data, the Data Warehouseallowed users to manipulate data to quickly reveal trends, indicators, andrelationships. In short, it offered a potential goldmine for Board divisions to bemore service-oriented, efficient, and responsive.
The WCB had recognized that evidence-based decision-making required access toall the facts. The speed and accuracy of data analysis had become crucial factors.Leading corporations were making information technology a top priority to predicttrends and find meaning in the information they collected. The WCB saw that thecutting-edge Data Warehouse was essential for timely, reliable, and responsivedecisions to drive down the incidence of workplace injury and disease.
The Data Warehouse dismantled the silos that had characterized informationmanagement to date at the WCB. A comprehensive data matrix, the Warehouseintegrated client information from 12 separate systems. It opened new channels forsharing data between divisions and reduced the time it took to identify patterns andtrends. Although the numbers and the data had been available under the previoussystem, a critical report that would have taken six months to produce could nowbe generated in two weeks.
In addition to speed, the new tool offered accuracy. For example, the WCB FinanceDivision could now analyze four years worth of data to find new ways to auditemployers who incorrectly reported assessable earnings.
The Data Warehouse tools allowed for three basic functions: performancemeasurement, stakeholder profiling, and risk identification. All three could nowbe applied to individual employers or claimants, entire industries, sectors, andoperations. Its real value, though, was in its flexibility. Since the Data Warehousecould provide reliable information in days rather than weeks, it allowed people toquickly analyze information along many dimensions. Subject to a rigorous qualityassurance process, the Data Warehouse has allowed the WCB to take a strategicapproach to both understanding and tackling the young worker issues in BC.
Page 8 of 31
3.1 Impetus to Plumb Deeper — Strategic Initiatives
Like a mineral resource that is only potential until drilling reveals its latent wealth,the Data Warehouse would require a special impetus to reveal the depth of its riches.That impetus was the creation, in 2000, of a new section within the PreventionDivision, Strategic Initiatives. Along with its other responsibilities, the new sectionwas charged with expanding the WCB’s young worker strategy. Strategic Initiativestook on the roles of explorers and miners, drilling deeper and deeper into the DataWarehouse to extract data and trends that would transform the strategic approachto young workers, and flag the path for other Prevention Division sections anddepartments to make the most of this new information management resource.
Why focus on young workers?There are more than a quarter million young workers in British Columbia, and likeall workers, they have a right to a safe and healthy workplace. Young male workersare at a much higher risk of injury than other workers. More than a third ofworkplace accidents involving workers aged from 15–24 years occur between oneand six months on the job, and almost 20 percent occur during the first month.
Each working day, 42 young workers are hurt on the job and every week, five of theseworkers are permanently injured. In 2001, five young male workers died on the job.
3.1.1 Three-Part Process
To focus the young worker strategy, Strategic Initiatives applied a three-part process:• Part One - Data Analysis (Drilling for Information) would answer the
“what” questions, i.e. “What is at the core of young worker injuries?What subsectors, what types of injuries, what sources?”
• Part Two - External Research tackled the “why” questions, i.e. “Now thatwe know what is happening, why is it happening? Why are young workerssustaining higher injury rates than workers as a whole?”
• Part Three - Formation of a Young Worker Team would deal with the“how” — how to act on the wealth of new findings.
Page 9 of 31
Part One: Drilling For Information — The Young Worker Hierarchy Tree
The WCB codes and enters the more than 75,000 non-health care claims it receiveseach year according to several dimensions:
• Age• Gender• Accident Type• Occupation• Injury Type• Source of Injury• Nature of Injury• Body Part• ICD9 International Classification of Disease 9
Prior to the Data Warehouse, data to inform young worker initiatives had primarilybeen extracted from the top three levels of age, gender, and sector. The exceptionwas specific targeting of young worker initiatives to the two subsectors known tohave the highest young worker claims costs for the overall work force —construction, and forestry.
With the unplumbed Data Warehouse at its disposal, staff at the newly formedStrategic Initiatives section were curious to know what lay within and below theremaining 25 subsectors. However, they began their exploration at the top,the provincial level, looking at demographics and historical and future dataon population trends. (See Figures 3 and 4).
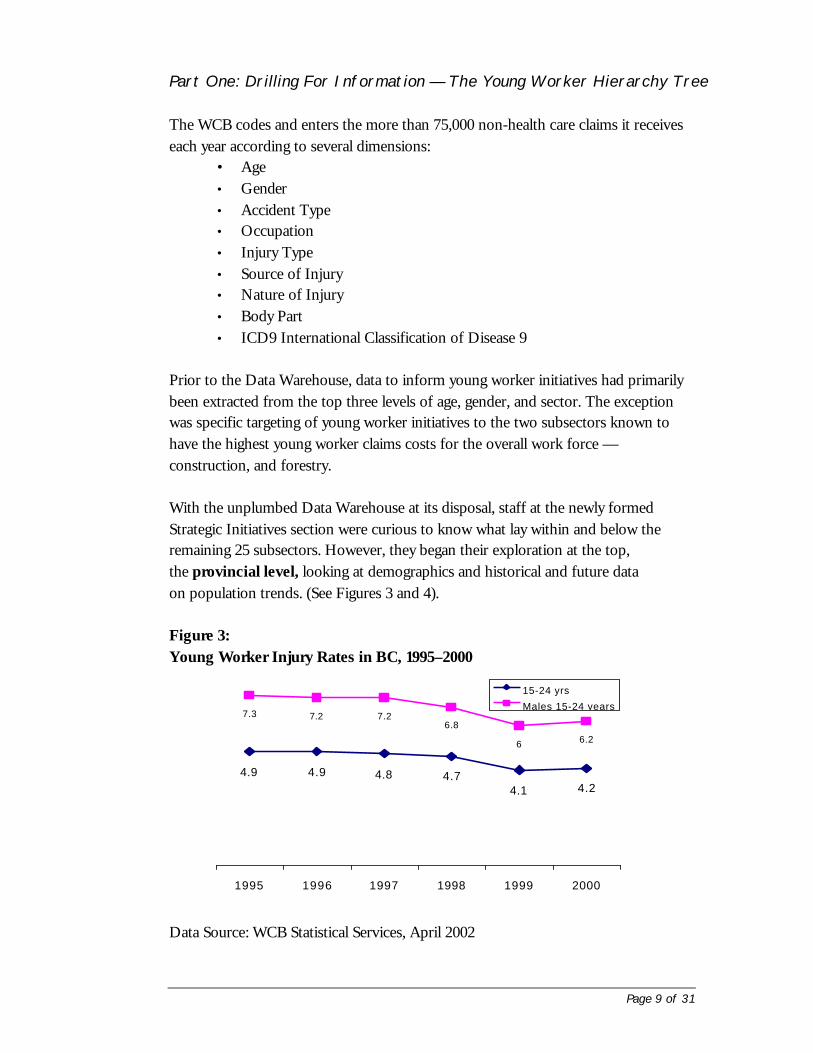
Figure 3:Young Worker Injury Rates in BC, 1995–2000
Data Source: WCB Statistical Services, April 2002
4.9 4.9 4.8 4.74.1 4.2
7.3 7.2 7.26.8
6 6.2
1995 1996 1997 1998 1999 2000
15-24 yrs
Males 15-24 years
Page 10 of 31
A snapshot of injury rates over six years showed an overall decline for all workers,including young workers as a whole and young males specifically. However, the rateof injury for young males persisted at 59 percent higher than the overall rate,suggesting the need to specifically target this audience.
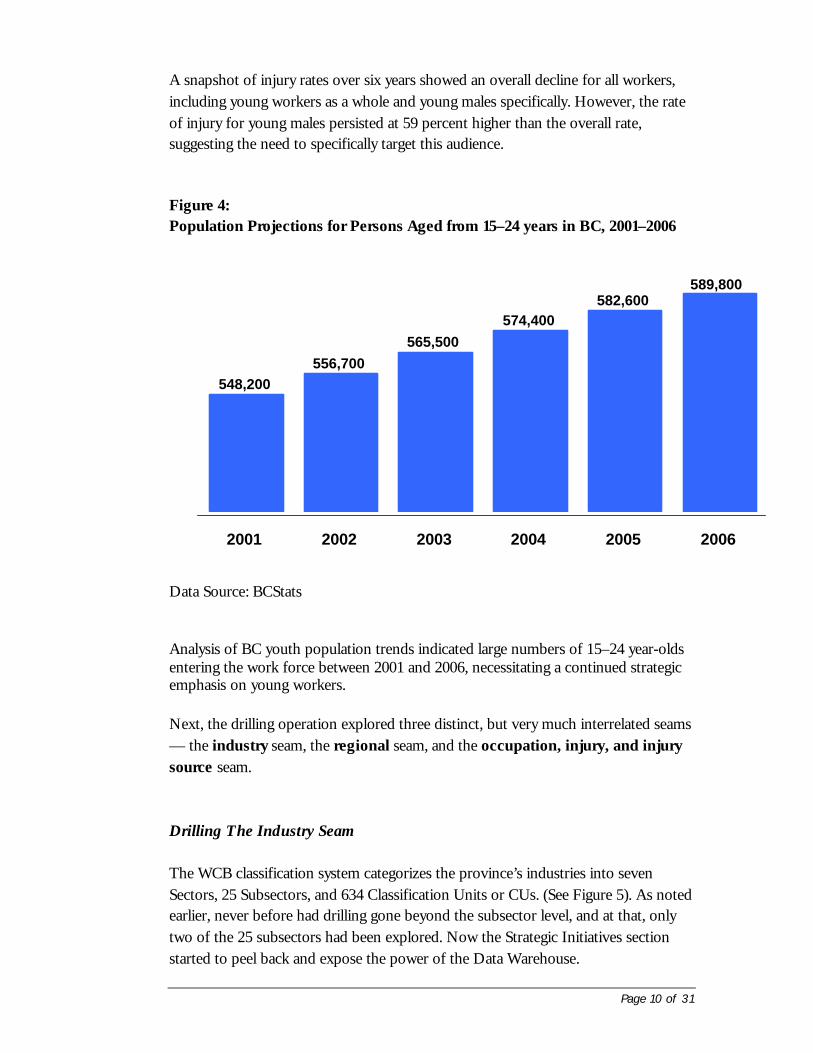
Figure 4:Population Projections for Persons Aged from 15–24 years in BC, 2001–2006
Data Source: BCStats
Analysis of BC youth population trends indicated large numbers of 15–24 year-oldsentering the work force between 2001 and 2006, necessitating a continued strategicemphasis on young workers.
Next, the drilling operation explored three distinct, but very much interrelated seams— the industry seam, the regional seam, and the occupation, injury, and injurysource seam.
Drilling The Industry Seam
The WCB classification system categorizes the province’s industries into sevenSectors, 25 Subsectors, and 634 Classification Units or CUs. (See Figure 5). As notedearlier, never before had drilling gone beyond the subsector level, and at that, onlytwo of the 25 subsectors had been explored. Now the Strategic Initiatives sectionstarted to peel back and expose the power of the Data Warehouse.
548,200556,700
565,500574,400
582,600589,800
2001 2002 2003 2004 2005 2006
Page 11 of 31
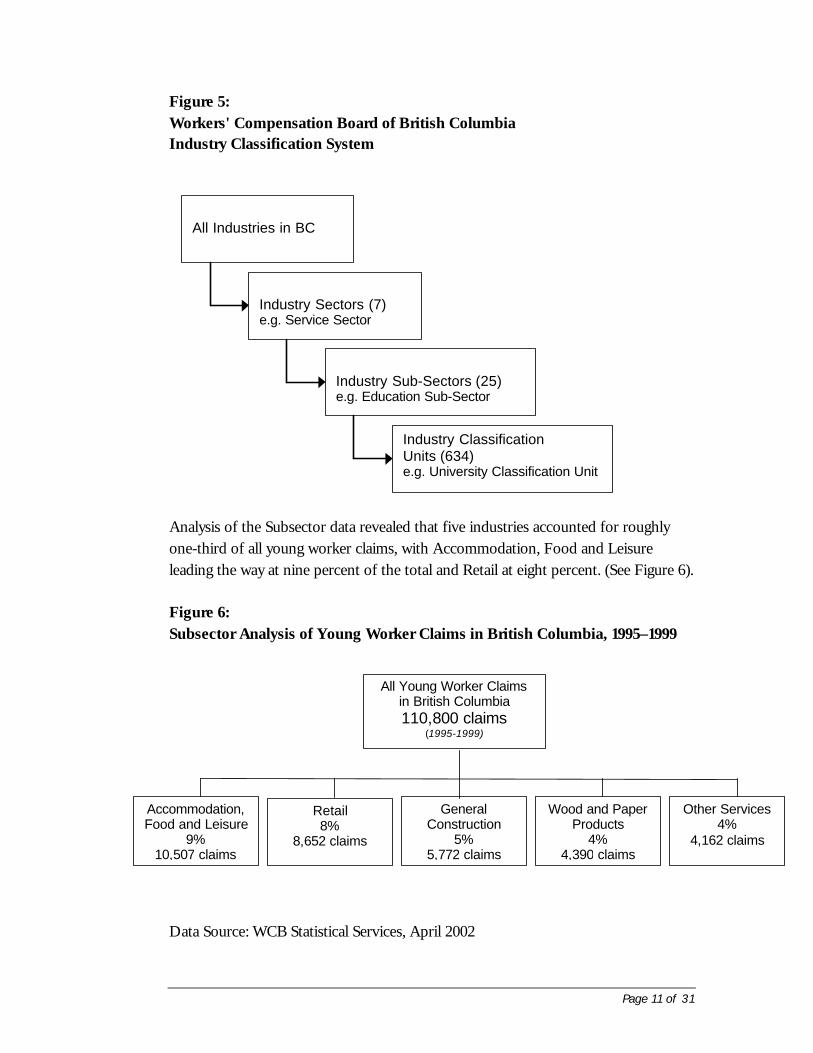
Figure 5:Workers' Compensation Board of British ColumbiaIndustry Classification System
Analysis of the Subsector data revealed that five industries accounted for roughlyone-third of all young worker claims, with Accommodation, Food and Leisureleading the way at nine percent of the total and Retail at eight percent. (See Figure 6).
Figure 6:Subsector Analysis of Young Worker Claims in British Columbia, 1995–1999
Data Source: WCB Statistical Services, April 2002
All Industries in BC
Industry Sectors (7)e.g. Service Sector
Industry Sub-Sectors (25)e.g. Education Sub-Sector
Industry ClassificationUnits (634)e.g. University Classification Unit
All Young Worker Claimsin British Columbia110,800 claims
(1995-1999)
Other Services4%
4,162 claims
Wood and PaperProducts
4%4,390 claims
GeneralConstruction
5%5,772 claims
Retail8%
8,652 claims
Accommodation,Food and Leisure
9%10,507 claims
Page 12 of 31
The findings by subsector stirred excitement in and of themselves, but piquedthe question “Now, within these Subsectors, which Classification Units account for thegreatest number of YW claims?”
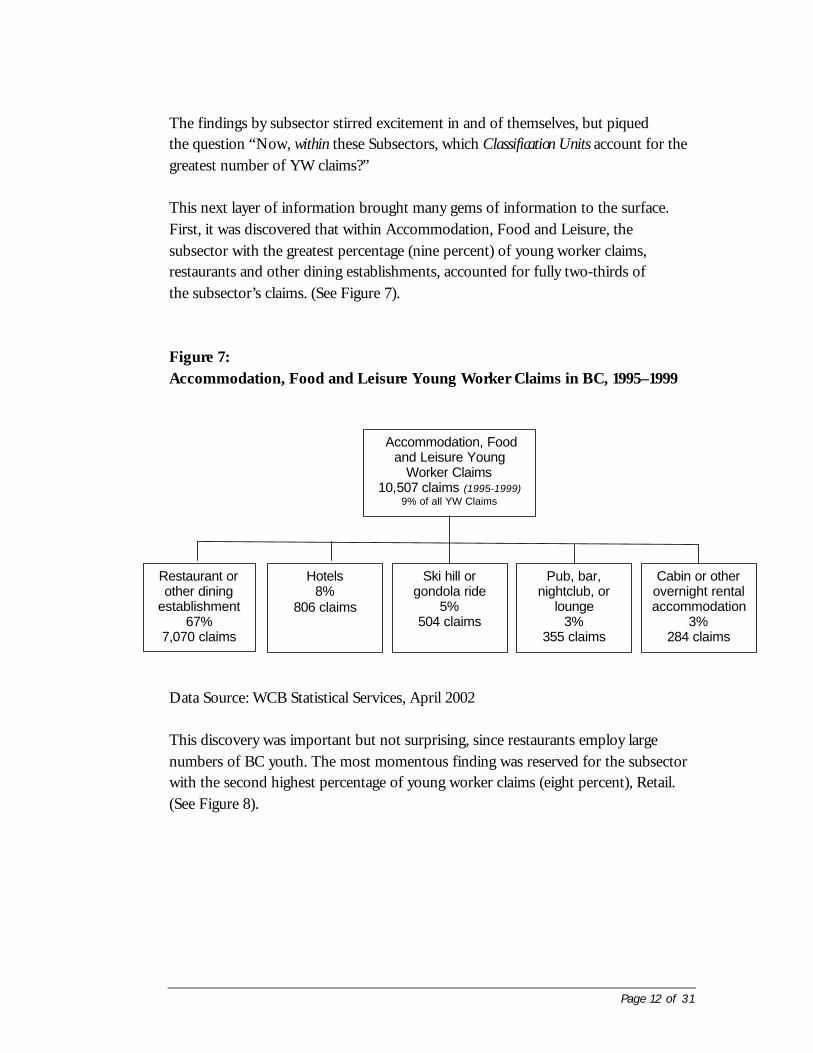
This next layer of information brought many gems of information to the surface.First, it was discovered that within Accommodation, Food and Leisure, thesubsector with the greatest percentage (nine percent) of young worker claims,restaurants and other dining establishments, accounted for fully two-thirds ofthe subsector’s claims. (See Figure 7).
Figure 7:Accommodation, Food and Leisure Young Worker Claims in BC, 1995–1999
Data Source: WCB Statistical Services, April 2002
This discovery was important but not surprising, since restaurants employ largenumbers of BC youth. The most momentous finding was reserved for the subsectorwith the second highest percentage of young worker claims (eight percent), Retail.(See Figure 8).
Accommodation, Foodand Leisure Young
Worker Claims10,507 claims (1995-1999)
9% of all YW Claims
Cabin or otherovernight rentalaccommodation
3%284 claims
Pub, bar,nightclub, or
lounge3%
355 claims
Ski hill orgondola ride
5%504 claims
Hotels8%
806 claims
Restaurant orother dining
establishment67%
7,070 claims
Page 13 of 31
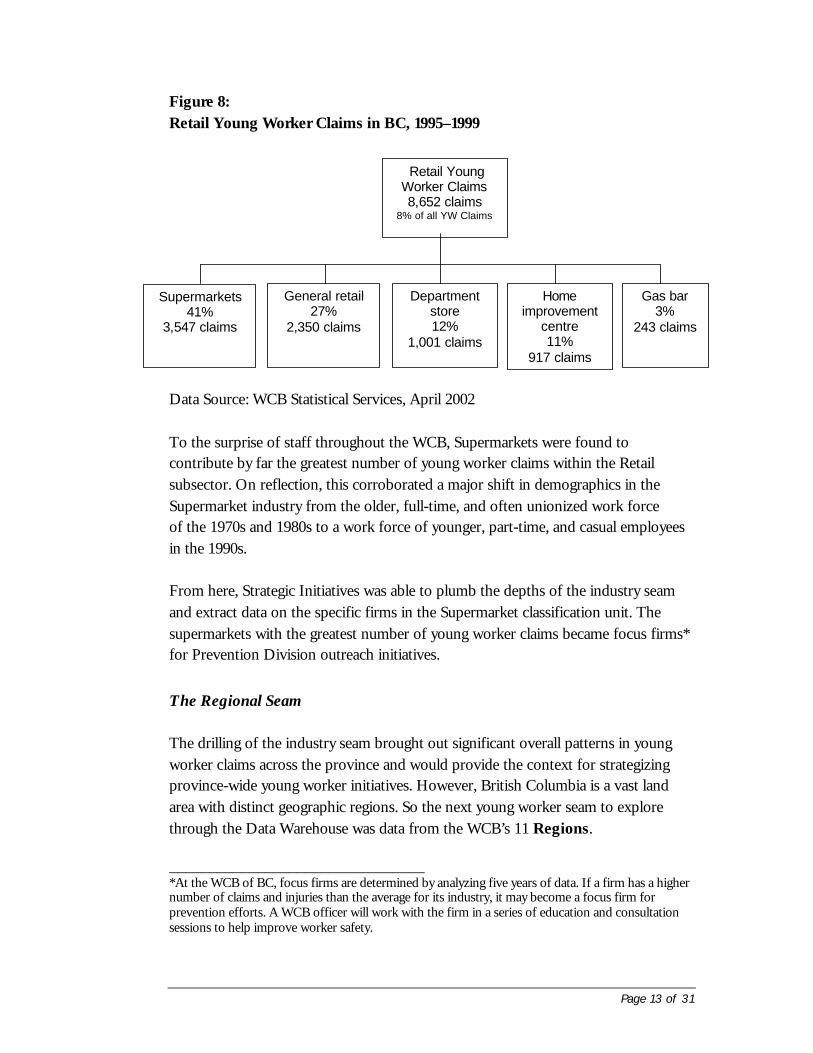
Figure 8:Retail Young Worker Claims in BC, 1995–1999
Data Source: WCB Statistical Services, April 2002
To the surprise of staff throughout the WCB, Supermarkets were found tocontribute by far the greatest number of young worker claims within the Retailsubsector. On reflection, this corroborated a major shift in demographics in theSupermarket industry from the older, full-time, and often unionized work forceof the 1970s and 1980s to a work force of younger, part-time, and casual employeesin the 1990s.
From here, Strategic Initiatives was able to plumb the depths of the industry seamand extract data on the specific firms in the Supermarket classification unit. Thesupermarkets with the greatest number of young worker claims became focus firms*for Prevention Division outreach initiatives.
The Regional Seam
The drilling of the industry seam brought out significant overall patterns in youngworker claims across the province and would provide the context for strategizingprovince-wide young worker initiatives. However, British Columbia is a vast landarea with distinct geographic regions. So the next young worker seam to explorethrough the Data Warehouse was data from the WCB’s 11 Regions.
________________________________*At the WCB of BC, focus firms are determined by analyzing five years of data. If a firm has a highernumber of claims and injuries than the average for its industry, it may become a focus firm forprevention efforts. A WCB officer will work with the firm in a series of education and consultationsessions to help improve worker safety.
Retail YoungWorker Claims8,652 claims
8% of all YW Claims
Gas bar3%
243 claims
Homeimprovement
centre11%
917 claims
Departmentstore12%
1,001 claims
General retail27%
2,350 claims
Supermarkets41%
3,547 claims
Page 14 of 31
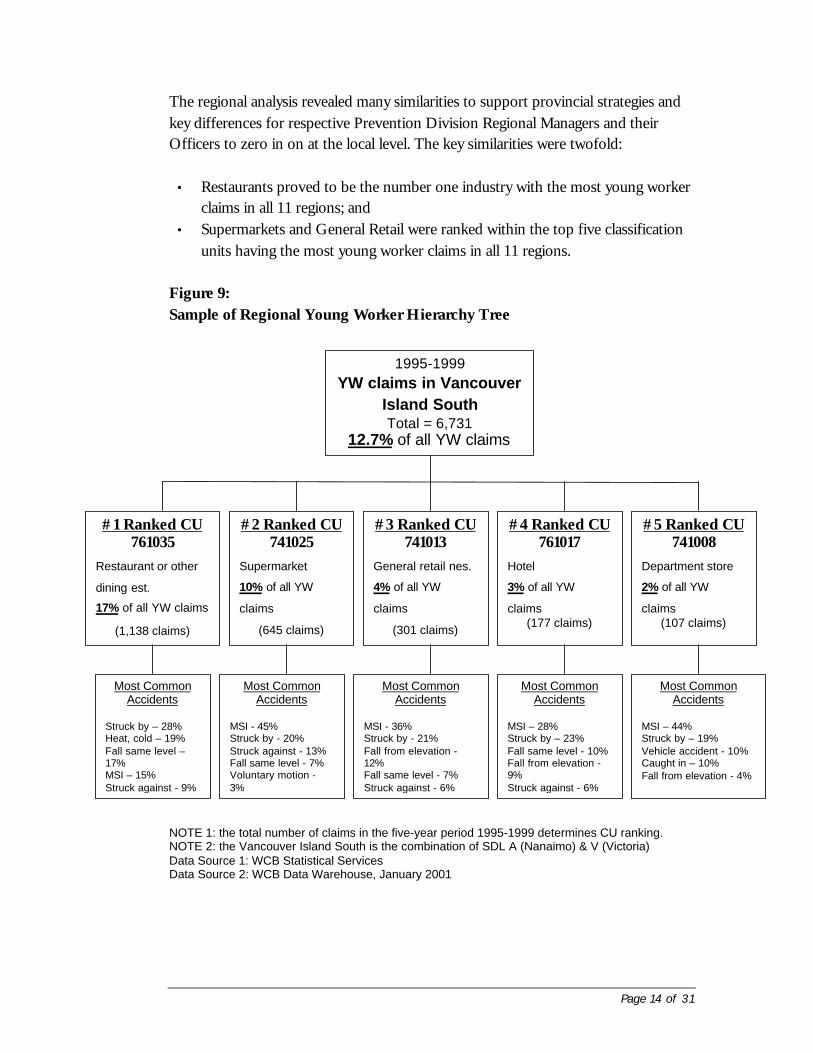
The regional analysis revealed many similarities to support provincial strategies andkey differences for respective Prevention Division Regional Managers and theirOfficers to zero in on at the local level. The key similarities were twofold:
• Restaurants proved to be the number one industry with the most young workerclaims in all 11 regions; and
• Supermarkets and General Retail were ranked within the top five classificationunits having the most young worker claims in all 11 regions.
Figure 9:Sample of Regional Young Worker Hierarchy Tree
NOTE 1: the total number of claims in the five-year period 1995-1999 determines CU ranking.NOTE 2: the Vancouver Island South is the combination of SDL A (Nanaimo) & V (Victoria)Data Source 1: WCB Statistical ServicesData Source 2: WCB Data Warehouse, January 2001
1995-1999YW claims in Vancouver
Island SouthTotal = 6,731
12.7% of all YW claims
#1 Ranked CU761035
Restaurant or other
dining est.
17% of all YW claims
(1,138 claims)
#2 Ranked CU741025
Supermarket
10% of all YW
claims
(645 claims)
#3 Ranked CU741013
General retail nes.
4% of all YW
claims
(301 claims)
#4 Ranked CU761017
Hotel
3% of all YW
claims(177 claims)
#5 Ranked CU741008
Department store
2% of all YW
claims(107 claims)
Most CommonAccidents
Struck by – 28%Heat, cold – 19%Fall same level –17%MSI – 15%Struck against - 9%
Most CommonAccidents
MSI - 45%Struck by - 20%Struck against - 13%Fall same level - 7%Voluntary motion -3%
Most CommonAccidents
MSI - 36%Struck by - 21%Fall from elevation -12%Fall same level - 7%Struck against - 6%
Most CommonAccidents
MSI – 44%Struck by – 19%Vehicle accident - 10%Caught in – 10%Fall from elevation - 4%
Most CommonAccidents
MSI – 28%Struck by – 23%Fall same level - 10%Fall from elevation -9%Struck against - 6%
Page 15 of 31
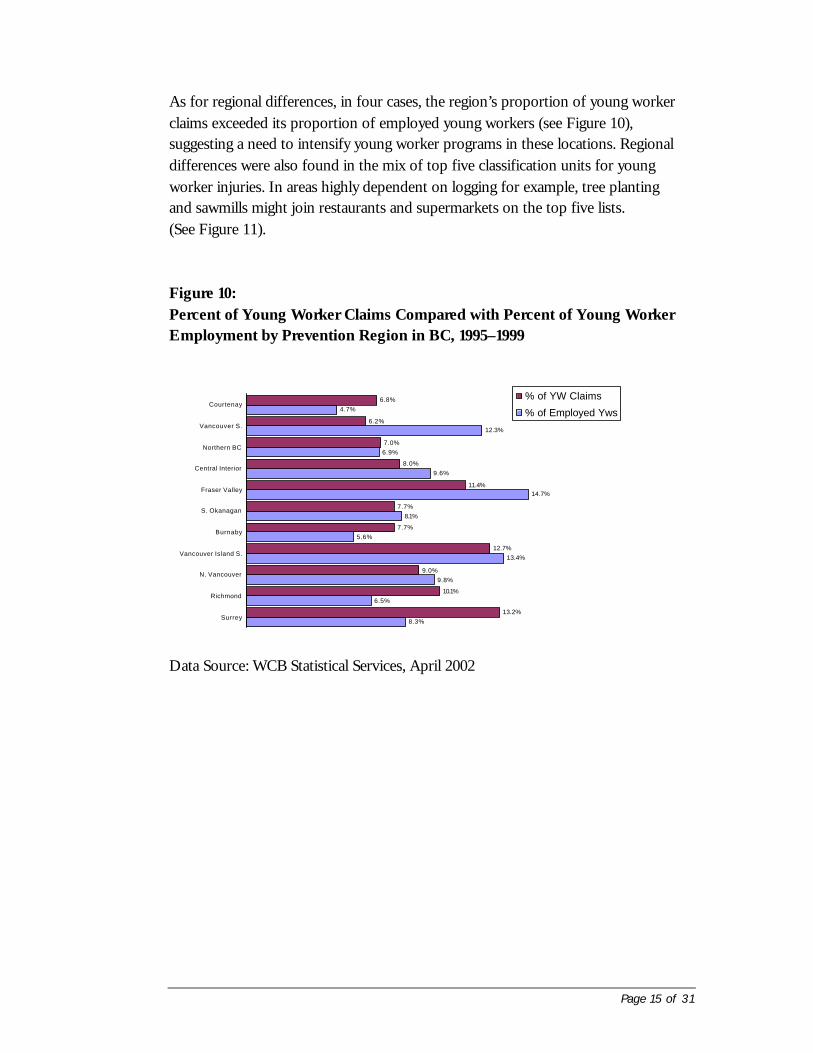
As for regional differences, in four cases, the region’s proportion of young workerclaims exceeded its proportion of employed young workers (see Figure 10),suggesting a need to intensify young worker programs in these locations. Regionaldifferences were also found in the mix of top five classification units for youngworker injuries. In areas highly dependent on logging for example, tree plantingand sawmills might join restaurants and supermarkets on the top five lists.(See Figure 11).
Figure 10:Percent of Young Worker Claims Compared with Percent of Young WorkerEmployment by Prevention Region in BC, 1995–1999
Data Source: WCB Statistical Services, April 2002
6.5%
9.8%
13.4%
5.6%
8.1%
14.7%
9.6%
6.9%
12.3%
4.7%
13.2%
10.1%
9.0%
12.7%
7.7%
7.7%
11.4%
8.0%
7.0%
6.2%
6.8%
8.3%Surrey
Richmond
N. Vancouver
Vancouver Island S.
Burnaby
S. Okanagan
Fraser Valley
Central Interior
Northern BC
Vancouver S.
Courtenay% of YW Claims
% of Employed Yws

Page 16 of 31
Figure 11:Remaining Top Five Young Worker Regional CUs other than Retail,Supermarkets & Restaurants
Classification Unit (CU)No. of Regions CUappeared in Top 5 YWRegional CUs
Hotel 2 regionsSki hill or gondola ride 2 regionsDepartment store 1 regionHome improvement centre 2 regionsHouse renovations 1 regionSawmill 4 regionsWooden component manufacturing 3 regionsWoodworking or carpentry shop 1 regionFood beverage or tobacco product wholesale 1 regionCourier services 2 regionsTree planting or cone picking 1 regionAircraft handling 1 regionLocal government & related operations 1 regionIntegrated logging 2 regions
Data Source: WCB Statistical Services, April 2002
The Occupation, Injury, and Injury Source Seam
The third major seam requiring drilling would answer the questions, “Within thehighest claim CUs, in what occupations are young workers most likely to sustaininjuries? What is the nature and source of those injuries?”
How did the Data Warehouse answer these questions? The four top occupationsfor young worker claims in the Restaurant CU were found to be cooks, kitchenand food service helpers, food and beverage servers, and cashiers.
Mining of the three main seams by no means exhausted the wealth of informationthe Data Warehouse afforded Strategic Initiatives in its young worker focus.
Page 17 of 31
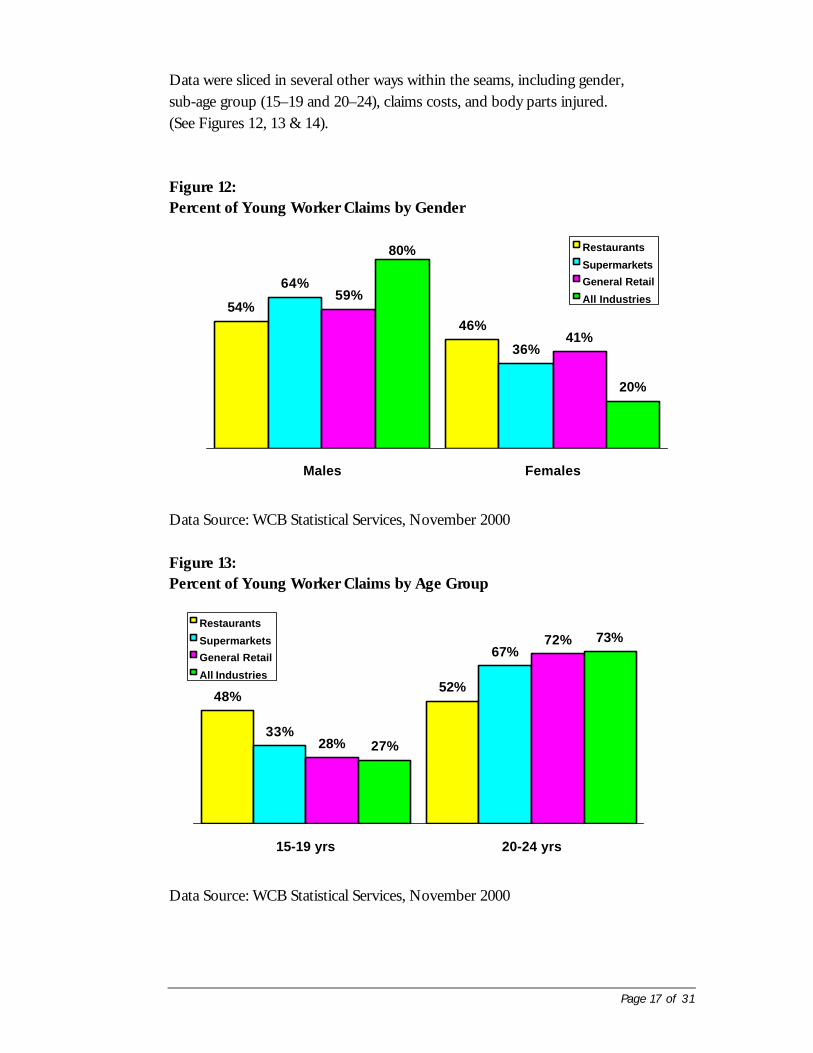
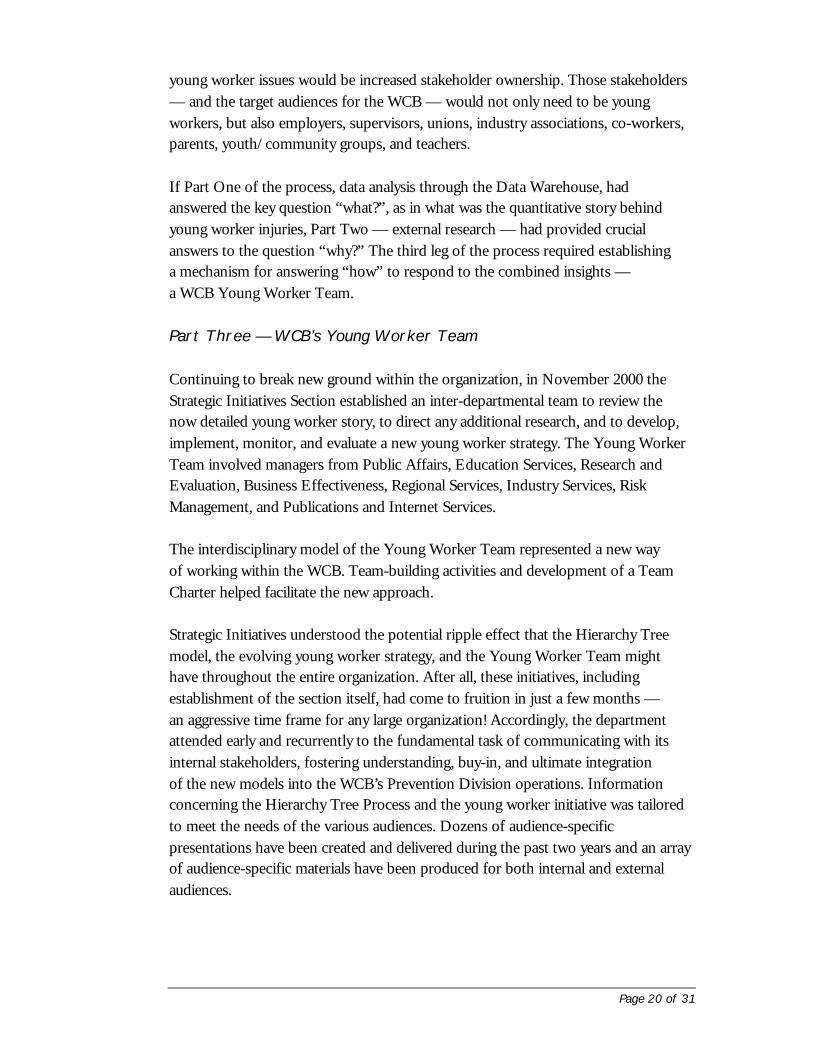
Data were sliced in several other ways within the seams, including gender,sub-age group (15–19 and 20–24), claims costs, and body parts injured.(See Figures 12, 13 & 14).
Figure 12:Percent of Young Worker Claims by Gender
Data Source: WCB Statistical Services, November 2000
Figure 13:Percent of Young Worker Claims by Age Group
Data Source: WCB Statistical Services, November 2000
54%46%
64%
36%
59%
41%
80%
20%
Males Females
Restaurants
Supermarkets
General Retail
All Industries
48%52%
33%
67%
28%
72%
27%
73%
15-19 yrs 20-24 yrs
Restaurants
Supermarkets
General Retail
All Industries

Page 18 of 31
Figure 14:Sample of Young Worker Restaurant Typical Worker Profile
Data Source: WCB Data Warehouse
What the Data Warehouse could not do, however, was provide qualitative insightsinto questions such as: “What are the differences in attitudes and behaviours towardsafety between young women and young men? How are 15–19 year-olds differentfrom 20–24 year-olds in their understanding of safety practises? Where do youngpeople go when they have a safety question? What are other stakeholders’ attitudesand beliefs about young workers — stakeholders such as supervisors, unions,teachers, and parents?” Such research had not been conducted anywhere inCanada to date.
Questions like these stimulated the second part of the Strategic Initiatives’ process,External Research.
Part Two — External Research
From the spring of 2000 through 2001, Strategic Initiatives commissioned orpartnered on a number of research pieces to understand the following factors:
i. The nature of the problem (i.e. the attitudes, perceptions, and behavioursunderlying young worker injuries);
ii. The nature of the solutions (i.e. what can and should be done to reduceyoung worker injuries);
iii. The audiences and stakeholders who need to contribute to solutions; andiv. The needs, motivators, and preferences that would help engage those
audiences.
Male CookAge Range: 15 to 24 years
Accident/Injury: Contact with hotobjects or substances
Injury Source: Buckets, baskets, orpails
Claim Cost: $450
Workdays Lost: 12
Employed: Restaurant

Page 19 of 31
As summarized in Figure 15, Strategic Initiatives undertook incrementally detailedresearch to acquire this understanding.
Figure 15:Young Worker External Research 2000 and 2001
Phase Research Objectives Outcomes
i. Understanding theproblem
Develop understanding ofunderlying attitudes,perceptions, andbehaviours relating toyoung worker injuries
In 2000, young worker andstakeholder focus groupand survey research; 2000and 2001 PreventionOfficer young workersurvey blitz, joint study withthe Insurance Corporationof BC on risk-takingbehaviours among youth(2001).
ii. Nature of solutions Determine what can andshould be done to reduceyoung worker injuries
Young worker andstakeholder focus groupand survey research (2000),Prevention Officer youngworker blitz survey (2000and 2001).
iii. Audiences andstakeholders
Identify and developstrategy for working withpotential partners in youngworker issues
Young worker communitypartners strategy (2001).
iv. Engaging targetaudiences
Determine how to bestreach, engage, andmotivate target audiences
Focus group research onfive specific young workerinitiatives proposed for the2002 program year.
Focus group research totest awareness concepts2002.
The cumulative results of this research created a collage of insights into how youngworkers viewed health and safety issues, the training they were (and were not)receiving, their attitudes about risk-taking, and the motivators/resources that mightsupport safer work practises. The research also confirmed that key to addressing
Page 20 of 31
young worker issues would be increased stakeholder ownership. Those stakeholders— and the target audiences for the WCB — would not only need to be youngworkers, but also employers, supervisors, unions, industry associations, co-workers,parents, youth/community groups, and teachers.
If Part One of the process, data analysis through the Data Warehouse, hadanswered the key question “what?”, as in what was the quantitative story behindyoung worker injuries, Part Two — external research — had provided crucialanswers to the question “why?” The third leg of the process required establishinga mechanism for answering “how” to respond to the combined insights —a WCB Young Worker Team.
Part Three — WCB’s Young Worker Team
Continuing to break new ground within the organization, in November 2000 theStrategic Initiatives Section established an inter-departmental team to review thenow detailed young worker story, to direct any additional research, and to develop,implement, monitor, and evaluate a new young worker strategy. The Young WorkerTeam involved managers from Public Affairs, Education Services, Research andEvaluation, Business Effectiveness, Regional Services, Industry Services, RiskManagement, and Publications and Internet Services.
The interdisciplinary model of the Young Worker Team represented a new wayof working within the WCB. Team-building activities and development of a TeamCharter helped facilitate the new approach.
Strategic Initiatives understood the potential ripple effect that the Hierarchy Treemodel, the evolving young worker strategy, and the Young Worker Team mighthave throughout the entire organization. After all, these initiatives, includingestablishment of the section itself, had come to fruition in just a few months —an aggressive time frame for any large organization! Accordingly, the departmentattended early and recurrently to the fundamental task of communicating with itsinternal stakeholders, fostering understanding, buy-in, and ultimate integrationof the new models into the WCB’s Prevention Division operations. Informationconcerning the Hierarchy Tree Process and the young worker initiative was tailoredto meet the needs of the various audiences. Dozens of audience-specificpresentations have been created and delivered during the past two years and an arrayof audience-specific materials have been produced for both internal and externalaudiences.
Page 21 of 31
Along with internal presentations, the Hierarchy Tree Model, findings and resultingyoung worker strategy are disseminated to internal and external audiences through avariety of mechanisms:
• Bi-monthly Young Worker Team Meetings;• Establishment of a Young Worker Officer Advisory Group, with Prevention
Officer representatives from each region, quarterly officer meetings, and regularwritten updates on young worker initiatives;
• WCB Intranet Site for the Young Worker Team and Officer Advisory Group;• Articles in WCB internal and external publications;• A Young Worker Health & Safety Centre Web Site (www.worksafebc.com);• Issue statements and briefing notes for elected government officials;• Presentations, speeches, and trade show booths at stakeholder and public events;• Development and distribution of public information and publicity
campaigns/materials; and• Formation of strategic partnerships and information-sharing with young worker
stakeholders.
The Young Worker Team approach enhanced the WCB’s effectiveness in addressingyoung worker issues in several ways:• By building awareness and facilitating integration of young worker issues into
various sections’ and departments’ initiatives;• By pooling knowledge, expertise, and perspectives;• By leveraging access to various sections’ and departments’ external stakeholders
— for example, a young worker component could be integrated into IndustryServices’ existing work with the restaurant industry; and
• By facilitating communication within and between sections, departments,and divisions.
The Young Worker Team thus provided an integrated, unified, tactical mechanismfor making the most of the deep quantitative insights gleaned from the DataWarehouse exploration and from external research.
Page 22 of 31
Section 4.0USING THE MINED WEALTH:A NEW YOUNG WORKER STRATEGY
WCB of BC 2001 Position Statement for Focusing the Young Worker Issue:A Divisional strategy that effectively focuses our attention and limited resources onthe key issues negatively influencing the young worker injury rate is critical if we areto successfully achieve our goal of a 2.5 percent reduction in the young worker injuryrate in 2001.
As a result of the ambitious data analysis, external research, and young workerteam formation during the year 2000, the Strategic Initiatives section was able to givegood reason for a focused, three-pronged approach to young worker issues in 2001.Such a tactical approach had never before been feasible or even imagined.
Three-Pronged Approach to Young Worker Targeting (2001):1. Province-wide, the three highest risk Classification Units (CUs) (Restaurants,
Supermarkets, and General Retail)2. Regionally, the top 5 CUs to target for young worker claims3. Stakeholder partnerships and ownership of young worker issues
In addition to the specific target areas, which had been jointly defined by thedata analysis and external qualitative and quantitative research, Strategic Initiativesextrapolated three major themes from focus group research on which to base2001 activities — Supervision, Orientation, and Heroes/Success Stories.
4.1 Young Worker Activities for 2001
The 2001 young worker strategy included a carryover of the many initiatives that hadseen successful launches in the 1990s and earlier. This section of the reporthighlights the new initiatives under the three-pronged strategy.
Page 23 of 31
4.1.1 Highest Risk Classification Unit (Province-Wide Focus) —Highlights of 2001 Activities
The WCB acted quickly on the data extracted in 2000 on young worker injuriesby industry, where the highest injury rate was found in the Restaurant classificationunit of the Accommodation, Food, and Leisure subsector. In 2001, the Boardimplemented a variety of young worker initiatives targeted to the restaurant industryincluding, among others:
• A partnership with the BC Restaurant and Foodservices Association (BCRFA)to co-host the 2001 Young Worker campaign launch attended by hundreds ofkey stakeholders and media representatives. The launch included presentationsfrom the President of the BCRFA and from Earl’s Restaurants Ltd., an employerof 2,500 people in 23 restaurants in BC. A young Earl’s employee who hadsustained a serious burn injury on the job gave a riveting re-enactment of hisexperience. The Earl’s BC Regional Chef talked about how the young worker’saccident had prompted Earl’s management to renew its commitment to thehealth and safety of Earl’s employees, and cited the specific example ofimproved procedures for cleaning deep fryers. This story was widely reported inmajor BC media and helped set a tone of shared ownership and responsibilityfor young worker issues.
• Also, with the BCRFA and the provincial restaurant chain, White Spot,distribution of White Spot’s health and safety training package to smallerrestaurants throughout the province. This package provided a model ofexcellence for others in the industry to emulate, and further demonstratedthe industry’s commitment to young workers — a commitment substantiallystrengthened by the specific sector and classification unit data mined from theData Warehouse.
• WCB participation in the provincial Steering Committee for FoodSafe,a mandatory training program for food handlers in BC. The Committee agreedto integrate the WCB’s WorkSafe curriculum into FoodSafe beginning in the2002 program year. All new young workers completing this mandatory programwould now have the added benefit of a workplace health and safety focus.
Page 24 of 31
4.1.2 Highest Classification Units (Regional Focus) — Highlights of2001 Activities
In addition to the province-wide focus on restaurants, in 2001 the 11 WCB Regions*began to apply their newly gleaned understanding of young worker issues withintheir boundaries. Armed with the data provided by Strategic Initiatives, regions wereable to identify and target, for the first time, young worker focus firms.** The dataidentified the five firms with the highest young worker injury rates in each of the topfive regional industry CUs, for a total of 25 young worker focus firms per region.
In about 80 percent of cases, the firms identified as having higher than averageinjury rates for young workers in their industry were already focus firms based onoverall injury rates. In these situations, WCB officers were able to build uponexisting relations, bringing in new information to help firms address youth-specificissues. The remaining 20 percent, or an average of five per region, became newfocus firms for the WCB officers.
4.1.3 Stakeholder Ownership — Highlights of 2001 Activities
For Strategic Initiatives, the long-term goal is to change the culture towardsworkplace health and safety by encouraging stakeholder ownership of young workerissues. This goal will be achieved over a number of years through cultivating existingstrategic alliances and developing new ones on an annual basis.
In 2001, achievements toward stakeholder ownership of young worker issues(in addition to the restaurant industry-specific activities described earlier) includedthe following:
• Development of strategic partnerships with provincial government agencies,community organizations, and the Canadian Federation of Students;
• Partnership with the federal Hire-A-Student program, which operates dozens ofsummer employment offices across BC;
_______________________________ *In 2002, the WCB Prevention Division underwent reorganization of its regions from 11 to 10.
**At the WCB of BC, focus firms are determined by analyzing five years of data. If a firm has a highernumber of claims and injuries than the average for its industry, it may become a focus firm forprevention efforts. A WCB officer will work with the firm in a series of education and consultationsessions to help improve worker safety.
Page 25 of 31
• Completion of a comprehensive Community Partners Strategy to recommendnew and expanded BC-wide, Sectoral, and Regional partnerships for youngworker issues;
• Groundwork for establishment of a multi-sectoral, multi-stakeholder youngworker advisory group;
• Initial meetings with high priority partners in the parent and educatorsstakeholder grouping — the BC Confederation of Parent Advisory Councils,an umbrella group for hundreds of parent advisory groups in BC, and theBC Principals’ and Vice-Principals’ Association of BC.
4.1.4 Preliminary Results Exciting
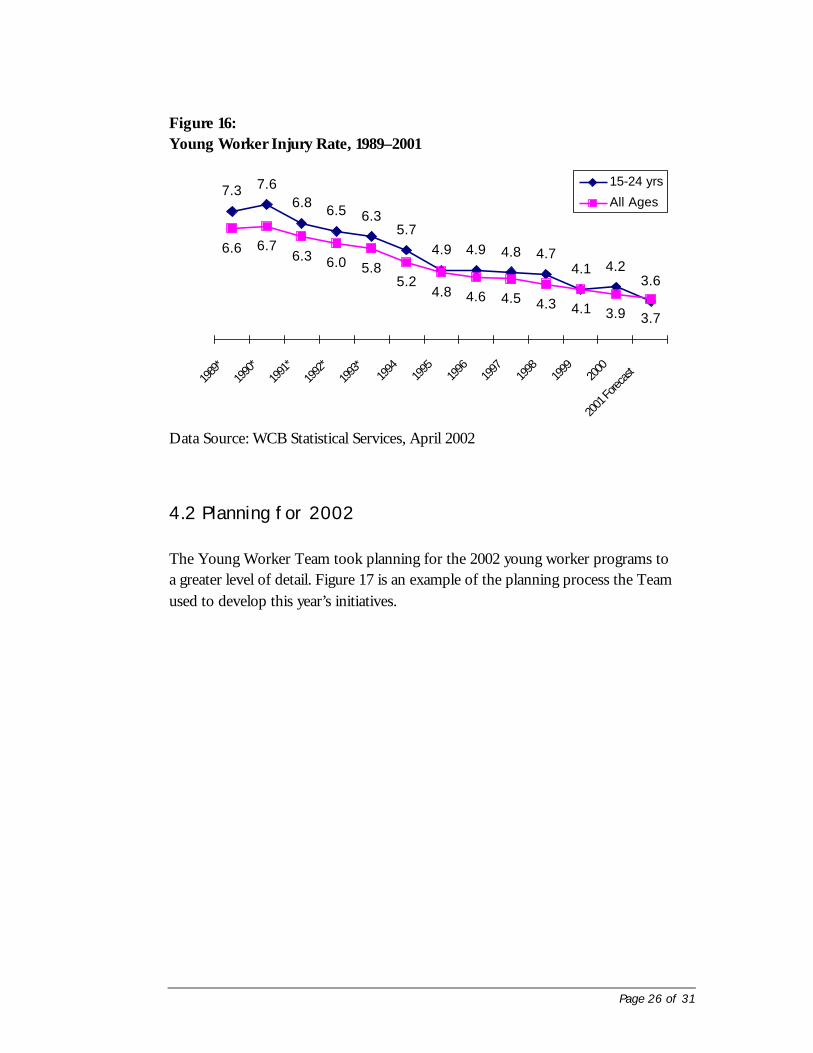
Performance data for 2001 are only just becoming available, but early indicatorsare extremely promising. A preliminary analysis in April 2002 suggests that youngworker injury rates may have fallen by a substantially greater margin than the hoped-for target. For the first time in the history of the WCB, preliminary findings indicatethat the 2001 young worker injury rate (3.6) has decreased to below the provincialinjury rate (3.7) for all age groups. The goal for 2001 was a 2.5 percent reduction,whereas the young worker injury rate reduction from 4.2 in 2000 to 3.6 in 2001represents an impressive 14 percent drop. (Refer to Figure 16 on the next page).This preliminary forecast remains to be borne out in the final analysis, which willalso offer up key data on young worker claims by the targeted classification unitsand regions. Even then, as Strategic Initiatives knows, the 2001 figures will onlybe a starting point; several additional years of claims monitoring will be required toestablish an overall trend line within the three-pronged approach. Meanwhile, theWCB believes the Strategic Initiatives section is on the right track with its evidence-based decision-making.
Page 26 of 31
Figure 16:Young Worker Injury Rate, 1989–2001
Data Source: WCB Statistical Services, April 2002
4.2 Planning for 2002
The Young Worker Team took planning for the 2002 young worker programs toa greater level of detail. Figure 17 is an example of the planning process the Teamused to develop this year’s initiatives.
7.3 7.66.8 6.5 6.3
5.74.9 4.9 4.8 4.7
4.1 4.23.6
6.6 6.76.3 6.0 5.8
5.24.8 4.6 4.5 4.3 4.1 3.9 3.7
1989
*19
90*
1991
*19
92*
1993
*19
9419
9519
9619
9719
9819
9920
00
2001
Forec
ast
15-24 yrs
All Ages

Page 27 of 31
Figure 17 - 2002 Young Worker Team Planning Process Diagram
This year’s industry focus is on the subsector with the second highest percentageof young worker claims (after Accommodation, Food and Leisure at nine percent),the Retail subsector, with eight percent of total claims. The WCB has partnered withRetail BC, Retail Council of Canada, Canadian Council of Grocery Distributors, andThe Bay, one of Canada’s largest retail chains, for the 2002 Young Worker annualawareness campaign. To draw even greater attention to the retail focus, the highprofile campaign launch occurred on The Bay’s premises. The launch incorporatedthe Regional theme, with events taking place in two other regions as well asVancouver.
Corporate, Divisional & Young Worker Initiative – Focus/Strategy
Identifying 2002 Young Worker Divisional Projects(Create YW Year 2002 Planning Matrix)
Prioritize 2002 Young Worker Divisional Projects(Prioritize YW Year 2002 Planning Matrix Projects)
Develop Project Summary Sheet(Create YW Year 2002 5Ws Project Summary Sheet)
Project Working Team/Committee Project Plan(Create YW Year 2002 Project Activity Worksheet)
YW Team Members
Incorporate/integrateYW activities into
Section/Department2002 Plans
Project Lead Person
15 min presentation toYW Team at
September 20, 2001 meeting
Strategic Initiatives
Roll-up Project Plans into 2002YW Divisional Plan
October 1, 2001(Using 5Ws & Activity Sheets)
Page 28 of 31
Activities aimed toward stakeholder ownership will not only involve these retailpartners. All key young worker stakeholder groupings will be reached through thefollowing seven 2002 key programs that were developed based on mining of theyoung worker claims data, external research, and a strategic planning session bythe Young Worker Team:
• Young Worker WorkSafe Certificate ProgramBased on an enthusiastically positive response at a series of focus groupsin November 2001, the WCB will continue to consult with young workerstakeholder groups on the development and implementation of a workplacehealth and safety certificate program for young workers.
• Young Worker Stakeholder Advisory CommitteeThe WCB will establish an external young worker advisory committee tofacilitate better coordination between organizations involved with young workerhealth and safety.
• Community Partners ProgramImplementation of the Young Worker Community Partners Strategy willcontinue.
• Young Worker Peer to Peer Theatre ProjectBased on research confirming that youth respond well to teaching and messagingfrom their peers, the WCB is having high school drama students develop, thenperform a play about young workers to district schools.
• Supervision ProjectThe WCB will develop information tools and resources to help supervisors trainand supervise young workers in health and safety. Strategic Initiatives identifiedsupervisors as one of the three anchors in the young worker strategy.
• Young Worker Health and Safety Web SiteA new web site for and about young workers and stakeholders has been recentlylaunched.
• Young Worker & Stakeholder Survey CardsTo continue eliciting youth and stakeholder feedback on workplace health andsafety issues, the WCB has launched survey instruments for distribution attradeshows and conferences having a youth focus.
Page 29 of 31
• Parent OutreachParents of young workers are a key young worker stakeholder group that hasinfluence concerning the health and safety of their young workers. The BCConfederation of Parent Advisory Councils (BCCPAC), the largest organizationrepresenting parents of school children in the province, has expressed keeninterest in partnering with the Board on young worker health and safety. Safetyin schools is currently a top priority for BCCPAC members. The WCB andBCCPAC will be working together on developing a resource kit for parents onhelping to prepare their children for work experience placement and paid jobs;linking web sites; participating in BCCPAC conferences; and providingarticles/information to parent members.
Page 30 of 31
Section 5.0LASTING IMPACTS:A NEW MODEL FOR THE ORGANIZATION
Despite its short history, the Prevention Division’s Strategic Initiatives sectionhas made a lasting, beneficial mark on the WCB’s overall operation. The section’sHierarchy Tree model for extracting data riches on young worker injuries has pavedthe way for other Divisional sections and departments to effectively use thepowerful Data Warehouse.
The Hierarchy Tree model has proven to provide breadth, depth, and flexibility ofdata analysis, and is vastly increasing the WCB’s decision-making and priority-settingcapabilities.
Various Prevention Industry Services sections, for example, are using the modelto drill for data to help target prevention efforts in high-risk sectors and make thebest use of limited resources.
A further example of the influence of the Hierarchy Tree Model can be seen inthree different types of accident/injury reports that will soon be available toPrevention managers at the touch of a button. These reports will sort data in theData Warehouse according to the hierarchy preferred by the respective IndustryServices manager. One report will sort data according to the occupations with thehighest injury rates in an industry sector. The report will then show the mostfrequent accidents within those occupations, and the specific sources of injuries.A second report will allow managers to view data based on accident type, followedby the occupations in which the accident most often occurred and the specific bodypart injured. The third report will show data sorted by hierarchy of accident type,then nature of injury, then occupation.
Public Affairs is using the information gathered on young worker injury ratesto focus its annual young worker awareness campaign on key industry subsectors.Last year’s campaign focus was the restaurant industry and this year’s focus the retailindustry. The campaigns have not only raised awareness of the highest risk sectorsfor young worker injuries, they have also helped forge new strategic partnershipswith key stakeholders.
Page 31 of 31
The Hierarchy Tree data mining process has also helped the Regional ServicesDepartment to determine priorities for WCB officer visits to employer worksites.Each region is now focusing on the firms and worksites identified as having thehighest rates of injury for young workers.
External research commissioned by Strategic Initiatives to probe the perceptions,behaviours, and values underlying young worker injuries has broken new groundin evidence-based decision-making. The research results are being applied by theDivision in multiple ways from key messaging to development of informationresources to web site design. Health and safety agencies throughout the country havealso benefited from the research and have utilized and referred to the findings intheir initiatives and resources.
The inter-divisional Young Worker Team has proven to be a success story forbringing the WCB’s collective knowledge, expertise, and perspectives to bear on akey strategic issue. The Team has also facilitated enhanced communication betweensections, departments, and divisions.
The story of Strategic Initiatives’ influence extends, however, well beyond the WCB.The young worker story is being told again and again to stakeholders within BritishColumbia and beyond. In BC, the story has stirred external stakeholders to action.Fascinated and troubled by the data, stakeholders have embraced the WCB’s focuson reducing young worker injuries and have asked to be part of the solution.Jurisdictions from around the continent have contacted Strategic Initiatives to learnmore about the young worker data mining and strategic planning approaches, andrecently the influence extended nationally and internationally, with visits by injuryprevention organizations from Quebec, New Zealand, Australia, Chile, andWashington State.
The Workers’ Compensation Board of British Columbia is honoured to be ableto share its young worker knowledge and experience with external stakeholders,including other jurisdictions. In doing so, the organization hopes to contributetoward two universally shared goals — smarter, more responsive, and efficientorganizations and, most importantly, a safer workplace for all workers.