Embed Size (px)
Citation preview

Deep Learning from EEG Reports for Inferring Underspecified
InformationTravis R. Goodwin and Sanda M. Harabagiu
The University of Texas at Dallas
Human Language Technology Research Institute
http://www.hlt.utdallas.edu

No conflicts to disclose.

Presentation Outline
1. Introduction
2. Data
3. Methods
4. Evaluation
5. Conclusions

Introduction: The ProblemMost Common Types of Malpractice Claims against Neurologists:
1. Lapses in communication between the neurologists and the patient
2. Lack of follow-up by the neurologist even when not primarily responsible,
3. Diagnostic errors
Possible Solution:
Automatically flag patients for follow-up and detect inconsistencies by determining whether an EEG report indicates normal or abnormal brain activity

Introduction: The Problem IIEHRs are known to suffer from lots of problems:
• Missing data• Diagnoses omitted; descriptions incomplete (Smith et al. [5])
• Inconsistent data• Contradictions; templated information (Weiner [3], Hersh [4])
• Underspecified data• Information is there, but needs expertise to be understood; difficult for machines (O’mally
et al. [6], Berlin [7])
Engineering features to recover missing/underspecified data is hard!• Requires expertise (domain knowledge)• Time consuming (trial-and-error)• Can be hard to generalize (tuned for specific problem/task)
How to overcome these barriers?

Introduction: The Solution
Goal:
Automatically determine whether an EEG report indicates normal or abnormal brain activity based on the textual content of the report – even if the impression section is absent
Solution:
• Leverage “Big Data” of EEG reports
• Learn how to automatically infer the most likely over-all impression from EEG reports by analyzing the impressions written by neurologists
• Remove the entire impression section from each report
• Train the model to recover the over-all from the remainder of each report
Overall Impression
Normal
Abnormal
?

Presentation Outline
1. Introduction
2. Data
3. Methods
4. Evaluation
5. Conclusions

Data: TUH EEG Corpus
• Temple University Hospital (TUH) EEG Corpus
• Largest publically available dataset of EEG data• 25,000 EEG sessions
• 15,000 patients
• Collected over 12 years
• Contains both EEG Reports and EEG signal data • (we only considered the textual reports)

Data: EEG Reports
American Clinical Neurophysiology Society (ACNS) Guidelines for writing EEG reports
Clinical History: patients age, gender, relevant medical conditions and medications
Introduction: EEG technique/configuration • “digital video EEG”, “standard 10-20 system with 1 channel EKG”
Description: describes any notable waveform activity, patterns, or EEG events• “sharp wave”, “burst suppression pattern”, “very quick jerks of the head”
Impression: interpretation of whether the EEG indicates normal or abnormal brain activity, as well as a list of contributing epileptiform phenomena
• “abnormal EEG due to background slowing”• 1 in 15 missing an over-all impression (normal vs. abnormal)
Clinical correlation: relates the EEG findings to the over-all clinical picture of the patient• “very worrisome prognostic features”

Data: EEG Reports II
Specified Unspecified
IMPRESSION: Normal EEG in wakefulness.
IMPRESSION: This is an abnormal EEG due to1. Prominent versus frontally predominant rhythmic delta.2 Excess beta.3. Excess theta.
IMPRESSION: This EEG is similar to the2 previous studies thisyear which demonstrated aslow background. Eachrecording seems todemonstrate an increase inslowing. Theadministration of Ativanproduced a somewhatdiscontinuous pattern asmay be anticipated in apatient with advanceddementia.
Normal Abnormal

Presentation Outline
1. Introduction
2. Data
3. Methods
4. Evaluation
5. Conclusions

Methods: Overview
Deep Learning Steps:
Step 1. word-level features are automatically extracted based on their context by incorporating the skip-gram model
• popularized by the Word2Vec framework
Step 2. report-level features are automatically extracted using either 1. deep averaging network (DAN)
2. recurrent neural network (RNN)
Step 3. the most likely over-all impression is predicted from word-and report-level features

Methods: Problem Formulation
Representation:
• EEG Report 𝑹 ∈ ℝ𝑁,𝑉
• Each row, 𝑹𝒊, is a one-hot vector
• Over-all impression 𝑐 ∈ NORMAL, ABNORMAL
Target Distribution:𝑃 𝑐 𝑹; 𝜃 = 𝑃 𝑾 𝑹) ⋅ 𝑃 𝒆 𝑾 ⋅ 𝑃 𝑐 𝒆; 𝜃)
where
• 𝑾 is a matrix of word-level feature vectors extracted from 𝑹
• 𝒆 is a report-level feature vector extracted from 𝑾
• 𝜃 represents the learnable model parameters

Methods: Problem Formulation II
𝑃 𝑐 𝑹; 𝜃 = 𝑃 𝑾 𝑹) ⋅ 𝑃 𝒆 𝑾 ⋅ 𝑃 𝑐 𝒆; 𝜃)
Three factors, corresponding to the three steps
1. produce a high-level feature representation 𝑾 of every word in 𝑹
create a single high-level feature representation 𝒆 for the report itself by combining and composing the high-level feature representations of every word in the report
determine the most likely over-all impression 𝑐 for the report based on its high-level feature representation 𝒆
1 2 3
1
2
3
Methods: Step 1Learning Word-Level Features from EEG Reports
Goal: Learn a representation for the word EEGwhich captures the facts that:
1. an EEG can be performed and 2. digital video is a type of EEG.
Skip-gram embeddings (Mikolov [12])• For each word:
• Try to predict 𝑘 previous and 𝑘 following words• (used 𝑘 = 2) words
• Learn one embedding matrix 𝑼 ∈ 𝜽 which is best at predicting the adjacent words for every word in the training set
• 𝑅 → 𝑊• 𝑊𝑖 is a fixed-length, continuous vector

Methods: Step 2Learning Report-Level Features from EEG ReportsGoal: learn how to combine and compose the word-level feature vectors 𝑾 to create a single high-level feature vector for the report, 𝒆.
Examples:
“…periodic delta with associated periodic paroxysmal fast activity identified from the left hemisphere with a generous field of spread including the centrotemporal and frontocentral region.
• Periodic delta observed in centrotemporal and frontocentral regions
• (19 words between them!) “
…a well-formed 9 to 10Hz posterior dominant rhythm, which is symmetrically reactive to eye opening and eye closing.
• the words posterior dominant rhythm describe a single EEG activity
• the posterior dominant rhythm is well-formed..

Methods: Step 2Learning Report-Level Features from EEG Reports
We considered two different neural architectures for learning 𝒆.
Model 1: Deep Averaging Network (DAN) (Iyyer [2014])• considers un-ordered composition of each word in the report
Model 2: Recurrent Neural Network (RNN). • considers ordered composition of each word in the report
• struggles to account for long-distance interactions
• favors the latter half of each document.
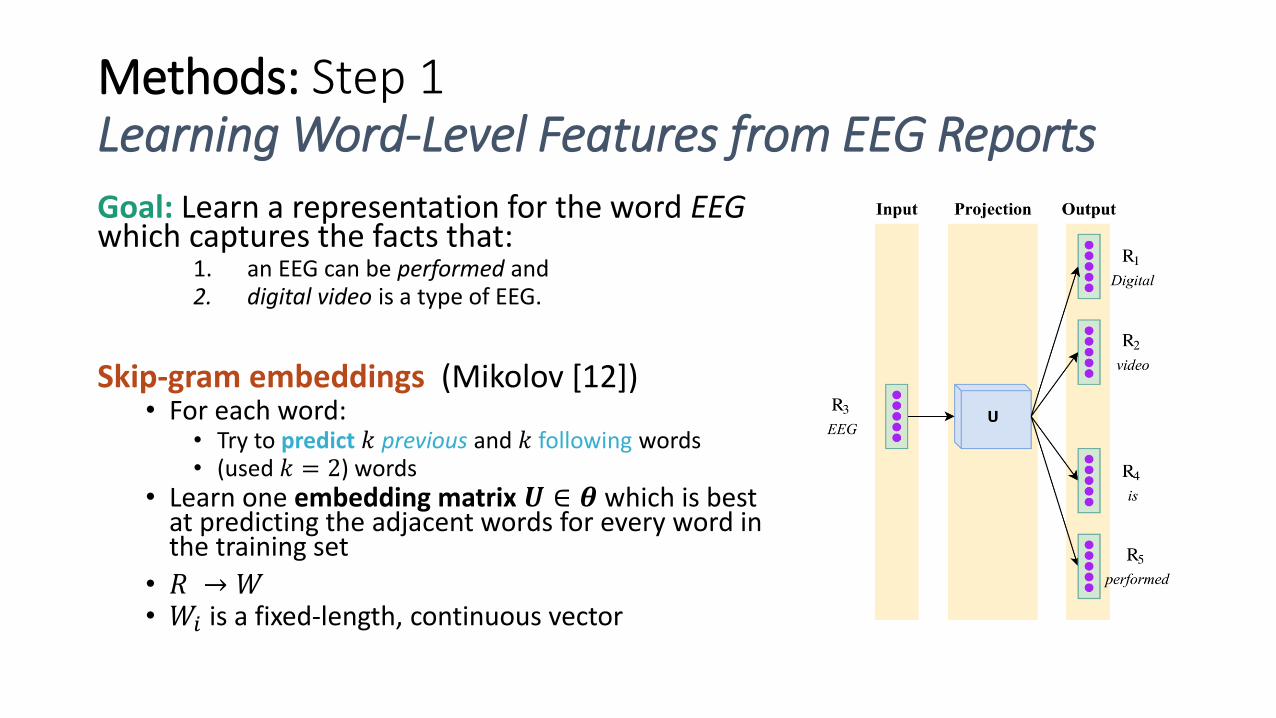
Methods: Step 2Model 1: DAN
REctified Linear Unit (ReLU)
• relu 𝑥 = max(𝐴𝑥 + 𝑏, 0)
Five layers:
• Layers 1 & 2: ReLUs to refineword-level feature vectors
• Layer 3: Averaging layer produce initial report-level feature vector
• Layers 4 & 5: ReLUs to refinereport-level feature vector
Result:
𝒆, report-level feature vector

Methods: Step 2Model 2: RNN
Recurrent Neural Network• Consider the EEG report as a sequence of word
vectors
• For each word-vector 𝑾𝒊, produce a partial embedding vector 𝒚𝒊
Long Short-Term Memory• Can learn long-range interactions in the report
• Maintains & updates an internal memory
• Final output embedding vector 𝒚𝑵 becomes 𝒆, the report-level feature vector

Methods: Step 3Inferring the over-all impressionAll the heavy lifting done in Steps 1 – 2!
Single fully-connected sigmoid layer,ǁ𝑐 = 𝜎 𝑺𝑐 ⋅ 𝒆 + 𝒃𝑐
where
𝜎 𝑥 = ൗ𝑒𝑥𝑒𝑥+1
Thus:
𝑃 𝑐 𝒆; 𝜃) = ቊ1 − ǁ𝑐, if 𝑐 = NORMAL
ǁ𝑐, if 𝑐 = ABNORMAL

Methods: Training the Model
Goal: minimize the loss when computing the over-all impression 𝑐 for each report 𝑹 in the training set 𝒳
Used cross-entropy loss between the predicted over-all impression 𝑐 and the gold-standard value Ƹ𝑐 indicated by the neurologist (in the removed impression section):
ℒ 𝜃 ∝𝑹, Ƹ𝑐 ∈𝒳
𝑃 𝑐 𝒆; 𝜃 ⋅ 𝑃 𝒆 𝑾 ⋅ 𝑃 𝑾 𝑹 ⋅ log𝑃 Ƹ𝑐
where 𝑃 Ƹ𝑐 = 1 if 𝑐 = ABNORMAL, and zero otherwise.
ADAptive Moment estimation (ADAM)

Presentation Outline
1. Introduction
2. Data
3. Methods
4. Evaluation
5. Conclusions

Evaluation: Experimental Setup
3:1:1 split for training / development / testing
For each report:1. Identified the over-all impression Ƹ𝐜 from the impression section2. Removed the impression section from the report3. Predicted 𝐜 from the remainder of the report using our model4. Evaluated 𝐜 against Ƹ𝐜
Measured using standard binary classification metrics:
Accuracy, Precision, Recall, 𝐹1-measure

Evaluation: Baselines
Support Vector Machine (SVM)• Bag of Words (SVM:BOW)
• Represent 𝑹 as a basic bag-of-words vector
• Latent Dirichlet Allocation (SVM:LDA)• Represent 𝑹 as a topic-vector produced using Latent Dirichlet Allocation (LDA)
Approximate Nearest Neighbor (ANN:Lev)• use the over-all impression given in the closest EEG report in the training set • measured the “distance” between reports using Levenshtein distance (with equal costs for insertion, deletion, and
substitution operations).
Neural Bag-of-Words (NBOW)• simple perceptron baseline • same as skipping steps 1 and 2! • Represent 𝑹 as a basic bag-of-words vector
Doc2Vec (D2V)• high-level semantic representation of EEG reports• agnostic of any particular task and do not capture any interaction between the content of the report and the over-all
impression. • Used to replace 𝒆 in step 3.

Evaluation: Experimental Results
System Accuracy Precision Recall 𝑭𝟏-measure Time
SVM:BOW 0.8349 0.8503 0.8814 0.8656 4min 44s
SVM:LDA 0.6331 0.6245 0.9947 0.7673 9min 56s
ANN:Lev 0.7457 0.8069 0.7601 0.7829 38s
NBOW 0.7491 0.8300 0.7346 0.7794 3min 37s
D2V 0.6587 0.7645 0.6275 0.6892 6min 12s
★ DNN: DAN 0.9143 0.9443 0.9117 0.9277 8min 14s
★ DNN: RNN 0.8941 0.9234 0.8991 0.9111 20min 46s

Evaluation: Errors
• Incomplete reports• the impression section refers to information not directly stated elsewhere,
e.g. “excess theta” or “excess beta” which were not mentioned
• Limited scope• the impression section considers the entire clinical picture not just the
neurological information in the report• e.g., “normal activity given recent trauma”
• Typos and grammatical inconsistencies• “$een in” rather than “seen in”; • “eta rhythm” rather than “beta rhythm”; • “& Hz” rather than “7 Hz”.

Presentation Outline
1. Introduction
2. Data
3. Methods
4. Evaluation
5. Conclusions

Conclusions
• It is important to consider both word- and report- level features
• Deep learning can automatically extract useful word- and report-level features from EEG reports
• Learning task-specific neural embeddings can be better than relying on global task-agnostic embeddings
• Un-ordered word composition is sufficient and much faster!

Acknowledgements
Research reported in this publication was supported by the National Human Genome Research Institute of the National Institutes of Health under award number 1U01HG008468. The content is solely the responsibility of the authors and does not necessarily represent the official views of the National Institutes of Health.

Questions?