Embed Size (px)
Citation preview

ARTICLE OPEN
Deep-learning-based real-time prediction of acute kidneyinjury outperforms human predictive performanceNina Rank 1, Boris Pfahringer 1, Jörg Kempfert1,2, Christof Stamm1,2, Titus Kühne 2,3,4, Felix Schoenrath1,2, Volkmar Falk 1,2,4,5,6,Carsten Eickhoff 7 and Alexander Meyer 1,2,4✉
Acute kidney injury (AKI) is a major complication after cardiothoracic surgery. Early prediction of AKI could prompt preventivemeasures, but is challenging in the clinical routine. One important reason is that the amount of postoperative data is too massiveand too high-dimensional to be effectively processed by the human operator. We therefore sought to develop a deep-learning-based algorithm that is able to predict postoperative AKI prior to the onset of symptoms and complications. Based on 96 routinelycollected parameters we built a recurrent neural network (RNN) for real-time prediction of AKI after cardiothoracic surgery. From thedata of 15,564 admissions we constructed a balanced training set (2224 admissions) for the development of the RNN. The modelwas then evaluated on an independent test set (350 admissions) and yielded an area under curve (AUC) (95% confidence interval)of 0.893 (0.862–0.924). We compared the performance of our model against that of experienced clinicians. The RNN significantlyoutperformed clinicians (AUC= 0.901 vs. 0.745, p < 0.001) and was overall well calibrated. This was not the case for the physicians,who systematically underestimated the risk (p < 0.001). In conclusion, the RNN was superior to physicians in the prediction of AKIafter cardiothoracic surgery. It could potentially be integrated into hospitals’ electronic health records for real-time patientmonitoring and may help to detect early AKI and hence modify the treatment in perioperative care.
npj Digital Medicine (2020) 3:139 ; https://doi.org/10.1038/s41746-020-00346-8
INTRODUCTIONAcute kidney injury (AKI) is a major postoperative complicationafter cardiothoracic surgery. It is an independent risk factor forearly and long-term mortality1–4 and is strongly associated withincreased hospital costs and length of stay5–7.AKI is defined as a major increase of serum creatinine or a
strong decline in urine output8. Compromised renal blood flowand cardiopulmonary bypass play a critical role in the develop-ment of AKI, but overall its etiology is highly multifactorial9–12.Early detection of patients at high risk of developing AKI allows
for early therapeutic intervention prior to the onset of anuria andits complications such as acidosis, hyperkalemia, or volumeoverload as well as long-term complications such as lung injury,sepsis and chronic kidney disease13–16. In a pilot study in 2011 itwas demonstrated that in patients with AKI stage I, earlynephrologist consultation can avert progression to higher AKIstages17. It was also shown that delayed nephrologist involvement(48 h after AKI onset) in critically ill patients was associated with anincrease of mortality and dependence on dialysis18. An immediatepost-operative “KDIGO care bundle” (optimization of volumestatus and hemodynamics, avoidance of nephrotoxic drugs andhyperglycemia) in high-risk patients has been shown to reducecardiac surgery-associated AKI19.Although several classical clinical risk scores for the prediction
of postoperative AKI exist, none of them is specifically recom-mended by guidelines20–26. With few exceptions they rely onpatient demographics, disease history and the type of surgery andrequire time-consuming manual data collection and calculation.Furthermore, they are usually based on static properties or single
point-in-time measurements that cannot adapt to the often rapidand dramatic changes that occur in the postoperative setting.Increased digitization of medical information opens up new
alternatives for early prediction of postoperative complicationsthat might potentially be integrated into existing electronic healthrecord (EHR) software. A vast amount of data with high temporalresolution is collected during a hospital stay. Effectively processingsuch high-dimensional data in a parallelized way, however, goesfar beyond the capabilities of the human brain27. Machinelearning (ML) offers a potential solution to this problem.Previous studies investigating the performance of ML models in
predicting AKI have yielded promising results28–35. However,studies directly comparing the predictive performance of MLmodels against experienced physicians in the prediction ofpostoperative AKI on time-series data of real clinical cases arehighly needed.We therefore developed a recurrent neural network (RNN) that
allows real-time predictions of AKI within the first 7 postoperativedays following cardiothoracic surgery based on routinely collectedvariables (features). This model was then compared to theperformance of experienced health-care professionals.
RESULTSPerformance of the RNN based predictionA complete description of the study population, patient selectionprocess, development of the ML model, and the experimentaldesign of our RNN-vs-human comparison can be found in the‘Methods’ section.
1Department of Cardiothoracic and Vascular Surgery, German Heart Center Berlin, Augustenburger Platz 1, 13353 Berlin, Germany. 2DZHK (German Centre for CardiovascularResearch), Partner Site Berlin, P.O. Box 65 21 33, 13316 Berlin, Germany. 3Institute for Computer-assisted Cardiovascular Medicine, Charité–Universitätsmedizin Berlin,Augustenburger Platz 1, 13353 Berlin, Germany. 4Berlin Institute of Health, Anna-Louisa-Karsch-Str. 2, 10178 Berlin, Germany. 5Department of Cardiothoracic Surgery, Charité –Universitätsmedizin Berlin, Charitéplatz 1, 10117 Berlin, Germany. 6Department of Health Sciences and Technology, ETH Zürich, Leopold-Ruzicka-Weg 4, 8093 Zürich, Switzerland.7Center for Biomedical Informatics, Brown University, 233 Richmond Street, Providence, RI 02912, USA. ✉email: [email protected]
www.nature.com/npjdigitalmed
Seoul National University Bundang Hospital
1234567890():,;

In summary, we retrospectively analysed EHR time series datawith high temporal resolution (up to 1min) generated at a tertiarycare center for cardiovascular diseases. Based on n= 2224admissions, we developed an RNN that continuously (every15min) predicted the probability of developing AKI defined asKDIGO8 stage 2 or 3 within the first 7 days after cardiothoracicsurgery.Supplementary Tables 1–4 show a comparison of baseline
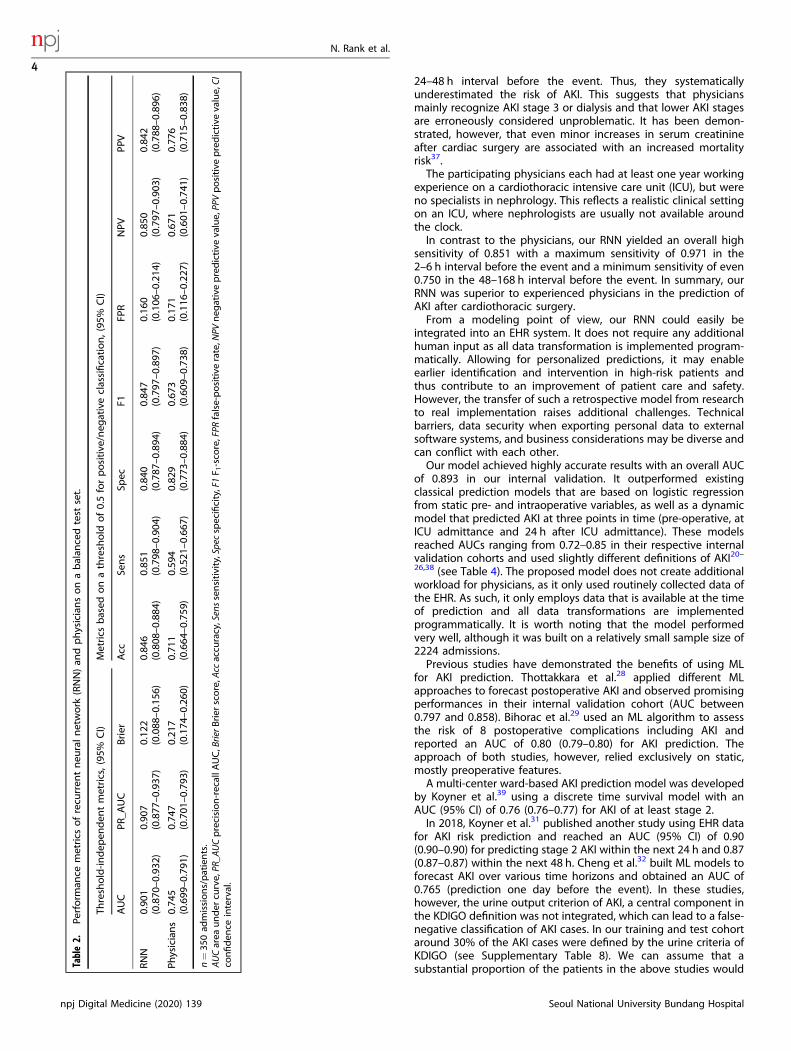
characteristics between AKI- and non-AKI cases in the training,balanced and imbalanced test set and the whole study populationbefore matching AKI- and non-AKI cases.Table 1 shows the performance metrics of our RNN evaluated
on an independent test set with n= 350 patients. The modelachieved an area under curve (AUC) (95% confidence interval (CI))of 0.893 (0.862–0.924). In addition, we trained a model with onlyserum creatinine as input and yielded an AUC of 0.805(0.768–0.842). Thus, the addition of further parameters led to anabsolute increase of around 10 percentage points in the AUC.However, a model using all features but creatinine and glomerularfiltration rate (GFR) (the GFR is calculated from creatinine)performed almost as good as the full model with an AUC of0.887 (0.855–0.919)—probably due to high correlation betweencreatinine and other features, e.g., urea. For further performancemetrics of these reduced models see Supplementary Tables 5 and 6.A table with the model performance metrics derived from an
imbalanced test set with incidence rate of 10% AKI (seeSupplementary Results 1) can be found in Supplementary Table 7.In addition, we analysed some examples of the predictions ofindividual patients including false-positive and false-negativepredictions. These can be found in Supplementary Figs. 1–3.
RNN vs. human-level performance—experimental designWe set up an experiment to compare our ML model againstexperienced physicians (Fig. 1). For each of the n= 350 patients ofour balanced test set a quasi-random point in time in theirobservation period was chosen, further denoted as ‘predictionpoint’ (For more information about quasi-random samples see the‘Methods’ section.).At the chosen prediction point, seven experienced physicians
and the ML model each had to make a prediction (between 0 and100%) of how likely the patient was to develop AKI within the first7 days after surgery.All time series information up to the ‘prediction point’ was
graphically displayed for the physicians to mimic the electronicpatient chart.
Performance of RNN and physiciansThe performance of our RNN and the physicians’ assessment canbe found in Table 2 (Note that the metrics of the RNN are slightlydifferent from those in section ‘Performance of the RNN basedprediction’. The reason is that in the RNN vs. human experimentonly one prediction point per patient was evaluated, whereas forthe complete evaluation of the RNN all predictions of the wholeobservation periods for all patients were evaluated.).The median (interquartile range (IQR)) prediction value for the
physicians was 0.36 (0.15–0.70) vs. 0.51 (0.12–0.86) for the RNN.Across all metrics, the RNN outperformed the physicians. We
obtained an AUC of 0.901 for the RNN vs. 0.745 for the physicians(p < 0.001, Z= 6.85, DeLong’s test). The receiver operatingcharacteristic (ROC) curves and the precision-recall curves aredisplayed in Fig. 2a and Fig. 2b, respectively.The mean of our predictive quality score S (S= r, if the patient
developed AKI and S= 1−r, if the patient did not develop AKI)was significantly higher for the RNN than for the experiencedphysicians (0.754 vs 0.639, p < 0.001, t-statistic= 8.47, df= 349,paired t-test).Ta
ble1.
Model
perform
ance
metrics
forbalan
cedtest
set.
Threshold-in
dep
enden
tmetrics,(95
%CI)
Threshold-dep
enden
tmetrics,(95
%CI)
AUC
PR_A
UC
MSE
pat
Acc
Sens
Spec
F1FP
RNPV
PPV
0.89
3(0.862
–0.92
4)0.90
3(0.873
–0.93
3)0.12
4(0.090
–0.15
9)0.82
5(0.786
–0.86
3)0.85
3(0.802
–0.90
4)0.79
8(0.741
–0.85
5)0.82
6(0.776
–0.87
6)0.20
2(0.145
–0.25
9)0.85
1(0.799
–0.90
3)0.80
1(0.745
–0.85
7)
n=35
0ad
missions/patients.
AUCarea
under
curve,PR
_AUCprecision-recallA
UC, M
SEpa
tmeanofthebrier
score
ofe
achpatient,Acc
accu
racy,Senssensitivity,Specspecificity,F1F 1-sco
re,FPR
false-positive
rate,N
PVneg
ativepredictive
value,
PPVpositive
predictive
value,
CIco
nfiden
ceinterval.T
hethreshold
forpositive
/neg
ativeclasspredictionwas
setto
0.41
,leadingto
asensitivity
of0.85
0oncross-validationfoldsin
thetrainingset.
N. Rank et al.
2
npj Digital Medicine (2020) 139 Seoul National University Bundang Hospital
1234567890():,;

In addition, we investigated the calibration of the RNN’s andphysicians’ predictions. Calibration describes how close thepredicted probabilities are to the observed frequencies. Aperfectly calibrated model would have one point at (0,0) andone at (1,1) in a calibration plot (it would always predict 0 fornegatives and 1 for positives). For a well-calibrated model, thepoints lie on the diagonal between (0,0) and (1,1). Figure 2cillustrates that in the intervals of high prediction values ofphysicians, the predicted frequencies of AKI largely correspond tothe observed frequencies (upper right part of the calibrationcurve). However, for several patients that developed AKI,physicians predicted low AKI probabilities (false-negative predic-tions, lower left part of the calibration curve). This is also reflectedin the observation that the physicians’ median (IQR) predictionvalue was lower than the RNN’s (Physicians: 0.36 (0.15–0.70) andRNN: 0.51 (0.12–0.86)). Overall the physicians’ predictions were notwell calibrated (p < 0.001, Χ2= 165.5, df= 8, Hosmer-Lemeshow-test36).In contrast, Fig. 2d displays a very well calibration (p= 0.37, Χ2
= 8.67, df= 8, Hosmer-Lemeshow-test) for the RNN, with most ofthe points lying very close to the diagonal, even in intervals of lowprediction values.We investigated the performance of our RNN and physicians at
different points in time before the event (AKI or non-AKI/discharge) (see Table 3). Not-surprisingly, both, humans andRNN, performed worse when the event was further away in time.However, low sensitivity rates could also be observed when theevent was very close (≤2 h). In this group the median total
observation length was very short, meaning that patients whodeveloped AKI, developed it rapidly after surgery. Thus, there wasprobably not enough information available before the event toreliably predict AKI. However, even in this interval, the RNNreached a sensitivity of 0.789.
DISCUSSIONWe developed an RNN for real-time prediction of postoperativeAKI within 7 days after cardiothoracic surgery—based on routinelycollected features during the hospital stay and then retro-spectively validated it on an independent test set.To test the clinical significance, we performed a side-by-side
comparison of our model against experienced physicians. Suchdirect comparisons are highly needed, but hardly ever performedin clinical ML studies. We had expected our model to performnearly as well as the physicians, and had designed our study as anon-inferiority-experiment. Surprisingly, our RNN significantlyoutperformed experienced clinicians in terms of the mean ofour performance metric S. (S indicates how close a prediction is tothe observed outcome). In addition, the model reached asignificantly higher AUC than the physicians (0.901 vs. 0.745, p <0.001, DeLong’s test) and was overall well calibrated (Hosmer-Lemeshow-Test: p= 0.37 vs. p < 0.001 for physicians).Physicians showed an overall low sensitivity of 0.594 at AKI
prediction. They predicted lower risk probabilities in general. Theyreached a maximum sensitivity of 0.793 for the 2–6 h intervalbefore the event and a minimum sensitivity of 0.387 for the
patient selection process (see Fig. 3,
Methods)
Test Set350 admissions/
patients
EHR data
RNN
Train RNN
Xend of OP end of full
timeseriesprediction
point
quasi-random selection of one "prediction point" in time-series of each patient when
prediction has to be made prediction point
length of full time-series
Pat A 36h 15min 85h 15min
Pat B 7h 45min 33h 0min
Pat C 110h 15min 150h 30min
Physicians
prediction point
risk prediction RNN
risk prediction physicians
Pat A 36h 15min 78 % 55 %
Pat B 7h 45min 33 % 65 %
Pat C 110h 15min 10 % 12 %
after surgery at prediction point
patients' time-series till prediction point
Training Set2,224 admissions/
2,180 patients
Fig. 1 Experimental design for performance comparison of recurrent neural network (RNN) against physicians. The electronic healthrecord (EHR) data was split into a training and a test set. The training set was used for the development of the RNN (orange path). For eachpatient (Pat) in the test set, a quasi-random ‘prediction point’ in the time-series was chosen (for more information about quasi-randomnesssee ‘Methods’). EHR data up to this prediction point was given to physicians and RNN (the rest of the time series data, here denoted as X, washidden). Both physicians and RNN, had to make a prediction for postoperative AKI at this prediction point.
N. Rank et al.
3
Seoul National University Bundang Hospital npj Digital Medicine (2020) 139
24–48 h interval before the event. Thus, they systematicallyunderestimated the risk of AKI. This suggests that physiciansmainly recognize AKI stage 3 or dialysis and that lower AKI stagesare erroneously considered unproblematic. It has been demon-strated, however, that even minor increases in serum creatinineafter cardiac surgery are associated with an increased mortalityrisk37.The participating physicians each had at least one year working
experience on a cardiothoracic intensive care unit (ICU), but wereno specialists in nephrology. This reflects a realistic clinical settingon an ICU, where nephrologists are usually not available aroundthe clock.In contrast to the physicians, our RNN yielded an overall high
sensitivity of 0.851 with a maximum sensitivity of 0.971 in the2–6 h interval before the event and a minimum sensitivity of even0.750 in the 48–168 h interval before the event. In summary, ourRNN was superior to experienced physicians in the prediction ofAKI after cardiothoracic surgery.From a modeling point of view, our RNN could easily be
integrated into an EHR system. It does not require any additionalhuman input as all data transformation is implemented program-matically. Allowing for personalized predictions, it may enableearlier identification and intervention in high-risk patients andthus contribute to an improvement of patient care and safety.However, the transfer of such a retrospective model from researchto real implementation raises additional challenges. Technicalbarriers, data security when exporting personal data to externalsoftware systems, and business considerations may be diverse andcan conflict with each other.Our model achieved highly accurate results with an overall AUC
of 0.893 in our internal validation. It outperformed existingclassical prediction models that are based on logistic regressionfrom static pre- and intraoperative variables, as well as a dynamicmodel that predicted AKI at three points in time (pre-operative, atICU admittance and 24 h after ICU admittance). These modelsreached AUCs ranging from 0.72–0.85 in their respective internalvalidation cohorts and used slightly different definitions of AKI20–26,38 (see Table 4). The proposed model does not create additionalworkload for physicians, as it only used routinely collected data ofthe EHR. As such, it only employs data that is available at the timeof prediction and all data transformations are implementedprogrammatically. It is worth noting that the model performedvery well, although it was built on a relatively small sample size of2224 admissions.Previous studies have demonstrated the benefits of using ML
for AKI prediction. Thottakkara et al.28 applied different MLapproaches to forecast postoperative AKI and observed promisingperformances in their internal validation cohort (AUC between0.797 and 0.858). Bihorac et al.29 used an ML algorithm to assessthe risk of 8 postoperative complications including AKI andreported an AUC of 0.80 (0.79–0.80) for AKI prediction. Theapproach of both studies, however, relied exclusively on static,mostly preoperative features.A multi-center ward-based AKI prediction model was developed
by Koyner et al.39 using a discrete time survival model with anAUC (95% CI) of 0.76 (0.76–0.77) for AKI of at least stage 2.In 2018, Koyner et al.31 published another study using EHR data
for AKI risk prediction and reached an AUC (95% CI) of 0.90(0.90–0.90) for predicting stage 2 AKI within the next 24 h and 0.87(0.87–0.87) within the next 48 h. Cheng et al.32 built ML models toforecast AKI over various time horizons and obtained an AUC of0.765 (prediction one day before the event). In these studies,however, the urine output criterion of AKI, a central component inthe KDIGO definition was not integrated, which can lead to a false-negative classification of AKI cases. In our training and test cohortaround 30% of the AKI cases were defined by the urine criteria ofKDIGO (see Supplementary Table 8). We can assume that asubstantial proportion of the patients in the above studies wouldTa
ble2.
Perform
ance
metrics
ofrecu
rren
tneu
ralnetwork
(RNN)an
dphysiciansonabalan
cedtest
set.
Threshold-in
dep
enden
tmetrics,(95
%CI)
Metrics
based
onathreshold
of0.5forpositive
/neg
ativeclassification,(95
%CI)
AUC
PR_A
UC
Brier
Acc
Sens
Spec
F1FP
RNPV
PPV
RNN
0.90
1(0.870
–0.93
2)0.90
7(0.877
–0.93
7)0.12
2(0.088
–0.15
6)0.84
6(0.808
–0.88
4)0.85
1(0.798
–0.90
4)0.84
0(0.787
–0.89
4)0.84
7(0.797
–0.89
7)0.16
0(0.106
–0.21
4)0.85
0(0.797
–0.90
3)0.84
2(0.788
–0.89
6)
Physicians
0.74
5(0.699
–0.79
1)0.74
7(0.701
–0.79
3)0.21
7(0.174
–0.26
0)0.71
1(0.664
–0.75
9)0.59
4(0.521
–0.66
7)0.82
9(0.773
–0.88
4)0.67
3(0.609
–0.73
8)0.17
1(0.116
–0.22
7)0.67
1(0.601
–0.74
1)0.77
6(0.715
–0.83
8)
n=35
0ad
missions/patients.
AUCarea
under
curve,PR
_AUCprecision-recallA
UC,BrierB
rier
score,A
ccaccu
racy,Senssensitivity,Specspecificity,F1F 1-sco
re,FPR
false-positive
rate,N
PVneg
ativepredictive
value,PPVpositive
predictive
value,CI
confiden
ceinterval.
N. Rank et al.
4
npj Digital Medicine (2020) 139 Seoul National University Bundang Hospital

Table 3. Performance metrics of recurrent neural network (RNN) and physicians in temporal dependence to the event.
Predictor Time to event patients AKI MOL AUC PR_AUC Brier Acc Sens Spec F1 FPR NPV PPV
RNN 0 h to 2 h 54 19 8.3 h 0.913 0.837 0.113 0.870 0.789 0.914 0.811 0.086 0.889 0.833
Physicians 0 h to 2 h 54 19 8.3 h 0.709 0.552 0.199 0.759 0.632 0.829 0.649 0.171 0.806 0.667
RNN 2 h to 6 h 63 29 12.5 h 0.881 0.88 0.13 0.825 0.862 0.794 0.820 0.206 0.871 0.781
Physicians 2 h to 6 h 63 29 12.5 h 0.853 0.861 0.152 0.794 0.793 0.794 0.780 0.206 0.818 0.767
RNN 6 h to 12 h 63 34 17.8 h 0.942 0.948 0.088 0.921 0.971 0.862 0.930 0.138 0.962 0.892
Physicians 6 h to 12 h 63 34 17.8 h 0.811 0.798 0.19 0.746 0.618 0.897 0.724 0.103 0.667 0.875
RNN 12 h to 24 h 74 42 36.4 h 0.888 0.921 0.128 0.824 0.881 0.750 0.851 0.250 0.828 0.822
Physicians 12 h to 24 h 74 42 36.4 h 0.693 0.706 0.257 0.689 0.667 0.719 0.709 0.281 0.622 0.757
RNN 24 h to 48 h 60 31 46.4 h 0.890 0.899 0.142 0.817 0.774 0.862 0.814 0.138 0.781 0.857
Physicians 24 h to 48 h 60 31 46.4 h 0.718 0.774 0.246 0.633 0.387 0.897 0.522 0.103 0.578 0.800
RNN 48 h to 168 h 36 20 99.0 h 0.875 0.929 0.132 0.806 0.750 0.875 0.811 0.125 0.737 0.882
Physicians 48 h to 168 h 36 20 99.0 h 0.647 0.741 0.274 0.611 0.400 0.875 0.533 0.125 0.538 0.800
AKI number of patients with acute kidney injury, MOL median total observation length, AUC area under curve, PR_AUC precision-recall AUC, Brier Brier score,Acc accuracy, Sens sensitivity, Spec specificity, F1 F1-score, FPR false-positive rate, NPV negative predictive value, PPV positive predictive value.
Fig. 2 Discrimination and calibration of the predictions of recurrent neural network (RNN) and physicians. a receiver operatingcharacteristics (ROC), b precision-recall curve, c calibration of physicians, d calibration of RNN. AUC area under curve. H-L Hosmer-Lemeshow-Test36, PR_AUC precision-recall AUC. The RNN outperformed clinical physicians regarding AUC (a) and PR_AUC (b). Physicians systematicallyunderestimated the risk of acute kidney injury (predicted risks < observed risks, c). In contrast, the RNN was overall well calibrated (d).
N. Rank et al.
5
Seoul National University Bundang Hospital npj Digital Medicine (2020) 139

also have met the urine criteria first. Probably not all of them havebeen classified as false-negative, as they might have met thecreatinine criterion at a later stage. In our population, 11% of theAKI-cases in the training set and 12% in the test set exclusivelyfulfilled the urine criterion and would have been diagnosed false-negatively without this criterion. The median (IQR) diagnosis delayof patients who met both criteria within 7 postoperative days was14.0 h (6.3–27.3 h) in the training set and 13.3 h (5.3–22.4 h) in thetest set. Especially in models with short prediction horizons, thereis a high risk that the prediction of imminent AKI andconsequently initiation of preventive measurements is delayedwhen not integrating the urine criterion.In addition, these previous models were restricted to patients
with a serum creatinine of <3mg/dl (Koyner et al.) or even normalserum creatinine level and a GFR of at least 60ml/min/1.73 m2
(Cheng et al.) at admission.Mohamadlou et al.40 developed an ML algorithm based on EHR
data for detection of AKI at onset and prediction of AKI 12, 24, 48,and 72 h before onset. They reported AUCs from 0.872 (onset) to0.728 (72 h before onset).Another study for continuous AKI prediction on a large data set
was performed by Tomasev et al.34. The developed RNN predictedAKI stage 2 or 3 with an AUC of 0.971 24 h before onset.Also in these studies the urine output criterion of AKI was not
incorporated. In addition, in the study of Tomasev et al. only
patients were included for whom at least one year of EHR datawere available before admission. They added aggregate featuresof up to five years of historical information of each individualpatient. This approach requires that patients are already known inthe admitting hospital, which is often not the case. It is unclearhow their algorithm would perform on patients without any priormedical history. In contrast, we used a real uncurated data streamin our model that only contained information generated afteradmission.Meyer et al.35 used an RNN to predict AKI requiring dialysis,
mortality and postoperative bleeding after cardiac surgery usingroutinely collected parameters within the first 24 hours aftersurgery. The deep-learning model provided very accurate predic-tions (positive predictive value (PPV)/sensitivity for AKI: 0.87/0.94)that outperformed usual clinical risk scores.Our model predicted AKI in a time frame up to 7 days after
cardiothoracic surgery. Compared to the observation windows ofthe studies mentioned above, this is a much longer time period.Events in the near future are usually easier to predict than those inthe more distant future. To intervene early when the kidneys aremerely at risk of injury, a longer prediction window might benecessary. It has been shown that early intervention can preventAKI or its progression to higher stages17,19. Therefore, theprediction of our model was not limited to AKI requiring dialysis,
Table 4. Comparison between classical prediction models20 based on logistic regression and our recurrent neural network (RNN).
Authors, model Sample sizederivation
Sample sizeinternalvalidation
Validation method “Real-time”prediction
Predicted outcome Manualcalculation
AUC on internalvalidation
Chertow et al.,CICSS21
42,773 42,773 100-sample bootstrap No 30 days post-op. AKI Yes 0.76 (AUC onderivationcohort)
3795 Prospective validation Not reported
Brown et al.,NNECDSG38
8363 8363 Bootstrap validatedC-index (AUC)
No Severe post-op. AKI(eGFR < 30ml/min)
Yes 0.72* (0.68–0.75)
Palomba et al.,AKICS24
603 215 Prospective validation No 7 days post-op. AKI Yes 0.85 (0.8–0.9)
Aronson et al.,MCSPI25
2381 2420 Split sample validation No Renal dysfunction orrenal failure (dialysisor evidence of renalfailure at autopsy)
Yes 0.80
Wijeysundera et al.,SRI26
10,751 10,751 200-sample bootstrap No Post-op. renalreplacement therapy
Yes 0.81* (0.78–0.84)
2566 Prospective validation 0.78 (0.72–0,84)
Mehta et al.,STS (Mehta)23
simplified model
449,524 86,009 Independent sample No Post-op. dialysis Yes 0.83
Thakar et al.,Cleveland Clinic22
15,838 15,839 Split sample validation No Post-op. dialysis Yes 0.82 (0.80–0.85)
Jiang et al., DynamicPredictive Score67
6081 1152 Independent sample No AKI ≥ stage 1 KDIGO Yes 0.74preoperative,0.75 at ICUadmission,0.82postoperative
This study,RNN
2224 350 IndependentSample (balanced,incidence 50%)
Yes 7 days post-op. AKIstage 2 or 3
No 0.89 (0.86–0.92)
1945 Independent sample(imbalanced,incidence 10%)
0.85 (0.83–0.86)
AKI acute kidney injury, AUC area under curve.
N. Rank et al.
6
npj Digital Medicine (2020) 139 Seoul National University Bundang Hospital

but included the prediction of AKI stages 2 or 3 according to theKDIGO definition.To conclude, based on a relatively small sample size, we
developed a highly accurate model for the prediction of AKI aftercardiac surgery that significantly outperformed experiencedphysicians, could potentially be integrated into EHR systems andmight prevent severe complications following AKI through real-time patient surveillance. In a long-term perspective, an extensionof the application from a simple risk prediction model totreatment decision support tool is also conceivable.This study has several shortcomings. The observation periods of
the included patients varied widely in length. For most patients itended in <3 days while some outliers lasted for up to 7 days. Weonly used the start of nephrotoxic drug administration as a feature.Consideration of exact dose, administration route (e.g., i.v., p.o, …),and administration length could reflect the underlying pharmaco-dynamics better and improve the prognostic performance.Our RNN is currently cohort specific for cardiothoracic surgery
patients that most likely have different characteristics and riskfactors than, e.g., neurosurgical patients. Implementing the sameapproach on other patient cohorts could give a deeper insightinto the generalizability of our method.Our study is retrospective. Thus, in our RNN vs. physicians head-
to-head comparison, physicians only received EHR data and couldnot clinically evaluate patients. Information such as volume status(except for weight), general condition, etc. or additional examina-tions (e.g., ultrasound) were not available to them and to the RNN.This deviation from the physicians’ usual workflow in clinicalpractice may explain some of the observed performance deficits.Real clinical data can be very noisy, leading to reducedperformance and greater burden of deploying completelyautomated systems. This stresses once again the fact that artificialintelligence should be utilised in support systems for physiciansand not as their replacement.External validation trials should be performed on prospective
data. In addition, they should focus on usage and acceptance of asystem such as the one described here in a real clinical setting.
METHODSEthics and reporting guidelineThis study was approved by the institutional data protection officer andethics committee of Charité – Universitätsmedizin Berlin (EA2/180/17). Theapproval included the collection of data on implied consent. We only usedretrospective data and the patients were not actively involved in the study.The requirement of informed consent of the participating physicians waswaived by the Institutional Review Board (IRB) of Charité – Universitäts-medizin Berlin due to anonymized data acquisition. Reporting ofdevelopment and validation of the prediction model follows widely theguideline of the TRIPOD statement41.
Patient selection processWe retrospectively analysed EHR time series data generated betweenOctober 2012 and February 2018 at a tertiary care center for cardiovasculardiseases.We included adult patients (18+) that were admitted at least once to the
operating theatre for cardiothoracic surgery (15,564 admissions/13,895patients). We excluded patients without any creatinine or urine flow values,patients receiving hemodialysis before the end of the operation or havinga baseline creatinine level ≥4.0 mg/dl (2322 admissions/1487 patients).Within this collection of 12,978 admissions, 1308 cases were identified
with severe postoperative AKI defined as stage 2 or 3 according to KDIGOAKI guidelines—briefly, an increase in serum creatinine to at least twice thebaseline value or a decrease in urine flow < 0.5ml/kg/h for ≥12 h.As AKI can develop over multiple days, we defined a study period of
7 days after cardiothoracic surgery. The global AKI label of a patient wasset positive when the KDIGO criteria stage 2 or 3 was fulfilled at any pointwithin these 7 postoperative days.The observation time of each patient started when the patient was
transferred to the ICU or recovery room. It ended when the patient was
either discharged, or when the KDIGO criteria for AKI stage 2 or 3 werefulfilled, or after 7 days after the end of the first surgery.Each AKI-case was assigned a control out of the non-AKI pool (11,670
admissions/11,046 patients). The controls were matched to the cases on
Fig. 3 Flow chart of patient selection process. adm admissions, patpatients.
N. Rank et al.
7
Seoul National University Bundang Hospital npj Digital Medicine (2020) 139

observation length. Thus, we generated a balanced data set that we thenrandomly split into a training set (85%, 2224 admissions/2180 patients)and the remaining set (15%, 392 admissions/patients) while keeping thecases with their respective controls.For the 392 patients of the remaining set we manually checked
physicians’ notes in the EHR data and consequently excluded 28 patients.Exclusion criteria were primarily insufficient documentation of the type ofsurgery, false recording of surgery times or notion of end-stage kidneydisease in the patients’ history that was not detected by automatedfiltering.Out of this set, we randomly selected 350 patients that formed the final
test set for model evaluation and comparison with human-levelperformance. A detailed flow chart of the patient selection process isshown in Fig. 3.The baseline characteristics were well balanced between the training
and the test and are summarized in Supplementary Table 8.The density distribution and a histogram of the observation periods for
patients in the training and test sets is shown in Fig. 4. Most patients wereeither discharged or diagnosed with AKI within the first 3 days after thefirst surgery.
Feature selection and preprocessingWe developed our model based on 96 routinely collected clinicalparameters. Table 5 gives an overview of all considered features. Theycan be grouped into static features (e.g., most patient and surgerycharacteristics, 25 features) that do not change over the observationperiod and frequently measured dynamic features (e.g., lab values, vitalsigns, blood gas values and fluid output, 49 features). In addition, weincluded a variety of widely administered agents that have been reportedto potentially cause nephrotoxic effects42–47 (22 features).The last creatinine/urea value before surgery was used as a baseline. If
there was none available in the five days before surgery, we used the firstpostoperative value.We observed that urine output was sometimes incompletely documen-
ted on normal wards. As this could lead to false-positive AKI diagnoses weconsidered urine values reliable only when they were recorded in theoperation theatre, the recovery room or the ICU. Thus, on normal wardsAKI was only defined by the creatinine criterion whereas in the recoveryroom or the ICU both AKI criteria (creatinine and urine) were used.EHR systems are often designed with billing and revision purposes in
mind, making certain retrospective therapeutic analyses difficult toconduct due to missing information48. In our case, the type of operationthat patients underwent was available partly in unstructured textual andpartly in categorical form. To access both types of data, we developed aseparate set of bag-of-words logistic regression models that predicted thetype of operation based on unstructured text describing the operationprocedures. As explanatory variables we used all single words orabbreviations that occurred in the pool of text information in its trainingset. The probability of a specific surgery type Yi (i= 1, 2, …, 17) wasgiven by
PðYi ¼ 1Þ ¼ expðβ0 þ β1x1 þ β2x2 þ :::Þ1þ expðβ0 þ β1x1 þ β2x2 þ :::Þ (1)
where xj, denotes a count variable indicating how often word/abbreviationj occurred in a patient’s surgery procedure description (j= 1, 2, …, no.
distinct words/abbreviations). For further information see SupplementaryNote 1, Supplementary Tables 9 and 10.Time sequences with 15-min intervals of all features served as input to
our model.Except for the nephrotoxic agents, missing values were filled by forward
imputation. If no precedent value was available, static default valuesdefined by a clinical expert were imputed (one value per feature). Thesame default values were used for all patients and they were imputedprogrammatically. They are shown in Supplementary Table 11.It is extremely difficult to determine the exact effect duration of a drug
due to varying excipients, dosages, drug combinations, application typesand patient conditions. Therefore, the administration of a drug wasconsidered as an event. For each nephrotoxic agent class in Table 5 abinary feature was created and its value was set to 1 only at the single timeslice immediately following the administration of the drug.Except for the operation types all continuous features were then scaled
as follows49:
Xscaled ¼ X � μðXtrainÞIQRðXtrainÞ (2)
where μ(Xtrain) denotes the median and IQR(Xtrain) the IQR of the feature Xin the training set. In total, the model was built on a data matrix of36,244,608 single data points.For patient selection, preprocessing of features and imputation of
missing data, we used R v3.3.3 (R Core Team (2017). R: A language andenvironment for statistical computing. R Foundation for StatisticalComputing, Vienna, Austria. URL https://www.R-project.org/) and Pythonv3.6.7 (The Python Software Foundation, Beaverton, OR) with modulesIPython50 (v7.5.0), Matplotlib51 (v3.1.0), Scikit-learn52 (v0.19.1), Pandas53
(v0.24.2) and Numpy54 (v1.16.2).
ModelingIn contrast to classical prediction models such as logistic regression, RNNsare able to capture the temporal development of features in a trulysequential fashion as they incorporate information about preceding timesteps, links between single timesteps and a direct indicator of the currentposition in the timeline (see Fig. 5).We constructed a set of RNNs with different architectures (preceding
convolutional layer, different cell types) which allow to process dynamictemporal information.Hyperparameter tuning was performed on the training set using fivefold
cross-validation with balanced class proportions in each fold. We used theAdam optimizer55 with a fixed learning rate of 0.001. The hyperparameterconfigurations leading to the highest overall AUC on cross-validation foldsof the training set were chosen as final models.As the parameters of an RNN depend on their initialization and the order
in which the training instances are presented, 10 final models with thesame hyperparameters but different initializations were trained on thetraining set. Our final model comprised a uniform ensemble of the 10constituent models.For the modeling process we used Python v3.6.7 (The Python Software
Foundation, Beaverton, OR) with modules Tensorflow56, IPython50 (v7.5.0),Matplotlib51 (v3.1.0), Scikit-learn52 (v0.19.1), Pandas53 (v0.24.2) andNumpy54 (v1.16.2).
Fig. 4 Total observation period for the training and test set. a Density distribution. b Histogram. For most patients the observation periodended within three days after surgery.
N. Rank et al.
8
npj Digital Medicine (2020) 139 Seoul National University Bundang Hospital

Measuring RNN performanceWe measured the performance of the RNN on an independent test set. Noinstance of this test set was used for training of the final model. Wecalculated AUC, precision-recall-AUC (PR_AUC), accuracy, sensitivity,specificity, PPV, negative predictive value (NPV), false-positive rate (FPR)and the F1-score to measure prediction correctness.In addition, we calculated the mean of the Brier score57—or mean
squared error—of each patient (MSEpat)—a measure of accuracy ofpredictions, without the need for a set threshold.A single patient’s Brier score—or mean squared error—is calculated as
follows:
MSEpat ¼ 1=tsjXtsj
i¼0
ðyji � yjtÞ2 (3)
where tsj is the number of timesteps, yji the prediction at time step i and yjtthe true label of patient j.The MSEpat ranges from 0 to 1, with value 0 meaning perfect prediction
and 1 meaning worst prediction. Random guessing (always predicting50%) would result in a MSEpat of 0.25. In contrast to the metrics mentionedabove, the MSEpat is independent of the individual observation length of apatient and the resulting number of predictions per patient.We adjusted the threshold for positive class prediction until a fixed
sensitivity of 0.85 on cross-validation folds in the training set was reached(threshold= 0.41).Our model predicted the risk of developing AKI every 15min after the
initial surgery. The predictions of an individual patient can be regarded as acluster of usually highly correlated data. We therefore had to adjust the CIsof our model’s metrics. We calculated the 95% CI of each metric X asfollows:
X þ�1:96σðXÞwith a standard error σðXÞ of variable X of
σðXÞ ¼ffiffiffiffiffiffiffiffiffiffiffiffiffiffiffiffiffiffiXð1� XÞ
neff
s(4)
To account for intracluster correlation, our sample size n was adjusted,resulting in an effective sample size of58,59
neff ¼ nDE
¼Pk
i¼1
Pmij¼1 1
DE(5)
where k is the number of patients and mi the number of time steps ofpatient i. DE denotes the design effect, also called variance inflation factor,and can be calculated as follows60:
DE ¼ mkPk
i¼1mi
1þðmi�1ÞICC(6)
with ICC as the intracluster correlation coefficient. The ICC was calculatedusing the R package ICC61 (v2.3.0).
Comparing RNN vs. human performanceWe set up an experiment to compare the performance of our RNN againstthat of experienced physicians (see Fig. 1). For each patient in the test set,a quasi-random point in time in their observation period was chosen,further denoted as the ‘prediction point’. In contrast to real uniformrandom samples, which tend to form clusters and contain regions withoutany points at all, quasi-random sequences reduce the probability of clusterformation while still being uniformly distributed62,63. This methodprevented us from accidentally exclusively sampling prediction pointsfrom e.g. the first half of the patients’ observation periods.
Table 5. Input feature overview.
Feature Group (no. features) Features
Patient characteristics (4) Age, sex, weight, height
Laboratory results (25) Phosphate, total bilirubin, baseline creatinine, creatinine, baseline urea, urea, glomerular filtration rate, creatinekinase (CK), CK-MB, red blood count, white blood count, platelets, C-reactive protein, gamma-glutamyltransferase, glutamic oxaloacetic transaminase, hemoglobin, international normalized ratio, lactatedehydrogenase, magnesium, hematocrit, prothrombin time, partial thromboplastin time, mean corpuscularhemoglobin, mean corpuscular volume, mean corpuscular hemoglobin concentration
Surgery characteristics (20) Aortic cross-clamp time, cardiopulmonary bypass time, time in operation theatre, surgery procedure (fromlogistic regression text model, see Supplementary Note 1)
Vital signs (8) Systolic, mean and diastolic arterial pressure, central venous pressure, heart frequency, pulse, bodytemperature, oxygen saturation
Arterial blood gas values (BGA) (15) Base excess, bicarbonate, glucose, hemoglobin, oxygen saturation, partial pressure of carbon dioxide andoxygen, total carbon dioxide, pH level, potassium, sodium, calcium, lactate, carboxyhemoglobin,oxyhemoglobin
Fluid output (2) Bleeding Rate, urine flow rate
Nephrotoxic agents (22) Allopurinol, Aminoglycosides, Amphotericin B, Antiplatelet agents (clopidogrel, ticlopidine), Benzodiazepines,Cephalosporins, Cyclosporine, Haloperidol, Ketamine, Nonsteroidal anti-inflammatory drugs, Paracetamol,Penicillines, Proton pump inhibitors, Pyrazolone derivatives, Quinolones, Ranitidine, Rifampin, Sulfonamides,Tacrolimus, (Val-)/Ganciclovir, Aciclovir, VancomycinRed Blood Cell Transfusions
Fig. 5 Architecture of a recurrent neural network (RNN). At eachtime step, the model receives the current time slice data as input aswell as the own output from the preceding time step. The featuresare captured in a truly sequential fashion.
N. Rank et al.
9
Seoul National University Bundang Hospital npj Digital Medicine (2020) 139
At each prediction point, a physician and the RNN had to predictwhether a patient would develop AKI within the first 7 days after surgery.All time series information up to the ‘prediction point’ was graphically
displayed for the physicians to mimic the electronic patient chart—although here not in 15-min intervals but in the originally recorded timeresolution (up to 1min).To create a realistic setting, physicians not only received information
about nephrotoxic agents, but of all administered drugs. In addition, thesurgery type was given to them as unstructured text manually extractedfrom physicians’ notes. This information was not available to the RNNmodel. Physicians were explicitly informed about the incidence rate of 50%AKI in our test set.A physician as well as the RNN made a probability prediction r of the
development of AKI for each patient at the respective prediction point. Inaddition, the physicians made a binary decision (development of AKI: yes/no).We asked 14 physicians to participate in our study, 10 of whom agreed
(response rate= 0.71). All had to meet the selection criteria of ≥5 years ofclinical experience and ≥1 year of work experience on a cardiothoracic ICU.From the 10 volunteers we selected seven physicians with different levelsof expertise (senior resident up to senior consultant) to create a mostrealistic setting. Their working experience on a cardiothoracic ICU rangedfrom at least one year up to several years. None of the participatingphysicians were specialists in nephrology as nephrologists are usually notconstantly available on an ICU. Each physician made predictions for 50different patients.
Statistical analysisThe initial aim of our study was to show that the RNN is not inferior toexperienced physicians in the prediction of AKI. For both, RNN andphysicians, the predictive quality of each probability prediction r wasmeasured by a score S as follows:
S ¼ r; if the patient developedAKI
S ¼ 1� r; if the patient did not developAKI
A prior investigation of the RNN’s predictions had shown that S was non-normally distributed. Thus, for sample size calculation and power analysiswe considered the transformed score X, which was approximately normallydistributed:
X ¼ �logð�logðSÞÞ (7)
We assumed that X of the physicians’ predictions would also be normallydistributed.Based on a significance level of α= 0.025, a power of at least 80% and a
non-inferiority margin of δ= 0.3 (this corresponds to a non-inferioritymargin of 5.5% for sensitivity+ specificity), we obtained a sample size of N= 350.Both, for RNN and physicians, we calculated AUC, PR_AUC, brier score,
accuracy, sensitivity, specificity, PPV, NPV, FPR and F1-score. We set thethreshold for positive class prediction to 0.5 as this was also the thresholdin the physicians’ predictions that corresponded to the ‘yes/no’-classifica-tion. We calculated CIs for all metrics as described in Section ‘MeasuringRNN Performance’ whereas the effective sample size was neff= n= 350 asthere was no clustering.For the statistical comparison of S between RNN and physicians we
applied a paired t-test. We used DeLong’s64 method to compare the twocorrelated ROC curves using the R package pROC65 (v1.9.1). In addition, weinvestigated the calibration of both, physicians’ and RNN’s predictions,with the Hosmer-Lemeshow-Test using the R package ResourceSelection66
(v0.3-2). All three comparisons mentioned above were tested on asignificance level of α= 0.05.
Reporting summaryFurther information on research design is available in the Nature ResearchReporting Summary linked to this article.
DATA AVAILABILITYThe EHR data used in this study contain protected health information (PHI) andcannot be published for reasons of data protection. The dataset may be availablefrom the German Heart Center Berlin subject to ethical approvals.
CODE AVAILABILITYThe source code of this publication may be obtained from the corresponding authorupon request. To enable independent replication, we describe the experiments andimplementation in detail in the ‘Methods’ section and in the SupplementaryInformation.
Received: 10 February 2020; Accepted: 17 September 2020;
REFERENCES1. Chertow, G. M., Levy, E. M., Hammermeister, K. E., Grover, F. & Daley, J. Inde-
pendent association between acute renal failure and mortality following cardiacsurgery 12. Am. J. Med. 104, 343–348 (1998).
2. Hobson, C. E. et al. Acute kidney injury is associated with increased long-termmortality after cardiothoracic surgery. Circulation 119, 2444–2453 (2009).
3. Mandelbaum, T. et al. Outcome of critically ill patients with acute kidney injuryusing the Acute Kidney Injury Network criteria. Crit. Care Med. 39, 2659–2664(2011).
4. Ympa, Y. P., Sakr, Y., Reinhart, K. & Vincent, J.-L. Has mortality from acute renalfailure decreased? A systematic review of the literature. Am. J. Med. 118, 827–832(2005).
5. Hobson, C. et al. Cost and mortality associated with postoperative acute kidneyinjury. Ann. Surg. 261, 1207–1214 (2015).
6. Silver, S. A., Long, J., Zheng, Y. & Chertow, G. M. Cost of acute kidney injury inhospitalized patients. J. Hosp. Med. 12, 70–76 (2017).
7. Silver, S. A. & Chertow, G. M. The economic consequences of acute kidney injury.Nephron 137, 297–301 (2017).
8. Khwaja, A. KDIGO clinical practice guidelines for acute kidney injury. Nephron Clin.Pract. 120, c179–c184 (2012).
9. Spanuchart, I., Cheungpasitporn, W., Thongprayoon, C., Ratanapo, S. & Srivali, N.Off-pump versus on-pump coronary artery bypass surgery: an updated meta-analysis of randomized controlled trials on acute kidney injury and mortalityoutcomes. J. Am. Coll. Cardiol. 65, A211 (2015).
10. Seabra, V. F., Alobaidi, S., Balk, E. M., Poon, A. H. & Jaber, B. L. Off-pump coronaryartery bypass surgery and acute kidney injury: a meta-analysis of randomizedcontrolled trials. Clin. J. Am. Soc. Nephrol. 5, 1734–1744 (2010).
11. Mao, H. et al. Cardiac surgery-associated acute kidney injury. Blood Purif. 37(Suppl2), 34–50 (2014).
12. Wang, Y. & Bellomo, R. Cardiac surgery-associated acute kidney injury: risk factors,pathophysiology and treatment. Nat. Rev. Nephrol. 13, 697–711 (2017).
13. Faubel, S. & Shah, P. B. Immediate consequences of acute kidney injury: theimpact of traditional and nontraditional complications on mortality in acutekidney injury. Adv. Chronic Kidney Dis. 23, 179–185 (2016).
14. Hsia, C. C. W., Ravikumar, P. & Ye, J. Acute lung injury complicating acute kidneyinjury: a model of endogenous αKlotho deficiency and distant organ dysfunction.Bone 100, 100–109 (2017).
15. Mehta, R. L. et al. Sepsis as a cause and consequence of acute kidney injury:Program to Improve Care in Acute Renal Disease. Intensive Care Med. 37, 241–248(2011).
16. Coca, S. G., Singanamala, S. & Parikh, C. R. Chronic kidney disease after acutekidney injury: a systematic review and meta-analysis. Kidney Int. 81, 442–448(2012).
17. Balasubramanian, G. et al. Early nephrologist involvement in hospital-acquiredacute kidney injury: a pilot study. Am. J. Kidney Dis. 57, 228–234 (2011).
18. Costa e Silva, V. T. et al. Nephrology referral and outcomes in critically ill acutekidney injury patients. PLoS ONE 8, e70482 (2013).
19. Meersch, M. et al. Prevention of cardiac surgery-associated AKI by implementingthe KDIGO guidelines in high risk patients identified by biomarkers: the PrevAKIrandomized controlled trial. Intensive Care Med. 43, 1551–1561 (2017).
20. Huen, S. C. & Parikh, C. R. Predicting acute kidney injury after cardiac surgery: asystematic review. Ann. Thorac. Surg. 93, 337–347 (2012).
21. Chertow, G. M. et al. Preoperative renal risk stratification. Circulation 95, 878–884(1997).
22. Thakar, C. V., Arrigain, S., Worley, S., Yared, J.-P. & Paganini, E. P. A clinical score topredict acute renal failure after cardiac surgery. J. Am. Soc. Nephrol. 16, 162–168(2005).
23. Mehta, R. H. et al. Bedside tool for predicting the risk of postoperative dialysis inpatients undergoing cardiac surgery. Circulation 114, 2208–2216 (2006). quiz2208.
24. Palomba, H., de Castro, I., Neto, A. L. C., Lage, S. & Yu, L. Acute kidney injuryprediction following elective cardiac surgery: AKICS Score. Kidney Int. 72, 624–631(2007).
N. Rank et al.
10
npj Digital Medicine (2020) 139 Seoul National University Bundang Hospital

25. Aronson, S. et al. Risk index for perioperative renal dysfunction/failure: criticaldependence on pulse pressure hypertension. Circulation 115, 733–742 (2007).
26. Wijeysundera, D. N. et al. Derivation and validation of a simplified predictive indexfor renal replacement therapy after cardiac surgery. JAMA 297, 1801–1809 (2007).
27. Halford, G. S., Baker, R., McCredden, J. E. & Bain, J. D. How many variables canhumans process? Psychol. Sci. 16, 70–76 (2005).
28. Thottakkara, P. et al. Application of machine learning techniques to high-dimensional clinical data to forecast postoperative complications. PLoS ONE 11,e0155705 (2016).
29. Bihorac, A. et al. MySurgeryRisk: development and validation of a machine-learning risk algorithm for major complications and death after surgery. Ann.Surg. 269, 652–662 (2019).
30. Koyner, J. L., Adhikari, R. & Edelson, D. P. Development of a multicenterward–based AKI prediction model. Clin. J. Am. Soc. Nephrol. 11, 1935–1943 (2016).
31. Koyner, J. L., Carey, K. A., Edelson, D. P. & Churpek, M. M. The development of amachine learning inpatient acute kidney injury prediction model. Crit. Care Med.46, 1070–1077 (2018).
32. Cheng, P., Waitman, L. R., Hu, Y. & Liu, M. Predicting inpatient acute kidney injuryover different time horizons: how early and accurate? AMIA Annu. Symp. Proc.2017, 565–574 (2017).
33. Mohamadlou, H. et al. Prediction of acute kidney injury with a machine learningalgorithm using electronic health record data. Can. J. Kidney Health Dis. 5, 1–9 (2018).
34. Tomašev, N. et al. A clinically applicable approach to continuous prediction offuture acute kidney injury. Nature 572, 116–119 (2019).
35. Meyer, A. et al. Machine learning for real-time prediction of complications incritical care: a retrospective study. Lancet Respir. Med. 6, 905–914 (2018).
36. Hosmer, D. W., Jr., Lemeshow, S. & Sturdivant, R. X. Applied Logistic Regression(John Wiley & Sons, 2013).
37. Praught, M. L. & Shlipak, M. G. Are small changes in serum creatinine animportant risk factor? Curr. Opin. Nephrol. Hypertens. 14, 265–270 (2005).
38. Brown, J. R. et al. Multivariable prediction of renal insufficiency developing aftercardiac surgery. Circulation 116, I139–I143 (2007).
39. Koyner, J. L., Adhikari, R., Edelson, D. P. & Churpek, M. M. Development of amulticenter ward-based AKI prediction model. Clin. J. Am. Soc. Nephrol. 11,1935–1943 (2016).
40. Mohamadlou, H. et al. Prediction of acute kidney injury with a machine learningalgorithm using electronic health record data. Can. J. Kidney Health Dis. 5, 1–9(2018).
41. Collins, G. S., Reitsma, J. B., Altman, D. G. & Moons, K. G. M. Transparent Reportingof a multivariable prediction model for Individual Prognosis or Diagnosis (TRI-POD): the TRIPOD statement. Ann. Intern. Med. 162, 55–63 (2015).
42. Naughton, C. A. Drug-induced nephrotoxicity. Am. Fam. Physician 78, 743–750(2008).
43. Mazer, M. & Perrone, J. Acetaminophen-induced nephrotoxicity: pathophysiol-ogy, clinical manifestations, and management. J. Med. Toxicol. 4, 2–6 (2008).
44. Kitano, A., Motohashi, H., Takayama, A., Inui, K.-I. & Yano, Y. Valacyclovir-InducedAcute Kidney Injury in Japanese Patients Based on the PMDA Adverse DrugReactions Reporting Database. Drug Inf. J. 49, 81–85 (2014).
45. Redondo-Pachon, M. D. et al. Acute renal failure and severe thrombocytopeniaassociated with metamizole. Saudi J. Kidney Dis. Transpl. 25, 121–125 (2014).
46. Koch, C. G. et al. Duration of red-cell storage and complications after cardiacsurgery. N. Engl. J. Med. 358, 1229–1239 (2008).
47. Nuis, R.-J. et al. Blood transfusion and the risk of acute kidney injury aftertranscatheter aortic valve implantation. Circ. Cardiovasc. Interv. 5, 680–688 (2012).
48. Johnson, A. E. W. et al. Machine Learning and Decision Support in Critical Care.Proc. IEEE Inst. Electr. Electron. Eng. 104, 444–466 (2016).
49. LeCun, Y. A., Bottou, L., Orr, G. B. & Müller, K.-R. in Neural Networks: Tricks of theTrade: Second Edition (eds. Montavon, G., Orr, G. B. & Müller, K.-R.) 9–48 (SpringerBerlin Heidelberg, 2012).
50. Perez, F. & Granger, B. E. IPython: a system for interactive scientific computing.Comput. Sci. Eng. 9, 21–29 (2007).
51. Hunter, J. D. Matplotlib: a 2D graphics environment. Comput. Sci. Eng. 9, 90–95(2007).
52. Pedregosa, F. et al. Scikit-learn: machine learning in Python. J. Mach. Learn. Res.12, 2825–2830 (2011).
53. McKinney, W., Others. Data structures for statistical computing in python. Proc.9th Python Sci. Conf. 445, 51–56 (2010). Austin, TX.
54. van der Walt, S., Colbert, S. C. & Varoquaux, G. The NumPy Array: A Structure forEfficient Numerical Computation. Comput. Sci. Eng. 13, 22–30 (2011).
55. Kingma, D. P. & Ba, J. Adam: a method for stochastic optimization. Preprint athttp://arxiv.org/abs/1412.6980 (2014)
56. Abadi, M. et al. TensorFlow: large-scale machine learning on heterogeneousdistributed systems, 2015. Software available from https://www.tensorflow.org/about/bib.
57. BRIER & W, G. Verification of Forecasts Expressed in terms of probability. MontheyWeather Rev. 78, 1–3 (1950).
58. Kalton, G., Michael Brick, J. & Lê, T. Chapter VI Estimating components of designeffects for use in sample design. http://citeseerx.ist.psu.edu/viewdoc/summary?doi:10.1.1.522.3221.
59. Gonzalez, E. J. & Foy, P. Third International Mathematics and Science Study,Technical Report: Estimation of sampling variability, design effects, and effectivesample sizes. p. 87 (II, Boston College Chestnut Hill, Massachusetts, USA, 1997).
60. Kerry, S. M. & Bland, J. M. Unequal cluster sizes for trials in English and Welshgeneral practice: implications for sample size calculations. Stat. Med. 20, 377–390(2001).
61. Wolak, M. E., Fairbairn, D. J. & Paulsen, Y. R. Guidelines for estimating repeat-ability. Methods Ecol. Evol. 3, 129–137 (2012).
62. Press, W. H., Teukolsky, S. A., Vetterling, W. T. & Flannery, B. P. In Numerical Recipesin FORTRAN: The Art of Scientific Computing 2, 299–306 (Cambridge UniversityPress, 1992).
63. Weyl, H. Über die Gleichverteilung von Zahlen mod. Eins. Math. Ann. 77, 313–352(1916).
64. DeLong, E. R., DeLong, D. M. & Clarke-Pearson, D. L. Comparing the areas undertwo or more correlated receiver operating characteristic curves: a nonparametricapproach. Biometrics 44, 837–845 (1988).
65. Robin, X. et al. pROC: an open-source package for R and S+ to analyze andcompare ROC curves. BMC Bioinforma. 12, 77 (2011).
66. Lele, S. R., Keim, J. L. & Solymos, P. ResourceSelection: resource selection (prob-ability) functions for use-availability data. R package version 3–2 (2017). Softwareavailable at https://cran.r-project.org/src/contrib/Archive/ResourceSelection/.
67. Jiang, W. et al. Dynamic predictive scores for cardiac surgery–associated acutekidney injury. J. Am. Heart Assoc. 5, e003754 (2016).
ACKNOWLEDGEMENTSThis work was supported by the German Ministry for Education and Research asBIFOLD - Berlin Institute for the Foundations of Learning and Data (ref. 01IS18025Aand ref. 01IS18037A). A.M. is a participant in the BIH Charité Clinician ScientistProgram funded by the Charité – Universitätsmedizin Berlin and the Berlin Institute ofHealth. C.E. is funded by the Swiss National Science Foundation (SNSF) AmbizioneProgram under grant agreement no. 174025.
AUTHOR CONTRIBUTIONSN.R. and A.M. conceived the study and drafted the manuscript. N.R., A.M., and C.E.designed the methods. N.R. and A.M. obtained the data and contributed to studydesign. J.K., T.K., C.S., F.S., and V.F. contributed to study design. N.R. and B.P.performed the analyses under the supervision of C.E. and A.M. All authorscontributed in result interpretation and critically revised the manuscript.
FUNDINGOpen Access funding enabled and organized by Projekt DEAL.
COMPETING INTERESTSA.M. declares the receipt of consulting and lecturing fees from Medtronic GmbH andEdwards Lifesciences Services GmbH, and consulting fees from Pfizer. C.E. declaresownership of shares in codiag AG. F.S. declares the receipt of honoraria, consultancyfees or travel support from Medtronic GmbH, Biotronik SE & Co., Abbott GmbH & Co.KG, Sanofi S.A., Cardiorentis AG, Novartis Pharma GmbH. J.K. declares the receipt oflecturing fees from, Boston Scientific, LSI Solutions, Edwards, Medtronic, Abbott,Ascyrus Medical GmbH. V.F. declares (institutional) financial activities with Medtronic,Biotronik, Abbott, Boston, Edwards, Berlin Heart, Novartis, Jotec, Zurich Heart inrelation to Educational Grants, honoraria, consultancy, research & study funds, feesfor travel support. All other authors declare no competing interests.
ADDITIONAL INFORMATIONSupplementary information is available for this paper at https://doi.org/10.1038/s41746-020-00346-8.
Correspondence and requests for materials should be addressed to A.M.
Reprints and permission information is available at http://www.nature.com/reprints
N. Rank et al.
11
Seoul National University Bundang Hospital npj Digital Medicine (2020) 139
Publisher’s note Springer Nature remains neutral with regard to jurisdictional claimsin published maps and institutional affiliations.
Open Access This article is licensed under a Creative CommonsAttribution 4.0 International License, which permits use, sharing,
adaptation, distribution and reproduction in anymedium or format, as long as you giveappropriate credit to the original author(s) and the source, provide a link to the Creative
Commons license, and indicate if changes were made. The images or other third partymaterial in this article are included in the article’s Creative Commons license, unlessindicated otherwise in a credit line to the material. If material is not included in thearticle’s Creative Commons license and your intended use is not permitted by statutoryregulation or exceeds the permitted use, you will need to obtain permission directlyfrom the copyright holder. To view a copy of this license, visit http://creativecommons.org/licenses/by/4.0/.
© The Author(s) 2020
N. Rank et al.
12
npj Digital Medicine (2020) 139 Seoul National University Bundang Hospital