Embed Size (px)
Citation preview
Deep-dwelling foraminifera as thermocline temperaturerecorders
Caroline Cleroux, Elsa Cortijo, and Jean-Claude DuplessyLaboratoire des Sciences du Climat et de l’Environnement, IPSL, Laboratoire Mixte, CEA-CNRS-UVSQ, Parc duCNRS, F-91198 Gif sur Yvette Cedex, France ([email protected])
Rainer ZahnInstitucio Catalana de Recerca i Estudis Avancats, ICREA i Universitat Autonoma de Barcelona, Institut de Ciencia iTecnologia Ambientals, Edifici Cn, Campus UAB, E-08193 Bellaterra (Cerdanyola), Spain
[1] We measured the oxygen isotopic composition of the deep-dwelling foraminiferal species G. inflata,G. truncatulinoides dextral and sinistral, and P. obliquiloculata in 29 modern core tops raised from theNorth Atlantic Ocean. We compared calculated isotopic temperatures with atlas temperatures and definedecological models for each species. G. inflata and G. truncatulinoides live preferentially at the base of theseasonal thermocline. Under temperature stress, i.e., when the base of the seasonal thermocline is warmerthan 16�C, G. inflata and G. truncatulinoides live deeper in the main thermocline. P. obliquiloculatainhabits the seasonal thermocline in warm regions. We tested our model using 10 cores along theMauritanian upwelling and show that the comparison of d18O variations registered by the surficial speciesG. ruber and G. bulloides and the deep-dwelling species G. inflata evidences significant glacial-interglacial shifts of the Mauritanian upwelling cells.
Components: 10,829 words, 12 figures, 3 tables.
Keywords: deep-dwelling foraminifera; depth habitat; isotopic temperature; thermocline; North Atlantic; Mauritanian
upwelling.
Index Terms: 4813 Oceanography: Biological and Chemical: Ecological prediction; 4870 Oceanography: Biological and
Chemical: Stable isotopes (0454, 1041); 4944 Paleoceanography: Micropaleontology (0459, 3030).
Received 8 September 2006; Revised 23 January 2007; Accepted 31 January 2007; Published 25 April 2007.
Cleroux, C., E. Cortijo, J.-C. Duplessy, and R. Zahn (2007), Deep-dwelling foraminifera as thermocline temperature
recorders, Geochem. Geophys. Geosyst., 8, Q04N11, doi:10.1029/2006GC001474.
————————————
Theme: Past Ocean CirculationGuest Editors: C. Kissel, L. Labeyrie, J. Lynch-Stieglitz, and O. Marchal
1. Introduction
[2] Quaternary climatic variations resulted in largeocean circulation changes associated with the
atmospheric and sea surface temperature varia-tions. Deep and intermediate water temperaturechanges can be reconstructed by isotopic or traceelement analyses in benthic foraminifera [Martin et
G3G3GeochemistryGeophysics
Geosystems
Published by AGU and the Geochemical Society
AN ELECTRONIC JOURNAL OF THE EARTH SCIENCES
GeochemistryGeophysics
Geosystems
Article
Volume 8, Number 4
25 April 2007
Q04N11, doi:10.1029/2006GC001474
ISSN: 1525-2027
Copyright 2007 by the American Geophysical Union 1 of 19
al., 2002; Streeter and Shackleton, 1979] or deepcorals [Schrag and Linsley, 2002]. Assemblageanalyses of fossil marine plankton communities,such as coccolithophores, surface dwelling forami-nifera or diatoms are commonly used to infer pastsea surface temperature [Giraudeau et al., 2000;Koc Karpuz and Schrader, 1990; Prell, 1985].However, little information is available on temper-ature variations in the upper 500 m of the watercolumn, where most of the energy storage and heattransport occur [Liu and Philander, 2001].
[3] Deep-dwelling planktonic foraminifers inhabitthe top few hundred meters of the ocean [Be, 1977]and constitute potential recorders of thermoclineconditions [Fairbanks et al., 1980]. Mulitza et al.[1997] used the oxygen isotopic composition(d18O) of G. truncatulinoides to monitor pastseawater temperature variations at 250 m depthand suggested that the thermal stratification ofthe western equatorial Atlantic was weaker duringthe Last Glacial Maximum (LGM) than during theHolocene.
[4] However, reconstructing mixed layer and ther-mocline structure requires insight into ecologicalniches of deep-dwelling planktonic foraminifersincluding their growth seasons and calcificationdepths. In this paper, we use multispecies d18Oanalyses to better constrain these parameters and to
gain a fuller understanding of deep-dwelling fora-miniferal habitats.
[5] We selected three species that are common indeep sea sediments: the transitional water speciesGloborotalia inflata, the warm and high salinitywater species Pulleniatina obliquiloculata and thedeep species Globorotalia truncatulinoides rightand left coiling [Be, 1977]. d18O values of thesespecies sampled in modern core tops are used tocalculate isotopic temperature (Tiso). These valuesconstrain their calcification depths and seasonal-ities, when compared to modern hydrological data.We apply this concept to down-core isotope pro-files from a suite of sediment cores from theMauritanian margin to assess upwelling intensityduring the LGM.
2. Samples and Methods
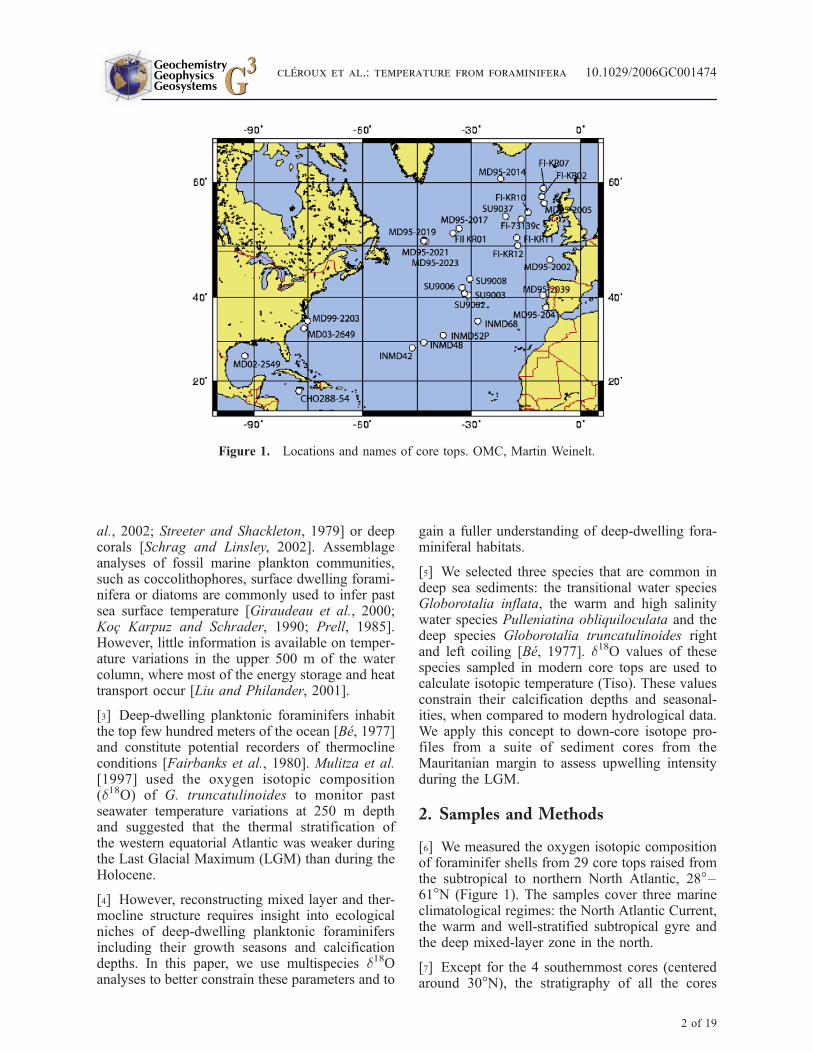
[6] We measured the oxygen isotopic compositionof foraminifer shells from 29 core tops raised fromthe subtropical to northern North Atlantic, 28�–61�N (Figure 1). The samples cover three marineclimatological regimes: the North Atlantic Current,the warm and well-stratified subtropical gyre andthe deep mixed-layer zone in the north.
[7] Except for the 4 southernmost cores (centeredaround 30�N), the stratigraphy of all the cores
Figure 1. Locations and names of core tops. OMC, Martin Weinelt.
GeochemistryGeophysicsGeosystems G3G3
clEroux et al.: temperature from foraminifera 10.1029/2006GC001474
2 of 19
indicates that the upper part correspond to anexpanded Holocene section. This minimizes theinfluence of upward bioturbational mixing of olderforaminiferal shells (from early Holocene or degla-ciation). However, for all the cores, we use the LateHolocene stratigraphic quality levels as defined inMARGO [Kucera et al., 2005] to ensure an UpperHolocene age of the samples and checked that theisotopic composition of the surface-dwelling spe-cies G. ruber and G. bulloides are consistent withmodern seawater temperature and salinity (Table 1).
[8] Foraminifera were picked in different sizesfractions. G. ruber and G. bulloides were chosenin the 250–315 mm fraction. About 4 shells weretaken for each d18O analysis. Deep-dwelling spe-
cies were picked in the 355–400 mm fraction.G. inflata specimens were also taken in the 250–315 mm size fraction to check for a possible sizeeffect. 2 or 3 tests were used for analyses. 2 to 10isotopic measurements on the same sample wereperformed to estimate the d18O variability withinsingle sediment samples (Table S11).
[9] Prior to analysis, shells were ultrasonicallycleaned in methanol to remove clays and otherimpurities and then roasted at 380�C during 30 minunder vacuum to burn organic matter. Samples
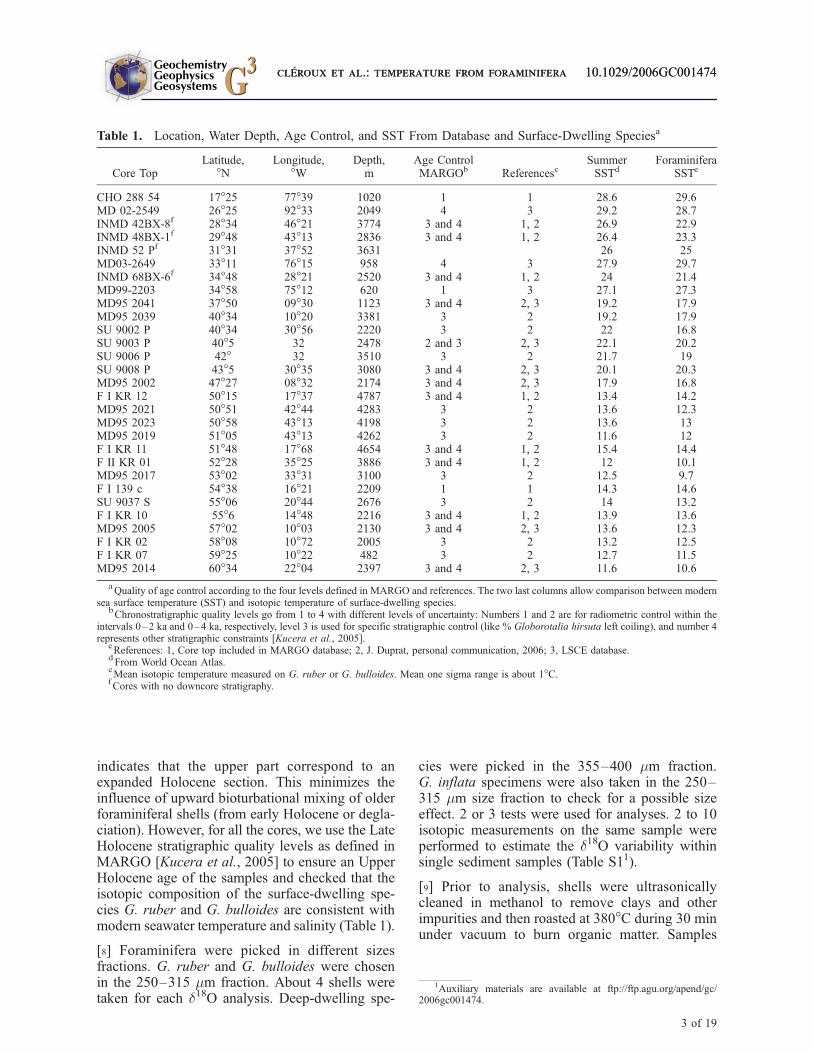
Table 1. Location, Water Depth, Age Control, and SST From Database and Surface-Dwelling Speciesa
Core TopLatitude,
�NLongitude,
�WDepth,m
Age ControlMARGOb Referencesc
SummerSSTd
ForaminiferaSSTe
CHO 288 54 17�25 77�39 1020 1 1 28.6 29.6MD 02-2549 26�25 92�33 2049 4 3 29.2 28.7INMD 42BX-8f 28�34 46�21 3774 3 and 4 1, 2 26.9 22.9INMD 48BX-1f 29�48 43�13 2836 3 and 4 1, 2 26.4 23.3INMD 52 Pf 31�31 37�52 3631 26 25MD03-2649 33�11 76�15 958 4 3 27.9 29.7INMD 68BX-6f 34�48 28�21 2520 3 and 4 1, 2 24 21.4MD99-2203 34�58 75�12 620 1 3 27.1 27.3MD95 2041 37�50 09�30 1123 3 and 4 2, 3 19.2 17.9MD95 2039 40�34 10�20 3381 3 2 19.2 17.9SU 9002 P 40�34 30�56 2220 3 2 22 16.8SU 9003 P 40�5 32 2478 2 and 3 2, 3 22.1 20.2SU 9006 P 42� 32 3510 3 2 21.7 19SU 9008 P 43�5 30�35 3080 3 and 4 2, 3 20.1 20.3MD95 2002 47�27 08�32 2174 3 and 4 2, 3 17.9 16.8F I KR 12 50�15 17�37 4787 3 and 4 1, 2 13.4 14.2MD95 2021 50�51 42�44 4283 3 2 13.6 12.3MD95 2023 50�58 43�13 4198 3 2 13.6 13MD95 2019 51�05 43�13 4262 3 2 11.6 12F I KR 11 51�48 17�68 4654 3 and 4 1, 2 15.4 14.4F II KR 01 52�28 35�25 3886 3 and 4 1, 2 12 10.1MD95 2017 53�02 33�31 3100 3 2 12.5 9.7F I 139 c 54�38 16�21 2209 1 1 14.3 14.6SU 9037 S 55�06 20�44 2676 3 2 14 13.2F I KR 10 55�6 14�48 2216 3 and 4 1, 2 13.9 13.6MD95 2005 57�02 10�03 2130 3 and 4 2, 3 13.6 12.3F I KR 02 58�08 10�72 2005 3 2 13.2 12.5F I KR 07 59�25 10�22 482 3 2 12.7 11.5MD95 2014 60�34 22�04 2397 3 and 4 2, 3 11.6 10.6
aQuality of age control according to the four levels defined in MARGO and references. The two last columns allow comparison between modern
sea surface temperature (SST) and isotopic temperature of surface-dwelling species.bChronostratigraphic quality levels go from 1 to 4 with different levels of uncertainty: Numbers 1 and 2 are for radiometric control within the
intervals 0–2 ka and 0–4 ka, respectively, level 3 is used for specific stratigraphic control (like % Globorotalia hirsuta left coiling), and number 4represents other stratigraphic constraints [Kucera et al., 2005].
cReferences: 1, Core top included in MARGO database; 2, J. Duprat, personal communication, 2006; 3, LSCE database.
dFrom World Ocean Atlas.
eMean isotopic temperature measured on G. ruber or G. bulloides. Mean one sigma range is about 1�C.
fCores with no downcore stratigraphy.
1Auxiliary materials are available at ftp://ftp.agu.org/apend/gc/2006gc001474.
GeochemistryGeophysicsGeosystems G3G3
clEroux et al.: temperature from foraminifera 10.1029/2006GC001474clEroux et al.: temperature from foraminifera 10.1029/2006GC001474
3 of 19
were analyzed using Finnigan MAT 251 massspectrometer equipped with an automated KielCARBO device for CO2 production. We used bothNBS 19 and NBS 18 as reference standards toensure calibration over a large range of d18O values[Ostermann and Curry, 2000]. All results areexpressed as d18O in % versus V-PDB. The meanexternal reproducibility of carbonate standards is0.07% for d18O, this error is insignificant in ourcalculation.
3. Calcification Temperature Estimates
[10] Several authors have shown that many fora-miniferal species do not precipitate their shell inisotopic equilibrium with ambient water but exhibitan offset called ‘‘vital effect’’ that is assumed to beconstant. For surface-dwellers vital effect seems tobe constant both within the same species across itsoptimum environmental regimes [Duplessy et al.,1991; Wang et al., 1995] and through stratigraphictime. For deep-dwelling species, contradictoryresults have been published in the literature. How-ever, apparent disequilibria are rather small inthe range 0 ± 0.3% [Deuser and Ross, 1989;Fairbanks et al., 1980; Ganssen, 1983; Niebler etal., 1999; Wilke et al., 2006] which is equivalent to±1�C.
[11] Neglecting isotopic equilibrium, we first quan-tify the depth habitat of the deep-dwelling speciesand then test the robustness of this approach bycalculating the effect of a potential disequilibriumfor each species.
[12] We calculated Tiso using the paleotemperatureequation of Shackleton [1974] (equation (1)). Thisrelation fits isotope measurements performed onbenthic foraminifera and the slope of this relation-ship fits well with measurements performed onplanktonic species [Bemis et al., 1998; Bouvier-Soumagnac and Duplessy, 1985].
Tisotopic ¼ 16:9� 4:38 * d18Oforaminifera � d18Oseawater
� �
þ 0:1 * d18Oforaminifera � d18Oseawater
� �2 ð1Þ
This equation does not differ from other paleo-temperature equations [Epstein et al., 1953; Kimand O’Neil, 1997] by more than 0.8�C in the range8–20�C.
[13] In this equation, d18O of both foraminifera andwater are measured against the same working stand-ards. As we report here foraminifera d18O againstV-PDB and seawater d18O against V-SMOW, a
0.27% correction factor was used to account forthe difference between PDB-CO2 and SMOW-CO2
standards [Hull and Turnbull, 1973; Hut, 1987].
[14] We extracted salinity data from the WorldOcean Atlas 2001 (WOA) [Conkright et al., 2002]to estimate the d18Oseawater value for each core topsample. We use the Goddard Institute for SpaceStudies database for the North Atlantic (http://data.giss.nasa.gov/o18data) to compute the relationshipbetween d18Oseawater and salinity in the NorthAtlantic Ocean between 0 and 500 meter depth. Thisgives a relationship very close to the GEOSECSequation defined between 0 and 250 m:
d18Oseawater ¼� 19:264 þ 0:558 * salinity
in V�SMOWð Þ ð2Þ
At high latitude, salinity is nearly constant in themixed layer and the thermocline. We calculatedd18Oseawater from the mean salinity value between0 and 500 m (Figure A1). The same approach isapplied for low latitude cores. In the subtropicalgyre, salinity varies from 37 psu at the surface to35.75 psu at 500 m depth. Taking a mean salinity/d18O value for the water column results in an erroron the isotopic temperature of ±1.5�C, which issmall when compared to the observed temperaturerange within the thermocline which commonlyexceed 10�C. Taking into account the experimentalerror of ±0.07% on the isotope measurement, thetotal error is about ±2�C.
[15] This calculation rests on the assumption ofisotopic equilibrium of foraminifer carbonate shellswith ambient seawater. If we assume a vital effectof ±0.3%, which is the maximum value given byprevious studies [Niebler et al., 1999], isotopictemperatures will change by less than 1.5�Caccording to the paleotemperature equation (1).Given the large scatter of the measured d18Ovalues, such a small disequilibrium would notaffect our conclusions.
4. Results and Discussion: A ModernEcological Concept
[16] To compare Tiso with modern temperaturesfrom atlas we applied the following method: Totake account regional variability, we extracted,around each core, summer and winter temperatureprofiles from the four neighboring grid points.Figure 2 gives an example for the isotopic resultsof G. inflata in the core FI KR02 but we applied
GeochemistryGeophysicsGeosystems G3G3
clEroux et al.: temperature from foraminifera 10.1029/2006GC001474
4 of 19

the same method for each core top and each species(Figures A2, A3, and A4).
[17] At midlatitudes and high latitudes, the Tisoof all species are higher than winter temperaturesbut coincide with summer temperatures aroundthe base of the summer thermocline (BST here-inafter, which we define as the depth where thesummer and winter profiles join). In agreementwith the observation that planktonic blooms occurduring summer time [Colebrook, 1982; Esaias etal., 1986]. At low latitude, we cannot exclude thepossibility of a surface habitat during winterbased on our isotopic measurements [Deuser,1987; Deuser and Ross, 1989; Deuser et al.,1981].
4.1. G. inflata
[18] As results were similar for both size fractions(250–315 mm and 355–400 mm) we have com-bined the two data sets (Table S1). We defined thedifferent ecological niches according to localhydrology. We have separated the water columninto three units: the seasonal thermocline, the BST,and the main thermocline below this level.
[19] When the BST is colder than about 16�C, Tisoof G. inflata corresponds to the temperature at theBST (Figures A2a to A2u). When the BST iswarmer than 16�C, Tiso of G. inflata indicates adeeper habitat, in the upper part of the mainthermocline (Figures A2v to A2y). In the latter
case, it is impossible to determine whether thisspecies lives throughout the year or only season-ally, because the temperature at this depth exhibitslittle seasonal variation.
[20] We develop a simple concept for this species:when the Tiso of G. inflata is lower than 16 ± 1�C,we consider that it records the temperature at theBST. When the Tiso is higher than 16 ± 1�C, itreflects warm conditions in the upper part of themain thermocline.
[21] Our ecological model is in agreement withseveral in-situ observations. In plankton tows andsurface sediment studies from off NW Africa,Ganssen [1983] and Ganssen and Sarnthein [1983],used isotope differences between G. ruber andG. inflata to mirror seasonal temperature changes.As G. ruber lives during the warm season andG. inflata at the BST, of which temperature is closeto that of winter condition, this interpretation fitswell with our concept. The development of thisspecies during warm season at midlatitude is con-firmed by the plankton nets of Ottens [1992]collected between 30�N and 60�N in the Atlantic.Recently, living G. inflata were sampled in theSW-African margin water column during australsummer [Wilke et al., 2006]. In this study theyfound a maximum for both the shell concentrationsand the amount of calcification within the thermo-cline. From 1978 to 1984, Deuser and colleaguesstudied sediment traps in the Sargasso Sea and
Figure 2. Comparison of the mean isotopic temperature (Tiso) of G. inflata with modern temperatures for the coreFI KR02. Blue (pink) line is the coldest winter (warmest summer) temperature profile from WOA 2001. Squarerepresents the mean Tiso. Rectangle indicates the possible habitat depth. The width of rectangle gives the one sigmarange in Tiso resulting from replicate d18Oforaminifera measurements. The height of rectangle expresses this error interms of water depth.
GeochemistryGeophysicsGeosystems G3G3
clEroux et al.: temperature from foraminifera 10.1029/2006GC001474
5 of 19
made oxygen isotopic measurements and foramin-ifer fluxes observations [Deuser, 1987; Deuser andRoss, 1989; Deuser et al., 1981]. They concludedthat G. inflata lives in the winter mixed-layer. Thisresult is in agreement with our observations at lowlatitude and provides additional information on thelife season in this warm region. Plankton towsstudies in the equatorial Atlantic show maximumabundance of G. inflata at the BST [Ravelo andFairbanks, 1990] and oxygen isotopic measure-ments confirm this calcification depth [Ravelo andFairbanks, 1992]. Finally the ecological nichedefined in our study for G. inflata agrees withthe calcification depth observed in the NorthAtlantic [Durazzi, 1981; Ganssen and Kroon,2000; Mortyn and Charles, 2003].
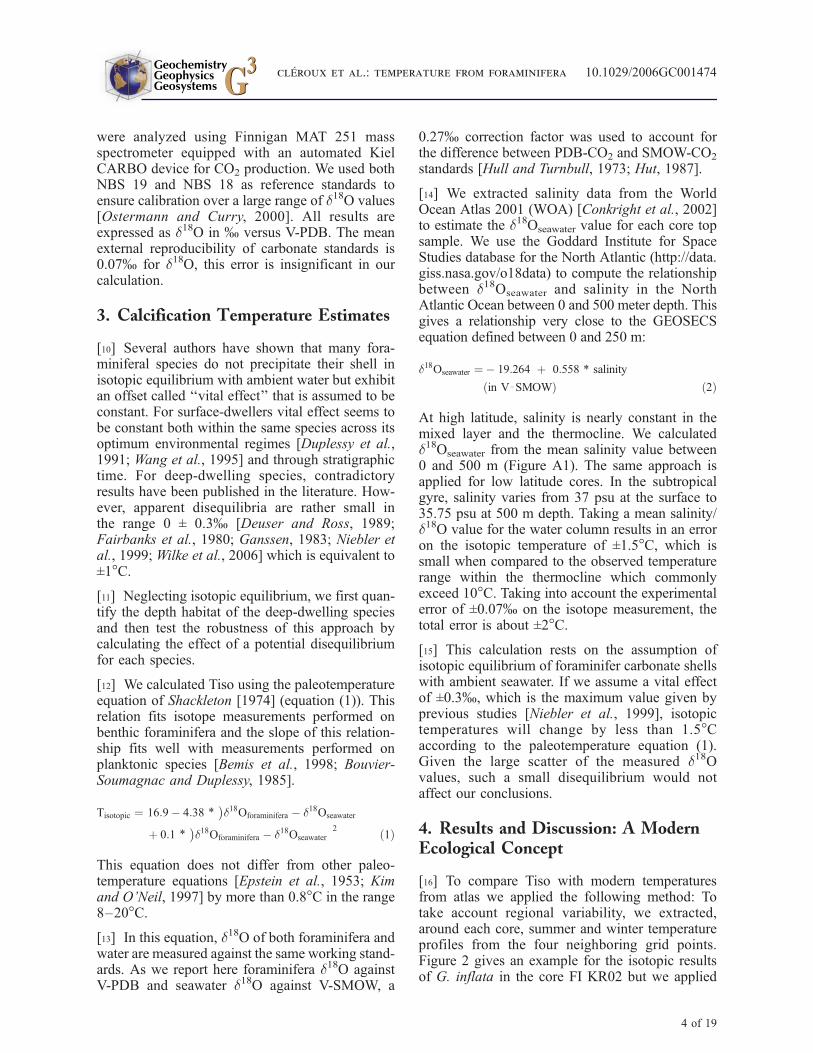
[22] Along longitudinal sections across the NorthAtlantic, we found that the depth habitat ofG. inflata follows the 0.3–0.4 mMol/l PO4 con-centration line in seawater (Figure 3). The BST isindeed a level of nutrient accumulation [Sarmientoet al., 2004] and concentration of phytoplankton ishigh, providing food for foraminifera.
4.2. G. truncatulinoides Dextral andSinistral
[23] Both G. truncatulinoides right and left coilingexhibit roughly similar Tiso (Table S1) and there-
fore occupy the same ecological niche. Ganssenand Kroon [2000] have also found similar d18O forboth coiling directions. However, we still separatethem because they constitute different geneticspecies [de Vargas et al., 2001] and they havedifferent behavior with respect to trace elementincorporation (C. Cleroux et al., manuscript inpreparation, 2007). In our data set, G. truncatuli-noides right coiling has a greater temperaturetolerance than G. truncatulinoides left coiling: thestandard deviation of the Tiso at a given location isoften larger for the right coiling form than for theleft coiling (Figures A3i to A3m and A3r).
[24] When the BST is colder than about 16�C,G. truncatulinoides is found in the seasonal ther-mocline lower part (Figures A3a to A3n). Whenthe BST is warmer than about 16�C, G. truncatu-linoides lives deeper in the main thermocline(Figures A3o to A3t). Although G. truncatuli-noides and G. inflata have similar depth habitat,G. truncatulinoides always lives at greater depththan G. inflata when both species are present in thesame area. The great scatter of the calculated Tisofor low latitude samples reflects the wide temper-ature variation that occurs in the upper watercolumn.
[25] We thus develop a concept similar to that ofG. inflata: when the Tiso of G. truncatulinoides is
Figure 3. Depth positions of G. inflata 355–400 mm on summer temperature (�C) and phosphate (mmol/l) crosssection at (left) 37�W and (right) 15�W. G. inflata depth habitats (white circle) were placed according to latitude oftheir core top and calculated Tiso on (a) two longitudinal temperature sections and (b) corresponding PO4 section.
GeochemistryGeophysicsGeosystems G3G3
clEroux et al.: temperature from foraminifera 10.1029/2006GC001474
6 of 19
lower than 16 ± 1�C, we consider that it records thetemperature at the BST. When the Tiso is higherthan 16 ± 1�C, it reflects conditions of the mainthermocline.
[26] Local hydrology therefore fixes the depthhabitat of G. truncatulinoides. LeGrande et al.[2004] predict G. truncatulinoides d18O for manySouth and North Atlantic core tops assuming(1) a single depth calcification at 350 m or(2) 30% of calcification at the surface and 70%of calcification at 800 m. We tested our conceptwith the North Atlantic data of LeGrande et al.’s[2004] paper. One fraction of their data comes fromthe study of Ganssen and Kroon [2000] and will bediscussed further in the text. The other fractioncorresponds to core tops located in warm regions,around the equator or in the Gulf stream water,where temperature at the BST largely exceed ourthreshold value of 16�C. Thus, according to ourprediction, G. truncatulinoides calcifies in the mainthermocline, in agreement with the model ofLeGrande et al. [2004], which specifies that it isaround 350 m. On the contrary, our concept doesnot fit with the South Atlantic LeGrande et al.[2004] data. Estimated isotopic temperatures arevery low, in contradiction with the temperaturepreferences known for the North Atlantic G. trun-catulinoides. It is possible that the genetic differ-ence observed by de Vargas et al. [2001] betweenthe North and South Atlantic G. truncatulinoides
corresponds to different ecological characteristics.We do not have elements to check that hypothesisand we consider that at the present stage theconcept is not adapted for the South Atlantic.
[27] Our concept directly reproduces regionalobservations. In the Sargasso Sea, d18O values ofG. truncatulinoides record average conditions near200 meters depth [Deuser, 1987; Deuser and Ross,1989; Deuser et al., 1981; McKenna and Prell,2004]. This depth corresponds to the BST with atemperature close to 16�C. Here, G. truncatuli-noides inhabits its preferred habitat. In slope water,cold core rings of the Gulf Stream and NorthernSargasso Sea plankton tows, Fairbanks et al.[1980] observed that the main population ofG. truncatulinoides is found between 125 to175 m, which corresponds to the BST. Mulitza etal. [1999] also showed that G. truncatulinoideslives in phosphate-rich waters and is a goodrecorder of thermocline nutrient levels.
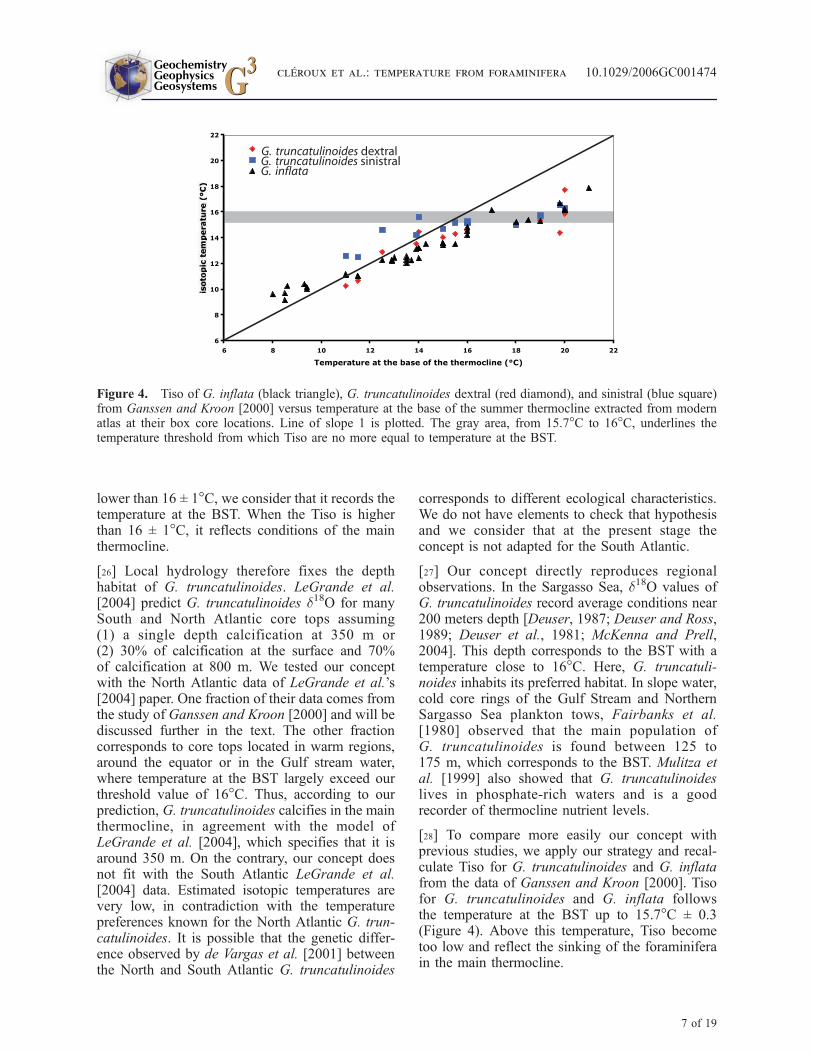
[28] To compare more easily our concept withprevious studies, we apply our strategy and recal-culate Tiso for G. truncatulinoides and G. inflatafrom the data of Ganssen and Kroon [2000]. Tisofor G. truncatulinoides and G. inflata followsthe temperature at the BST up to 15.7�C ± 0.3(Figure 4). Above this temperature, Tiso becometoo low and reflect the sinking of the foraminiferain the main thermocline.
Figure 4. Tiso of G. inflata (black triangle), G. truncatulinoides dextral (red diamond), and sinistral (blue square)from Ganssen and Kroon [2000] versus temperature at the base of the summer thermocline extracted from modernatlas at their box core locations. Line of slope 1 is plotted. The gray area, from 15.7�C to 16�C, underlines thetemperature threshold from which Tiso are no more equal to temperature at the BST.
GeochemistryGeophysicsGeosystems G3G3
clEroux et al.: temperature from foraminifera 10.1029/2006GC001474
7 of 19
4.3. P. obliquiloculata
[29] P. obliquiloculata has a restricted geographicaldistribution and was found in only 7 core tops. Tisoof P. obliquiloculata reflect those at the BST(Figures A4a to A4g). This species inhabits thesame ecological niche as G. inflata but is restrictedto warm regions. In a core located south of Cuba(core CHO288-54, Figure A4f), P. obliquiloculatais in equilibrium with the seawater temperature at175 m depth. In this region where seasonality isquasi-absent and stratification is strong throughoutthe year, this depth corresponds to the base of theupper thermocline.
[30] Ravelo and Fairbanks [1992] found the max-imum occurrence of P. obliquiloculata at 60 m inequatorial Atlantic waters, i.e., at the BST. In astudy off NW Africa, Ganssen [1983] concludesalso that P. obliquiloculata delineates winter tem-perature. Except for one specimen collected inMarch, this species was not found in winter planktontows. Moreover, calculated Tiso from sedimentsamples was often a little warmer than winter seasurface temperature thus compatible with temper-ature at the BST. In the Sargasso Sea, the sedimenttraps studies of [Deuser, 1987; Deuser and Ross,1989; Deuser et al., 1981] yield a characteristicisotopic depth of 0–75 m which do not contradictthese results.
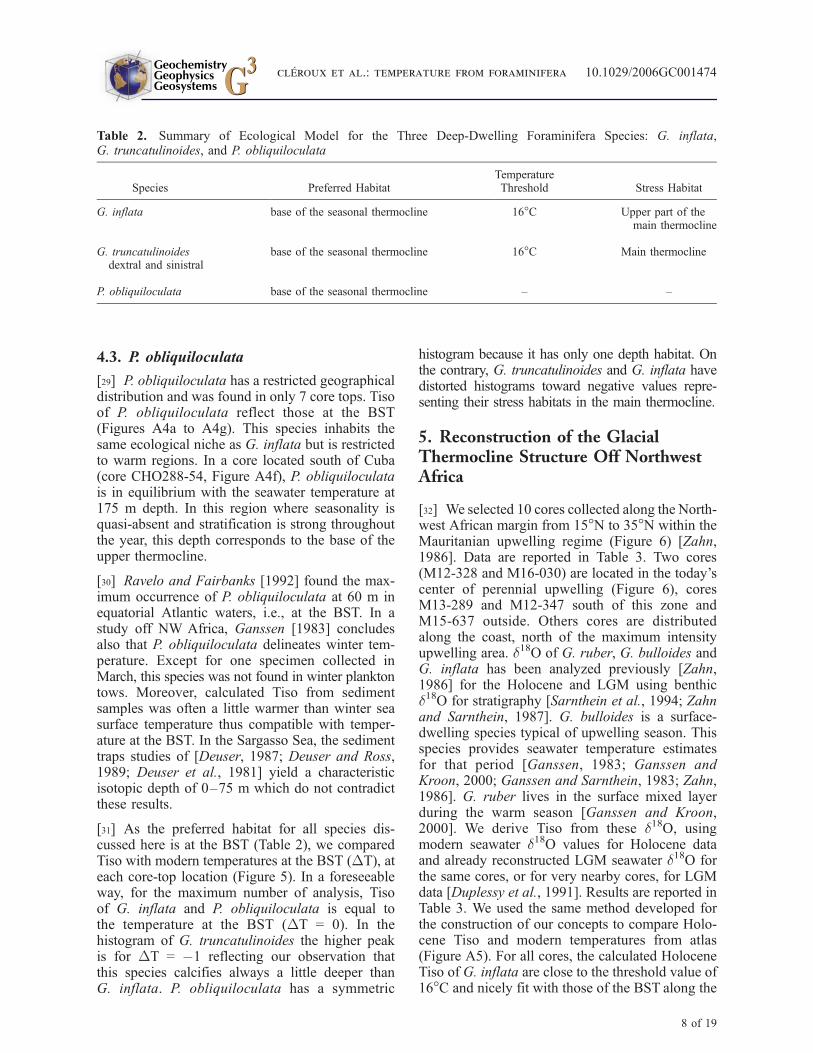
[31] As the preferred habitat for all species dis-cussed here is at the BST (Table 2), we comparedTiso with modern temperatures at the BST (DT), ateach core-top location (Figure 5). In a foreseeableway, for the maximum number of analysis, Tisoof G. inflata and P. obliquiloculata is equal tothe temperature at the BST (DT = 0). In thehistogram of G. truncatulinoides the higher peakis for DT = �1 reflecting our observation thatthis species calcifies always a little deeper thanG. inflata. P. obliquiloculata has a symmetric
histogram because it has only one depth habitat. Onthe contrary, G. truncatulinoides and G. inflata havedistorted histograms toward negative values repre-senting their stress habitats in the main thermocline.
5. Reconstruction of the GlacialThermocline Structure Off NorthwestAfrica
[32] We selected 10 cores collected along the North-west African margin from 15�N to 35�N within theMauritanian upwelling regime (Figure 6) [Zahn,1986]. Data are reported in Table 3. Two cores(M12-328 and M16-030) are located in the today’scenter of perennial upwelling (Figure 6), coresM13-289 and M12-347 south of this zone andM15-637 outside. Others cores are distributedalong the coast, north of the maximum intensityupwelling area. d18O of G. ruber, G. bulloides andG. inflata has been analyzed previously [Zahn,1986] for the Holocene and LGM using benthicd18O for stratigraphy [Sarnthein et al., 1994; Zahnand Sarnthein, 1987]. G. bulloides is a surface-dwelling species typical of upwelling season. Thisspecies provides seawater temperature estimatesfor that period [Ganssen, 1983; Ganssen andKroon, 2000; Ganssen and Sarnthein, 1983; Zahn,1986]. G. ruber lives in the surface mixed layerduring the warm season [Ganssen and Kroon,2000]. We derive Tiso from these d18O, usingmodern seawater d18O values for Holocene dataand already reconstructed LGM seawater d18O forthe same cores, or for very nearby cores, for LGMdata [Duplessy et al., 1991]. Results are reported inTable 3. We used the same method developed forthe construction of our concepts to compare Holo-cene Tiso and modern temperatures from atlas(Figure A5). For all cores, the calculated HoloceneTiso of G. inflata are close to the threshold value of16�C and nicely fit with those of the BST along the
Table 2. Summary of Ecological Model for the Three Deep-Dwelling Foraminifera Species: G. inflata,G. truncatulinoides, and P. obliquiloculata
Species Preferred HabitatTemperatureThreshold Stress Habitat
G. inflata base of the seasonal thermocline 16�C Upper part of themain thermocline
G. truncatulinoidesdextral and sinistral
base of the seasonal thermocline 16�C Main thermocline
P. obliquiloculata base of the seasonal thermocline – –
GeochemistryGeophysicsGeosystems G3G3
clEroux et al.: temperature from foraminifera 10.1029/2006GC001474
8 of 19
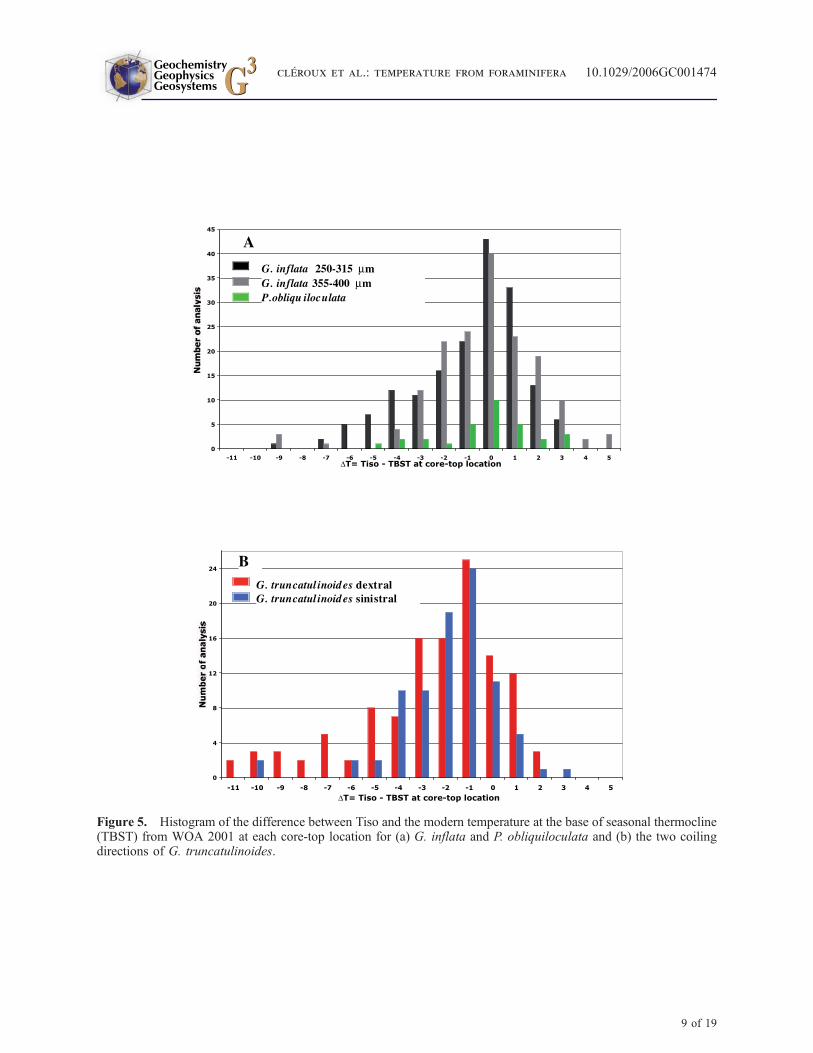
Figure 5. Histogram of the difference between Tiso and the modern temperature at the base of seasonal thermocline(TBST) from WOA 2001 at each core-top location for (a) G. inflata and P. obliquiloculata and (b) the two coilingdirections of G. truncatulinoides.
GeochemistryGeophysicsGeosystems G3G3
clEroux et al.: temperature from foraminifera 10.1029/2006GC001474
9 of 19
Northwest African Margin (Figure A5). We high-lighted in this paper that G. inflata might changehis depth habitat when seawater becomes warmer;as Tiso for LGM samples are colder than thepresent we assume that G. inflata did not changeits habitat from LGM time to Holocene. Accord-ingly, we consider that the calculated LGM Tisoreflect conditions at the BST.
[33] The upwelling activity, which exist at thecores M12-328, M16-030 and M16-004 locations(Figures 6 and 7), is reflected by several indicators:Tiso of G. bulloides are low; Tiso of G. inflata arealso low because the temperature at the BST islinked to the coldest month conditions. Thus Tisodifferences between G. bulloides and G. inflataunder upwelling conditions are small. We shall usethe whole set of these indicators to characterizeupwelling activity. In the other cores, outside themain upwelling cell, mean Tiso of G. bulloides isabout 21�C (M13-289, M12-309 and M16-006).The absence of upwelled cold water is well marked
between 23�N and 29�N with the warm Tiso ofG. inflata (Figure 7).
[34] During LGM, in the southern cores M12-347and M13-289, Tiso of G. inflata are low (about12.5�C), whereas those of G. bulloides are high(19.1�C and 19.5�C, respectively), resulting inlarge temperature difference between G. bulloidesand G. inflata (6.9�C and 6.6�C). This suggeststhat the strong cooling observed at the BST is notassociated with upwelling during glacial conditionsbut is probably due to a water mass circulationdifferent from the present [Sarnthein et al., 1994].
[35] In the cores M12-328, M16-030, M12-379and M12-309, Tiso for G. inflata is comprisedbetween 14�C and 15�C, and the mean Tiso ofG. bulloides is 19�C. The mean temperature dif-ference between the two species is about 4.5�C.According to Holocene observations, it reflectshydrological area with moderate upwelling activity.We conclude that during LGM, upwelling activity
Figure 6. Sea surface temperatures and locations of the cores used to reconstruct upwelling intensity along theNW African margin.
GeochemistryGeophysicsGeosystems G3G3
clEroux et al.: temperature from foraminifera 10.1029/2006GC001474
10 of 19
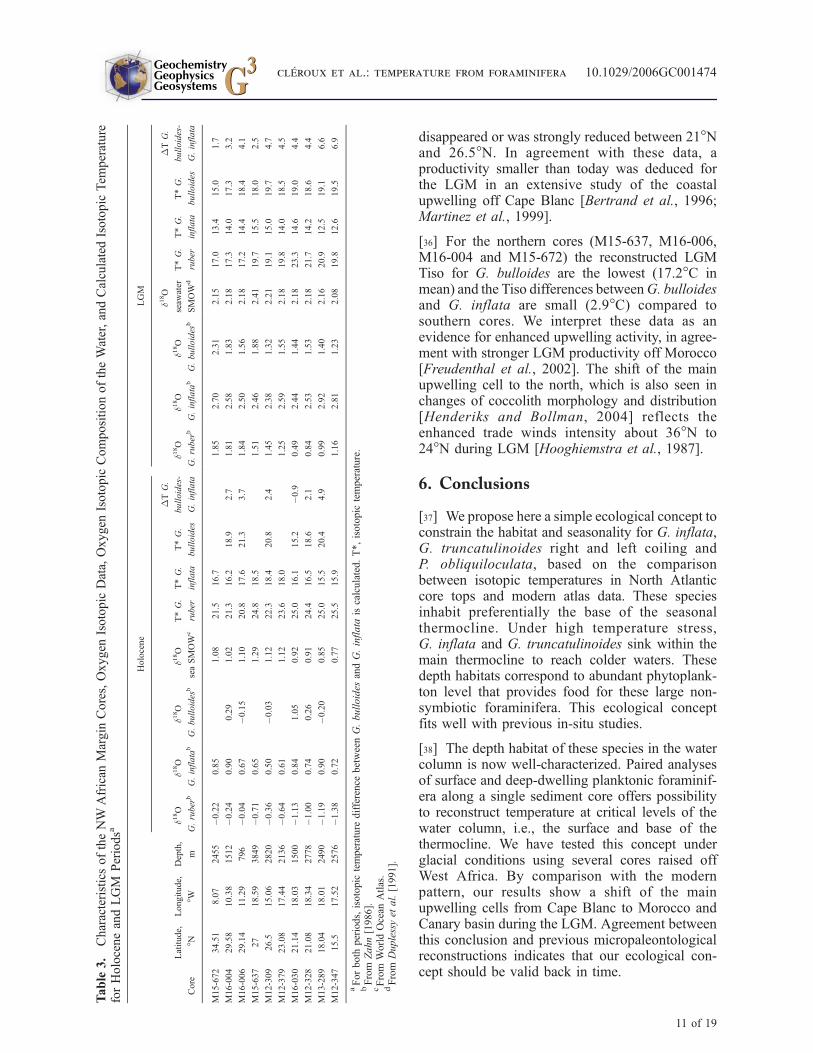
disappeared or was strongly reduced between 21�Nand 26.5�N. In agreement with these data, aproductivity smaller than today was deduced forthe LGM in an extensive study of the coastalupwelling off Cape Blanc [Bertrand et al., 1996;Martinez et al., 1999].
[36] For the northern cores (M15-637, M16-006,M16-004 and M15-672) the reconstructed LGMTiso for G. bulloides are the lowest (17.2�C inmean) and the Tiso differences betweenG. bulloidesand G. inflata are small (2.9�C) compared tosouthern cores. We interpret these data as anevidence for enhanced upwelling activity, in agree-ment with stronger LGM productivity off Morocco[Freudenthal et al., 2002]. The shift of the mainupwelling cell to the north, which is also seen inchanges of coccolith morphology and distribution[Henderiks and Bollman, 2004] reflects theenhanced trade winds intensity about 36�N to24�N during LGM [Hooghiemstra et al., 1987].
6. Conclusions
[37] We propose here a simple ecological concept toconstrain the habitat and seasonality for G. inflata,G. truncatulinoides right and left coiling andP. obliquiloculata, based on the comparisonbetween isotopic temperatures in North Atlanticcore tops and modern atlas data. These speciesinhabit preferentially the base of the seasonalthermocline. Under high temperature stress,G. inflata and G. truncatulinoides sink within themain thermocline to reach colder waters. Thesedepth habitats correspond to abundant phytoplank-ton level that provides food for these large non-symbiotic foraminifera. This ecological conceptfits well with previous in-situ studies.
[38] The depth habitat of these species in the watercolumn is now well-characterized. Paired analysesof surface and deep-dwelling planktonic foraminif-era along a single sediment core offers possibilityto reconstruct temperature at critical levels of thewater column, i.e., the surface and base of thethermocline. We have tested this concept underglacial conditions using several cores raised offWest Africa. By comparison with the modernpattern, our results show a shift of the mainupwelling cells from Cape Blanc to Morocco andCanary basin during the LGM. Agreement betweenthis conclusion and previous micropaleontologicalreconstructions indicates that our ecological con-cept should be valid back in time.
Table
3.
CharacteristicsoftheNW
African
Margin
Cores,Oxygen
Isotopic
Data,Oxygen
Isotopic
CompositionoftheWater,andCalculatedIsotopic
Tem
perature
forHoloceneandLGM
Periodsa
Core
Latitude,
�NLongitude,
�WDepth,
m
Holocene
LGM
d18O
G.ruber
b
d18O
G.inflata
b
d18O
G.bulloides
b
d18O
seaSMOW
c
T*G.
ruber
T*G.
inflata
T*G.
bulloides
DTG.
bulloides-
G.inflata
d18O
G.ruber
b
d18O
G.inflata
b
d18O
G.bulloides
b
d18O
seaw
ater
SMOW
d
T*G.
ruber
T*G.
inflata
T*G.
bulloides
DTG.
bulloides-
G.inflata
M15-672
34.51
8.07
2455
�0.22
0.85
1.08
21.5
16.7
1.85
2.70
2.31
2.15
17.0
13.4
15.0
1.7
M16-004
29.58
10.38
1512
�0.24
0.90
0.29
1.02
21.3
16.2
18.9
2.7
1.81
2.58
1.83
2.18
17.3
14.0
17.3
3.2
M16-006
29.14
11.29
796
�0.04
0.67
�0.15
1.10
20.8
17.6
21.3
3.7
1.84
2.50
1.56
2.18
17.2
14.4
18.4
4.1
M15-637
27
18.59
3849
�0.71
0.65
1.29
24.8
18.5
1.51
2.46
1.88
2.41
19.7
15.5
18.0
2.5
M12-309
26.5
15.06
2820
�0.36
0.50
�0.03
1.12
22.3
18.4
20.8
2.4
1.45
2.38
1.32
2.21
19.1
15.0
19.7
4.7
M12-379
23.08
17.44
2136
�0.64
0.61
1.12
23.6
18.0
1.25
2.59
1.55
2.18
19.8
14.0
18.5
4.5
M16-030
21.14
18.03
1500
�1.13
0.84
1.05
0.92
25.0
16.1
15.2
�0.9
0.49
2.44
1.44
2.18
23.3
14.6
19.0
4.4
M12-328
21.08
18.34
2778
�1.00
0.74
0.26
0.91
24.4
16.5
18.6
2.1
0.84
2.53
1.53
2.18
21.7
14.2
18.6
4.4
M13-289
18.04
18.01
2490
�1.19
0.90
�0.20
0.85
25.0
15.5
20.4
4.9
0.99
2.92
1.40
2.16
20.9
12.5
19.1
6.6
M12-347
15.5
17.52
2576
�1.38
0.72
0.77
25.5
15.9
1.16
2.81
1.23
2.08
19.8
12.6
19.5
6.9
aForboth
periods,isotopic
temperature
difference
betweenG.bulloides
andG.inflata
iscalculated.T*,isotopic
temperature.
bFrom
Zahn[1986].
cFrom
WorldOcean
Atlas.
dFrom
Duplessyet
al.[1991].
GeochemistryGeophysicsGeosystems G3G3
clEroux et al.: temperature from foraminifera 10.1029/2006GC001474
11 of 19
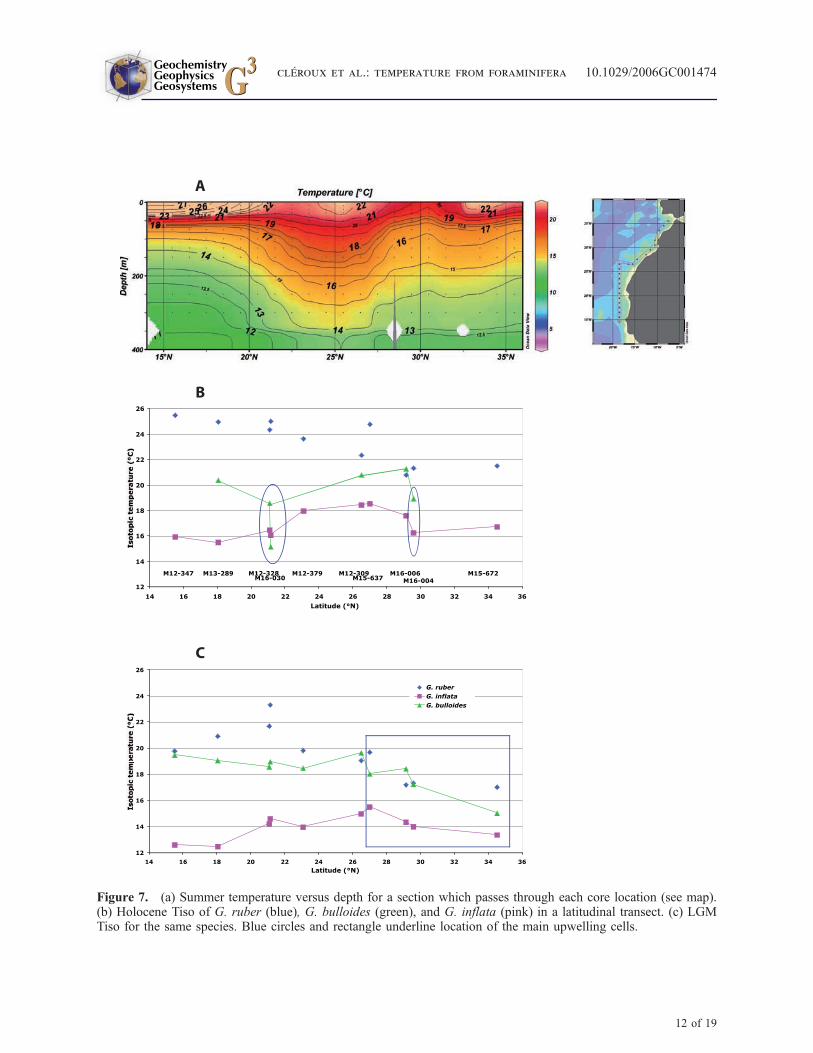
Figure 7. (a) Summer temperature versus depth for a section which passes through each core location (see map).(b) Holocene Tiso of G. ruber (blue), G. bulloides (green), and G. inflata (pink) in a latitudinal transect. (c) LGMTiso for the same species. Blue circles and rectangle underline location of the main upwelling cells.
GeochemistryGeophysicsGeosystems G3G3
clEroux et al.: temperature from foraminifera 10.1029/2006GC001474
12 of 19
Appendix A
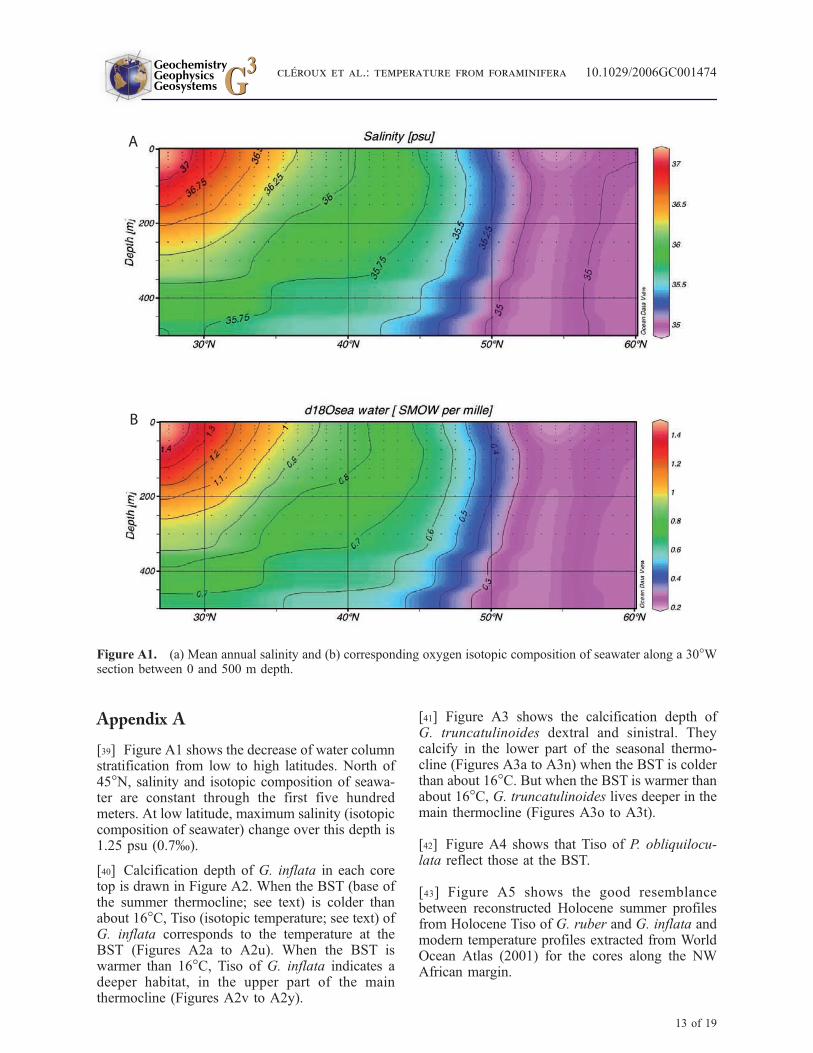
[39] Figure A1 shows the decrease of water columnstratification from low to high latitudes. North of45�N, salinity and isotopic composition of seawa-ter are constant through the first five hundredmeters. At low latitude, maximum salinity (isotopiccomposition of seawater) change over this depth is1.25 psu (0.7%).
[40] Calcification depth of G. inflata in each coretop is drawn in Figure A2. When the BST (base ofthe summer thermocline; see text) is colder thanabout 16�C, Tiso (isotopic temperature; see text) ofG. inflata corresponds to the temperature at theBST (Figures A2a to A2u). When the BST iswarmer than 16�C, Tiso of G. inflata indicates adeeper habitat, in the upper part of the mainthermocline (Figures A2v to A2y).
[41] Figure A3 shows the calcification depth ofG. truncatulinoides dextral and sinistral. Theycalcify in the lower part of the seasonal thermo-cline (Figures A3a to A3n) when the BST is colderthan about 16�C. But when the BST is warmer thanabout 16�C, G. truncatulinoides lives deeper in themain thermocline (Figures A3o to A3t).
[42] Figure A4 shows that Tiso of P. obliquilocu-lata reflect those at the BST.
[43] Figure A5 shows the good resemblancebetween reconstructed Holocene summer profilesfrom Holocene Tiso of G. ruber and G. inflata andmodern temperature profiles extracted from WorldOcean Atlas (2001) for the cores along the NWAfrican margin.
Figure A1. (a) Mean annual salinity and (b) corresponding oxygen isotopic composition of seawater along a 30�Wsection between 0 and 500 m depth.
GeochemistryGeophysicsGeosystems G3G3
clEroux et al.: temperature from foraminifera 10.1029/2006GC001474
13 of 19
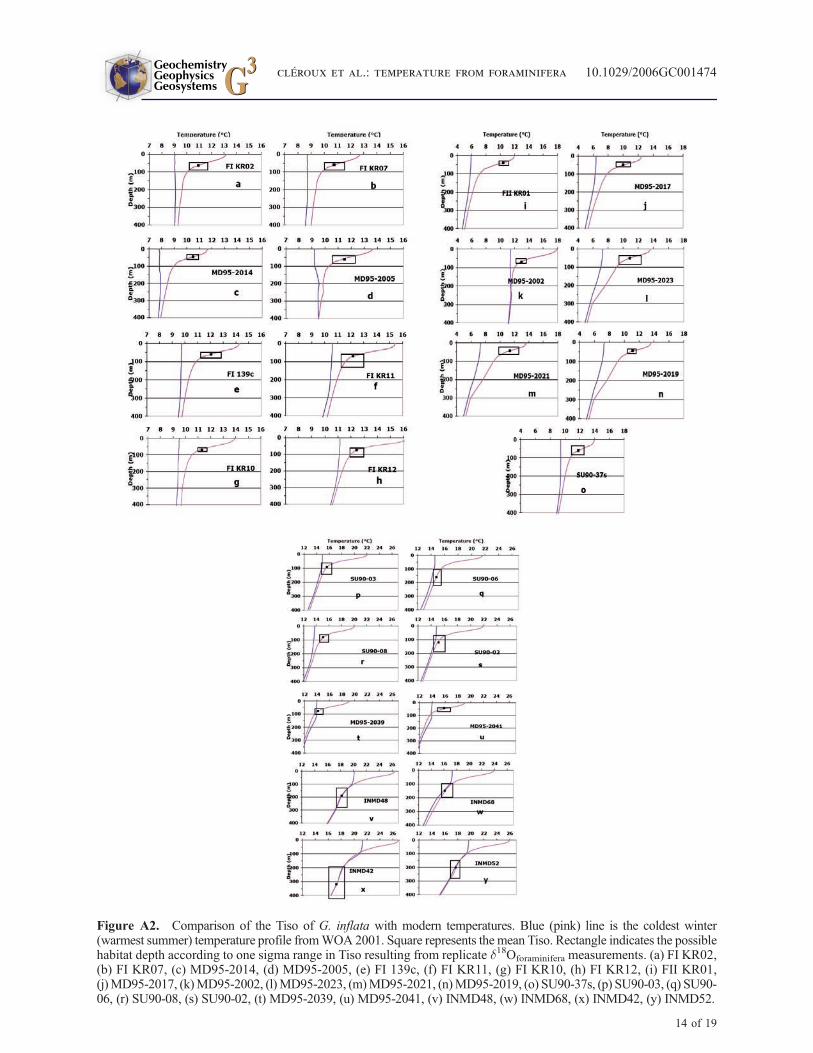
Figure A2. Comparison of the Tiso of G. inflata with modern temperatures. Blue (pink) line is the coldest winter(warmest summer) temperature profile fromWOA 2001. Square represents the mean Tiso. Rectangle indicates the possiblehabitat depth according to one sigma range in Tiso resulting from replicate d18Oforaminifera measurements. (a) FI KR02,(b) FI KR07, (c) MD95-2014, (d) MD95-2005, (e) FI 139c, (f) FI KR11, (g) FI KR10, (h) FI KR12, (i) FII KR01,(j)MD95-2017, (k)MD95-2002, (l)MD95-2023, (m)MD95-2021, (n)MD95-2019, (o) SU90-37s, (p) SU90-03, (q) SU90-06, (r) SU90-08, (s) SU90-02, (t) MD95-2039, (u) MD95-2041, (v) INMD48, (w) INMD68, (x) INMD42, (y) INMD52.
GeochemistryGeophysicsGeosystems G3G3
clEroux et al.: temperature from foraminifera 10.1029/2006GC001474
14 of 19
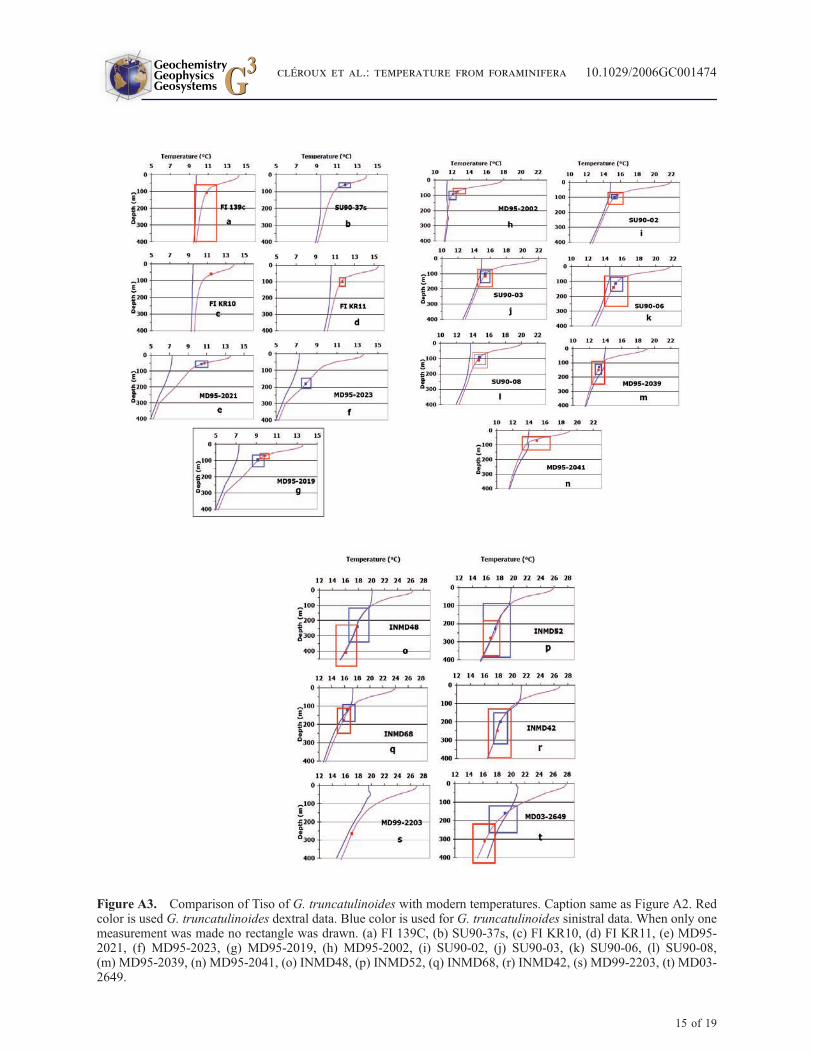
Figure A3. Comparison of Tiso of G. truncatulinoides with modern temperatures. Caption same as Figure A2. Redcolor is used G. truncatulinoides dextral data. Blue color is used for G. truncatulinoides sinistral data. When only onemeasurement was made no rectangle was drawn. (a) FI 139C, (b) SU90-37s, (c) FI KR10, (d) FI KR11, (e) MD95-2021, (f) MD95-2023, (g) MD95-2019, (h) MD95-2002, (i) SU90-02, (j) SU90-03, (k) SU90-06, (l) SU90-08,(m) MD95-2039, (n) MD95-2041, (o) INMD48, (p) INMD52, (q) INMD68, (r) INMD42, (s) MD99-2203, (t) MD03-2649.
GeochemistryGeophysicsGeosystems G3G3
clEroux et al.: temperature from foraminifera 10.1029/2006GC001474
15 of 19
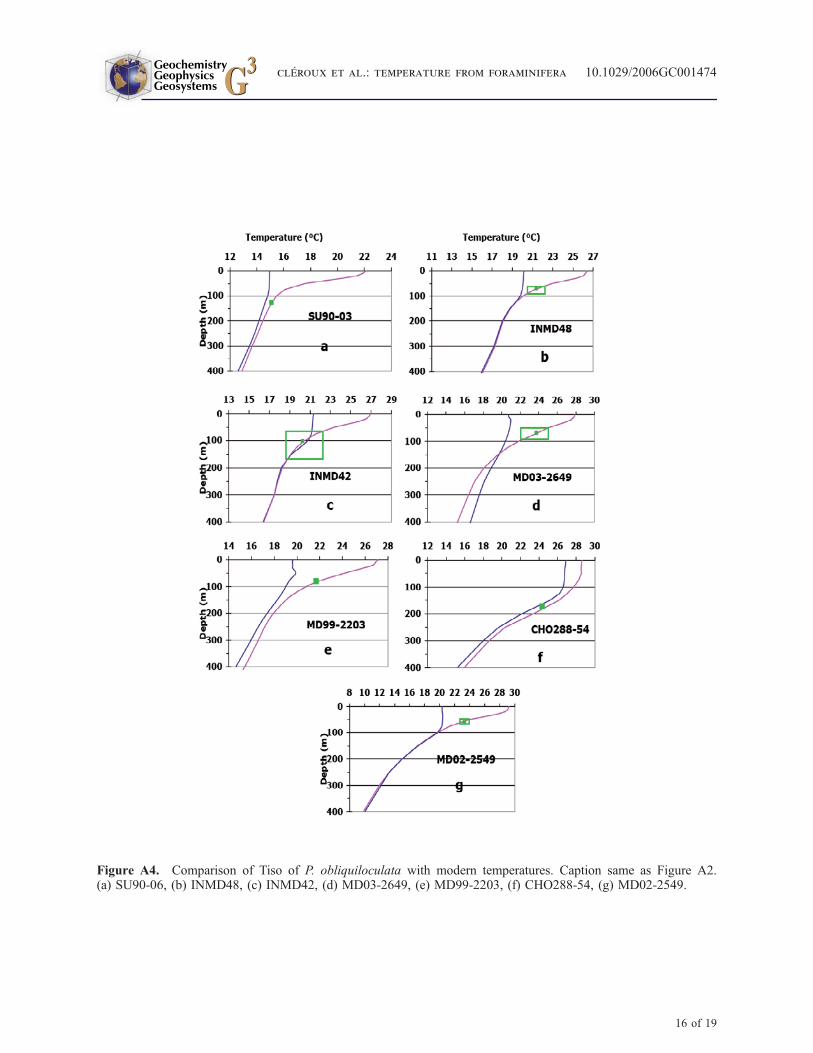
Figure A4. Comparison of Tiso of P. obliquiloculata with modern temperatures. Caption same as Figure A2.(a) SU90-06, (b) INMD48, (c) INMD42, (d) MD03-2649, (e) MD99-2203, (f) CHO288-54, (g) MD02-2549.
GeochemistryGeophysicsGeosystems G3G3
clEroux et al.: temperature from foraminifera 10.1029/2006GC001474
16 of 19
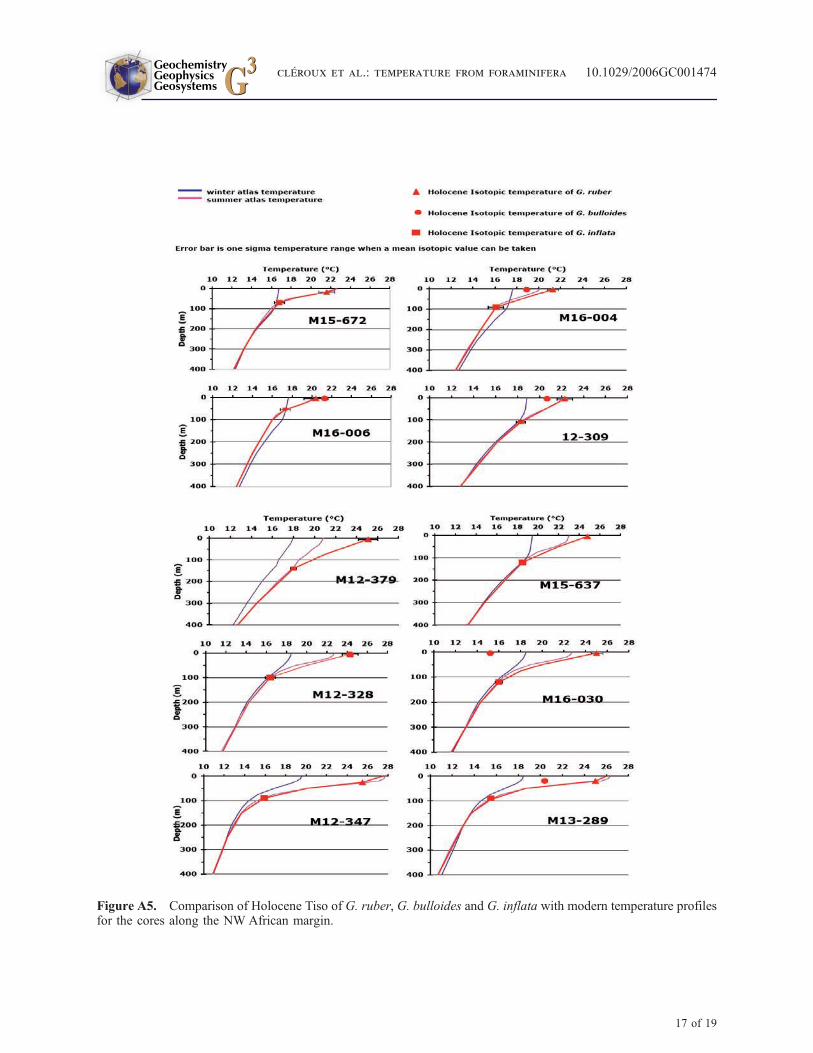
Figure A5. Comparison of Holocene Tiso of G. ruber, G. bulloides and G. inflata with modern temperature profilesfor the cores along the NW African margin.
GeochemistryGeophysicsGeosystems G3G3
clEroux et al.: temperature from foraminifera 10.1029/2006GC001474
17 of 19
Acknowledgments
[44] The material for the calibration was taken during several
oceanographic cruises, noticeably the IMAGES cruises. We
thank IFREMER and IPEV for technical support and making
the R/V available. We thank the Scripps Institution of Ocean-
ography for providing the INMD samples and J. Duprat
(EPOC-Bordeaux) for establishing the stratigraphy of many
cores. We thank colleagues of LSCE, C. Waelbroeck,
L. Labeyrie, and E. Michel, for careful reading and construc-
tive remarks, and F. Dewilde and B. Le Coat for mass
spectrometer analyses. C.C. is supported by a French Research
Ministry fellowship. Basic support from CNRS and CEA to
LSCE is acknowledged. ANR Forclim and PICC grants
provided funds for this study.
References
Be, A. W. H. (1977), An ecological, zoogeographic and taxo-nomic review of recent planktonic foraminifera, in OceanicMicropaleontology, vol. 1, edited by A. T. S. E. Ramsay,pp. 1–100, Elsevier, New York.
Bemis, B. E., H. J. Spero, J. Bijma, and D. W. Lea (1998),Reevaluation of the oxygen isotopic composition of plank-tonic foraminifera: Experimental results and revised paleo-temperature equations, Paleoceanography, 13(2), 150–160.
Bertrand, P., et al. (1996), The glacial ocean productivityhypothesis: The importance of regional temporal and spatialstudies, Mar. Geol., 130, 1–9.
Bouvier-Soumagnac, Y., and J.-C. Duplessy (1985), Carbonand oxygen isotopic composition of planktonic foraminiferafrom laboratory culture, plankton tows and recent sediment:Implications for the reconstruction of paleoclimatic condi-tions and of the global carbon cycle, J. Foraminifera Res.,15(4), 302–320.
Colebrook, J. M. (1982), Continuous plankton records: seaso-nal variations in the distribution and abundance of planktonin the North Atlantic Ocean and the North Sea, J. PlanktonRes., 4, 435–462.
Conkright, M. E., R. A. Locarnini, H. E. Garcia, T. D. O’Brien,T. P. Boyer, C. Stephens, and J. I. Antonov (2002), WorldOcean Atlas 2001: Objective Analyses, Data Statistics, andFigures, CD-ROM documentation, Natl. Oceanogr. DataCent. Internal Rep. 17, 17 pp., Silver Spring, Md.
de Vargas, C., S. Renaud, H. Hilbrecht, and J. Pawlowski(2001), Pleistocene adaptive radiation in Globorotalia trun-catulinoides: Genetic, morphologic, and environmental evi-dence, Paleobiology, 27(1), 104–125.
Deuser, W. G. (1987), Seasonal variations in isotopic compo-sition and deep-water fluxes of the tests of perennially abun-dant planktonic foraminifera of the Sargasso Sea: Resultsfrom sediment-trap collections and their paleoceanographicsignificance, J. Foraminifera Res., 17, 14–27.
Deuser, W. G., and E. H. Ross (1989), Seasonally abun-dant planktonic foraminifera of the Sargasso Sea—Succession, deep-water fluxes, isotopic composition andpaleoceanographic implication, J. Foraminifera Res., 19,268–293.
Deuser, W. G., E. H. Ross, C. Hemleben, and M. Spindler(1981), Seasonal changes in species composition, numbers,mass, size, and isotopic composition of planktonic foramini-fera settling into the deep Sargasso Sea, Palaeogeogr.Palaeoclimatol. Palaeoecol., 33, 103–127.
Duplessy, J.-C., L. Labeyrie, A. Juillet-Leclerc, F. Maitre,J. Duprat, and M. Sarnthein (1991), Surface salinityreconstruction of the north Atlantic Ocean during thelast glacial maximum, Oceanol. Acta, 14(4), 311–324.
Durazzi, J. T. (1981), Stable-isotope studies of planktonic for-aminifera in North Atlantic core tops, Palaeogeogr. Palaeo-climatol. Palaeoecol., 33, 157–172.
Epstein, S., R. Buchsbaum, H. A. Lowenstam, and H. C. Urey(1953), Revised carbonate-water isotopic temperature scale,Bull. Geol. Soc. Am., 64, 1315–1326.
Esaias, W. E., G. C. Feldman, C. R. McClain, and J. A. Elrod(1986), Monthly satellite-derived phytoplankton pigmentdistribution for the North Atlantic Ocean basin, Eos TransAGU, 67, 835–837.
Fairbanks, R. G., P. H. Wiebe, and A. W. H. Be (1980), Ver-tical distribution and isotopic composition of living plank-tonic foraminifera in the western North Atlantic, Science,207, 61–63.
Freudenthal, T., H. Meggers, J. Henderiksb, H. Kuhlmanna,A. Moreno, and G. Wefer (2002), Upwelling intensity andfilament activity off Morocco during the last 250,000 years,Deep Sea Res., Part II, 49, 3655–3674.
Ganssen, G. (1983), Dokumentation von kustennahem Auf-trieb anhand stabiler Isotopen in rezenten Foraminiferenvor Nordwest-Afrika., Meteor Forschungsergeb., Reihe C,37, 1–46.
Ganssen, G., and D. Kroon (2000), The isotopic signature ofplanktonic foraminifera from NE Atlantic surface sediments:Implications for the reconstruction of past oceanic condi-tions, J. Geol. Soc. London, 157, 693–699.
Ganssen, G., and M. Sarnthein (1983), Stable-isotope compo-sition of foraminifers: The surface and bottom water recordof coastal upwelling, in Coastal Upwelling: Its SedimentRecord, Part A, edited by E. Suess and J. Thiede, pp. 99–121, Springer, New York.
Giraudeau, J., M. Cremer, S. Manthe, L. Labeyrie, andG. Bond (2000), Coccolith evidence for instabilities in sur-face circulation south of Iceland during Holocene times,Earth Planet. Sci. Lett., 179, 257–268.
Henderiks, J., and J. Bollman (2004), The Gephyrocapsa seasurface palaeothermometer put to the test: Comparison withalkenone and foraminifera proxies off NW Africa, Mar.Micropaleontol., 50, 161–184.
Hooghiemstra, H., A. Bechler, and H.-J. Beug (1987), Isopol-len maps for 18,000 years BP of the Atlantic offshore ofNorth-west Africa: Evidence for paleowind circulation,Paleoceanography, 2, 561–582.
Hull, H., and A. G. Turnbull (1973), A thermochemical study ofmonohydrocalcite,Geochim. Cosmochim. Acta, 37, 685–694.
Hut, G. (1987), Consultants group meeting on stable isotopereference samples for geochemical and hydrologicalinvestigations, Vienna, Austria, 16–18 September 1985,IAEA report, Int. At. Energy Agency, Vienna.
Kim, S. T., and J. R. O’Neil (1997), Equilibrium and non-equilibrium oxygen isotope effects in synthetic carbonates,Geochim. Cosmochim. Acta, 61, 3461–3475.
Koc Karpuz, N., and H. Schrader (1990), Surface sedimentdiatom distribution and Holocene paleotemperature varia-tions in the Greenland, Iceland and Norwegian Sea, Paleo-ceanography, 5(4), 557–580.
Kucera, M., A. Rosell-Mele, R. Schneider, C. Waelbroeck, andM. Weinelt (2005), Multiproxy approach for the reconstruc-tion of the glacial ocean surface (MARGO), Quat. Sci. Rev.,24, 813–819.
LeGrande, A. N., J. Lynch-Stieglitz, and E. C. Farmer (2004),Oxygen isotopic composition of Globorotalia truncatuli-
GeochemistryGeophysicsGeosystems G3G3
clEroux et al.: temperature from foraminifera 10.1029/2006GC001474
18 of 19
noides as a proxy for intermediate depth density, Paleocea-nography, 19, PA4025, doi:10.1029/2004PA001045.
Liu, Z., and S. G. H. Philander (2001), Tropical-extratropicaloceanic exchange pathways, in Ocean Circulation and Cli-mate: Observing and Modeling the Global Ocean, pp. 247–257, Elsevier, New York.
Martin, P. A., D. W. Lea, Y. Rosenthal, N. J. Shackleton,M. Sarnthein, and T. Papenfuss (2002), Quaternary deepsea temperature histories derived from benthic foraminif-eral Mg/Ca, Earth Planet. Sci. Lett., 198, 193–209.
Martinez, P., P. Bertrand, G. B. Shimmield, K. Cochrane, F. J.Jorissen, J. Foster, and M. Dignan (1999), Upwelling inten-sity and ocean productivity changes off Cape Blanc (north-west Africa) during the last 70,000 years: Geochemical andmicropalaeontological evidence, Mar. geol., 158, 57–74.
McKenna, V. S., and W. L. Prell (2004), Calibration of theMg/Ca of Globorotalia truncatulinoides (R) for the recon-struction of marine temperature gradients, Paleoceanogra-phy, 19, PA2006, doi:10.1029/2000PA000604.
Mortyn, P. G., and C. D. Charles (2003), Planktonic forami-niferal depth habitat and d18O calibrations: Plankton towresults from the Atlantic sector of the Southern Ocean,Paleoceanography, 18(2), 1037, doi:10.1029/2001PA000637.
Mulitza, S., A. Durkoop, W. Hale, G. Wefer, and H. S. Niebler(1997), Planktonic foraminifera as recorders of past surface-water stratification, Geology, 25(4), 335–338.
Mulitza, S., H. W. Arz, Mucke, C. Moos, H. S. Niebler,J. Patzold, and M. Segl (1999), The south Atlantic carbonisotope record of planktic foraminifera, in Use of Proxies inPaleoceanography: Examples From the South Atlantic,edited by G. Fisher and G. Wefer, pp. 427–445, Springer,New York.
Niebler, H. S., H. W. Hubberten, and R. Gersonde (1999),Oxygen isotope values of planktic foraminifera: a tool forthe reconstruction of surface water stratification, in Use ofProxies in Paleoceanography: Examples From the SouthAtlantic, edited by G. Fisher and G. Wefer, pp. 165–189,Springer, New York.
Ostermann, D. R., and W. B. Curry (2000), Calibration ofstable isotopic data: An enriched d18O standard used forsource gas mixing detection and correction, Paleoceanogra-phy, 15(3), 353–360.
Ottens, J. (1992), April and August northeast Atlantic surfacewater masses reflected in planktic foraminifera, Neth. J. SeaRes., 28(4), 261–283.
Prell, W. L. (1985), The stability of low-latitude sea-surfacetemperatures: An evaluation of the CLIMAP reconstructionwith emphasis on the positive SST anomalies, U. S. Dept. ofEnergy, Washington, D. C.
Ravelo, A. C., and R. G. Fairbanks (1990), Reconstructingtropical Atlantic hydrography using planktonic foraminiferaand an ocean model, Paleoceanography, 5(3), 409–431.
Ravelo, A. C., and R. G. Fairbanks (1992), Oxygen isotopiccomposition of multiple species of planktonic foraminifera:Recorders of the modern photic zone temperature gradient,Paleoceanography, 7(6), 815–831.
Sarmiento, J. L., N. Gruber, M. A. Brzezinski, and J. P. Dunne(2004), High-latitude controls of the thermocline nutrientsand low latitude biological productivity, Nature, 427, 56–60.
Sarnthein, M., K. Winn, S. Jung, J.-C. Duplessy, L. Labeyrie,H. Erlenkeuser, and G. Ganssen (1994), Changes in eastAtlantic deepwater circulation over the last 30,000 years:Eight time slice reconstructions, Paleoceanography, 9(6),209–267.
Schrag, D. P., and B. K. Linsley (2002), Corals, chemistry, andclimate, Science, 296, 277–278.
Shackleton, N. J. (1974), Attainment of isotopic equilibriumbetween ocean water and benthonic foraminifera genus Uvi-gerina: isotopic changes in the ocean during the last glacial,in Les Methodes Quantitatives d’Etude des Variations duClimat au Cours du Pleistocene, pp. 203–209, Cent. Natl.de la Rech. Sci., Gif sur Yvette, France.
Streeter, S. S., and N. J. Shackleton (1979), Paleocirculation ofthe deep North Atlantic: 150,000-year record of benthic for-aminifera and oxygen-18, Science, 203, 168–170.
Wang, L., M. Sarnthein, J.-C. Duplessy, H. Erlenkeuser,S. Jung, and U. Pflaumann (1995), Paleo sea surface sali-nities in the low-latitude Atlantic: The d18O record ofGlobigerinoides ruber (white), Paleoceanography, 10(4),749–761.
Wilke, I., T. Bickert, and F. J. C. Peeters (2006), The influenceof seawater carbonate ion concentration [CO3
2�] on the stablecarbon isotope composition of the planktic foraminifera spe-cies Globorotalia inflata, Mar. Micropaleontol., 58, 243–258.
Zahn, R. (1986), Spatquartare Entwicklung von Kustenauftriebund Tiefenwasserzirkulation in Nordost-Atlantik. Rekon-struktion anhand stabiler Isotope kalkschaliger Foraminife-ren, Ph.D. thesis, Univ. of Kiel, Kiel, Germany.
Zahn, R., and M. Sarnthein (1987), Benthic isotope evidencefor changes of the Mediterranean outflow during the latequaternary, Paleoceanography, 2(6), 543–559.
GeochemistryGeophysicsGeosystems G3G3
clEroux et al.: temperature from foraminifera 10.1029/2006GC001474
19 of 19