Embed Size (px)
Citation preview

Deep Dive in Total Renewables businessFebruary 2021

Deep Dive in Total Renewables business |
Gross capacity end-2020
Deep Dive in Total Renewables business
1
Fixed bottom in UK (JVs)
Floating offshore in South Korea, UK and France (JVs)
Offshore Wind100%
- GW
Total Quadran100%
Solar and onshore wind in France
1 GW
Total EREN30%
Solar and onshore wind worldwide
Option to acquire 100% in 2023
1.9 GW
Total Solar International
100%
Solar in Europe, US and Middle East
50/50 JV with AGEL in India
3.3 GW
Total Distributed generation
100%
Global business 100% except JV (50/50) with Envision for China
SunPower (52% stake) in US
0.8 GW
Adani Green Energy Ltd
20%
Solar and wind in India
- GW
Priority to developing utility scale portfolio

Deep Dive in Total Renewables business |
Renewables delivering predictable long-term cash flow
2
All figures at 05/02/2021
~60% of portfolio (>20 GW) already covered by PPA
In operation
Offtaker: > 95% state
7 GWNet : 3.1
Average remaining duration
~18 years
In construction
Offtaker: 99% state
5 GWNet : 3
Average duration
21 years
In development to 2025
Offtaker: ~60% state,
~40% corporate
23 GWNet : 21
Average duration
20 years
In development post-2025
4 GWNet : 2
Offshore wind PPAs under negotiation
Covered by PPACovered by PPA
Already 40%Covered by PPA
90%Covered by PPA
> 99%

Deep Dive in Total Renewables business |
7 GW in Operation
3
Producing ~6 TWh/y of electricity
By developerGW
By technologyGW gross
By geographyGW gross
* Group share
80%solar
20%wind India
South America
France
Middle East
AsiaOceania
North America
Africa
Gross Net*
Total Solar Int. 3.3 1.6
Total Quadran 1.0 0.7
Total EREN 1.9 0.5
Total Solar DG 0.8 0.3
Total 7.0 3.1
~4.5 years average asset age18 years remaining PPA duration at average PPA price > 110 $/MWh
Rest of Europe
Deep Dive in Total Renewables business |
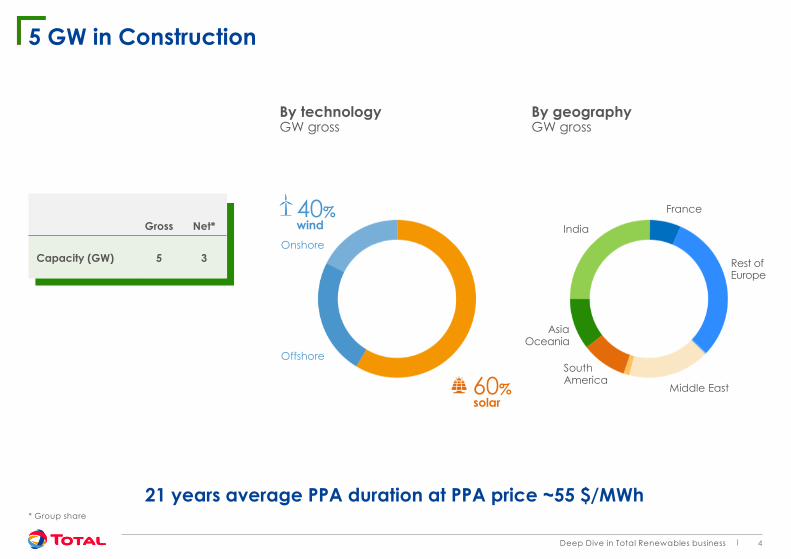
5 GW in Construction
4
By technologyGW gross
By geographyGW gross
* Group share
India
South America
Rest of Europe
France
AsiaOceania
Middle East
Offshore
Onshore
21 years average PPA duration at PPA price ~55 $/MWh
40%windGross Net*
Capacity (GW) 5 3
60%solar

Deep Dive in Total Renewables business |
2025 pipeline > 20 GW
5
Targeting > 10% equity IRR
By technologyGW gross
By geographyGW gross
* Group share, pre-farm-down
India
North America
Rest of Europe
France
Asia/Oceania
Onshore
Offshore
Spain
South America
9 GW under PPA20 years average PPA duration at PPA price ~45 $/MWh
10%wind
Gross Net*
Capacity (GW) 23 21
90%solar

Deep Dive in Total Renewables business |
> 20 GW covered by PPA
6
Gross capacity covered by PPA (GW)
Europe
Asia
North America
RoW
Total
In operationOnshore
Wind Solar Total
1.3 0.5 1.8
x 4.1 4.2
x 0.6 0.6
x 0.3 0.4
1.4 5.6 7.0
In constructionOnshore
WindOffshore
Wind Solar Total
0.3 0.8 0.3 1.4
0.3 - 2.1 2.4
x - x 0.1
0.3 - 0.2 0.5
0.9 0.8 2.7 4.4
PPA price ($/MWh)
Europe
Asia
North America
RoW
Total
In operationOnshore
Wind Solar Total
119 251 156
x 89 89
x 155 157
x 100 102
116 112 113
In constructionOnshore
WindOffshore
Wind Solar Total
79 61 63 64
50 - 45 46
x - - 147
52 - 45 50
64 61 47 54
x : not disclosed, capacity < 0.2 GW
In development to 2025Onshore
WindOffshore
Wind Solar Total
0.3 x 3.5 3.9
0.4 - 4.1 4.4
x - 0.5 0.6
x - 0.2 0.3
0.8 x 8.3 9.2
In development to 2025Onshore
WindOffshore
Wind Solar Total
72 x 43 48
34 - 40 40
x - 32 49
x - 95 126
65 x 42 45

Deep Dive in Total Renewables business |
4 GW offshore wind post-2025 pipeline
7
Up to 400 MWUK
Erebus/Valorous
First floating offshore wind
80% stake
Target FID 2024 (100 MW)
2020 2021
> 2,000 MWSouth Korea
Bada
Scaling up in floating
offshore wind
50% Total50% Macquarie (GIG)
Target FID 2023 (500 MW)
1.5 GWUK
Round 4 award
Scaling up in fixed bottom offshore wind
50% Total50% Macquarie (GIG)
Deep Dive in Total Renewables business |

Deep Dive in Total Renewables business |
Growing profitable power generation from Renewables
8
Renewables production (Group share)TWh
Renewables Proportional EBITDA (Group share)*B$
3 B$ Group share net debt **Targeting > 30 TWh by 2025
* Including proportional share of equity affiliates** At December 31, 2020
~7 TWh
4 TWh
Deep Dive in Total Renewables business |
2019 2020 2021 2019 2020 2021
4
0.5

Deep Dive in Total Renewables business |
DisclaimerThis document may contain forward-looking statements within the meaning of the Private Securities Litigation Reform Act of 1995, notably with respect to the financial condition, results of operations, business activities and industrial strategy of TOTAL. This document may also contain statements regarding the perspectives, objectives and goals of the Group, including with respect to climate change and carbon neutrality (net zero emissions). An ambition expresses an outcome desired by the Group, it being specified that the means to be deployed do not depend solely on TOTAL. These forward-looking statements may generally be identified by the use of the future or conditional tense or forward-looking words such as “envisions”, “intends”, “anticipates”, “believes”, “considers”, “plans”, “expects”, “thinks”, “targets”, “aims” or similar terminology. Such forward-looking statements included in this document are based on economic data, estimates and assumptions prepared in a given economic, competitive and regulatory environment and considered to be reasonable by the Group as of the date of this document.
These forward-looking statements are not historical data and should not be interpreted as assurances that the perspectives, objectives or goals announced will be achieved. They may prove to be inaccurate in the future, and may evolve or be modified with a significant difference between the actual results and those initially estimated, due to the uncertainties notably related to the economic, financial, competitive and regulatory environment, or due to the occurrence of risk factors, such as, notably, the price fluctuations in crude oil and natural gas, the evolution of the demand and price of petroleum products, the changes in production results and reserves estimates, the ability to achieve cost reductions and operating efficiencies without unduly disrupting business operations, changes in laws and regulations including those related to the environment and climate, currency fluctuations, as well as economic and political developments, changes in market conditions, loss of market share and changes in consumer preferences including those due to epidemics such as Covid-19. Additionally, certain financial information is based on estimates particularly in the assessment of the recoverable value of assets and potential impairments of assets relating thereto.
Neither TOTAL nor any of its subsidiaries assumes any obligation to update publicly any forward-looking information or statement, objectives or trends contained in this document whether as a result of new information, future events or otherwise. Further information on factors, risks and uncertainties that could affect the Group’s business, financial condition, including its operating income and cash flow, reputation or outlook is provided in the most recent version of the Universal Registration Document which is filed by the Company with the French Autorité des Marchés Financiers and the annual report on Form 20-F/A filed with the United States Securities and Exchange Commission (“SEC”).
Financial information by business segment is reported in accordance with the internal reporting system and shows internal segment information that is used to manage and measure the performance of TOTAL. In addition to IFRS measures, certain alternative performance indicators are presented, such as performance indicators excluding the adjustment items described below (adjusted operating income, adjusted net operating income, adjusted net income), return on equity (ROE), return on average capital employed (ROACE), gearing ratio and operating cash flow before working capital changes. These indicators are meant to facilitate the analysis of the financial performance of TOTAL and the comparison of income between periods. They allow investors to track the measures used internally to manage and measure the performance of the Group.
These adjustment items include:
(i) Special itemsDue to their unusual nature or particular significance, certain transactions qualified as "special items"are excluded from the business segment figures. In general, special items relate to transactions that are significant, infrequent or unusual.
However, in certain instances, transactions such as restructuring costs or asset disposals, which are not considered to be representative of the normal course of business, may be qualified as special items although they may have occurred within prior years or are likely to occur again within the coming years.
(ii) Inventory valuation effectThe adjusted results of the Refining & Chemicals and Marketing & Services segments are presented according to the replacement cost method. This method is used to assess the segments’ performance andfacilitate the comparability of the segments’ performance with those of its competitors.
In the replacement cost method, which approximates the LIFO (Last-In, First-Out) method, the variation of inventory values in the statement of income is, depending on the nature of the inventory, determined using either the month-end price differentials between one period and another or the average prices of the period rather than the historical value. The inventory valuation effect is the difference between the results according to the FIFO (First-In, First-Out) and the replacement cost.
(iii) Effect of changes in fair value The effect of changes in fair value presented as an adjustment item reflects for some transactions differences between internal measures of performance used by TOTAL’s management and the accountingfor these transactions under IFRS.
IFRS requires that trading inventories be recorded at their fair value using period-end spot prices. In order to best reflect the management of economic exposure through derivative transactions, internal indicators used to measure performance include valuations of trading inventories based on forward prices.
TOTAL, in its trading activities, enters into storage contracts, whose future effects are recorded at fair value in Group’s internal economic performance. IFRS precludes recognition of this fair value effect.
Furthermore, TOTAL enters into derivative instruments to risk manage certain operational contracts or assets. Under IFRS, these derivatives are recorded at fair value while the underlying operational transactions are recorded as they occur. Internal indicators defer the fair value on derivatives to match with the transaction occurrence.
The adjusted results (adjusted operating income, adjusted net operating income, adjusted net income) are defined as replacement cost results, adjusted for special items, excluding the effect of changes in fair value.
Euro amounts presented herein represent dollar amounts converted at the average euro-dollar (€-$) exchange rate for the applicable period and are not the result of financial statements prepared in euros.
This document also contains extra-financial performance indicators, including a carbon intensity indicator for energy products used by Total customers, that measures the average greenhouse gas emissions of those products, from their production to their end use, per unit of energy. This indicator covers the direct GHG emissions of production and processing facilities (scope 1) and their indirect emissions associated with energy purchase (Scope 2), as well as the emissions associated with the use of products by the customers of the Group (Scope 3) which Total does not control (for the definitions of scopes 1, 2 and 3, refer to Total’s Universal Registration Document).
This document does not constitute an offer to sell or the solicitation of an offer to buy securities in any jurisdiction. The securities offered in any potential capital markets transaction will be made by means of a prospectus.
Cautionary Note to U.S. Investors – The SEC permits oil and gas companies, in their filings with the SEC, to separately disclose proved, probable and possible reserves that a company has determined in accordance with SEC rules. We may use certain terms in this presentation, such as “potential reserves” or “resources”, that the SEC’s guidelines strictly prohibit us from including in filings with the SEC. U.S. investors are urged to consider closely the disclosure in our Form 20-F/A, File N° 1-10888, available from us at 2, place Jean Millier –Arche Nord Coupole/Regnault – 92078 Paris-La Défense Cedex, France, or at our website total.com. You can also obtain this form from the SEC by calling 1-800-SEC-0330 or on the SEC’s website sec.gov.

For more information, please visit
total.com
TOTAL S.E.Investor Relations10 Upper Bank Street, Canary WharfLondon E14 5BFUnited KingdomShare capital: 6,632,810,062.50 euros542 051 180 RCS Nanterretotal.com
Reception: +33 (0)1 47 44 45 46
Investor Relations: +44 (0)207 719 7962