Embed Size (px)
Citation preview
Using Data to Drive
Standards-based Instruction
Deep Dive #1
Special Board Session
September 21, 2010

Session Goals
• Review the ‘Using Data’ strategy within thecontext of our strategic roadmap
• Highlight current tools to support data-basedinstructional decision making strategy
• Take a deep dive into one of the Board goals
– 8th grade Algebra

3

4

5

6
Strategy: Using Data to Drive
Standards-Based Instruction
Use data to drive standards-based,
effective instruction for all students,
coupled with support and intervention,
when students need extra assistance or
accelerated learning.
Definition
Three Cultures that Need to Change
• From Excuse to Accountability
• From Compliance to Performance
• From Uniformity to Differentiation Based
on Talent and Need

• Eligibility focus– Diagnose and Place– Get label
• Outcome focus– Problem Solving– Response to
Instruction & Intervention
– Get help

If We’re Honest With Ourselves
• What we have been doing has not been
predictably effective for ALL of our kids
• If we want to become more effective, we can’t
do the same things harder, faster or longer
• We need to do different things that are more
effective

Basic Tenets of Educational Reform IncludeBasic Tenets of Educational Reform Include……
Standards
Assessment
Instruction
A C C O U N T A B I L I T Y A C C O U N T A B I L I T Y

Accountability Must
Be Reciprocal`
Meaning…
The system invests in capacity development
in return for more accountable
performance.

Common Language,
Common Understanding

Where are we now?
• Celebrate our growth!
• Goal = Proficiency for All
• Need to move students over the Goal line
• Accelerated vs. incremental growth


Change Model
Consensus
Infrastructure
Implementation

Infrastructure Tools
• MyData
• The Accountability Matrix
• Tiering of Schools
• Teaching & Learning Framework
– Lesson Design
• Instructional Reviews
• New Assessment System
• Teacher and Administrator evaluation system
17

Elementary
18

19
Elementary

Middle School
20

High School
21
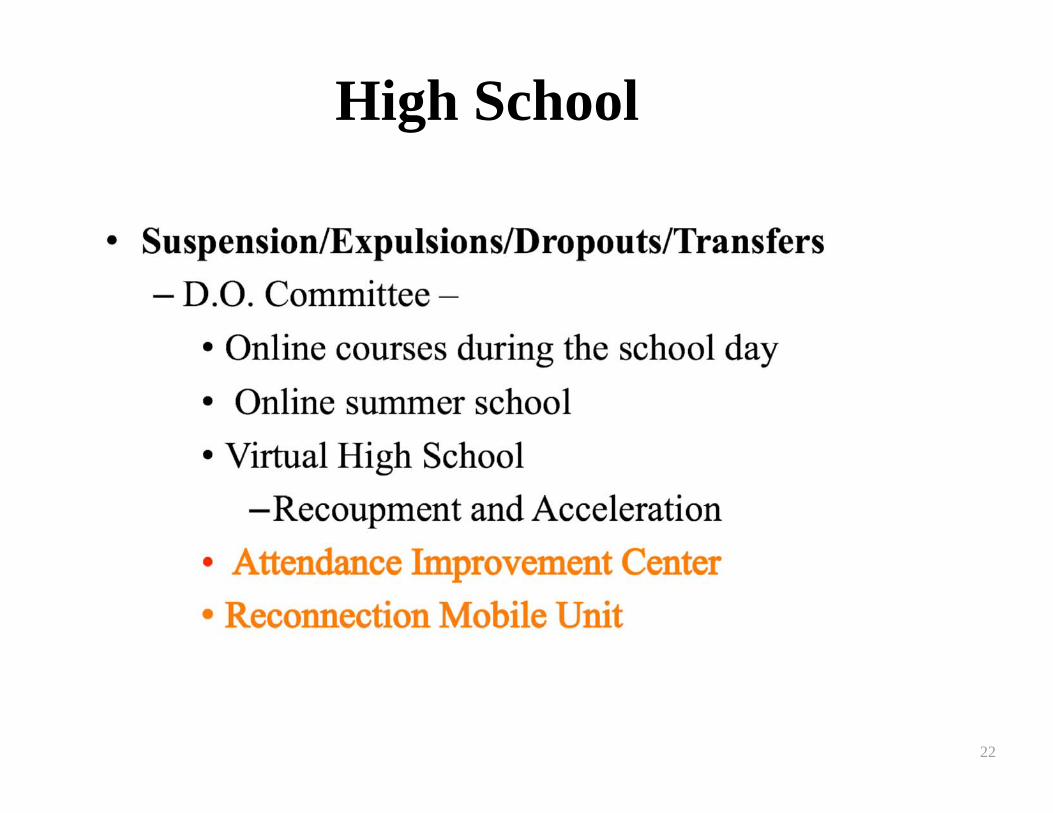
High School
22
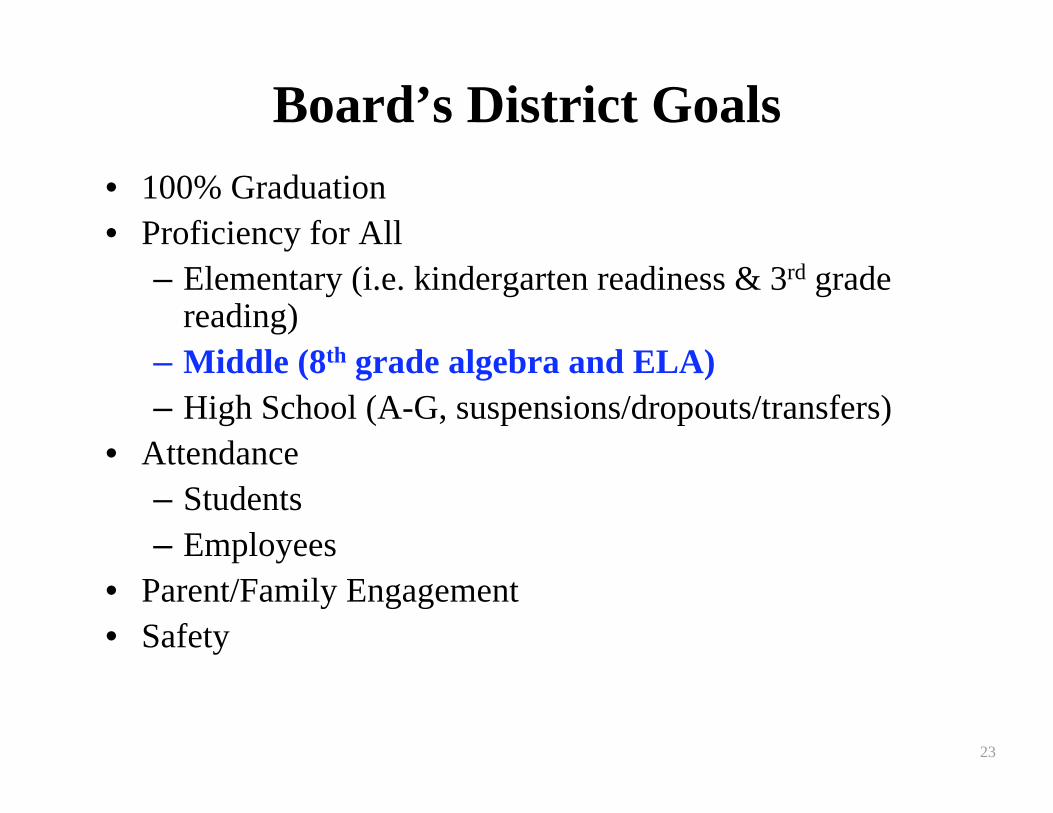
Board’s District Goals
• 100% Graduation
• Proficiency for All
– Elementary (i.e. kindergarten readiness & 3rd gradereading)
– Middle (8th grade algebra and ELA)
– High School (A-G, suspensions/dropouts/transfers)
• Attendance
– Students
– Employees
• Parent/Family Engagement
• Safety
23
24
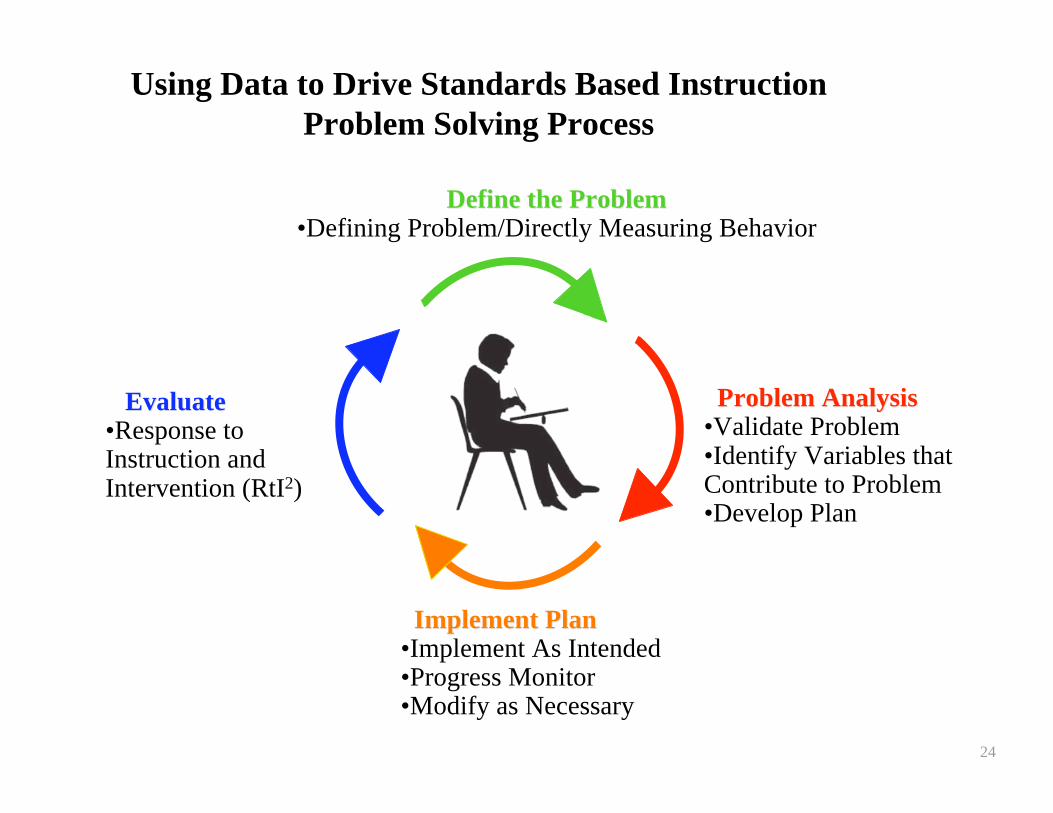
Using Data to Drive Standards Based Instruction
Problem Solving Process
EvaluateEvaluate•Response toInstruction andIntervention (RtI2)
Problem AnalysisProblem Analysis•Validate Problem•Identify Variables thatContribute to Problem•Develop Plan
Define the ProblemDefine the Problem•Defining Problem/Directly Measuring Behavior
Implement PlanImplement Plan•Implement As Intended•Progress Monitor•Modify as Necessary

Identify the Problem:
Proficiency in Algebra
13%
27%
31%
43%
24%
19%23%
10%9%1%
0%
10%
20%
30%
40%
50%
60%
70%
80%
90%
100%
Grade 8 Grade 9
% Advanced
% Proficient
% Basic
% Below Basic
% Far Below Basic
In 2009-10:
• 31% of 8th Graders were Proficient or Above
•11% of 9th Graders were Proficient or Above
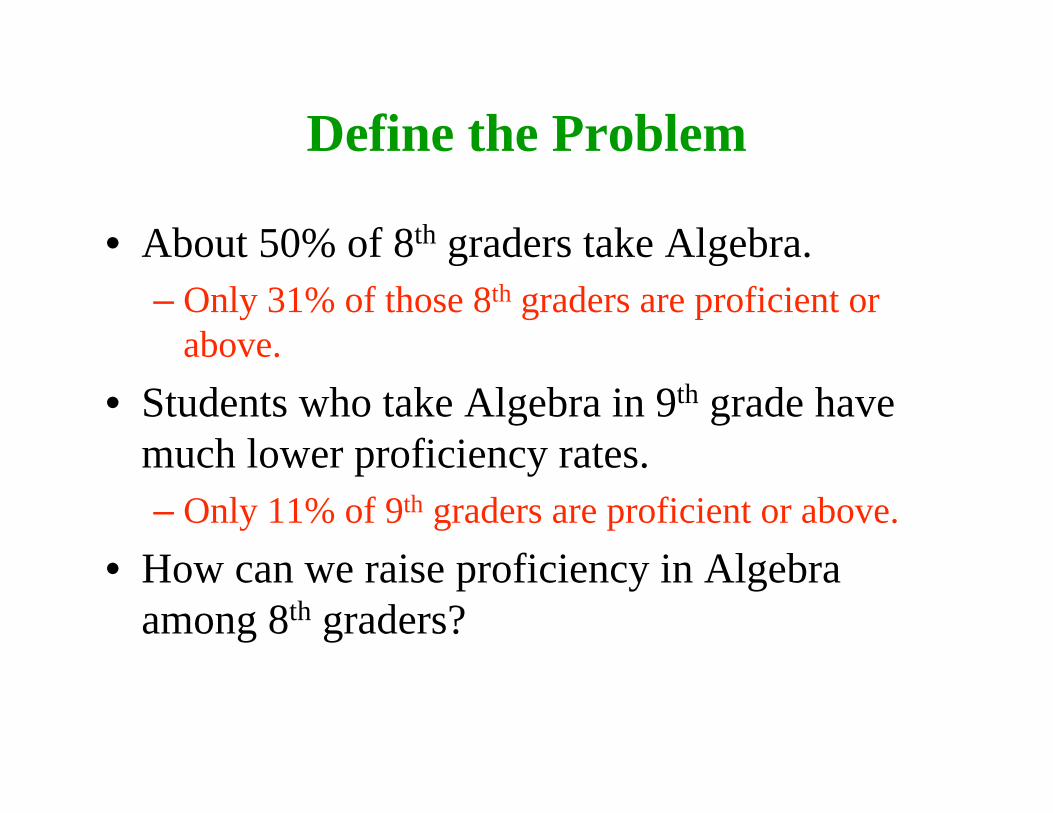
Define the Problem
• About 50% of 8th graders take Algebra.
– Only 31% of those 8th graders are proficient or
above.
• Students who take Algebra in 9th grade have
much lower proficiency rates.
– Only 11% of 9th graders are proficient or above.
• How can we raise proficiency in Algebra
among 8th graders?

Problem Analysis
Are we teaching the Algebra I contents
standards assessed by the CST?
What are the students’ areas of strengths and
deficits as they begin Algebra I?
What is the impact of earlier math instruction?
What does the math pedagogy look like, sound
like?
How is student progress monitored?

Problem Analysis
Are we teaching the Algebra I content
standards assessed by the CST?
What are the students’ areas of strengths and
deficits as they begin Algebra I?
What is the impact of earlier math instruction?
What does the math pedagogy look like, sound
like?
How is student progress monitored?

What gets tested on the
Algebra I CST?
Algebra 1, CST Blueprints
Strand# of
Items%
Number Properties, Operations, & Linear
Equations17 26%
Graphing & Systems of Linear Equations 14 22%
Quadratics & Polynomials 21 32%
Functions & Rational Expressions 13 20%
Total Number of Items 65 100%

What Does it Take to Reach Proficiency on
the Algebra CST?
Grade 8 Algebra # Items
State –
Avg #
Minimally
Proficient
State –
Avg %
Minimally
Proficient
Total Number of Items 65
Number Properties,
Operations, & Linear
Equations 17 12 72%
Graphing & Systems of Linear
Equations 14 8 59%
Quadratics & Polynomials 21 12 56%
Functions & Rational
Expressions 13 6 44%

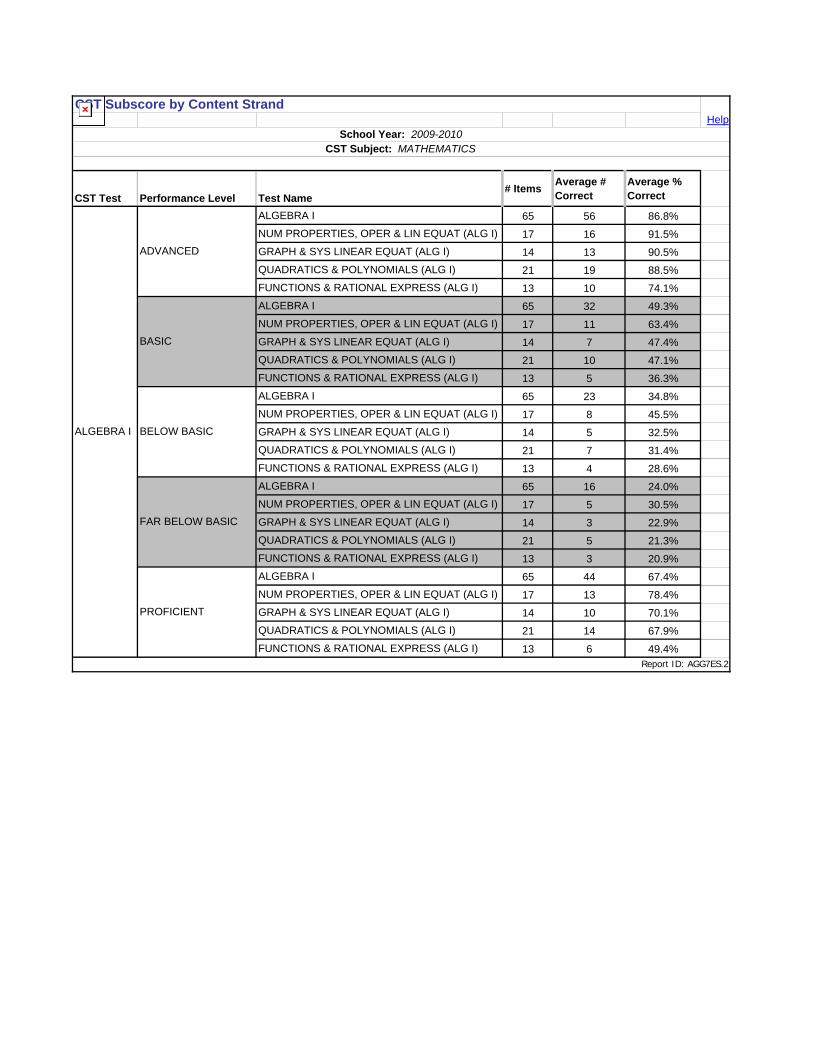
How Did Our Students Perform?From MyData, we can examine the content strands for Algebra for
each of the performance bands.
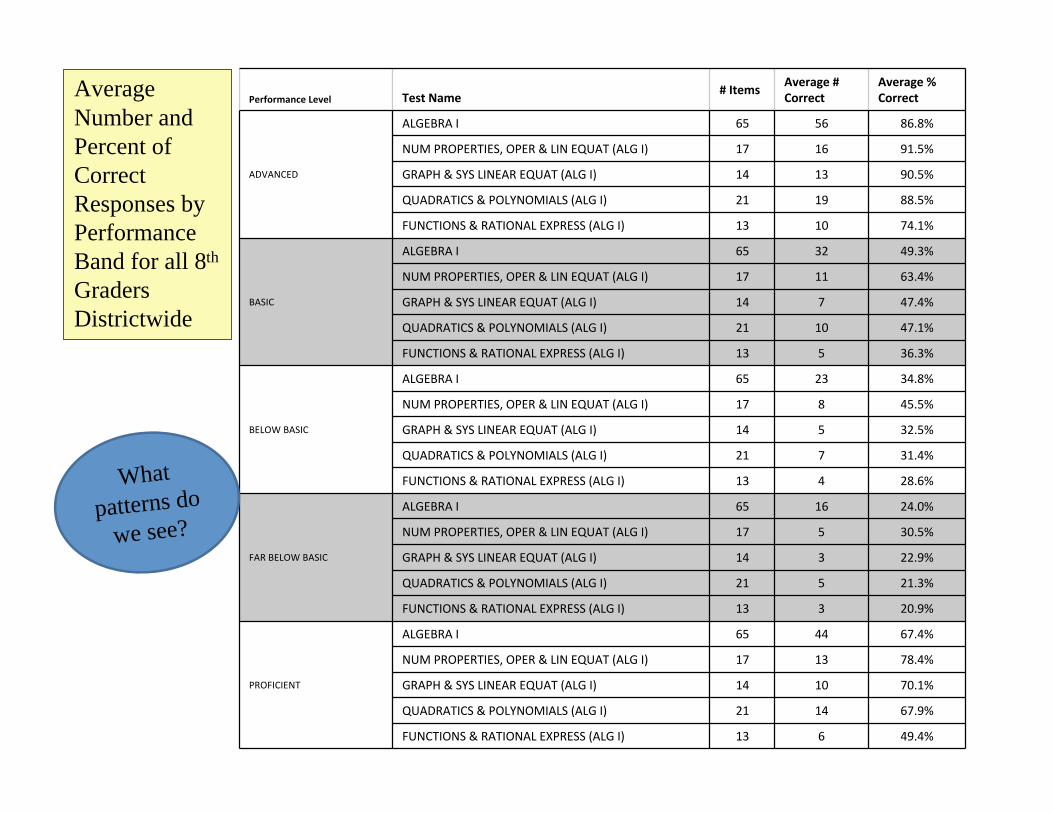
Average
Number and
Percent of
Correct
Responses by
Performance
Band for all 8th
Graders
Districtwide
What
patterns do
we see?

In every
performance
band,
Functions
and Rational
Expressions
have the
lowest
percentage
of correct
answers.
Performance Level Test Name# Items
Average #
Correc
t
Average %
Correct

What standards are covered in
Functions and Rational Expressions?
CA Standards Blueprints for Algebra

Examples of Functions and Rational
Expression Standards
• 13.0*-- Students add, subtract, multiply, and
divide rational expressions and functions.
Students solve both computationally and
conceptually challenging problems by using
these techniques.
• 15.0* --Students apply algebraic techniques to
solve rate problems, work problems, and
percent mixture problems.

What Do We Do With This Information?
• Classroom perspective:
– What methods did we use in teaching these concepts?
– Did we devote enough time to them?
– How do we check for understanding?
– Where are the areas of misunderstanding for students?
• School Level perspective:
– Is this pattern school-wide or in a few classrooms?
– Are teachers teaching these standards?
• Local District/Central Office perspective:
– How are we addressing this in professional development?
– Do we have tools to help teachers focus on these standards?

Develop and Implement Plan
• Classroom perspective:
– Examine data in real time, make adjustments, as necessary
– Tiered & differentiated intervention for struggling students
– Reinforce key standards
• School level perspective:
– Organize opportunities for teachers to share practices, examinestrengths and weaknesses across classrooms
– Create time for teachers to meet in grade level teams or departmentteams
– Guide collaborative teams and data dialogues
• Local District/Central Office level
– Plan for and encourage timely discussion of the data
– Create the infrastructure and tools for examining data

What Tools Are Available for Monitoring?
• Periodic assessments three times per year, aligned
with standards
• Progress monitoring assessments – short
assessments that can be created by teachers using
an item bank or short, pre-made assessments
aligned to standards
• End of Course Algebra I exam
• MyData rosters that combine multiple measures
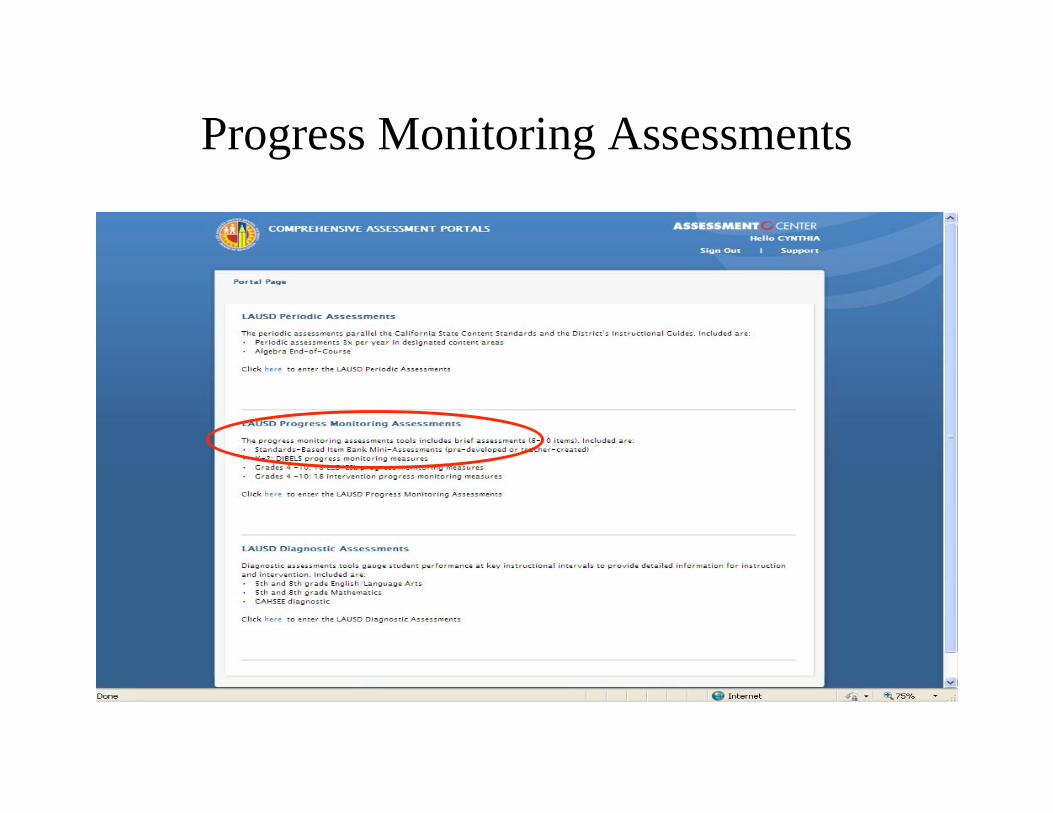
Progress Monitoring Assessments
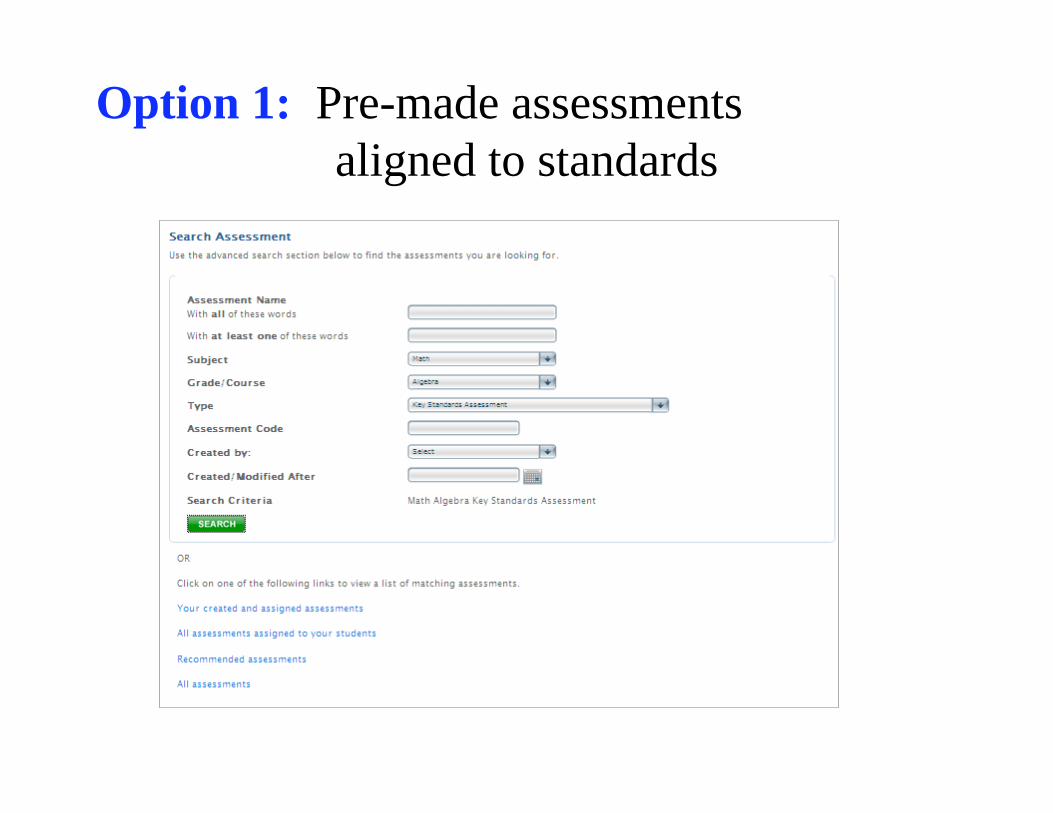
Option 1: Pre-made assessments
aligned to standards

Option 2: Create Your Own Assessment
from Item Bank

Teacher or Administrator Can Choose from List
of Algebra Standards

Choosing Standard 15.0: Students apply algebraic
techniques to solve rate problems, work problems, and
percent mixture problems.
The list
expandsEnter
the
number
of items
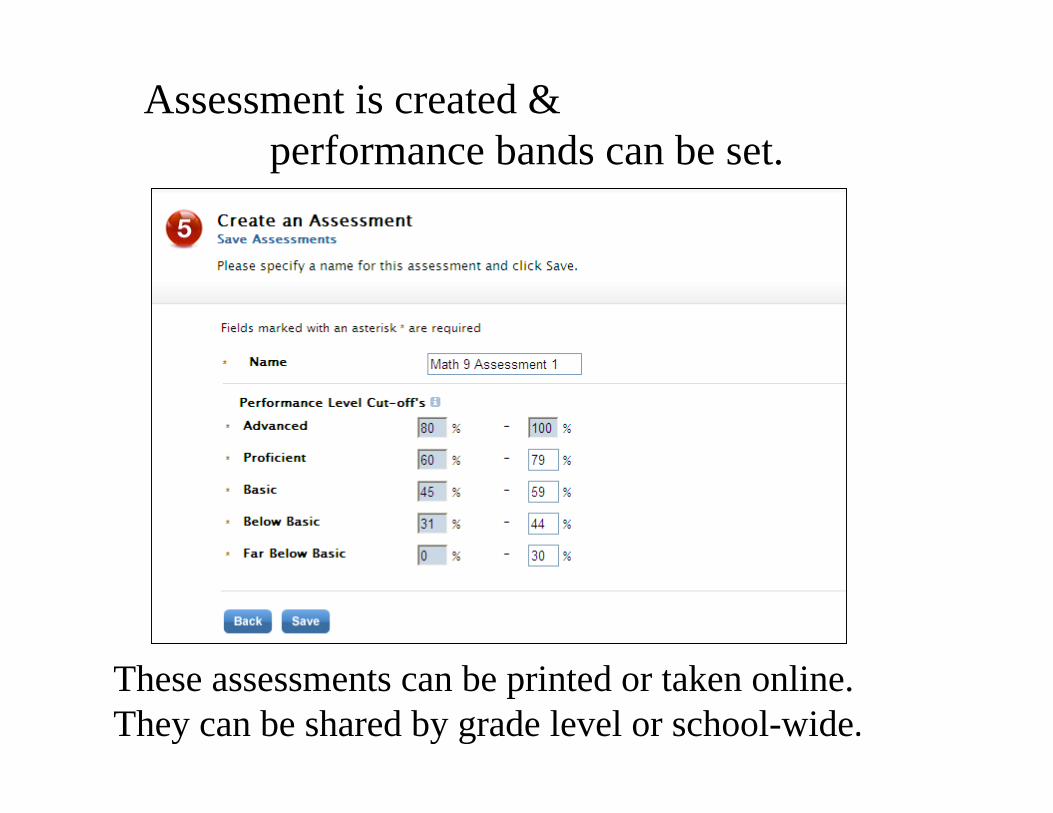
Assessment is created &
performance bands can be set.
These assessments can be printed or taken online.
They can be shared by grade level or school-wide

Sample question from Algebra Standard 15.0

A closer look at the thinking skills…

Another sample question on Algebra standard 15.0
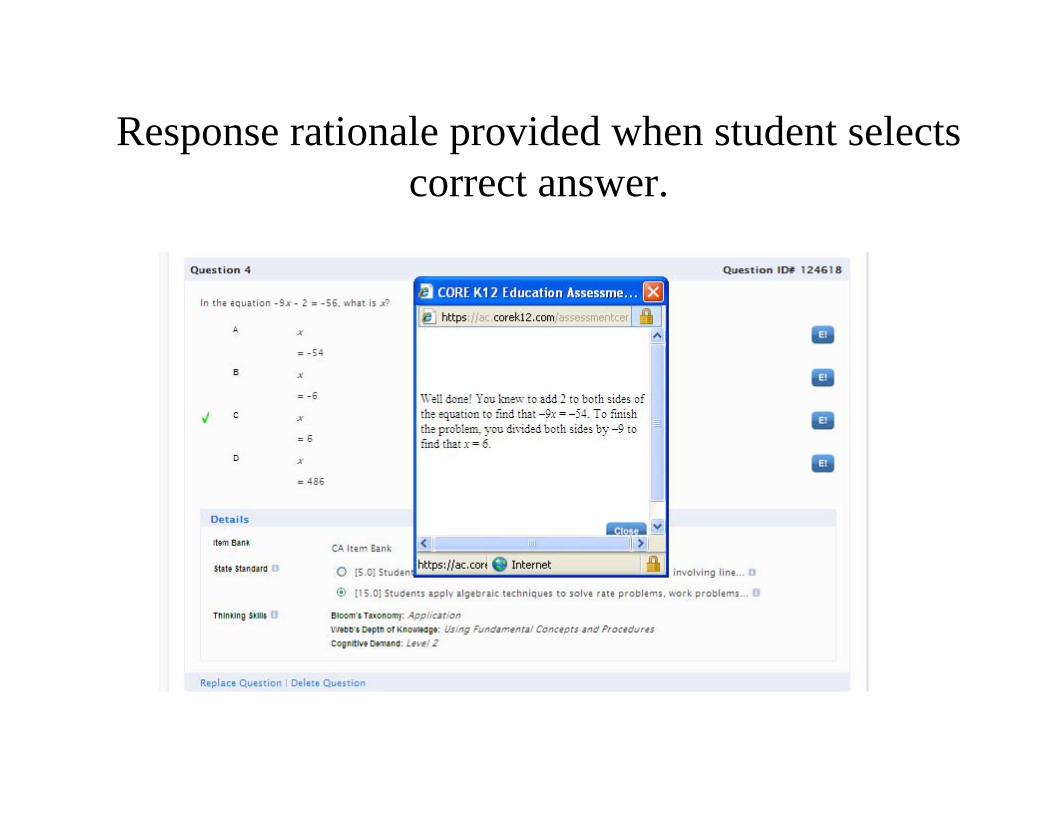
Response rationale provided when student selects
correct answer.
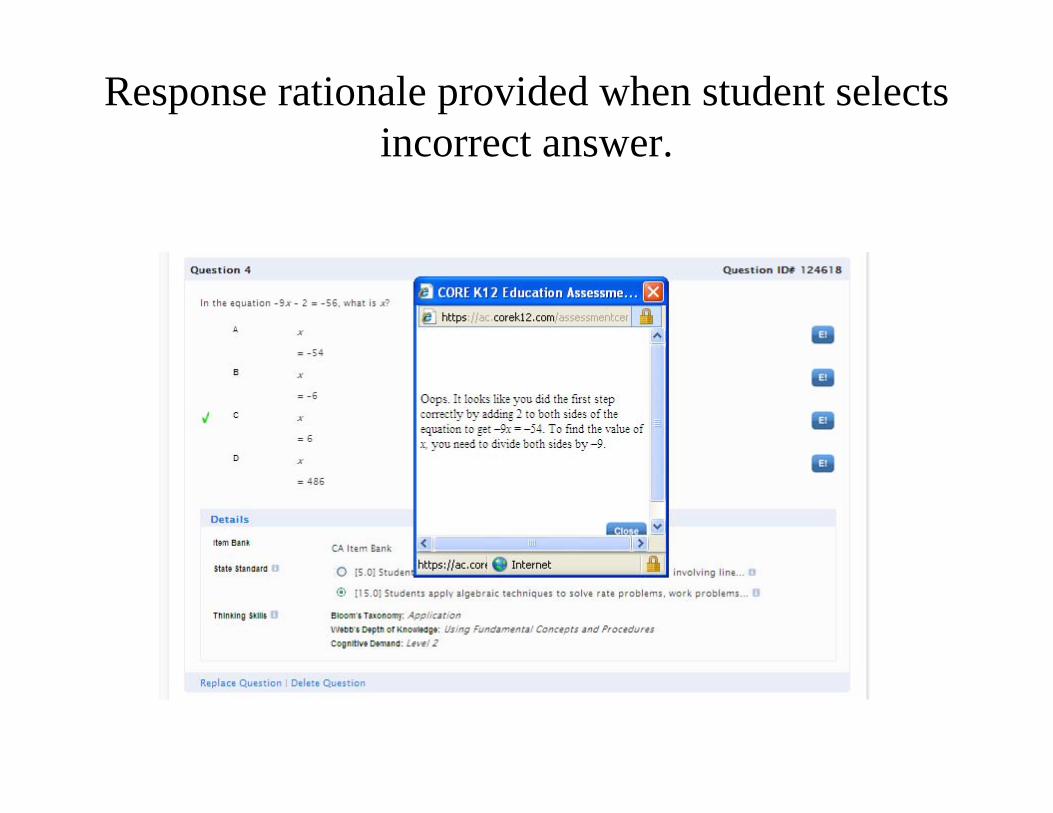
Response rationale provided when student selects
incorrect answer.
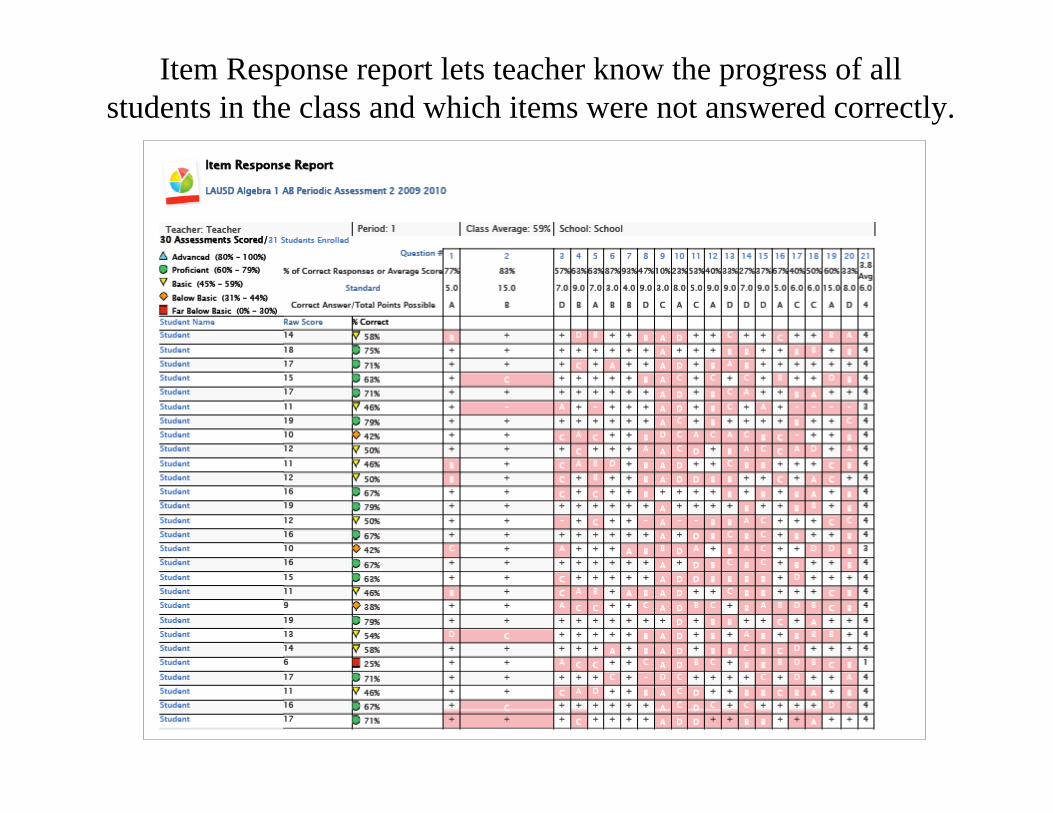
Item Response report lets teacher know the progress of all
students in the class and which items were not answered correctly.

Evaluate the Plan
What is the response to instruction &/or intervention?
• How will we monitor student progress?
– Periodic assessments
• What strands or standards are students struggling with ?
• Monitor/adjust instruction & opportunities for learning
and practice
– Progress monitoring assessments
– Department level discussions of student work and
progress
– End of course exam
• Did we increase proficiency on the CST?
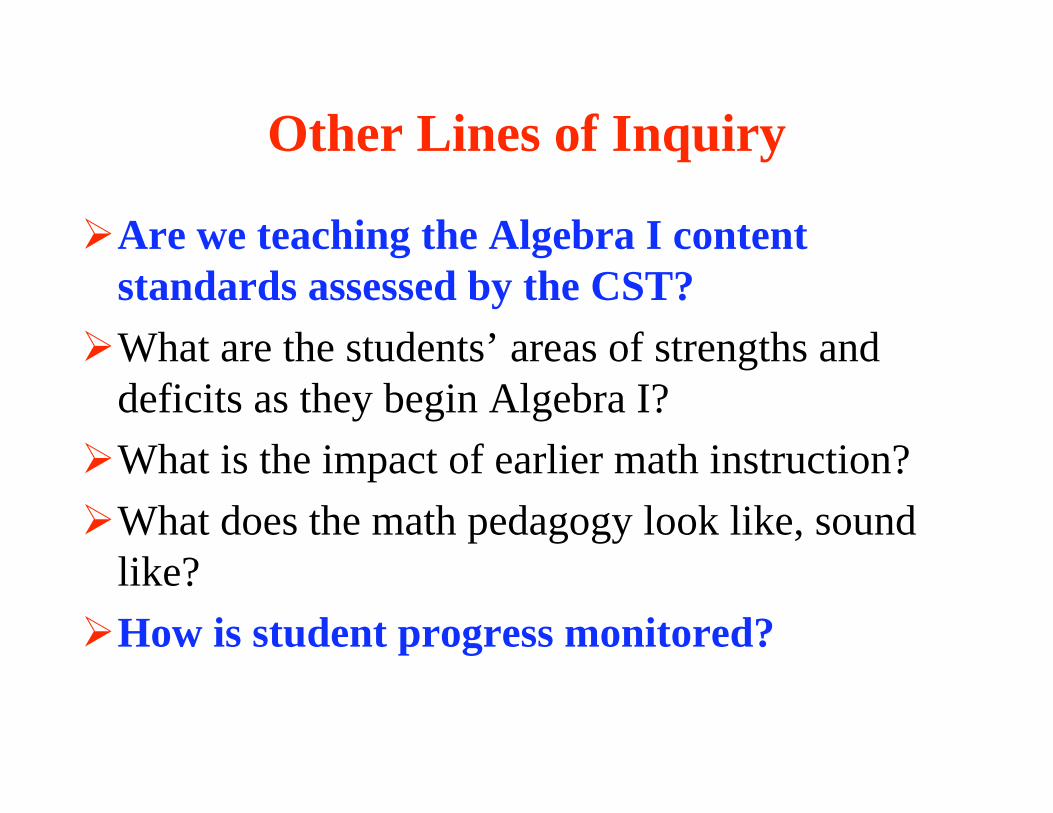
Other Lines of Inquiry
Are we teaching the Algebra I content
standards assessed by the CST?
What are the students’ areas of strengths and
deficits as they begin Algebra I?
What is the impact of earlier math instruction?
What does the math pedagogy look like, sound
like?
How is student progress monitored?

Using Data to Improve Outcomes
for Our Students
• Reallocate and realign resources and efforts
that are laser like in focus and outcome-based
• Guiding Professional Development
opportunities for teachers administrators
around instruction and behavior
54
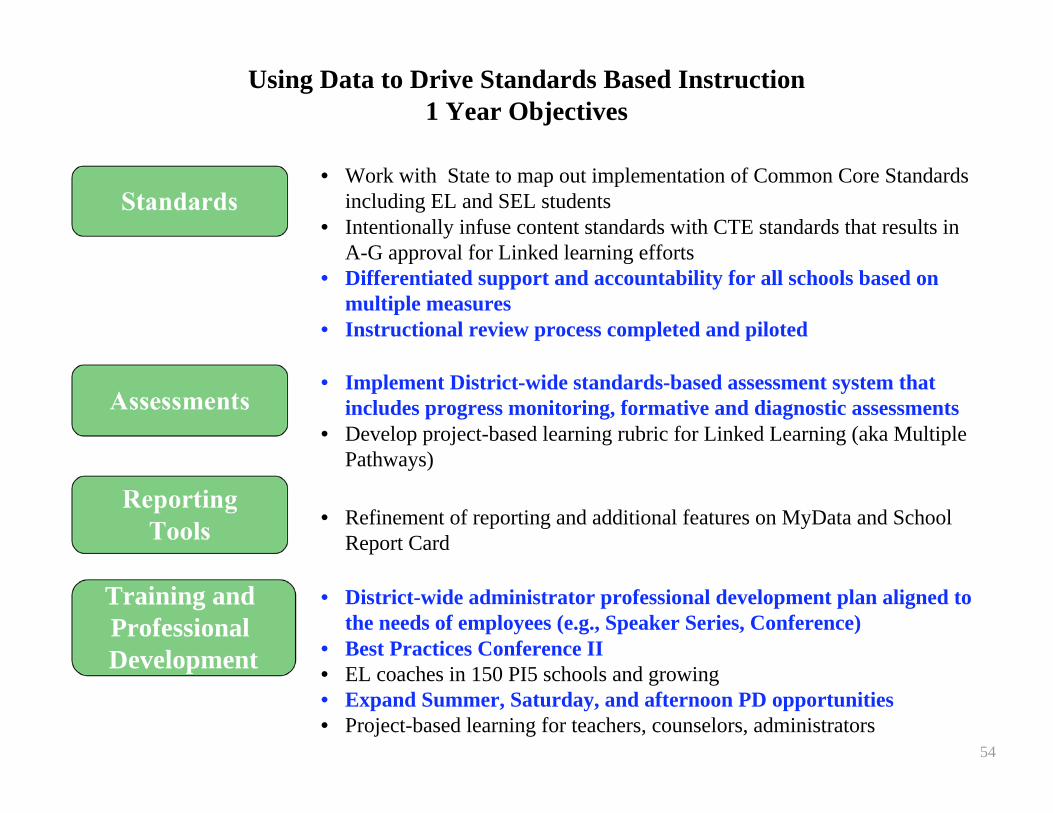
Using Data to Drive Standards Based Instruction
1 Year Objectives
• Work with State to map out implementation of Common Core Standards
including EL and SEL students
• Intentionally infuse content standards with CTE standards that results in
A-G approval for Linked learning efforts
• Differentiated support and accountability for all schools based on
multiple measures
• Instructional review process completed and piloted
Standards
• Implement District-wide standards-based assessment system that
includes progress monitoring, formative and diagnostic assessments
• Develop project-based learning rubric for Linked Learning (aka Multiple
Pathways)
Assessments
• Refinement of reporting and additional features on MyData and School
Report Card
Reporting
Tools
• District-wide administrator professional development plan aligned to
the needs of employees (e.g., Speaker Series, Conference)
• Best Practices Conference II
• EL coaches in 150 PI5 schools and growing
• Expand Summer, Saturday, and afternoon PD opportunities
• Project-based learning for teachers, counselors, administrators
Training and
Professional
Development
We are using data-based tools tountangle theGordian knot thatwill result inacceleratedachievement forall students!
Using Data to Drive Standards-based Instruction
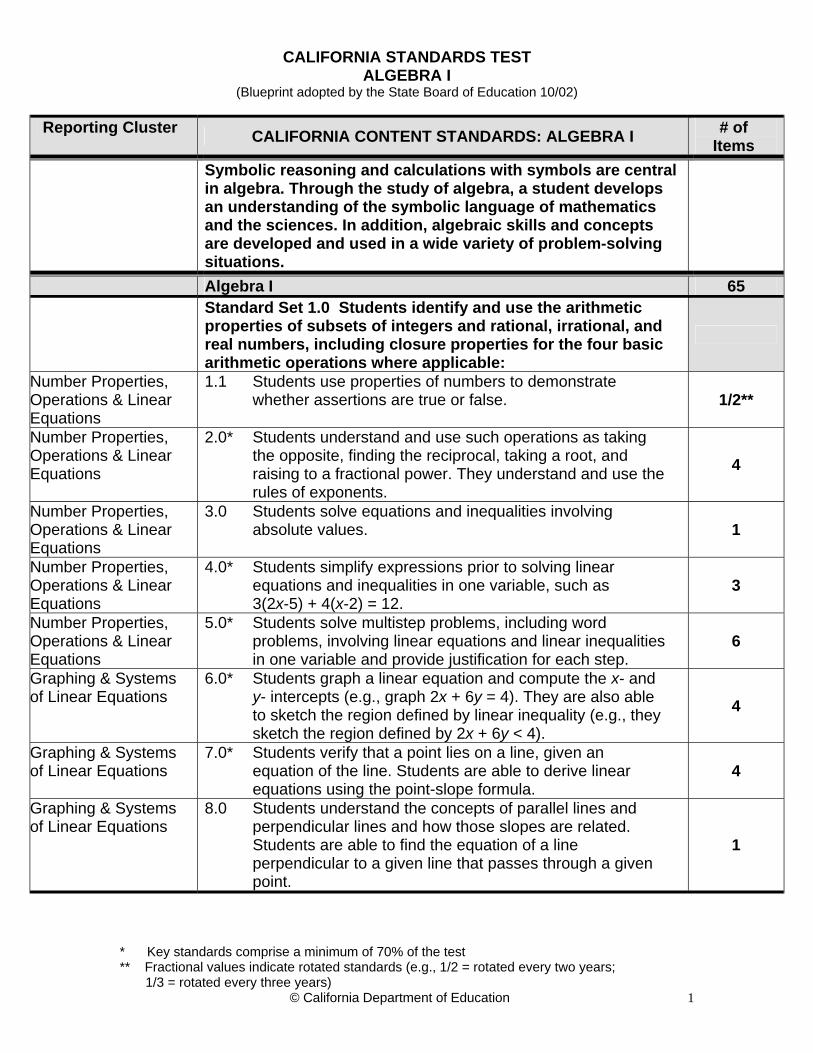
CALIFORNIA STANDARDS TEST ALGEBRA I
(Blueprint adopted by the State Board of Education 10/02)
* Key standards comprise a minimum of 70% of the test ** Fractional values indicate rotated standards (e.g., 1/2 = rotated every two years; 1/3 = rotated every three years) © California Department of Education 1
Reporting Cluster CALIFORNIA CONTENT STANDARDS: ALGEBRA I # of Items
Symbolic reasoning and calculations with symbols are central in algebra. Through the study of algebra, a student develops an understanding of the symbolic language of mathematics and the sciences. In addition, algebraic skills and concepts are developed and used in a wide variety of problem-solving situations.
Algebra I 65 Standard Set 1.0 Students identify and use the arithmetic properties of subsets of integers and rational, irrational, and real numbers, including closure properties for the four basic arithmetic operations where applicable:
Number Properties, Operations & Linear Equations
1.1 Students use properties of numbers to demonstrate whether assertions are true or false. 1/2**
Number Properties, Operations & Linear Equations
2.0* Students understand and use such operations as taking the opposite, finding the reciprocal, taking a root, and raising to a fractional power. They understand and use the rules of exponents.
4
Number Properties, Operations & Linear Equations
3.0 Students solve equations and inequalities involving absolute values. 1
Number Properties, Operations & Linear Equations
4.0* Students simplify expressions prior to solving linear equations and inequalities in one variable, such as
3(2x-5) + 4(x-2) = 12. 3
Number Properties, Operations & Linear Equations
5.0* Students solve multistep problems, including word problems, involving linear equations and linear inequalities in one variable and provide justification for each step.
6
Graphing & Systems of Linear Equations
6.0* Students graph a linear equation and compute the x- and y- intercepts (e.g., graph 2x + 6y = 4). They are also able to sketch the region defined by linear inequality (e.g., they sketch the region defined by 2x + 6y < 4).
4
Graphing & Systems of Linear Equations
7.0* Students verify that a point lies on a line, given an equation of the line. Students are able to derive linear equations using the point-slope formula.
4
Graphing & Systems of Linear Equations
8.0 Students understand the concepts of parallel lines and perpendicular lines and how those slopes are related. Students are able to find the equation of a line perpendicular to a given line that passes through a given point.
1

CALIFORNIA STANDARDS TEST ALGEBRA I
(Blueprint adopted by the State Board of Education 10/02)
* Key standards comprise a minimum of 70% of the test ** Fractional values indicate rotated standards (e.g., 1/2 = rotated every two years; 1/3 = rotated every three years) © California Department of Education 2
CALIFORNIA CONTENT STANDARDS: ALGEBRA I # of Items
Graphing & Systems of Linear Equations
9.0* Students solve a system of two linear equations in two variables algebraically and are able to interpret the answer graphically. Students are able to solve a system of two linear inequalities in two variables and to sketch the solution sets.
5
Quadratics & Polynomials
10.0* Students add, subtract, multiply, and divide monomials and polynomials. Students solve multistep problems, including word problems, by using these techniques.
4
Quadratics & Polynomials
11.0 Students apply basic factoring techniques to second-and simple third-degree polynomials. These techniques include finding a common factor for all terms in a polynomial, recognizing the difference of two squares, and recognizing perfect squares of binomials.
2
Functions & Rational Expressions
12.0* Students simplify fractions with polynomials in the numerator and denominator by factoring both and reducing them to the lowest terms.
3
Functions & Rational Expressions
13.0* Students add, subtract, multiply, and divide rational expressions and functions. Students solve both computationally and conceptually challenging problems by using these techniques.
4
Quadratics & Polynomials
14.0* Students solve a quadratic equation by factoring or completing the square. 3
Functions & Rational Expressions
15.0* Students apply algebraic techniques to solve rate problems, work problems, and percent mixture problems. 4
Functions & Rational Expressions
16.0 Students understand the concepts of a relation and a function, determine whether a given relation defines a function, and give pertinent information about given relations and functions.
1/2**
Functions & Rational Expressions
17.0 Students determine the domain of independent variables and the range of dependent variables defined by a graph, a set of ordered pairs, or a symbolic expression.
1
Functions & Rational Expressions
18.0 Students determine whether a relation defined by a graph, a set of ordered pairs, or a symbolic expression is a function and justify the conclusion.
1/2**
Quadratics & Polynomials
19.0* Students know the quadratic formula and are familiar with its proof by completing the square. 2
Quadratics & Polynomials
20.0* Students use the quadratic formula to find the roots of a second-degree polynomial and to solve quadratic equations.
3

CALIFORNIA STANDARDS TEST ALGEBRA I
(Blueprint adopted by the State Board of Education 10/02)
* Key standards comprise a minimum of 70% of the test ** Fractional values indicate rotated standards (e.g., 1/2 = rotated every two years; 1/3 = rotated every three years) © California Department of Education 3
CALIFORNIA CONTENT STANDARDS: ALGEBRA I # of Items
Quadratics & Polynomials
22.0 Students use the quadratic formula or factoring techniques or both to determine whether the graph of a quadratic function will intersect the x-axis in zero, one, or two points.
1
Quadratics & Polynomials
21.0* Students graph quadratic functions and know that their roots are the x-intercepts. 3
Quadratics & Polynomials
23.0* Students apply quadratic equations to physical problems, such as the motion of an object under the force of gravity. 3
Standard Set 24.0 Students use and know simple aspects of a logical argument:
Number Properties, Operations & Linear Equations
24.1 Students explain the difference between inductive and deductive reasoning and identify and provide examples of each.
1/3**
Number Properties, Operations & Linear Equations
24.2 Students identify the hypothesis and conclusion in logical deduction. 1/3**
Number Properties, Operations & Linear Equations
24.3 Students use counterexamples to show that an assertion is false and recognize that a single counterexample is sufficient to refute an assertion.
1/3**
Standard Set 25.0 Students use properties of the number system to judge the validity of results, to justify each step of a procedure, and to prove or disprove statements:
Number Properties, Operations & Linear Equations
25.1 Students use properties of numbers to construct simple, valid arguments (direct and indirect) for, or formulate counterexamples to, claimed assertions.
1/2**
Number Properties, Operations & Linear Equations
25.2 Students judge the validity of an argument according to whether the properties of the real number system and the order of operations have been applied correctly at each step.
1/2**
Number Properties, Operations & Linear Equations
25.3 Given a specific algebraic statement involving linear, quadratic, or absolute value expressions or equations or inequalities, students determine whether the statement is true sometimes, always, or never.
1/2**
ALGEBRA I TOTAL 65
CST Test Performance Level Test Name# Items Average #
CorrectAverage % Correct
ALGEBRA I 65 56 86.8%NUM PROPERTIES, OPER & LIN EQUAT (ALG I) 17 16 91.5%GRAPH & SYS LINEAR EQUAT (ALG I) 14 13 90.5%QUADRATICS & POLYNOMIALS (ALG I) 21 19 88.5%FUNCTIONS & RATIONAL EXPRESS (ALG I) 13 10 74.1%ALGEBRA I 65 32 49.3%NUM PROPERTIES, OPER & LIN EQUAT (ALG I) 17 11 63.4%GRAPH & SYS LINEAR EQUAT (ALG I) 14 7 47.4%QUADRATICS & POLYNOMIALS (ALG I) 21 10 47.1%FUNCTIONS & RATIONAL EXPRESS (ALG I) 13 5 36.3%ALGEBRA I 65 23 34.8%NUM PROPERTIES, OPER & LIN EQUAT (ALG I) 17 8 45.5%GRAPH & SYS LINEAR EQUAT (ALG I) 14 5 32.5%QUADRATICS & POLYNOMIALS (ALG I) 21 7 31.4%FUNCTIONS & RATIONAL EXPRESS (ALG I) 13 4 28.6%ALGEBRA I 65 16 24.0%NUM PROPERTIES, OPER & LIN EQUAT (ALG I) 17 5 30.5%GRAPH & SYS LINEAR EQUAT (ALG I) 14 3 22.9%QUADRATICS & POLYNOMIALS (ALG I) 21 5 21.3%FUNCTIONS & RATIONAL EXPRESS (ALG I) 13 3 20.9%ALGEBRA I 65 44 67.4%NUM PROPERTIES, OPER & LIN EQUAT (ALG I) 17 13 78.4%GRAPH & SYS LINEAR EQUAT (ALG I) 14 10 70.1%QUADRATICS & POLYNOMIALS (ALG I) 21 14 67.9%FUNCTIONS & RATIONAL EXPRESS (ALG I) 13 6 49.4%
CST Subscore by Content StrandHelp
Report ID: AGG7ES.2
School Year: 2009-2010CST Subject: MATHEMATICS
ALGEBRA I
ADVANCED
BASIC
BELOW BASIC
FAR BELOW BASIC
PROFICIENT