Embed Size (px)
Citation preview

Northwest Lantau
Deep Bay
Southeast Lantau Lamma Po Toi
Northeast Lantau
West Lantau
Figure 1. Nine Line-transect Survey Areas within the Study Area during 2013-14
Southwest Lantau
NinepinsHKLR09
HKLR03
HKBCF

Figure 2. Survey Route for Helicopter Surveys in Eastern and Southern Waters of Hong Kong
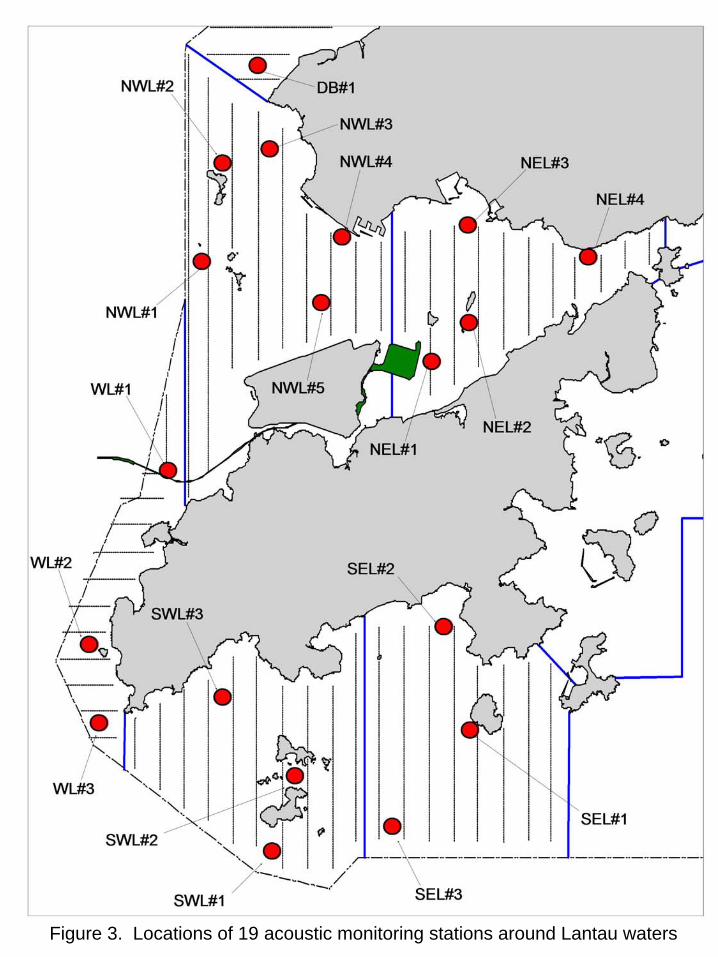
Figure 3. Locations of 19 acoustic monitoring stations around Lantau waters

Figure 4. Theodolite-tracking stations set up along the coastline in North and West Lantau waters

(a)
(b)
Figure 5. Temporal trends of (a) total number of identified individuals; (b) total number of re-sightings made; and (c) number of identified individuals within several categories of number of re-sightings in the past 12 monitoring periods since 2002
(c)
0
50
100
150
200
250
50 or more 30 or more 15 or more 10 or more
Number of Re-sightings
No
. of
Ide
nti
fie
d In
div
idu
als 2002/03
2003/04
2004/05
2005/06
2006/07
2007/08
2008/09
2009/10
2010/11
2011/12
2012/13
2013/14
0
1000
2000
3000
4000
5000
6000
7000
8000
9000
2002/03 2003/04 2004/05 2005/06 2006/07 2007/08 2008/09 2009/10 2010/11 2011/12 2012/13 2013/14
Monitoring Period
No
. o
f R
e-s
igh
tin
gs
285 296341 361
471507
655 679704
752
829 841
0
100
200
300
400
500
600
700
800
900
2002/03 2003/04 2004/05 2005/06 2006/07 2007/08 2008/09 2009/10 2010/11 2011/12 2012/13 2013/14
Monitoring Period
No
. of
Iden
tifi
ed In
div
idu
als

Figure 6. Distribution of Chinese white dolphin sightings made during AFCD surveys (April 2013 – March 2014)

Figure 7. Distribution of Chinese white dolphin sightings in Hong Kong waters in 2013 (pink dots: AFCD survey sightings; blue dots: HKLR survey sightings)
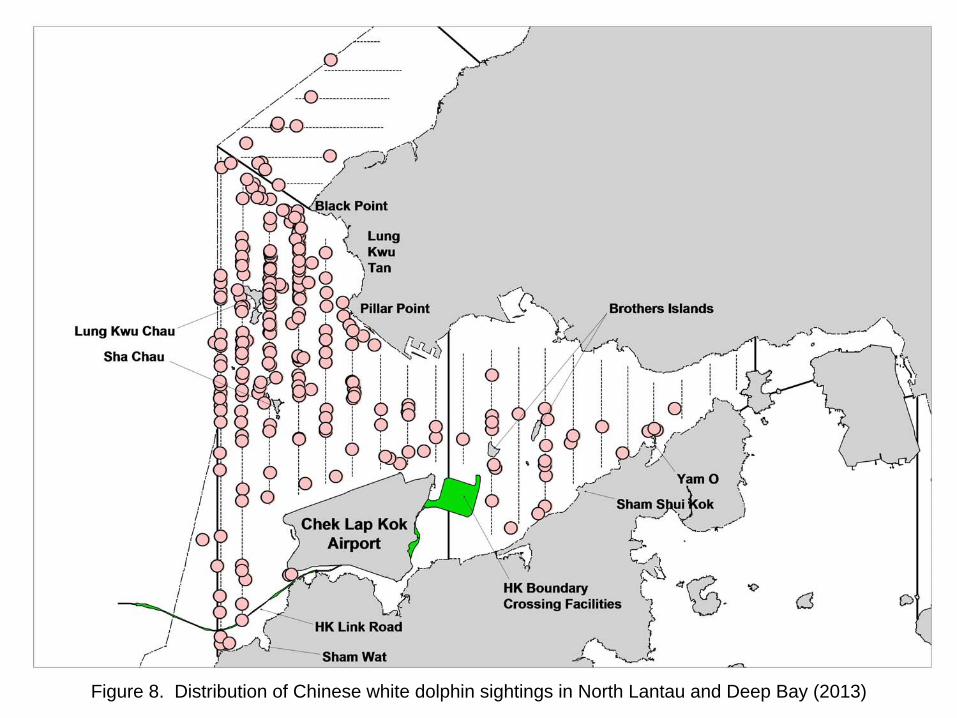
Figure 8. Distribution of Chinese white dolphin sightings in North Lantau and Deep Bay (2013)

Figure 9. Distribution of Chinese white dolphin sightings in West and Southwest Lantau waters (2013)
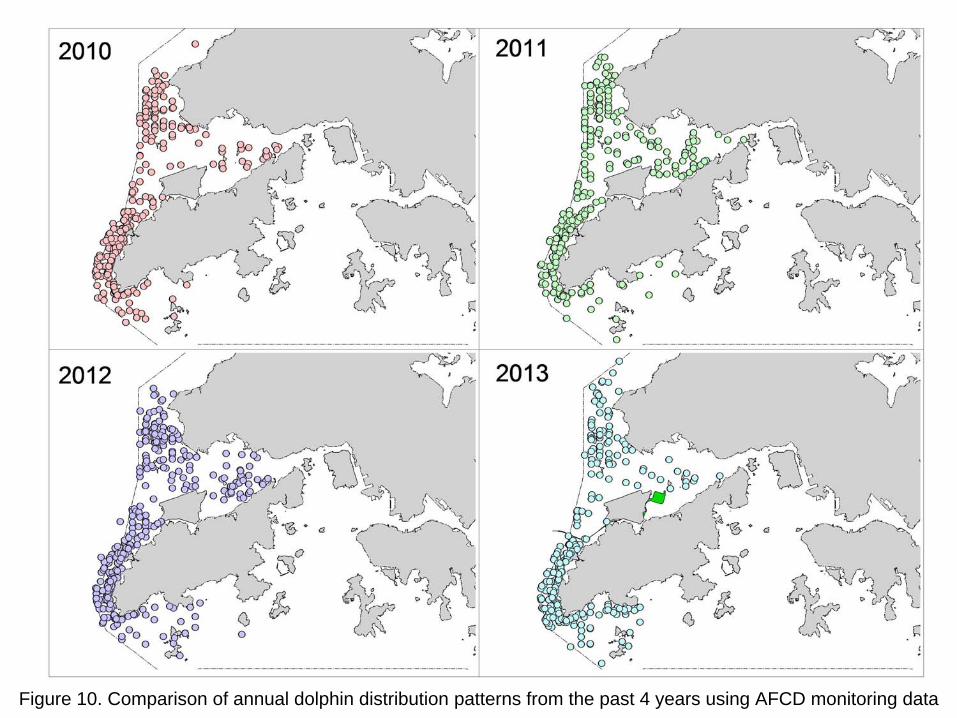
Figure 10. Comparison of annual dolphin distribution patterns from the past 4 years using AFCD monitoring data

Figure 11. Seasonal distribution of Chinese white dolphins in Hong Kong waters in 2013

Figure 12. Distribution of finless porpoise sightings made during AFCD surveys (April 2013 – March 2014) (yellow dots: sightings made during summer/autumn months)
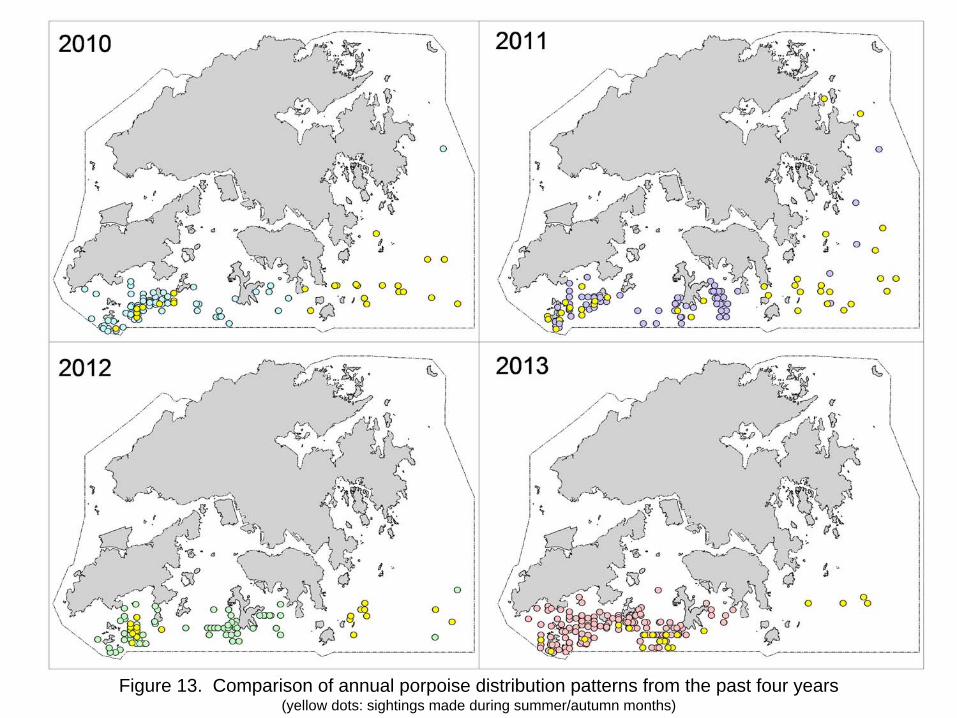
Figure 13. Comparison of annual porpoise distribution patterns from the past four years (yellow dots: sightings made during summer/autumn months)

8.6
10.8
8.27.8
6.9
9.9
7.2
6.36.8
7.77.3 7.2
0
2
4
6
8
10
12
2002-03 2003-04 2004-05 2005-06 2006-07 2007-08 2008-09 2009-10 2010-11 2011-12 2012-13 2013-14
Monitoring Period
En
cou
nte
r ra
te (
# o
f si
gh
tin
gs
per
100
km
)
Figure 14. Temporal trend in encounter rates of Chinese white dolphins (combined from WL, NWL, NEL and SWL survey areas) in the past twelve monitoring periods from 2002-14

Figure 15. Encounter rates of Chinese white dolphins among different survey areas (April 2013 – March 2014)
0.7
6.3
19.6
6.8
3.8
0
2
4
6
8
10
12
14
16
18
20
22
NE Lantau NW Lantau W Lantau SW Lantau Deep Bay
Survey Area
En
cou
nte
r ra
te (
# o
f si
gh
tin
gs
per
100
km
)

Figure 16. Long-term trends in annual dolphin encounter rates in different survey areas
9.4
12.3
9.38.4
8.08.8
8.07.3 7.3
8.4
7.1
8.5
0
2
4
6
8
10
12
14
2002 2003 2004 2005 2006 2007 2008 2009 2010 2011 2012 2013
Enc
ount
er r
ate
(# o
f sig
htin
gs p
er 1
00 k
m) Overall
12.8
19.818.1
16.1 15.6
12.7
10.511.2 10.8
9.310.3
13.6
0
5
10
15
20
25
2002 2003 2004 2005 2006 2007 2008 2009 2010 2011 2012 2013
Enc
ount
er r
ate
(# o
f sig
htin
gs p
er 1
00 k
m) W + SW Lantau
8.89.2
5.9
5.1 5.3
6.3
5.5
4.4 4.5
7.7
4.9
3.8
0
1
2
3
4
5
6
7
8
9
10
2002 2003 2004 2005 2006 2007 2008 2009 2010 2011 2012 2013
En
cou
nte
r ra
te (
# o
f si
gh
ting
s p
er
10
0 k
m) NE + NW Lantau

0
1
2
3
4
5
6
7
1st Quarter 2nd Quarter 3rd Quarter 4th Quarter
En
co
un
ter
rate
(#
of
sig
hti
ng
s p
er
10
0 k
m)
2011
2012
2013
0
2
4
6
8
10
1st Quarter 2nd Quarter 3rd Quarter 4th Quarter
En
co
un
ter
rate
(#
of
sig
hti
ng
s p
er
10
0 k
m)
2011
2012
2013
0
2
4
6
8
1st Quarter 2nd Quarter 3rd Quarter 4th Quarter
En
co
un
ter
rate
(#
of
sig
hti
ng
s p
er
10
0 k
m)
2011
2012
2003
NE Lantau
NE + NW Lantau
NW Lantau
Figure 17. Temporal trends in quarterly dolphin encounter rates in North Lantau region from 2011-13
HKBCF Reclamation Begins
HKLR03 Reclamation Begins
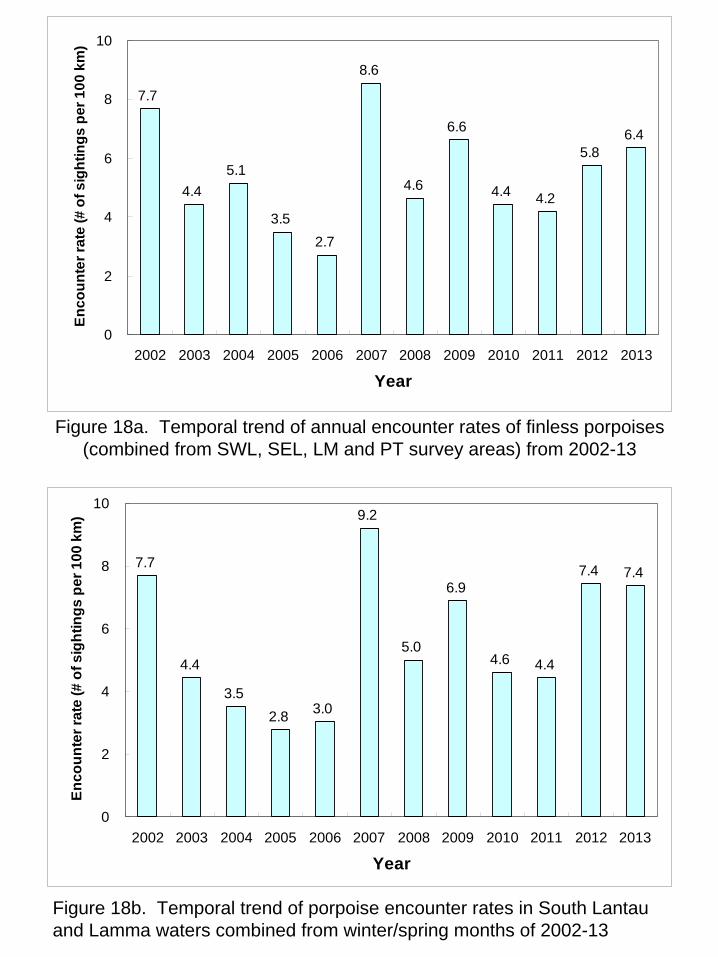
Figure 18a. Temporal trend of annual encounter rates of finless porpoises (combined from SWL, SEL, LM and PT survey areas) from 2002-13
7.7
4.4
5.1
3.5
2.7
8.6
4.6
6.6
4.4 4.2
5.86.4
0
2
4
6
8
10
2002 2003 2004 2005 2006 2007 2008 2009 2010 2011 2012 2013
Year
En
co
un
ter
rate
(#
of
sig
hti
ng
s p
er 1
00
km
)
7.7
4.4
3.5
2.83.0
9.2
5.0
6.9
4.6 4.4
7.4 7.4
0
2
4
6
8
10
2002 2003 2004 2005 2006 2007 2008 2009 2010 2011 2012 2013
Year
En
co
un
ter
rate
(#
of
sig
hti
ng
s p
er
10
0 k
m)
Figure 18b. Temporal trend of porpoise encounter rates in South Lantau and Lamma waters combined from winter/spring months of 2002-13

10.8
8.0
5.4 5.2
3.7
13.6
5.5
10.5
12.8
8.6
6.7
15.4
0
2
4
6
8
10
12
14
16
2002 2003 2004 2005 2006 2007 2008 2009 2010 2011 2012 2013
En
co
un
ter
rate
(#
of
sig
hti
ng
s p
er
10
0 k
m)
6.2
1.2
3.1 3.22.7
8.7
5.6
4.03.5
5.4
4.0
10.3
0
2
4
6
8
10
12
2002 2003 2004 2005 2006 2007 2008 2009 2010 2011 2012 2013
En
cou
nte
r ra
te (
# o
f si
gh
tin
gs
per
100
km
)
2.22.9 3.0
0.0
3.4
4.6
3.4
4.7
2.0
3.5
11.1
4.8
0
2
4
6
8
10
12
2002 2003 2004 2005 2006 2007 2008 2009 2010 2011 2012 2013
En
cou
nte
r ra
te (
# o
f si
gh
tin
gs
per
100
km
)
11.5
5.0
1.5
5.1
2.9
5.5
3.4 3.4
2.2
0.00
2
4
6
8
10
12
2004 2005 2006 2007 2008 2009 2010 2011 2012 2013
En
cou
nte
r ra
te (
# o
f si
gh
tin
gs
per
100
km
)
Figure 19. Temporal trends in annual encounter rates of finless porpoises among different survey areas
SE LantauSW Lantau
Lamma Po Toi

Figure 20. Temporal trends in combined abundance estimates of Chinese white dolphins in West, Northwest & Northeast Lantau from 2003-13
84
62 58 5460
42 4035
39 40 36
18
97
9
10
115
7
114
3
56
51
42 44
54
43
43
33
28
17 23
0
20
40
60
80
100
120
140
160
2003 2004 2005 2006 2007 2008 2009 2010 2011 2012 2013
Year
Ab
un
da
nc
e E
sti
ma
te
W Lantau
NE Lantau
NW Lantau

0
10
20
30
40
50
60
70
80
90
2003 2004 2005 2006 2007 2008 2009 2010 2011 2012 2013
Year
Ind
ivid
ual
Ab
un
dan
ce (
N)
0
10
20
30
40
50
60
70
80
90
100
110
2001 2002 2003 2004 2005 2006 2007 2008 2009 2010 2011 2012 2013
Year
Ind
ivid
ual
Ab
un
dan
ce (
N)
0
5
10
15
20
25
30
2001 2002 2003 2004 2005 2006 2007 2008 2009 2010 2011 2012 2013
Year
Ind
ivid
ua
l Ab
un
da
nc
e (
N)
West Lantau
Northwest Lantau
Northeast Lantau
Figure 21. Temporal trends in abundance estimates of Chinese white dolphins in West, Northwest & Northeast Lantau from 2001-13 (error bars: 95% confidence interval of abundance estimates)
A B C D E F G H I J K L M N O P Q R S T U V W X Y Z A B C D E F G H I J K L M N O P Q R S T U V W X Y Z1 1 1 1
2 2 2 2
3 3 3 3
4 4 4 4
5 5 5 5
6 6 6 6
7 7 7 7
8 8 8 8
9 9 9 9
10 10 10 10
11 11 11 11
12 12 12 12
13 13 13 13
14 14 14 14
15 15 15 15
16 16 16 16
17 17 17 17
18 18 18 18
19 19 19 19
20 20 20 20
21 21 21 21
22 22 22 22
23 23 23 23
24 24 24 24
25 25 25 25
26 26 26 26
27 27 27 27
28 28 28 28
29 29 29 29
30 30 30 30
31 31 31 31
32 32 32 32
33 33 33 33
34 34 34 34
35 35 35 35
36 36 36 36A B C D E F G H I J K L M N O P Q R S T U V W X Y Z A B C D E F G H I J K L M N O P Q R S T U V W X Y Z
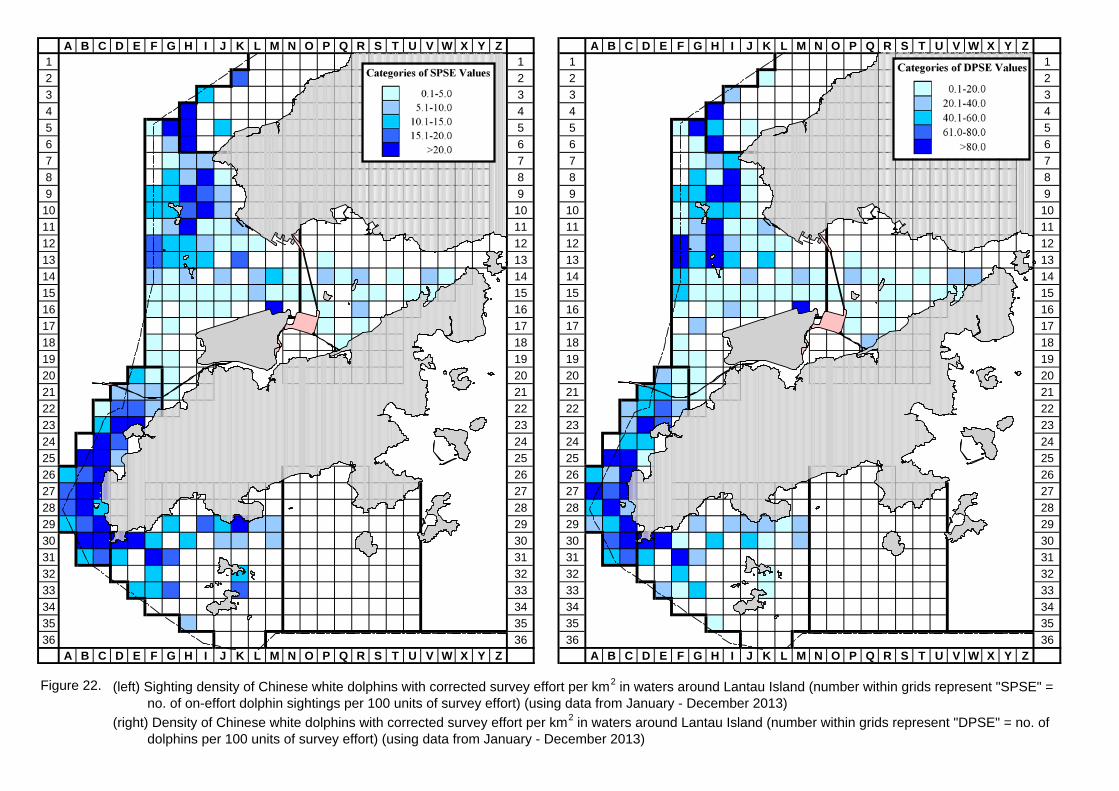
Figure 22. (left) Sighting density of Chinese white dolphins with corrected survey effort per km2 in waters around Lantau Island (number within grids represent "SPSE" =no. of on-effort dolphin sightings per 100 units of survey effort) (using data from January - December 2013)
(right) Density of Chinese white dolphins with corrected survey effort per km2 in waters around Lantau Island (number within grids represent "DPSE" = no. of dolphins per 100 units of survey effort) (using data from January - December 2013)
A B C D E F G H I J K L M N O P Q R S T U V W X Y Z A B C D E F G H I J K L M N O P Q R S T U V W X Y Z A B C D E F G H I J K L M N O P Q R S T U V W X Y Z1 1 1
2 2 2
3 3 3
4 4 4
5 5 5
6 6 6
7 7 7
8 8 8
9 9 9
10 10 10
11 11 11
12 12 12
13 13 13
14 14 14
15 15 15
16 16 16
17 17 17
18 18 18
19 19 19
20 20 20
21 21 21
22 22 22
23 23 23
24 24 24
25 25 25
26 26 26
27 27 27
28 28 28
29 29 29
30 30 30
31 31 31
32 32 32
33 33 33
34 34 34
35 35 35
36 36 36A B C D E F G H I J K L M N O P Q R S T U V W X Y Z A B C D E F G H I J K L M N O P Q R S T U V W X Y Z A B C D E F G H I J K L M N O P Q R S T U V W X Y Z
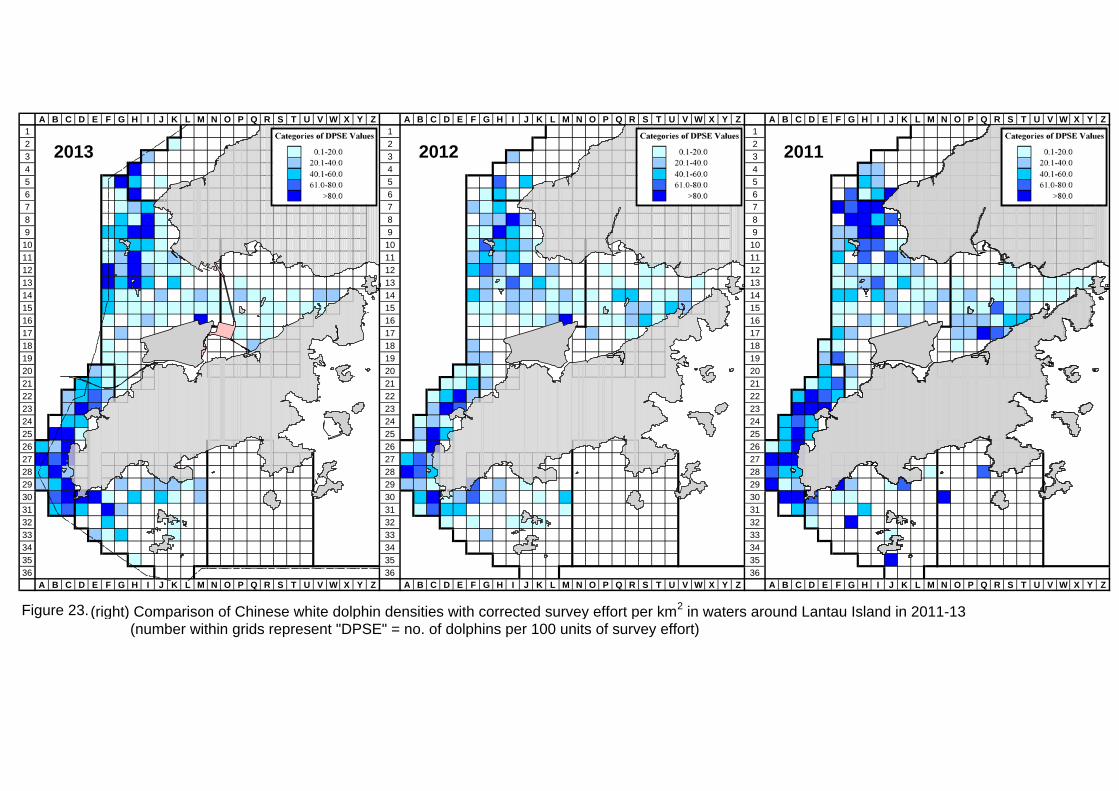
Figure 23. (right) Comparison of Chinese white dolphin densities with corrected survey effort per km2 in waters around Lantau Island in 2011-13(number within grids represent "DPSE" = no. of dolphins per 100 units of survey effort)
2013 2012 2011
A B C D E F G H I J K L M N O P Q R S T U V W X Y Z A B C D E F G H I J K L M N O P Q R S T U V W X Y Z1 1 1 1
2 2 2 2
3 3 3 3
4 4 4 4
5 5 5 5
6 6 6 6
7 7 7 7
8 8 8 8
9 9 9 9
10 10 10 10
11 11 11 11
12 12 12 12
13 13 13 13
14 14 14 14
15 15 15 15
16 16 16 16
17 17 17 17
18 18 18 18
19 19 19 19
20 20 20 20
21 21 21 21
22 22 22 22
23 23 23 23
24 24 24 24
25 25 25 25
26 26 26 26
27 27 27 27
28 28 28 28
29 29 29 29
30 30 30 30
31 31 31 31
32 32 32 32
33 33 33 33
34 34 34 34
35 35 35 35
36 36 36 36A B C D E F G H I J K L M N O P Q R S T U V W X Y Z A B C D E F G H I J K L M N O P Q R S T U V W X Y Z
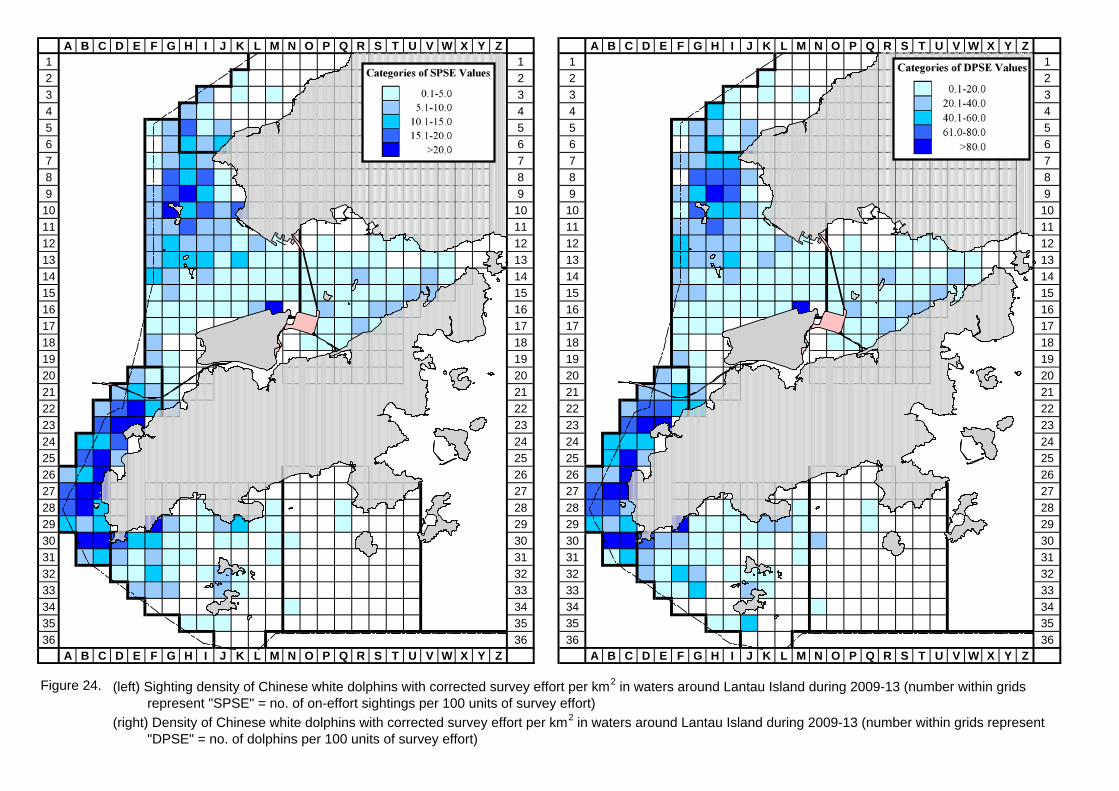
Figure 24. (left) Sighting density of Chinese white dolphins with corrected survey effort per km2 in waters around Lantau Island during 2009-13 (number within gridsrepresent "SPSE" = no. of on-effort sightings per 100 units of survey effort)
(right) Density of Chinese white dolphins with corrected survey effort per km2 in waters around Lantau Island during 2009-13 (number within grids represent "DPSE" = no. of dolphins per 100 units of survey effort)

A B C D E F G H I J K L M N O P Q R S T U V W X Y Z A B C D E F G H I J K L M N O P Q R S T U V W X Y Z1 1 1 1
2 2 2 2
3 3 3 3
4 4 4 4
5 5 5 5
6 6 6 6
7 7 7 7
8 8 8 8
9 9 9 9
10 10 10 10
11 11 11 11
12 12 12 12
13 13 13 13
14 14 14 14
15 15 15 15
16 16 16 16
17 17 17 17
18 18 18 18
19 19 19 19
20 20 20 20
21 21 21 21
22 22 22 22
23 23 23 23
24 24 24 24
25 25 25 25
26 26 26 26
27 27 27 27
28 28 28 28
29 29 29 29
30 30 30 30
31 31 31 31
32 32 32 32
33 33 33 33
34 34 34 34
35 35 35 35
36 36 36 36A B C D E F G H I J K L M N O P Q R S T U V W X Y Z A B C D E F G H I J K L M N O P Q R S T U V W X Y Z
Figure 25. (left) Density of Chinese white dolphins with corrected survey effort per km2 in waters around Lantau Island during 2004-08 (numbers within grids represent"DPSE" = no. of dolphins per 100 units of survey effort)
(right) Density of Chinese white dolphins with corrected survey effort per km2 in waters around Lantau Island during 2009-13 (numbers within grids represent "DPSE" = no. of dolphins per 100 units of survey effort)
2004-08 2009-13

A B C D E F G H I J K L M N O P Q R S T U V W X Y Z A B C D E F G H I J K L M N O P Q R S T U V W X Y Z1 1 1 1
2 2 2 2
3 3 3 3
4 4 4 4
5 5 5 5
6 6 6 6
7 7 7 7
8 8 8 8
9 9 9 9
10 10 10 10
11 11 11 11
12 12 12 12
13 13 13 13
14 14 14 14
15 15 15 15
16 16 16 16
17 17 17 17
18 18 18 18
19 19 19 19
20 20 20 20
21 21 21 21
22 22 22 22
23 23 23 23
24 24 24 24
25 25 25 25
26 26 26 26
27 27 27 27
28 28 28 28
29 29 29 29
30 30 30 30
31 31 31 31
32 32 32 32
33 33 33 33
34 34 34 34
35 35 35 35
36 36 36 36A B C D E F G H I J K L M N O P Q R S T U V W X Y Z A B C D E F G H I J K L M N O P Q R S T U V W X Y Z
Figure 26. Grids of six key dolphin habitats that were examined for temporal trend in dolphin densities
Black Point
Proposed BrothersIsland Marine Park
Tai O Peninsula
Sha Chau &Lung Kwu Chau
Marine Park
Proposed Southwest LantauMarine Park (SWLMP)
Proposed Soko IslandsMarine Park (SIMP)
Sha Chau & Lung Kwu ChauMarine Park (SLMP)
Proposed Southwest LantauMarine Park (SWLMP)
Proposed Soko IslandsMarine Park (SIMP)
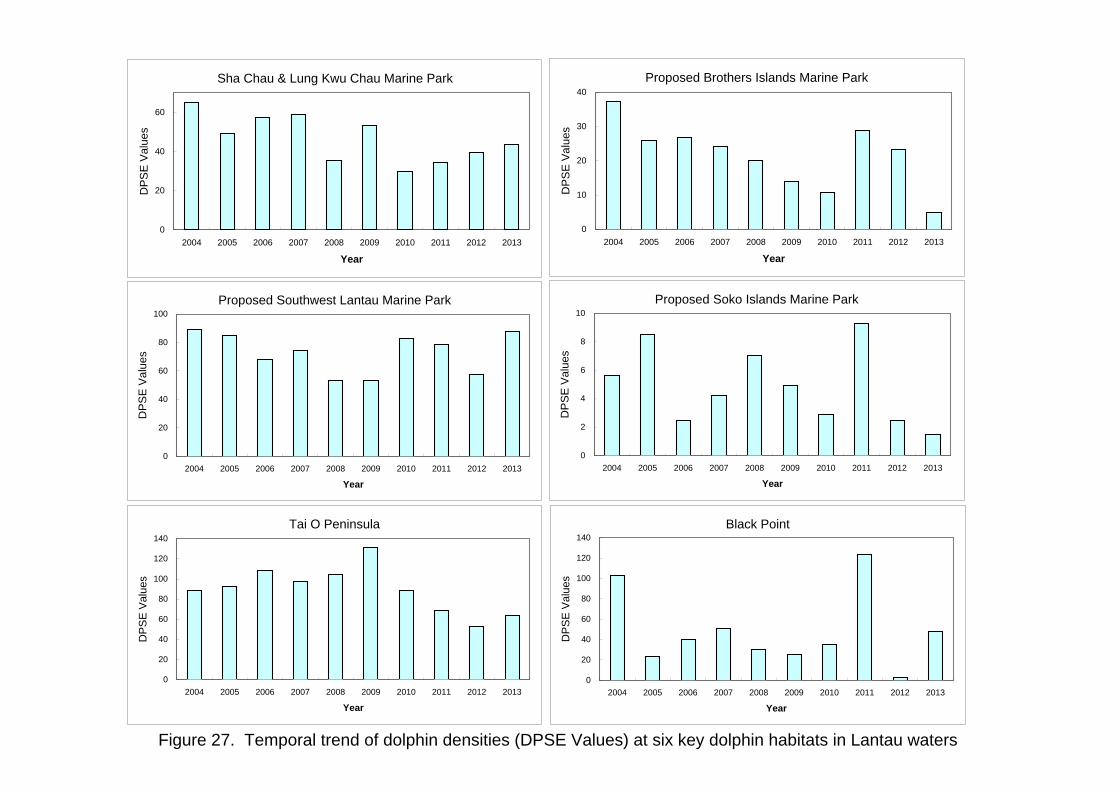
Figure 27. Temporal trend of dolphin densities (DPSE Values) at six key dolphin habitats in Lantau waters
Sha Chau & Lung Kwu Chau Marine Park
0
20
40
60
2004 2005 2006 2007 2008 2009 2010 2011 2012 2013
Year
DP
SE
Val
ues
Black Point
0
20
40
60
80
100
120
140
2004 2005 2006 2007 2008 2009 2010 2011 2012 2013
Year
DP
SE
Val
ues
Tai O Peninsula
0
20
40
60
80
100
120
140
2004 2005 2006 2007 2008 2009 2010 2011 2012 2013
Year
DP
SE
Val
ues
Proposed Brothers Islands Marine Park
0
10
20
30
40
2004 2005 2006 2007 2008 2009 2010 2011 2012 2013
Year
DP
SE
Val
ues
Proposed Southwest Lantau Marine Park
0
20
40
60
80
100
2004 2005 2006 2007 2008 2009 2010 2011 2012 2013
Year
DP
SE
Val
ues
Proposed Soko Islands Marine Park
0
2
4
6
8
10
2004 2005 2006 2007 2008 2009 2010 2011 2012 2013
Year
DP
SE
Val
ues

A B C D E F G H I J K L M N O P Q R S T U V W X Y Z A B C D E F G H I J K L M N O P Q R S T U V W X Y Z1 1 1 1
2 2 2 2
3 3 3 3
4 4 4 4
5 5 5 5
6 6 6 6
7 7 7 7
8 8 8 8
9 9 9 9
10 10 10 10
11 11 11 11
12 12 12 12
13 13 13 13
14 14 14 14
15 15 15 15
16 16 16 16
17 17 17 17
18 18 18 18
19 19 19 19
20 20 20 20
21 21 21 21
22 22 22 22
23 23 23 23
24 24 24 24
25 25 25 25
26 26 26 26
27 27 27 27
28 28 28 28
29 29 29 29
30 30 30 30
31 31 31 31
32 32 32 32
33 33 33 33
34 34 34 34
35 35 35 35
36 36 36 36A B C D E F G H I J K L M N O P Q R S T U V W X Y Z A B C D E F G H I J K L M N O P Q R S T U V W X Y Z
Figure 28. (left) Overall sighting density of Chinese white dolphins with corrected survey effort per km2 in waters around Lantau Island, using data collected during2001-12 (SPSE = no. of on-effort sightings per 100 units of survey effort)
(right) Overall density of Chinese white dolphins with corrected survey effort per km2 in waters around Lantau Island, using data collected during 2001-12 (DPSE = no. of dolphins per 100 units of survey effort)

A B C D E F G H I J K L M N O P Q R S T U V W X Y Z A B C D E F G H I J K L M N O P Q R S T U V W X Y Z1 1 1 1
2 2 2 2
3 3 3 3
4 4 4 4
5 5 5 5
6 6 6 6
7 7 7 7
8 8 8 8
9 9 9 9
10 10 10 10
11 11 11 11
12 12 12 12
13 13 13 13
14 14 14 14
15 15 15 15
16 16 16 16
17 17 17 17
18 18 18 18
19 19 19 19
20 20 20 20
21 21 21 21
22 22 22 22
23 23 23 23
24 24 24 24
25 25 25 25
26 26 26 26
27 27 27 27
28 28 28 28
29 29 29 29
30 30 30 30
31 31 31 31
32 32 32 32
33 33 33 33
34 34 34 34
35 35 35 35
36 36 36 36A B C D E F G H I J K L M N O P Q R S T U V W X Y Z A B C D E F G H I J K L M N O P Q R S T U V W X Y Z
Figure 29. (left) Sighting density of Chinese white dolphins per km2 engaged in feeding activities in waters around Lantau Island from 2001-12 (SPSE = no. of on-effortdolphin sightings per 100 units of survey effort)
(right) Sighting density of Chinese white dolphins per km2 engaged in socializing activities in waters around Lantau Island from 2001-12 (SPSE = no. ofon-effort dolphin sightings per 100 units of survey effort)
Feeding Socializing

A B C D E F G H I J K L M N O P Q R S T U V W X Y Z A B C D E F G H I J K L M N O P Q R S T U V W X Y Z1 1 1 1
2 2 2 2
3 3 3 3
4 4 4 4
5 5 5 5
6 6 6 6
7 7 7 7
8 8 8 8
9 9 9 9
10 10 10 10
11 11 11 11
12 12 12 12
13 13 13 13
14 14 14 14
15 15 15 15
16 16 16 16
17 17 17 17
18 18 18 18
19 19 19 19
20 20 20 20
21 21 21 21
22 22 22 22
23 23 23 23
24 24 24 24
25 25 25 25
26 26 26 26
27 27 27 27
28 28 28 28
29 29 29 29
30 30 30 30
31 31 31 31
32 32 32 32
33 33 33 33
34 34 34 34
35 35 35 35
36 36 36 36A B C D E F G H I J K L M N O P Q R S T U V W X Y Z A B C D E F G H I J K L M N O P Q R S T U V W X Y Z
Figure 30. (left) Density of unspotted calves of Chinese white dolphins per km2 in waters around Lantau Island from 2001-12 (DPSE = no. of unspotted calves per100 units of survey effort)
(right) Density of unspotted juveniles of Chinese white dolphins per km2 in waters around Lantau Island from 2001-12 (DPSE = no. of unspotted juvenilesper 100 units of survey effort)
UnspottedCalves
UnspottedJuveniles

A B C D E F G H I J K L M N O P Q R S T U V W X Y Z A B C D E F G H I J K L M N O P Q R S T U V W X Y Z1 1 1 1
2 2 2 2
3 3 3 3
4 4 4 4
5 5 5 5
6 6 6 6
7 7 7 7
8 8 8 8
9 9 9 9
10 10 10 10
11 11 11 11
12 12 12 12
13 13 13 13
14 14 14 14
15 15 15 15
16 16 16 16
17 17 17 17
18 18 18 18
19 19 19 19
20 20 20 20
21 21 21 21
22 22 22 22
23 23 23 23
24 24 24 24
25 25 25 25
26 26 26 26
27 27 27 27
28 28 28 28
29 29 29 29
30 30 30 30
31 31 31 31
32 32 32 32
33 33 33 33
34 34 34 34
35 35 35 35
36 36 36 36A B C D E F G H I J K L M N O P Q R S T U V W X Y Z A B C D E F G H I J K L M N O P Q R S T U V W X Y Z
Figure 31. (left) Number of years with Chinese white dolphin sighting records per km2 in waters around Lantau Island from 2001-12
(right) Number of months with Chinese white dolphin sighting records per km2 in waters around Lantau Island from 2001-12
Yearly Monthly
A B C D E F G H I J K L M N O P Q R S T U V W X Y Z A B C D E F G H I J K L M N O P Q R S T U V W X Y Z1 1 1 1
2 2 2 2
3 3 3 3
4 4 4 4
5 5 5 5
6 6 6 6
7 7 7 7
8 8 8 8
9 9 9 9
10 10 10 10
11 11 11 11
12 12 12 12
13 13 13 13
14 14 14 14
15 15 15 15
16 16 16 16
17 17 17 17
18 18 18 18
19 19 19 19
20 20 20 20
21 21 21 21
22 22 22 22
23 23 23 23
24 24 24 24
25 25 25 25
26 26 26 26
27 27 27 27
28 28 28 28
29 29 29 29
30 30 30 30
31 31 31 31
32 32 32 32
33 33 33 33
34 34 34 34
35 35 35 35
36 36 36 36A B C D E F G H I J K L M N O P Q R S T U V W X Y Z A B C D E F G H I J K L M N O P Q R S T U V W X Y Z
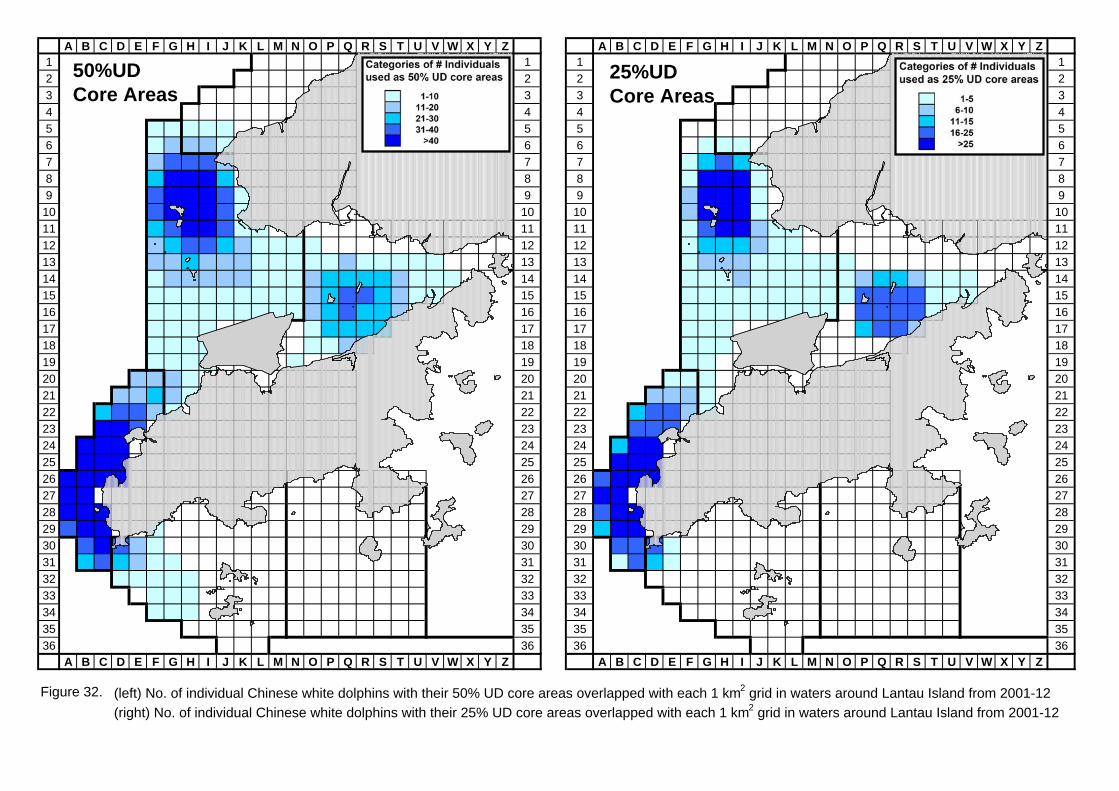
Figure 32. (left) No. of individual Chinese white dolphins with their 50% UD core areas overlapped with each 1 km2 grid in waters around Lantau Island from 2001-12
(right) No. of individual Chinese white dolphins with their 25% UD core areas overlapped with each 1 km2 grid in waters around Lantau Island from 2001-12
50%UDCore Areas
25%UDCore Areas

A B C D E F G H I J K L M N O P Q R S T U V W X Y Z A B C D E F G H I J K L M N O P Q R S T U V W X Y Z1 1 1 10 1
2 6 5 2 2 3 7 2
3 4 8 4 4 3 3 3 10 5 7 5 3
4 4 10 4 4 4 2 13 2 4
5 1 5 17 11 18 5 5 6 6 12 6 12 5
6 1 18 14 10 5 6 6 8 13 10 7 6
7 10 28 32 34 8 7 7 9 21 22 25 7 7
8 10 35 42 36 17 8 8 11 21 27 24 16 8
9 14 41 43 32 14 1 9 9 18 32 35 26 14 5 9
10 11 41 48 38 20 8 10 10 9 29 45 28 24 5 10
11 14 34 40 27 26 6 8 11 11 19 25 38 26 35 12 7 6 4 11
12 9 30 22 31 23 13 19 9 7 5 4 4 6 6 4 4 12 12 12 24 27 25 30 20 22 17 11 6 5 1 5 4 4 12
13 7 28 22 20 19 16 13 11 11 8 11 11 5 9 8 1 8 4 4 4 13 13 18 21 18 25 22 21 18 18 16 11 12 12 4 9 10 6 7 4 5 13
14 11 23 16 17 16 11 14 10 19 13 17 20 25 21 15 12 15 10 14 14 13 21 12 16 21 17 24 14 21 16 21 19 21 20 12 10 10 8 14
15 10 17 12 8 12 13 17 19 11 13 22 25 28 24 16 18 8 15 15 7 15 12 7 16 17 29 24 15 14 21 21 24 21 16 8 1 15
16 6 10 8 9 11 13 10 7 8 18 27 28 27 32 12 16 16 6 10 6 8 10 16 18 14 19 17 19 27 26 34 14 16
17 7 10 11 1 8 16 21 30 24 17 17 10 7 8 4 3 9 12 21 24 20 17
18 9 15 9 2 1 5 8 7 2 18 18 8 6 5 1 6 8 9 18
19 9 15 15 1 1 1 19 19 10 11 4 6 19
20 14 13 20 1 20 20 9 14 15 4 20
21 22 24 29 15 1 21 21 13 18 14 10 21
22 21 33 37 35 8 22 22 32 29 31 22 5 22
23 38 45 46 23 23 27 40 42 23
24 28 35 36 24 24 26 31 25 24
25 39 44 26 25 25 44 44 16 25
26 20 39 47 14 26 26 14 40 44 26
27 38 41 35 5 27 27 36 42 43 5 7 6 6 27
28 36 40 32 6 5 4 5 6 28 28 29 42 29 7 6 4 6 6 4 28
29 29 30 35 30 18 7 4 17 5 6 9 4 4 29 29 16 30 33 35 16 8 7 17 11 5 9 4 29
30 35 43 32 22 15 16 10 4 6 4 5 7 5 4 30 30 26 40 32 30 11 13 8 6 1 6 6 4 5 30
31 23 34 22 19 9 9 13 5 11 5 5 6 4 31 31 26 37 15 23 6 9 11 7 10 5 6 4 8 4 31
32 14 16 18 9 5 5 21 6 4 4 4 32 32 11 16 8 6 27 4 4 6 32
33 4 7 12 5 4 15 5 7 4 6 33 33 6 5 9 4 6 4 6 33
34 1 5 8 4 6 6 4 4 34 34 10 4 7 7 4 34
35 5 7 9 5 5 4 35 35 7 4 5 6 4 35
36 9 9 36 36 7 19 36A B C D E F G H I J K L M N O P Q R S T U V W X Y Z A B C D E F G H I J K L M N O P Q R S T U V W X Y Z
Figure 33. Habitat rating of Chinese white dolphins in Hong Kong using quantative habitat use information collected during 2001-12 and 1996-2005 (number within grids represents the sum of scores totaled from 10 selection criteria)
2001-2012 1996-2005

A B C D E F G H I J K L M N O P Q R S T U V W X Y Z A B C D E F G H I J K L M N O P Q R S T U V W X Y Z1 1 1 1
2 2 2 2
3 3 3 3
4 4 4 4
5 5 5 5
6 6 6 6
7 7 7 7
8 8 8 8
9 9 9 9
10 10 10 10
11 11 11 11
12 12 12 12
13 13 13 13
14 14 14 14
15 15 15 15
16 16 16 16
17 17 17 17
18 18 18 18
19 19 19 19
20 20 20 20
21 21 21 21
22 22 22 22
23 23 23 23
24 24 24 24
25 25 25 25
26 26 26 26
27 27 27 27
28 28 28 28
29 29 29 29
30 30 30 30
31 31 31 31
32 32 32 32
33 33 33 33
34 34 34 34
35 35 35 35
36 36 36 36A B C D E F G H I J K L M N O P Q R S T U V W X Y Z A B C D E F G H I J K L M N O P Q R S T U V W X Y Z
Figure 34. Comparions between 2001-12 and 1996-2005 for grids that are rated as above average, important and critical dolphin habitat that should deserve habitat protection for dolphin conservation purposes
1996-20052001-2012

D E F G H I J K L M N O P Q R S T U V W X Y Z AA BB CC DD EE FF GG HH II JJ KK LL MM NN OO PP QQ RR SS TT UU VV WW XX YY ZZ aa bb cc dd ee ff gg hh ii jj kk ll mm nn oo pp qq rr ss
20 20
21 21
22 22
23 23
24 24
25 25
26 26
27 27
28 28
29 29
30 30
31 31
32 32
33 33
34 34
35 35
36 36
D E F G H I J K L M N O P Q R S T U V W X Y Z AA BB CC DD EE FF GG HH II JJ KK LL MM NN OO PP QQ RR SS TT UU VV WW XX YY ZZ aa bb cc dd ee ff gg hh ii jj kk ll mm nn oo pp qq rr ss
20 20
21 21
22 22
23 23
24 24
25 25
26 26
27 27
28 28
29 29
30 30
31 31
32 32
33 33
34 34
35 35
36 36
Figure 35. (top) Sighting density of finless porpoises with corrected survey effort per km2 in southern waters of Hong Kong (number within grids represent "SPSE" = no. of
on-effort porpoise sightings per 100 units of survey effort) (using data from January - December 2013)
(bottom) Density of finless porpoises with corrected survey effort per km2 in southern waters of Hong Kong (number within grids represents "DPSE" = no. of
porpoises per 100 units of survey effort) (using data from January - December 2013)

D E F G H I J K L M N O P Q R S T U V W X Y Z AA BB CC DD EE FF GG HH II JJ KK LL MM NN OO
20 2021 2122 22
23 23
24 24
25 25
26 26
27 27
28 28
29 29
30 30
31 31
32 32
33 33
34 34
35 35
36 36D E F G H I J K L M N O P Q R S T U V W X Y Z AA BB CC DD EE FF GG HH II JJ KK LL MM NN OO
20 2021 2122 22
23 23
24 24
25 25
26 26
27 27
28 28
29 29
30 30
31 31
32 32
33 33
34 34
35 35
36 36D E F G H I J K L M N O P Q R S T U V W X Y Z AA BB CC DD EE FF GG HH II JJ KK LL MM NN OO
Figure 36. Density of finless porpoises with corrected survey effort per km2 in southern waters of Hong Kongduring dry season (December to May), using data collected during 2004-13 (SPSE = no. of on-effort porpoise sightings per 100 units of survey effort; DPSE = no. of porpoises per 100 units of survey effort

H I J K L M N O P Q R S T U V W X Y Z AA BB CC DD EE FF GG HH II JJ KK LL MM NN OO PP QQ RR SS TT UU VV WW XX YY ZZ aa bb cc dd ee ff gg hh ii jj kk ll mm nn oo
20 2021 2122 22
23 23
24 24
25 25
26 26
27 27
28 28
29 29
30 30
31 31
32 32
33 33
34 34
35 35
36 36H I J K L M N O P Q R S T U V W X Y Z AA BB CC DD EE FF GG HH II JJ KK LL MM NN OO PP QQ RR SS TT UU VV WW XX YY ZZ aa bb cc dd ee ff gg hh ii jj kk ll mm nn oo
20 2021 2122 22
23 23
24 24
25 25
26 26
27 27
28 28
29 29
30 30
31 31
32 32
33 33
34 34
35 35
36 36I J K L M N O P Q R S T U V W X Y Z AA BB CC DD EE FF GG HH II JJ KK LL MM NN OO PP QQ RR SS TT UU VV WW XX YY ZZ aa bb cc dd ee ff gg hh ii jj kk ll mm nn oo
Figure 37. Density of finless porpoises with corrected survey effort per km2 in southern waters of Hong Kong during wet season (June to November),using data collected during 2004-13 (SPSE = no. of on-effort porpoise sightings per 100 units of survey effort; DPSE = no. of porpoises per100 units of survey effort
47.6%
25.5%
15.0%
6.9%
2.8% 2.0%
0%
10%
20%
30%
40%
50%
1-2 3-4 5-6 7-8 9-10 10+
Group Size
Per
cen
tag
e o
f T
ota
l No
. of
Do
lph
in G
rou
ps
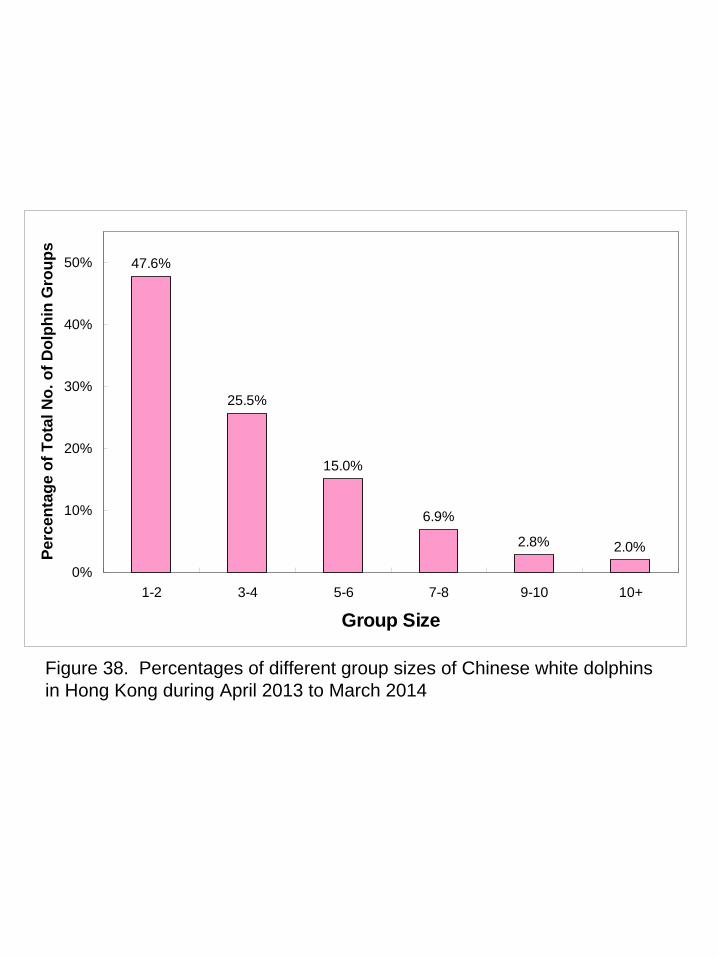
Figure 38. Percentages of different group sizes of Chinese white dolphins in Hong Kong during April 2013 to March 2014

Figure 39. Distribution of Chinese white dolphins with different group sizes in 2013
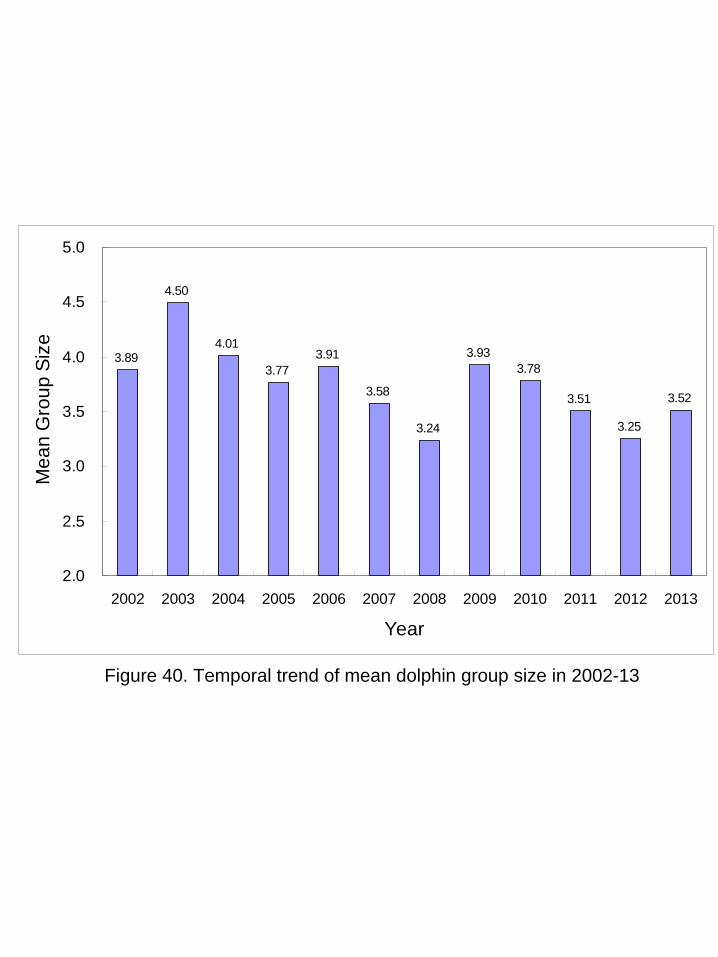
Figure 40. Temporal trend of mean dolphin group size in 2002-13
3.89
4.50
4.01
3.773.91
3.58
3.24
3.933.78
3.51
3.25
3.52
2.0
2.5
3.0
3.5
4.0
4.5
5.0
2002 2003 2004 2005 2006 2007 2008 2009 2010 2011 2012 2013
Year
Me
an
Gro
up
Siz
e

Figure 41. Percentages of different group sizes of finless porpoises in Hong Kong during April 2013 to March 2014
38.9%
33.6%
12.4%
7.1%
3.5%1.8% 1.8% 0.9%
0%
10%
20%
30%
40%
1 2 3 4 5 6 8 18
Porpoise Group Size
Pe
rce
nta
ge
of
To
tal N
o. o
f P
orp
ois
e G
rou
ps

Figure 42. Distribution of Chinese white dolphins engaged in feeding (green dots), socializing (pink dots), traveling (blue dots) and milling (purple dots) activities in 2013

Figure 43. Percentages of feeding and socializing activities among all dolphin groups sighted in Hong Kong during 2002-13
0%
5%
10%
15%
20%
25%
30%
2002 2003 2004 2005 2006 2007 2008 2009 2010 2011 2012 2013
Year
Pe
rce
nta
ge
of
Ac
tiv
itie
s
Feeding Socializing

Figure 44. Distribution of dolphin sightings associated with fishing boats in 2013 (green dots: with purse-seiners, blue dots: with gill-netters; red dots: with bottom trawlers)

Figure 45. Distribution of Unspotted Calves (UC) & Unspotted Juveniles (UJ) during 2013 monitoring surveys

Figure 46. Percentages of young calves (i.e. unspotted calves (UC) and unspotted juveniles (UJ)) among all dolphin groups during 2002-13
0%
1%
2%
3%
4%
5%
6%
7%
8%
2002 2003 2004 2005 2006 2007 2008 2009 2010 2011 2012 2013
Year
Pe
rce
nta
ge
of
Yo
un
g C
alv
es
UJ
UC