Embed Size (px)
Citation preview

Deep Atmospheric Response to the North Pacific Oceanic Subtropical Front in Spring
FUMIAKI KOBASHI
Faculty of Marine Technology, Tokyo University of Marine Science and Technology, Tokyo, Japan
SHANG-PING XIE
International Pacific Research Center, and Department of Meteorology, University of Hawaii at Manoa, Honolulu, Hawaii
NAOTO IWASAKA
Faculty of Marine Technology, Tokyo University of Marine Science and Technology, Tokyo, Japan
TAKASHI T. SAKAMOTO
Frontier Research Center for Global Change, Japan Agency for Marine-Earth Science and Technology, Kanagawa, Japan
(Manuscript received 2 November 2007, in final form 12 March 2008)
ABSTRACT
The North Pacific subtropical front (STF) is a zone of high sea surface temperature (SST) gradientslocated around 25°N in the western basin and is most pronounced in spring. The STF’s atmospheric effectsare investigated using satellite observations and an atmospheric reanalysis. During April–May along theSTF, surface wind stress curl turns weakly cyclonic in the general background of anticyclonic curls. Atmo-spheric column-integrated water vapor displays a pronounced meridional maximum along this surfacetrough, suggesting a deep vertical structure. Cyclonic wind curls occur intermittently at intervals of a fewdays along the STF in subsynoptic low pressure systems accompanying larger, synoptic highs in the mainstorm track to the north. In the subsynoptic surface lows, convective rain takes place with deep upwardmotion moistening the entire troposphere. The lows are enhanced by condensational heating, leading to theformation of weak cyclonic wind curls. The lows display vertical structure characteristic of baroclinicinstability, suggesting that they are triggered by the passage of synoptic migratory highs and grow on thebaroclinicity anchored by the SST front. The cyclonic wind curls appear to be related to a cloud/rainbandassociated with the so-called pre-baiu/meiyu front in May.
1. Introduction
Surface wind fields over the subtropical North Pacificare characterized by anticyclonic vorticity with thewesterlies to the north and the northeast trade winds tothe south. The anticyclonic wind stress curls drive thebasin-scale subtropical gyre. About 40 years ago,Yoshida and Kidokoro (1967a,b) found a weak localminimum of anticyclonic vorticity in the midst of thesubtropical gyre during winter and spring, based on ananalysis of seasonal-mean wind stress computed by
Hidaka (1958). They suggested that this trough of an-ticyclonic wind curl produces an eastward currentcalled the subtropical countercurrent (STCC), whichwas discovered by Uda and Hasunuma (1969) from di-rect current meter measurements and geostrophic cal-culations. Although the wind curl trough is found onlyduring winter and spring in Yoshida and Kidokoro’s(1967a,b) analysis, the STCC appears to persistthroughout the year (Uda and Hasunuma 1969; Whiteet al. 1978).
Many studies of the formation mechanisms for STCChave followed. Using an ocean general circulationmodel (GCM), Takeuchi (1984) produced a STCC us-ing wind stress forcing without the wind curl trough,indicating that the wind curl trough of Yoshida andKidokoro is not essential for the STCC. Recent theo-
Corresponding author address: Fumiaki Kobashi, Tokyo Uni-versity of Marine Science and Technology, Faculty of MarineTechnology, Etchujima 2-1-6, Koto-ku, Tokyo 135-8533, Japan.E-mail: [email protected]
5960 J O U R N A L O F C L I M A T E VOLUME 21
DOI: 10.1175/2008JCLI2311.1
© 2008 American Meteorological Society
JCLI2311

retical (Kubokawa 1999) and numerical (Kubokawaand Inui 1999) studies show that the STCC is associatedwith distinct potential vorticity structures caused by thecirculation of mode waters in the ventilated ther-mocline, a mechanism that has won support from ob-servations (Aoki et al. 2002; Kobashi et al. 2006). Thismechanism does not require an anticyclonic curl troughbut generates an STCC with smooth wind forcing.
There have been no follow-up studies since Yoshidaand Kidokoro (1967a,b) to reexamine the wind curltrough that they reported. It is unclear whether theirwind curl trough is a robust feature of the subtropicalgyre or an artifact of noisy data of Hidaka (1958). Fig-ure 1 shows a weekly mean map of satellite-derived seasurface temperature (SST), which features a sharp SSTfront in the STCC region. The SST front extends fromthe east of Taiwan to the central North Pacific between20° and 30°N, slightly tilting northward toward the east.The magnitude of the SST gradients is comparable instrength to the Kuroshio Front south of Japan and itsextension to the east. This SST front is called the Sub-tropical Front1 (STF) (Roden 1975). Recent satelliteobservations reveal robust air–sea coupling over suchsharp SST fronts throughout the World Ocean (Xie2004). Over the northwest Pacific, SST fronts associ-ated with the Kuroshio and its extension affect the at-mosphere and cause significant changes in surface wind(Xie et al. 2002; Nonaka and Xie 2003). These studiessuggest a possible atmospheric response to the STF,which may imprint on the surface wind.
The present paper examines surface wind fields overthe subtropical northwest Pacific using the Quick Scat-terometer (QuikSCAT) vector wind observations thathave accumulated since 1999. Our results confirm thewind curl trough of Yoshida and Kidokoro (1967a,b)
and show that the wind curls near the STCC turn cy-clonic during spring. We then proceed to study thethree-dimensional structure of the atmosphere and pro-cesses that lead to the formation of these cyclonic windcurls in the subtropical gyre, using an atmospheric re-analysis product. We show that the atmospheric re-sponse to the STF has a deep vertical structure, distinctfrom that near other SST fronts over the cool ocean, asreviewed in Xie (2004).
The remainder of the paper is organized as follows:The data and processing procedure are described insection 2. Section 3 confirms the existence of the windcurl trough along the STF from satellite observations.Section 4 analyzes the spatiotemporal structure of thesurface trough and infers the mechanisms for its devel-opment. Section 5 is a summary and discusses possiblefeedback on the STCC and other implications.
2. Data
This study uses surface vector wind velocity mea-sured by the QuikSCAT, SST, columnar water vapor,and precipitation measured by the Tropical RainfallMeasuring Mission (TRMM) Microwave Imager (TMI)from August 1999 to December 2006. Both productsare processed by Remote Sensing Systems onto 3-dayrunning mean maps on a 0.25° grid. We compute windstress based on drag coefficients of Kondo (1975) andcalculate the curl by applying a spatial running meanwith 1° latitude and 3° longitude to extract the large-scale vorticity structure.
We use the Japanese 25-yr Reanalysis (JRA-25),which is produced jointly by the Japan MeteorologicalAgency (JMA) and Central Research Institute of Elec-tric Power Industry (CRIEPI). The JRA-25 uses a T106global spectral forecast model with 40 vertical levelsand a three-dimensional variational data assimilationmethod (Onogi et al. 2007). The JRA-25 covers a mainperiod from 1979 to 2004, but continues to be updatedfor the subsequent period using the same real-time cli-matic assimilation system, the JMA Climate Data As-similation System (JCDAS). This study uses 6-hourlyfields of air temperature, specific humidity, and hori-zontal and vertical velocities available on a 1.25° grid at12 vertical levels (1000, 925, 850, 700, 600, 500, 400, 300,250, 200, 150, and 100 hPa). Six-hourly surface variables(wind velocity and stress vectors, air temperature, spe-cific humidity, sea level pressure, and precipitationrate) are available on the T106 Gaussian grid (approxi-mately 1.125° in spacing). We analyze the JRA-25 datafor the period of the satellite observations from January2000 to December 2006.
We use vertical velocity instead of pressure verticalvelocity. The vertical velocity w is derived from the
1 This subtropical front is located within the surface mixed layerand is different in nature from the subtropical front associatedwith the STCC, which is found at the subsurface depth of 100–200m (Uda and Hasunuma 1969).
FIG. 1. Weekly mean TMI SST for 30 April–6 May 2000,contoured every 1°C.
15 NOVEMBER 2008 K O B A S H I E T A L . 5961

pressure vertical velocity � by the approximate rela-tionship for synoptic scales under the hydrostatic ap-proximation w � ��g�, where � is the air density andg is the gravity acceleration (Holton 2004).
3. Characteristics of cyclonic curls
This section examines the spatial and seasonal varia-tions in QuikSCAT wind stress. Figure 2 shows the Mayclimatology of SST, the magnitude of its gradient, windstress and its curl, and columnar water vapor, all de-
rived from satellite data. The magnitude of the SSTgradient is calculated from the monthly mean SST using�(�SST/�x)2 � (�SST/�y)2. The STF is clearly identi-fied with a zone of large SST gradients between 20° and30°N. The wind stress curl is generally anticyclonic(negative) over the subtropical region, but there is aband of local minimum in anticyclonic curl with somenarrow cyclonic (positive) curl between 22° and 28°Nwest of about 155°E. The anticyclonic curl trough isapproximately collocated with the STF, associated witha weakening of the easterly trade winds south of theSTF around 23°N. The columnar water vapor map fea-tures a tonguelike band of high columnar water vaporthat extends eastward to 155°E between 18° and 26°N.This high moisture band is located in the area of highSST �27°C and is slightly displaced south of the windcurl trough and the STF.
Figure 3 shows the seasonal variations in the merid-ional profiles of SST, magnitude of the SST gradient,wind stress and wind stress curl, columnar water vapor,and precipitation obtained from the zonal average be-tween 135° and 145°E. The same figures are also madefrom the zonal average for every 5° longitude bin be-tween 135° and 155°E, and the results are rather insen-sitive to the longitude. The STF appears in late fall tothe following early summer, anchored between 22° and28°N presumably by the STCC and the associated sub-surface front. The STF seasonal cycle agrees with theresults of Roden (1980) based on satellite infrared mea-surements.
The wind curl trough exhibits a clear seasonality. Thesubtropical region is occupied by anticyclonic curlthroughout the year, except at lower latitudes wherecyclonic curls march north from 15°N in July to 22°N inSeptember in association with the development of thenorthwest Pacific summer monsoon (Ueda and Yasu-nari 1996). The anticyclonic curl decreases in the STFregion from April to May with a pronounced meridio-nal minimum in May. This curl trough is coincident withthe seasonal intensification of the SST gradient in theSTF from April and May. A careful look indicates that,as the maximum SST gradient migrates northward from25°N in April to 27°N in May, the center of the windcurl trough also seems to move northward, maintainingits position on the southern flank of the front. Theseresults from satellite observations are confirmed fromthe JRA-25 data (not shown).
The wind curl trough during April–May is coincidentwith the abrupt increase in columnar water vapor (Fig.3c). Although the columnar water vapor shows gener-ally a seasonal evolution similar to that of SST, itsabrupt increase from April to May does not seem tofollow a similar SST change. This abrupt increase in
FIG. 2. May climatology from satellite observations for (a) vec-tor wind stress, (b) magnitude of SST gradient, (c) wind stresscurl, and (d) columnar water vapor, along with SST in contours. Athick contour in (d) marks the 27°C isotherm.
5962 J O U R N A L O F C L I M A T E VOLUME 21

columnar water vapor is related to the formation of theeastward extending, high moisture tongue in Fig. 2d.
The wind curl trough is also concurrent with a weakbut noticeable increase of precipitation over the STF inMay (Fig. 3d). The precipitation occurs with some me-ridional peaks over the STF and is seemingly distin-guished from a much stronger rainband lying to thenorth of 28°N, which is associated with the baiu/meiyufront with a maximum peak at June (e.g., Wang andLinHo 2002).
There are other noteworthy features in the subtropi-
cal wind curl. Broad anticyclonic curls weaken in Oc-tober, and there is a similar but weaker trough centeredat 27°N. There are strong cyclonic curls around 35°Nalmost year-round over the Kuroshio south of Japan, ascan be seen from Fig. 2c. Similar cyclonic curls arefound in the winter Kuroshio in the East China Sea(Xie et al. 2002) and in the Gulf Stream (Chelton et al.2004; Xie 2004). This study focuses on the STF region inspring.
We have also investigated wind curl fields usingmonthly climatology based on long-term ship obser-vations from the International Comprehensive Ocean–Atmosphere Dataset (ICOADS) and found a weakwind curl trough in spring in the STF region. The windcurl trough is also present in a high-resolution coupledGCM jointly developed by the Center for Climate Sys-tem Research (CCSR) of the University of Tokyo, theNational Institute for Environmental Studies (NIES),and the Frontier Research Center for Global Change(FRCGC) of the Japan Agency for Marine–Earth Sci-ence and Technology. The atmosphere has T106 spec-tral resolution with high vertical resolution in the plan-etary boundary layer, while the ocean has 0.28° (0.19°)horizontal (meridional) resolution (Hasumi and Emori2004). We use 3-yr output from 71 to 73 model years ofa control-run simulation (Sakamoto et al. 2005). Con-sistent with satellite observations, the model repro-duces a narrow band of cyclonic wind curl and a highmoisture tongue along the southern flank of the STF(not shown). The wind curl trough also has a clear sea-sonality—well defined during April–May. The overallagreement between the results from independent ob-servations and the model indicates that the wind curltrough is a robust feature in the STF region.
The present study thus confirms the wind curl troughin the STF region, previously reported by Yoshida andKidokoro (1967a,b). Here we note several differencesfrom their studies. Whereas Yoshida and Kidokoro(1967a,b) reported the presence of the trough in bothwinter and spring and extending farther toward the eastto 140°W, our trough is present only in spring and isconfined to the western part of the subtropical gyre.Probably the differences are attributable to the dataused. The Hidaka (1958) wind data that Yoshida andKidokoro (1967a,b) used are based on sparse ship ob-servations, whereas satellite observations have muchsuperior space–time sampling. In addition, the Hidakadata are gridded seasonally on a 5° grid in longitudeand latitude, which may be inadequate to resolve thewind curl trough properly in the STF region.
The cyclonic curl in the STF region appears differentfrom the prevailing wind adjustment to SST fronts else-where, as reviewed in Xie (2004). A vertical mixing
FIG. 3. Satellite-observed seasonal cycle as represented in time–latitude sections of (a) SST (thick contours) and magnitude of theSST gradient (shading), (b) vector wind stress and wind stress curl(zero contours thickened), (c) columnar water vapor (mm), and(d) precipitation (mm day�1), zonally averaged between 135° and145°E.
15 NOVEMBER 2008 K O B A S H I E T A L . 5963

mechanism (Wallace et al. 1989) is considered impor-tant in the latter type of atmospheric adjustment, asobserved along the Kuroshio (Xie et al. 2002) and Ex-tension (Nonaka and Xie 2003; Tokinaga et al. 2006). Inthis mechanism, an increase in SST reduces the staticstability of the near-surface atmosphere and intensifiesthe vertical mixing, bringing fast moving air aloft downto the sea surface and accelerating the surface wind.Thus, surface winds blowing parallel to the SST frontare accelerated (decelerated) on the warm (cold) sidesof the SST front, causing a curl of the surface wind field(Chelton et al. 2001, 2004; O’Neill et al. 2003). Indeed,cyclonic wind curls are generated around 35°N alongthe Kuroshio south of Japan in the prevailing westerlies(Fig. 3b). Over the STF region, however, the prevailingwinds are easterly (Fig. 2a). The wind adjustment bythe vertical mixing mechanism would accelerate (decel-erate) the easterlies on the southern (northern) flank ofthe SST front, generating an anticyclonic wind curl, op-posite to what is observed. Some other mechanisms areresponsible for the cyclonic wind curl along the STF.
4. Structures and mechanisms
This section examines spatiotemporal characteristicsof the wind curl trough using JRA-25. Figure 4 shows
time–longitude diagrams in May 2001 of wind stresscurl, rain rate, and sea level pressure, meridionally av-eraged over the trough region between 23° and 27°N.For sea level pressure, before calculating the meridio-nal average, we subtract a 10° meridional moving aver-age from the original data to remove the large-scalebackground field. Although only results for 2001 areshown, similar features are seen during other years.
In the STF region, cyclonic wind curls occur inter-mittently and propagate eastward with a typical periodof several days. The cyclonic curl is accompanied byrain and low sea level pressure, suggesting a deep struc-ture in the atmosphere. Indeed, JRA-25 indicates thatprecipitation in this region is due largely to convectiveprecipitation rather than large-scale condensation. Theprecipitation over the STF is consistent with the localincrease in rain observed by TRMM satellite (Fig. 3d).
a. Vertical structure
This subsection investigates the vertical structure ofthe cyclonic wind curl near the STF using JRA-25. Forthis, we make two composites based on the May timeseries of wind curl at 142.875°E (in Fig. 4) for sevenyears: one by averaging the data when positive curlvalues exceed one standard deviation and the other by
FIG. 4. Time–longitude diagrams of wind stress curl (contours at intervals of 3 10�7 N m�3) alongwith (left) sea level pressure anomaly and (right) rain rates (gray shading). These are obtained froma meridional average of the JRA-25 data between 23° and 27°N and then smoothed with a 12-hmoving average.
5964 J O U R N A L O F C L I M A T E VOLUME 21

averaging the data when the curl is negative. Theformer represents the mean structure for the cyclonicwind curl; the latter the absence of the cyclonic curl.Note that our results are not sensitive to the choice ofthe reference longitude; the same results are obtainedat other nearby longitudes. A close inspection of dailysurface weather maps published by the JMA indicatesthat three events of cyclonic curl are typhoons thatformed to the south and moved to the STF region.These typhoons (during 10–13 May 2000, 18–20 May2002, and 23–25 May 2003) are excluded from theanalysis. Out of 868 6-hourly maps, 81 and 493 are in-cluded in the strong cyclonic and anticyclonic curl com-posites, respectively.
Figure 5 shows the composite meridional profiles ofSST and surface air temperature (SAT) and the com-posite latitude–height sections of potential temperatureand wind velocity. In both composites, the meridionalvariations in SAT follow well those in SST (Fig. 5a),and an air temperature front is anchored by the STFbetween 21° and 29°N within the atmospheric boundarylayer below 925 hPa (Figs. 5a,b,d). Thus, the STF main-tains surface baroclinicity of the atmosphere. It is notedthat the temperature front is also recognized as thefront of equivalent potential temperature because ofthe contrast between warm, wet air to the south andcold, dry air to the north.
Although there is no notable difference in SST (Fig.5a), the distributions of wind and temperature are quitedifferent between the two composites. When the cy-clonic curl is absent at the surface, southerly winds aredominant at the surface in the STF region (Fig. 5b). Onthe other hand, when the cyclonic curl is present, north-erly winds blow from the north over the STF and con-verge with the southerly winds, leading to a strong up-ward motion around 24°N (Figs. 5d,e). The upward mo-tion is consistent with the result, from Fig. 4, that thecyclonic curl is associated with low sea level pressure.The SAT decreases (increases) significantly north(south) of the wind convergence as a result of cold(warm) advection in the boundary layer (Fig. 5a).
Figure 6 shows the cyclonic–anticyclonic compositedifference. The surface wind convergence near the STFis caused by both the northerly winds and the intensi-fied southerly winds. The upward motion occurs mainlyover the southern, warm flank of the STF between 21°and 26°N and reaches the 200-hPa level with a maxi-mum upward velocity of 2.6 cm s�1 around 300 hPa(Fig. 5e), causing large changes in the circulation of theupper troposphere (Fig. 6a). The upward motion is co-incident with a significant increase in moisture, espe-cially in the lower troposphere (Fig. 6b), and a localmaximum in convective rain (Fig. 6c). Another remark-
able feature for the cyclonic curl is the presence of adownward motion to the north of 30°N below 200 hPa,accompanied by the decrease in tropospheric moistureand convective rain.
The increase in moisture occurs within the entire aircolumn between 21° and 26°N because of the moisturesupply by the upward motion. Specific humidity formsa broad meridional maximum above the atmosphericboundary layer (not shown), consistent with the humidtongue in satellite-observed columnar water vapor (Fig.
FIG. 5. (a) Meridional profiles at 142.875°E of SST and SAT inthe cyclonic (solid lines) and anticyclonic (dashed lines) curl com-posites, along with 95% confidence intervals for the SAT. Lati-tude–height sections of meridional and vertical winds (vectors)and potential temperature (K) (contours) for (b), (c) the anticy-clonic and (d), (e) the cyclonic curl composite. These are derivedfrom JRA-25. The vertical wind speed is multiplied by 100.
15 NOVEMBER 2008 K O B A S H I E T A L . 5965

2d). The latter lends strong support that the surfacecyclonic curls near the STF are associated with deepatmospheric adjustment.
The convective rain indicates latent heating to theatmosphere over the STF. This is confirmed by calcu-lating the apparent heat source Q1 and the apparentmoisture sink Q2 (e.g., Yanai et al. 1973; Yanai andTomita 1998), defined as
Q1 � Cp� p
p0�R�Cp���
�t� v � �� � �
��
�p�and
Q2 � �L��q
�t� v � �q � �
�q
�p�.
Here is the potential temperature, q the mixing ratioof water vapor, V the horizontal velocity, � the pres-sure vertical velocity, R the gas constant, Cp the speci-
fic heat capacity of dry air, and L the latent heat ofcondensation. Figure 7 shows the composite latitude–height sections of Q1 and Q2 for the cyclonic curl case.The large Q1 appears over the entire troposphere onthe southern flank of the STF, accompanied by Q2 ofsimilar magnitude, indicating that the heat sourcemainly comes from the release of latent heat of con-densation over the STF. The vertical peak of Q1 is lo-cated above that of Q2 because of the latent heat trans-port by strong upward motion there. The convectiveheating lowers surface pressure and forces deep upwardmotion. The vertical stretching in the convective regioncauses cyclonic vorticity in the lower troposphere asobserved by QuikSCAT in surface winds.
Figure 8 shows the longitude–height sections of cy-clonic–anticyclonic composite differences in geopoten-tial height, vector wind velocity, and potential tempera-ture at 25°N. The wind stress curl and sea level pressureare also shown in Fig. 8d for the cyclonic curl compos-ite. For sea level pressure, a 15-day moving average issubtracted from the original data to remove the back-ground field.
Because the composites are made with respect to thewind stress curl at 142.875°E, the surface curl peaks atthis reference longitude (Fig. 8d). The axis of the lowpressure trough tilts westward with height (Fig. 8a).The upward motion occurs to the east of this troughaxis between 140° and 155°E, where temperature in-creases except at 600–700 hPa (Fig. 8c). In the down-ward motion region west of the trough axis, tempera-
FIG. 6. Cyclonic–anticyclonic curl composite differences of (a)meridional and vertical winds and (b) specific humidity (g kg�1) at142.875°E: open circles in (a) and (b) show grid points of signif-icant difference with confidence greater than 95%; the verticalwind speed is multiplied by 100. (c) Meridional profiles of con-vective rain rate (mm day�1) in the cyclonic (solid line) and theanticyclonic (dashed line) curl composites, along with 95% con-fidence intervals. These are derived from JRA-25.
FIG. 7. Latitude–height sections at 142.875°E of the heat sourceQ1 and the moisture sink Q2 in the cyclonic curl composite, cal-culated from JRA-25.
5966 J O U R N A L O F C L I M A T E VOLUME 21

ture decreases except at 500 hPa. This pattern of warmair rising and cold air sinking indicates the well-knownenergy conversion from potential to kinetic energy.Thus, the disturbance with surface cyclonic curl is as-sociated with atmospheric baroclinic instability over theSTF. Although the vertical structure somewhat differsfrom the classical baroclinic instability waves of Eady(1949), the difference may be partly attributable to thelatent heating effect in upward motion. In fact, the tem-perature profile with a cold anomaly at 600–700 hPa inthe warm/upwelling sector is similar to the results fromBannon (1986) and Jiang and Gutowski (2000), whoinvestigated baroclinic instability in the presence ofcondensational heating.
b. Cyclonic disturbances over the STF
Not only cyclonic but also anticyclonic disturbancesappear along the STF, which are found on both sides of
cyclonic disturbances in Fig. 8. We examine the prob-ability density function of disturbances along the STFusing high-pass filtered sea level pressures and surfacewind stress curls in May (Fig. 9). The frequency ofnegative sea level pressure anomalies is generallyhigher than that of positive ones, with large deviationsfrom the Gaussian distribution for negative anomalies.A similar feature is also seen from the wind stress curls.The frequency of large positive curls (�1 10�7 Nm�3) is significantly higher than the Gaussian fit. Theseprobability distribution functions indicate that lowpressure systems tend to be well developed and en-hanced along the STF.
Figure 10 shows the horizontal distribution of theprobability of low pressure disturbances with positivewind curls. The relatively high probability of lows isfound in almost the same area as the surface wind curltrough (Fig. 2c), following roughly the large SST gra-
FIG. 8. Cyclonic–anticyclonic curl composite differences of (a)geopotential height (gpm), (b) zonal and vertical winds, and (c)potential temperature (K) at 25°N: open circles in (a)–(c) showgrid points of significant difference with confidence greater than95%; a thick vertical line indicates a reference longitude for thecomposites; the vertical wind speed is multiplied by 200. (d) Com-posite profiles of wind stress curl (triangles) and high-pass-filteredsea level pressure (circles) for the cyclonic curl case, along with95% confidence intervals. These are derived from JRA-25.
FIG. 9. Probability density function of (a) high-pass-filtered sealevel pressure and (b) surface wind stress curl in May in the STFregion 23°–27°N, 135°–155°E: dark shading indicates that theprobability of low pressures (cyclonic curls) is higher than that ofhigh pressures (anticyclonic curls), and a thick curve denotes aGaussian fit, assuming a symmetrical distribution of the probabil-ity of high pressures (anticyclonic curls) with respect to the centerof the probability at 0.5 hPa (�0.5 10�7 N m�3). These arederived from JRA-25.
15 NOVEMBER 2008 K O B A S H I E T A L . 5967
dient of the STF (Fig. 2b) and hence strong atmosphericbaroclinicity. Such high probability is not seen to thenorth or south away from the STF. Low pressure sys-tems are more intense than the high pressure ones onthe STF, and this asymmetry results in the formation ofthe cyclonic curl band along the STF. Indeed, the meanfield computed solely from the days of anticyclonicwind curls does not display a wind curl trough (notshown).
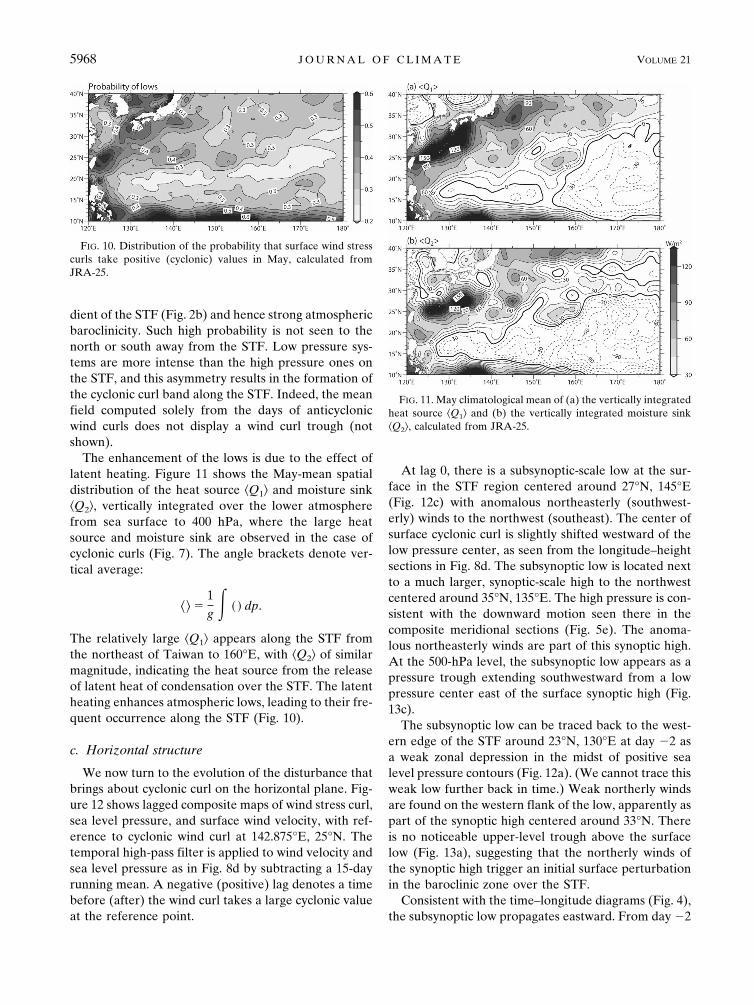
The enhancement of the lows is due to the effect oflatent heating. Figure 11 shows the May-mean spatialdistribution of the heat source �Q1� and moisture sink�Q2�, vertically integrated over the lower atmospherefrom sea surface to 400 hPa, where the large heatsource and moisture sink are observed in the case ofcyclonic curls (Fig. 7). The angle brackets denote ver-tical average:
�� �1g � � dp.
The relatively large �Q1� appears along the STF fromthe northeast of Taiwan to 160°E, with �Q2� of similarmagnitude, indicating the heat source from the releaseof latent heat of condensation over the STF. The latentheating enhances atmospheric lows, leading to their fre-quent occurrence along the STF (Fig. 10).
c. Horizontal structure
We now turn to the evolution of the disturbance thatbrings about cyclonic curl on the horizontal plane. Fig-ure 12 shows lagged composite maps of wind stress curl,sea level pressure, and surface wind velocity, with ref-erence to cyclonic wind curl at 142.875°E, 25°N. Thetemporal high-pass filter is applied to wind velocity andsea level pressure as in Fig. 8d by subtracting a 15-dayrunning mean. A negative (positive) lag denotes a timebefore (after) the wind curl takes a large cyclonic valueat the reference point.
At lag 0, there is a subsynoptic-scale low at the sur-face in the STF region centered around 27°N, 145°E(Fig. 12c) with anomalous northeasterly (southwest-erly) winds to the northwest (southeast). The center ofsurface cyclonic curl is slightly shifted westward of thelow pressure center, as seen from the longitude–heightsections in Fig. 8d. The subsynoptic low is located nextto a much larger, synoptic-scale high to the northwestcentered around 35°N, 135°E. The high pressure is con-sistent with the downward motion seen there in thecomposite meridional sections (Fig. 5e). The anoma-lous northeasterly winds are part of this synoptic high.At the 500-hPa level, the subsynoptic low appears as apressure trough extending southwestward from a lowpressure center east of the surface synoptic high (Fig.13c).
The subsynoptic low can be traced back to the west-ern edge of the STF around 23°N, 130°E at day �2 asa weak zonal depression in the midst of positive sealevel pressure contours (Fig. 12a). (We cannot trace thisweak low further back in time.) Weak northerly windsare found on the western flank of the low, apparently aspart of the synoptic high centered around 33°N. Thereis no noticeable upper-level trough above the surfacelow (Fig. 13a), suggesting that the northerly winds ofthe synoptic high trigger an initial surface perturbationin the baroclinic zone over the STF.
Consistent with the time–longitude diagrams (Fig. 4),the subsynoptic low propagates eastward. From day �2
FIG. 10. Distribution of the probability that surface wind stresscurls take positive (cyclonic) values in May, calculated fromJRA-25.
FIG. 11. May climatological mean of (a) the vertically integratedheat source �Q1� and (b) the vertically integrated moisture sink�Q2�, calculated from JRA-25.
5968 J O U R N A L O F C L I M A T E VOLUME 21

FIG. 12. Time-lagged composite maps of wind stress curl (shading) and temporally high-pass-filtered surface wind and sea level pressure (hPa) (contours) with reference to the cyclonic wind curlat 142.875°E in Fig. 4: wind velocity less than 0.5 m s�1 is masked out; wind stress curl is shown onlyfor a significantly cyclonic area with 95% confidence, with values greater than 0.7 10�7 and 1.4 10�7 N m�3 shaded lightly and darkly over the ocean, respectively. These are derived from JRA-25.See the text for details.
15 NOVEMBER 2008 K O B A S H I E T A L . 5969

to �2 the low travels along 26°N (the latitude of theSTF) and intensifies along with the upper-level trough.During the course, the surface low is attached to thesynoptic high to the north, which is a migratory mid-latitude disturbance in the main storm track. The sur-face low weakens around day �4 and becomes uniden-tifiable by day �5. East of 160°E the STF still maintains
large SST gradients, but the high moisture tongue dis-appears with columnar water decreasing rapidly east-ward (Fig. 2d). The decay of the surface low and high-moisture tongue is probably due to low SST there (Fig.2d), which is unfavorable for deep convection. Theo-retical studies suggest that latent heating intensifiesbaroclinic instability (e.g., Bannon 1986).
FIG. 13. Time-lagged composite maps of high-pass-filtered geopotential height at 500 hPa (shades)and sea level pressure (hPa) (contours), with reference to the cyclonic wind curl at 142.875°E in Fig.4. These are derived from JRA-25.
5970 J O U R N A L O F C L I M A T E VOLUME 21

The composite evolution of the subsynoptic low issometimes seen on synoptic weather maps. Figure 14shows one example during 14–18 May 2005. A weaksurface low is first seen at noon on 14 May northeastof Taiwan centered around 26°N, 130°E (Fig. 14a)
with northeasterly (southwesterly) winds to the north(south). The northeasterly winds come from the synop-tic high to the north. The surface low then intensifieswhile propagating eastward along the STF (Figs. 14b,c).After reaching 150°E the low begins moving north on
FIG. 14. Instantaneous maps of high-pass-filtered surface wind and sea level pressure (contouredevery 2 hPa) during 14–18 May 2005, derived from JRA-25.
15 NOVEMBER 2008 K O B A S H I E T A L . 5971

17 May (Figs. 14d,e), followed by its decay on 18 May(Fig. 14f).
5. Summary and discussion
We have used satellite observations and JRA-25 toinvestigate a trough of anticyclonic wind stress curl overthe North Pacific STF first reported by Yoshida andKidokoro (1967a,b). Our results confirm that there is ameridional minimum in the background of anticycloniccurls between 22° and 28°N in the western subtropicalgyre. The trough is located on the southern flank of theSTF, most pronounced during April–May. Along thiscurl trough, tropospheric moisture increases, forming ameridional maximum in independent satellite observa-tions. A high-resolution coupled GCM reproduces thissurface trough and high moisture tongue along the STF.
Our analysis of JRA-25 reveals that the STF anchorsa temperature front and maintains baroclinicity in theatmospheric boundary layer. Cyclonic wind curls in thetrough on the STF occur intermittently in low pressuredisturbances that propagate eastward with a period ofseveral days and are accompanied with convective rain.The axis of the low pressure trough tilts slightly west-ward with height, and the upward motion is located tothe east. The temperature displays a pattern of warmair rising and cold air sinking, suggestive of baroclinicinstability. When the cyclonic curl is present, anoma-lous northeasterly and southwesterly winds convergeonto the STF, forcing upward motion from the surfaceto 200 hPa. Convective precipitation ensures that thelatent heating enhances low pressure disturbance gen-esis, leading to formation of the cyclonic wind curlalong the STF. The vertical transport by the upwardmotion is responsible for the formation of a high co-lumnar water vapor band observed by satellite.
On the horizontal plane, the low pressure distur-bance on the STF is a subsynoptic scale, accompanyinga larger, synoptic-scale migratory anticyclone in thestorm track to the north. A time-lagged compositeanalysis shows that the low is first recognized as asmaller-scale low on the western edge of the STF. It issuggested that surface northerly winds of the synoptichigh trigger the initial perturbation in the atmosphericbaroclinicity zone along the STF. The low intensifies asit travels along the STF, accompanied by a pressuretrough in the upper atmosphere. The surface low weak-ens around 165°E as it moves into cooler waters, whichare not conducive to deep convection.
Why does the cyclonic wind curl develop preferen-tially in April to May? We consider three factors re-lated to the development of the subsynoptic low: stormtrack activity, atmospheric baroclinicity, and moisture.
Figure 15 shows the standard deviation of high-passfiltered meridional winds at 850 hPa, SAT gradient, andhumidity. A major storm track is found around 35°Nnorth of the STF during September to May with twomajor peaks around January and March, roughly inagreement with the results from previous studies (Na-kamura 1992; Nakamura et al. 2004). The atmosphericbaroclinicity is large around 25°N from January toJune, anchored by the SST front (thick contours in Fig.15b). The SAT front slightly weakens from April toMay despite equally strong SST gradients, possibly aresult of baroclinic adjustment. The seasonal evolutionof surface moisture roughly follows that of the SAT(SST), with surface humidity increasing rapidly fromApril to May south of the STF because of the SST
FIG. 15. Seasonal cycle as represented in time–latitude sectionsfrom JRA-25: (a) standard deviation of high-pass filtered merid-ional wind at 850 hPa; (b) SAT (contours) and the magnitude ofSAT gradient (shading); and (c) surface specific humidity (gkg�1), zonally averaged between 135° and 145°E. Thick contoursin (a)–(c) denote SST gradient magnitudes at 6.0 10�6 and8.0 10�6 °C m�1, marking the STF around 25°N. These areobtained from JRA-25.
5972 J O U R N A L O F C L I M A T E VOLUME 21

warming. Thus high SST and high humidity conduciveto deep convection favor surface trough formationalong the STF in April–May. During winter, atmo-spheric storm activity and baroclinicity are both highbut SST is too low, whereas during summer and fall SSTis high but the STF is absent. The deep convective na-ture of atmospheric adjustment to the STF sets it apartfrom the other type of atmospheric response to SSTfronts, ubiquitously observed over a cool ocean, that ischaracterized by surface wind acceleration (decelera-tion) on the warmer (colder) flank of a front (Xie 2004).
The northerly winds of synoptic highs advect cold airto the south (Fig. 5a). Such cold air advection some-times causes significant changes in convective activity insouthern warm oceans. This phenomenon has beenstudied for cold surges off the east coast of China dur-ing the winter monsoon (e.g., Lau and Li 1984). Dingand Liu (2001) pointed out that cold air intrusion due tothe southward shift of the upper westerly jet induces arapid amplification of convection in May in the north-ern South China Sea, triggering the onset of the sum-mer monsoon there. They suggested as a possiblemechanism that the enhanced temperature gradientand baroclinicity in the cold surge intensify convection.The convection growing on the increased baroclinicitymay resemble the low development on the STF pre-sented in this study, but the enhanced baroclinicityalong the STF is due to the SST front rather than coldair advection.
Frequent cyclogenesis occurs northeast of Taiwan(Chen et al. 1991; Adachi and Kimura 2007), to west ofthe STF. This region of cyclogenesis is identified in Fig.10 as the frequent appearance of lows. There, the cy-clogenesis is due mostly to surface baroclinicity associ-ated with SST gradients across the Kuroshio (Hansonand Long 1985; Xie et al. 2002). Our analysis suggeststhat these Taiwan cyclones, often accompanying synop-tic highs to the north, provide initial perturbations thatgrow along the STF. Indeed, the time–longitude dia-gram in Fig. 4 displays some cyclones coming from theKuroshio region around 123°E.
Our results confirm the existence of an anticycloniccurl trough first suggested by Yoshida and Kidokoro(1967a,b). Whereas Yoshida and Kidokoro exploredthe possibility that this curl trough drives the STCC, ourstudy focuses on meteorological aspects of the forma-tion of the wind curl trough. In particular, we find en-hanced precipitation associated with the wind curltrough (Fig. 3d). This increase in precipitation appearsto correspond to the so-called pre-baiu/meiyu front, in-dependently identified from previous meteorologicalstudies. The pre-baiu/meiyu front is manifested as acloud and rainband and is one of the most remarkable
events in the seasonal march of the East Asia summermonsoon. Using infrared satellite observations and sur-face weather maps, Kato and Kodama (1992) found aquasi-stationary cloud band in May along 25°N beforethe onset of the baiu season in Japan, which tends toform south of migratory anticyclones centered andpropagating around 30°–40°N. These characteristics aresimilar to our results. A similar cloud band is also foundfrom Tanaka’s (1992) long-term climatology of satellitecloud data. Wang and LinHo (2002) described a similarrainband based on long-term precipitation data. Thesestudies, however, have not investigated the underlyingoceanic conditions and the STF in particular. Our re-sults suggest that the STF anchors this pre-baiu/meiyucloud/rain band, a hypothesis that needs further inves-tigations. While pre-baiu/meiyu subsynoptic lows onthe STF display a westward phase tilt with height, somemesoscale lows that develop 1–2 months later on thebaiu/meiyu front to the north show an eastward phasetilt (Tagami et al. 2005), possibly indicative of a stron-ger condensational heating effect.
The JRA-25 captures the trough of anticyclonic windcurls observed by satellite. The horizontal grid spacingof the JRA-25 is approximately 1.125°, barely sufficientto resolve the trough whose meridional scale about 5°(Fig. 2c). It should be noticed, however, that the actualresolution of a numerical model in the sense of abilityto represent a given feature is known to be generally 4to 10 times larger than the grid spacing (Pielke 1991;Grasso 2000; Walters 2000; Durran 2000). Thus, thewind curl trough from the JRA-25 is somewhatsmoothed. Indeed, compared to satellite observations(Fig. 2c), the May climatology of surface wind stresscurl calculated from the JRA-25 displays a weak andmeridionally smoothed wind curl trough. The subsyn-optic lows that develop along the STF and are respon-sible for the curl trough may be more intense in mag-nitude and smaller in spatial scale in the real world thanin the JRA-25.
Although not essential to the formation of STCC(Takeuchi 1984; Kubokawa 1999), the cyclonic windcurl may still influence and feed back onto the STCC.The Hawaiian Lee Countercurrent (HLCC) serves asan example. Although to first order the HLCC is oro-graphically generated by the tall Hawaiian Islands (Xieet al. 2001; Sakamoto et al. 2004), Sasaki and Nonaka(2006) showed from a high-resolution ocean simulationthat HLCC-induced SST changes alter wind curl(Hafner and Xie 2003), extending the HLCC far to thewest. Similar feedback may be possible in the STCCregion, with the STF-induced cyclonic wind curl modi-fying the STCC through Sverdrup dynamics. For ex-ample, the STCC varies on seasonal and interannual
15 NOVEMBER 2008 K O B A S H I E T A L . 5973

time scales (White et al. 1978; Kobashi and Kawamura2002), but the mechanism has not been clarified. Weneed to evaluate the influence of the cyclonic wind curlas well as the potential vorticity dynamics of Kubokawa(1999) and Kobashi et al. (2006) for a fuller understand-ing of STCC variations.
A similar local minimum of wind curl has also beenreported in the subtropical gyre of the North Atlantic(Yoshida and Kidokoro 1967b; Schmitz et al. 1992).Schmitz et al. noticed from wind stress maps that Sver-drup transport streamlines are commonly distortedeastward near 30°N in the western subtropical gyre.The distortion is probably attributable to the existenceof a wind curl trough. They further noted that the re-gional pattern of Sverdrup transport seems to be inagreement with the observed geostrophic flow. TheSTF exists with large horizontal SST gradients in theNorth Atlantic (e.g., Voorhis and Hersey 1964; Ullmanet al. 2007). The distortion of Sverdrup transport ap-pears to occur roughly along the STF. It would be in-teresting to explore whether the North Atlantic windcurl trough is formed in the same way as in the NorthPacific.
Acknowledgments. We thank H. Nakamura for com-ments and helpful discussion. Careful comments fromthe anonymous reviewers helped improve an early ver-sion of the manuscript. This work is partially supportedby the Ministry of Education, Culture, Sports, Scienceand Technology, Japan [Grant-in-Aid for Young Sci-entists (B), Nos. 17740305 and 20740267] and by theJapan Society for the Promotion of Science [Grant-in-Aid for Scientific Research (B), No. 17340137], the Ja-pan Agency for Marine–Earth Science and Technology,and the U.S. National Aeronautic and Space Adminis-tration and National Science Foundation. The satellitedata were obtained from the Remote Sensing Systemswebsite, and the Japanese 25-year Reanalysis (JRA-25)from the website of the Japan Meteorological AgencyGlobal Environment and Marine Department. IPRCpublication 524 and SOEST publication 7461.
REFERENCES
Adachi, S., and F. Kimura, 2007: A 36-year climatology of surfacecyclogenesis in East Asia using high-resolution reanalysisdata. SOLA, 3, 113–116.
Aoki, Y., T. Suga, and K. Hanawa, 2002: Subsurface subtropicalfronts of the North Pacific as inherent boundaries in the ven-tilated thermocline. J. Phys. Oceanogr., 32, 2299–2311.
Bannon, P. R., 1986: Linear development of quasi-geostrophicbaroclinic disturbances with condensational heating. J. At-mos. Sci., 43, 2261–2274.
Chelton, D. B., and Coauthors, 2001: Observation of coupling be-
tween surface wind stress and sea surface temperature in theeastern tropical Pacific. J. Climate, 14, 1479–1498.
——, M. G. Schlax, M. H. Freilich, and R. F. Milliff, 2004: Satellitemeasurements reveal persistent small-scale features in oceanwinds. Science, 303, 978–983, doi:10.1126/science.1091901.
Chen, S.-J., Y.-H. Kuo, P.-Z. Zhang, and Q.-F. Bai, 1991: Synopticclimatology of cyclogenesis over East Asia, 1958–1987. Mon.Wea. Rev., 119, 1407–1418.
Ding, Y., and Y. Liu, 2001: Onset and the evolution of the summermonsoon over the South China Sea during SCSMEX fieldexperiment in 1998. J. Meteor. Soc. Japan, 79, 255–276.
Durran, D. R., 2000: Comments on “The differentiation betweengrid spacing and resolution and their application to numericalmodeling.” Bull. Amer. Meteor. Soc., 81, 2478.
Eady, E. T., 1949: Long waves and cyclone waves. Tellus, 1, 33–52.Grasso, L. D., 2000: The differentiation between grid spacing and
resolution and their application to numerical modeling. Bull.Amer. Meteor. Soc., 81, 579–580.
Hafner, J., and S.-P. Xie, 2003: Far-field simulation of the Hawai-ian wake: Sea surface temperature and orographic effects. J.Atmos. Sci., 60, 3021–3032.
Hanson, H. P., and B. Long, 1985: Climatology of cyclogenesisover the East China Sea. Mon. Wea. Rev., 113, 697–707.
Hasumi, H. and S. Emori, Eds., 2004: Coupled GCM (MIROC)description. K-1 Tech. Rep. 1, Center for Climate SystemResearch, University of Tokyo, 34 pp. [Available online athttp://www.ccsr.u-tokyo.ac.jp/kyosei/hasumi/MIROC/tech-repo.pdf.]
Hidaka, K., 1958: Computation of the wind stresses over theoceans. Rec. Oceanogr. Works Japan, 4, 77–123.
Holton, J. R., 2004: An Introduction to Dynamical Meteorology.4th ed. Academic Press, 535 pp.
Jiang, W., and W. J. Gutowski, 2000: Moist baroclinic instability inthe presence of surface–atmosphere coupling. J. Atmos. Sci.,57, 2923–2935.
Kato, K., and Y. Kodama, 1992: Formation of the quasi-stationaryBaiu front to the south of the Japan Islands in early May of1979. J. Meteor. Soc. Japan, 70, 631–647.
Kobashi, F., and H. Kawamura, 2002: Seasonal variation and in-stability nature of the North Pacific Subtropical Countercur-rent and the Hawaiian Lee Countercurrent. J. Geophys. Res.,107, 3185, doi:10.1029/2001JC001225.
——, H. Mitsudera, and S.-P. Xie, 2006: Three subtropical frontsin the North Pacific: Observational evidence for mode water-induced subsurface frontogenesis. J. Geophys. Res., 111,C09033, doi:10.1029/2006JC003479.
Kondo, J., 1975: Air–sea bulk transfer coefficients in diabatic con-ditions. Bound.-Layer Meteor., 9, 91–112.
Kubokawa, A., 1999: Ventilated thermocline strongly affected bya deep mixed layer: A theory for subtropical countercurrent.J. Phys. Oceanogr., 29, 1314–1333.
——, and T. Inui, 1999: Subtropical countercurrent in an idealizedocean GCM. J. Phys. Oceanogr., 29, 1303–1313.
Lau, K. M., and M. T. Li, 1984: The monsoon of East Asia and itsglobal associations—A survey. Bull. Amer. Meteor. Soc., 65,114–125.
Nakamura, H., 1992: Midwinter suppression of baroclinic waveactivity in the Pacific. J. Atmos. Sci., 49, 1629–1642.
——, T. Sampe, Y. Tanimoto, and A. Shimpo, 2004: Observedassociations among storm tracks, jet streams and midlatitudeoceanic fronts. Earth’s Climate: The Ocean–Atmosphere In-teraction, Geophys. Monogr., Vol. 147, Amer. Geophys.Union, 329–346.
5974 J O U R N A L O F C L I M A T E VOLUME 21

Nonaka, M., and S.-P. Xie, 2003: Co-variations of sea surfacetemperature and wind over the Kuroshio and its extension:Evidence for ocean-to-atmosphere feedback. J. Climate, 16,1404–1413.
O’Neill, L. W., D. B. Chelton, and S. K. Esbensen, 2003: Obser-vations of SST-induced perturbations of the wind stress fieldover the Southern Ocean on seasonal time scales. J. Climate,16, 2340–2354.
Onogi, K., and Coauthors, 2007: The JRA-25 Reanalysis. J. Me-teor. Soc. Japan, 85, 369–432.
Pielke, R. A., 1991: A recommended specific definition of “reso-lution.” Bull. Amer. Meteor. Soc., 72, 1914.
Roden, G. I., 1975: On the North Pacific temperature, salinity,sound velocity, and density fronts and their relation to thewind and energy flux fields. J. Phys. Oceanogr., 5, 557–571.
——, 1980: On the variability of surface temperature fronts in thewestern Pacific, as detected by satellite. J. Geophys. Res., 85,2704–2710.
Sakamoto, T. T., A. Sumi, S. Emori, T. Nishimura, H. Hasumi, T.Suzuki, and M. Kimoto, 2004: Far-reaching effects of the Ha-waiian Islands in the CCSR/NIES/FRCGC high-resolutionclimate model. Geophys. Res. Lett., 31, L17212, doi:10.1029/2004GL020907.
——, H. Hasumi, M. Ishii, S. Emori, T. Suzuki, T. Nishimura, andA. Sumi, 2005: Responses of the Kuroshio and the KuroshioExtension to global warming in a high-resolution climatemodel. Geophys. Res. Lett., 32, L14617, doi:10.1029/2005GL023384.
Sasaki, H., and M. Nonaka, 2006: Far-reaching Hawaiian LeeCountercurrent driven by wind-stress curl induced by warmSST band along the current. Geophys. Res. Lett., 33, L13602,doi:10.1029/2006GL026540.
Schmitz, W. J., Jr., J. D. Thompson, and J. R. Luyten, 1992: TheSverdrup circulation for the Atlantic along 24°N. J. Geophys.Res., 97, 7251–7256.
Tagami, H., H. Niino, W. Yanase, and T. Kato, 2005: Character-istics of the Meso-�-scale low on the Baiu front (in Japanese).Tenki, 52, 767–770.
Takeuchi, K., 1984: Numerical study of the Subtropical Front andthe Subtropical Countercurrent. J. Oceanogr., 40, 371–381.
Tanaka, M., 1992: Intraseasonal oscillation and the onset and re-treat dates of the summer monsoon over East, SoutheastAsia and the western Pacific region using GMS high cloudamount data. J. Meteor. Soc. Japan, 70, 613–629.
Tokinaga, H., and Coauthors, 2006: Atmospheric sounding overthe winter Kuroshio Extension: Effect of surface stability onatmospheric boundary layer structure. Geophys. Res. Lett.,33, L04703, doi:10.1029/2005GL025102.
Uda, M., and K. Hasunuma, 1969: The eastward subtropical coun-tercurrent in the western North Pacific Ocean. J. Oceanogr.Soc. Japan, 25, 201–210.
Ueda, H., and T. Yasunari, 1996: Maturing process of the summermonsoon over the western North Pacific: A coupled ocean/atmosphere system. J. Meteor. Soc. Japan, 74, 493–508.
Ullman, D. S., P. C. Cornillon, and Z. Shan, 2007: On the charac-teristics of subtropical fronts in the North Atlantic. J. Geo-phys. Res., 112, C01010, doi:10.1029/2006JC003601.
Voorhis, A. D., and J. B. Hersey, 1964: Oceanic thermal fronts inthe Sargasso Sea. J. Geophys. Res., 69, 3809–3814.
Wallace, J. M., T. P. Mitchell, and C. Deser, 1989: The influenceof sea surface temperature on surface wind in the easternequatorial Pacific: Seasonal and interannual variability. J.Climate, 2, 1492–1499.
Walters, M. K., 2000: Comments on “The differentiation betweengrid spacing and resolution and their application to numericalmodeling.” Bull. Amer. Meteor. Soc., 81, 2475–2477.
Wang, B., and LinHo, 2002: Rainy season of the Asian–Pacificsummer monsoon. J. Climate, 15, 386–398.
White, W. B., K. Hasunuma, and H. Solomon, 1978: Large-scaleseasonal and secular variability of the subtropical front in thewestern North Pacific from 1954 to 1974. J. Geophys. Res., 83,4531–4544.
Xie, S.-P., 2004: Satellite observations of cool ocean–atmosphereinteraction. Bull. Amer. Meteor. Soc., 85, 195–208.
——, W. T. Liu, Q. Liu, and M. Nonaka, 2001: Far-reaching ef-fects of the Hawaiian Islands on the Pacific Ocean–atmo-sphere system. Science, 292, 2057–2060.
——, J. Hafner, Y. Tanimoto, W. T. Liu, H. Tokinaga, and H. Xu,2002: Bathymetric effect on the winter sea surface tempera-ture and climate of the Yellow and East China Seas. Geo-phys. Res. Lett., 29, 2228, doi:10.1029/2002GL015884.
Yanai, M., and T. Tomita, 1998: Seasonal and interannual vari-ability of atmospheric heat sources and moisture sinks asdetermined from NCEP–NCAR Reanalysis. J. Climate, 11,463–482.
——, S. Esbensen, and J. H. Chu, 1973: Determination of bulkproperties of tropical cloud clusters from large-scale heat andmoisture budgets. J. Atmos. Sci., 30, 611–627.
Yoshida, K., and T. Kidokoro, 1967a: A subtropical countercur-rent in the North Pacific—An eastward flow near the sub-tropical convergence. J. Oceanogr. Soc. Japan, 23, 88–91.
——, and ——, 1967b: A subtropical countercurrent (II)—A pre-diction of eastward flows at lower subtropical latitudes. J.Oceanogr. Soc. Japan, 23, 231–236.
15 NOVEMBER 2008 K O B A S H I E T A L . 5975