Embed Size (px)
Citation preview
Information for HMA Review Data Supplement
FLOODPLAIN AND STREAM RESTORATION
Page 1 of 23
December 2016
££ PROVIDE A VICINITY MAP WITH ADDRESS AND PROJECT BOUNDARIES
Potential Sources: Provide a map showing project extents. Provide a clear delineation of areas disturbed to construct the project, including potential offsite areas such as spoils disposal locations.
Include the address(es) of the mitigation project. This includes street name and number, city, county or parish, state, and zip code for the property. A post office box number is not an acceptable address.
Map(s) and/or site survey(s) should show the project boundaries and identify all the property parcels that are included in the project area, as well as adjacent parcels. Tax Parcel maps, Property Survey Map, US Geological Survey (USGS) topographic map, aerial photographs are some acceptable resources. Obtain the information from the property owner, local building inspector, tax assessor records, deed to the property, or engineering plans.
Example: A site survey was conducted by a licensed surveyor to clearly establish project and property boundaries. Attached map shows the location of the project located at 4456 River Road NE, Martinsburg, Berkeley County, WV 25409.
££ IDENTIFY PROJECT LOCATION BY LATITUDE AND LONGITUDE IN DECIMAL DEGREES
Potential Sources: There are several ways to obtain the latitude and longitude of a property. Options include:
¡ Use a Global Positioning System (GPS) device.
¡ Enter the property address into a mapping application to find the coordinates. Several free tools are available that generate the latitude and longitude coordinates when you type in an address. Enter “how to find GPS coordinates” into an Internet search engine to find a mapping application.
Note: Note that latitude and longitude are shown in either decimal degrees (e.g., 38.889463, -77.035237) or degrees, minutes, and seconds (38° 53’ 22.1’’ N, 77° 02’ 06.8’’ W). If your GPS or tool provides degrees, minutes, and seconds, you may need to convert this into decimal degrees in order to enter it into eGrants. Several free tools are available on the Internet for this conversion. Enter “coordinate converter” into a search engine to find one of these tools.
Example: Coordinates for the Washington Monument, Washington D.C. 38.889463, -77.035237. See Figure 1.
Figure 1: Washington Monument, Washington, DC (Source: http://www.publicdomainpictures.net/)
Each Hazard Mitigation Assistance (HMA) application must comply with the requirements outlined in the HMA Guidance. According to the guidance, in addition to a general programmatic review, an Environmental Planning and Historic Preservation (EHP) review and a technical review must be performed by the Federal Emergency Management Agency (FEMA) for each proposed project. Early submission of accurate and complete information will facilitate FEMA’s review process and the release of HMA funds. This Data Supplement augments the Floodplain and Stream Restoration Job Aid by providing additional information, examples, and potential sources of documentation for items listed in the Job Aid to help communities applying for HMA grants comply with application requirements. For more information, Subapplicants and Applicants are encouraged to refer to FEMA’s Hazard Mitigation Assistance Guidance and Environmental and Historical Preservation Resources At-A-Glance Guide.
Information for HMA Review Data Supplement
FLOODPLAIN AND STREAM RESTORATION
Page 2 of 23
December 2016
££ PROVIDE SITE PHOTOGRAPHS DOCUMENTING IMPAIRED OR SCOURED STREAMS, DISCONNECTEDFLOODPLAINS, BANK EROSION CONDITIONS, VEGETATION CONDITIONS, AND EXISTING STORMWATER STRUCTURES
Potential Sources: Use a phone, tablet, or camera to take clear, good quality photos for inclusion in the application.
¡ Show close and long range photos whenever possible.
¡ Include photos of the area where the flood / high water accumulates, and the area where the injection well will be placed if applicable.
¡ The photos should be taken from multiple angles.
¡ Provide photos with sufficient detail to explain the proposed project.
¡ Label the photos to explain exactly what they show and include directions.
¡ The photos should depict the areas detailed on the site maps.
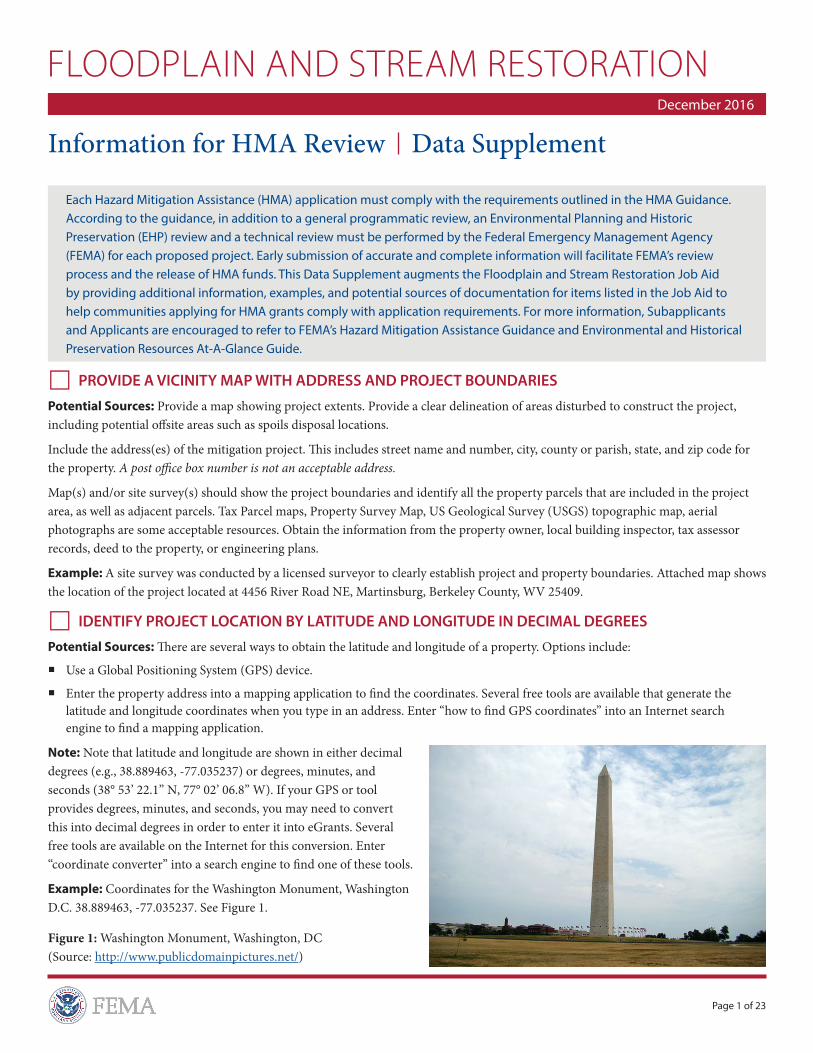
Example: Figures 2 through 5 (below) illustrate the four sides of the structure, as required.
Figure 2: View looking west across project site Figure 3: View looking west across project site showing outfall
Figure 4: View looking north across project site Figure 5: Front and west side of building
Information for HMA Review Data Supplement
FLOODPLAIN AND STREAM RESTORATION
Page 3 of 23
December 2016
££ PROVIDE CURRENT PROPERTY OWNERSHIP INFORMATION, INCLUDING ANY EASEMENTS OR COVENANTS
Potential Sources: Contact the local tax office to identify the property owners. If there are multiple properties included in the project, ensure that all property owners are provided and clearly identify what parcel (consistent with the site map) each property owner is associated with. Identify any current or potential easements, leases and/or liens on the property, as applicable.
Example: Parcel 1 owned by John Smith. Parcel 2 owned by XYZ Corp.
££ DISCUSS WATERSHED DEVELOPMENT PLANS/FUTURE LAND USE PLANS
Potential Sources: Obtain Watershed Development Plans (WDP) for specific watershed(s) within the project area from the local environmental or planning department/agency, U.S. Army Corps of Engineers (USACE) local district offices, or local USGS offices. Include information on any streams listed on the Clean Water Act Section 303(d) List of Impaired Streams, if provided in the WDP. Future Land Use Plans also found on the local planning department’s website and sometimes accompanied by a future land use map providing a generalized view of how land in the area is intended to be used in the future. Future land use information can also be found as a chapter/section within the city or town’s Comprehensive Plan.
States may be another source, through Section 319 non-point management implementation (e.g., Georgia’s Statewide Nonpoint Source Management Plan).
Example: The {INDICATE SPECIFIC WATERSHED(S) WITHIN PROJECT AREA} Watershed Plan is intended to assist watershed stakeholders in their efforts toward restoration and protection of {PROVIDE NAME(S) OF HYDROLOGIC FEATURES WITHIN WATERSHED}.
According to the {IDENTIFY CITY/TOWN} Comprehensive Plan, future land use objectives include {PROVIDE FUTURE LAND USE INTENTIONS}. Based on this Comprehensive Plan’s future land use map, the City has plans to {IDENTIFY LAND USE CHANGE (OR NO CHANGE FROM CURRENT LAND USE)} for the area where the project site is located.
££ PROVIDE A COPY OF THE FLOOD INSURANCE RATE MAP (FIRM) SHOWING PROJECT LOCATION
Potential Sources: FEMA Flood Insurance Rate Map (FIRMs) and Letters of Map Revisions (LOMRs) can be found on FEMA’s Map Center website or through the local floodplain regulatory agency. https://msc.fema.gov/portal.
Example: Based on the FEMA Flood Map FEMA MAP {PANEL NO xxxx, Map NO. xxxx with effective date xxx}, the project would be constructed in the flood zone designation of {IDENTIFY FLOOD ZONE DESIGNATION and elevation} which are areas subject to inundation by the {PERCENT ANNUAL CHANCE FLOOD EVENT}.
££ INCLUDE GEOLOGIC AND HYDROGEOLOGIC INFORMATION (E.G., AQUIFER TYPES, AQUIFER AND VADOSE ZONE CHARACTERISTICS, SUBSURFACE HOMOGENEITY/HETEROGENEITY, HYDROLOGIC CONDUCTIVITY, TRANSMISSION RATES, STORAGE COEFFICIENTS, WATER TEMPERATURES). INCLUDE COPIES OF INVESTIGATION REPORTS.
Potential Sources: Describe the local and regional geology and hydrogeology underlying the project, including information such as the depth to groundwater, depth to bedrock, geologic formations, type of aquifer, aquifer and vadose zone characteristics, subsurface homogeneity/heterogeneity, hydraulic conductivity, transmission rates, storage coefficients, water temperatures. Include copies of investigation reports. Information can be found at:
¡ Groundwater observation well data (groundwater quality and groundwater levels) located on the USGS National Water Information Systems: Web Interface http://nwis.waterdata.usgs.gov/usa/nwis/gwlevels.
Information for HMA Review Data Supplement
FLOODPLAIN AND STREAM RESTORATION
Page 4 of 23
December 2016
¡ Aquifer properties (e.g., hydraulic conductivity, transmission rates, storage coefficients, water temperatures, etc.) from local hydrogeology studies in academic journals such as: http://www.journals.elsevier.com/journal-of-hydrology-regional-studies or USGS publications: https://pubs.er.usgs.gov/.
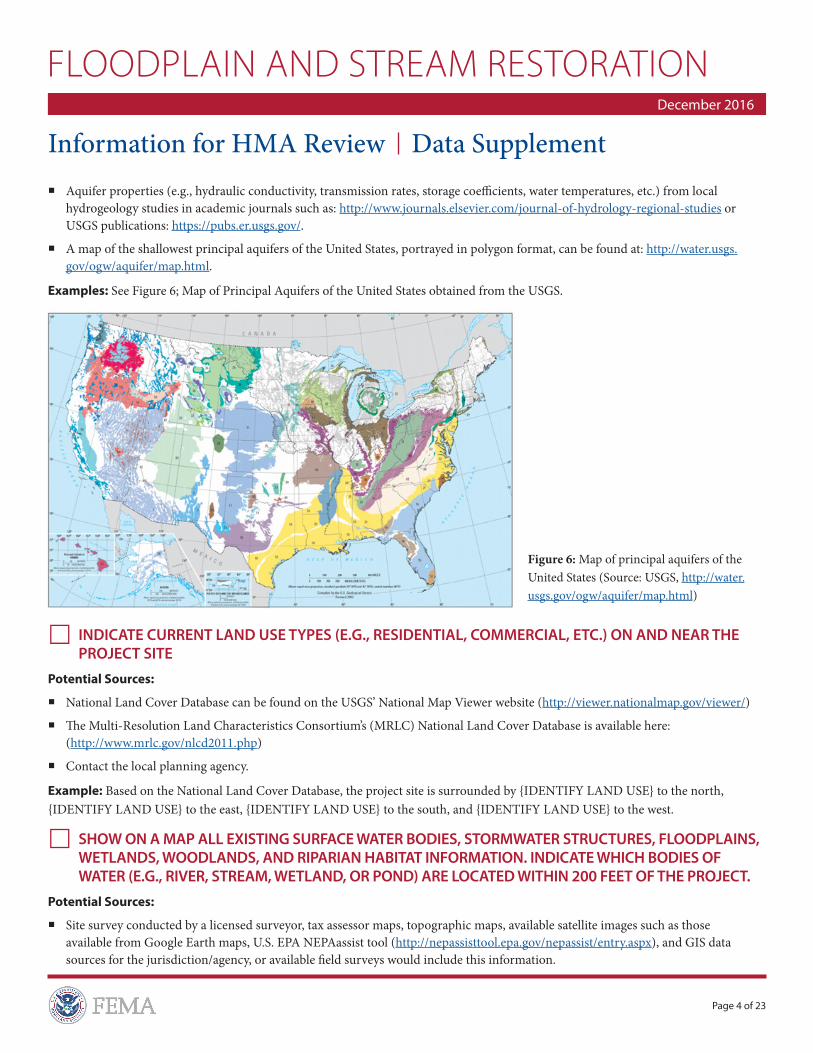
¡ A map of the shallowest principal aquifers of the United States, portrayed in polygon format, can be found at: http://water.usgs.gov/ogw/aquifer/map.html.
Examples: See Figure 6; Map of Principal Aquifers of the United States obtained from the USGS.
££ INDICATE CURRENT LAND USE TYPES (E.G., RESIDENTIAL, COMMERCIAL, ETC.) ON AND NEAR THE PROJECT SITE
Potential Sources:
¡ National Land Cover Database can be found on the USGS’ National Map Viewer website (http://viewer.nationalmap.gov/viewer/)
¡ The Multi-Resolution Land Characteristics Consortium’s (MRLC) National Land Cover Database is available here: (http://www.mrlc.gov/nlcd2011.php)
¡ Contact the local planning agency.
Example: Based on the National Land Cover Database, the project site is surrounded by {IDENTIFY LAND USE} to the north, {IDENTIFY LAND USE} to the east, {IDENTIFY LAND USE} to the south, and {IDENTIFY LAND USE} to the west.
££ SHOW ON A MAP ALL EXISTING SURFACE WATER BODIES, STORMWATER STRUCTURES, FLOODPLAINS, WETLANDS, WOODLANDS, AND RIPARIAN HABITAT INFORMATION. INDICATE WHICH BODIES OF WATER (E.G., RIVER, STREAM, WETLAND, OR POND) ARE LOCATED WITHIN 200 FEET OF THE PROJECT.
Potential Sources:
¡ Site survey conducted by a licensed surveyor, tax assessor maps, topographic maps, available satellite images such as those available from Google Earth maps, U.S. EPA NEPAassist tool (http://nepassisttool.epa.gov/nepassist/entry.aspx), and GIS data sources for the jurisdiction/agency, or available field surveys would include this information.
Figure 6: Map of principal aquifers of the United States (Source: USGS, http://water.usgs.gov/ogw/aquifer/map.html)
Information for HMA Review Data Supplement
FLOODPLAIN AND STREAM RESTORATION
Page 5 of 23
December 2016
¡ Review the local jurisdiction’s/lead agency’s ordinances, codes to determine any special requirements regarding setbacks/ restrictions to development and/or permits.
¡ Identify the location of any vegetation that will be affected and identify the type(s) of affected vegetation.
¡ Describe whether any part of the project site is within 200 feet of a body of water (e.g., river, stream, ditch, wetland, pond), and provide details about the proximity of the project site to the water body(ies) and the type of water body(ies).This information would be obtained internally from the project engineer or planner.
¡ Identify the location of areas with potential sinkhole risks.
Example: A site survey was conducted by licensed surveyor to clearly establish property boundaries. Attached is a map that shows the location of the project, all surface water bodies, stormwater structures, floodplains, wetlands and woodland. Based on the review of {IDENTIFY DATA SOURCE} the proposed project would be within {DISTANCE} of the {WATERBODY}.
££ PROVIDE HISTORIC STREAM FLOW, STAGE, AND WATER QUALITY DATA (FOR SUBSURFACE, SURFACE, RECLAIMED WATER). DISCUSS THE POTENTIAL ECOLOGIC EFFECTS DUE TO WATER QUALITY AND PROVIDE DOCUMENTATION FROM COMPLETED STUDIES.
Potential Sources: Most of this information can be found on the USGS National Water Information System (NWIS) website at http://waterdata.usgs.gov/nwis/. The USGS-NWIS Water Data for the Nation website supplies surface water data in the form of daily stream flow, and water quality observations. Some USGS stations collect real-time observations of these hydrologic metrics. The USGS Water Watch website (http://waterwatch.usgs.gov/index.php?id=ww_past) contains an archive of stream flow maps and a map of real-time stream flow compared to historical stream flow to compare how stream flow conditions have changed over time. If USGS surface water gauge stations are sparse within the study area, historical stream flow, stage, and water quality data can also be obtained from best estimates based on engineering analysis, which would be obtained internally from the project engineer or planner.
Example: {PROVIDE USGS SITE IDENTIFICATION NUMBER}, with {PROVIDE LENGTH OF MONITORING DATA RECORD}, has a stream stage of {PROVIDE FLOOD STAGE} and is classified as having {PROVIDE CLASSIFICATION OF STREAM FLOW CONDITION} stream flow compared to historical stream flow.
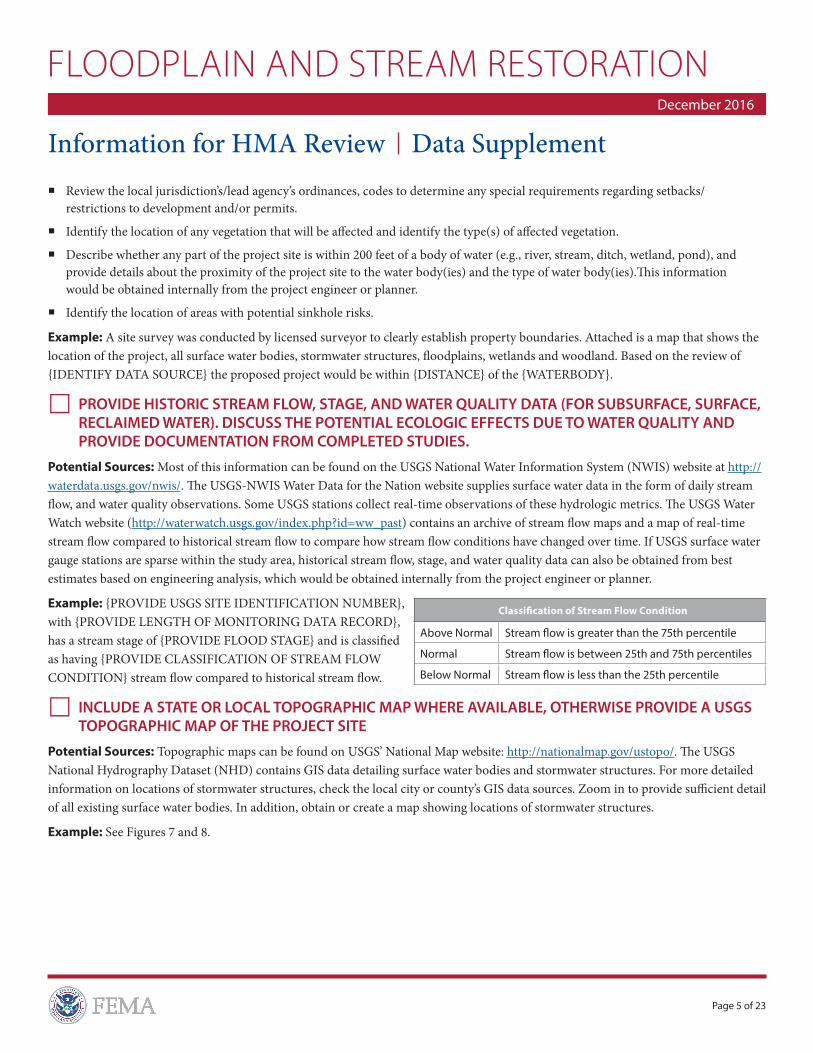
££ INCLUDE A STATE OR LOCAL TOPOGRAPHIC MAP WHERE AVAILABLE, OTHERWISE PROVIDE A USGS TOPOGRAPHIC MAP OF THE PROJECT SITE
Potential Sources: Topographic maps can be found on USGS’ National Map website: http://nationalmap.gov/ustopo/. The USGS National Hydrography Dataset (NHD) contains GIS data detailing surface water bodies and stormwater structures. For more detailed information on locations of stormwater structures, check the local city or county’s GIS data sources. Zoom in to provide sufficient detail of all existing surface water bodies. In addition, obtain or create a map showing locations of stormwater structures.
Example: See Figures 7 and 8.
Classification of Stream Flow Condition
Above Normal Stream flow is greater than the 75th percentile
Normal Stream flow is between 25th and 75th percentiles
Below Normal Stream flow is less than the 25th percentile
Information for HMA Review Data Supplement
FLOODPLAIN AND STREAM RESTORATION
Page 6 of 23
December 2016
Figure 7: USGS Topo Map (Source: USGS, http://nationalmap.gov/ustopo/)
Figure 8: USGS National Hydrography Dataset (NHD) (Source: USGS, http://viewer.nationalmap.gov/basic/#productSearch)
Information for HMA Review Data Supplement
FLOODPLAIN AND STREAM RESTORATION
Page 7 of 23
December 2016
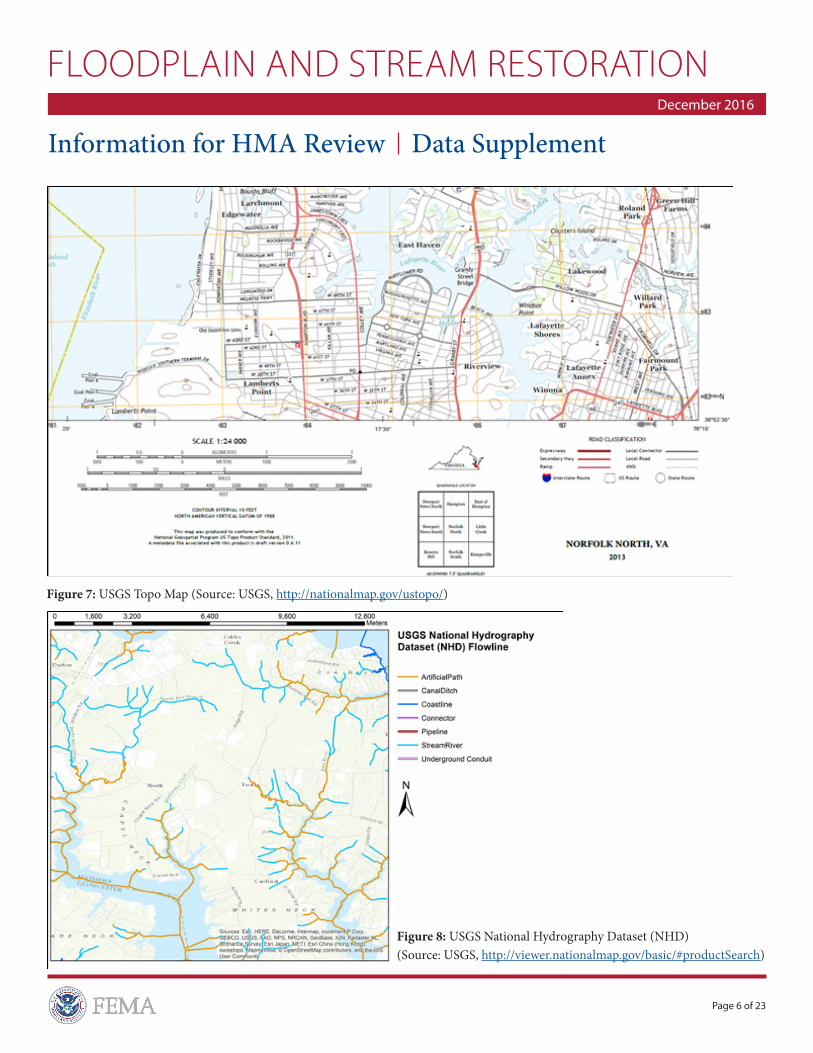
££ INCLUDE THE NATURAL RESOURCES CONSERVATION SERVICE SOIL MAP FOR THE PROJECT SITE
Potential Sources: Soil maps can be obtained from state Natural Resources Conservation Service (NRCS) offices and the U.S. Department of Agriculture, Web Soil Survey website at: http://websoilsurvey.sc.egov.usda.gov/App/WebSoilSurvey.aspx.
Example: Based on the USDA’s Web Soil Survey attached, the project would be constructed primarily in {INSERT SOIL TYPE(S)}. See Figure 9.
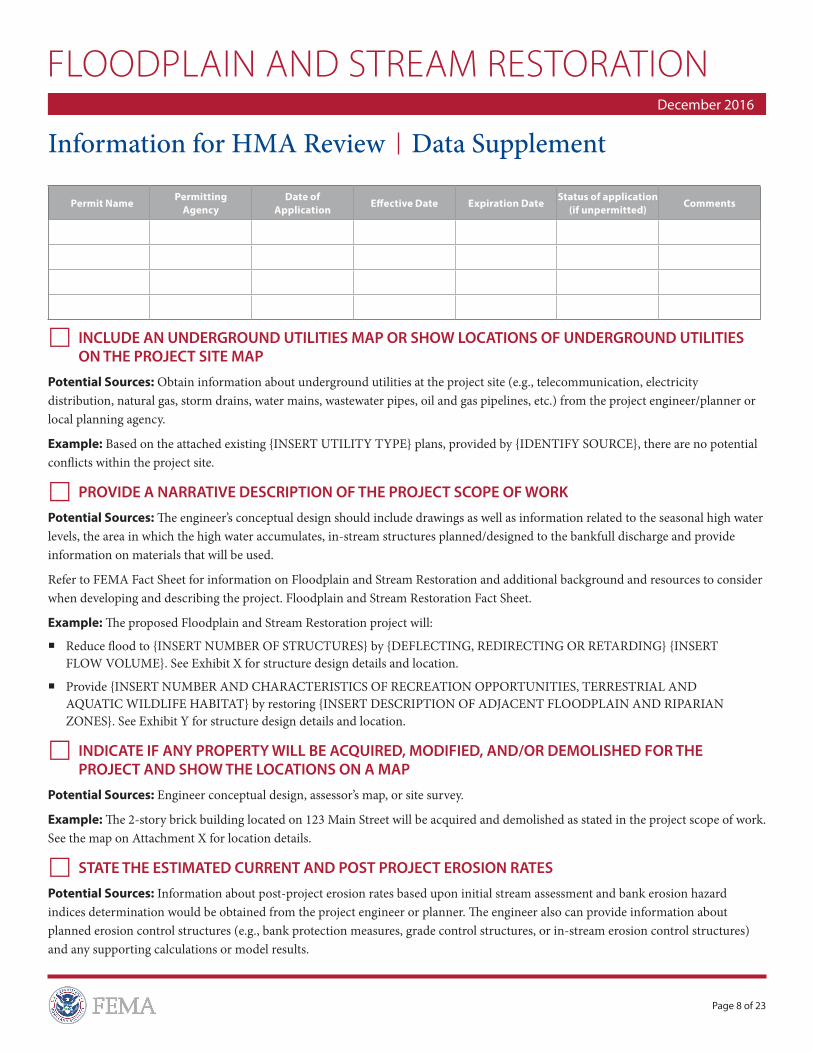
££ IDENTIFY PERMITTING REQUIREMENTS, RELEVANT AND LOCAL ORDINANCES. INCLUDE STATUS OF PERMIT APPLICATIONS, COPIES OF PERMITS OBTAINED.
Potential Sources: Permits may be federal, state, local, or a combination thereof (e.g., Maryland’s Joint Federal/State (Corps/MDE) permit process). For summary information, include at a minimum, the name of the agency, permit type, status of the application or summary of determination of non-applicability, and date of the application/effective date/expiration date (as appropriate). These documents should be available with the project proposal / management records or consulting engineer, or obtain the information from the permitting agency.
Example: This project requires {INSERT TYPES OF PERMITS} from {NAME PERMITTING AGENCY(IES)}. The table on page 8 summarizes the permits needed for the project and the status of the permit.
Figure 9: Web Soil Survey Map (Source: U.S. Department of Agriculture, http://websoilsurvey.sc.egov.usda.gov/App/WebSoilSurvey.aspx)
Information for HMA Review Data Supplement
FLOODPLAIN AND STREAM RESTORATION
Page 8 of 23
December 2016
££ INCLUDE AN UNDERGROUND UTILITIES MAP OR SHOW LOCATIONS OF UNDERGROUND UTILITIES ON THE PROJECT SITE MAP
Potential Sources: Obtain information about underground utilities at the project site (e.g., telecommunication, electricity distribution, natural gas, storm drains, water mains, wastewater pipes, oil and gas pipelines, etc.) from the project engineer/planner or local planning agency.
Example: Based on the attached existing {INSERT UTILITY TYPE} plans, provided by {IDENTIFY SOURCE}, there are no potential conflicts within the project site.
££ PROVIDE A NARRATIVE DESCRIPTION OF THE PROJECT SCOPE OF WORK
Potential Sources: The engineer’s conceptual design should include drawings as well as information related to the seasonal high water levels, the area in which the high water accumulates, in-stream structures planned/designed to the bankfull discharge and provide information on materials that will be used.
Refer to FEMA Fact Sheet for information on Floodplain and Stream Restoration and additional background and resources to consider when developing and describing the project. Floodplain and Stream Restoration Fact Sheet.
Example: The proposed Floodplain and Stream Restoration project will:
¡ Reduce flood to {INSERT NUMBER OF STRUCTURES} by {DEFLECTING, REDIRECTING OR RETARDING} {INSERT FLOW VOLUME}. See Exhibit X for structure design details and location.
¡ Provide {INSERT NUMBER AND CHARACTERISTICS OF RECREATION OPPORTUNITIES, TERRESTRIAL AND AQUATIC WILDLIFE HABITAT} by restoring {INSERT DESCRIPTION OF ADJACENT FLOODPLAIN AND RIPARIAN ZONES}. See Exhibit Y for structure design details and location.
££ INDICATE IF ANY PROPERTY WILL BE ACQUIRED, MODIFIED, AND/OR DEMOLISHED FOR THE PROJECT AND SHOW THE LOCATIONS ON A MAP
Potential Sources: Engineer conceptual design, assessor’s map, or site survey.
Example: The 2-story brick building located on 123 Main Street will be acquired and demolished as stated in the project scope of work. See the map on Attachment X for location details.
££ STATE THE ESTIMATED CURRENT AND POST PROJECT EROSION RATES
Potential Sources: Information about post-project erosion rates based upon initial stream assessment and bank erosion hazard indices determination would be obtained from the project engineer or planner. The engineer also can provide information about planned erosion control structures (e.g., bank protection measures, grade control structures, or in-stream erosion control structures) and any supporting calculations or model results.
Permit NamePermitting
AgencyDate of
ApplicationEffective Date Expiration Date
Status of application (if unpermitted)
Comments
Information for HMA Review Data Supplement
FLOODPLAIN AND STREAM RESTORATION
Page 9 of 23
December 2016
Example: In this particular project site along {NAME STREAM}, storm events have resulted in high erosion rates, channel incision, bank failure in areas along the stream, and mass wasting (movement of sediment downslope), evident in aerial photographs from {DATES OF AERIAL PHOTOGRAPHS}. The proposed project includes stream bank stabilization features to reduce streambank erosion with minimal maintenance. To design the project, site specific stormwater/sedimentation modeling of the area was conducted to predict the extent of erosion after installation of erosion control measures. Model results indicate that {PROVIDE POST-PROJECT EROSION RATES}.
££ PROVIDE CHARACTERISTICS (E.G., SIZE AND GEOGRAPHIC AREA) OF POPULATION THAT WOULD BENEFIT FROM FLOOD RISK REDUCTION AND THAT WOULD USE THE RETAINED WATER. NOTE ANY POTENTIAL USERS OF LARGE VOLUMES OF WATER, SUCH AS AGRICULTURAL, COMMERCIAL, OR INDUSTRIAL USERS. EXPLAIN HOW THE PROJECT WOULD AFFECT THE QUALITY OF VOLUME OF WATER SUPPLIED TO THESE USERS.
Potential Sources: A map depicting potential users within a one-mile radius would be useful. Characteristics (e.g., size, geographic area, and demographics) of populations can be found on the U.S. Census Bureau website that provides online demographic data (population size, housing characteristics, business and industry, etc.); data can be queried by state, county, city, town, or zip code at: http://factfinder.census.gov/faces/nav/jsf/pages/index.xhtml.
For water use information, the USGS National Water-Use Information Program compiles and disseminates the nation’s water-use data in cooperation with local, State, and Federal environmental agencies at: http://water.usgs.gov/watuse/index.html and http://water.usgs.gov/watuse/data/index.html. The USGS aggregates this water-use information at the county, state, and national levels and breaks up data into water-use categories such as public supply, domestic, irrigation, thermoelectric power, industrial, mining, livestock, and aquaculture.
This information could also be obtained internally if project reconnaissance involved interviews/surveys with local community members about water use.
Example: Based on the USGS National Water-Use Information Program, {SPECIFY WATER-USE CATEGORY} in {INDICATE COUNTY WHERE PROJECT SITE IS LOCATED} used approximately {SPECIFY GALLONS OF WATER USED ANNUAL BY WATER-USE CATEGORY} in {YEAR}. The proposed project is expected to change the volume of water supplied to these users by {SPECIFY INCREASE OR REDUCTION IN QUANTITY OF WATER SUPPLIED}.
££ IDENTIFY AND SHOW ON A MAP THE CURRENT WATER SOURCES, CONDITIONS, AND CAPACITIES THAT SERVE THE COMMUNITIES THAT WOULD BE IMPACTED BY THE PROJECT
Potential Sources: Information can be obtained from a local water purveyor; EPA Safe Drinking Water Information System https://www3.epa.gov/enviro/facts/sdwis/search.html; USGS National Hydrography Dataset http://nhd.usgs.gov/data.html; USGS Water Resources of the United States http://water.usgs.gov/data/; State Department of Environmental Quality; Open Public Records investigation of permitted water/wastewater discharges.
States may be another source, through Section 319 non-point management implementation (e.g., Georgia’s Statewide Nonpoint Source Management Plan).
Example: A report prepared by {IDENTIFY, REPORT DATE} consulting engineers is provided. The overall findings are: {PROVIDE SUMMARY / CONCLUSIONS}.
Information for HMA Review Data Supplement
FLOODPLAIN AND STREAM RESTORATION
Page 10 of 23
December 2016
££ ATTACH HYDROLOGY AND HYDRAULICS (H&H) AND OTHER ENGINEERING STUDIES, CALCULATIONS, AND/OR MODELS; GEOTECHNICAL STUDIES; AND STREAM FLOW AND RAINFALL RECORDS. H&H ANALYSIS SHOULD DEMONSTRATE ANY DOWNSTREAM IMPACTS (POSITIVE OR NEGATIVE) AND ANY CHANGES IN BASE FLOOD ELEVATION AND DISCHARGE RATES IN THE IMMEDIATE VICINITY AND DOWNSTREAM OF THE PROJECT.
Potential Sources: Hydrologic conditions for floodplain and stream restoration projects should be characterized for existing and future conditions. This information would be obtained internally from the project engineer or planner, who should also provide detailed methodologies and results from the H&H analysis to demonstrate any downstream impacts (positive of negative) associated with the proposed changes in channel morphology including any changes in base flood elevation and discharge rates in the immediate vicinity and downstream of the project site. Hydrologic modeling tools may include: HEC-HMS, HEC-RAS, SWMM, HSPF, ICPR, CEM or others. Publicly available data for input into hydrologic models are readily available through the internet from multiple sources such as the National Oceanic and Atmospheric Administration’s (NOAA’s) National Climate Data Center (NCDC) (http://www.ncdc.noaa.gov/) and the USGS National Water Information System (NWIS) (http://waterdata.usgs.gov/nwis/). The USGS-NWIS website supplies surface water data in the form of water surface elevations, streamflow discharges, groundwater levels, and water quality observations.
Example: Based on multiple field assessments, the existing channel condition is characterized by {INSERT DESCRIPTION OF EXISTING CONDITION}. After implementation of {INSERT DETAILS ON FLOOD DIVERSION STRATEGIES}, the Channel Evolution Model (CEM) shows channel morphology changes including {INSERT DESCRIPTION OF MODEL RESULTS}.
££ DESCRIBE THE QUANTITY OF FLOOD PRONE AREA CHANNEL BANK AND/OR IN-STREAM CUTS AND FILLS
Potential Sources: This information would be obtained from the project engineer or planner and would be included in the excavation plan and calculations for the project.
Example: As shown in the attached report and profiles, the proposed project will require the following cut/fill volumes from the channel bank:
¡ {ENTER VALUE} cubic yards of cut between Station {ENTER STATION NUMBER} and Station {ENTER STATION NUMBER}.
¡ {ENTER VALUE} cubic yards of fill between Station {ENTER STATION NUMBER} and Station {ENTER STATION NUMBER}.
¡ Resulting in a total net cut/fill value of {ENTER VALUE} cubic yards.
££ IDENTIFY AND DESCRIBE PLANNED IN-STREAM STRUCTURES
Potential Sources: Provide designs of the planned in-stream structures. GIS or computer-aided design (CAD) files would be useful. To supplement designs, provide a discussion on details of proposed plans, including size, type, and purpose of in-stream structures, installation requirements, and information on materials that will be used. This information would be obtained internally, from the project engineer or planner. Also include any information on plans for long-term maintenance of in-stream structures.
Example: As depicted in the CAD design, a {INSERT TYPE OF IN-STREAM STRUCTURE, SUCH AS ROCK VANES, J-HOOK VANES, BENDWAY WEIRDS, CROSS VANES, ETC.} will be constructed in the {LOCATION OF INSTALLATION} in order {DESCRIBE PURPOSE OF STRUCTURE}.
Information for HMA Review Data Supplement
FLOODPLAIN AND STREAM RESTORATION
Page 11 of 23
December 2016
££ STATE THE ESTIMATE VOLUME OF WATER TO BE REDIRECTED
Potential Sources: Provide designs depicting volume and direction of volume of water that will be redirected as a result of the project. This information would be obtained internally, from the project engineer or planner.
Example: The project would result in {QUANTITY OF WATER} that will be redirected to the {DIRECTION OF WATER DIVERSION}.
££ PROVIDE CURRENT AND PROJECTED FLOW RATES
Potential Sources: This information would be obtained internally from the project engineer or planner. Hydrologic and Hydraulic modeling tools may include HEC-HMS, HEC-RAS, SWMM, HSPF, ICPR, or others. Historical streamflow and stage data found on the USGS Surface-Water Data for the Nation website, or best estimates based on engineering analyses.
Example: The attached Hydrologic and Hydraulic (H&H) study provides before- and after-mitigation conditions of the proposed project site, including current and projected flow rates.
££ PROVIDE EXISTING AND PROPOSED WATER SURFACE ELEVATIONS AND VELOCITIES
Potential Sources: Existing water surface elevations and velocities may be based on initial stream assessment site survey. Initial stream assessment information would be obtained internally from the project engineer or planner. To supplement survey data, additional information can be found on the USGS National Water Information System (NWIS) (http://waterdata.usgs.gov/nwis/). The USGS-NWIS website supplies surface water data in the form of water surface elevations and streamflow discharges. Proposed water surface elevations resulting from construction of the project would be obtained internally from the project engineer or planner.
Example: The attached Hydrologic and Hydraulic (H&H) study provides before- and after-mitigation conditions of the proposed project site, including current and projected water surface elevations and velocities.
££ IF PROJECT INCLUDES MEASURES PLANNED AS DROUGHT MITIGATION, PROVIDE ESTIMATED GROUNDWATER RECHARGE VOLUME, AND DESIGN STORM FREQUENCY AND PRECIPITATION RATE
Potential Sources: This information would be obtained from the project engineer or planner.
Example: The proposed project would result in {INSERT VOLUME AND RATE} of groundwater recharge. Based on the storm frequency analysis, the {SPECIFY HYDROLOGIC FEATURE AT THE SITE} level has a {ENTER RETURN PERIOD} of {ENTER EXCEEDENCE THRESHOLD}. For example, if the stream level at the project site has a 30-year return period of 10 feet above flood stage, this means that a river level of 10 feet above flood stage should occur, on average, only once every 30 years.
££ INCLUDE CONCEPTUAL DESIGNS, PRELIMINARY DESIGN DRAWINGS AND SPECIFICATIONS, INCLUDING STREAM CHANNEL AND BANKFULL PROFILES, TYPICAL CROSS-SECTION, LIMITS OF GROUND DISTURBANCE, INCLUDING DEPTHS ASSOCIATED WITH THIS PROJECT (E.G., GRADING; DIGGING FOR BURIED UTILITY LINES; NEW TEMPORARY OR PERMANENT ACCESS ROADS OR STAGING AREAS; USE OF GEOTEXTILES, FLOODWALLS, OR LEVEES), AND EROSION CONTROL MEASURES
Potential Sources: The engineer’s conceptual design should include drawings as well as detailed information about the existing and proposed characteristics of every project component.
Refer to FEMA Fact Sheet for information on Flood Diversion and Storage and additional background and resources to consider when developing and describing the project: Floodplain and Stream Restoration Fact Sheet.
Information for HMA Review Data Supplement
FLOODPLAIN AND STREAM RESTORATION
Page 12 of 23
December 2016
Example: The attached engineered drawings illustrate the existing conditions and proposed improvements to the floodplain and stream. The attached report provides specifications on proposed re-vegetation and floodplain restoration techniques.
££ INDICATE THE QUANTITY OF SEDIMENT TO BE REMOVED FROM THE FLOODPLAIN AREA
Potential Sources: Consult the project engineer, landscape architect, restoration ecologist, or forester assisting in project design and implementation to determine the number of cubic yards of sediment to be removed.
Example: The attached dredge plan identifies the quantity and locations of sediment that will be removed as part of this project, see {REFERENCE LIST OR DREDGE PLAN}.
££ INDICATE THE QUANTITY OF EXCAVATED SEDIMENT TO BE REUSED WITHIN RIPARIAN FLOODPLAIN WETLANDS
Potential Sources: Consult the project engineer, landscape architect, restoration ecologist, or wetland scientist assisting in project design and implementation.
Example: The project would result in approximately {INDICATE QUANTITY} of excavated sediment that will be reused within the riparian floodplain wetlands {INDICATE WHERE RIPARION FLOODPLAIN WETLAND ARE LOCATED IN RELATION TO THE PROJECT SITE, I.E. WITHIN OR ADJACENT TO THE PROJECT SITE}.
££ DESCRIBE THE TYPE AND SOURCE OF ANY FILL THAT WILL BE IMPORTED TO THE PROJECT AREA FROM ANY OFF-SITE SOURCE (E.G., EXISTING BORROW PIT)
Potential Sources: Project engineer can provide information about the type of fill that would be imported, the sources of the fill (including location), and a description whether the fill source is currently licensed and permitted to operate for this intended use. Fill companies can provide information about sources, gradations, etc.
Example: All fill material, which would include concrete, aggregate rock, and rock riprap, would be provided by {NAME OF PROVIDER}, which stockpiles all the necessary materials at their processing plant located {ADDRESS}. All materials would originate from one of three quarries operated by {NAME OF COMPANY}. These existing quarries operate under permits from {NAME PERMITTING AGENCY (IES)}, and {NAME OF PROVIDER} has indicated that providing the needed borrow materials for the project would not exceed the overall availability capacity of the quarries.
££ DESCRIBE DEBRIS OR OTHER MATERIALS THAT WILL BE REMOVED AND DISPOSED OF OFF-SITE. PROVIDE ESTIMATES OF TYPES AND QUANTITIES OF MATERIALS TO BE DISPOSED AND THOSE THAT COULD BE SUITABLE FOR RE-USE. INCLUDE INFORMATION ABOUT WHERE DEBRIS WILL BE DISPOSED (INCLUDING TEMPORARY STAGING AREAS) IN ACCORDANCE WITH LOCAL AND STATE REQUIREMENTS.
Potential Sources: Project engineer or planner should have information about debris to be removed from the site (construction and/or existing debris on site), vegetation, and soil to be removed from the site, including types and estimated volumes. The State environmental department maintains a list of and the legal status of disposal sites, i.e., is the site a licensed landfill. Re-used materials should be analyzed to assure compliance with project specifications.
Example: Construction debris generated by the project would include materials from an existing structure that would be demolished, soil material from excavation, and vegetative material from plants and trees that would be removed. A Phase 1 Environmental Site Assessment has already been completed (attached) and the site has been determined to be clean and not contain any potential contaminated soils. Construction debris and vegetation debris would be disposed of at the local licensed transfer station {INSERT
Information for HMA Review Data Supplement
FLOODPLAIN AND STREAM RESTORATION
Page 13 of 23
December 2016
DETAILS OF FACILITY}, which has adequate capacity as described in the attached letter. All soil that would be excavated has been determined through geotechnical testing to be suitable for use in the detention basin berms. No excavated soil would be disposed of offsite.
££ DESCRIBE AND/OR SHOW ON A MAP THE TYPE AND LOCATION OF ANY VEGETATION THAT WILL BE AFFECTED BY IMPLEMENTATION OF THE PROJECT
Potential Sources: Consult the project engineer, landscape architect, restoration ecologist, or forester assisting in project design and implementation to describe the treatment plan or landscaping plan for all vegetation that would be removed or affected (e.g., trimmed) by the project. Include:
¡ Identify the types of vegetation that would be removed
¡ The method of removal (e.g., herbicide, hand tools, bulldozer)
¡ The overall goal of the vegetation removal (e.g., eliminate invasive exotic vegetation removal of ladder fuels, create a level and vegetation free site)
¡ The overall goal of the planting plan (e.g., stream bank stability and erosion control, native plant habitat, stream shading)
If vegetation would be planted, include details about the specific types of vegetation that would be planted and the general method of planting. State the functional benefit the planting plan will provide. For multiple project sites, include this information in similar detail for each project site
Example: The attached planting plan identifies the species currently on site that will be removed as part of this project, see {REFERENCE LIST OR PLANTING PLAN KEY}. Following the removal of the undesirable species, the following species will be planted in the {NAME ZONE OR SECTION OF THE PROJECT AREA OR REFERENCE PLANTING PLAN} in order to reestablish the naturally occurring vegetation types.
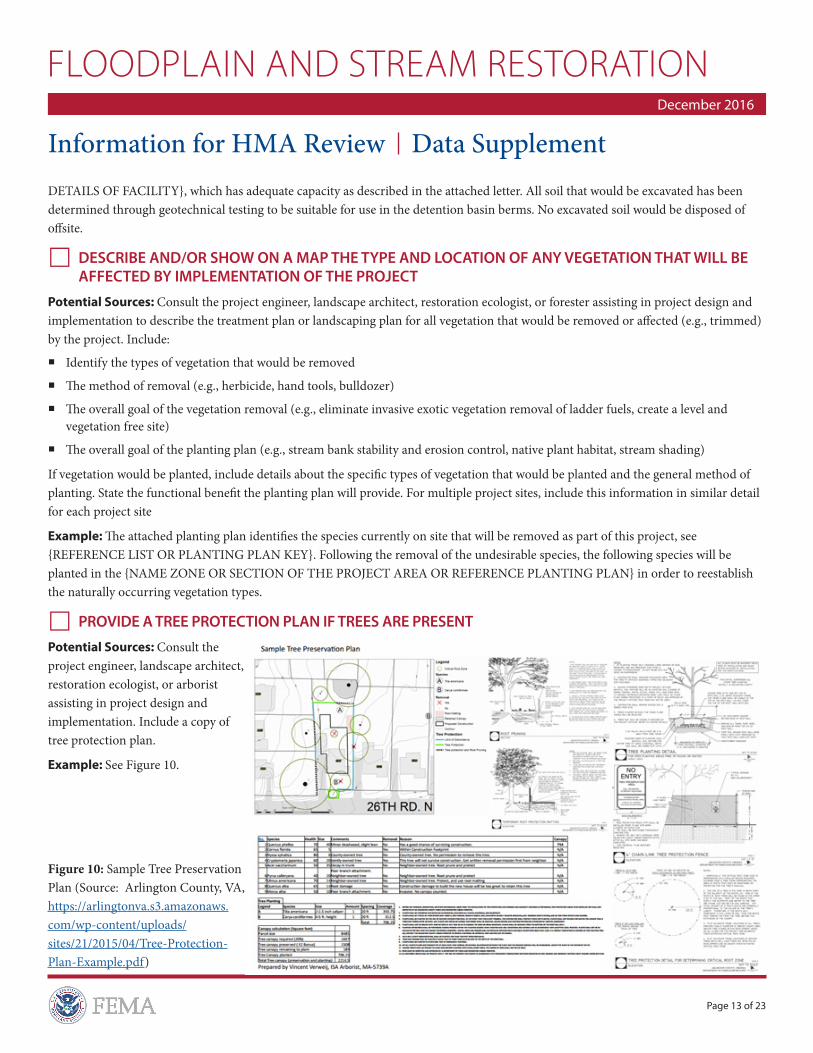
££ PROVIDE A TREE PROTECTION PLAN IF TREES ARE PRESENT
Potential Sources: Consult the project engineer, landscape architect, restoration ecologist, or arborist assisting in project design and implementation. Include a copy of tree protection plan.
Example: See Figure 10.
Figure 10: Sample Tree Preservation Plan (Source: Arlington County, VA, https://arlingtonva.s3.amazonaws.com/wp-content/uploads/sites/21/2015/04/Tree-Protection-Plan-Example.pdf)
Information for HMA Review Data Supplement
FLOODPLAIN AND STREAM RESTORATION
Page 14 of 23
December 2016
££ DESCRIBE THE EXPECTED IMPACT ON NEARBY STRUCTURES
Potential Sources: The project engineer or planner could provide a map showing the type and location of any infrastructure that will be affected by the project. If the project significantly affects any nearby infrastructure, the project engineer or planner should describe any design elements that have been incorporated in the project design or will be incorporated into the project design because of the project’s proximity to nearby infrastructure, including any communication that has occurred with nearby facilities.
Example: Review of aerial photographs reveal that the proposed project has the potential to impact the frequency and magnitude of stormwater flowing into the reservoir located {INSERT DISTANCE} from the project site. Based on stormwater modeling results, it is anticipated that inflow from the project site to the reservoir will increase by {INSERT FREQUENCY AND DURATION OF ANTICIPATED CHANGE}.
££ DESCRIBE CONSTRUCTION AND POST-CONSTRUCTION ADAPTIVE MANAGEMENT REQUIREMENTS FOR NUISANCE, INVASIVE SPECIES, AND HERBIVORY CONTROLS
Potential Sources: Consult the project engineer, landscape architect, restoration ecologist, or forester assisting in project design and implementation. If a Vegetation Monitoring or Invasive Species Control Plan was developed, provide a copy.
Example: During construction activities, project staff that have sufficient experience with field identification of invasive plants and detection of herbivory will {DESCRIBE ADAPTIVE MANAGEMENT REQUIREMENTS} to avoid nuisance and invasive species and to control herbivory that could threaten success of the project. Post-construction adaptive management requirements include a {NUMBER OF YEARS} of vegetation and species monitoring to document species changes following project implementation. Invasive species identified during monitoring will be removed by {INDICATE CERTIFICATION OF STAFF TO PERFORM REMOVAL}.
££ INCLUDE A PROJECT SCHEDULE SHOWING START AND END DATES, MILESTONES, ACTIVITIES, AND DELIVERABLES. THE SCHEDULE SHOULD BE NO LONGER THAN 3 YEARS.
Potential Sources: A detailed project schedule for all phases of the project with start and end dates for each phase, milestones, and critical path activities would be obtained internally from the project engineer or planner.
Example: Based on the attached schedule, Phase I {OR INCLUDE SPECIFIC PROJECT ACTIVITY} would commence in November 2016 and end in April 2017. Phase II includes {IDENTIFY PROJECT ACTIVITY} and would immediately precede Phase I provided the Applicant obtains the following permits {LIST PERMITS OR OTHER CONCERNS}.
££ PROVIDE COST INFORMATION FOR: ¡ Project development, including site selection, field testing, engineering, public outreach
¡ Land acquisition, including site access, permitting, and source water availability
¡ Construction, including labor, materials, equipment, and testing
¡ Operations and maintenance, including pre-treatment and post-treatment requirements and post-project monitoring, labor, electricity, consulting services, regulatory testing, treatment, and other miscellaneous costs
Potential Sources: Frequently used sources of cost data include:
¡ Material and labor costs for Applicant’s force account labor and materials on similar projects ¡ Unit cost data from recent local projects of similar scope ¡ State agency data from recent projects of similar scope ¡ State Department of Transportation (DOT) contracts for stream maintenance at bridges or low-water crossings
Information for HMA Review Data Supplement
FLOODPLAIN AND STREAM RESTORATION
Page 15 of 23
December 2016
¡ Cost estimates prepared by engineering consultants documenting quantities of work and unit costs ¡ Estimates based on published construction unit cost data; e.g., RS Means Cost Data
Example: Cost estimates must include detailed estimates of various cost item categories such as labor, materials, equipment, and subcontractor costs. Lump-sum estimates are typically not accepted.
££ DETERMINE TYPE OF DAMAGES AND LOSSES TO BE MITIGATED AND CHOOSE THE APPROPRIATE MODULE IN THE FEMA BENEFIT-COST ANALYSIS TOOLKIT
Potential Sources: Use the Flood Module if all of the following conditions are met:
¡ The proposed project will lower flood levels to existing, floodprone structures.
¡ Structure-specific data are available, such as the square footage and first floor elevation for each structure.
¡ A detailed study of the effectiveness of the proposed project has been completed, such as an H&H study. Such a study will identify how much the proposed project would reduce the flood depths for each structure.
Use the Damage Frequency Assessment (DFA) Module if the proposed project would result in mitigating any of the following categories of losses:
¡ Loss of function of public infrastructure (i.e., roads and bridges)
¡ Loss of function of utilities
¡ Loss of function of critical facilities, i.e., police stations, hospitals, or fire stations
¡ Agricultural and crop losses
It is possible to use both modules to analyze one project. The Flood Module would be used to assess the avoided damages to structures, and the DFA Module would be used to assess the avoided losses to public infrastructure, utilities, critical facilities, or crops.
££ THE PROJECT USEFUL LIFE IS 30 YEARS UNLESS THE USER PROVIDES JUSTIFICATION FOR USING A DIFFERENT VALUE
Potential Sources: The FEMA standard value for the project useful life of a Floodplain and Stream Restoration (FSR) project is 30 years. If a user enters a different value, supporting documentation from an expert should be provided. Cost information is available from the project engineer or planner or from a cost estimator.
Example: The potential impacts of the project on existing wells, water quality, and flow within the aquifer include {DESCRIBE IMPACTS}.
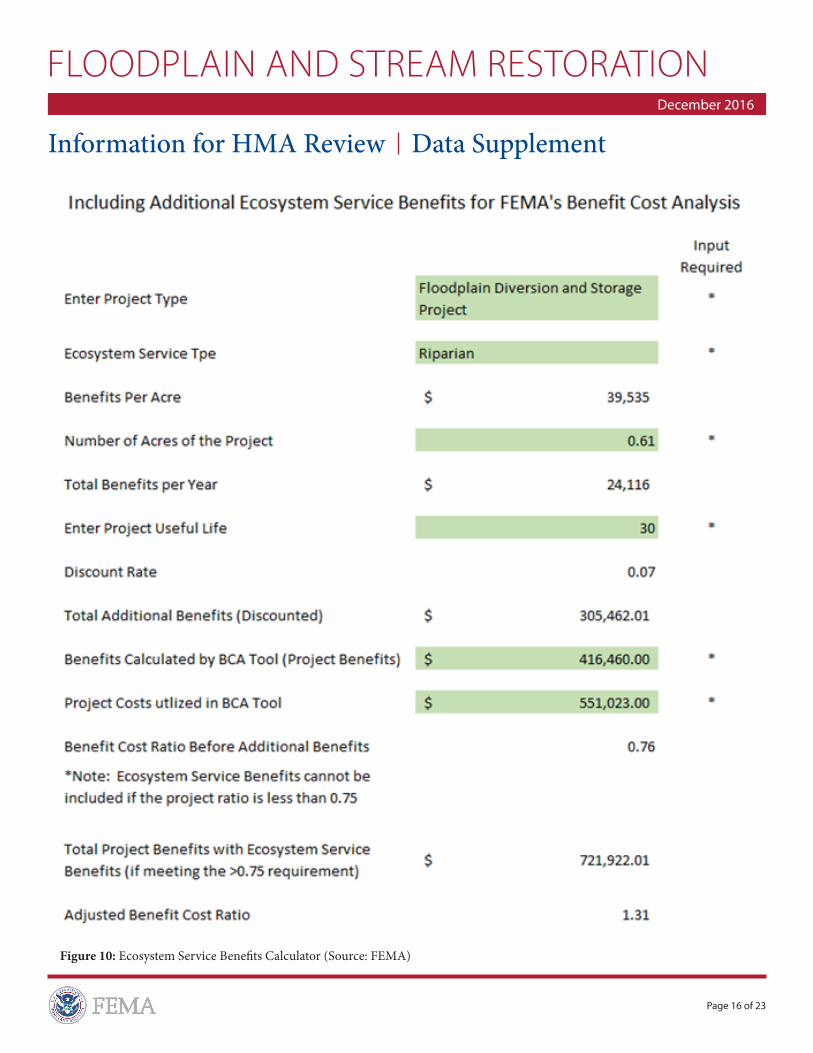
££ IF THE BENEFIT-COST RATIO IS GREATER OR EQUAL TO 0.75, THEN ENVIRONMENTAL BENEFITS CAN BE INCLUDED IN THE ANALYSIS USING THE ECOSYSTEMS BENEFITS CALCULATOR AVAILABLE FROM YOUR FEMA REGION. IDENTIFY ANTICIPATED LAND USE AFTER THE PROJECT IS COMPLETED AND THE NUMBER OF ACRES OF RESTORED ECOSYSTEM.
Potential Sources: Contact information for your FEMA Region is available from FEMA’s website: FEMA Region Contact Information
Example: See Figure 10 for an example of a project analysis using the Ecosystem Service Benefits Calculator.
Information for HMA Review Data Supplement
FLOODPLAIN AND STREAM RESTORATION
Page 16 of 23
December 2016
Figure 10: Ecosystem Service Benefits Calculator (Source: FEMA)
Information for HMA Review Data Supplement
FLOODPLAIN AND STREAM RESTORATION
Page 17 of 23
December 2016
££ ADDITIONAL BENEFITS MAY BE AVAILABLE DEPENDING ON THE PROJECT’S DESIGN
Reduced agricultural/crop losses: provide documentation of past losses or number of acres impacted, yield per acre and market price of crop
Potential Sources: To estimate damages to crops, a farmer may be able to provide documented damage from past flood events, possibly from insurance payments. In the absence of documentation, an estimate of how much damage occurred due to past events could be completed by determining the number of acres impacted by an event and then documenting assumptions for the yield per acre and the applicable market price for the crop grown.
Information about crop losses and crop yield is available from the USDA Crop Yield Information or your local farm service agency. Information about crop prices is available from AgWeb Crop Market Price Information
Reduced loss of function of roadways: provide traffic counts and detour times
Potential Sources: A FDS project may mitigate the loss of function of roadways that are located within the project area through reduced water surface elevations. The loss of function parameters are entered on the Type of Services (left) portion of the screen. For each roadway, select “Roads/Bridges” as the Facility Type for Loss of Function, and then enter the roadway description on the Roads/Bridges (right) portion of the screen. Enter the required parameters for the loss of function of that roadway: traffic count (one-way trips per day), the additional time of the detour, number of additional miles, and the current Federal mileage Rate.
Traffic counts and detour times are available from your local department of transportation or department of public works as well as your State department of transportation. The Federal mileage rate is available from the Internal Revenue Service (IRS) website: IRS Federal Standard Mileage Rates.
Avoided costs of stormwater conveyance and treatment infrastructure: provide the amount in millions of gallons of water to be stored by the project
Potential Sources: A FSR project could result in increased groundwater infiltration and, therefore, increased water supply, including drought resiliency. This information is available from the project engineer or planner.
Avoided costs of providing alternative drinking water source: provide the amount in millions of gallons of avoided alternative public drinking water supplies
Potential Sources: A FSR project would result in recharged water that becomes available for human consumption, and there would be a benefit, i.e., avoided costs, associated with not having to construct alternative water supplies because of compromised potable water supply. The cost to provide alternative drinking water is available from the local emergency management agency and/or the local water department.
Reduced damages due to subsidence: provide documentation of quantified reduction in structural damage to facilities in vicinity of project
Potential Sources: A FSR project may result in aquifer recharge and water table stabilization, which can help slow or lessen land subsidence, which, in turn, would potentially reduce structural damage to facilities in the vicinity of the project. This information is available from the project engineer, the local building department, or the local emergency management agency.
Information for HMA Review Data Supplement
FLOODPLAIN AND STREAM RESTORATION
Page 18 of 23
December 2016
Avoided costs associated with loss of business for water-dependent sectors: provide documentation of the reduction in loss for businesses in water-dependent sectors
Potential Sources: A FSR project could result in a benefit of reducing the loss of business for businesses in water-dependent sectors. Examples of such benefits include reduced unemployment benefits or reduced losses of tax revenue from businesses. This information can be obtained from the local emergency management agency, local economic development agency, the local tax office, and/or the Small Business Administration. Local Small Business Administration Contact.
££ IDENTIFY AT LEAST 2 ALTERNATIVES, INCLUDING THE DO-NOTHING CASE, AND EXPLAIN WHY THE PROPOSED APPROACH IS THE PREFERRED OPTION
Potential Sources: The project engineer/planner can provide information about other feasible alternatives that would address the purpose of the project and the reasons why these alternatives were dismissed and not pursued for FEMA funding. They can provide a statement supporting the reason that the proposed project is the most practicable alternative.
Example: The following alternatives were considered in the grant application: {LIST ALL ALTERNATIVES CONSIDERED}. Alternative {IDENTIFY ALTERNATIVE} was not considered practicable because of the increased costs resulting from the inability of the Public Works Department to provide the labor and equipment necessary for construction. The proposed project was considered the only practicable alternative, as it provides {IDENTIFY PROJECT OBJECTIVE SUCH AS INCREASED FLOOD PROTECTION} and was found to be the most cost-effective.
££ DESCRIBE THE PROPERTY HISTORY AND ANY STUDIES, INVESTIGATIONS, OR ENFORCEMENT ACTIONS (SUCH AS PENDING/CURRENT LITIGATION) RELATED TO THE PROPERTY. PROVIDE DETAILS OR COPIES OF THE DOCUMENTS.
Potential Sources: Obtain the information from the property owner, local building inspector, tax assessor records, deed to the property. Review Sanborn maps, environmental reports such as Environmental Data Resources, Inc. (EDR), U.S. EPA EnviroFacts (www.epa.gov/enviro), the state environmental department, city environmental department, and local, state, or national historic registers.
Example: Based on a Phase I investigation conducted by {IDENTIFY SOURCE} the proposed project area was determined to {DESCRIBE HISTORICAL USE FINDINGS}. Town records of the area {DESCRIBE FINDINGS}.
££ IF A BUILDING(S) OR OUTBUILDING(S) IS WITHIN SIGHT OF THE PROJECT, PROVIDE THE DATE WHEN THE OLDEST STRUCTURE WAS ORIGINALLY CONSTRUCTED. NOTE A CURRENT AERIAL PHOTOGRAPH OR MAP THE YEAR OF CONSTRUCTION OF BUILDINGS AND STRUCTURES WITHIN SIGHT OF THE PROJECT. NOTE FEMA IS CONCERNED WITH BUILDINGS AND STRUCTURES 50 YEARS OF AGE OR OLDER, NOT MORE RECENT ONES.
Potential Sources: Construction dates can be obtained from local real estate or taxing agency.
Example: The structure on {INSERT BUILDING ADDRESS} was built in {INSERT CONSTRUCTION YEAR}. See attached aerial map for location.
££ IDENTIFY IF THE PROJECT IS LOCATED WITHIN A DESIGNATED COASTAL ZONE OR COASTAL BARRIER RESOURCE SYSTEM UNDER THE STATE’S COASTAL MANAGEMENT PROGRAM
Potential Sources: Coastal Zone Management (CZM) is administered by NOAA and implemented at the State level, and coastal jurisdiction extent and permitting requirements vary from state to state. Applicants should review this information from the State CZM
Information for HMA Review Data Supplement
FLOODPLAIN AND STREAM RESTORATION
Page 19 of 23
December 2016
program to ascertain whether their project is in a coastal zone, and determine the permitting requirements imposed by their state. To determine if your state and/or project lies within coastal zone boundaries, go to the following link: http://coastalmanagement.noaa.gov/mystate/welcome.html.
The following link describes each state’s coastal zone boundary: http://coast.noaa.gov/czm/media/StateCZBoundaries.pdf
Information about the applicable CZM plans and regulatory agency should be obtained through the state regulatory agency of the coastal zone, either by phone or through the state agency’s website. Review of the applicable coastal zone management plan or direct communication with the agency regulating the coastal zone would need to occur to determine any project-specific restrictions related to the project’s occurrence within the coastal zone.
Example: The {INSERT STATE} coastal zone generally extends {INSERT DISTANCE} inland from the mean high tide line. The proposed project lies within the designated coastal zone and would require {IDENTIFY PERMITS}. The following activities {IDENTIFY ACTIVITIES} are regulated under this/these permits. A complete permit application form {PROVIDE APPLICATION LINK} including all required documentation and any {APPLICABLE FEES} should be submitted {IDENTIFY TIMING OF SUBMITTAL}.
££ IDENTIFY ANY KNOWN CONTAMINATED MATERIALS LOCATED ON-SITE (E.G., ASBESTOS, LEAD-BASED PAINT, UNDERGROUND STORAGE TANKS, CHEMICAL STORAGE CONTAINERS) THAT WILL REQUIRE REMOVAL PRIOR TO CONSTRUCTION
Potential Sources: Obtain the information from the property owner, local building inspector, local enforcement agency, site environmental assessments, and visual inspections. The U.S. Environmental Protection Agency (EPA) shows potential hazardous materials sites, at the following web link: http://www.epa.gov/emefdata/em4ef.home and http://nepassisttool.epa.gov/nepassist/entry.aspx.
Enter information, such as a city or an address, and view details on sites that are potential hazardous materials concerns on a map. Additionally, the U.S. Environmental Protection Agency (EPA) provides online data that can be searched by State and county that provides the location and details related to superfund cleanup sites at: Search for Superfund Sites Where You Live | Superfund | US EPA
Other sources include site inspections, environmental reports such as Environmental Data Resources, Inc (EDR), USEPA EnviroFacts (www.epa.gov/enviro), the state environmental department, and city environmental department.
Example: Based on the review of the {LIST AVAILABLE RECORDS SUCH AS PHASE I SITE ASSESSMENT}, the following contaminants {IDENTIFY CONTAMINANTS} were found on the project site. Clean-up actions would require {LIST ACTIONS TO BE TAKEN SUCH AS REMOVAL OF UNDERGROUND STORAGE TANKS (USTs)}.
££ IDENTIFY IF THE PROJECT SITE IS LOCATED ON OR WITHIN ONE MILE OF A SITE ON THE FEDERAL NATIONAL PRIORITIES LIST OR STATE HAZARDOUS WASTE SITE LIST. IF A PHASE I ENVIRONMENTAL SITE ASSESSMENT HAS BEEN COMPLETED, INCLUDE A COPY.
Potential Sources: Enter information, such as a city or an address, and view details on sites that are potential hazardous materials concerns on a map. Additionally, the U.S. EPA provides online data that can be searched by State and county that provides the location and details related to superfund cleanup sites at: https://www.epa.gov/superfund/superfund-national-priorities-list-npl and https://www3.epa.gov/enviro/facts/sdwis/search.html; State Departments of Environmental Protection (DEPs) often have superior information.
Example: Based on the review of the {LIST RESEARCH SOURCES AND / OR PHASE I SITE ASSESSMENT}, there are {IDENTIFY NUMBER} wells within one mile of the project property. The data associated with the contaminated sites indicate that the migration of the contamination {HAS / HAS NOT} reached the project property.
Information for HMA Review Data Supplement
FLOODPLAIN AND STREAM RESTORATION
Page 20 of 23
December 2016
££ IDENTIFY ANY SOIL OR GROUNDWATER CONTAMINATION KNOWN TO EXIST WITHIN A ONE-MILE RADIUS OF THE PROJECT SITE. INCLUDE ANY NATURALLY-OCCURRING CONTAMINANTS (E.G., ARSENIC, SELENIUM, BRACKISH WATER) THAT COULD ADVERSELY AFFECT THE REGIONAL GROUNDWATER AFTER THE PROJECT IS IMPLEMENTED.
Potential Sources: Obtain the information from the property owner, local building inspector, local enforcement agency, state and/or city environmental department, site environmental assessments, local hydrogeology reports, and visual inspections. The USGS National Ground-Water Monitoring Network website shows USGS groundwater monitoring wells with associated water quality metrics, such as chloride, hydrogen sulfide, and nitrogen concentrations, at the following link: http://cida.usgs.gov/ngwmn/index.jsp.
Example: Based on the review of the {USGS NATIONAL GROUND-WATER MONITORING NETWORK}, the following contaminants {IDENTIFY CONTAMINANTS} were found within groundwater wells within a one-mile radius of the project site. Clean-up actions would require {LIST ACTIONS TO BE TAKEN SUCH AS REMOVAL OF USTs}.
££ DESCRIBE ANY KNOWN FEDERALLY- OR STATE-LISTED THREATENED/ENDANGERED SPECIES OR SPECIES OF CONCERN AND THEIR CRITICAL HABITAT WITHIN THE PROJECT AREA AND ANY SPECIAL PROVISIONS OR MEASURES REQUIRED TO AVOID, MINIMIZE, OR MITIGATE DIRECT AND INDIRECT SPECIES IMPACTS
Potential Sources: U.S. Fish and Wildlife Service Mapper Information for Planning and Conservation (USFWS IPaC) https://ecos.fws.gov/ipac/; and State Department of Environmental Quality Natural Resource mapper tools are possible sources. Consultation with the State Department of Environmental Quality may be required, particularly if a species is identified as having construction restrictions (e.g., a certain month/season for nesting or spawning).
Example: The USFWS IPaC report notes the potential for four migratory bird species {LIST SPECIES}. The {STATE AGENCY AND DOCUMENT TYPE AND DATE} indicated an additional species on the site.
The attached list provides the species, status {e.g., SPECIAL CONCERN – NESTING, FORAGING, STATE THREATENED, ETC}. To avoid disrupting nesting, no construction or ground disturbance will occur from {DATE} to {DATE}.
££ DESCRIBE ANY ANADROMOUS OR MIGRATORY FISH SPECIES PRESENT IN THE WATERS, KNOWN FISH PASSAGES LOCATED WITHIN THE PROJECT AREA, AND REQUIRED SPECIAL PROVISIONS
Potential Sources: Many states have data portals that collect inventory information on common anadromous or migratory fish species. Enter “fish passage inventory database + {CITY or STATE}” or “fish passage assessment database + {CITY or STATE}” into an Internet search engine to find potential map-based inventories of known and potential barriers to anadromous or migratory fish species.
The National Marine Fisheries Service (NMFS) provides publicly available geospatial fisheries data such as critical habitat, essential fish habitat, and fish distribution, available at: https://www.st.nmfs.noaa.gov/appstech/data-portals/index.
Check applicable local ordinances, U.S. Fish and Wildlife Service’s National Fish Passage program reports, or NMFS reports and data portal (https://www.st.nmfs.noaa.gov/appstech/data-portals/index) to ensure project meets special provisions. A list of points of contact for regional coordinators of the National Fish Passage Program can be viewed at: http://www.fws.gov/fisheries/whatwedo/nfpp/nfpp_contacts.html.
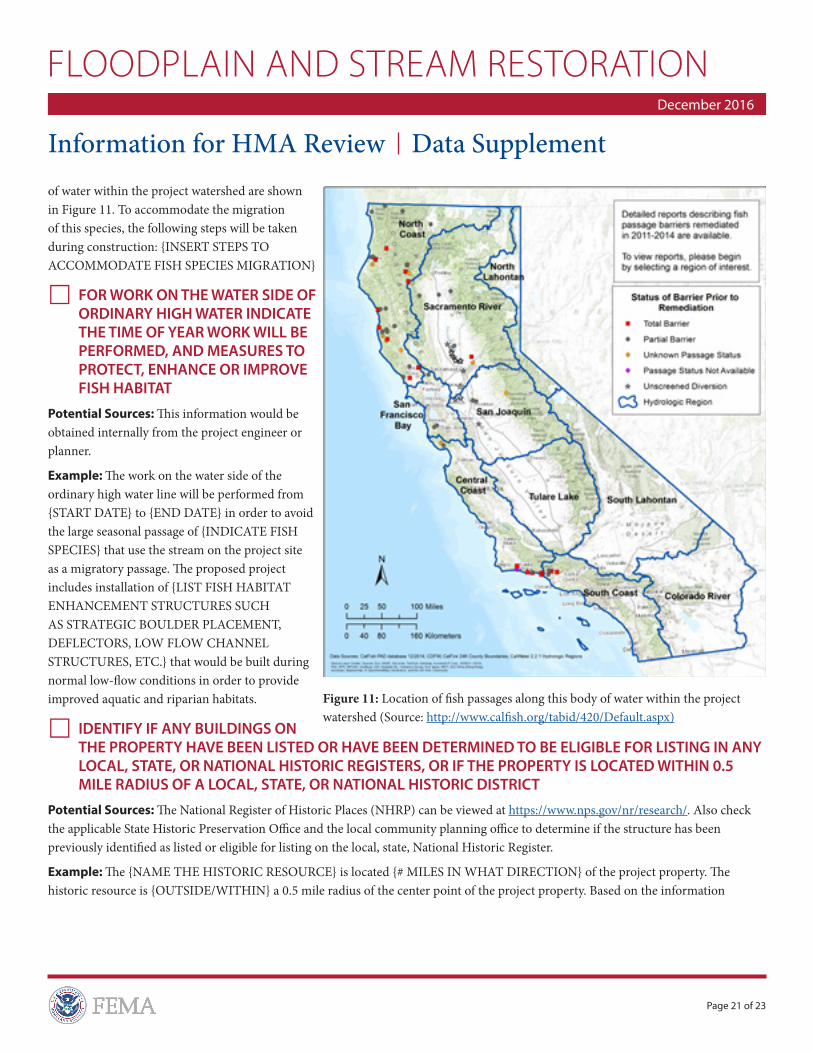
Example: The {INSERT NAME OF DATABASE} notes the potential for the presence of {INSERT TYPE OF ANADROMOUS OR MIGRATORY FISH SPECIES} to be present in {INSERT NAME OF BODY OF WATER}. The location of fish passages along this body
Information for HMA Review Data Supplement
FLOODPLAIN AND STREAM RESTORATION
Page 21 of 23
December 2016
of water within the project watershed are shown in Figure 11. To accommodate the migration of this species, the following steps will be taken during construction: {INSERT STEPS TO ACCOMMODATE FISH SPECIES MIGRATION}
££ FOR WORK ON THE WATER SIDE OF ORDINARY HIGH WATER INDICATE THE TIME OF YEAR WORK WILL BE PERFORMED, AND MEASURES TO PROTECT, ENHANCE OR IMPROVE FISH HABITAT
Potential Sources: This information would be obtained internally from the project engineer or planner.
Example: The work on the water side of the ordinary high water line will be performed from {START DATE} to {END DATE} in order to avoid the large seasonal passage of {INDICATE FISH SPECIES} that use the stream on the project site as a migratory passage. The proposed project includes installation of {LIST FISH HABITAT ENHANCEMENT STRUCTURES SUCH AS STRATEGIC BOULDER PLACEMENT, DEFLECTORS, LOW FLOW CHANNEL STRUCTURES, ETC.} that would be built during normal low-flow conditions in order to provide improved aquatic and riparian habitats.
££ IDENTIFY IF ANY BUILDINGS ON THE PROPERTY HAVE BEEN LISTED OR HAVE BEEN DETERMINED TO BE ELIGIBLE FOR LISTING IN ANY LOCAL, STATE, OR NATIONAL HISTORIC REGISTERS, OR IF THE PROPERTY IS LOCATED WITHIN 0.5 MILE RADIUS OF A LOCAL, STATE, OR NATIONAL HISTORIC DISTRICT
Potential Sources: The National Register of Historic Places (NHRP) can be viewed at https://www.nps.gov/nr/research/. Also check the applicable State Historic Preservation Office and the local community planning office to determine if the structure has been previously identified as listed or eligible for listing on the local, state, National Historic Register.
Example: The {NAME THE HISTORIC RESOURCE} is located {# MILES IN WHAT DIRECTION} of the project property. The historic resource is {OUTSIDE/WITHIN} a 0.5 mile radius of the center point of the project property. Based on the information
Figure 11: Location of fish passages along this body of water within the project watershed (Source: http://www.calfish.org/tabid/420/Default.aspx)
Information for HMA Review Data Supplement
FLOODPLAIN AND STREAM RESTORATION
Page 22 of 23
December 2016
provided by {NAME RESOURCE, PERSON, AGENCY}, {DESCRIBE} archaeological resources {ARE/ARE NOT} known to exist at the project site. The project property is not listed or eligible for listing on the {LIST LOCAL GOVERNING AGENCY and STATE} and / or National Registers of Historic Places.
££ DESCRIBE ANY KNOWN ARCHAEOLOGICAL ARTIFACTS, CULTURAL RESOURCES, OR HUMAN REMAINS ON OR LOCATED WITHIN A 0.5 MILE RADIUS OF THE PROPERTY
Potential Sources: Contact your State Historic Preservation Office (SHPO) / Tribal Historic Preservation Office (THPO), local planning department, local libraries, historical societies, university and college libraries, and State and local natural history museums, cultural resources surveys/reports within project area. Note that some of these resources are considered sensitive, and information about some archaeological sites is confidential and only available to professionally qualified individuals or at the discretion of a tribe. Include a copy of any archaeological survey done.
Near-complete list by State and county of properties included in the National Register of Historic Places (NRHP) is at: http://nrhp.focus.nps.gov/natreghome.do?searchtype=natreghome.
A list of SHPO websites can be found at: http://www.nps.gov/nr/shpolist.htm. A list of THPOs in each state can be accessed through http://nathpo.org/wp/thpos/find-a-thpo/.
Example: A cultural resources report was prepared for this project and cultural resources were identified within 0.5-mile radius {LIST RESOURCES}. No archaeological resources are known to exist at the project site.
££ IDENTIFY ANY NATIVE AMERICAN TRIBAL LANDS, TRADITIONAL CULTURAL PROPERTIES, OR OTHER NATIVE AMERICAN RESOURCES (E.G., TRADITIONAL FISHING AREAS) THAT ARE LOCATED ON OR ADJACENT TO THE SUBJECT PROPERTY
Potential Sources: Consult the resource data listed below to identify whether there are either Indian Tribal governments located in the project area, or Indian Tribal governments with a demonstrated interest in the project area. A complete list of all Federally-recognized Indian Tribal governments and their contact information is available on the National Park Service’s (NPS’s) Tribal Preservation Program website at: http://www.nps.gov/tribes/Tribal_Historic_Preservation_Officers_Program.htm.
¡ A directory of Tribal Leaders for all Federally-recognized Indian Tribal governments is maintained by the Bureau of Indian Affairs and is available at: http://www.bia.gov/cs/groups/xois/documents/text/idc002652.pdf.
¡ A map of all Indian Reservations in the Continental United States is available on the NPS’s The Native American Graves Protection and Repatriation Act (NAGPRA) website at: http://www.nps.gov/nagpra/DOCUMENTS/ResMap.htm.
¡ A complete list of all Federally- and State-recognized Indian Tribal governments is available through the National Conference of State Legislatures at: http://www.ncsl.org/issues-research/tribal/list-of-federal-and-state-recognized-tribes.aspx.
¡ Contact the local SHPO office for a list of Indian Tribal governments in an area. A list of SHPO websites can be found at: http://www.nps.gov/nr/shpolist.htm. A list of THPOs can also be accessed through http://nathpo.org/wp/thpos/find-a-thpo/.
¡ Contact your local SHPO, local planning department, local libraries, historical societies, university and college libraries, and State and local natural history museums.
Example: The project site is located near an Indian Reservation, {STATE NAME OF RESERVATION AND TRIBE}. Contact information for the tribe was obtained from the list maintained by the NPS and {NAME INDIVIDUAL AND TRIBAL ROLE} was contacted about the project {INSERT ALL COMMUNICATION METHOD} on {INSERT DATE(s)}. This individual stated that there may be tribal resources near the project site and that the tribe would like to be officially contacted by a federal agency if one intends to fund or permit the project. No additional information was provided by the tribal representative.
Information for HMA Review Data Supplement
FLOODPLAIN AND STREAM RESTORATION
Page 23 of 23
December 2016
££ DESCRIBE ANY PUBLIC OUTREACH THAT HAS OCCURRED RELATED TO THE PROJECT (E.G., PUBLIC NOTICES ISSUED, NOTIFICATIONS PUBLISHED IN NEWSPAPERS, PUBLIC MEETINGS HELD, PUBLIC COMMENTS SOLICITED)
Potential Sources: Obtain this information from the public affairs office or public information office of your agency or of any partnering agencies or organizations.
Example: Public outreach on this project has included outreach through the following media: {INSERT ALL MEDIA USED}. A list of each of the outreach events, including the type (e.g., public meeting, web, etc.), the dates of occurrence, summary of content and summary of public response is provided in the attached document.
££ ENCLOSE COPIES OF ANY PREVIOUS COORDINATION, CORRESPONDENCE, OR CONSULTATION WITH FEDERAL, STATE, TRIBAL, AND LOCAL RESOURCE AGENCIES (E.G., U.S. FISH AND WILDLIFE SERVICE, STATE/TRIBAL HISTORIC PRESERVATION OFFICE, U.S. ARMY CORPS OF ENGINEERS, STATE AGENCIES)
Potential Sources: These documents may be available with the project proposal / management records or consulting engineer, or obtain the information from the agency. For summary information, include a summary of the report, issues raised, reason for the report or investigation, date of the report/investigation, and conclusions of the report/investigation.
Example: As a part of previous activities at the project site, a Phase I Environmental Site Assessment had been prepared for the project site in {insert year here}. The report, provided by {INSERT AGENCY} is included in this packet. Communication and responses from other agencies are included as {INSERT ATTACHMENTS SUCH AS EMAIL or MAIL COMMUNICATION}.
££ DESCRIBE ANY OTHER ENVIRONMENTAL AND HISTORIC PRESERVATION REQUIREMENTS THAT THE PROJECT IS OR WILL BE SUBJECT TO, SUCH AS STATE/TRIBAL OR LOCAL ENVIRONMENTAL REVIEWS, OTHER AGENCY REVIEWS, ETC.
Potential Sources: Discussions with project proposal / management team or consulting engineer, or regulatory agencies. Review FEMA Hazard Mitigation Assistance Guidance: Hazard Mitigation Grant Program, Pre-Disaster Mitigation Program, and Flood Mitigation Assistance Program at: http://www.fema.gov/media-library-data/1424983165449-38f5dfc69c0bd4ea8a161e8bb7b79553/HMA_Guidance_022715_508.pdf.
Example: The response to this item is best presented in a table or list of each regulatory requirement and the explanation of how it will be met.