Embed Size (px)
Citation preview
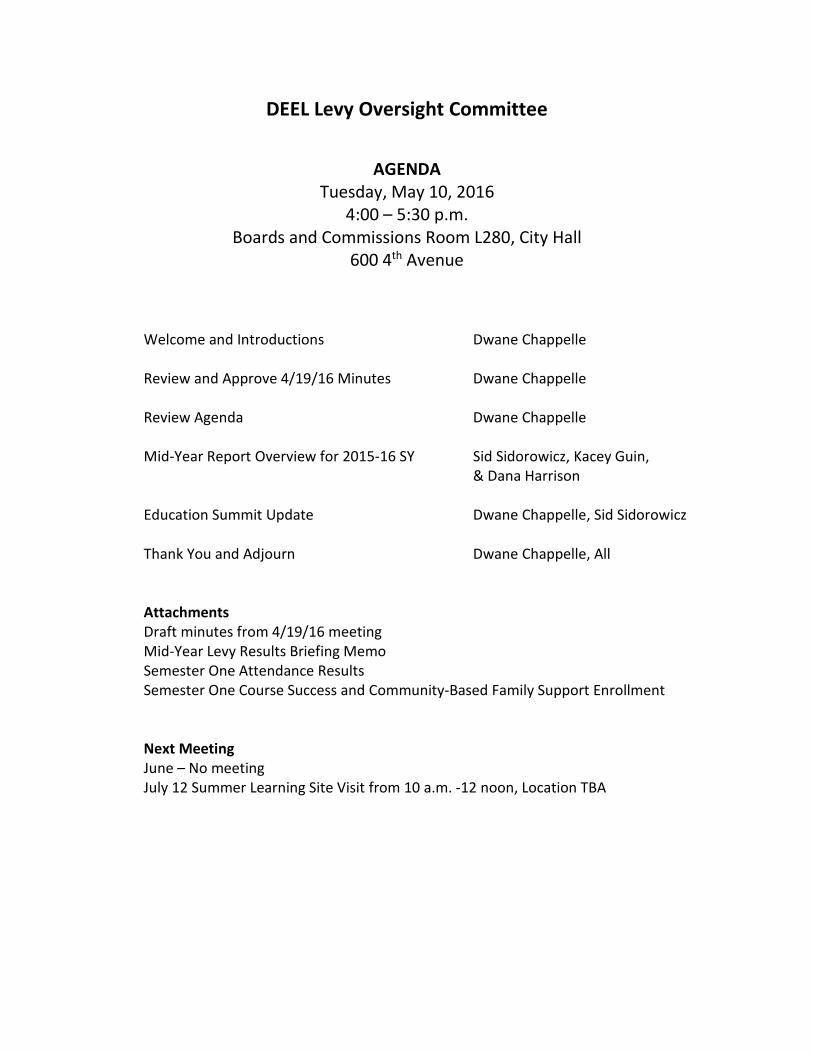
DEEL Levy Oversight Committee
AGENDA Tuesday, May 10, 2016
4:00 – 5:30 p.m. Boards and Commissions Room L280, City Hall
600 4th Avenue Welcome and Introductions Dwane Chappelle Review and Approve 4/19/16 Minutes Dwane Chappelle Review Agenda Dwane Chappelle Mid-Year Report Overview for 2015-16 SY Sid Sidorowicz, Kacey Guin, & Dana Harrison Education Summit Update Dwane Chappelle, Sid Sidorowicz Thank You and Adjourn Dwane Chappelle, All Attachments Draft minutes from 4/19/16 meeting Mid-Year Levy Results Briefing Memo Semester One Attendance Results Semester One Course Success and Community-Based Family Support Enrollment Next Meeting June – No meeting July 12 Summer Learning Site Visit from 10 a.m. -12 noon, Location TBA
Department of Education and Early Learning 700 5th Avenue, Suite 1700 • PO Box 94665 • Seattle, WA 98124-6965 • (206) 233-5118 • FAX (206) 233-5142
Page 1
DEEL LEVY OVERSIGHT COMMITTEE
Tuesday, April 19, 2016
MINUTES MEMBERS PRESENT: Rick Burke, Lucy Gaskill-Gaddis, Kevin Washington, Saadia Hamid, Elise Chayet, Greg Wong. OTHERS PRESENT: Sid Sidorowicz (DEEL), Isabel Muñoz-Colón (DEEL), Sara Stevens (DEEL), Dana Harrison (DEEL), Kacey Guin (DEEL), Waslala Miranda (CBO), Brian Goodnight (Council Central Staff), Monica Liang-Aguirre (DEEL), Sara Rigel (PHSKC), Sarah Wilhelm (PHSKC), Kaetlin Miller (PHSKC). Sid Sidorowicz called the meeting to order. Introductions were made and the minutes from the February 9 LOC meeting were approved. Sara Rigel presented the Families and Education Levy Health Investment 2014-15 Report. Presentation Overview:
1. Health investment and services overview 2. 2014-15 Performance Outcomes and Indicators 3. Discussion of successes and challenges
Elementary health
Crisis planning and response
Long-acting reversible contraception (LARC)
Kevin Washington asked if to some degree we are playing catch-up on the need in health. He stated that in this Levy we boosted the funding for health services, but also asked if we still have schools with .5 nurses that we are backfilling. Sara Rigel replied that the Levy is funding school nurses and that they play an important part in linking students to school-based health services/clinics in the school. S. Sidorowicz asked S. Rigel to describe where partners and sponsors money comes from. S. Rigel replied that their other money comes from a variety of sources. For example Neighborcare Health is a federally qualified healthcare center that sees a large number of Medicaid patients. Health providers receive external grants, donations, and fundraising, but primarily it is patient-generated revenue. Another example, Odessa Brown and Swedish partially contribute through community benefits; as part of their nonprofit status they give a certain percentage back to the community. This is a unique system that allows the flexibility of funding, but the Levy funding is essential for this work.
DRAFT City of Seattle
Department of Education and Early Learning 700 5th Avenue, Suite 1700 • PO Box 94665 • Seattle, WA 98124-6965 • (206) 233-5118 • FAX (206) 233-5142
Page 2
Lucy Gaskill-Gaddis stated that there are clearly no health centers in North Seattle middle schools. S. Rigel replied that high school-based health clinics are providing health services for some middle school students in the north end, especially Nathan Hale due to its proximity to Jane Adams. Direct referrals from school nurses provide safe access for middle school students. There are formalized agreements with schools so middle school students can enter a high school campus to obtain health services. Greg Wong asked if we are not funding any new health services/clinics for the remainder of the Levy period. S. Rigel replied that there is no plan or funding to start more clinics. However, middle schools that are being built do have clinic space in them. There is no funding available to support new clinics in the current Levy. S. Sidorowicz stated that once we added Interagency School that was the last school funded for a clinic. In the previous Levy we were able to accelerate funding for a couple of sites because we had under expenditures before the Levy expired. Rick Burke asked if there is a finite list of services offered. S. Rigel replied yes. The health centers offer comprehensive and preventative medical and mental health care, which is a full scope of medical services that would be provided by your regular medical provider. The Levy provides funding for oral health/dental service at 10 schools. Other sites have access to dental services via other sources of funding and service. K. Washington asked if health is still taught in schools. S. Rigel replied that health is taught by health teachers as its own class in 9th grade, 6th grade is taught by science teachers, and elementary schools use a Flash curriculum and is taught by a variety of teachers. There are very discrete and small amounts of health education in the curriculum. Saadia Hamid asked who is targeted for health services. S. Rigel replied that referrals come from school nurses, peers, teachers, etc. All students are eligible to receive services. The health providers do specific outreach to students who are having academic or behavioral problems. Elise Chayet asked what type of oral health services are provided in schools. S. Rigel replied that Neighborcare Health has portable equipment to create a dental laboratory. They have a dentist and a hygienist who provide care in schools and they provide restorative care as well. A lot of outreach is provided to students and parents to identify those children who need help in the community, especially to kids who may not otherwise receive care. E. Chayet asked if they have a way of billing Medicaid. S. Rigel replied yes. Most clinics/providers are billing Medicaid, including Take Charge. Medicaid revenue is a small portion of the funding. Many services are not billable. E. Chayet asked if clinics are connecting students back to their primary care provider and coordinating care. Yes. Clinics cannot really be the primary medical home since they are not open in the summer. Coordination with family and outside medical providers particularly takes a lot of time in Elementary sites. S. Rigel replied that the provider is funded through the Levy to do the connection and coordination of care with a child’s outside providers.
Department of Education and Early Learning 700 5th Avenue, Suite 1700 • PO Box 94665 • Seattle, WA 98124-6965 • (206) 233-5118 • FAX (206) 233-5142
Page 3
S. Sidorowicz stated that oral health was put into the Levy as a pilot without a specific plan for implementation. It was intended to be our foray of how we can provide oral health as an academic support. The committee that reviewed the oral health RFI asked do we serve younger kids for preventative care, do we serve middle schoolers who fall through the cracks, or do we serve high school students who suffer chronic problems that are affecting their ability to attend school? We decided to serve all three. There is a bit of a pilot and demonstration of what are going to be effective approaches at those different ages. We will discuss what lessons we learned for the 2018 levy. K. Washington asked if we have a body of knowledge from the pilot for oral health and what are other aspects of the health pieces. S. Rigel replied yes we do. R. Burke asked if there is an issue with provider turnover due to the contracting cycling and have there been some changes in sponsorship. S. Rigel replied that there hasn’t been a lot of turnover in providers during a school levy cycle. There have been changes to providers at sites between Levies. S. Hamid asked if all the health sites provide the same services. S. Rigel replied that all the middle and high school have the same set of core health services. The elementary schools have a slightly different set of core health services but all still provide comprehensive primary medical care and mental health. S. Sidorowicz also mentioned that Interagency and World School have slightly different models of delivering care because of the students they serve. L. Gaskill-Gaddis asked what it means that a mental health visit is related to an educational circumstance. Kaetlin Miller replied that there is an educational component of why students are at that visit. In this case, there may be students who are struggling academically and they are meeting with the mental health provider to determine if there is a mental health issue at the root of that problem. A student’s chart would be coded that the visit is associated with an educational purposes. R. Burke asked if they are categorizing multiple reasons for each visit. S. Rigel replied that data is collected on every single visit. Procedure codes and diagnostic codes are recorded for each visit. E. Chayet asked why there are a lot of routine well-child visits in middle and high schools. S. Rigel replied that it is a visit to get a physical for sports but also a great way to get students plugged into other health services. K. Washington asked if the inclusion of the school-based health center helps with attendance at Interagency. Sarah Wilhelm replied absolutely, having a school-based health clinic at Interagency supports students’ attendance at the school. S. Hamid asked if S. Rigel could speak about the behavioral risk factors. S. Rigel replied that behavior risk factor screening is used by school nurses to identify students with risk factors that would indicate that students have need. E. Chayet asked whether those screening are done at the clinics. S. Rigel replied that risk assessments are being done by school nurses. Clinics are doing generalized risk assessments.
Department of Education and Early Learning 700 5th Avenue, Suite 1700 • PO Box 94665 • Seattle, WA 98124-6965 • (206) 233-5118 • FAX (206) 233-5142
Page 4
E. Chayet asked if we are capturing whether those assessments are being done. S. Rigel replied yes - we are collecting data on whether the assessments are being done, but it’s a challenging area to collect data and document the screening data and results. E. Chayet asked if we were going to do a suicide assessment screening. S. Rigel replied that there are no universal tools being implemented at the clinics being done across all the health providers. Mental health and depression systems are included in generalized risk assessments provided to all students. Some suicide risk assessments are conducted within mental health visits. There is also crisis prevention work being implemented. L. Gaskill-Gaddis asked if there is a big need for trauma informed services at West Seattle Elementary School where there are a lot of immigrants and refugees. S. Wilhelm replied that there is a big need at all schools but Public Health received funding from the Gates Foundation to partner with Dr. Chris Blodgett from WSU at West Seattle Elementary School. K. Washington asked whether the addition of funds to the elementary schools health services is based on knowing the value and wanting to add to the level of services being provided. S. Wilhelm replied that schools are both seeing the value that the health providers can bring to the table and are trying to find additional resources to expand services. It is also easier to expanded services with a provider already housed in a building versus starting up a new partnership. K. Washington asked what the message is from the LARC chart slide on the increase in IUDs. S. Rigel replied that Public Health received money from a grant in 2010 to provide education and training to medical providers. We created a systematic way for providers to get up to speed, but now their expertise is greater than most medical providers in the community because of the difficulties in obtaining IUD’s in a primary care setting. The American College of Obstetrics and Gynecology and the American Academy of Pediatrics recommends LARC’s as the first line and most effective and appropriate contraception for adolescents. All providers need to be trained and they are provided adequate practice and mentoring. There are multiple components and this needs to be provided as a fundamental core service. This is a comprehensive approach as of 2014-15. E. Chayet asked do we know what the breakdown of clinics that have LARC versus other forms of contraception options. S. Rigel replied that we can try to pull that data but the clinics are using different codes to identify the method of contraception. E. Chayet asked if we have teen birth rates by zip code to get at regional differences and what is the correlation between the clinics in Seattle and the broader county results. S. Wilhelm replied yes - we can disaggregate the rates. E. Chayet asked how we are positioning ourselves to take advantage of Best Start for Kids or Medicaid Match from the state to support the work of the school-based health services. S. Rigel replied that Public Health sees a real value in trying to leverage other resources of funding to support the work of school-based health clinics and model the work being done in Seattle to spread to other communities in King County.
Department of Education and Early Learning 700 5th Avenue, Suite 1700 • PO Box 94665 • Seattle, WA 98124-6965 • (206) 233-5118 • FAX (206) 233-5142
Page 5
G. Wong asked what are the new trends that the health clinics are seeing in terms of student needs. S. Rigel replied that mental health is always the top diagnosis, both for acute care and long-term management of mental health needs. K. Washington asked are there ways you can see what the needs are in sites not funded by the Levy. S. Rigel replied that we use tools like the Healthy Youth Survey to identify needs that could inform Levy ramp-up. S. Sidorowicz stated one other response to Kevin’s question is we are a part of the Best Start’s coordinating group between the city and the county and some of the questions from the county are going to be around where are our needs as they start releasing RFIs that are associated with Best Starts. That might be an area of health epidemiology where we can get a better understanding of different population needs around Seattle and some of those could be gaps that can be met by enhancing our strategies or some other strategies that are a part of Best Starts. S. Rigel thanked the group for the questions and opportunity to speak today. S. Sidorowicz stated that there is a Levy mid-year 2015-16 summary in LOC member packets. DEEL will go through the mid-year report briefing at the May 10 LOC meeting and will give an update on the Education Summit and Community Conversations. Meeting was adjourned at 5:30 pm.
Policy Briefing Memo
Page 1 of 4
City of Seattle Edward B. Murray, Mayor Date: May 10, 2016 To: Levy Oversight Committee Members From: Dwane Chappelle, 4-4508 Subject: School Year 2015-16 Mid-Year Levy Results Update
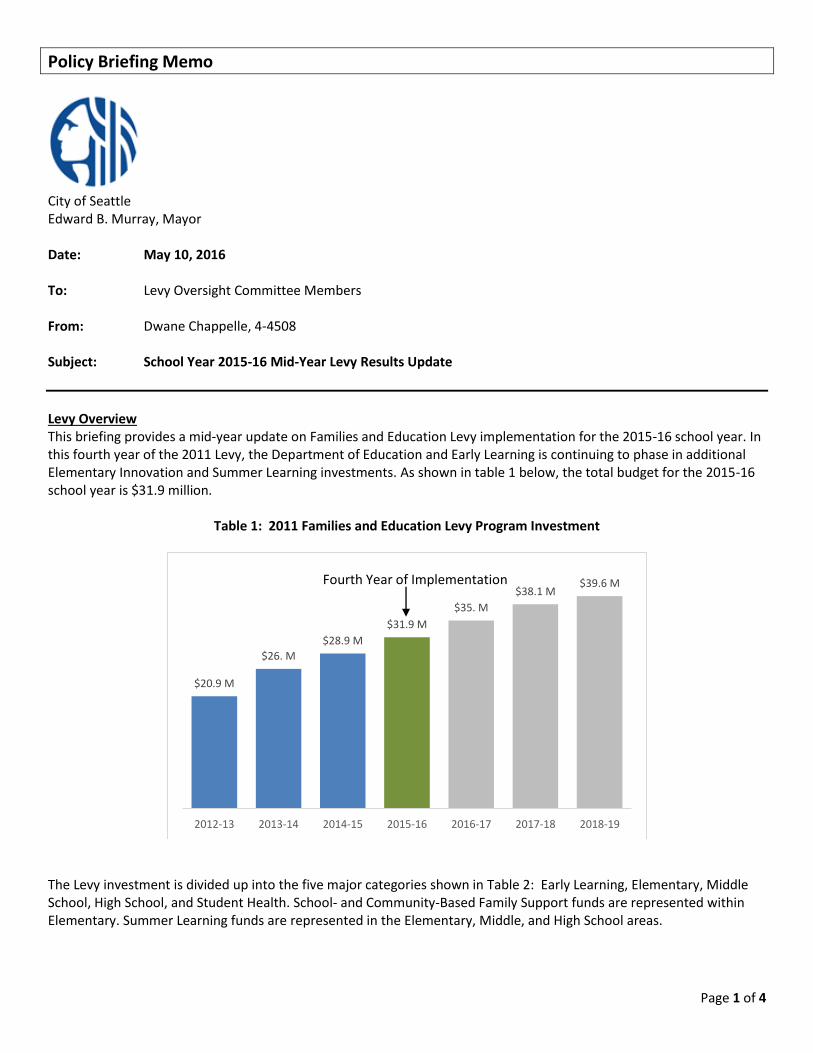
Levy Overview This briefing provides a mid-year update on Families and Education Levy implementation for the 2015-16 school year. In this fourth year of the 2011 Levy, the Department of Education and Early Learning is continuing to phase in additional Elementary Innovation and Summer Learning investments. As shown in table 1 below, the total budget for the 2015-16 school year is $31.9 million.
Table 1: 2011 Families and Education Levy Program Investment
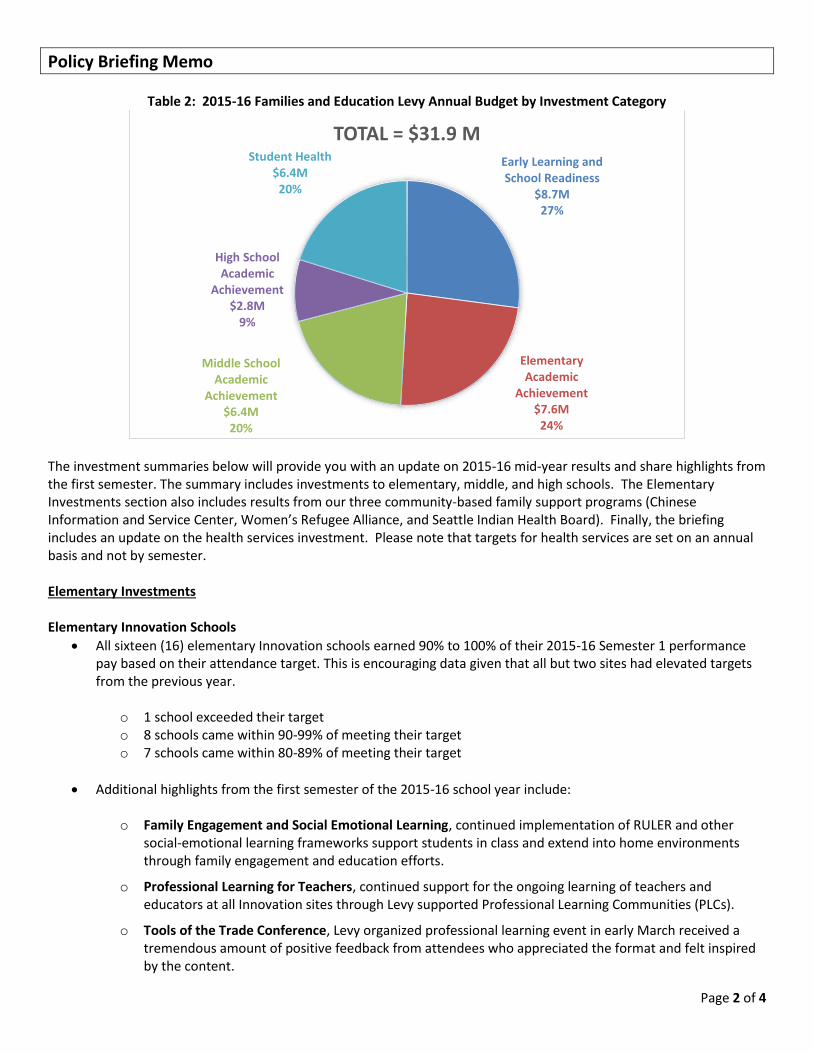
The Levy investment is divided up into the five major categories shown in Table 2: Early Learning, Elementary, Middle School, High School, and Student Health. School- and Community-Based Family Support funds are represented within Elementary. Summer Learning funds are represented in the Elementary, Middle, and High School areas.
$20.9 M
$26. M
$28.9 M
$31.9 M
$35. M
$38.1 M$39.6 M
2012-13 2013-14 2014-15 2015-16 2016-17 2017-18 2018-19
Fourth Year of Implementation
Policy Briefing Memo
Page 2 of 4
Table 2: 2015-16 Families and Education Levy Annual Budget by Investment Category
The investment summaries below will provide you with an update on 2015-16 mid-year results and share highlights from the first semester. The summary includes investments to elementary, middle, and high schools. The Elementary Investments section also includes results from our three community-based family support programs (Chinese Information and Service Center, Women’s Refugee Alliance, and Seattle Indian Health Board). Finally, the briefing includes an update on the health services investment. Please note that targets for health services are set on an annual basis and not by semester. Elementary Investments Elementary Innovation Schools
All sixteen (16) elementary Innovation schools earned 90% to 100% of their 2015-16 Semester 1 performance pay based on their attendance target. This is encouraging data given that all but two sites had elevated targets from the previous year.
o 1 school exceeded their target o 8 schools came within 90-99% of meeting their target o 7 schools came within 80-89% of meeting their target
Additional highlights from the first semester of the 2015-16 school year include:
o Family Engagement and Social Emotional Learning, continued implementation of RULER and other social-emotional learning frameworks support students in class and extend into home environments through family engagement and education efforts.
o Professional Learning for Teachers, continued support for the ongoing learning of teachers and educators at all Innovation sites through Levy supported Professional Learning Communities (PLCs).
o Tools of the Trade Conference, Levy organized professional learning event in early March received a tremendous amount of positive feedback from attendees who appreciated the format and felt inspired by the content.
Early Learning and School Readiness
$8.7M27%
Elementary Academic
Achievement$7.6M
24%
Middle School Academic
Achievement$6.4M
20%
High School Academic
Achievement$2.8M
9%
Student Health$6.4M
20%
TOTAL = $31.9 M
Policy Briefing Memo
Page 3 of 4
o Partnerships for Systems Improvement, Levy consultants as well as staff from DEEL’s Early Learning Department and SPS are participating in the UW’s P3 Institute and collaboratively developing action research projects that align efforts and triangulate systems within the three departments in support of Seattle PreK-3 students.
Community Based Family Support (CBFS)
All three (3) CBFS sites met their enrollment targets and earned 100% of their 2015-16 Semester 1 performance pay for attendance.
All sites are also participating in the Youth Program Quality Initiative, a year-long professional development opportunity focused on continuous improvement, which includes staff training, program assessment, coaching and data analysis/planning.
Middle School Investments
All thirteen (13) Innovation and Linkage middle schools with an attendance target earned 90% to 100% of their 2015-16 Semester 1 performance pay.
o 4 schools exceeded their target o 4 schools came within 90-99% of meeting their target o 5 schools came within 80-89% of meeting their target
All seven (7) Innovation and Linkage middle schools with a target for passing core courses earned 90% to 100% of their 2015-16 Semester 1 performance pay.
o 6 school exceeded their target o 1 school came within 90-99% of meeting their target
Additional highlights from the first semester of the 2015-16 school year include: o Enhanced & Expanded Reading Strategies, such as a home visit/home language campaign, one-on-one
reading tutoring, and extended day learning labs. o College & Career Readiness Strategies in the four Innovation Middle Schools are being reviewed,
redesigned and implemented, using input from schools staff and students. o The Empowerment Math Project (EMP) supported teachers, working to change the math mindset of
hundreds of middle school students. Third year of implementation and seeing promising results in student academic growth. The EMP program was highlighted on the Seattle Channel.
o Student-Led Conferences at the middle school level provide students an opportunity to share their academic and personal goals with school staff and a family member.
High School Investments
All five (5) Innovation high schools earned 90% to 100% of their 2015-16 Semester 1 performance pay based on their attendance target.
o 2 schools exceeded their target o 1 school met their target o 1 school came within 90-99% of meeting their target o 1 school came within 80-89% of meeting their target
Four out of five Innovation high schools with a target for passing core courses for all 9th graders earned 90% to 100% of their 2015-16 Semester 1 performance pay.
o 1 school exceeded their target o 1 school met their target o 2 schools came within 90-99% of meeting their target
Policy Briefing Memo
Page 4 of 4
o 1 school came within 70-89% of meeting their targets
Three out of five Innovation high schools with a target for passing core courses with a C or better for students served by case management earned 90% to 100% of their 2015-16 Semester 1 performance pay. These results indicate that schools may struggle with the more rigorous target of passing core courses with a C or better in the 2016-17 school year.
o 2 schools exceeded their target o 1 school came within 80-89% of meeting their target o 1 school came within 70-79% of meeting their target o 1 school came within 50-59% of meeting their target
Additional highlights from the first semester of the 2015-16 school year include:
Student-Led Conferences at the high school level provide students an opportunity to share their academic and personal goals with school staff and a family member.
Link Crew is providing ongoing peer to peer mentoring, engagement and academic activities to connect 9th graders to high school.
College & Career Case Management, provided by school staff and/or community partners, offers focused supports for a subset of 9th grade College Bound Scholars to ensure they remain eligible for their scholarship and on the path to college and career.
Health Investments
Over 9,700 School-based Health Centers/School Nurse users during S1 – far exceeded annual target of 7,660
Interagency School-based Health Center exceeded its first semester attendance target and the rest of the health services programs are on track to meet their end of the year attendance goal.
Seven of eight elementary health sites have added staff hours to better meet demand for services, leveraging levy funds with a range of additional funding sources including sponsor organization, levy innovation, and private grants.
Crisis response protocols streamlined and clearly communicated across Interagency sites. Convened training for Interagency administration and health partner staff on crisis response systems, with representatives from the Crisis Clinic, Children’s Crisis Outreach Response System, and King County.
School-based health center mental health providers received institutional partner designation with Seattle Public Schools in 2015-2016. The designation offers Mental Health Providers access to their patients’ academic data in real time as well as authorizes more concrete collaboration opportunities with building staff. This enables mental health providers to better tailor student services to influence health and academic outcomes.
In January 2016, the Mental Health Integrated Tracking System (MHITS) began including academic data in addition to clinical data for students receiving mental health services at school-based health centers, further enabling mental health providers to tailor their services to students.
Public Health—Seattle & King County began piloting an HPV vaccine promotion project at a handful of middle and high schools with school-based health centers, aiming to improve HPV vaccination rates which have sorely lagged behind other recommended adolescent vaccines. The project eases vaccine consent by sending forms homes electronically; and increases knowledge and awareness of the vaccine, its benefits, and its availability at the school-based health centers through student-led campaigns.
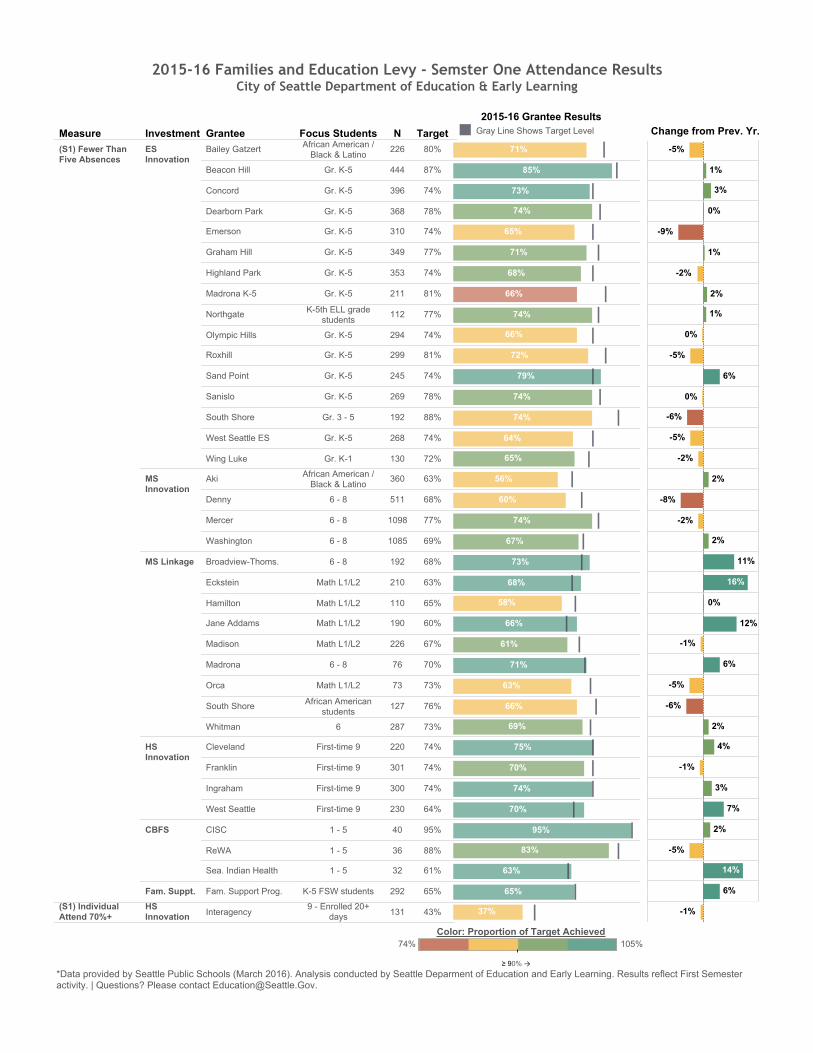
2015-16 Families and Education Levy - Semster One Attendance ResultsCity of Seattle Department of Education & Early Learning
Measure InvestmentGrantee Focus Students N Target
2014-15 S1 Actual Performace (%Meeting Measure)
0% 20% 40% 60% 80%2015-16 % Met Target
(S1) Fewer ThanFive Absences
ESInnovation
Bailey Gatzert African American /Black & Latino
226 80%
Beacon Hill Gr. K-5 444 87%
Concord Gr. K-5 396 74%
Dearborn Park Gr. K-5 368 78%
Emerson Gr. K-5 310 74%
Graham Hill Gr. K-5 349 77%
Highland Park Gr. K-5 353 74%
Madrona K-5 Gr. K-5 211 81%
Northgate K-5th ELL gradestudents
112 77%
Olympic Hills Gr. K-5 294 74%
Roxhill Gr. K-5 299 81%
Sand Point Gr. K-5 245 74%
Sanislo Gr. K-5 269 78%
South Shore Gr. 3 - 5 192 88%
West Seattle ES Gr. K-5 268 74%
Wing Luke Gr. K-1 130 72%
MSInnovation
Aki African American /Black & Latino
360 63%
Denny 6 - 8 511 68%
Mercer 6 - 8 1098 77%
Washington 6 - 8 1085 69%
MS Linkage Broadview-Thoms. 6 - 8 192 68%
Eckstein Math L1/L2 210 63%
Hamilton Math L1/L2 110 65%
Jane Addams Math L1/L2 190 60%
Madison Math L1/L2 226 67%
Madrona 6 - 8 76 70%
Orca Math L1/L2 73 73%
South Shore African Americanstudents
127 76%
Whitman 6 287 73%
HSInnovation
Cleveland First-time 9 220 74%
Franklin First-time 9 301 74%
Ingraham First-time 9 300 74%
West Seattle First-time 9 230 64%
CBFS CISC 1 - 5 40 95%
ReWA 1 - 5 36 88%
Sea. Indian Health 1 - 5 32 61%
Fam. Suppt. Fam. Support Prog. K-5 FSW students 292 65%
(S1) IndividualAttend 70%+
HSInnovation Interagency
9 - Enrolled 20+days 131 43%
71%
85%
73%
74%
65%
71%
68%
66%
74%
66%
72%
79%
74%
74%
64%
65%
56%
60%
74%
67%
73%
68%
58%
66%
61%
71%
63%
66%
69%
75%
70%
74%
70%
95%
83%
63%
65%
37%
2016
-5%
1%
3%
0%
-9%
1%
-2%
2%
1%
0%
-5%
6%
0%
-6%
-5%
-2%
2%
-8%
-2%
2%
11%
16%
0%
12%
-1%
6%
-5%
-6%
2%
4%
-1%
3%
7%
2%
-5%
14%
6%
-1%
*Data provided by Seattle Public Schools (March 2016). Analysis conducted by Seattle Deparment of Education and Early Learning. Results reflect First Semesteractivity. | Questions? Please contact [email protected].
InvestmentNull
CBFS
ES Innovation
Fam. Suppt.
HS Innovation
MS Innovation
MS Linkage
Public Health
Step Ahead
MeasureNull
1st-3rd grade focus students meeting annual typical growth on ..
1st-3rd grade focus students meeting annual typical growth on ..
70% Attendance Rate (First Semester)
70% Attendance Rate (Second Semester)
85% Attendance Rate
(S2) 1+ Core ELA
(S2) 1+ Core Math
(S2) 70%+ Att.
(S2) Fewer Than Five Absences
(S2) Passing Core Courses
Attaining Typical/High Growth (SGP) in Math
Attaining Typical/High Growth (SGP) in Reading
Attaining Typical/High Growth in Math (SGP)
Attaining Typical/High Growth in Math SBA (SGP)
Attaining Typical/High Growth in Reading (SGP)
Attaining Typical/High Growth in Reading SBA (SGP)
Attaining typical/high growth Math SGP
Attaining Typical/High Growth on Algebra EOC (SGP)
Completing a health screening
Earning C or Better in Core Courses
Fewer Than 10 Absences
Fewer Than Five Absences
Focus Students Enrolled in Program
Indiv. Attend. Rate ≥70%
Making gains on PPVT-4 Growth Value score from fall to spring
Making gains on the final Teaching Strategies Gold assessment
Making gains on WELPA
Making Typical/High Growth in Math (SGP)
MakingTypical/High Growth in Math (SGP)
Meeting age-level expectations in all six Teaching Strategies G..
Meeting expectations in social emitional and phydical domains ..
Meeting PPVT-4 Standard Score of 85 or above
Meeting Standard on End-of-Course Exam in Algebra or Geom..
Meeting Standard on SBA Math
Meeting Standard on SBA Math and Reading
Meeting Standard on SBA Reading
Meeting Typical Growth on MAP Math
Meeting Typical Growth on MAP Math and Reading
Meeting Typical Growth on MAP Reading
On-time Promotion
Passing ≥1 Core ELA Course
Passing ≥1 Core Math Course
Passing All Classes
Passing Core Courses
Receiving a behavioral health plan and follow-up by Mental He..
Student Credit Trgts.
≥ 90% →
74% 105%Color: Proportion of Target Achieved
2015-16 Grantee ResultsGray Line Shows .. Change from Prev. Yr.Gray Line Shows Target Level
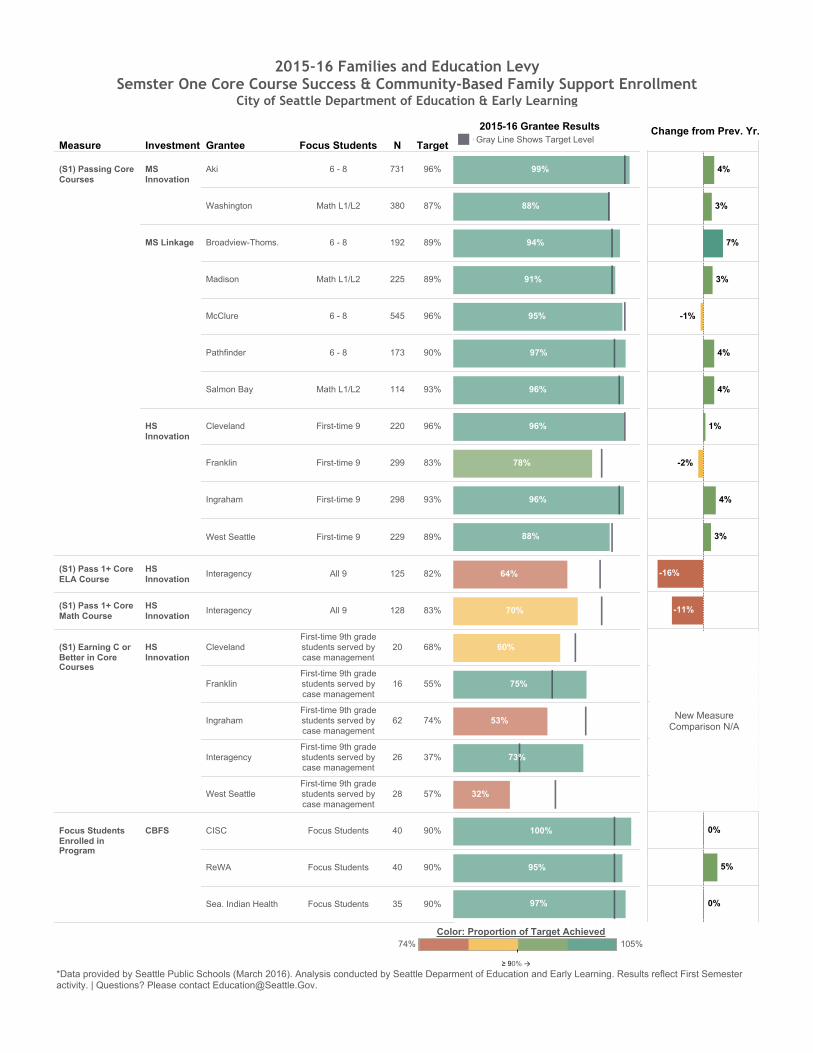
2015-16 Families and Education LevySemster One Core Course Success & Community-Based Family Support Enrollment
City of Seattle Department of Education & Early Learning
Measure InvestmentGrantee Focus Students N Target
2014-15 S1 Actual Performace (%Meeting Measure)
0% 20% 40% 60% 80% 100%2015-16 % Met Target
(S1) Passing CoreCourses
MSInnovation
Aki 6 - 8 731 96%
Washington Math L1/L2 380 87%
MS Linkage Broadview-Thoms. 6 - 8 192 89%
Madison Math L1/L2 225 89%
McClure 6 - 8 545 96%
Pathfinder 6 - 8 173 90%
Salmon Bay Math L1/L2 114 93%
HSInnovation
Cleveland First-time 9 220 96%
Franklin First-time 9 299 83%
Ingraham First-time 9 298 93%
West Seattle First-time 9 229 89%
(S1) Pass 1+ CoreELA Course
HSInnovation
Interagency All 9 125 82%
(S1) Pass 1+ CoreMath Course
HSInnovation
Interagency All 9 128 83%
(S1) Earning C orBetter in CoreCourses
HSInnovation
ClevelandFirst-time 9th gradestudents served bycase management
20 68%
FranklinFirst-time 9th gradestudents served bycase management
16 55%
IngrahamFirst-time 9th gradestudents served bycase management
62 74%
InteragencyFirst-time 9th gradestudents served bycase management
26 37%
West SeattleFirst-time 9th gradestudents served bycase management
28 57%
Focus StudentsEnrolled inProgram
CBFS CISC Focus Students 40 90%
ReWA Focus Students 40 90%
Sea. Indian Health Focus Students 35 90%
99%
88%
94%
91%
95%
97%
96%
96%
78%
96%
88%
64%
70%
60%
75%
53%
73%
32%
100%
95%
97%
2016
4%
3%
7%
3%
-1%
4%
4%
1%
-2%
4%
3%
-16%
-11%
60%
75%
53%
73%
32%
0%
5%
0%
*Data provided by Seattle Public Schools (March 2016). Analysis conducted by Seattle Deparment of Education and Early Learning. Results reflect First Semesteractivity. | Questions? Please contact [email protected].
InvestmentNull
CBFS
ES Innovation
Fam. Suppt.
HS Innovation
MS Innovation
MS Linkage
Public Health
Step Ahead
MeasureNull
1st-3rd grade focus students meeting annual typical growth on ..
1st-3rd grade focus students meeting annual typical growth on ..
70% Attendance Rate (First Semester)
70% Attendance Rate (Second Semester)
85% Attendance Rate
(S2) 1+ Core ELA
(S2) 1+ Core Math
(S2) 70%+ Att.
(S2) Fewer Than Five Absences
(S2) Passing Core Courses
Attaining Typical/High Growth (SGP) in Math
Attaining Typical/High Growth (SGP) in Reading
Attaining Typical/High Growth in Math (SGP)
Attaining Typical/High Growth in Math SBA (SGP)
Attaining Typical/High Growth in Reading (SGP)
Attaining Typical/High Growth in Reading SBA (SGP)
Attaining typical/high growth Math SGP
Attaining Typical/High Growth on Algebra EOC (SGP)
Completing a health screening
Earning C or Better in Core Courses
Fewer Than 10 Absences
Fewer Than Five Absences
Focus Students Enrolled in Program
Indiv. Attend. Rate ≥70%
Making gains on PPVT-4 Growth Value score from fall to spring
Making gains on the final Teaching Strategies Gold assessment
Making gains on WELPA
Making Typical/High Growth in Math (SGP)
MakingTypical/High Growth in Math (SGP)
Meeting age-level expectations in all six Teaching Strategies G..
Meeting expectations in social emitional and phydical domains ..
Meeting PPVT-4 Standard Score of 85 or above
Meeting Standard on End-of-Course Exam in Algebra or Geom..
Meeting Standard on SBA Math
Meeting Standard on SBA Math and Reading
Meeting Standard on SBA Reading
Meeting Typical Growth on MAP Math
Meeting Typical Growth on MAP Math and Reading
Meeting Typical Growth on MAP Reading
On-time Promotion
Passing ≥1 Core ELA Course
Passing ≥1 Core Math Course
Passing All Classes
Passing Core Courses
Receiving a behavioral health plan and follow-up by Mental He..
Student Credit Trgts.
≥ 90% →
74% 105%Color: Proportion of Target Achieved
2015-16 Grantee ResultsGray Line Shows ..
Change from Prev. Yr.
New MeasureComparison N/A
Gray Line Shows Target Level