Embed Size (px)
Citation preview
�����������
department of business and professional regulation
division of hotels and restaurants
����������� ���� �� ������������ ��
FY 1999-2000
������������������� ���
protand s
thriw
Dedicated toecting the healthafety of the publicough educationn partnershipith industry.
1999-2000Division of Hotels and Restaurants
Annual Report:
The Division of Hotels and Restaurants is responsible for licensing, inspecting and regulatingpublic lodging and food service establishments in Florida pursuant to Chapter 509, FloridaStatutes. The mission statement of the Division of Hotels and Restaurants is: "Dedicated toprotecting the health and safety of the public through education in partnership with industry."The division is also responsible for licensing and regulating elevators, escalators and othervertical conveyance devices, pursuant to Chapter 399, Florida Statutes.
In pursuit of that mission, the division has received local, regional and national recognition as atrendsetter and leader among the states. During the year, division inspectors inspected over180,000 facilities and conducted 3,000 Hazard Analysis/Critical Control Points (HACCP)inspections to provide science-based educational training for licensees. Additionally, routineinspections are incorporating HACCP procedures that are designed to spot and stop troublebefore the public is endangered. More than 90,000 food managers have been certified duringthe past five years.
The Hospitality Education Program trained over 21,000 individuals and distributed 469,182educational materials to industry and interested parties. Additionally, Florida became the firststate to require specific training for all food-service employees.
Electronic communications have been enhanced to the point that over 100 division forms,brochures, rules and laws are available on the division website at MyFlorida.com. Documentscanners have been installed in each district office to expedite data entry into the division�scomputer system.
Consumers were rewarded with refunds of over $75,000 in lodging price gouging claimsrecovered through division efforts after Hurricane Floyd.
The division made great strides during the year towards the formal adoption of the U. S. Foodand Drug Administration�s Recommended Standards for Retail/Food Program Excellence.The division is currently organized into seven main units: the Bureau of Sanitation and SafetyInspections; the Bureau of Elevator Safety; the Bureau of Licensure; the Office of Compliance;the Office of Program Policy; and the Hospitality Education Program. The three sub-units ofOperational Development, Program Oversight, and seven district offices complete theorganizational structure. The director�s office also provides administrative support to theDivision of Hotels and Restaurants� Advisory Council.
Division of Hotels and Restaurants
2
Annual Report: FY 1999-2000Annual Report: FY 1999-2000Annual Report: FY 1999-2000Annual Report: FY 1999-2000
In Fiscal Year 1999-2000, the division was authorized 337 positions and an operating budget of$17,961,491. The 2000 Florida Legislature privatized the Bureau of Elevator Safety inspectionprogram and the division has begun developing procedures to implement this legislation.
OFFICE OF THE DIRECTOROFFICE OF THE DIRECTOROFFICE OF THE DIRECTOROFFICE OF THE DIRECTORSusan R. McKinley, Director(850) 488-1133 FAX (850) 488-1514
The Office of the Director establishes policy for and oversees activities of the division. Thedirector supervises the administration of the Hospitality Education Program; oversees thepresentation of the division�s annual legislative budget request and ensures that appropriatedfunds are properly disbursed; ensures that the division is operating within its means; organizesand submits the fiscal year goals and objectives of the division and ensures they are main-tained; serves as legislative liaison for the division; is responsible for implementing changes toChapters 83, Part II, 399 and 509 Florida Statutes, as well as promulgating rules and regulationspertaining to the division�s programs; works closely with the department�s legal staff regardingmatters of enforcement and the filing of charges against licensees when compliance cannot beobtained; and conducts emergency closures on establishments posing an immediate health orsafety threat to the public by suspending their licenses.
Office of Program OversightOffice of Program OversightOffice of Program OversightOffice of Program OversightDiann S. Worzalla, Special Programs Administrator (850) 922-8850 FAX (850) 414-7425
The Office of Program Oversight (OPO) monitors, assesses, and evaluates all programsadministered by the division and reports on the quantity and quality of its activities to thedirector and management. This office evaluates a broad spectrum of activities by assessingquality from the perspective of structure, process and outcome. Data is evaluated from whichconclusions can be drawn and findings presented in a manner that draws support for correctingor preventing indicated problems. A report is issued annually which addresses outcomeassessments, total quality management, and continuous quality improvement. The OPOcoordinates the division's Speakers Bureau, one of the division's consumer and licenseeoutreach programs. Program Oversight has been successful in the adoption of the FDAstandards and provided technical assistance in ensuring the division maintains them.
Division of Hotels and Restaurants
3
Annual Report: FY 1999-2000Annual Report: FY 1999-2000Annual Report: FY 1999-2000Annual Report: FY 1999-2000
Operational Development and Information OfficeOperational Development and Information OfficeOperational Development and Information OfficeOperational Development and Information OfficeThomas N. Coker, Operations and Management Consultant Manager(850) 922-8842 FAX (850) 414-7425
The Operational Development and Information Office (ODI) is responsible for analyzing businessprocesses and making recommendations to management for improvements and efficiencies. Asadvanced power users, this staff has worked to develop and enhance the division�s businessprocesses through automated systems to replace manual processes. During Fiscal Year 1999-2000, ODI staff completed coordination and implementation of a project incorporating opticalmark readers (bubble scanners) to drastically reduce time spent by district clerical staff dataentering inspection information.
The ODI Office also designs, produces and maintains most of the division�s customized formsand other publications. These publications include forms, brochures, newsletters andreproductions of applicable statutes, rules, and codes for distribution to the division�s staff,licensees and the general public.
In addition, ODI staff serve as web authors for the division, ensuring timely sharing ofinformation on the department�s Internet and Intranet sites. Through their efforts, over 100forms and publications are now available through this medium. ODI staff members also serveas technical coordinators for the division, providing assistance and information to the StateTechnology Office regarding the division�s computer resources when needed.
ODI also maintains statistical information and generates reports for the division. These reportsinclude a monthly inspection activity report that helps management to better assessachievement of inspection goals throughout the year. In addition, ODI responds to publicrequests for public records, information and statistics.
Office of Program PolicyOffice of Program PolicyOffice of Program PolicyOffice of Program PolicyDebra K. Williams, Biological Administrator(850) 410-1493 FAX (850) 488-2740
The Office of Program Policy staff is responsible for keeping abreast of federal and state foodand fire safety code changes that affect the division and then making recommendations tomanagement regarding rules and policies influenced by these changes. The technicalcoordinators also interpret law and rule to resolve specific issues raised by field staff andprovide leadership in resolving sanitation and safety issues in any public workshops andhearings. The coordinators also address technical questions from the division�slicensees/operators and the public regarding laws, rules, procedures and field complaints priorto further investigation by the district offices.
Division of Hotels and Restaurants
4
Annual Report: FY 1999-2000Annual Report: FY 1999-2000Annual Report: FY 1999-2000Annual Report: FY 1999-2000The Office of Program Policy also responds to consumer public health concerns by addressingspecific diseases, their modes of transmission and food service operations in order to reducethe risk of foodborne illness. The office staff must remain up-to-date at the federal and nationallevel on emerging pathogens in order to be proactive in protecting and educating Floridaconsumers. This office coordinates communications and issue resolution with the other twostate agencies that handle food safety issues in Florida. With Florida having a tourist basedeconomy and a very large at-risk population, it is critical to foster and maintain cooperationbetween the agencies to assure that the public health concerns remain focused and are fullyaddressed. The OPP staff is instrumental in developing educational material for Floridalicensees to use to educate and promote safe food handling techniques, proper sanitation andappropriate methods of foodborne illness intervention.
The Office of Program Policy hosts four (4) monthly statewide conference calls. These callsinclude:
! The CEO (Certified Evaluation Officers) conference calls address food safety issues andinterpretations made relating to division foodservice laws and rules.
! The Lodging conference calls address fire safety and sanitation issues and other topicsrelating to lodging regulations.
! The Plan Review conference calls address the review of construction plans for the state�sfood service industry to assure that the division is uniform across the state in regard tointerpretations of foodservice laws and rules relating to construction and remodeling.
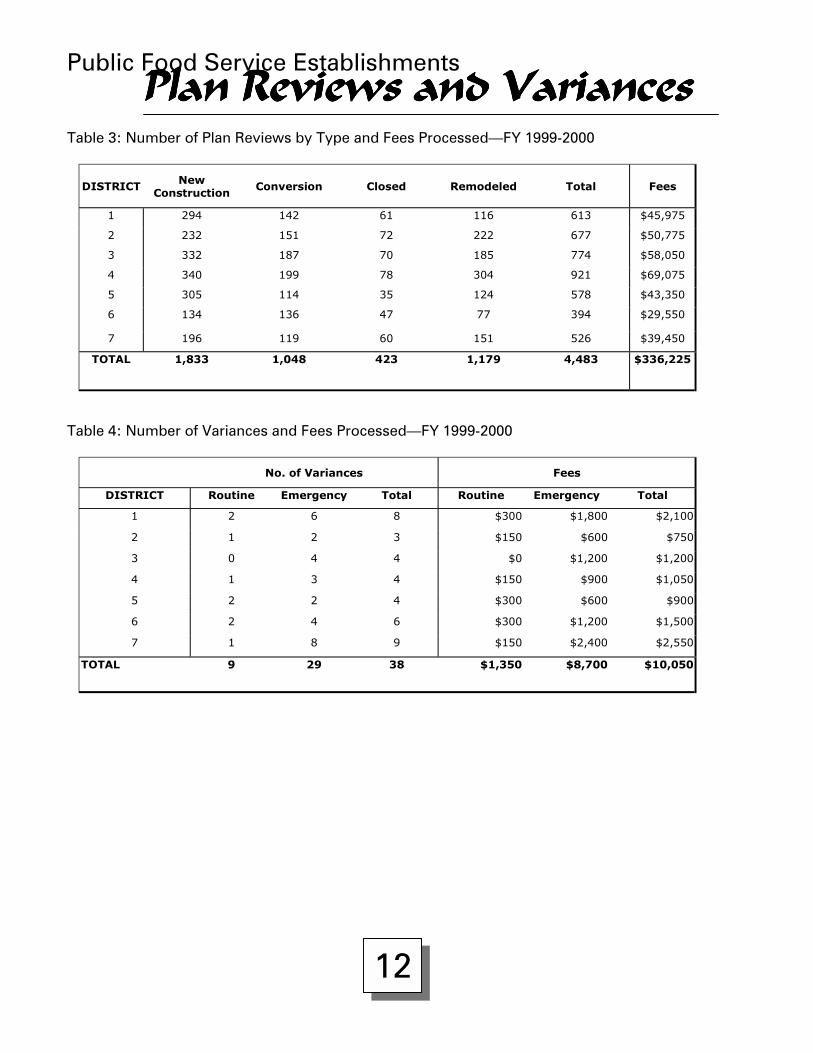
In Fiscal Year 1999-2000, the office handled nearly 5,000 plan reviews and 55 variancerequests. These plan reviews are conducted in our seven (7) district offices and areoverseen by the Office of Program Policy to ensure consistency, accuracy, and efficiencystatewide. The variance requests are carefully considered, reviewed and investigated on anindividual basis and are granted only when it is determined that public health is notcompromised in any manner.
! The HACCP (Hazard Analysis Critical Control Points) conference calls coordinate thedevelopment of the science based, risk assessment inspection process that the division iscurrently implementing.
The Office of Program Policy is also very active with public outreach activities. These activitiesinclude developing industry information sheets for licensees relating to important public healthand safety information, participating in community educational efforts, assisting the public withgeneral food safety information, and developing disaster preparedness and staff inspectionprocedures to assist in the event of a major disaster.
Division of Hotels and Restaurants
5
Annual Report: FY 1999-2000Annual Report: FY 1999-2000Annual Report: FY 1999-2000Annual Report: FY 1999-2000The office coordinates and provides the mandatory technical training for division inspection staffin compliance with Chapter 509.036, Florida Statutes. This includes 20 hours of CEUs per yearfor foodservice and 40 hours every 3 years for fire safety inspectors. The office ensures our fieldstaff is provided with current information and is dynamic in accommodating the ever-changingneeds of the field staff and assisting them in upholding their responsibilities to our licensees andconsumers.
HOSPITALITY EDUCATION PROGRAMHOSPITALITY EDUCATION PROGRAMHOSPITALITY EDUCATION PROGRAMHOSPITALITY EDUCATION PROGRAMDr. Angel Gonzalez, Administrator(850) 644-2051 FAX (850) 644-8681
The Hospitality Education Program (HEP) and Resource Center is designed to provide educationand information to operators of hospitality businesses licensed by this division. Funding isprovided from a fee which is included as part of every public lodging and food serviceestablishment license fee.
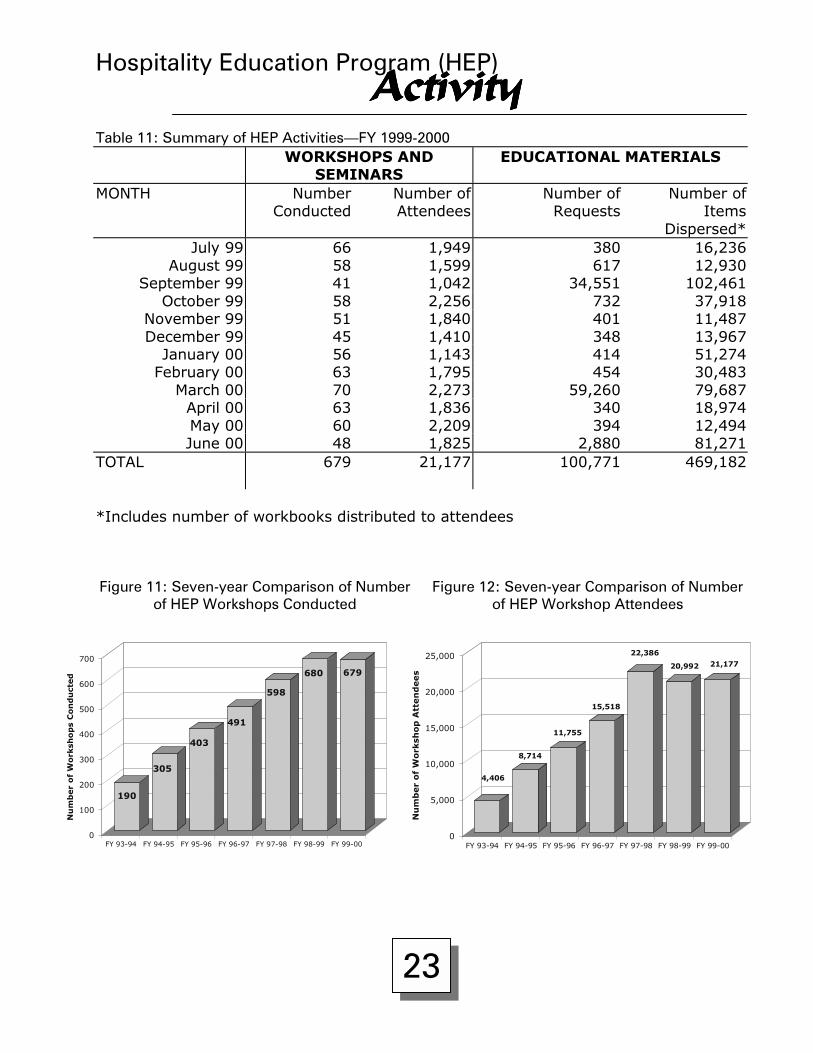
The program researches, prepares and presents educational materials and training classes tolicensees relevant to the operation and regulation of the hospitality industry. Located in theUniversity Center at Florida State University, the Hospitality Education Program Office andResource Center contains over 6,000 training materials and over 60 periodicals. HEP distributedmore than 469,000 educational materials during the 1999-2000 Fiscal Year.
During the past year, the Hospitality Education Program trained more than 21,000 hospitalityindustry employees through free workshops offered in communities throughout the state. HEPworkshops are offered in several different languages including Mandarin Chinese, Creole andSpanish.
This year, HEP sponsored a school-to-career training program for high school students incooperation with the Florida Hotel and Motel Association and the Florida Restaurant Association.This program prepares students for future careers in the hospitality industry.
BUREAU OF ELEVATOR SAFETYBUREAU OF ELEVATOR SAFETYBUREAU OF ELEVATOR SAFETYBUREAU OF ELEVATOR SAFETYCathy White, Bureau Chief(850) 488-9097 FAX (850) 922-6208
The Bureau of Elevator Safety enforces Florida�s elevator laws to ensure the safety of personsusing vertical transportation (elevators, escalators, dumbwaiters, moving walks, inclinedstairway chair lifts and inclined or vertical wheelchair lifts). The program enforces the AmericanSociety of Mechanical Engineers� Safety Code for Elevators and Escalators; portions of theNational Electrical Code; State Fire Marshal�s Uniform Fire Safety Standards; National
Division of Hotels and Restaurants
6
Annual Report: FY 1999-2000Annual Report: FY 1999-2000Annual Report: FY 1999-2000Annual Report: FY 1999-2000Handicapped Requirements; Chapter 399, Florida Statutes; and Chapter 61C-5, FloridaAdministrative Code.
The bureau licenses all elevators, conducts plan reviews for proposed elevators, issuesconstruction and alteration permits, registers elevator companies, and coordinates examinationsfor issuance of Certificates of Competency. Annual service maintenance contract statusverification and renewals of Certificates of Operation are coordinated with the Bureau ofLicensure. The bureau also manages contracts with the cities of Miami, Miami Beach and Miami-Dade County and Reedy Creek Improvement District to ensure that inspections adhere to statestandards. The bureau is currently negotiating with other local jurisdictions to expand thisprogram.
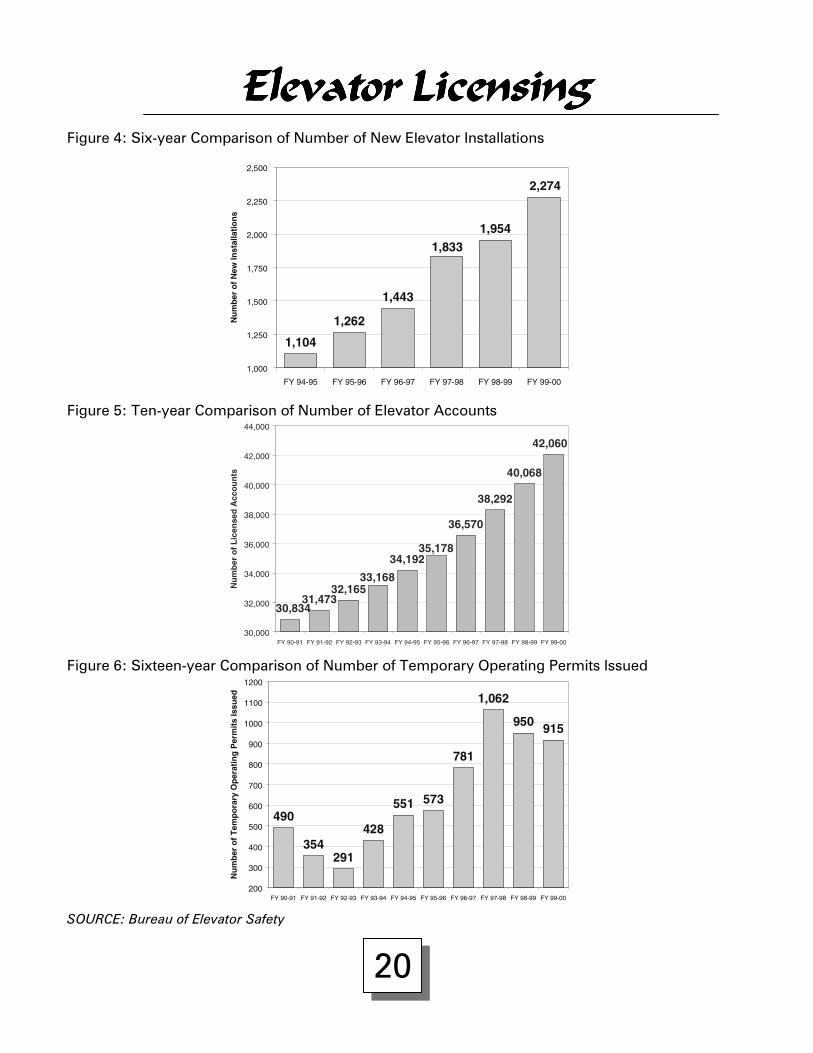
The 2000 Legislative Session privatized the safety inspection function of the bureau, therebyeliminating 18 positions. The bureau conducted 16,772 inspections during Fiscal Year 1999-2000.
BUREAU OF LICENSUREBUREAU OF LICENSUREBUREAU OF LICENSUREBUREAU OF LICENSURELance Rodan, Bureau Chief(850) 922-5335 FAX (850) 488-1514
The Bureau of Licensure processes licenses for public lodging and food service establishmentsand elevator certificates; reconciles license fees received by the division; processes elevatorservice maintenance contract information; enters new licenses and changes of ownership;provides listings and labels for public requests; provides electronically generated managementreports for the division; and manages electronic data services on the mainframe computerscurrently maintained by the Department of Management Services� Technology Resource Center.
During the past Fiscal Year, the Bureau of Licensure processed licenses and license renewals for69,028 public lodging and food service establishments and 42,060 elevator accounts. Inaddition, this bureau provides licensing information, data management and data entry supportto the division. The bureau is exploring new technological advancements including on-linerenewals.
BUREAU OF SANITATION AND SAFETY INSPECTIONSBUREAU OF SANITATION AND SAFETY INSPECTIONSBUREAU OF SANITATION AND SAFETY INSPECTIONSBUREAU OF SANITATION AND SAFETY INSPECTIONSLarry Schwartz, Bureau Chief(850) 488-9263 FAX (850) 488-2740
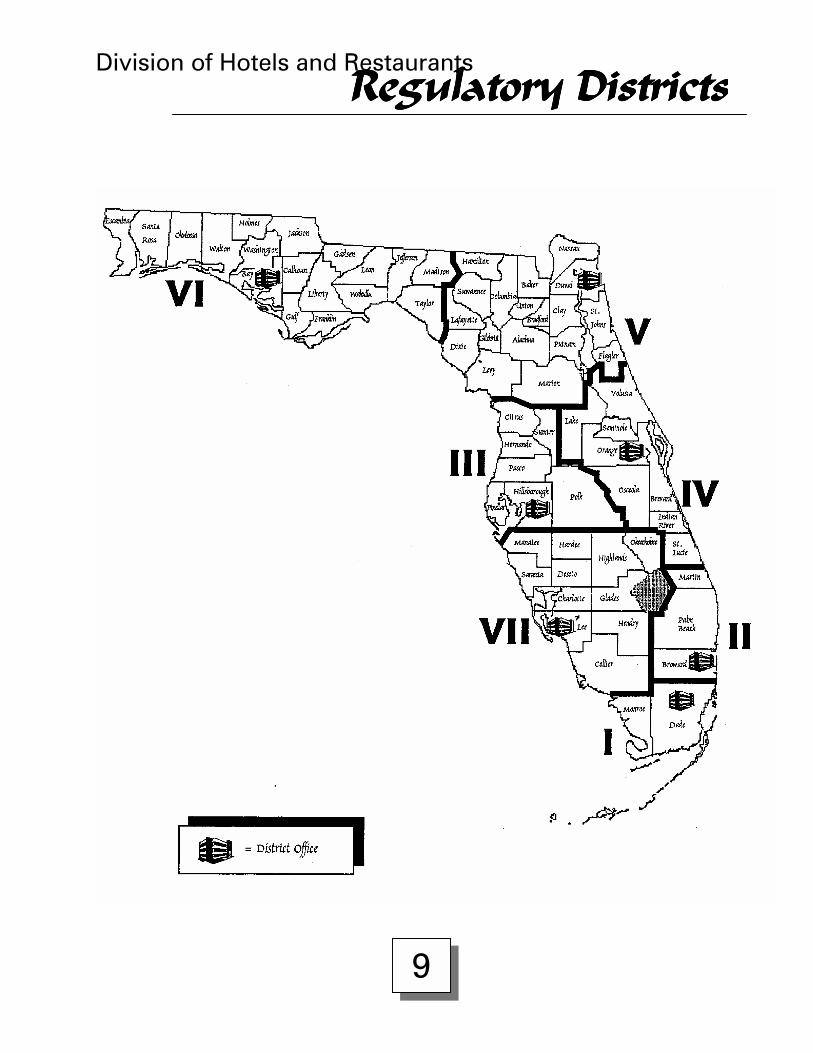
During Fiscal Year 1999-2000, the Bureau of Sanitation and Safety Inspections conducted morethan 220,000 inspections of food service and lodging establishments to ensure the health andsafety of Florida�s residents and visitors. The bureau has seven district offices that are located inMiami, Ft. Lauderdale, Ft. Myers, Winter Park, Tampa, Jacksonville, and Panama City.
Division of Hotels and Restaurants
7
Annual Report: FY 1999-2000Annual Report: FY 1999-2000Annual Report: FY 1999-2000Annual Report: FY 1999-2000
These inspections include:! routine inspections;! opening inspections for new establishments and changes of ownership;! call-back inspections on establishments having critical violations to correct within a
specified time;! temporary event inspections;! health inspections for alcoholic beverage license applicants;! complaint investigations;! assist the Department of Health with foodborne illness investigations;! resolution of landlord/tenant disputes regarding security deposits.
Further, the bureau enforces licensee compliance with the Florida Clean Indoor Air Act and longdistance telephone carrier access and posting of charges for the Florida Public ServiceCommission.
Administrators and office staff in each of the seven district offices are responsible forcoordinating daily activities and scheduling inspections. Administrative enforcement cases areinitiated in the districts to ensure compliance with the law. The division is authorized by law toassess fines up to $1,000 per offense per day and to suspend or revoke an operator�s license forviolations of law or rule.
This year, the bureau undertook the investigation of price gouging complaints resulting fromHurricanes Floyd and Irene. The division recovered more than $75,000 for more than 250consumers who were victims of price gouging.
OFFICE OF COMPLIANCEOFFICE OF COMPLIANCEOFFICE OF COMPLIANCEOFFICE OF COMPLIANCEGeoff Luebkemann, Administrator(850) 410-2491 FAX (850) 488-2740
The Division�s Office of Compliance has one simple mission: Procure Compliance. This requiresbalancing the needs of several diverse stakeholder groups, including: Florida�s citizens andnearly 50 million annual visitors, regulated industries, division field inspection staff andmanagement, and division legal staff.
The majority of the division�s 111,088 license holders in public food service, public lodging,elevators (and related conveyances) operate within the standards set forth in statute and rule.Effective achievement of the division�s mission and mandate do require, however, a mechanismto deal with those operators that cannot or will not comply with these standards and thusjeopardize the public health, safety or welfare.
Division of Hotels and Restaurants
8
Annual Report: FY 1999-2000Annual Report: FY 1999-2000Annual Report: FY 1999-2000Annual Report: FY 1999-2000The Office of Compliance manages and administers the formal disciplinary processes necessaryto compel compliance when standards are violated. This process, set forth in Chapter 120,Florida Statutes, Florida�s Administrative Procedures Act, is initiated when division inspectorsobserve violations that 1) require immediate legal remediation by virtue of their imminent,severe and adverse public safety impact, or 2) consist of less hazardous circumstances thatremain uncorrected after notice and reasonable time to do so are provided to the operator.
The process for disciplinary actions is governed by Chapter 120, Florida Statutes, and iscomprised of the following: 1) existence of violations requiring disciplinary action; 2) formalnotice to operator, called an administrative complaint, charging the violations; 3) opportunity foroperator to request an informal hearing (no dispute of the facts of the matter), or a formalhearing (does dispute facts of the matter); 4) opportunity to settle the case without litigation; and5) a final order of the division setting out the findings of fact, conclusions of law, and resultingcorrective order including punitive fines, if any.
Division of Hotels and Restaurants
9
Regulatory DistrictsRegulatory DistrictsRegulatory DistrictsRegulatory Districts
Division of Hotels and Restaurants
10
Performance MeasuresPerformance MeasuresPerformance MeasuresPerformance Measures
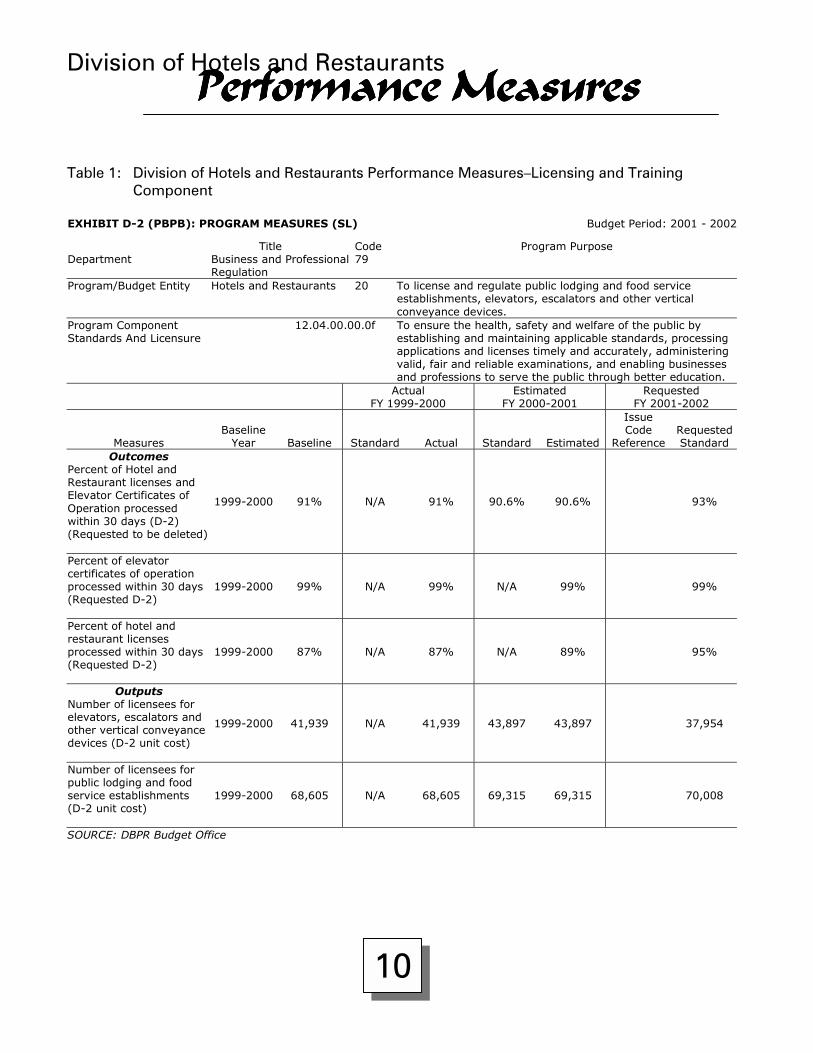
Table 1: Division of Hotels and Restaurants Performance Measures�Licensing and TrainingComponent
EXHIBIT D-2 (PBPB): PROGRAM MEASURES (SL) Budget Period: 2001 - 2002
Title Code Program PurposeDepartment Business and Professional
Regulation79
Program/Budget Entity Hotels and Restaurants 20 To license and regulate public lodging and food serviceestablishments, elevators, escalators and other verticalconveyance devices.
Program ComponentStandards And Licensure
12.04.00.00.0f To ensure the health, safety and welfare of the public byestablishing and maintaining applicable standards, processingapplications and licenses timely and accurately, administeringvalid, fair and reliable examinations, and enabling businessesand professions to serve the public through better education.
ActualFY 1999-2000
EstimatedFY 2000-2001
RequestedFY 2001-2002
MeasuresBaseline
Year Baseline Standard Actual Standard Estimated
IssueCode
ReferenceRequestedStandard
OutcomesPercent of Hotel andRestaurant licenses andElevator Certificates ofOperation processedwithin 30 days (D-2)(Requested to be deleted)
1999-2000 91% N/A 91% 90.6% 90.6% 93%
Percent of elevatorcertificates of operationprocessed within 30 days(Requested D-2)
1999-2000 99% N/A 99% N/A 99% 99%
Percent of hotel andrestaurant licensesprocessed within 30 days(Requested D-2)
1999-2000 87% N/A 87% N/A 89% 95%
OutputsNumber of licensees forelevators, escalators andother vertical conveyancedevices (D-2 unit cost)
1999-2000 41,939 N/A 41,939 43,897 43,897 37,954
Number of licensees forpublic lodging and foodservice establishments(D-2 unit cost)
1999-2000 68,605 N/A 68,605 69,315 69,315 70,008
SOURCE: DBPR Budget Office
Division of Hotels and Restaurants
11
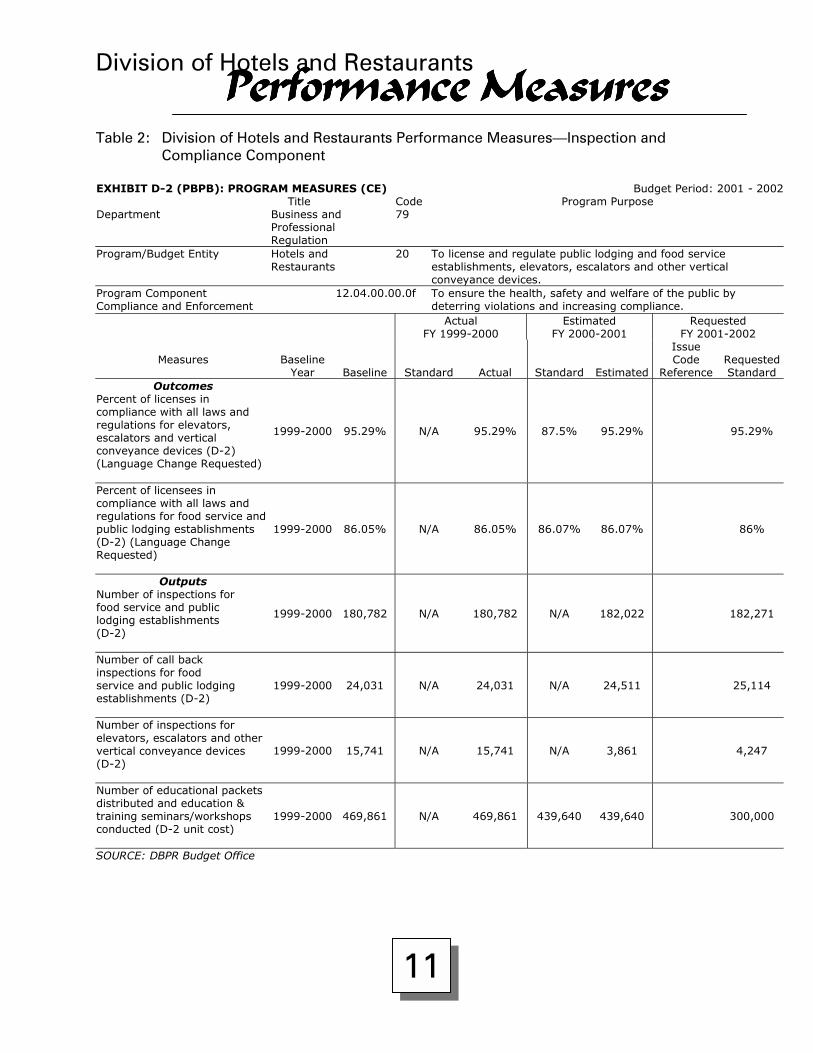
Performance MeasuresPerformance MeasuresPerformance MeasuresPerformance MeasuresTable 2: Division of Hotels and Restaurants Performance Measures�Inspection and
Compliance Component
EXHIBIT D-2 (PBPB): PROGRAM MEASURES (CE) Budget Period: 2001 - 2002Title Code Program Purpose
Department Business andProfessionalRegulation
79
Program/Budget Entity Hotels andRestaurants
20 To license and regulate public lodging and food serviceestablishments, elevators, escalators and other verticalconveyance devices.
Program ComponentCompliance and Enforcement
12.04.00.00.0f To ensure the health, safety and welfare of the public bydeterring violations and increasing compliance.
ActualFY 1999-2000
EstimatedFY 2000-2001
RequestedFY 2001-2002
Measures BaselineYear Baseline Standard Actual Standard Estimated
IssueCode
ReferenceRequestedStandard
OutcomesPercent of licenses incompliance with all laws andregulations for elevators,escalators and verticalconveyance devices (D-2)(Language Change Requested)
1999-2000 95.29% N/A 95.29% 87.5% 95.29% 95.29%
Percent of licensees incompliance with all laws andregulations for food service andpublic lodging establishments(D-2) (Language ChangeRequested)
1999-2000 86.05% N/A 86.05% 86.07% 86.07% 86%
OutputsNumber of inspections forfood service and publiclodging establishments(D-2)
1999-2000 180,782 N/A 180,782 N/A 182,022 182,271
Number of call backinspections for foodservice and public lodgingestablishments (D-2)
1999-2000 24,031 N/A 24,031 N/A 24,511 25,114
Number of inspections forelevators, escalators and othervertical conveyance devices(D-2)
1999-2000 15,741 N/A 15,741 N/A 3,861 4,247
Number of educational packetsdistributed and education &training seminars/workshopsconducted (D-2 unit cost)
1999-2000 469,861 N/A 469,861 439,640 439,640 300,000
SOURCE: DBPR Budget Office
Public Food Service Establishments
12
Plan Reviews and VariancesPlan Reviews and VariancesPlan Reviews and VariancesPlan Reviews and VariancesTable 3: Number of Plan Reviews by Type and Fees Processed�FY 1999-2000
DISTRICT NewConstruction
Conversion Closed Remodeled Total Fees
1 294 142 61 116 613 $45,975
2 232 151 72 222 677 $50,775
3 332 187 70 185 774 $58,050
4 340 199 78 304 921 $69,075
5 305 114 35 124 578 $43,350
6 134 136 47 77 394 $29,550
7 196 119 60 151 526 $39,450
TOTAL 1,833 1,048 423 1,179 4,483 $336,225
Table 4: Number of Variances and Fees Processed�FY 1999-2000
No. of Variances Fees
DISTRICT Routine Emergency Total Routine Emergency Total
1 2 6 8 $300 $1,800 $2,100
2 1 2 3 $150 $600 $750
3 0 4 4 $0 $1,200 $1,200
4 1 3 4 $150 $900 $1,050
5 2 2 4 $300 $600 $900
6 2 4 6 $300 $1,200 $1,500
7 1 8 9 $150 $2,400 $2,550
TOTAL 9 29 38 $1,350 $8,700 $10,050
Public Food Service EstablishmentsLicensingLicensingLicensingLicensing
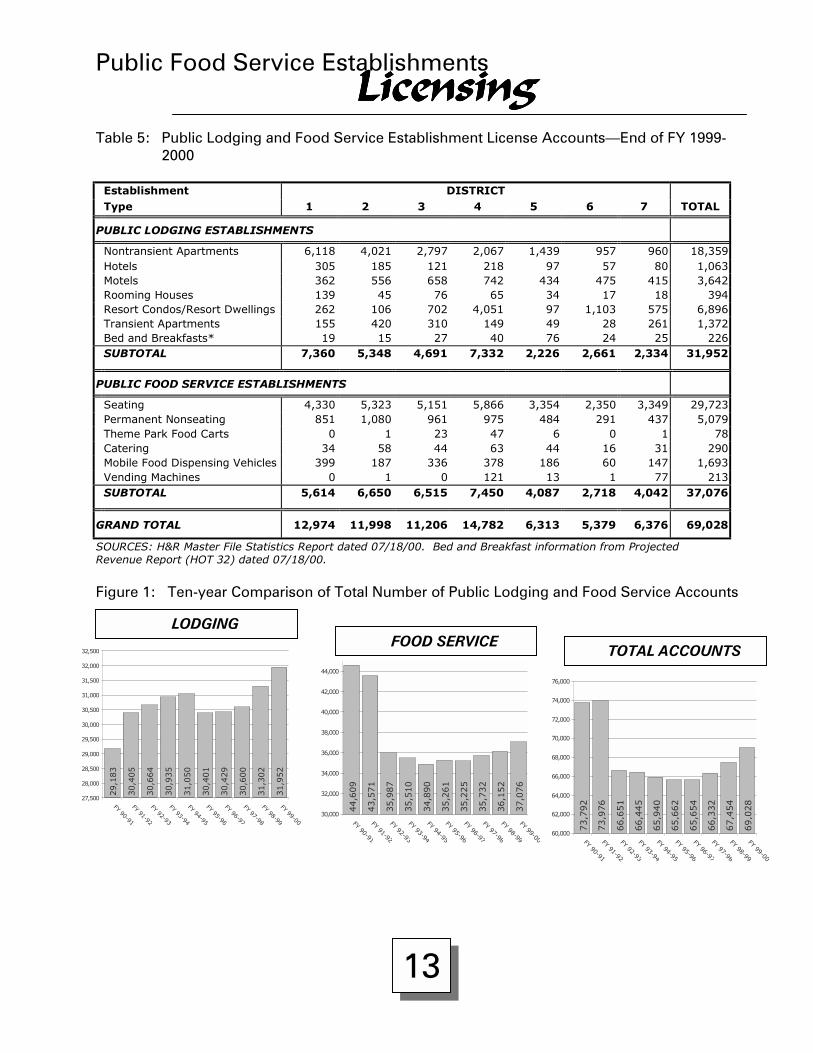
Table 5: Public Lodging and Food Service Establishment License Accounts�End of FY 1999-2000
Establishment DISTRICTType 1 2 3 4 5 6 7 TOTAL
PUBLIC LODGING ESTABLISHMENTS
Nontransient Apartments 6,118 4,021 2,797 2,067 1,439 957 960 18,359Hotels 305 185 121 218 97 57 80 1,063Motels 362 556 658 742 434 475 415 3,642Rooming Houses 139 45 76 65 34 17 18 394Resort Condos/Resort Dwellings 262 106 702 4,051 97 1,103 575 6,896Transient Apartments 155 420 310 149 49 28 261 1,372Bed and Breakfasts* 19 15 27 40 76 24 25 226SUBTOTAL 7,360 5,348 4,691 7,332 2,226 2,661 2,334 31,952
PUBLIC FOOD SERVICE ESTABLISHMENTS
Seating 4,330 5,323 5,151 5,866 3,354 2,350 3,349 29,723Permanent Nonseating 851 1,080 961 975 484 291 437 5,079Theme Park Food Carts 0 1 23 47 6 0 1 78Catering 34 58 44 63 44 16 31 290Mobile Food Dispensing Vehicles 399 187 336 378 186 60 147 1,693Vending Machines 0 1 0 121 13 1 77 213SUBTOTAL 5,614 6,650 6,515 7,450 4,087 2,718 4,042 37,076
GRAND TOTAL 12,974 11,998 11,206 14,782 6,313 5,379 6,376 69,028
SOURCES: H&R Master File Statistics Report dated 07/18/00. Bed and Breakfast information from ProjectedRevenue Report (HOT 32) dated 07/18/00.
Figure 1: Ten-year Comparison of Total Number of Public Lodging and Food Service Accounts
29,1
83
30,4
05
30,6
64
27,500
28,000
28,500
29,000
29,500
30,000
30,500
31,000
31,500
32,000
32,500
FY 90-91
FY 91-92
FY 92-
LODGING
30,9
35
31,0
50
30,4
01
30,4
29
30,6
00
31,9
52
31,3
02
93
FY 93-94
FY 94-95
FY 95-96
FY 96-97
FY 97-98
FY 98-99
FY 99-00
44,6
09
43,5
71
30,000
32,000
34,000
36,000
38,000
40,000
42,000
44,000
FY 90-91
FY 91-
FOOD SERVICE
13
35,9
87
35,5
10
34,8
90
35,2
61
35,2
25
35,7
32
36,1
52
37,0
76
92
FY 92-93
FY 93-94
FY 94-95
FY 95-96
FY 96-97
FY 97-98
FY 98-99
FY 99-00
73,7
92
60,000
62,000
64,000
66,000
68,000
70,000
72,000
74,000
76,000
FY 90-9
TOTAL ACCOUNTS
73,9
76
66,6
51
66,4
45
65,9
40
65,6
62
65,6
54
66,3
32
69,0
28
67,4
54
1
FY 91-92
FY 92-93
FY 93-94
FY 94-95
FY 95-96
FY 96-97
FY 97-98
FY 98-99
FY 99-00
Public Food Service Establishments
14
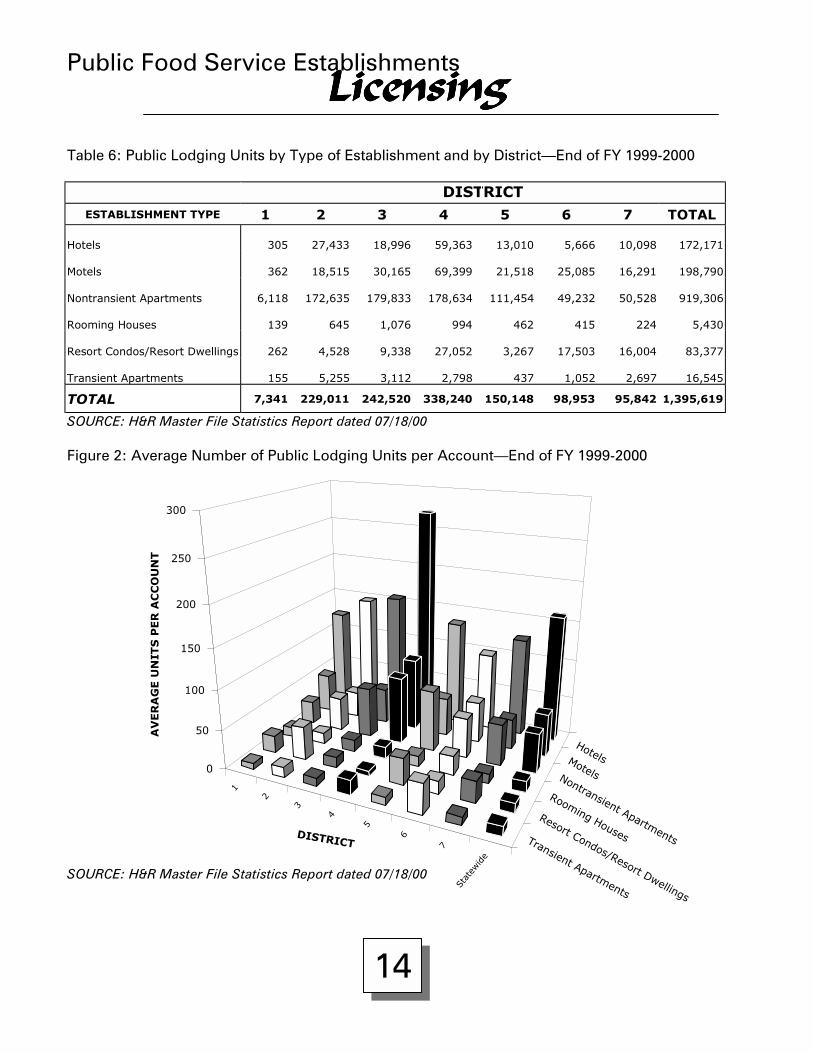
LicensingLicensingLicensingLicensingTable 6: Public Lodging Units by Type of Establishment and by District�End of FY 1999-2000
DISTRICTESTABLISHMENT TYPE 1 2 3 4 5 6 7 TOTAL
Hotels 305 27,433 18,996 59,363 13,010 5,666 10,098 172,171
Motels 362 18,515 30,165 69,399 21,518 25,085 16,291 198,790
Nontransient Apartments 6,118 172,635 179,833 178,634 111,454 49,232 50,528 919,306
Rooming Houses 139 645 1,076 994 462 415 224 5,430
Resort Condos/Resort Dwellings 262 4,528 9,338 27,052 3,267 17,503 16,004 83,377
Transient Apartments 155 5,255 3,112 2,798 437 1,052 2,697 16,545
TOTAL 7,341 229,011 242,520 338,240 150,148 98,953 95,842 1,395,619
SOURCE: H&R Master File Statistics Report dated 07/18/00
Figure 2: Average Number of Public Lodging Units per Account�End of FY 1999-2000
SOURCE: H&R Master File Statistics Report dated 07/18/00
HotelsMotelsNontransient Apartments
Rooming Houses
Resort Condos/Resort Dwellings
Transient Apartments
1
2
3
4
5
6
7
Stat
ewide
0
50
100
150
200
250
300
AV
ER
AG
E U
NIT
S P
ER
AC
CO
UN
T
DISTRICT
Public Lodging and Food Service Establishment
15
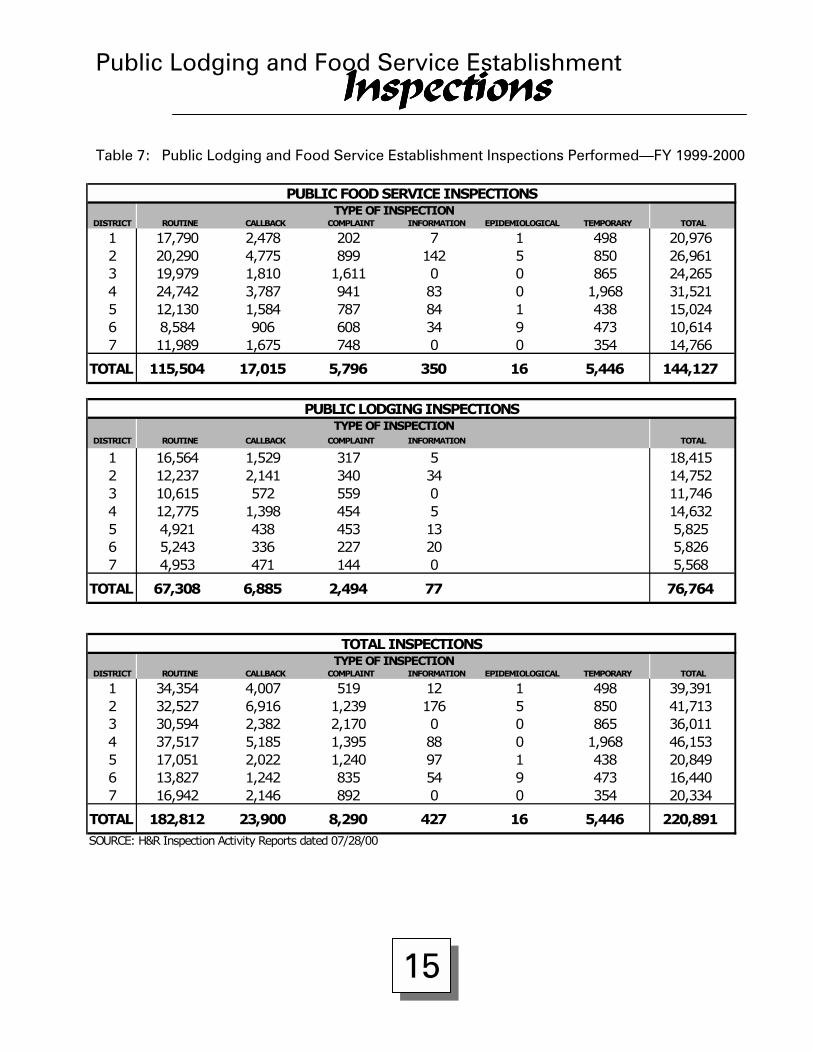
InspectionsInspectionsInspectionsInspectionsTable 7: Public Lodging and Food Service Establishment Inspections Performed�FY 1999-2000
PUBLIC FOOD SERVICE INSPECTIONSTYPE OF INSPECTION
DISTRICT ROUTINE CALLBACK COMPLAINT INFORMATION EPIDEMIOLOGICAL TEMPORARY TOTAL
1 17,790 2,478 202 7 1 498 20,9762 20,290 4,775 899 142 5 850 26,9613 19,979 1,810 1,611 0 0 865 24,2654 24,742 3,787 941 83 0 1,968 31,5215 12,130 1,584 787 84 1 438 15,0246 8,584 906 608 34 9 473 10,6147 11,989 1,675 748 0 0 354 14,766
TOTAL 115,504 17,015 5,796 350 16 5,446 144,127
PUBLIC LODGING INSPECTIONSTYPE OF INSPECTION
DISTRICT ROUTINE CALLBACK COMPLAINT INFORMATION TOTAL
1 16,564 1,529 317 5 18,4152 12,237 2,141 340 34 14,7523 10,615 572 559 0 11,7464 12,775 1,398 454 5 14,6325 4,921 438 453 13 5,8256 5,243 336 227 20 5,8267 4,953 471 144 0 5,568
TOTAL 67,308 6,885 2,494 77 76,764
TOTAL INSPECTIONSTYPE OF INSPECTION
DISTRICT ROUTINE CALLBACK COMPLAINT INFORMATION EPIDEMIOLOGICAL TEMPORARY TOTAL
1 34,354 4,007 519 12 1 498 39,3912 32,527 6,916 1,239 176 5 850 41,7133 30,594 2,382 2,170 0 0 865 36,0114 37,517 5,185 1,395 88 0 1,968 46,1535 17,051 2,022 1,240 97 1 438 20,8496 13,827 1,242 835 54 9 473 16,4407 16,942 2,146 892 0 0 354 20,334
TOTAL 182,812 23,900 8,290 427 16 5,446 220,891SOURCE: H&R Inspection Activity Reports dated 07/28/00
Public Lodging Establishment
16
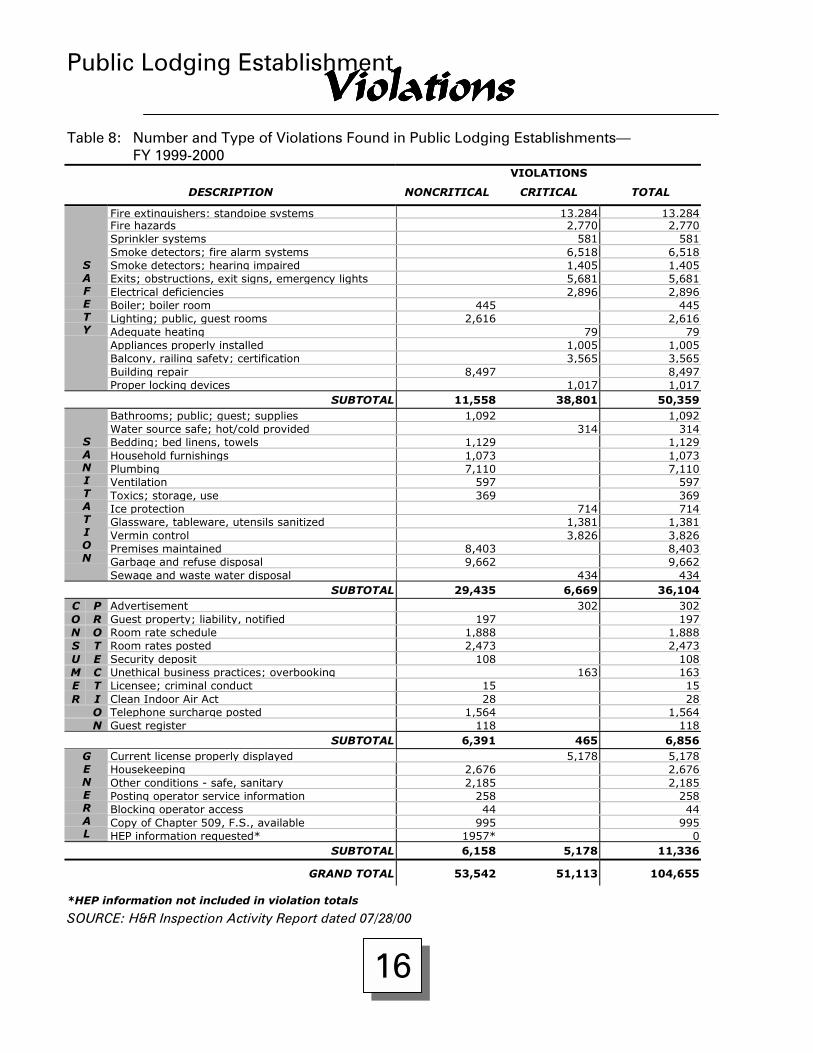
ViolationsViolationsViolationsViolationsTable 8: Number and Type of Violations Found in Public Lodging Establishments�
FY 1999-2000VIOLATIONS
DESCRIPTION NONCRITICAL CRITICAL TOTAL
Fire extinguishers; standpipe systems 13,284 13,284Fire hazards 2,770 2,770Sprinkler systems 581 581Smoke detectors; fire alarm systems 6,518 6,518Smoke detectors; hearing impaired 1,405 1,405Exits; obstructions, exit signs, emergency lights 5,681 5,681Electrical deficiencies 2,896 2,896Boiler; boiler room 445 445Lighting; public, guest rooms 2,616 2,616Adequate heating 79 79Appliances properly installed 1,005 1,005Balcony, railing safety; certification 3,565 3,565Building repair 8,497 8,497
SAFETY
Proper locking devices 1,017 1,017SUBTOTAL 11,558 38,801 50,359
Bathrooms; public; guest; supplies 1,092 1,092Water source safe; hot/cold provided 314 314Bedding; bed linens, towels 1,129 1,129Household furnishings 1,073 1,073Plumbing 7,110 7,110Ventilation 597 597Toxics; storage, use 369 369Ice protection 714 714Glassware, tableware, utensils sanitized 1,381 1,381Vermin control 3,826 3,826Premises maintained 8,403 8,403Garbage and refuse disposal 9,662 9,662
SANITATION
Sewage and waste water disposal 434 434SUBTOTAL 29,435 6,669 36,104
C P Advertisement 302 302O R Guest property; liability, notified 197 197N O Room rate schedule 1,888 1,888S T Room rates posted 2,473 2,473U E Security deposit 108 108M C Unethical business practices; overbooking 163 163E T Licensee; criminal conduct 15 15R I Clean Indoor Air Act 28 28
O Telephone surcharge posted 1,564 1,564N Guest register 118 118
SUBTOTAL 6,391 465 6,856Current license properly displayed 5,178 5,178Housekeeping 2,676 2,676Other conditions - safe, sanitary 2,185 2,185Posting operator service information 258 258Blocking operator access 44 44Copy of Chapter 509, F.S., available 995 995
GENERAL HEP information requested* 1957* 0
SUBTOTAL 6,158 5,178 11,336
GRAND TOTAL 53,542 51,113 104,655
*HEP information not included in violation totals
SOURCE: H&R Inspection Activity Report dated 07/28/00
Public Food Service Establishment
17
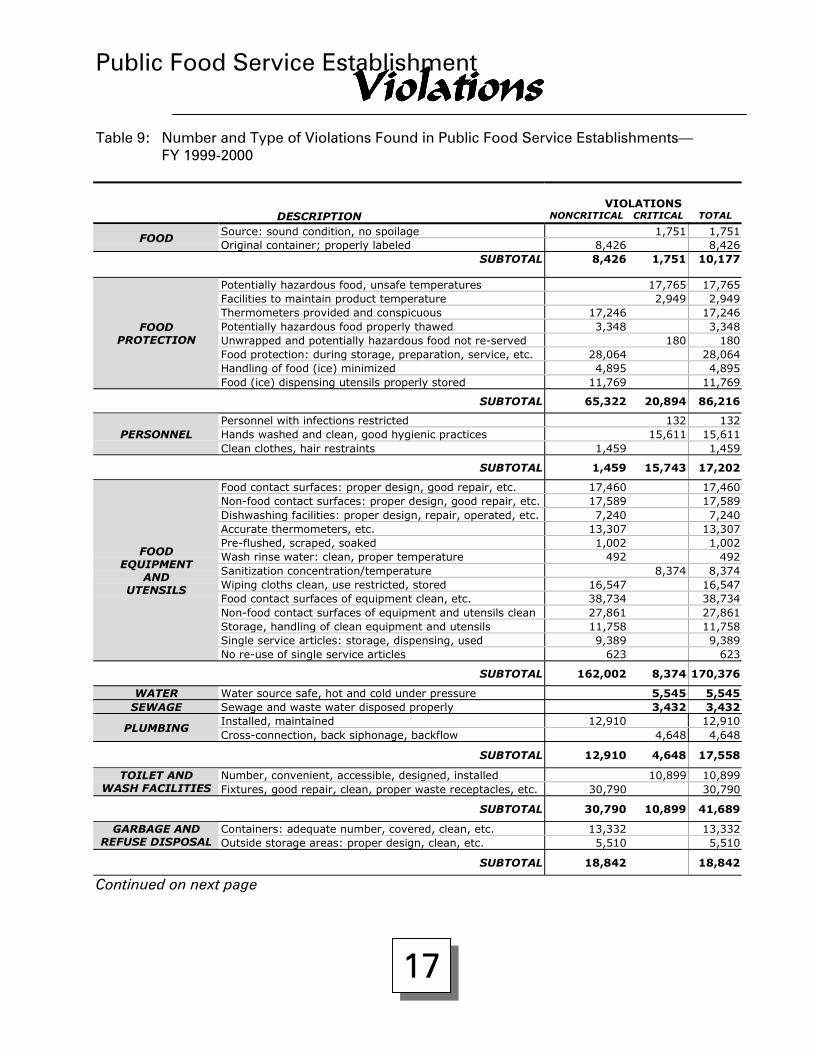
ViolationsViolationsViolationsViolationsTable 9: Number and Type of Violations Found in Public Food Service Establishments�
FY 1999-2000
VIOLATIONSDESCRIPTION NONCRITICAL CRITICAL TOTAL
Source: sound condition, no spoilage 1,751 1,751FOOD
Original container; properly labeled 8,426 8,426SUBTOTAL 8,426 1,751 10,177
Potentially hazardous food, unsafe temperatures 17,765 17,765Facilities to maintain product temperature 2,949 2,949Thermometers provided and conspicuous 17,246 17,246Potentially hazardous food properly thawed 3,348 3,348Unwrapped and potentially hazardous food not re-served 180 180Food protection: during storage, preparation, service, etc. 28,064 28,064Handling of food (ice) minimized 4,895 4,895
FOODPROTECTION
Food (ice) dispensing utensils properly stored 11,769 11,769
SUBTOTAL 65,322 20,894 86,216
Personnel with infections restricted 132 132Hands washed and clean, good hygienic practices 15,611 15,611PERSONNELClean clothes, hair restraints 1,459 1,459
SUBTOTAL 1,459 15,743 17,202
Food contact surfaces: proper design, good repair, etc. 17,460 17,460Non-food contact surfaces: proper design, good repair, etc. 17,589 17,589Dishwashing facilities: proper design, repair, operated, etc. 7,240 7,240Accurate thermometers, etc. 13,307 13,307Pre-flushed, scraped, soaked 1,002 1,002Wash rinse water: clean, proper temperature 492 492Sanitization concentration/temperature 8,374 8,374Wiping cloths clean, use restricted, stored 16,547 16,547Food contact surfaces of equipment clean, etc. 38,734 38,734Non-food contact surfaces of equipment and utensils clean 27,861 27,861Storage, handling of clean equipment and utensils 11,758 11,758Single service articles: storage, dispensing, used 9,389 9,389
FOODEQUIPMENT
ANDUTENSILS
No re-use of single service articles 623 623
SUBTOTAL 162,002 8,374 170,376
WATER Water source safe, hot and cold under pressure 5,545 5,545SEWAGE Sewage and waste water disposed properly 3,432 3,432
Installed, maintained 12,910 12,910PLUMBING
Cross-connection, back siphonage, backflow 4,648 4,648
SUBTOTAL 12,910 4,648 17,558
Number, convenient, accessible, designed, installed 10,899 10,899TOILET ANDWASH FACILITIES Fixtures, good repair, clean, proper waste receptacles, etc. 30,790 30,790
SUBTOTAL 30,790 10,899 41,689
Containers: adequate number, covered, clean, etc. 13,332 13,332GARBAGE ANDREFUSE DISPOSAL Outside storage areas: proper design, clean, etc. 5,510 5,510
SUBTOTAL 18,842 18,842
Continued on next page
Public Food Service Establishment
18
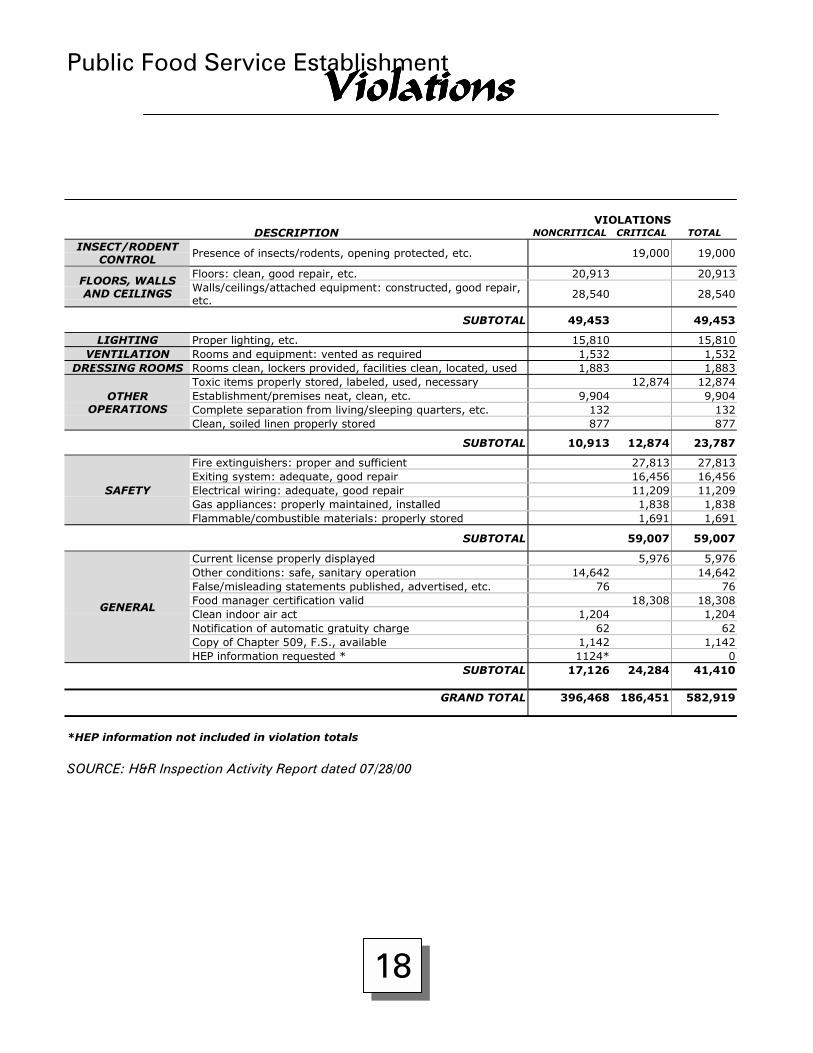
ViolationsViolationsViolationsViolations
VIOLATIONSDESCRIPTION NONCRITICAL CRITICAL TOTAL
INSECT/RODENTCONTROL
Presence of insects/rodents, opening protected, etc. 19,000 19,000
Floors: clean, good repair, etc. 20,913 20,913FLOORS, WALLSAND CEILINGS Walls/ceilings/attached equipment: constructed, good repair,
etc.28,540 28,540
SUBTOTAL 49,453 49,453
LIGHTING Proper lighting, etc. 15,810 15,810VENTILATION Rooms and equipment: vented as required 1,532 1,532
DRESSING ROOMS Rooms clean, lockers provided, facilities clean, located, used 1,883 1,883Toxic items properly stored, labeled, used, necessary 12,874 12,874Establishment/premises neat, clean, etc. 9,904 9,904Complete separation from living/sleeping quarters, etc. 132 132
OTHEROPERATIONS
Clean, soiled linen properly stored 877 877
SUBTOTAL 10,913 12,874 23,787
Fire extinguishers: proper and sufficient 27,813 27,813Exiting system: adequate, good repair 16,456 16,456Electrical wiring: adequate, good repair 11,209 11,209Gas appliances: properly maintained, installed 1,838 1,838
SAFETY
Flammable/combustible materials: properly stored 1,691 1,691
SUBTOTAL 59,007 59,007
Current license properly displayed 5,976 5,976Other conditions: safe, sanitary operation 14,642 14,642False/misleading statements published, advertised, etc. 76 76Food manager certification valid 18,308 18,308Clean indoor air act 1,204 1,204Notification of automatic gratuity charge 62 62Copy of Chapter 509, F.S., available 1,142 1,142
GENERAL
HEP information requested * 1124* 0SUBTOTAL 17,126 24,284 41,410
GRAND TOTAL 396,468 186,451 582,919
*HEP information not included in violation totals
SOURCE: H&R Inspection Activity Report dated 07/28/00
Public Food Service Establishment
19
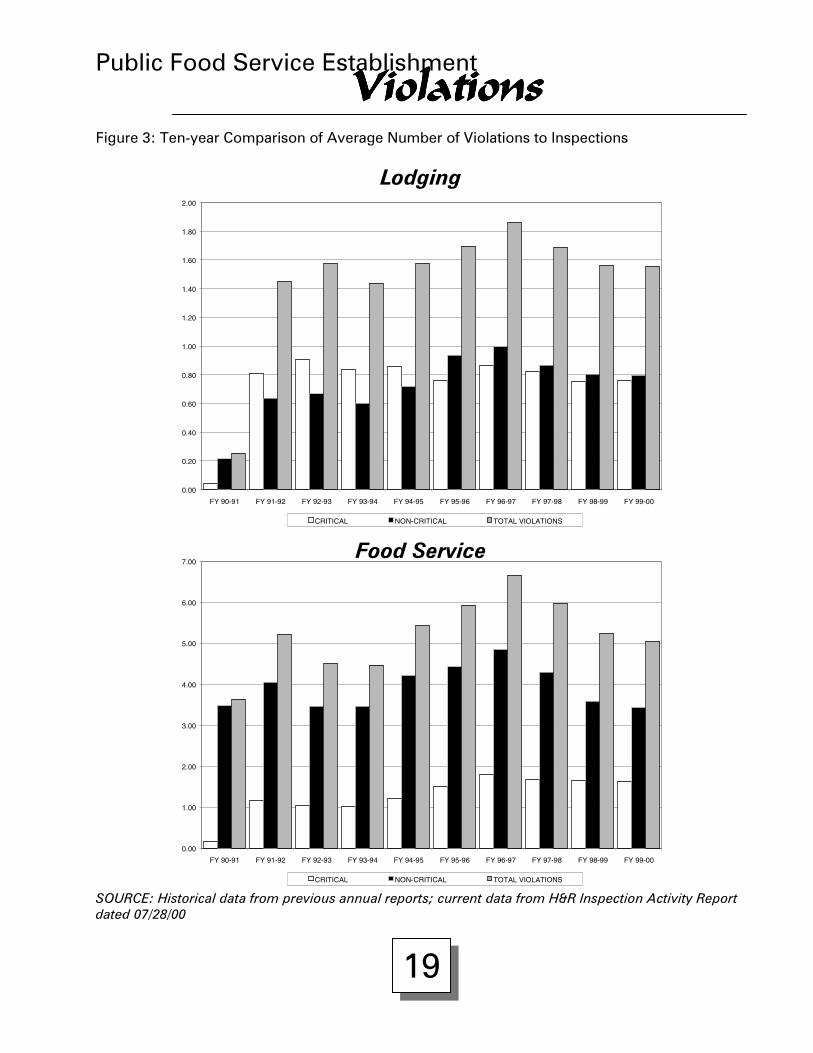
ViolationsViolationsViolationsViolationsFigure 3: Ten-year Comparison of Average Number of Violations to Inspections
Lodging
Food Service
SOURCE: Historical data from previous annual reports; current data from H&R Inspection Activity Reportdated 07/28/00
0.00
0.20
0.40
0.60
0.80
1.00
1.20
1.40
1.60
1.80
2.00
FY 90-91 FY 91-92 FY 92-93 FY 93-94 FY 94-95 FY 95-96 FY 96-97 FY 97-98 FY 98-99 FY 99-00
CRITICAL NON-CRITICAL TOTAL VIOLATIONS
0.00
1.00
2.00
3.00
4.00
5.00
6.00
7.00
FY 90-91 FY 91-92 FY 92-93 FY 93-94 FY 94-95 FY 95-96 FY 96-97 FY 97-98 FY 98-99 FY 99-00
CRITICAL NON-CRITICAL TOTAL VIOLATIONS
20
Elevator LicensingElevator LicensingElevator LicensingElevator LicensingFigure 4: Six-year Comparison of Number of New Elevator Installations
Figure 5: Ten-year Comparison of Number of Elevator Accounts
Figure 6: Sixteen-year Comparison of Number of Temporary Operating Permits Issued
SOURCE: Bureau of Elevator Safety
1,104
1,262
1,443
1,954
2,274
1,833
1,000
1,250
1,500
1,750
2,000
2,250
2,500
FY 94-95 FY 95-96 FY 96-97 FY 97-98 FY 98-99 FY 99-00
Nu
mb
er o
f N
ew In
stal
lati
on
s
31,47332,165
34,192
36,570
38,292
40,068
42,060
30,834
35,178
33,168
30,000
32,000
34,000
36,000
38,000
40,000
42,000
44,000
FY 90-91 FY 91-92 FY 92-93 FY 93-94 FY 94-95 FY 95-96 FY 96-97 FY 97-98 FY 98-99 FY 99-00
Nu
mb
er o
f L
icen
sed
Acc
ou
nts
291
428
551 573
781
1,062
950 915
354
490
200
300
400
500
600
700
800
900
1000
1100
1200
FY 90-91 FY 91-92 FY 92-93 FY 93-94 FY 94-95 FY 95-96 FY 96-97 FY 97-98 FY 98-99 FY 99-00
Nu
mb
er o
f T
emp
ora
ry O
per
atin
g P
erm
its
Issu
ed
21
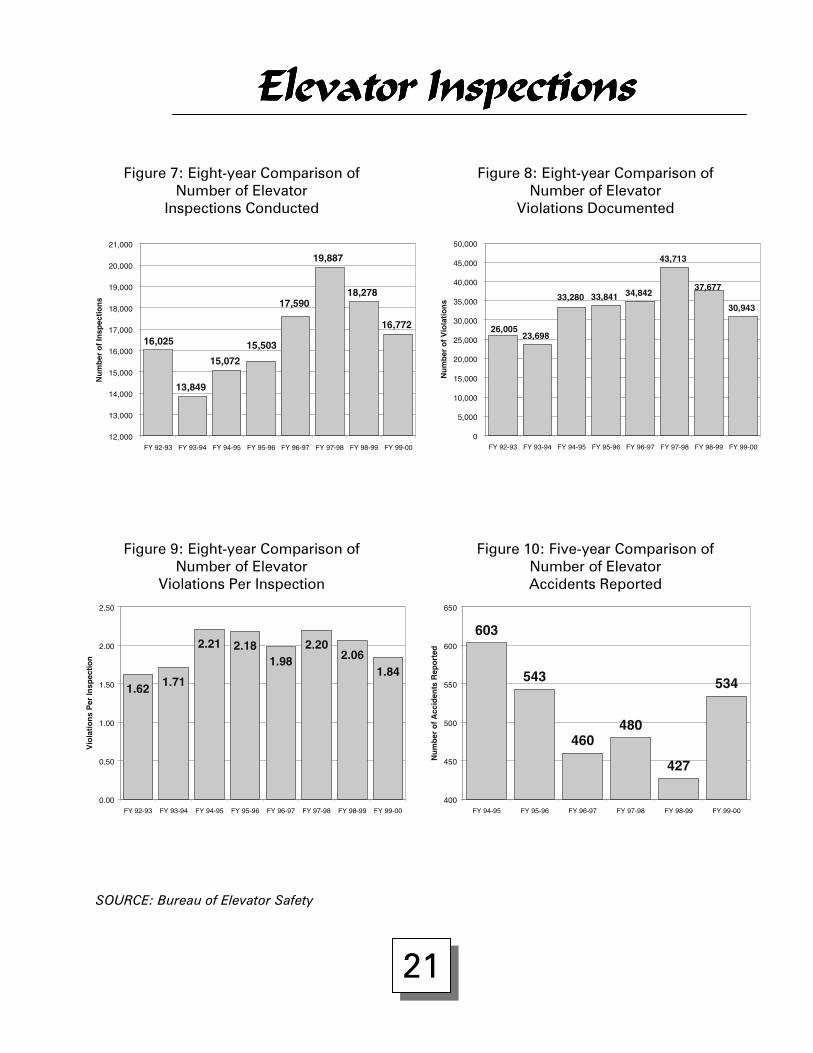
Elevator InspectionsElevator InspectionsElevator InspectionsElevator Inspections
Figure 7: Eight-year Comparison ofNumber of Elevator
Inspections Conducted
Figure 8: Eight-year Comparison ofNumber of Elevator
Violations Documented
Figure 9: Eight-year Comparison ofNumber of Elevator
Violations Per Inspection
Figure 10: Five-year Comparison ofNumber of ElevatorAccidents Reported
SOURCE: Bureau of Elevator Safety
13,849
15,072
19,887
18,278
16,772
17,590
15,50316,025
12,000
13,000
14,000
15,000
16,000
17,000
18,000
19,000
20,000
21,000
FY 92-93 FY 93-94 FY 94-95 FY 95-96 FY 96-97 FY 97-98 FY 98-99 FY 99-00
Nu
mb
er o
f In
spec
tio
ns
23,698
33,841 34,842
43,713
30,94333,280
37,677
26,005
0
5,000
10,000
15,000
20,000
25,000
30,000
35,000
40,000
45,000
50,000
FY 92-93 FY 93-94 FY 94-95 FY 95-96 FY 96-97 FY 97-98 FY 98-99 FY 99-00N
um
ber
of
Vio
lati
on
s
1.62 1.71
2.21 2.181.98
2.202.06
1.84
0.00
0.50
1.00
1.50
2.00
2.50
FY 92-93 FY 93-94 FY 94-95 FY 95-96 FY 96-97 FY 97-98 FY 98-99 FY 99-00
Vio
lati
on
s P
er In
spec
tio
n
603
543
460480
427
534
400
450
500
550
600
650
FY 94-95 FY 95-96 FY 96-97 FY 97-98 FY 98-99 FY 99-00
Nu
mb
er o
f A
ccid
ents
Rep
ort
ed
Hospitality Education Program (HEP)
22
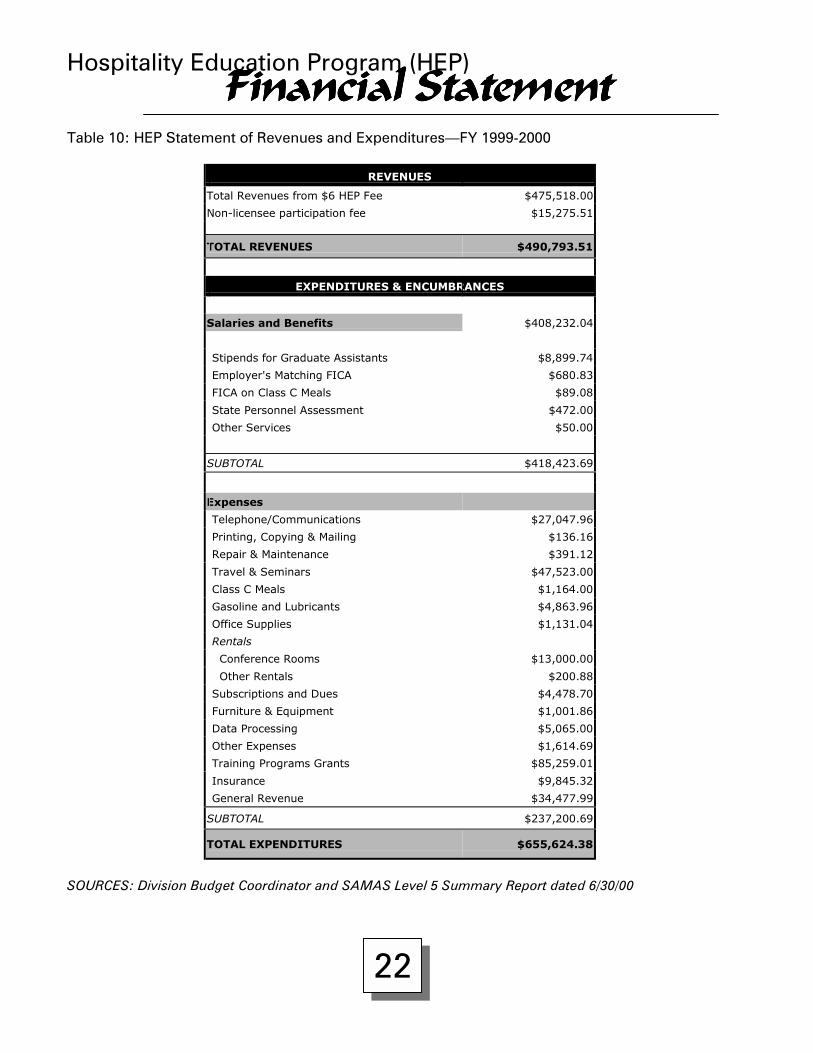
Financial StatementFinancial StatementFinancial StatementFinancial StatementTable 10: HEP Statement of Revenues and Expenditures�FY 1999-2000
REVENUES
Total Revenues from $6 HEP Fee $475,518.00
Non-licensee participation fee $15,275.51
TOTAL REVENUES $490,793.51
EXPENDITURES & ENCUMBRANCES
Salaries and Benefits $408,232.04
Stipends for Graduate Assistants $8,899.74
Employer's Matching FICA $680.83
FICA on Class C Meals $89.08
State Personnel Assessment $472.00
Other Services $50.00
SUBTOTAL $418,423.69
Expenses
Telephone/Communications $27,047.96
Printing, Copying & Mailing $136.16
Repair & Maintenance $391.12
Travel & Seminars $47,523.00
Class C Meals $1,164.00
Gasoline and Lubricants $4,863.96
Office Supplies $1,131.04
Rentals
Conference Rooms $13,000.00
Other Rentals $200.88
Subscriptions and Dues $4,478.70
Furniture & Equipment $1,001.86
Data Processing $5,065.00
Other Expenses $1,614.69
Training Programs Grants $85,259.01
Insurance $9,845.32
General Revenue $34,477.99
SUBTOTAL $237,200.69
TOTAL EXPENDITURES $655,624.38
SOURCES: Division Budget Coordinator and SAMAS Level 5 Summary Report dated 6/30/00
Hospitality Education Program (HEP)
23
ActivityActivityActivityActivityTable 11: Summary of HEP Activities�FY 1999-2000
WORKSHOPS ANDSEMINARS
EDUCATIONAL MATERIALS
MONTH NumberConducted
Number ofAttendees
Number ofRequests
Number ofItems
Dispersed*July 99 66 1,949 380 16,236
August 99 58 1,599 617 12,930September 99 41 1,042 34,551 102,461
October 99 58 2,256 732 37,918November 99 51 1,840 401 11,487December 99 45 1,410 348 13,967
January 00 56 1,143 414 51,274February 00 63 1,795 454 30,483
March 00 70 2,273 59,260 79,687April 00 63 1,836 340 18,974May 00 60 2,209 394 12,494June 00 48 1,825 2,880 81,271
TOTAL 679 21,177 100,771 469,182
*Includes number of workbooks distributed to attendees
Figure 11: Seven-year Comparison of Numberof HEP Workshops Conducted
Figure 12: Seven-year Comparison of Numberof HEP Workshop Attendees
190
305
403
491
598
680 679
0
100
200
300
400
500
600
700
Nu
mb
er
of
Wo
rksh
op
s C
on
du
cted
FY 93-94 FY 94-95 FY 95-96 FY 96-97 FY 97-98 FY 98-99 FY 99-00
4,406
8,714
11,755
15,518
22,386
20,992 21,177
0
5,000
10,000
15,000
20,000
25,000
Nu
mb
er
of
Wo
rksh
op
Att
en
dees
FY 93-94 FY 94-95 FY 95-96 FY 96-97 FY 97-98 FY 98-99 FY 99-00
Hospitality Education Program (HEP)
24
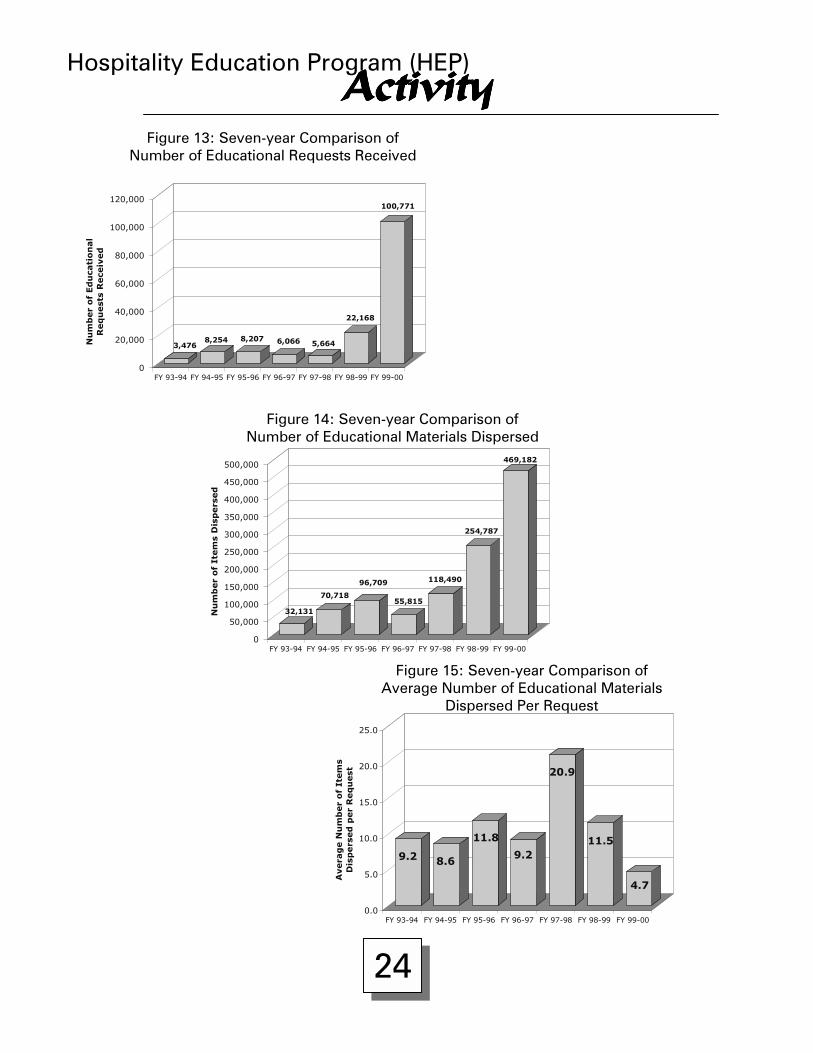
ActivityActivityActivityActivityFigure 13: Seven-year Comparison of
Number of Educational Requests Received
Figure 14: Seven-year Comparison ofNumber of Educational Materials Dispersed
Figure 15: Seven-year Comparison ofAverage Number of Educational Materials
Dispersed Per Request
3,4768,254 8,207 6,066 5,664
22,168
100,771
0
20,000
40,000
60,000
80,000
100,000
120,000
Nu
mb
er
of
Ed
uca
tio
nal
Req
uest
s R
ece
ived
FY 93-94 FY 94-95 FY 95-96 FY 96-97 FY 97-98 FY 98-99 FY 99-00
32,131
70,718
96,709
55,815
118,490
254,787
469,182
0
50,000
100,000
150,000
200,000
250,000
300,000
350,000
400,000
450,000
500,000
Nu
mb
er
of
Item
s D
isp
ers
ed
FY 93-94 FY 94-95 FY 95-96 FY 96-97 FY 97-98 FY 98-99 FY 99-00
9.2 8.6
11.8
9.2
20.9
11.5
4.7
0.0
5.0
10.0
15.0
20.0
25.0
Avera
ge N
um
ber
of
Item
s D
isp
ers
ed
per
Req
uest
FY 93-94 FY 94-95 FY 95-96 FY 96-97 FY 97-98 FY 98-99 FY 99-00