Embed Size (px)
Citation preview

World Business Council for Sustainable Development
eco-efficiencymeasuring
a guide to reporting company performance
Hendrik A. Verfaillie, Monsanto Company
Robin Bidwell, Environmental Resources Management plc
DEDICATED TO MAKING A DIFFERENCE

foreword We believe this report will help companies around the world
measure their progress toward sustainable development. It is the
product of a two-year project to develop a framework for assessing
and reporting eco-efficiency which can be used across all industries.
The concept of eco-efficiency was introduced by the WBCSD in 1992
and has been widely adopted. Many businesses in all continents
have been pursuing ways of reducing their impact on the
environment while continuing to grow and develop. But different
companies have interpreted and measured it in different ways. Our
task has been to find a common approach which will make it easier
for companies to measure their performance and for stakeholders to
assess the progress they are making.
We have done this by talking to many people, both inside and
outside companies, who are responsible for or interested in
corporate eco-efficiency. Most importantly, we have tested the
framework with 22 companies from more than 10 industrial sectors
and 15 countries.
That rigorous testing has shown that the approach, principles,
definitions and the indicators explained here can be implemented
by all companies. We have not attempted to define a rigid
straitjacket and believe we have left room for the flexibility which is
required by the natural diversity of business activity. But the year-
long pilot testing has shown that the indicators presented here can
be used right across the business world, while we also provide
guidance on other measures which will help to flesh out an
individual company’s eco-efficiency profile.
We would like to thank the many people who have contributed
to this work, especially the managers in the pilot companies who
have done the hard work of putting these ideas into practice on
the ground.
We urge companies to adopt this framework as a way of measuring
and reporting their progress and contributing to a more sustainable
society. We believe it will help to forge the link between
environmental and economic performance which is essential for
sustainable development.
Hendrik A. VerfaillieMonsanto Company
Robin BidwellEnvironmental Resources Management plc
June 2000

setting the scene
executive summaryExample eco-efficiency profile
CHAPTER 1
setting the sceneThe rationale for measuring progress through eco-efficiency
Framework • Eco-efficiency in the context of sustainability • Definitions •
The need for indicators • Measuring eco-efficiency
CHAPTER 2
the core elements of the approachBased on sound principles and practical concepts
Principles
Concepts
Generally applicable and business specific indicators • Guidance on selecting
business specific indicators • The set of generally applicable indicators
CHAPTER 3
gathering informationUsing the right indicators
Developing indicators • Generally applicable value indicators • Generally applicable
environmental influence indicators • Potential generally applicable indicators •
Business specific indicators
Table of indicators
CHAPTER 4
measurement and reporting in practiceKey lessons from the pilot program
Measurement issues
Selection of boundaries • Data availability • Sensitivity and error • Transformation
and conversion • Aggregation • Interpretation and benchmarking
Reporting issues
Understanding the needs of users • Meeting audience needs • Scope and limitations
The eco-efficiency profile
The elements of a company’s eco-efficiency profile • Reporting trends over time
appendices List of categories, aspects and examples of indicators • Examples of business-
specific indicators • List of pilot companies • Working group member companies
and organizations
about the WBCSD
contents2
6
10
16
22
31
36
table of

executive summary
2
THE MEASUREMENT FRAMEWORK
The concept of eco-efficiency was
developed by the WBCSD in 1992 and
has become widely recognized by the
business world. It brings together the
essential ingredients – economic and
environmental progress – which are
necessary for economic prosperity to
increase with more efficient use of
resources and lower emissions.
Approaches to implementing the
concept and measuring performance
have varied widely, however. This
report sets out a framework which can
be used by any business to measure
progress toward economic and
environmental sustainability.
The framework is flexible enough to be
widely used and easily interpreted
across the business spectrum,
recognizing the diversity of businesses.
But it provides a common set of
definitions, principles and indicators.
A small number of indicators have been
identified as being valid for virtually all
businesses. These are called “generally
applicable”. They are widely relevant
and subject to a common measurement
approach. Other indicators need to be
used by individual companies to fit their
particular context – these are termed
“business specific”. The framework
defines the generally applicable
indicators and provides guidelines for
companies to select their own business
specific indicators. It also offers
guidance on implementation and
communication. The indicators have
been rigorously tested in a year-long
pilot program involving 22 companies
from more than 10 different industry
sectors. This test process has shown
that the framework is appropriate for
all companies and has helped to
refine the approach to ensure the
recommendations can be implemented
on the ground.
THE INDICATORS
The indicators are based on 8 principles
which ensure they are scientifically
supportable, environmentally relevant,
accurate and useful for all kinds of
businesses around the globe. The

3
executive summary
ultimate aim is to improve the
performance of businesses and monitor
performance with measures which
are transparent and verifiable, and
therefore meaningful to business
managers as well as to external
stakeholders. While the emphasis is on
areas under direct management control,
we also recognize there are relevant
issues upstream (e.g. with suppliers)
and downstream (e.g. in product use)
of a company’s activities.
Generally applicable indicators can
be used by virtually all businesses. As
well as being more or less universally
relevant, each of these indicators relates
to a global environmental concern or
business value and methods for
measurement are established and
definitions accepted globally.
All other indicators which do not meet
these criteria have been termed
business specific, meaning that they
are more likely to be individually
defined from one business or one sector
to another. These indicators are not
necessarily less important than the first
group. That judgment will depend on
the nature of an individual business.
They are merely less widely applicable.
A company’s eco-efficiency
performance profile will include
both types of indicators.
The indicators fall into two groups,
based on the eco-efficiency formula
which brings together the two eco
dimensions of economy and ecology to
relate product or service value to
environmental influence. Eco-efficiency
is represented by:
Environmental influence includes
aspects of product or service creation
and aspects of product or service
consumption or use.
The generally applicable indicators for
product/service value are:
Quantity of goods or services
produced or provided to customers
Net sales
Those relating to the environmental
influence in product/service
creation are:
Energy consumption
Materials consumption
Water consumption
Greenhouse gas emissions
Ozone depleting substance
emissions
While the environmental influence of
products or services in use is important
we have not identified any generally
applicable indicators for this category of
eco-efficiency. All indicators in this
group are considered to be business or
product specific.
The following additional indicators
could become generally applicable if
current efforts to develop global
agreement on measurement methods
are successful:
Additional financial value indicators
Acidification emissions to air
Total waste
We believe the small number of
generally applicable indicators is helpful
Product or service value
Environmental influence
in assessing companies’ eco-efficiency
because a proliferation of measures
would make it difficult for reports to be
clear and understandable, especially
externally. A small core of common
indicators will help learning and
comparability across time, sectors and
industries. At the same time, individual
companies should develop a fuller
description of their performance by
adding business specific indicators.
PREPARING AND REPORTING
INFORMATION
The pilot program identified several
important practical issues for preparing
a company’s eco-efficiency profile and
reporting internally and to external
stakeholders. The report provides
advice on selecting boundaries for the
data, where to find data and how to
compile it appropriately, taking
account of sensitivity and error and
problems of transformation and
conversion. It is important that
companies provide some perspective
on issues such as the scope and
limitations of their indicators, so that
users understand the nature of the
information provided.
The questions of aggregation and
benchmarking are particularly
important. While aggregation will often
be desirable, it may obscure potentially
important information about an
enterprise’s eco-efficiency performance.
For example, different types of
unrelated emissions, or emissions across
different geographic locations, may be
added together, preventing a valid
assessment of potential influences on
the environment. Similarly, eco-
efficiency estimates from different
products, processes, or geographic areas
may be combined and averaged,
obscuring details about the performance
of individual units. Aggregation must

4
therefore be done with care, and
transparently so that the limitations of
the information can be properly
understood. This is especially the case
when data are reported publicly and
comparisons between different
companies, processes, or products
are made.
Outside users of eco-efficiency
information are likely to want to make
comparisons between companies and
over time but it is important to
recognize the inherent diversity of
business and the particular
circumstances of individual companies.
Comparisons should be made only
when the companies being compared
provide the same product/service. It is
also important to recognize that the
product portfolios of different
businesses often change, and that this
may affect eco-efficiency figures
regardless of a firm’s environmental
efforts. The impact of such changes
should be explained by companies in
reporting eco-efficiency data, to allow
users to interpret reports accurately.
The corollary of this is that companies
can use eco-efficiency information to
develop their product mix and activity
toward a more eco-efficient portfolio.
Trend data is important so that changes
in performance over time or compared
to a reference point can be assessed.
Data can be presented as absolute
figures, eco-efficiency ratios, indexed to
a selected year, or expressed relative to
a projected goal. The performance
could also be expressed relative to an
industry average, if that is available. If
indices are used, however, the absolute
numbers underlying them should also
be published so that users can calculate
their own ratios. It is crucial that data
presented in such charts is truly
comparable so that the trends depicted
accurately represent eco-efficiency
performance.
We propose the following five
elements for a summary eco-
efficiency profile, plus a verification
statement if the report has been
externally reviewed:
Organization Profile – to provide
a context for the eco-efficiency
information, including the number
of employees, business segments,
primary products and major
changes in the structure of
the company.
Value Profile – indicators from the
“value” portion of the WBCSD
framework, including financial
information, the quantity of
products, or functional indicators
for specific products.
Environmental Profile – including
generally applicable environmental
influence indicators as well as
business specific indicators relating
to product/service creation and use.
Eco-efficiency Ratios – in addition
to providing in the previous two
elements the basic “numerator” and
“denominator” data for estimating
eco-efficiency, companies may also
wish to provide calculations of eco-
efficiency indicators that they
consider most relevant and
meaningful for their business.
Methodological Information –
covering the approach used to
select indicators, data collection
methodologies, and any limitations
on use of the data.
WBCSD recommends that companies
integrate eco-efficiency information into
their overall decision making and
communications processes. Internally, it
should be part of routine management
systems. Externally, eco-efficiency
indicators could be provided in
corporate environment or sustainability
reports as one of the integrating
element between the three pillars of
sustainability, and could be included in
existing financial reports as an extension
to pure financial reporting.
Following is an exemple eco-
efficiency profile of a virtual company to
illustrate the approach. An information
platform displaying corporate and site
eco-efficiency profiles of pilot companies
is accessible through WBCSD’s website
at: www.wbcsd.org.

5
executive summary
0
100
200
300
400
500
600
TARGET9998969492902002
Net Sales in mil USD
134
540
470
391
323
236
190
0
10
20
30
40
50
60
TARGET9998969492902002
Energy Consumption in terajoules
20
5150
44
40
32
24
0
2
4
6
8
TARGET9998969492902002
GHG Emissionsin kilotons CO2 equivalent
5.0
5.8
7.07.5
8.1
7.2
6.3
5555
434347474848
0
20
40
60
80
100
029999989690
Mass of Product per GreenhouseGas Emissions(in kg per ton CO2 equivalent)
3636
4646
reference 1990
1996
1998
target 1999
1999
target 200227
93
6766
52
40
0
20
40
60
80
100
029999989690
Net Sales perGreenhouse Gas Emissions(in 1000 USD per ton CO2 equivalent)
27
93
6766
52
40
Example eco-efficiency profile
The following is an illustrative “straw model” of how a companymight apply the WBCSD framework. It illustrates the conceptsset out in chapter 2 of this report and focuses particularly on thegenerally applicable indicators described in chapter 3.
Value ProfileMass of product sold = 300,000 kg
Net sales = 470 million USD
Value added = 220 million USD
Gross margin = 45 million USD
EBIT = 45 million USD
The eco-efficiency profiles of several pilot companies areposted on the WBCSD website (www.wbcsd.org). These realprofiles exemplify how companies chose to publish their eco-efficiency profiles as part of the pilot.
Environmental ProfileEnergy consumed = 50,000 gigajoules
Material consumed = 4,500 tons
Water consumed = 60,000 m3
GHG emissions = 7,000 tons CO2 equiv.
ODS emissions = 25 tons CFC11 equiv.
Electricity consumed = 35,300 gigajoules
GHG from upstream
electricity gen. = 4,600 tons CO2 equiv.
Natural gas consumed = 11,500 gigajoules
Acidification emissions = 400 tons SO2 equiv.
VOC emissions = 230 tons
COD effluents = 86 tons
Total waste = 1,450 tons
Waste to landfill = 650 tons
Organization ProfileCompany name: Exemplis Inc.
Business segments: Pharmaceuticals (list of primary products)
Report for: Fiscal Year 1999
System boundaries: includes all consolidated units of Exemplis Inc.,
excludes joint ventures and minority activities
Number of employees: 2,500
Internet: Website, hyperlink to web-based sustainability report
Contact for additional information: Name, telephone, e-mail address
Methodological InformationISO 14,031 was used to identify relevant aspects of our business
activity and to select respective meaningful indicators.
Our data collection and use methodologies are available for review.
Eco-efficiency RatiosMass of product sold per :
Energy consumption = 6.0 kg per gigajoule
Material consumption = 66.7 kg per ton
GHG emissions = 42.9 kg per ton CO2 equiv.
Net sales per :
Energy consumption = 9,400 USD per gigajoule
Material consumption = 104,000 USD per ton
GHG emissions = 67,100 USD per ton CO2 equiv.

setting the scene
The purpose of this report is to encourage the use of the eco-efficiency concept
by proposing a common measurement framework that can guide all companies
regardless of their business or geographic base. It is intended to enable
company managers and external stakeholders to use eco-efficiency indicators as
a means of making and measuring progress toward economic and
environmental sustainability.
The objective is not to develop one single approach to measuring and reporting
eco-efficiency, nor to develop a single measure of performance. Rather it is to
establish a general framework that is flexible enough to be widely used, broadly
accepted and easily interpreted by the full range of businesses. This is based on
a recognition that the specifics of defining, measuring, and communicating
eco-efficiency will necessarily vary from one business to another.
This framework has been tested in a pilot program involving 22 companies
worldwide from more than 10 industry sectors over a period of 12 months.
Results from the pilot are summarized in the last chapter of this report.
6
chapter 1
The rationale for measuring progress
through eco-efficiency

7
FRAMEWORK
The report describes a flexible
framework for identifying and
measuring eco-efficiency indicators
and reporting eco-efficiency
performance. It consists of:
a limited set of generally applicable
indicators, which WBCSD believes
are valid for virtually all businesses
guidelines for the selection of
business specific indicators relevant
at company or sector level
guidance for implementation
recommendations for how to
communicate eco-efficiency
information to internal and
external audiences
“ The eco-efficiency indicators framework
is easy to understand and its use and
application make good business sense
to us. Keeping the framework flexible
and avoiding a rigid reporting format
wherever possible are key points for its
acceptance and practicability.”
EXPERIENCE SHARING MEETING IN TOKYO,
SEPTEMBER 28, 1999
businesses to improve eco-efficiency
performance is the promise of achieving
greater value with lower adverse
environmental consequences.
While eco-efficiency is a helpful tool
for businesses and a valuable policy
concept for governments driving toward
sustainability, it must be acknowledged
that other steps are also necessary to
achieve this long-term goal, which
embraces economic, environmental
and social aims.
Business exists to satisfy human needs
and to be rewarded with profits for
doing so. Responsible businesses also
aim to improve the quality of life as
part of a drive to become more
sustainable. But this process within
business alone is unlikely to prevent the
growth of total resource use and
environmental impact for the entire
economy. Sustainability will only be
achieved by business working together
with governments and external
stakeholders such as suppliers,
customers and NGOs. For example it is
important for governments to formulate
economic and industrial policies which
encourage eco-efficiency in business as
well as reduce energy and resource use
throughout the economy.
ECO-EFFICIENCY IN THE CONTEXT
OF SUSTAINABILITY
WBCSD defines eco-efficiency as follows:
“Eco-efficiency is achieved by the
delivery of competitively-priced goods
and services that satisfy human needs
and bring quality of life, while
progressively reducing ecological
impacts and resource intensity
throughout the life-cycle to a level at
least in line with the earth’s estimated
carrying capacity.”
Eco-efficiency is a key concept which
can help companies, individuals,
governments or other organizations
become more sustainable. It brings
together the essential ingredients –
economic and ecological progress –
which are necessary for economic
prosperity to increase with more
efficient use of resources and lower
emissions of substances that can have
adverse environmental consequences.
The concept calls for business to achieve
more value from lower inputs of
materials and energy and with reduced
emissions. Companies need to apply
creativity and innovation. For example,
new technologies, improved supply
chain practices and better products can
all boost eco-efficiency. The incentive for
setting the scene
seven elements for eco-efficiency improvement
Eco-efficiency calls for business to achieve
more value from lower inputs of
materials and energy and with reduced
emissions. It applies throughout a
business, to marketing and product
development just as much as to
manufacturing or distribution. The range
of possibilities outlined here
demonstrates the pervasive nature of
eco-efficiency:
1 Reduced material intensity
2 Reduced energy intensity
3 Reduced dispersion oftoxic substances
4 Enhanced recyclability
5 Maximized use of renewables
6 Extended product life
7 Increased service intensity

8
chapter 1
DEFINITIONS
WBCSD proposes a framework
containing three levels of organization
for eco-efficiency information:
categories, aspects and indicators. This
is consistent with the terminology used
in the ISO 14000 series, and in the
Global Reporting Initiative (GRI).
Categories are broad areas of
environmental influence or business
value. Each has a number of aspects,
which are general types of information
related to a specific category. Aspects
describe what is to be measured.
Indicators are the specific measures of
an individual aspect that can be used to
track and demonstrate performance.
A given aspect may have several
indicators as demonstrated in detail
in chapter 3.
A full list of categories, aspects and
indicators is shown in appendix 1.
The 3 categories identified in this
report for eco-efficiency, and their
main related aspects are:
Product/service value
volume / mass
monetary
function
Environmental influence in
product/service creation
energy consumption
materials consumption
natural resources
consumption
non-product output
unintended events
Environmental influence in
product /service use
product/service
characteristics
packaging waste
energy consumption
emissions during
use/disposal
MEASURING ECO-EFFICIENCY
Eco-efficiency brings together the two
eco dimensions of economy and ecology
to relate product or service value to
environmental influence. It can be
represented as:
Progress in eco-efficiency can be
achieved by providing more value per
unit of environmental influence or unit
of resource consumed.
There are numerous ways in which eco-
efficiency can be calculated using this
basic equation. Both product or service
value and environmental influence
include many different indicators which
cannot be merged into one single
number. Companies will need to choose
eco-efficiency ratios that best serve their
process for communication and decision
making. Specific calculations will
depend upon the needs of individual
decision makers. For example, a plant
manager may wish to focus on the
number of products shipped per
kilojoule of energy consumed during
manufacturing. A financial analyst may
instead focus on the economic value of
products sold per kilojoule.
Value and environmental influence can
also be measured for different entities,
such as production lines, manufacturing
sites, or entire corporations, as well as
for single products, market segments or
entire economies. In the same way, eco-
efficiency ratios can be calculated and
Product or service value
Environmental influence
audiences, including investors, insurers,
consumers, and other interest groups.
THE NEED FOR INDICATORS
Setting targets and monitoring
performance with indicators are accepted
management tools used throughout
business. This includes environmental
management and measurement of eco-
efficiency, and is necessary to measure
corporate progress toward a more
sustainable future.
Companies may choose to measure
their eco-efficiency performance for a
number of reasons. These include
tracking and documenting performance
and progress, identification and
prioritization of opportunities for
improvement, and identifying cost
savings and other benefits related to
improving eco-efficiency. It may even be
that a company wants to demonstrate
why in certain areas improvement is
limited or will not be possible to the
degree expected by certain stakeholders.
Eco-efficiency indicators may also help
managers take decisions on a product
or business portfolio. They can provide
managers with the information on how
to make a business portfolio more eco-
efficient or more sustainable overall.
Monitoring and reporting eco-efficiency
publicly is also a way to communicate a
key element of the corporation’s progress
on sustainable development to external

9
setting the scene
used for many of these entities. The
same indicator may not be suitable for
each one. For example, an eco-
efficiency indicator for the manufacture
of detergent could be kilogram
produced per kilojoule of energy
consumed during manufacturing.
Alternatively, the product manager
could calculate an indicator on the basis
of economic value (e.g. USD detergent
sales) per kilojoule of manufacturing
energy consumed, or on a function
delivered basis (e.g. average laundry
cycles per kilojoule of manufacturing
energy consumed).
Indicators may also be useful in helping
customers understand the
environmental performance of products.
Eco-efficiency ratios for single products
or market segments can help express
product performance in ways which are
more meaningful to their users. Many
businesses already use eco-efficiency
ratios to express a product’s functional
use related to its impact. For example,
the fuel efficiency of a car expressed
in kilometers per liter of fuel used
(or miles per gallon) is a well known
eco-efficiency ratio.
Many companies and users so far have
tracked environmental influence per unit
of value – the inverse of the formula set
out here. Such calculation results in
impact intensity ratios, where a
declining intensity ratio reflects a
positive performance improvement.
WBCSD recommends the use of eco-
efficiency ratios (value per
environmental influence) since in this
form an increasing efficiency ratio
reflects a positive performance
improvement. This parallels the way
business tracks financial performance.
Increasing key financial indicators, e.g.
sales, profit, return on capital employed,
reflect positive financial performance.
Intensity ratios could be provided if a
business and stakeholders agreed that
these ratios are important business
specific indicators for that business.
The substantial information contained
in both, efficiency and intensity ratios,
is the same.
other indicator initiatives
Throughout this project, the WBCSD
working group has maintained
connections to other key initiatives in the
area of indicators and reporting both for
corporate performance (micro level) and
for the performance of the entire
economy (macro level).
The most relevant initiatives and
programs have been:
the International Standards
Organization’s International Standard
on Environmental Performance
Evaluation (ISO 14031). In fact, ISO
14031 is recommended in the framework
to be used as the primary approach for
selecting sector or company specific
environmental influence indicators.
the Coalition for Environmentally
Responsible Economies (CERES) with
the Global Reporting Initiative (GRI).
GRI focuses on developing a common
harmonized format for corporate
sustainability reporting. The fact that the
GRI reporting guidelines and the WBCSD
framework were developed in the same
period and partly with the support of
the same companies, led to a high level
of fruitful interaction, cross-fertilization
and adaptation.
the Canadian National Round Table
on the Environment and the Economy
(NRTEE). NRTEE has conducted pilot
studies on how to measure eco-efficiency
in business, especially with respect to the
use of energy and materials. The findings
of the NRTEE pilot studies have been
taken into consideration in developing
the WBCSD framework.
OECD, UNCSD, and the European
Environment Agency (EEA). These
organizations are working on indicators
to describe the performance of national
or regional economies with regard to
sustainability and/or eco-efficiency.
WBCSD has worked with these groups
to provide a linkage between the
micro- and macro-level aspects of eco-
efficiency indicators.

core elementsof the approach
the
Indicators of any kind should be based on a set of principles which
define how they will be selected and used. This will help ensure
that measurement programs are scientifically supportable, relevant,
accurate and useful.
Performance measurement and reporting must be practical and
straightforward for the whole business community to follow. This
is why our concept calls for two types of indicators – generally
applicable and business specific. This approach allows companies
to keep their measurement system focused on the relevant issues,
as well as provide information in a form which is commonly
understood and broadly accepted.
10
chapter 2
Based on sound principles and
practical concepts

The WBCSD recommends that the
following eight principles be adopted
for indicators in any field, including eco-
efficiency. WBCSD believes that these
principles are applicable to all elements
of measuring the performance of a
company, and could apply to other
areas of sustainability such as social
impact. Indicators should:
1 be relevant and meaningful
with respect to protecting the
environment and human health
and/or improving the quality
of life
The primary goal of the eco-efficiency
concept is to improve the
environmental performance of a
company relative to the value of the
products and services it provides to
society. In order to ensure that
companies and stakeholders focus their
attention on high priority areas, all
indicators should be clearly related to
issues for which there is a clear need to
improve an organization’s
environmental performance, or that
improve the value of the product to
users and society.
2 inform decision making to
improve the performance of
the organization
Ultimately, the purpose of eco-efficiency
indicators is to help facilitate decisions
about a company’s performance. The
primary value is to help management
make decisions about how production
processes and product designs can be
most effectively modified to reduce
resource use or environmental
burdens; or how the performance of a
product can be improved in ways that
improve its eco-efficiency. Eco-efficiency
indicators may also be used by
external audiences. For example,
stakeholders such as financial
institutions may be able to use eco-
efficiency indicators to inform decision
making about the economic risks
associated with a company’s
environmental performance.
3 recognize the inherent diversity
of business
One of the key challenges of developing
indicators is that every business is
different. For instance, the factors most
relevant to the environmental
performance of a chemical company are
different to those of an automobile
manufacturer. While it is tempting to
presume that there could be a
“universal” set of indicators that would
apply to all businesses, in practice the
environmental aspects and values of a
company’s activities and products
depend heavily on the specific nature of
its business.
4 support benchmarking and
monitoring over time
Improving the eco-efficiency of a
company’s activities or products requires
the use of indicators that can be
consistently followed over time, and
confidently related to both past and
current performance. To maximize the
value of benchmarking and monitoring,
indicators must be designed to
minimize the influence of extraneous
factors that are not related to either
environmental performance or product
value. Otherwise users could observe
“false” changes in eco-efficiency.
Indicators must also be based on robust
and reproducible measurement systems
that stand the test of time, and care
11
the core elements of the approach
Principles
Indicators should:
1 be relevant and meaningful
with respect to protecting the
environment and human health
and/or improving the quality
of life
2 inform decision making to
improve the performance of
the organization
3 recognize the inherent diversity
of business
4 support benchmarking and
monitoring over time
5 be clearly defined, measurable,
transparent and verifiable
6 be understandable and
meaningful to identified
stakeholders
7 be based on an overall evaluation
of a company’s operations, products
and services, especially focusing on
all those areas that are of direct
management control
8 recognize relevant and
meaningful issues related to
upstream (e.g. suppliers) and
downstream (e.g. product use)
aspects of a company’s activities

12
chapter 2
must be taken in the aggregation of
data across different processes or
products to ensure that the resulting
information is meaningful.
Benchmarking is primarily about
learning, and not about ranking. Where
benchmarking or monitoring
performance over time is carried out, it
is important that the indicators from
different processes, products, or
businesses are defined in the same way,
so that “apple-to-apple” comparisons
are made rather than putting apples
and pears in the same basket.
5 be clearly defined, measurable,
transparent and verifiable
In order to genuinely inform decision
making, indicators should be clearly
defined and directly measurable, or
calculated by clearly defined estimation
methodologies. The definition, means
and boundaries of measurement
should be available to decision makers,
and the process of data collection
(including issues related to variability
and quality control procedures) should
be subject to verification either
internally or externally.
6 be understandable and
meaningful to identified
stakeholders
To facilitate decision making it is
important that indicators be clearly
understandable to both company
managers and external stakeholders.
Indicators should not be so complex
that they are difficult to use effectively.
The aggregation of data across different
processes or products should be
carefully considered so that individual
indicators and their limitations are
clearly understood.
7 be based on an overall evaluation
of a company’s operations, products
and services, especially focusing on
all those areas that are of direct
management control
In defining indicators that are
appropriate for its business, and that
meet the needs of users both inside
and outside the company, an
organization should examine all of
the relevant areas of its operations,
products or services. As a minimum,
this evaluation should focus on those
areas that a business can control or
influence directly (often referred to as
“gate-to-gate”). This would include, for
example, the selection of raw materials,
the use of natural resources, the
organization’s manufacturing
operations, the characteristics of its
products, the distribution of those
products to markets.
8 recognize relevant and
meaningful issues related to
upstream (e.g. suppliers) and
downstream (e.g. product use)
aspects of a company’s activities
In addition to those areas that are
directly influenced or controlled
by a company, there may be other
areas that are equally relevant
(environmentally, economically or
socially). These could include, for
example, the eco-efficiency of the
production of raw materials by key
suppliers (“cradle-to-gate” issues), or
issues associated with the use and
disposal of products by users (“gate-to-
grave” issues). In general, these areas
should be differentiated from indicators
that are directly controllable by a
company, because the control that an
organization has over such activities is
often limited.
“We believe that the quality of
decision-making increases with the
level of detail and diversity of
indicators used. It is also helpful to
be aware of common global concerns.
The WBCSD model provides very
useful information for companies
to develop their own indicators.”
“The concept can increase the quality of
decision-making dramatically, not only
with regards to where to invest but also
with regards to how much.”
“The approach adds a new perspective
on usual indicators and drives the
organization to review the soundness
of existing indicators. Due to the fact
that eco-efficiency indicators and
trends can be used to validate business
decisions, we are better able to set
objectives and make internal and
external benchmarks.”
EVALUATION OF THE CONCEPT BY PILOT
COMPANIES, MARCH 2000
13
the core elements of the approach
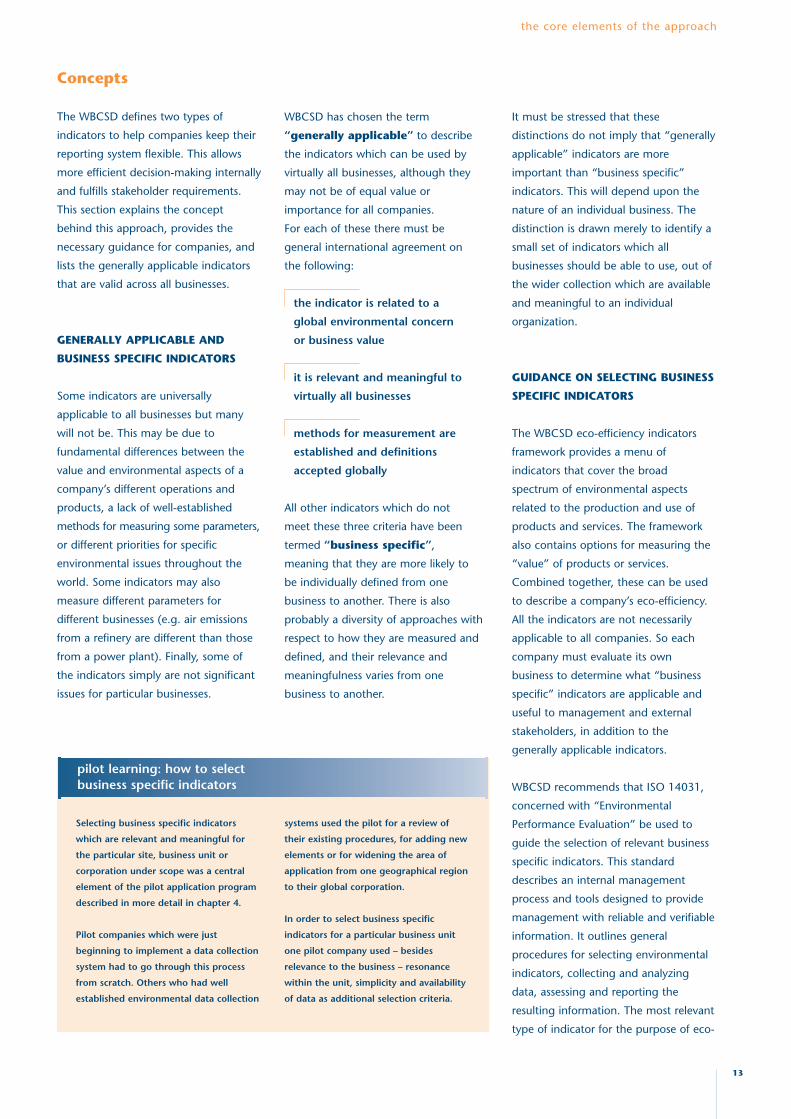
pilot learning: how to selectbusiness specific indicators
Selecting business specific indicators
which are relevant and meaningful for
the particular site, business unit or
corporation under scope was a central
element of the pilot application program
described in more detail in chapter 4.
Pilot companies which were just
beginning to implement a data collection
system had to go through this process
from scratch. Others who had well
established environmental data collection
systems used the pilot for a review of
their existing procedures, for adding new
elements or for widening the area of
application from one geographical region
to their global corporation.
In order to select business specific
indicators for a particular business unit
one pilot company used – besides
relevance to the business – resonance
within the unit, simplicity and availability
of data as additional selection criteria.
Concepts
The WBCSD defines two types of
indicators to help companies keep their
reporting system flexible. This allows
more efficient decision-making internally
and fulfills stakeholder requirements.
This section explains the concept
behind this approach, provides the
necessary guidance for companies, and
lists the generally applicable indicators
that are valid across all businesses.
GENERALLY APPLICABLE AND
BUSINESS SPECIFIC INDICATORS
Some indicators are universally
applicable to all businesses but many
will not be. This may be due to
fundamental differences between the
value and environmental aspects of a
company’s different operations and
products, a lack of well-established
methods for measuring some parameters,
or different priorities for specific
environmental issues throughout the
world. Some indicators may also
measure different parameters for
different businesses (e.g. air emissions
from a refinery are different than those
from a power plant). Finally, some of
the indicators simply are not significant
issues for particular businesses.
WBCSD has chosen the term
“generally applicable” to describe
the indicators which can be used by
virtually all businesses, although they
may not be of equal value or
importance for all companies.
For each of these there must be
general international agreement on
the following:
the indicator is related to a
global environmental concern
or business value
it is relevant and meaningful to
virtually all businesses
methods for measurement are
established and definitions
accepted globally
All other indicators which do not
meet these three criteria have been
termed “business specific”,
meaning that they are more likely to
be individually defined from one
business to another. There is also
probably a diversity of approaches with
respect to how they are measured and
defined, and their relevance and
meaningfulness varies from one
business to another.
It must be stressed that these
distinctions do not imply that “generally
applicable” indicators are more
important than “business specific”
indicators. This will depend upon the
nature of an individual business. The
distinction is drawn merely to identify a
small set of indicators which all
businesses should be able to use, out of
the wider collection which are available
and meaningful to an individual
organization.
GUIDANCE ON SELECTING BUSINESS
SPECIFIC INDICATORS
The WBCSD eco-efficiency indicators
framework provides a menu of
indicators that cover the broad
spectrum of environmental aspects
related to the production and use of
products and services. The framework
also contains options for measuring the
“value” of products or services.
Combined together, these can be used
to describe a company’s eco-efficiency.
All the indicators are not necessarily
applicable to all companies. So each
company must evaluate its own
business to determine what “business
specific” indicators are applicable and
useful to management and external
stakeholders, in addition to the
generally applicable indicators.
WBCSD recommends that ISO 14031,
concerned with “Environmental
Performance Evaluation” be used to
guide the selection of relevant business
specific indicators. This standard
describes an internal management
process and tools designed to provide
management with reliable and verifiable
information. It outlines general
procedures for selecting environmental
indicators, collecting and analyzing
data, assessing and reporting the
resulting information. The most relevant
type of indicator for the purpose of eco-
14
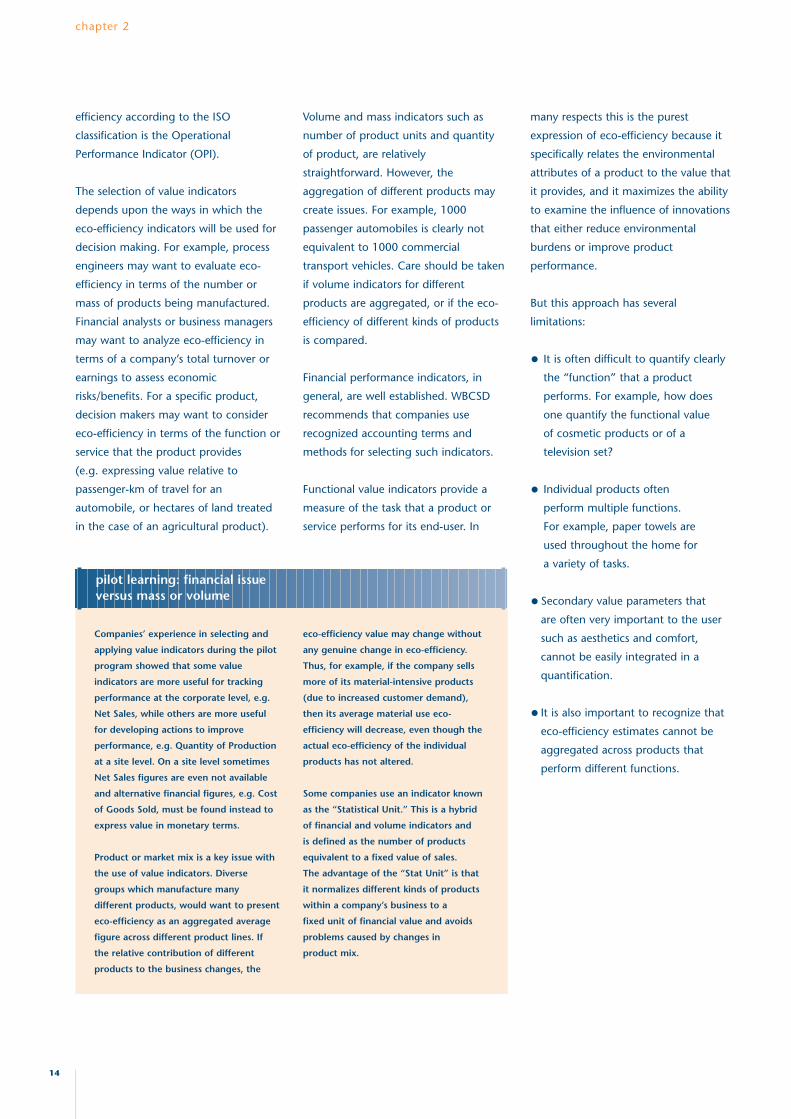
efficiency according to the ISO
classification is the Operational
Performance Indicator (OPI).
The selection of value indicators
depends upon the ways in which the
eco-efficiency indicators will be used for
decision making. For example, process
engineers may want to evaluate eco-
efficiency in terms of the number or
mass of products being manufactured.
Financial analysts or business managers
may want to analyze eco-efficiency in
terms of a company’s total turnover or
earnings to assess economic
risks/benefits. For a specific product,
decision makers may want to consider
eco-efficiency in terms of the function or
service that the product provides
(e.g. expressing value relative to
passenger-km of travel for an
automobile, or hectares of land treated
in the case of an agricultural product).
chapter 2
pilot learning: financial issueversus mass or volume
Companies’ experience in selecting and
applying value indicators during the pilot
program showed that some value
indicators are more useful for tracking
performance at the corporate level, e.g.
Net Sales, while others are more useful
for developing actions to improve
performance, e.g. Quantity of Production
at a site level. On a site level sometimes
Net Sales figures are even not available
and alternative financial figures, e.g. Cost
of Goods Sold, must be found instead to
express value in monetary terms.
Product or market mix is a key issue with
the use of value indicators. Diverse
groups which manufacture many
different products, would want to present
eco-efficiency as an aggregated average
figure across different product lines. If
the relative contribution of different
products to the business changes, the
eco-efficiency value may change without
any genuine change in eco-efficiency.
Thus, for example, if the company sells
more of its material-intensive products
(due to increased customer demand),
then its average material use eco-
efficiency will decrease, even though the
actual eco-efficiency of the individual
products has not altered.
Some companies use an indicator known
as the “Statistical Unit.” This is a hybrid
of financial and volume indicators and
is defined as the number of products
equivalent to a fixed value of sales.
The advantage of the “Stat Unit” is that
it normalizes different kinds of products
within a company’s business to a
fixed unit of financial value and avoids
problems caused by changes in
product mix.
Volume and mass indicators such as
number of product units and quantity
of product, are relatively
straightforward. However, the
aggregation of different products may
create issues. For example, 1000
passenger automobiles is clearly not
equivalent to 1000 commercial
transport vehicles. Care should be taken
if volume indicators for different
products are aggregated, or if the eco-
efficiency of different kinds of products
is compared.
Financial performance indicators, in
general, are well established. WBCSD
recommends that companies use
recognized accounting terms and
methods for selecting such indicators.
Functional value indicators provide a
measure of the task that a product or
service performs for its end-user. In
many respects this is the purest
expression of eco-efficiency because it
specifically relates the environmental
attributes of a product to the value that
it provides, and it maximizes the ability
to examine the influence of innovations
that either reduce environmental
burdens or improve product
performance.
But this approach has several
limitations:
• It is often difficult to quantify clearly
the “function” that a product
performs. For example, how does
one quantify the functional value
of cosmetic products or of a
television set?
• Individual products often
perform multiple functions.
For example, paper towels are
used throughout the home for
a variety of tasks.
• Secondary value parameters that
are often very important to the user
such as aesthetics and comfort,
cannot be easily integrated in a
quantification.
• It is also important to recognize that
eco-efficiency estimates cannot be
aggregated across products that
perform different functions.

15
the core elements of the approach
THE SET OF GENERALLY
APPLICABLE INDICATORS
WBCSD has worked in the course of the
creation of this concept and during the
pilot exercise to come up with a set of
generally applicable indicators that can
be used by all businesses and provides a
globally accepted description and
measurement method for them. This
will help for a common understanding.
The following indicators meet the three
criteria for general applicability and
should therefore be used by all
companies. More detailed descriptions
of these generally applicable indicators
are given in chapter 3.
Product/service value
Quantity of goods/services
produced or provided
to customers
Net sales
Environmental influence in
product/service creation
Energy consumption
Materials consumption
Water consumption
Greenhouse gas (GHG)
emissions
Ozone depleting substance
(ODS) emissions
There are no generally applicable
indicators for the environmental
influence of product/service use.
All indicators in this group are
considered to be business specific.
The following additional indicators
could become generally applicable if
current efforts to develop global
agreement on measurement methods
are successful:
Additional financial
value indicators
Acidification emissions
to air
Total waste
WBCSD recommends that all companies
collect and report data on the generally
applicable indicators. But these
indicators alone will not necessarily
represent the eco-efficiency
performance of a company. They will
normally be combined with appropriate
business specific indicators and
meaningful eco-efficiency ratios to
provide a company’s eco-efficiency
performance profile.
pilot learning: comparisons usinggenerally applicable indicators
Comparisons between companies are
more likely to be valid for generally
applicable than for business specific
indicators. However, especially when
stakeholders try to compare the
performance of companies, it is
important to recognize business’
inherent diversity, and understand
that comparisons are primarily for
learning to understand differences
and trends and to identify potential
for improvements.
Comparison are only meaningful when a
company’s individual circumstances can
be taken into consideration. Comparison
between different indicators should
normally be done only between like
products, services, or operations.
Differences observed should be discussed
and explained. When data are
aggregated across different operations,
geographies, or products/services, it
becomes more difficult to make
meaningful comparisons, even for
generally applicable indicators.

informationgathering
Only a small number of indicators fit the three criteria necessary for them to
be generally applicable to all companies: concerned with a global business
value or environmental issue, relevant to virtually all businesses and having
an agreed measurement method and definition. While there are many issues
and associated indicators, most fail to meet at least one of these three criteria.
This is actually helpful in assessing companies’ eco-efficiency, especially in
external reporting, because a proliferation of measures would make it difficult
for reports to be clear and understandable. A small core of common
indicators, on the other hand, will help learning and comparability across
time, sectors and industries. At the same time, individual companies will
develop a fuller description of their performance by adding a number of
business specific indicators.
This chapter describes the generally applicable indicators, with explanations
of what should be included and excluded. The table details all the indicators
identified, with measurement references and the sources of data which
companies could use to gather the information.
16
chapter 3
Using the right indicators

DEVELOPING INDICATORS
The purpose of developing indicators
and encouraging companies to collect
and publish the information is to
improve eco-efficiency. Yet, companies
should beware of producing excessive
information. While in theory each value
indicator could be used in combination
with each indicator of environmental
influence to produce an extensive list of
eco-efficiency ratios, it is not necessary
or desirable to use all possible
combinations. Only the most
meaningful combinations should be
used, with the aim of concentrating on
measuring performance in the most
relevant way and providing the most
useful information for decision-making.
“We should follow the rule of ‘collect less
and use it’, meaning that any data
collected must be used for something.
That’s the best way for companies to
help drive performance improvements.”
EXPERIENCE EXCHANGE MEETING IN
CINCINNATI, JULY 27/28, 1999
The same applies to data collection,
which can exclude minor quantities of
data as long as the remaining figures
cover at least 90% of the total and
provide sufficient understanding for
good decision-making. This 90% rule is
intended to avoid disproportionate
effort and cost being expended in
gathering data on the final few
percentage points of usage. It should
not be used to exclude even small
quantities of especially significant
material or other sources of
environmental influence.
So far as product/service creation is
concerned the definition of generally
applicable indicators includes only those
aspects under the direct control of the
company. Influences outside a notional
“fence” beyond the direct control, up-
stream or down-stream in the value
chain (i.e. controlled by suppliers or
customers, such as emissions emerging
from electricity generation by power
utilities) need to be covered with
business specific indicators if these
aspects are relevant for a certain
business. The fence should not be seen
as a physical representation, however.
Thus distribution businesses should
account for their operations beyond
physical corporate boundaries, just as
airlines should include flight operations.
GENERALLY APPLICABLE VALUE
INDICATORS
Quantity of product/service1
produced or sold is a physical
measure or count of product or service
produced, delivered or sold to
customers. It is most useful in product
specific situations such as individual
factories or service units. It can be
measured in mass, volume or number.
In most cases this information can be
obtained from existing and readily
available internal reports. Summing
numbers for different products for an
entire corporation should be done
carefully, recognizing the limitations of
the aggregated information. Corporate
level information may be useful for
tracking overall performance but
product specific information is more
useful to develop action plans to
improve performance.
Net sales is the total recorded sales less
sales discounts and sales returns and
allowances. It is the most easily
measurable and available value indicator
for all businesses. Using sales as a value
indicator for measuring factory
performance is more problematic since
production units are not generally linked
to sales figures. It must also be
recognized that sales values can be
influenced by a variety of factors which
do not bear on eco-efficiency, such as
commodity prices and currency
exchange rates, which could distort
performance figures.
17
1 For simplicity in the rest of this chapter, output isdescribed only as “product”. The term should be takento mean either product or service, as appropriate tothe business concerned.
pilot learning: the mining industry
Mining is a “price-taker” rather than
a “price-maker” since most of its
products are traded on central
commodity exchanges. Revenue
streams may fluctuate from one year
to the next without any underlying
changes in operating processes
taking place. Using “Net sales” as
a value indicator for eco-efficiency
performance tracking for the
mining industry has therefore
limited meaning.
In the mining sector the
environmental influence caused by
extraction operations is primarily
driven by the amount of material
handled. “Total material moved” or
“Tons of ore milled” might therefore
be more useful business specific value
indicators to relate to environmental
influence indicators to track eco-
efficiency performance of the
extraction operations.
Since “Total material moved” and
“Tons of ore milled” seem to work as
value indicators for both, mining
extraction operations, and
aggregating different mining
products, the “Quantity of goods
produced” does not. Aggregating
quantities of different mining
products is not practical, since
amounts of some products are
measured in carats and ounces, while
others are measured in kilotons.
gathering information

18
chapter 3
GENERALLY APPLICABLE
ENVIRONMENTAL INFLUENCE
INDICATORS
Energy consumption is a global issue
and relevant to all businesses across
sectors. The total energy consumed
equals energy purchased or obtained
(e.g. coal, natural gas) minus energy
sold to others for their use (e.g.
electricity, steam). The definition agreed
for general applicability relates solely to
energy consumed and transformed on
site, which means that electricity
companies would report the purchased
energy amount and subtract energy
sold, keeping generation and transfer
losses as part of their consumption.
Companies could further elaborate on
energy use by identifying separately the
renewable energy consumption and a
breakdown into different types of
energy sources such as natural gas, oil
and others.
Water consumption is the sum of all
fresh water purchased from a water
supplier or obtained from surface or
ground water sources. Availability of
fresh water is a global issue. Even
though for many areas there may be no
local concern about availability, it is
increasingly costly to generate clean
water. “Fresh water” includes water
used for cooling purposes even if there
is no physical contact to process
materials, and excludes sea water.
Material consumption is the sum of
weight of all materials purchased or
obtained from other sources such as
extraction, including raw materials for
conversion, other process materials
(such as catalysts, solvents), and pre- or
semi-manufactured goods, parts and
modules (such as automobile parts,
computer parts). Dematerialization is a
global requirement for sustainability,
which makes materials use an issue of
global concern and relevance to virtually
all businesses. Material included in this
indicator excludes water and fuels,
which are identified as separate
generally applicable indicators.
Packaging materials are also excluded
from this item. Packaging is clearly
important, especially in consumer
industries. But packaging fails the
generally applicable criteria of being
meaningful to virtually all businesses
and there is no agreement on
measurement methodology. This issue
should be dealt with as a business
specific indicator for product use.
This item, representing the weight of
all materials used, provides a useful
denominator for material efficiency
ratios. Companies might also expand
measurement to identify specific
material categories such as replaceable
(e.g. natural crops, wood from managed
forests), non-renewable, hazardous,
non-hazardous materials categories.
Greenhouse gas (GHG) emissions
include carbon dioxide (CO2), methane
(CH4), nitrous oxide (N20), hydro- and
perfluorocarbons (HFCs, PFCs) and
sulfur hexafluoride (SF6) emissions from
fuel combustion, process reactions and
treatment processes. The climate
change issue related to increasing
concentrations of greenhouse gases is a
global concern and – because it is
closely linked to emissions from energy
sources – is relevant across businesses.
The definition of the GHG emissions
covers the gases detailed in annex A of
the Kyoto Protocol and their relative
contributions are commonly accepted as
detailed in the work of the
Intergovernmental Panel on
Climate Change.
The concept of the “boundary fence” is
very important for this indicator. This
generally applicable indicator covers
only emissions from direct corporate
activities, although companies may
choose to track significant GHG
emissions from suppliers such as
electricity providers and also from
product use where they feel they are
relevant. WBCSD participates in a joint
effort together with World Resources
Institute (WRI) and other organizations
to develop a broadly accepted protocol
to measure and report greenhouse gas
emissions (www.ghgprotocol.org). This
protocol will provide further detail on
comprehensive GHG reporting.
Ozone depleting substance (ODS)
emissions are a global concern,
defined in the Montreal Protocol which
lists the groups of gases that are
contributing to the effect and describes
their impact potential. This issue has
relevance across business, even though
the markets of the most dangerous
gases have been strongly reduced and
less harmful alternatives introduced.
Even though the effect will be visible in
the stratospheric ozone layer over many
decades or even centuries, the indicator
might lose its relevance in the near
future, when policies to eliminate
ODS from applications continue to
be implemented successfully on a
global scale.

19
gathering information
POTENTIAL GENERALLY
APPLICABLE INDICATORS
The small number of generally
applicable indicators could eventually
be expanded by the addition of others
which currently do not quite meet the
three criteria.
The following three items are clearly
important for eco-efficiency but there is
currently no consensus for measuring
them. This may change in the near
future, in which case they could
become generally applicable indicators.
When using these indicators it is
important that reporters specify the
definition which they apply.
Additional financial value
indicators: We were striving to find
additional financial value indicators
(other than Net Sales), such as
indicators for profitability or value
added. Profitability being the measure
of the overall financial performance of a
business entity, is obviously a relevant
and important value indicator for
business around the world. As virtually
all companies measure it, it might
appear peculiar that we have not
categorized it as a generally applicable
indicator. However, profitability is a very
broad term and can mean different
things to different companies. Thus,
when using profitability information, it
is important to specify which definition
is used, e.g. the US generally accepted
accounting principles (GAAP) for profit,
earnings or income.
There are still wide differences in the
meaning and measurement for financial
measures such as “Earnings before
interest and tax” (EBIT), Gross Margin
or Value Added. We list these under
business specific indicators. Businesses
which wish to relate environmental
influence to such measures should
again specify the definition they are
using.
Acidification emissions to air
include acid gases and mists (e.g.
ammonia, hydrochloric acid, hydrogen
fluoride acid, nitrogen oxides, sulfur
dioxide and sulfuric acid) from fuel
combustion, process reactions and
treatment processes. Measurement
methods and effect definitions are as yet
not globally agreed, although many
European companies have used factors
which have been developed for the
relative strength of various acids to the
effect of acidification. This indicator
could become generally applicable if a
global agreement on measurement
methods can be reached.
Total waste is the total amount of
substances or objects destined for
disposal. Waste is certainly an issue of
growing global concern. However the
term is used very differently by different
industries and in different countries,
even though there exists a global
convention ratified by many countries
that includes a definition. Total waste
could become a generally applicable
indicator if agreement can be reached
on a definition and measurement
method, possibly based on the Basel
Convention approach. Until then
companies will need to specify the
definition and measurement method
used to track and report their waste
amounts. In any case companies are
likely to include business specific
indicators to cover different types of
non-product output, identifying the
type of waste (e.g. hazardous/non-
hazardous) or its final destination
(e.g. landfill, recycling or incineration).
BUSINESS SPECIFIC INDICATORS
Some examples of business specific
indicators are included in Appendix 2 to
help companies to identify their relevant
indicators and to provide guidance
based on the experience gained during
the pilot exercise. The descriptions,
measurement methods and data
sources are taken from information
provided by pilot companies. Many
of these indicators are used in these
companies in examples which can be
seen on the WBCSD website at
www.wbcsd.org.
pilot learning: waste is a tricky issue
The working group as well as pilot
companies discussed at length how to use
and describe waste indicators for total
amounts and for particular types of
wastes, relative to their composition or
their final way of disposal.
Discussions centered on the problem of a
commonly accepted definition for waste.
Some participants recommended as
generally applicable simply-defined
indicators for “Total Waste” (e.g.
following the Basel Convention), or “Total
Non-Product Output”, including effluents
to water and emissions to air. Particular
waste types such as “Waste to Landfill” or
“Waste to Incineration” would be left as
business specific indicators. For such
types of wastes participants did not see
commonly accepted definitions to emerge.
Reduction of waste has been a focus for
many companies for some time.
These sometimes prefer to work with
waste or non-product output (NPO)
instead of total materials consumption
because purchased amounts are only
available in monetary terms, while waste
or NPO are traditionally tracked in tons.
One company has set a long-term goal
to reduce total NPO, including anything
that does not go into products (waste,
air emissions and water emissions),
because it leads to maximum eco-
efficiency. For paper as an illustrative
example, of an original value of e.g.
1000 USD/ton, recycling allows for a benefit
of e.g. 100 USD/ton while 900 USD/ton
are lost, but could be saved by reducing
total NPO.

20
chapter 3
Table of indicators
QuantityPhysical measure or count of productor services produced, delivered or soldto customers
as appropriate for the particular business,such as number or mass
Company specific method used tomeasure the quantity, e.g. mass ornumber of product or serviceproduced or sold
Cost, production, or salesreportsAnnual financial reports
Net SalesTotal recorded sales less sales discountsand sales returns and allowances
in USD, Euro, Yen, or company’s usual currency
International Accounting StandardsCommittee (IASC), Generally AcceptedAccounting Principles (GAAP)
Annual financial reports
GENERALLY APPLICABLE VALUE INDICATORS
INDICATOR UNIT MEASUREMENT METHOD POTENTIAL DATA SOURCE
Energy ConsumptionTotal sum of energy consumed (equals energy purchases minus energysold to others for their use), including:
• electricity and district heat
• fossil fuels (e.g. natural gas, oil, coal)
• other fuel based energy (e.g. biomass, wood, waste fuel)
• non-fuel based energy (e.g. solar, wind)
in gigajoules (or other appropriatemultiplier of joule)
Transformation factors:
• fuel high (gross) heating value (HHV) based on combustion products (physicalstates) of water (liquid), carbon dioxide (gaseous) andnitrogen (gaseous).
• electricity and district heat asamount end energy purchased
Procurement filesSite energy/fuel useinventoriesFacility management reportsLiterature
Material ConsumptionSum of weight of all materialspurchased or obtained from othersources, including:
• raw materials for conversion
• other process materials (such ascatalysts, solvents)
• pre- or semi-manufactured goodsand parts
excluding packaging, waterconsumption and materials used for energy purposes
in metric tons Company specific method used tomeasure quantity used
Procurement filesManufacturing reports Cost reports
Water ConsumptionSum of all fresh water purchased frompublic supply, or obtained from surfaceor ground water sources (includingwater for cooling purposes)
in cubic meters Company specific method Procurement filesManufacturing reports Cost reports
GENERALLY APPLICABLE ENVIRONMENTAL INFLUENCE INDICATORS
INDICATOR UNIT MEASUREMENT METHOD POTENTIAL DATA SOURCE
Ozone Depleting Substance (ODS)EmissionsAmount of ODS emissions to air fromprocesses and losses/replacement fromcontainments (chillers)
in metric tons ofCFC11 equivalents
List of controlled ODS and OzoneDepletion Potentials:Montreal Protocol, Annex A to E
Plant surveys EHS reports Estimation or calculation

Note: Businesses and their stakeholders may find it useful to provide additional information for some generally applicable indicators (e.g. EnergyConsumption indicator for total energy consumption and energy consumption by specific sources such as electricity, fuel-based, and non-fuelbased consumption; Greenhouse Gas Emissions in total CO2 equivalents and specific CO2, CH4, N2O, HFCs, PFCs and SF6 emissions).
21
gathering information
Net Profit/Earnings/Incomein USD, Euro, Yen orcompany’s usual reporting currency
Net sales minus all expenses for the period including: cost of goods sold; selling,general and administrative expenses; technology expenses; R&D costs; amortization and adjustment of intangible assets; restructuring and special charges; interest expenses; other expenses; income taxInternational Accounting StandardsCommittee (IASC)Generally Accepted Accounting Principles (GAAP)
Financial reports
POTENTIAL GENERALLY APPLICABLE INDICATORS
In this table we list indicators that might soon become generally applicable indicators if current efforts to develop common global agreement onmeasurement methods are successful.
INDICATOR UNIT POTENTIAL MEASUREMENT METHOD POTENTIAL DATA SOURCE
Acidification Emissions to AirAmount of acid gases and acid mistsemitted to air (including NH3, HCl, HF,NO2, SO2 and sulfuric acid mists) from fuel combustion, processreactions and treatment processes
in metric tons of SO2
equivalents- List of acids:
ICI: Environmental BurdenThe ICI Approach, 1997
- Acidification Potentials:Heijungs et al., CML University ofLeiden, 1992; and Hauschild andWenzel, Chapman & Hall, London, 1997
Plant surveys EHS reports Estimation or calculation
Total Waste Total amount of substances or objectsdestined for disposal
in metric tons Definitions of waste and disposal: Basel Convention, 1992: Definitionsand Annex IV
Plant surveys EHS reports Estimation or calculation
ENVIRONMENTAL INFLUENCE INDICATORS
VALUE INDICATORS
INDICATOR UNIT POTENTIAL MEASUREMENT METHOD POTENTIAL DATA SOURCE
Greenhouse Gas (GHG) Emissions Amount of GHG emissions to air from fuel combustion, process reactionsand treatment processes, includingCO2, CH4, N20, HFCs, PFCs and SF6
(excluding GHG emissions released ingeneration of purchased electricity)
in metric tons of CO2
equivalents- List of greenhouse gases:
Kyoto Protocol, Annex A- Global Warming Potentials:
IPCC, Climate Change 1995, SecondAssessment Report
- Transformation factors for fuels: fromfuel carbon content e.g. ResponsibleCare: Health Safety andEnvironmental Reporting Guidelines,CEFIC November 1998, page 31f.
GHG emissions from process reactionsand treatment processes arecalculated/estimated using specificknowledge of processes, wastecomposition and treatment efficiency.
Cost reports Fuel invoicesPlant survey EHS records Estimation or calculation
INDICATOR UNIT MEASUREMENT METHOD POTENTIAL DATA SOURCE

measurementand reporting in practice
A wide-ranging pilot program among 22 WBCSD member
companies has tested the framework and recommendations
which are contained in this report. Pilot results showed that
the concept is valid for all company types and sizes and
that the generally applicable indicators are appropriate across
a wide range of sectors and across geography.
This chapter presents the lessons learned from the pilot
program in the form of guidance on measurement and reporting.
It also offers a proposal on how a company could present
its performance in the form of an eco-efficiency profile.
A comprehensive information platform displaying corporate
eco-efficiency profiles is accessible through WBCSD’s website
at: www.wbcsd.org.
22
chapter 4
Key lessons from the pilot program

23
“We expect that this pilot will allow us
to develop clear criteria and comprise
a transparent process to assess
whether an indicator is relevant
and meaningful. We also see in it an
opportunity to set the right goals.”
PILOT KICK-OFF MEETING IN ST. LOUIS,
APRIL 26/27, 1999
“We involved in the pilot activity not
only business decision makers, but
also marketing, financial, product
development and production people.
We found this very important for
the success of our efforts.”
EXPERIENCE SHARING MEETING IN
MONTERREY, MEXICO, OCTOBER 26/27, 1999
Measurement issues
It is clear that gathering and presenting
eco-efficiency data is currently not as
straightforward as with financial
information, where there are well-
established methodologies and the
unifying force of monetary value. In
contrast, environmental performance
spans a complex mix of parameters which
relate to different impacts and for which
measurement methodologies are often
very new or still not widely agreed.
This has a number of important
practical implications for preparing
an eco-efficiency profile of a company
or operation.
SELECTION OF BOUNDARIES
Defining the boundaries of an eco-
efficiency analysis is a key challenge for
any organization. Principles 7 and 8
relate to this issue. They suggest that
the priority should be areas that are
under direct control by the company,
but that relevant and meaningful
upstream and downstream issues
should also be addressed even though
they are not directly controllable.
Even within a company’s operations,
there are numerous boundaries that
must be defined for the selection and
use of indicators. For example, within a
given process, there may be multiple
inputs of energy and multiple outputs
of emissions from various sub-processes.
How one selects which sub-processes
to include, and how to allocate
measurements across different sub-
processes can have a great influence on
a specific indicator. These issues have
been the focus of Life Cycle Assessment
methodologies for a number of years,
and it is recommended that the
ISO 14040 series of international
standards be consulted for guidance.
Boundaries should be selected based
on the information needs of users
(e.g. management, outside
stakeholders). The entity to which the
information refers to should be specified
in an eco-efficiency or sustainability
report.
measurement and reporting in practice
pilot learning: system boundaries forgenerally applicable indicators
Pilot companies found that the concept
of the “boundary fence” is important for
the definition of generally applicable
indicators. This is seen clearly in the
different approaches e.g. to GHG
emissions and electricity use.
Upstream GHG emissions are measured,
tracked and reported by the supplier
company. For example, emissions released
by the supplier of purchased electricity
will be reported by the supplying utility
and shall not be included in a company’s
own measurement again. The generally
applicable indicator description for GHG
emissions covers therefore only emissions
from direct corporate activities.
On the other hand, purchased electricity
is part of the total energy consumption
of an entity. Therefore it is included in
the energy consumption indicator and
eco-efficiency profile of this entity.
Following indicator principle 8,
companies may nevertheless wish to
track significant impacts from upstream
and downstream, such as impacts
from purchased electricity generation
and product use. They can track these
as business specific indicators where
they identify them as relevant for
their business.

24
chapter 4
DATA AVAILABILITY
Tracking eco-efficiency performance
should wherever possible be based on
information that is already available in
the business or can be acquired at a
reasonable cost relative to its value for
users. Some information must be
estimated because it is not practical to
obtain actual measurements (e.g. GHG
emissions associated with purchased
electricity). But most of the information
needed to develop the recommended
indicators for product/service value and
creation (except the function delivered
aspect) can generally be obtained from
the following mainstream business
information sources:
production reports
cost reports
annual financial reports
material safety data sheets
environmental reports (internal
management and external regulatory)
Despite this availability it may not
be easy to compile the information
needed to track eco-efficiency
performance. Most mainstream
business systems are not set up to
generate this kind of information for
the enterprise as a whole. The
information is typically tracked and
managed at a facility, process or
sub-process level.
In some cases data may not be
disaggregated sufficiently to identify the
numbers needed for indicators with
specific products or processes. For
example, shared resources are not
always allocated by process or end-
product, especially at integrated,
multi-product facilities. Also, recycled
or reused materials may not easily be
allocated back to a specific process.
Nor can their “historic” environmental
burdens be easily quantified.
In the absence of the kind of well-
developed codification available for
financial information, companies may
also need to grapple with problems of
definition. This is especially the case for
international companies, where there
may be differences in definition or
presentation from country to country,
including units of measure. But it is also
true that definitions of common terms
(e.g. solid waste and hazardous waste)
can be different from state to state as
well as between sectors.
Information needed to develop the
indicators for the product/service use
category is often particularly difficult to
obtain because it relates to the specific
way in which products are used. Such
information may be available internally
as a part of business plans, but may not
necessarily be available in mainstream
business information sources such as
financial and cost reports. Such
information is highly product specific
and cannot be meaningfully aggregated
across different products.
Each business needs to develop an
enterprise level information system that
addresses these challenges in collecting,
managing, analyzing and reporting
data. The basis for information
(measurements or estimates &
methodology) and terminology used
needs to be documented in reports. As
far as possible, the terminology and
definitions used should be those
presented in chapter 3, but there are
some genuine differences from country
to country (e.g. regulatory differences in
the definition of hazardous waste).
SENSITIVITY AND ERROR
It is important to bear in mind the
relevance or materiality of data to
ensure that effort invested in gathering
information is proportionate to its
importance. Information used to
develop eco-efficiency indicators should
be of sufficient quality to meet the
needs of users, especially with respect
to tracking performance. But it is not
always necessary to have high precision
on all of the information. For example,
if three out of ten raw materials used in
a process constitute ninety percent by
volume of the total, the volume
precision on those three major materials
needs to be high and the volume for
the other seven could be estimated
without sacrificing much precision in
the overall figures. Similarly, if ninety
percent of energy use for a business
occurs at one of ten locations, the
energy use precision for that one
location needs to be high, while
energy use for the other nine could
be estimated.
pilot learning: a journey
Pilot companies found that “building
a sound system of performance
evaluation and reporting is a journey”
and normally needs a corporation’s
efforts over several years.
One company proposed that
implementing a sound system should
comprise the following four steps:
1 select business specific indicators meaningful to the business
2 implement new data systems on these indicators
3 select the indicators to be used
for external reporting
4 establish corporate goals

25
measurement and reporting in practice
TRANSFORMATION AND
CONVERSION
For several of the generally applicable
indicators there are internationally
recognized methods for the
transformation of data into common
units (e.g. the calculation of
greenhouse gas equivalents). However,
for many other parameters, such as
hazardous waste, there are no
commonly agreed methods for this type
of conversion. In these cases care needs
to be taken when data are transformed,
and the method of transformation
should be clearly described.
AGGREGATION
Eco-efficiency information will generally
be aggregated and reported for an
enterprise as a whole, rather than for
individual products and facilities. This is
especially so when reporting to outside
stakeholders (e.g. in a corporate
sustainability report), and for large
companies with tens or hundreds of
facilities and products, distributed
worldwide. Some businesses may
choose to report enterprise, segment
and/or product level eco-efficiency
performance. But most are likely to limit
it to the enterprise level to protect
confidential business information, or to
keep volume limited.
While aggregation will often be
necessary, it is likely to obscure
potentially important information about
an enterprise’s eco-efficiency
performance. For example, different
types of unrelated emissions, or
emissions across different geographic
locations, may be added together,
preventing a valid assessment of
potential influences on the local
environment. Eco-efficiency estimates
from different products, processes, or
geographic areas may be combined and
averaged, obscuring details about the
performance of individual units. As a
result, aggregation of data should be
done carefully, and with transparency to
the end-user, so that the limitations of
the information can be well understood.
This is especially the case when data are
reported publicly, where comparisons
between different companies, processes,
or products could be made.
INTERPRETATION AND
BENCHMARKING
Eco-efficiency reporting serves to track
performance, identify potential
improvement opportunities and
document progress. Within a company,
benchmarking could be made to track
year-to-year performance and to
compare against targets.
For comparisons between companies it
is important to recognize the inherent
diversity of business. Comparisons
should be made only when the
companies being compared provide
the same product/service (e.g.
electricity). It is also important to
recognize that the product portfolios
of different businesses often change,
and that this may affect eco-efficiency
performance, independent of a firm’s
environmental activities. The impact
of such changes should be discussed
in reporting eco-efficiency data, to
allow users to interpret year-to-year
trends accurately.
“Interpretation of the data is the central
issue of performance evaluation and
reporting. Decision makers want to
know what their own figures mean for
the various businesses in relation to
peers and targets. It is important to
have trends over several years for
good interpretation.”
EXPERIENCE SHARING MEETING IN LONDON,
JULY 6/7, 1999

26
chapter 4
Reporting issues
The primary aim of most business
measurement systems is to collect
performance information for internal
management purposes. But while the
primary audiences for eco-efficiency
information are within a company
there are also various external
audiences that will be interested in the
information, especially at the corporate
level.
WBCSD does not recommend that
companies prepare a separate or stand-
alone eco-efficiency report, but rather
integrate eco-efficiency information
into their overall decision making
and communications processes.
Internally, it should be part of routine
management systems.
Externally, eco-efficiency indicators
could be provided and interpreted in
corporate environmental or
sustainability reports as one of the
integrating element between the three
pillars of sustainability, and integrated
into existing financial reports. Eco-
efficiency information can be
communicated on a facility, regional,
divisional, or corporate basis,
recognizing the risks already identified
of aggregating data across different
products and/or operations.
UNDERSTANDING THE NEEDS
OF USERS
When deciding how to communicate
eco-efficiency information, companies
need to understand the users and their
needs, and present data accordingly.
Eco-efficiency information can be used
by a wide variety of audiences, both
inside and outside companies.
Internally:
Management uses the information
for decision making such as how to
improve products and processes,
and to set business goals
Employees in functions such asfinance, process engineering andenvironmental management may have
a professional interest in the eco-
efficiency performance of a company,
especially in the context of how they
can work to make improvements.
All employees are also likely to be
interested in their company’s
performance and their role in it.
Boards of Directors may incorporateeco-efficiency information and othersustainability issues in their strategicdecision making.
External audiences may include:
Investors, accountants,shareholders, and analysts, who arebeginning to look at how eco-efficiencyperformance of a company caninfluence its financial value and thequality of investments in it.
Bankers attempting to integrate
eco-efficiency in their lending decisions
and their view of a company’s
creditworthiness.
Insurers may be able to use eco-efficiency indicators as a means toidentify potential insurance risks and
set premiums, as well as assess the
economic consequences of
environmental performance.
International Standards Bodies
may seek to integrate eco-efficiency
indicators into the standards for
management practices.
Communities may be interested in the
performance of facilities in their area.
Consumers may want to include eco-
efficiency performance information as a
part of their purchase decisions.
Interest groups may request thatcompanies describe and quantify eco-efficiency in their public reporting as ameans to help document their progresstoward sustainability.
MEETING AUDIENCE NEEDS
The following questions may help to
develop a communications approach by
focusing a company’s efforts on the key
needs of its audience(s), and identifying
key issues that must be dealt with.
• What do specific audiences want
from the company?
• What is the goal of reporting?
• What is the added value for the
company of reporting eco-efficiency?
• What is the risk (and how can the
risk be managed) of reporting or
not reporting the information with
respect to :
- not meeting the user’s expectations
- corporate reputation
- managing perceived “bad news”
- raising new, previously
unknown issues?
• Are there competitive issues
associated with reporting eco-
efficiency information such as
disclosing potentially confidential or
sensitive details, and how can those
concerns be managed?
• Should the information be evaluated
and verified by an independent third
party to improve its credibility with
an audience?
27
measurement and reporting in practice
• What is the best means of
communication (e.g. paper reports,
Internet)?
• Should a company provide
benchmarking information (e.g. from
other companies or industry
averages) and how?
• Are there any issues that need to be
communicated about the influence
on eco-efficiency performance of
- changing technologies
- changing markets
- new environmental knowledge?
• What is the environmental/human
health relevance and scientific basis of
the data?
• Are there geographic issues and
special concerns to be considered
and communicated?
SCOPE AND LIMITATIONS
It is very important that companies
provide some perspective on the scope
and limitations of their indicators.
Information should be provided on
issues such as accuracy and precision
(e.g. margins of error); the degree to
which data have been aggregated;
boundaries of data collection;
environmental relevance; the influence
of market changes that may be
unrelated to changes in eco-efficiency;
the limits of comparisons; etc.. The
purpose of these explanations is to
ensure that users understand the nature
of the information provided.
“After we have now successfully applied
this approach at one of our sites, we
intend to expand it to other sites of
the same business unit and finally to
the entire corporation. The study
team gained a lot of experience and
will also be able to help other
companies in the future.”
“As a company we learned that we
still have many opportunities to
improve our eco-efficiency, even
though we felt we already were a
highly profitable and environmentally
responsible business when we
engaged in this pilot.”
PILOT CONCLUSIONS MEETING, NYON
SWITZERLAND, MARCH 27/28, 2000

28
chapter 4
There are no “rules” for communicating
eco-efficiency information and WBCSD
does not propose a standard format
because of the flexibility required to
meet the needs of different audiences.
One approach is illustrated in the
example at the beginning of this report
and within this section.
In general, eco-efficiency information
must be presented in a substantive and
clear manner that is accurate, not
misleading, and consistent with the
technical background of the end-user.
Users may want to express eco-
efficiency with a number of different
ratios combining various value and
environmental influence indicators.
THE ELEMENTS OF A COMPANY’S
ECO-EFFICIENCY PROFILE
WBCSD proposes the following five
elements for a summary report. If the
report has undergone third party
review, a verification statement might
also be included.
Organization Profile – to provide a
context for the eco-efficiency
information. A typical profile might
include the number of employees,
business segments and primary
products, system boundary conditions,
and contacts for additional information.
This section should also include a
description of major changes in the
structure of the company since a
previous report was issued.
Value Profile – This section of the
report provides a profile of both
generally applicable and business
specific indicators from the “value”
portion of the WBCSD framework.
This would include indicators such as
financial information, the amount of
products sold, or functional indicators
for specific products.
Environmental Profile – including
generally applicable environmental
influence indicators as well as business
specific indicators relating to
product/service creation and use that
are relevant and meaningful for the
specific company.
organization profile
Company name: Exemplis Inc.
Business segments: Pharmaceuticals (list of primary products)
Report for: Fiscal Year 1999
System boundaries: includes all consolidated units of
Exemplis Inc., excludes joint ventures
and minority activities
Number of employees: 2,500
Internet: Website, hyperlink to web-based
sustainability report
Contact for additional information: Name, telephone, e-mail address
value profile
Generally applicable indicators:
Mass of product sold = 300,000 kg
Net sales = 470 million USD
Business specific indicators:
Value added = 220 million USD
Gross margin = 130 million USD
EBIT = 45 million USD
The eco-efficiency profile
So while companies may want to
publish their own eco-efficiency ratios
it is recommended that environmental
and value data also be reported
separately as gross numbers (e.g.
tons of materials or emissions, total
gigajoules of energy used, total
earnings). The calculation of additional
eco-efficiency ratios can then be done
by the end-user.
environmental profile
Generally applicable indicators:
Energy consumed = 50,000 gigajoules
Material consumed = 4,500 tons
Water consumed = 60,000 m3
GHG emissions = 7,000 tons CO2 equiv.
ODS emissions = 25 tons CFC11 equiv.
Business specific indicators:
Electricity consumed = 35,300 gigajoules
GHG from upstream electricity gen. = 4,600 tons CO2 equiv.
Natural gas consumed = 11,500 gigajoules
Acidification emissions = 400 tons SO2 equiv.
VOC emissions = 230 tons
COD effluents = 86 tons
Total waste = 1,450 tons
Waste to landfill = 650 tons

29
measurement and reporting in practice
eco-efficiency ratios
Mass of product sold per
Energy consumption = 6.0 kg per gigajoule
Material consumption = 66.7 kg per ton material
GHG emissions = 42.9 kg per ton CO2 equiv.
Net sales per
Energy consumption = 9,400 USD per gigajoule
Material consumption = 104,000 USD per ton material
GHG emissions = 67,100 USD per ton CO2 equiv.
methodological information
ISO 14,031 was used to identify relevant
aspects of our business activity and to
select respective meaningful indicators.
Our data collection and use
methodologies are available
for review.
Eco-efficiency Ratios – In addition
to providing the basic “numerator”
and “denominator” data for estimating
eco-efficiency, companies may also
wish to provide calculations of eco-
efficiency indicators that they regard
as most relevant and meaningful for
their business.
Methodological Information –
covering the approach used to select
indicators, data collection
methodologies and any limitations
on use of the data.
Business specific indicators and
information should be provided using
the same format as for the generally
applicable indicators, both in absolute
terms and if relevant and meaningful, as
eco-efficiency ratios. The appropriate
indicators would be determined by the
company’s specific circumstances.
environmental reports
An analytical survey was carried out in
the course of our pilot program on
29 most recent corporate environmental
and sustainability reports. The study
analyzed the companies’ reporting
practices in their use of the recommended
reporting elements, generally applicable
indicators (value and environmental
influence), eco-efficiency ratios and
reporting vis-à-vis targets.
These were our main findings:
• The recommended organizational profile
information is not fully included.
• While net sales are provided in a
majority of reports, product quantity is
included only in one third.
• 15% of the reports provide no value
indicators at all.
• While a majority reports on total energy
and water consumption, materials
figures are only included in 20% of
the reports.
• Greenhouse gas emissions were reported
in some form or fashion by over 60 % of
the companies, but few reported on
Ozone Depleting Substances.
• Over 70% of the reports include
indicators on waste, but with varying
definitions and scopes.
• Where ratios are used, they are still most
often in the form of intensity ratios, not
eco-efficiency ratios.
• Targets are very rarely used.
Recommendations on general reporting
practices concluded from the study include
the need for clear definition of indicators
and scope of the report, consistent units
for data of the same kind, and use of
graphs that allow exact reading of the
data or provide the data separately.

30
chapter 4
0
100
200
300
400
500
600
TARGET9998969492902002
Net Sales in mil USD
134
540
470
391
323
236
190
0
10
20
30
40
50
60
TARGET9998969492902002
Energy Consumption in terajoules
20
5150
44
40
32
24
0
2
4
6
8
TARGET9998969492902002
GHG Emissionsin kilotons CO2 equivalent
5.0
5.8
7.07.5
8.1
7.2
6.3
5555
434347474848
0
20
40
60
80
100
029999989690
Mass of Product per GreenhouseGas Emissions(in kg per ton CO2 equivalent)
3636
4646
reference 1990
1996
1998
target 1999
1999
target 200227
93
6766
52
40
0
20
40
60
80
100
029999989690
Net Sales perGreenhouse Gas Emissions(in 1000 USD per ton CO2 equivalent)
27
93
6766
52
40
performance over time
eco-efficiency ratios
REPORTING TRENDS OVER TIME
Trend data is important so that
changes in performance over time or
compared to a reference point can be
assessed. Data can be presented as
absolute value and environmental
influence figures or as eco-efficiency
ratios, or indexed to a selected year,
or expressed relative to a projected
goal. The performance could also be
expressed relative to an industry
average, if that is available. If indices
are used, however, the absolute
numbers underlying them should also
be published so that users can calculate
their own ratios.
A report could therefore include data
from several years, as well as a reference
year and targets in order to illustrate
improvements over time and
demonstrate achievements against
targets, as shown in the example below.
It is crucial, however, that data
presented in such charts is truly
comparable so that the trends depicted
accurately represent eco-efficiency
performance.
“ Strong emphasis should be placed on
the use of trends or comparisons over
periods of time with the eco-efficiency
calculations. When they stand alone,
these indicators have little meaning in
comparison to the environmental
impact they represent.”
EVALUATION OF THE CONCEPT BY PILOT
COMPANIES, MARCH 2000

31
appendicesAppendix 1: List of categories, aspects and examples of indicators
CATEGORY ASPECT EXAMPLE INDICATOR
Product/Service Value Volume • Units (e.g. number) sold
• Statistical Unit (e.g. averaged, indexed)
• Employees (e.g. numbers, labor hours)
• Space (e.g. in building management)
Mass • Quantity (e.g. kilograms) sold
• Quantity (e.g. kilograms) produced
Monetary • Net Sales/Turnover
• Gross Margin (Net Sales - Cost of Goods Sold)
• Value Added (Net Sales - Costs of Goods Purchased)
• Income / Earnings / Profits
• Share Value
• Liabilities (e.g. Insurance Costs)
• Reserves / Provisions
• Investments and Write-offs
• Costs (e.g. Cost of Goods Sold, Production, Energy, Materials, WasteDisposal, Pollution Control)
Function • Product Performance (e.g. laundry loads washed, number of diapersused in a baby’s life time)
• Services Delivered (e.g. standard banking transactions)
• Agricultural Yield (e.g. bushels harvested)
• Agricultural Effectiveness (e.g. hectares treated)
• Product Durability/Lifetime (e.g. vehicle miles traveled)
• Transport Capacity (e.g. ton-kilometers, passenger-kilometers)
Note: Function describes the functional value of a product/service tothe end-user. As a result, they are highly specific and can only be usedfor individual products and services.
Other Potentially • Product PriceRelevant Information • Market Share
• Margins
• Market Mix
Product/Service Creation Energy Consumption • Gigajoules consumedEnvironmental Influence • Fossil Fuel Type (e.g. gigajoules of coal, natural gas, fuel oil, etc.)
• Source (e.g. gigajoules of renewable, non-renewable)
• Emissions (e.g. tons of SOx, NOx, VOC, greenhouse gases)
Materials Consumption • Tons consumed
• Type (e.g. tons of raw material, indirect/ancillary materials)
• Source (e.g. tons of renewable, non-renewable, recycled, virgin,extraction rucksack)
• Characteristics (e.g. tons of materials with certain environmentalsafety/risk characteristics)
Natural Resource • Tons consumed (e.g. water, wood, minerals)Consumption • Source (e.g. tons of renewable, non-renewable, m3 of groundwater,
fresh surface water, salt water)
• Land Use (e.g. hectares of biodiversity/species conservation habitat)
• Non-process Water (e.g. m3 of utility, product consumption)

32
CATEGORY ASPECT EXAMPLE INDICATOR
Non-product Output • Before Treatment (e.g. tons of process material inputs minus tons of product output)
• Techniques of Treatment (e.g. quantity to bio-treatment, incineration,landfill)
• Releases to Land or Water After Treatment (e.g. quantity to on-site/off-site treatment, quantity of hazardous/non-hazardous, quantity tosurface water, underground injection, tons of effluent BOD5 and/orCOD, tons of N&P nutrification emissions)
• Air Emissions (e.g. tons of NO2/NOx, SO2/SOx acidification,greenhouse gases, ozone depleting substances, volatile organiccompounds)
• Priority Heavy Metals Releases (e.g. tons of releases)
• Persistent, Bio-accumulative and Toxic Releases (e.g. tons of POPsreleases)
Unintended Events • Accidental Releases (e.g. number of releases)
Product/Service Creation Product/Service • Characteristics (e.g. recyclability, reusability, bio-degradability, Environmental Influence durability safety/risk)
Packaging Waste • Tons sold
• Source (e.g. virgin material, recycled)
Energy Consumption • Same as above for Product/Service Creation
Emissions During • Releases to land, water and air from use and disposalUse and Disposal
appendix 1

3333
appendix 2
Some examples of business specific indicatorsare included in this appendix to helpcompanies and provide some guidance basedon the experience gained during the pilotexercise. The descriptions, measurementmethods and data sources are taken frominformation provided by pilot companies.Many of them are used in these companies.Environmental business specific indicators canbe identified in the following areas:
• Indicators on emissions of individualor groups of gases and metals to airor water (e.g. VOC, SO2, NOx, priorityheavy metals)
• Environmental burden/effectindicators (e.g. eutrophication,photosmog, human toxicity):Environmental burden/effect indicators aresummary indicators for different gases oreffluent substances that contribute to thesame environmental burden or effect.
Weighting factors (e.g. Heijungs et al. atLeiden University (1992); ICI:Environmental Burden, The ICI Approach,1997; Responsible Care: Health Safety andEnvironmental Reporting Guidelines; CEFICNovember 1998), with which individualgases or effluent substances contribute toenvironmental effects, have beendeveloped for some indicators. In someregions (e.g. Europe) the weighting factorconcept is used quite broadly.
• Summary parameters for watereffluents (e.g. Chemical oxygendemand (COD) and others): Summaryparameters for water effluents are also verycommon. However, water effluentsubstances are not relevant for all type ofbusinesses, and therewith neither are suchsummary parameters. Those businesses forwhich it is relevant will have to choosebetween alternative parameters andmeasurement methods.
• Indicators on particular fractions ofwaste or non-product output (e.g.waste to landfill)
• Product use indicators (e.g. productpackaging, energy consumptionduring product use): These types ofindicators can often be defined alongsimilar terms as the indicators for productcreation, however with a scope relative tothe product usage.
• Indicators on aspects of upstreamimpacts emerging at operations ofsuppliers: These types of indicators canoften also be defined along similar termsas the indicators for product creation,however with a scope relative to theproduct’s upstream value chain orusage.
Appendix 2: Examples for business-specific indicators
EBITProfit before interest expense andincome tax
in USD, Euro, or Yen International Accounting StandardsCommittee (IASC), Generally AcceptedAccounting Principles (GAAP) e.g. at:www.aicpa.org
Financial reportsPurchasing reports
INDICATOR UNIT POTENTIAL MEASUREMENT METHOD POTENTIAL DATA SOURCE
Value AddedNet sales minus costs of goods andservices purchased
in USD, Euro or Yen International Accounting StandardsCommittee (IASC), Generally AcceptedAccounting Principles (GAAP) e.g. at:www.aicpa.org
Financial reportsPurchasing reports
VALUE INDICATORS
Priority Heavy Metals (PHM)Emissions to Surface Water Total aquatic release of sum of heavymetals (As, Cd, Cr, Cu, Pb, Hg, Ni, Zn)and their compound to water
in metric tons of Cu equivalents
- Heavy Metals as defined in:Responsible Care: Health Safety andEnvironmental Reporting Guidelines,CEFIC November 1998, page 12
- Transformation factors: ibidAppendix 9, page 38
Water discharge reportsEHS reportsEstimation or calculation
INDICATOR UNIT POTENTIAL MEASUREMENT METHOD POTENTIAL DATA SOURCE
ENVIRONMENTAL INFLUENCE INDICATORS
Gross MarginNet sales minus costs of goods andservices sold
in USD, Euro, or Yen International Accounting StandardsCommittee (IASC), Generally AcceptedAccounting Principles (GAAP) e.g. at:www.aicpa.org
Financial reportsPurchasing reports

INDICATOR UNIT POTENTIAL MEASUREMENT METHOD POTENTIAL DATA SOURCE
Photochemical Oxidant Creation(POC) VOC (excluding methane) and NOx releases
in metric tons of VOC& NOx or Ethyleneequivalents
- VOC as defined in Responsible Care:Health Safety and EnvironmentalReporting Guidelines, CEFICNovember 1998, page 11
- Photochemical Oxidant CreationPotentials (POCP): Heijungs et al.,CML University of Leiden, 1992 andHauschild and Wenzel, Chapman &Hall, London, 1997
Plant surveys EHS reports Estimation or calculation
Eutrophication Emissions toSurface WaterTotal aquatic release of phosphorousand nitrogen compounds
in metric tons ofphosphorusequivalents
Nutrification Potentials:Heijungs et al., CML University ofLeiden, 1992
Plant surveys EHS reports Estimation or calculation
Chemical Oxygen Demand (COD)to Surface Water Total amount of oxygen required forthe chemical oxidation of compoundsin all water effluents
in metric tons ofoxygen
COD as defined in:Responsible Care: Health Safety andEnvironmental Reporting Guidelines,CEFIC November 1998, page 12
Water discharge reports EHS reports Estimation or calculation
PackagingPackaging from purchased goods andfor products
in metric tons Company specific method used tomeasure or track packaging materialamounts (mass)
Purchasing reportsWaste disposal reports Estimation or calculation
GHG Emissions from PurchasedElectricityGHG emissions released by the supplierof purchased electricity
in metric tons of CO2
equivalents- List of greenhouse gases:
Kyoto Protocol, Annex A- Global Warming Potentials:
IPCC, Climate Change 1995, SecondAssessment Report
- Transformation factors for fuels fromfuel carbon content:e.g. Responsible Care: Health Safetyand Environmental ReportingGuidelines, CEFIC November 1998,page 31f.
GHG emissions released by supplier ofpurchased electricity are calculated/estimated using specific knowledge ofrelevant electric supplier network.
Cost reportsEstimations or calculations
appendix 2
34
Waste to LandfillWastes from processes, treatments andpackaging disposed of by landfill
in metric tons Company specific method used tomeasure or track quantity (mass) ofwaste disposed of by landfill
Waste disposal reports EHS reports Estimation or calculation
Waste to Incineration Wastes from processes, treatments andpackaging disposed of by incineration
in metric tons Company specific method used tomeasure or track quantity (mass) ofwaste (as defined by applicablegovernment authority) disposed of by incineration
Waste disposal reports EHS reports Estimation or calculation

appendices 3 and 4
35
Appendix 3: List of pilot companies
3M Consumer Products USABroken Hill Proprietary Mining AustraliaCompanhia Vale do Rio Doce Mining BrazilGeneral Motors Transportation Products USAGrupo Vitro Glass MexicoMonsanto Company Life Sciences USANoranda Mining CanadaNorsk Hydro Conglomerate NorwayNovartis International Life Sciences SwitzerlandNovo Nordisk Chemicals DenmarkProcter & Gamble Consumer Products USARio Tinto Mining UKShell Chemicals Chemicals UKSonae Investimentos Forest product and Retail PortugalSony Europe Electronics, Entertainment EuropeSTMicroelectronics Microelectronics FranceSuez Lyonnaise des Eaux Utilities FranceTECO Electric & Machinery Electrical TaiwanTokyo Electric Power Company Utilities JapanToyota Automobiles JapanVolkswagen Automobiles GermanyWMC Limited Mining AustraliaTaiwan Ind. Sector Assoc. Cement, Paper, Semiconductors Taiwan
3MAnova HoldingArthur D. LittleAT&TAventisBASFBOC GroupBroken Hill ProprietaryCH2M HILLChemical Works SokolovCIMPORCompanhia Vale do Rio DoceDeloitte Touche TohmatsuDow Chemical DuPontEastman KodakEnvironmental Resources Management plcFiat AutoGeneral MotorsGerling-Konzern InsurancesGrupo IMSAGrupo VitroInterfaceJohnson & JohnsonKikkoman CorporationMitsui & CoMonsanto CompanyNorandaNorsk HydroNovartis International Novo Nordisk Petro-Canada
PLIVAPowerGen UK Procter & Gamble Rio Tinto SC Johnson & SonSamsung ElectronicsSevern Trent SGS Société Générale de SurveillanceShell International Sonae InvestimentosSony STMicroelectronicsStorebrand Suez Lyonnaise des EauxSuncor Energy ThermoRetec CorporationTokyo Electric Power Company Toyota UBS Unilever Volkswagen Westvaco Weyerhaeuser WMC LimitedZurich Financial Services Group
Appendix 4: Working group member companies and organizations
Austrian BCSD BCSD ArgentinaBCSD BrazilBCSD ColombiaBCSD TaiwanEnvironmental Forum of ZimbabweIndustrial Environmental Forum of SouthernAfrica (IEF)

36
The World Business Council for Sustainable Development (WBCSD) is a coalition of
130 international companies united by a shared commitment to sustainable
development. Its members are drawn from 30 countries and more than 20 major
industrial sectors. The organization also benefits from a thriving global network of
national and regional business councils and partner organizations.
The WBCSD aims to be a catalyst for change and fosters closer co-operation between
business, government and other organizations concerned with sustainable
development. It also serves as a forum where leading business people can exchange
ideas and best practice in this field. The organization’s work program reflects the
determination of many in business to engage in an action-oriented approach. In
particular, the WBCSD carries out a program covering the following focus areas:
sustainability reporting; corporate social responsibility; sustainability through the
market; innovation, technology, society and sustainability; climate and energy; and
natural resources.
Further, there are currently four sectoral projects under way within the WBCSD on
sustainable mobility, cement, mining and forestry.
Acknowledgments
The WBCSD’s working group on Eco-Efficiency Metrics and Reporting was fortunate to
have the commitment and leadership of Robin Bidwell, chairman, ERM plc, and
Hendrik Verfaillie, president of Monsanto Company. We would also like to extend our
appreciation for the dedicated efforts provided by Charles W. Keffer, Director, EHS
Operations Policy & SD Operational Excellence, Monsanto Company. Further, many
thanks to Markus Lehni, Program Manager at the WBCSD, who oversaw the
WBCSD’s eco-efficiency work for the past three years, and brought the metrics and
reporting project to a tangible outcome. Finally, we should like to thank all the
individuals who participated in the year-long pilot program to test the indicators,
refine them, and bring them to life.
Disclaimer
WBCSD reports, such as this document, are released in the name of the WBCSD.
Each publication is the product of a working group, comprising executives of
member companies, mandated by the council to address a particular topic, often
drawing on the advice of internationally renowned experts.
Each working group is chaired by council members, who lead the clearance process,
which includes the review of the text by all members and the final approval by the
executive committee. This process ensures that each document represents the
majority view of the WBCSD. However, it does not mean that every member agrees
with every word.
Copyright © World Business Council for Sustainable Development
June 2000
ISBN 2-940240-14-0
about the WBCSD

Written by Roger Cowe, LondonDesigned by Red Letter Design, London