Embed Size (px)
DESCRIPTION
Dedicated Outdoor Air Systems (DOAS) Automatic Control Considerations. ASHRAE 2012 Winter conference, Chicago Seminar 50, #1: January 25, 2012. Stanley A. Mumma , Ph.D., P.E. Prof. Emeritus, Architectural Engineering Penn State University, Univ. Park, PA [email protected]. - PowerPoint PPT Presentation
Citation preview
1
Stanley A. Mumma, Ph.D., P.E. Prof. Emeritus, Architectural Engineering
Penn State University, Univ. Park, [email protected]
Web: http://doas-radiant.psu.edu
Dedicated Outdoor Air Systems (DOAS) Automatic
Control ConsiderationsASHRAE 2012 Winter conference, Chicago
Seminar 50, #1: January 25, 2012
2
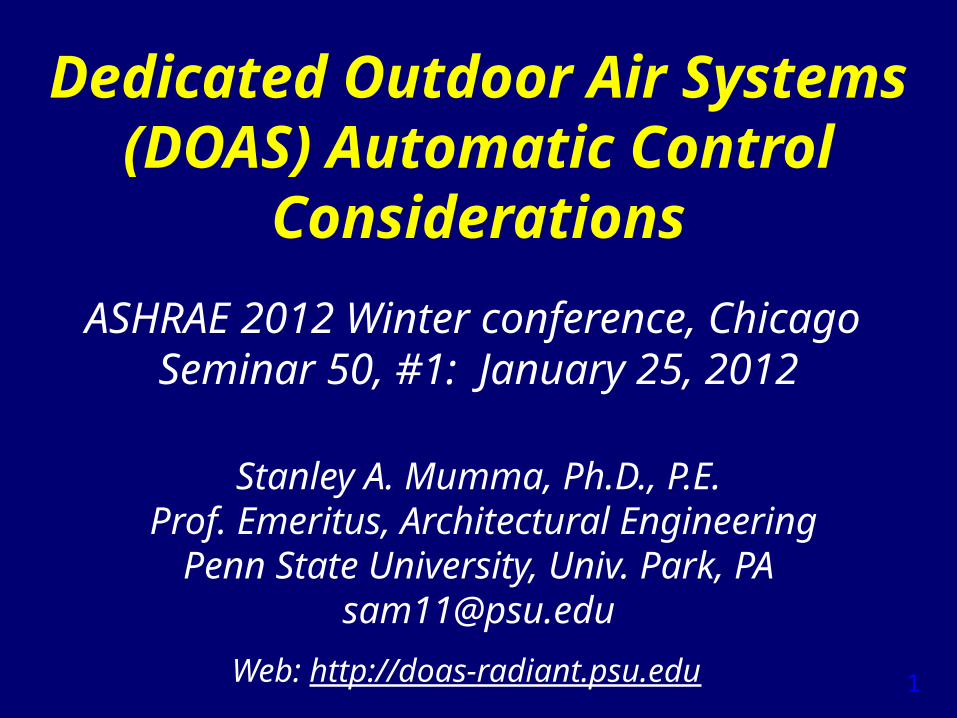
Learning Objectives for this Session1. DOAS heat recovery control related to dehumidification & free
cooling.2. Building pressurization.3. Freeze protection.4. Limiting terminal reheat—including demand controlled
ventilation. ASHRAE is a Registered Provider with The American Institute of Architects Continuing Education Systems. Credit earned on completion of this program will be reported to ASHRAE Records for AIA members. Certificates of Completion for non-AIA members are available on request.
This program is registered with the AIA/ASHRAE for continuing professional education. As such, it does not include content that may be deemed or construed to be an approval or endorsement by the AIA of any material of construction or any method or manner of handling, using, distributing, or dealing in any material or product. Questions related to specific materials, methods, and services will be addressed at the conclusion of this presentation.
3
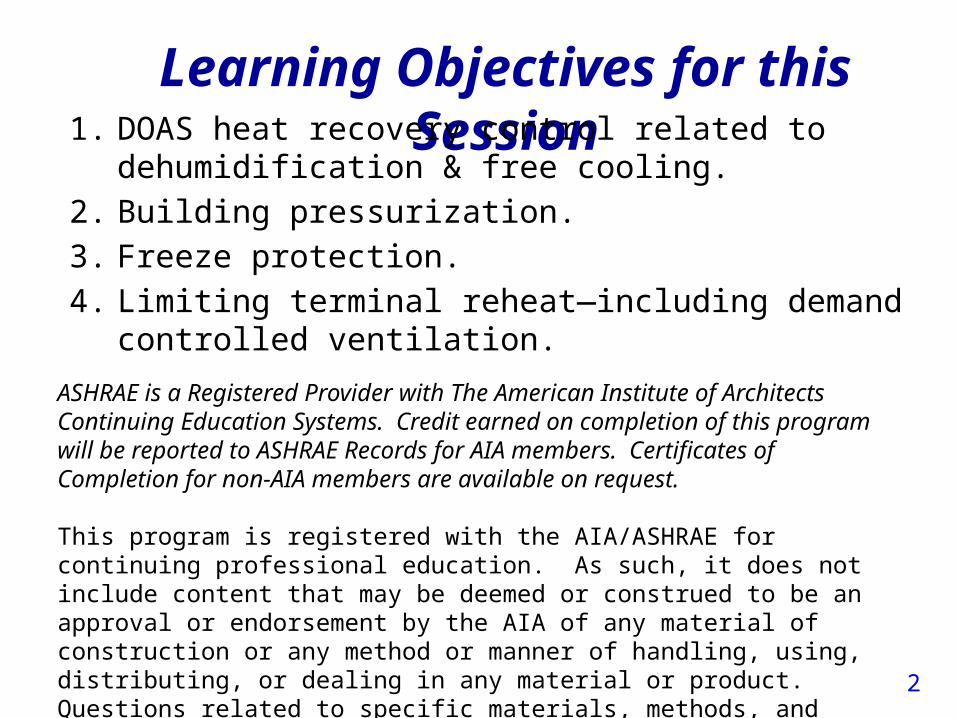
DOAS Defined for This Presentation
20%-70% less OA,than VAV
DOAS Unit w/ Energy Recovery
Cool/Dry Supply
Parallel Sensible Cooling System
High Induction Diffuser
Building with Sensible
and Latent Cooling
Decoupled
Pressurization
4
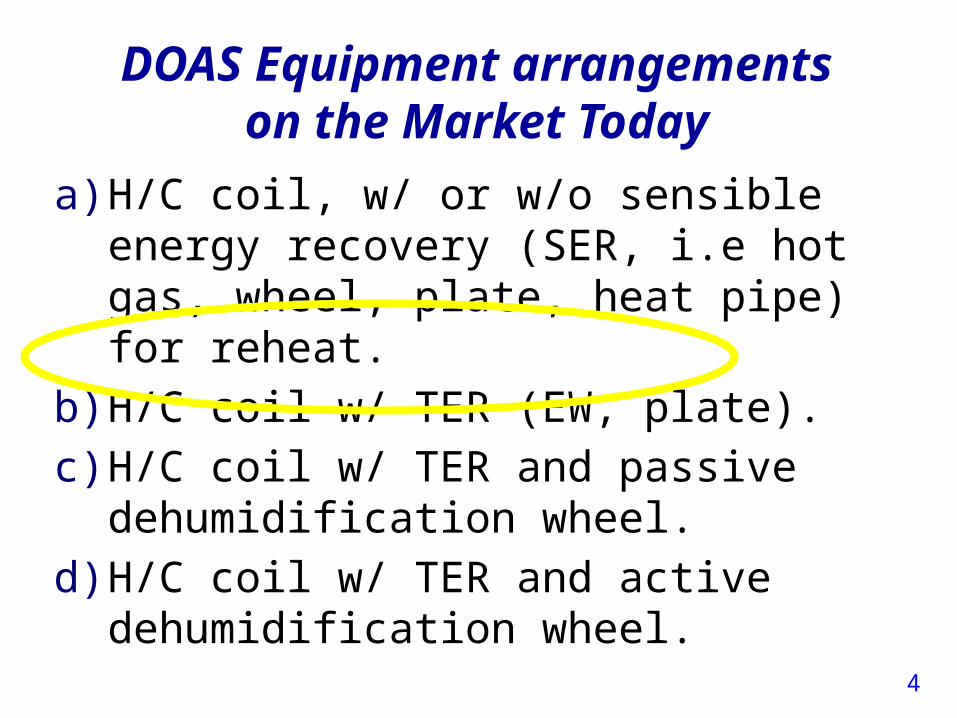
DOAS Equipment arrangementson the Market Today
a) H/C coil, w/ or w/o sensible energy recovery (SER, i.e hot gas, wheel, plate, heat pipe) for reheat.
b) H/C coil w/ TER (EW, plate).c) H/C coil w/ TER and passive
dehumidification wheel.d) H/C coil w/ TER and active
dehumidification wheel.
5
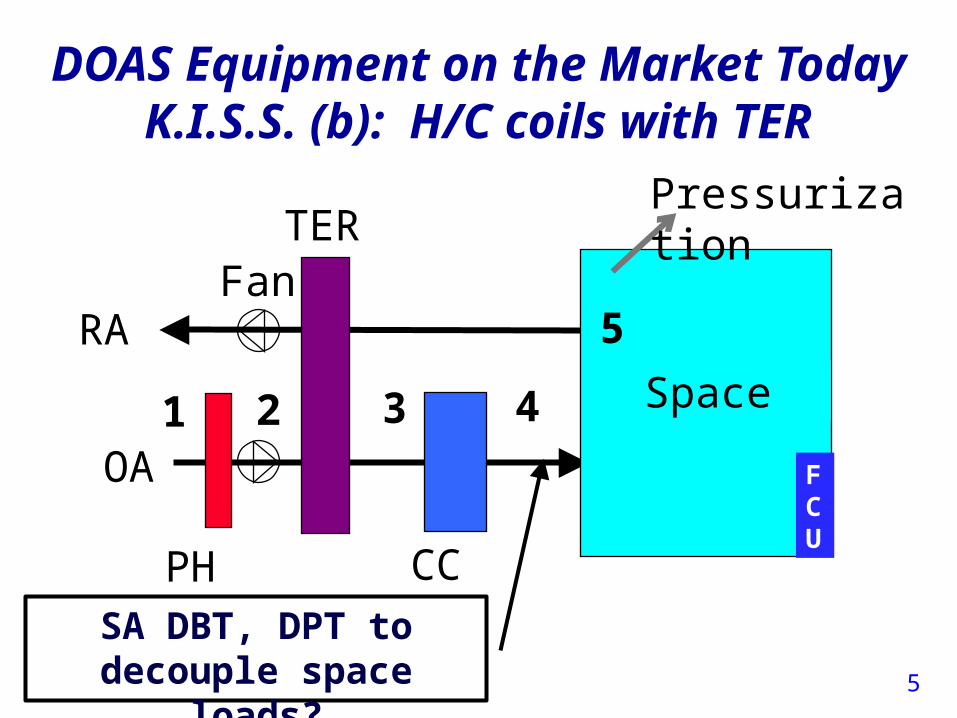
DOAS Equipment on the Market Today
K.I.S.S. (b): H/C coils with TER
OA
TER
RA
1 2 3 4
PH CC
5Space
Fan
SA DBT, DPT to decouple space loads?
Pressurization
FCU
6
0 20 40 60 80 100 1200
40
80
120
160
Dry Bulb Temperature, F
W, H
umid
ity R
atio
Gr/
lbm
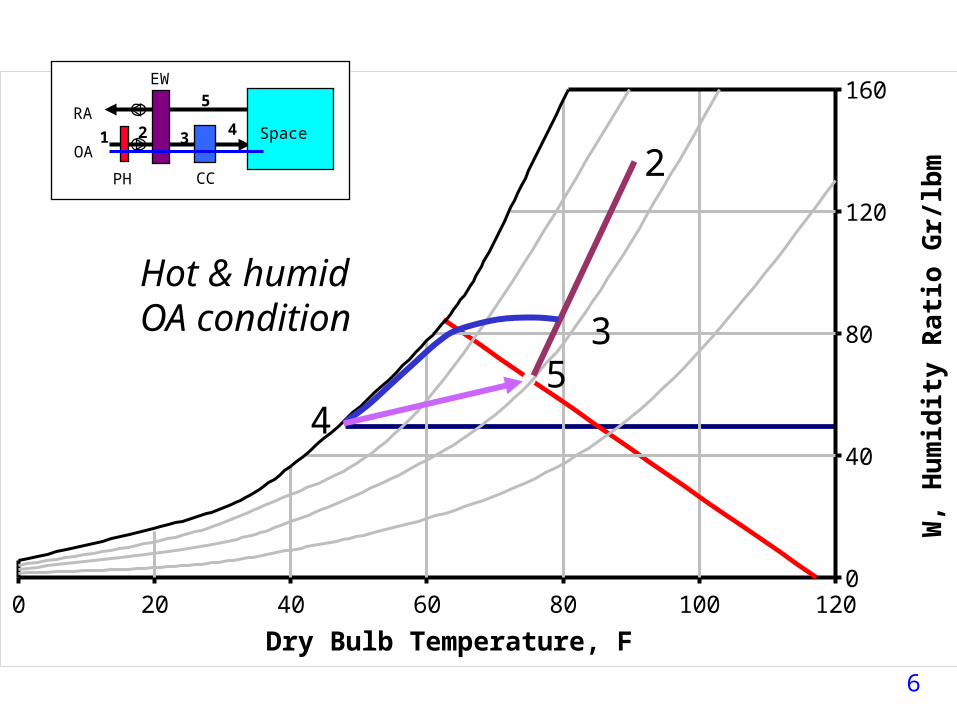
OA
EW
RA1 2 3 4
5
PH CC
Space
2
3
45
Hot & humid OA condition
7
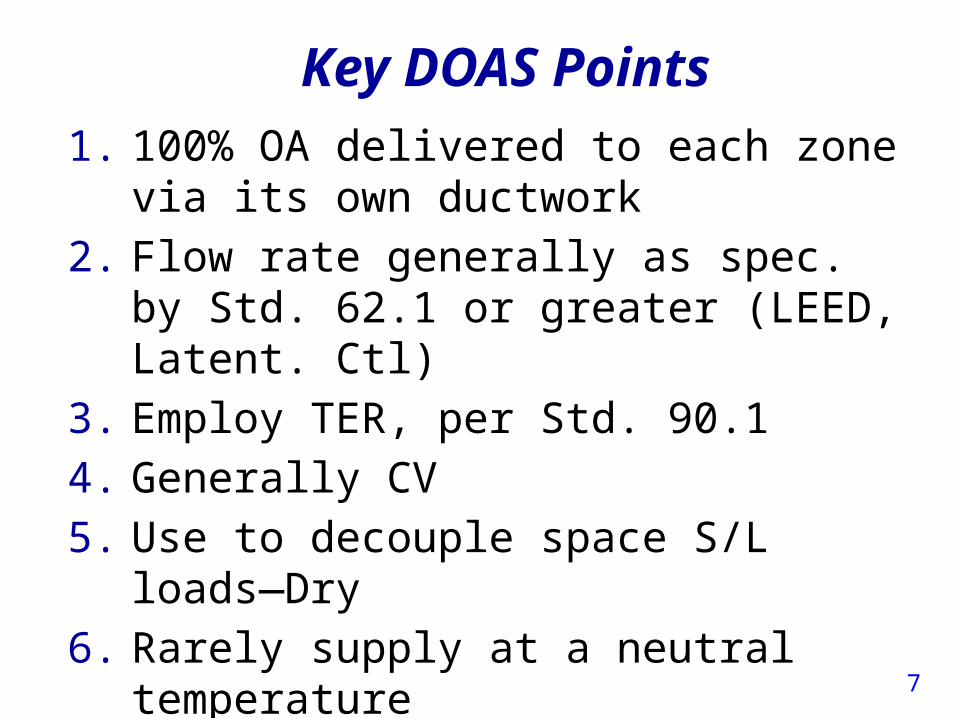
Key DOAS Points1. 100% OA delivered to each zone via
its own ductwork2. Flow rate generally as spec. by Std.
62.1 or greater (LEED, Latent. Ctl)3. Employ TER, per Std. 90.14. Generally CV5. Use to decouple space S/L loads—
Dry6. Rarely supply at a neutral
temperature7. Use HID, particularly where parallel
system does not use air
8
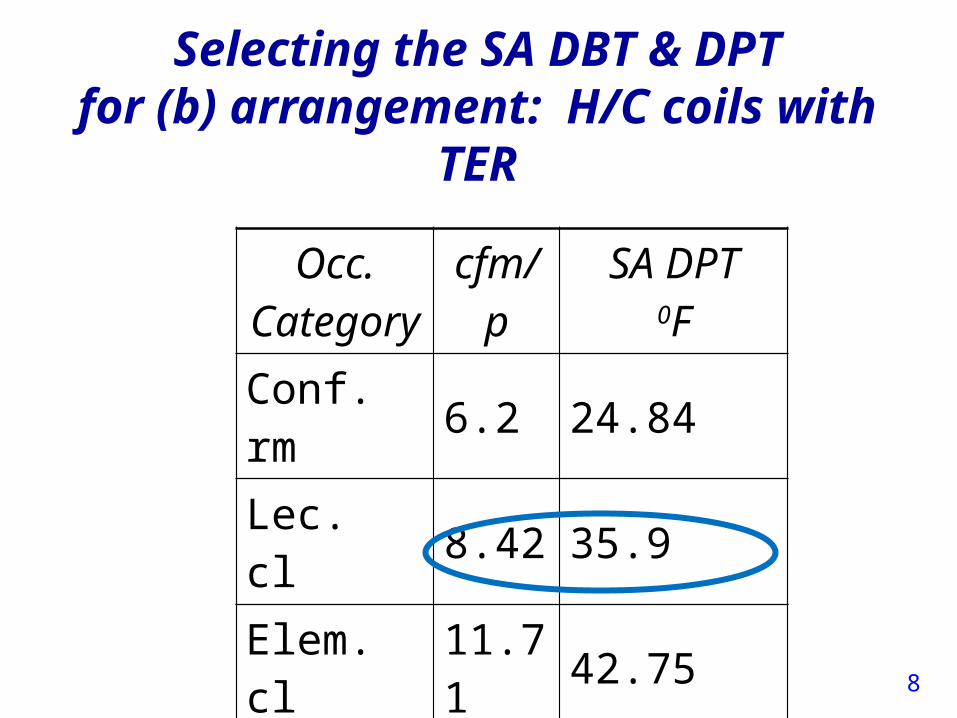
Selecting the SA DBT & DPTfor (b) arrangement: H/C coils
with TER
Occ.Categor
ycfm/
pSA DPT
0F
Conf. rm 6.2 24.84Lec. cl 8.42 35.9Elem. cl 11.7
1 42.75Office 17 47.18Museum 9 31.05
9
DOAS & Energy Recovery ASHRAE Standard 90.1 and ASHRAE’s
new Standard for the Design Of High Performance Green Buildings (189.1) both require most DOAS systems to utilize exhaust air (EA) energy recovery equipment with GT 50% or 60% energy recovery effectiveness: – that means a change in the enthalpy of
the outdoor air supply at least 50% or 60% of the difference between the outdoor air and return air enthalpies at design conditions.
Std 62.1 allows its use with class 1-3 air.
10
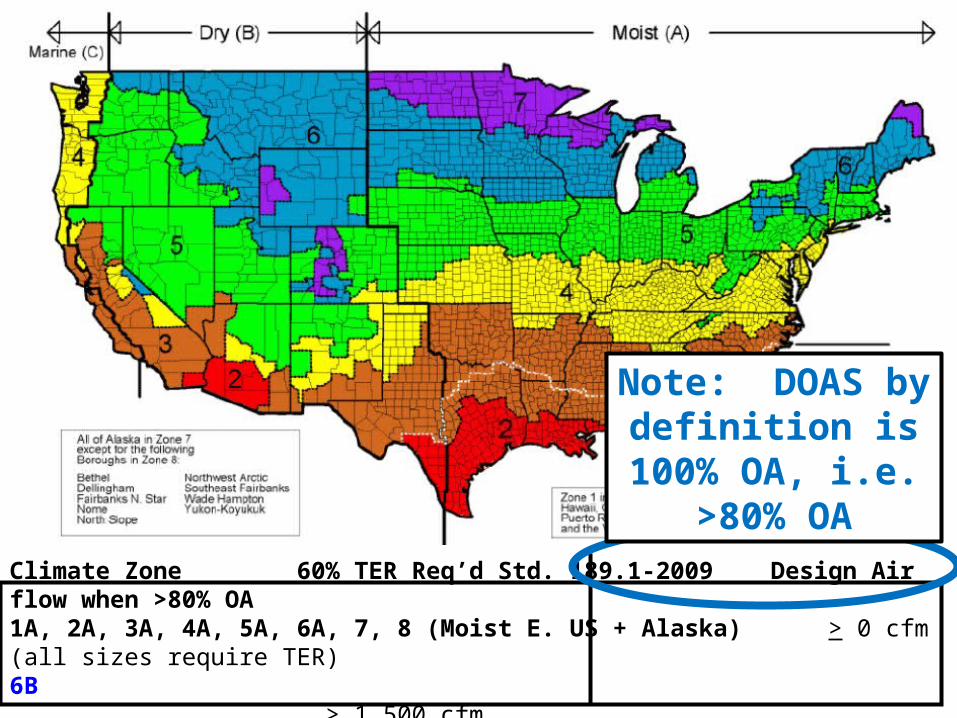
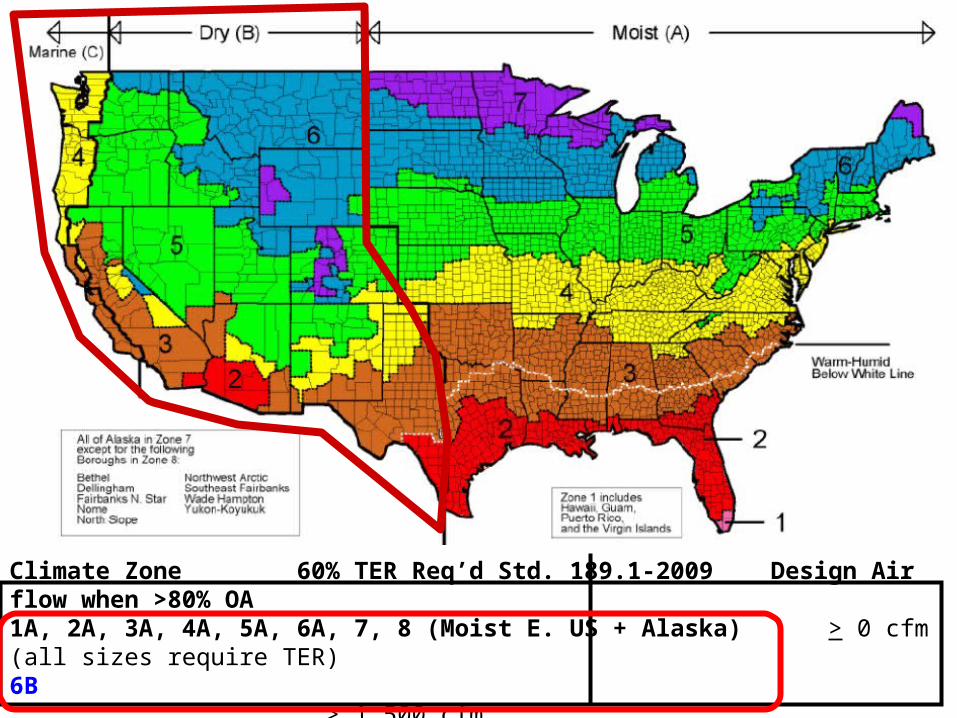
Climate Zone 60% TER Req’d Std. 189.1-2009 Design Air flow when >80% OA 1A, 2A, 3A, 4A, 5A, 6A, 7, 8 (Moist E. US + Alaska) > 0 cfm (all sizes require TER) 6B > 1,500 cfm1B, 2B, 5C > 4,000 cfm3B, 3C, 4B, 4C, 5B > 5,000 cfm
Note: DOAS by definition is 100% OA, i.e. >80% OA
11
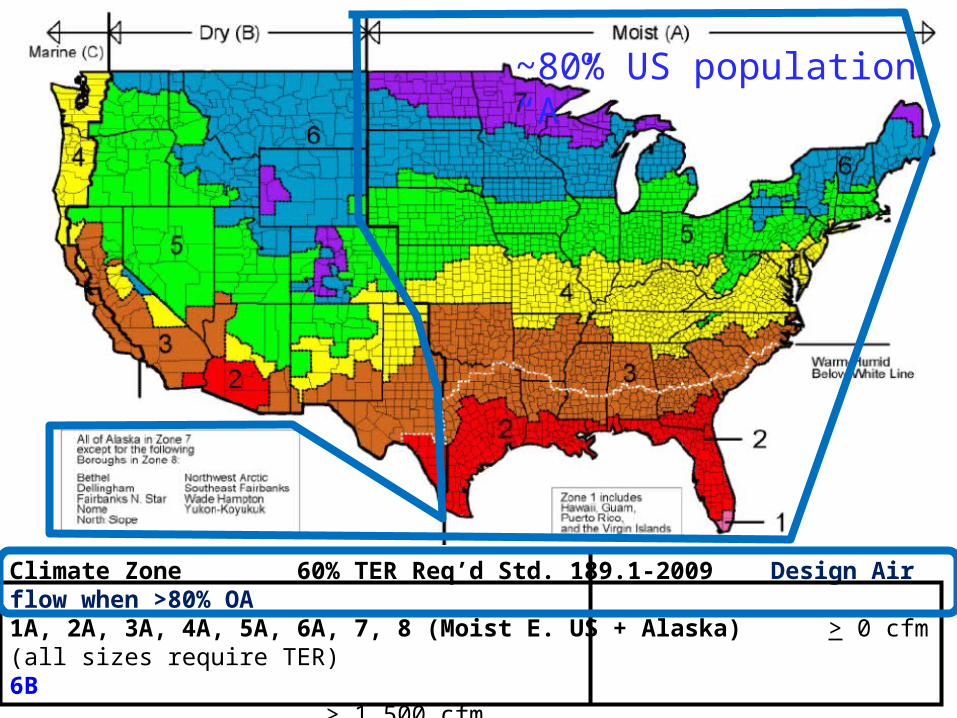
Climate Zone 60% TER Req’d Std. 189.1-2009 Design Air flow when >80% OA 1A, 2A, 3A, 4A, 5A, 6A, 7, 8 (Moist E. US + Alaska) > 0 cfm (all sizes require TER) 6B > 1,500 cfm1B, 2B, 5C > 4,000 cfm3B, 3C, 4B, 4C, 5B > 5,000 cfm
~80% US population “A”
12
Climate Zone 60% TER Req’d Std. 189.1-2009 Design Air flow when >80% OA 1A, 2A, 3A, 4A, 5A, 6A, 7, 8 (Moist E. US + Alaska) > 0 cfm (all sizes require TER) 6B > 1,500 cfm1B, 2B, 5C > 4,000 cfm3B, 3C, 4B, 4C, 5B > 5,000 cfm
13
DOAS & Energy Recovery
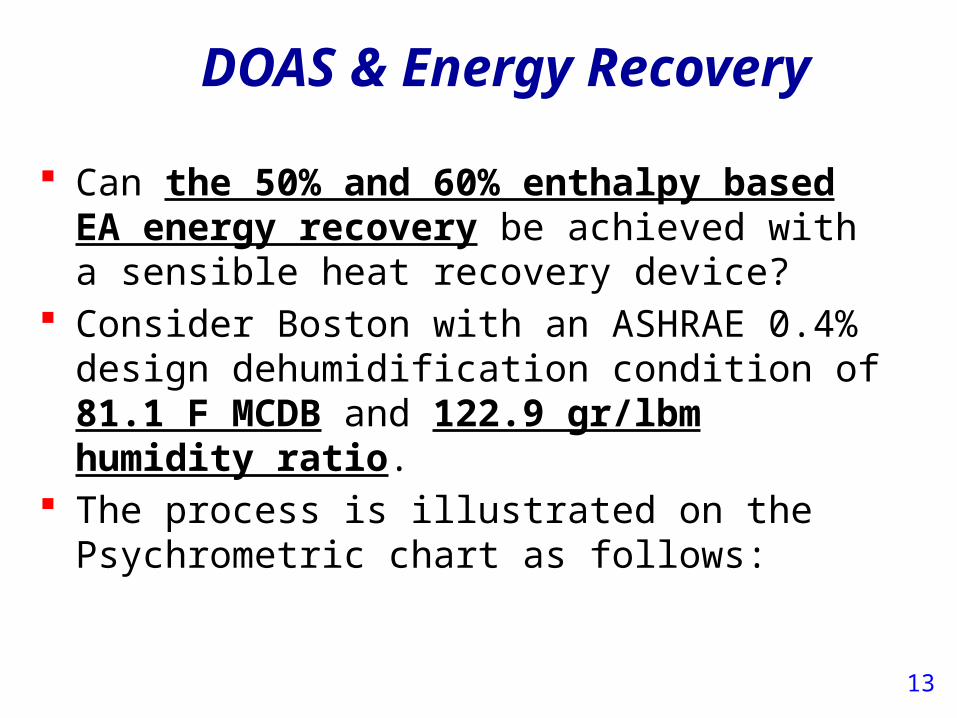
Can the 50% and 60% enthalpy based EA energy recovery be achieved with a sensible heat recovery device?
Consider Boston with an ASHRAE 0.4% design dehumidification condition of 81.1 F MCDB and 122.9 gr/lbm humidity ratio.
The process is illustrated on the Psychrometric chart as follows:
14
0 20 40 60 80 100 1200
40
80
120
160
Boston design
Dry Bulb Temperature, F
W, H
umid
ity R
atio
Gr/
lbm
QTER = 24 Btu/hr per scfmwith 50% effective TER
ΔhTER
Space state point
State point after50% effective TER
Design OA state point
15
0 20 40 60 80 100 1200
40
80
120
160
Boston design
Dry Bulb Temperature, F
W, H
umid
ity R
atio
Gr/
lbm
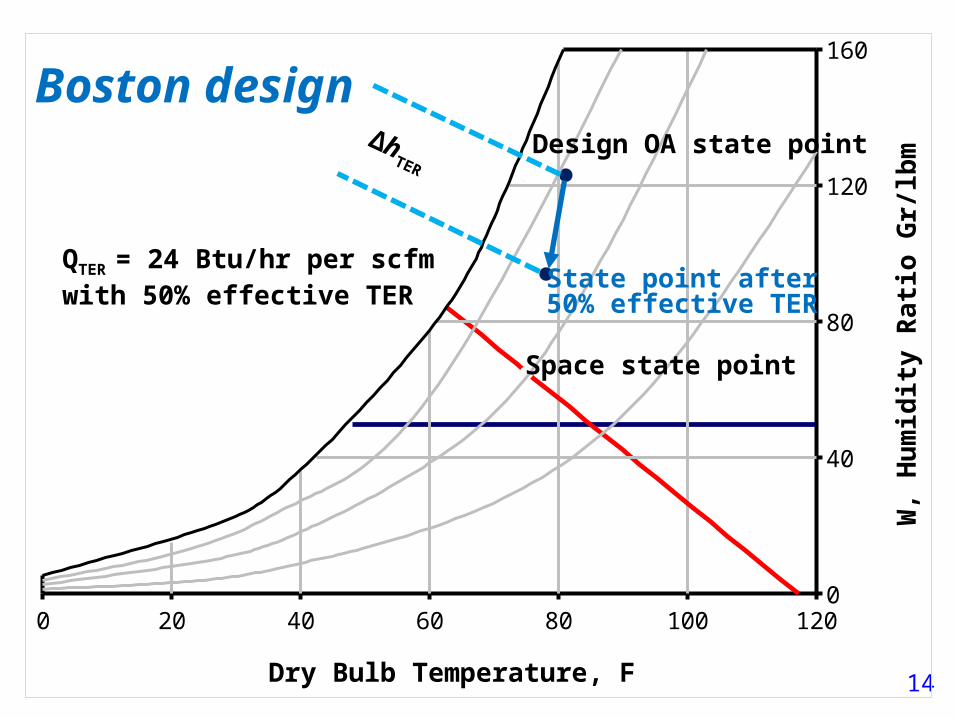
QSER = 7 Btu/hr per scfmwith 100% effective SER
ΔhSER
Space state point
Design OA state point
State point after100% effective SER
16
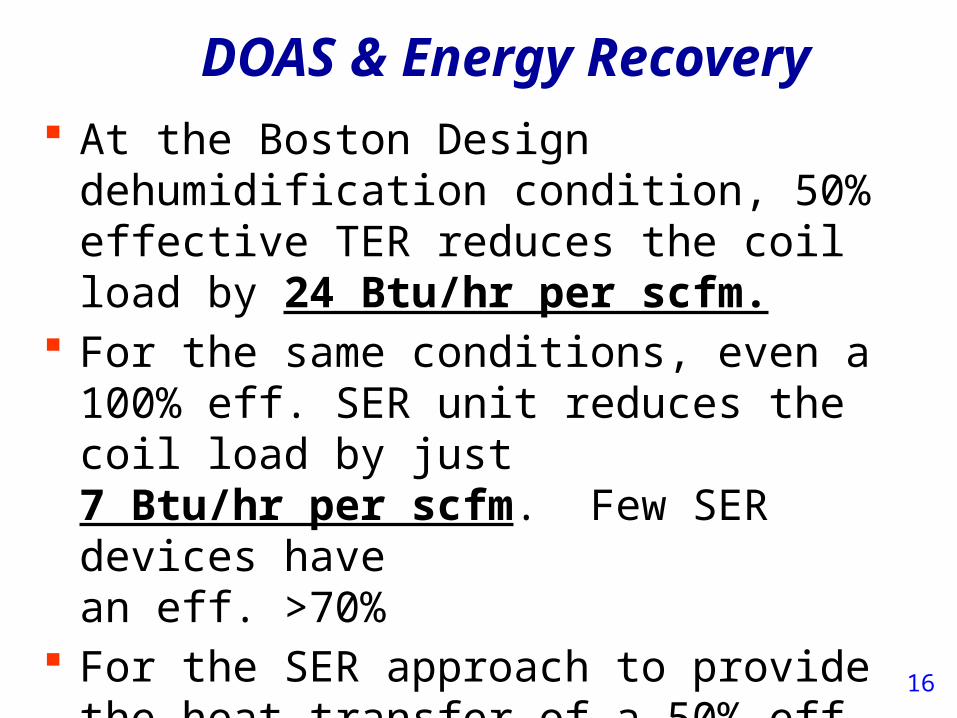
At the Boston Design dehumidification condition, 50% effective TER reduces the coil load by 24 Btu/hr per scfm.
For the same conditions, even a 100% eff. SER unit reduces the coil load by just 7 Btu/hr per scfm. Few SER devices havean eff. >70%
For the SER approach to provide the heat transfer of a 50% eff. TER device, it would need an eff. of at least 24/7*100=340%. SER can not be used to meet Std 90.1 in Boston.
DOAS & Energy Recovery
17
For geographic locations in Moist US Zone A (where ~80% of US population reside), the Std. 90.1 total heat recovery criteria can not be met with SER units.
DOAS & Energy Recovery
18
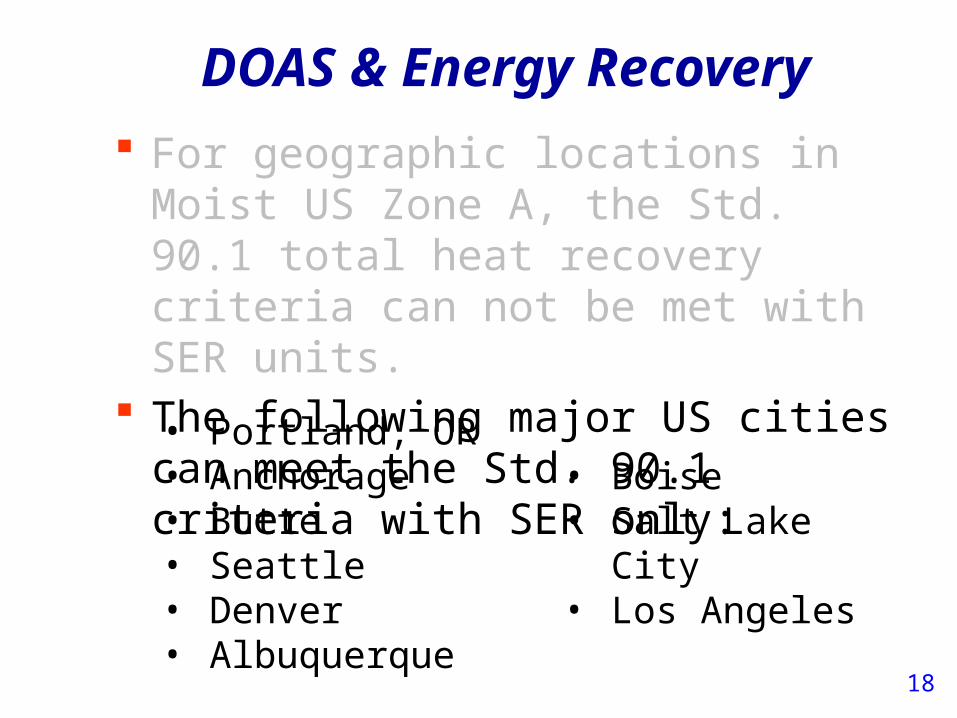
For geographic locations in Moist US Zone A, the Std. 90.1 total heat recovery criteria can not be met with SER units.
The following major US cities can meet the Std. 90.1 criteria with SER only:
DOAS & Energy Recovery
• Portland, OR• Anchorage• Butte• Seattle• Denver• Albuquerque
• Boise• Salt Lake City• Los Angeles
19
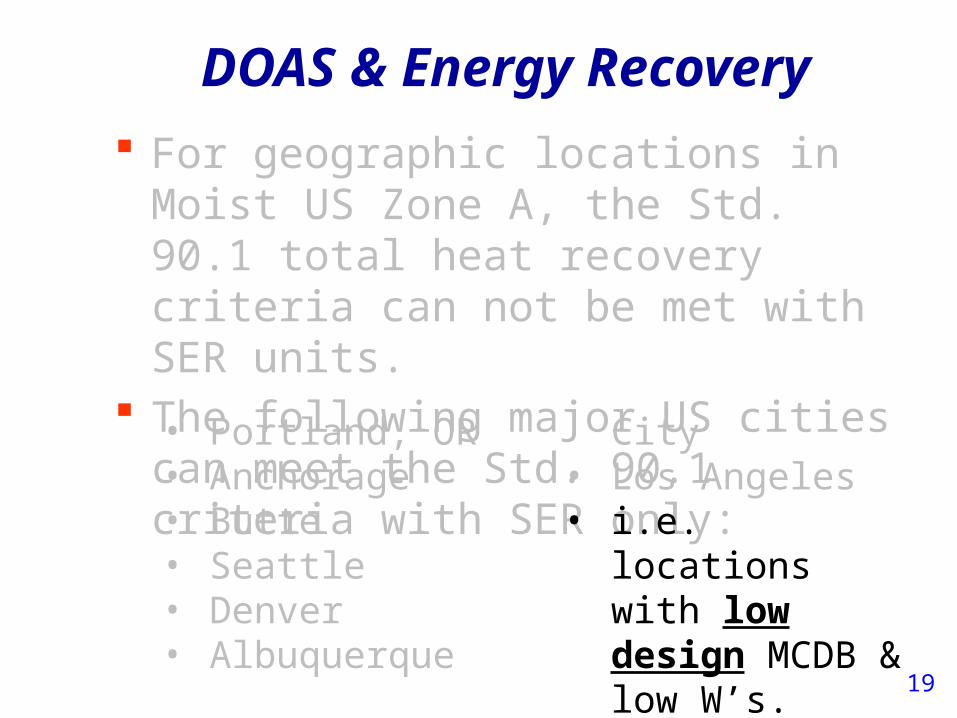
For geographic locations in Moist US Zone A, the Std. 90.1 total heat recovery criteria can not be met with SER units.
The following major US cities can meet the Std. 90.1 criteria with SER only:
DOAS & Energy Recovery
• Portland, OR• Anchorage• Butte• Seattle• Denver• Albuquerque
• Boise
• Salt Lake City• Los Angeles• i.e. locations with
low design MCDB & low W’s.
20
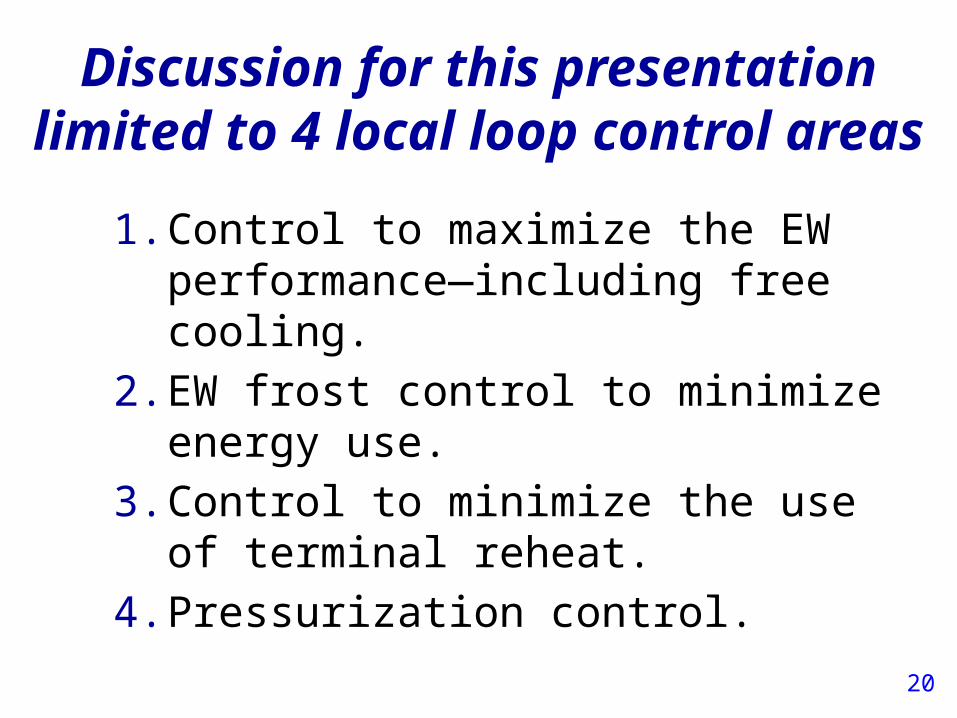
Discussion for this presentation limited to 4 local
loop control areas1. Control to maximize the EW performance—including free cooling.
2. EW frost control to minimize energy use.
3. Control to minimize the use of terminal reheat.
4. Pressurization control.
21
1. Controls to maximize the EW performance—including free cooling.
22
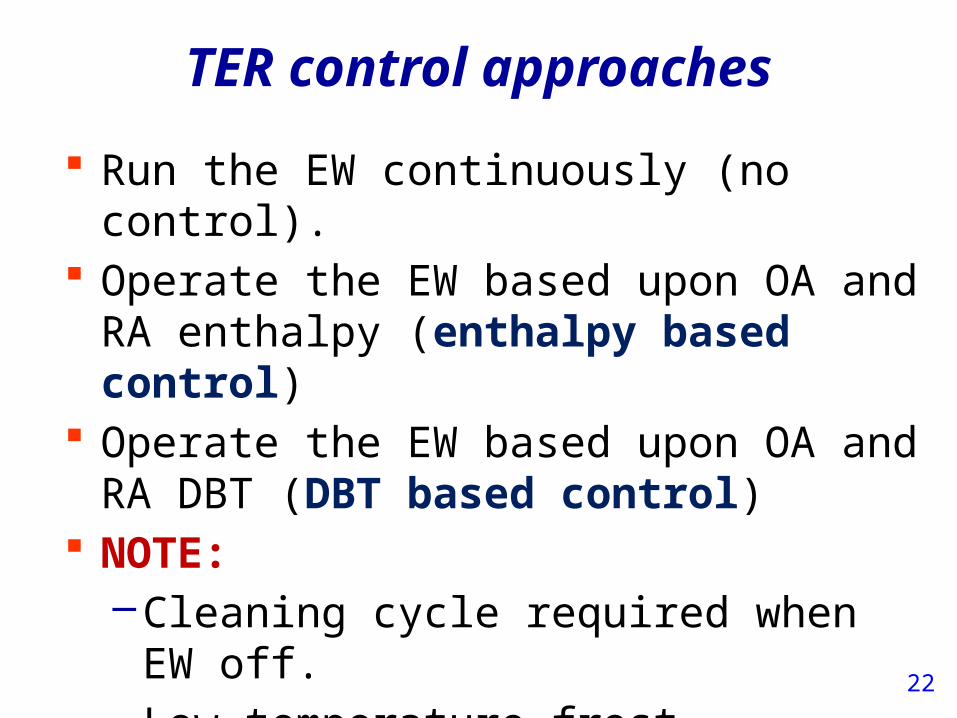
TER control approaches Run the EW continuously (no control).
Operate the EW based upon OA and
RA enthalpy (enthalpy based control)
Operate the EW based upon OA and RA DBT (DBT based control)
NOTE: –Cleaning cycle required when EW
off.–Low temperature frost protection
control important!
23
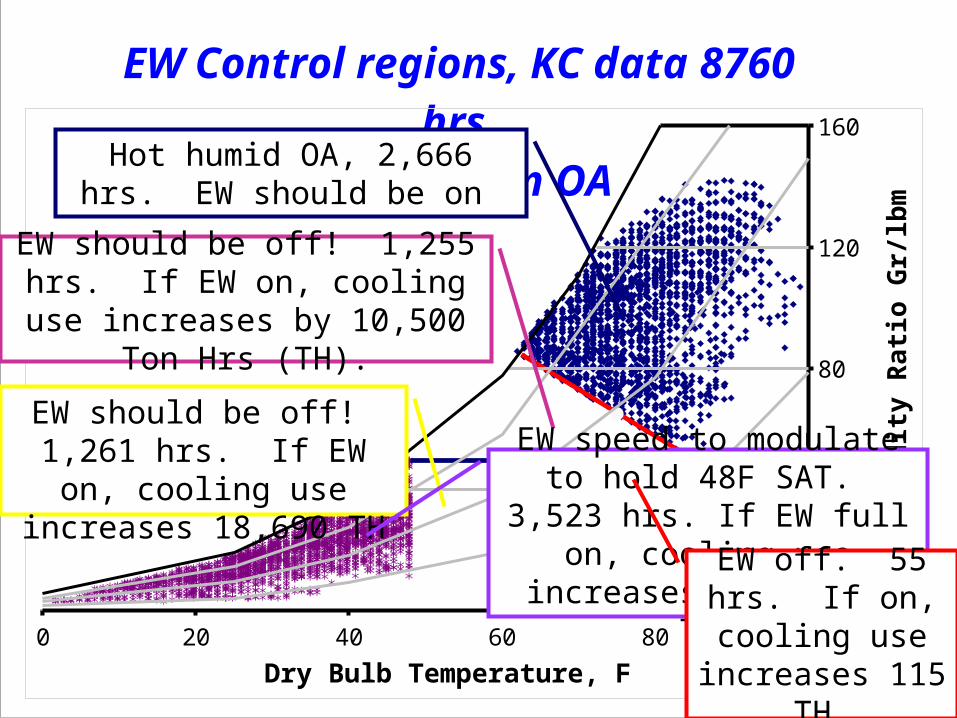
EW Control regions, KC data 8760 hrs.
10,000 scfm OA
0 20 40 60 80 1000
40
80
120
160
Dry Bulb Temperature, F
W, H
umid
ity R
atio
Gr/
lbm
Hot humid OA, 2,666 hrs. EW should be on
EW should be off! 1,255 hrs. If EW on, cooling use increases by
10,500 Ton Hrs (TH).
EW should be off! 1,261 hrs. If EW on, cooling use
increases 18,690 TH EW speed to modulate to hold 48F SAT. 3,523 hrs. If
EW full on, cooling use increases by 45,755 TH EW off. 55 hrs.
If on, cooling use increases 115
TH.
24
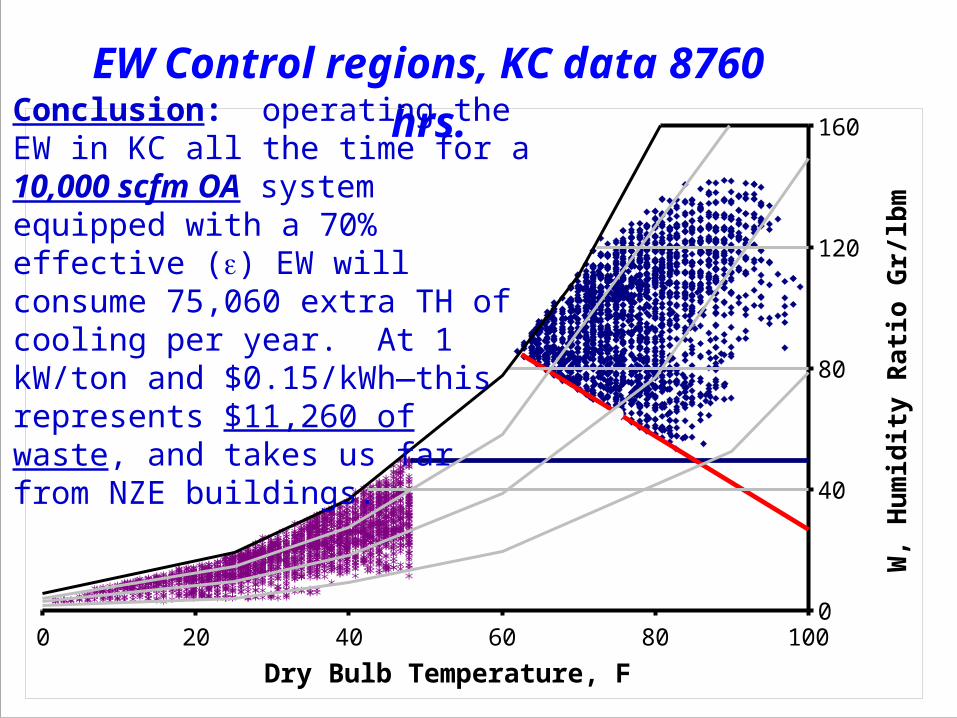
EW Control regions, KC data 8760 hrs.
0 20 40 60 80 1000
40
80
120
160
Dry Bulb Temperature, F
W, H
umid
ity R
atio
Gr/
lbm
Conclusion: operating the EW in KC all the time for a 10,000 scfm OA system equipped with a 70% effective (e) EW will consume 75,060 extra TH of cooling per year. At 1 kW/ton and $0.15/kWh—this represents $11,260 of waste, and takes us far from NZE buildings.
25
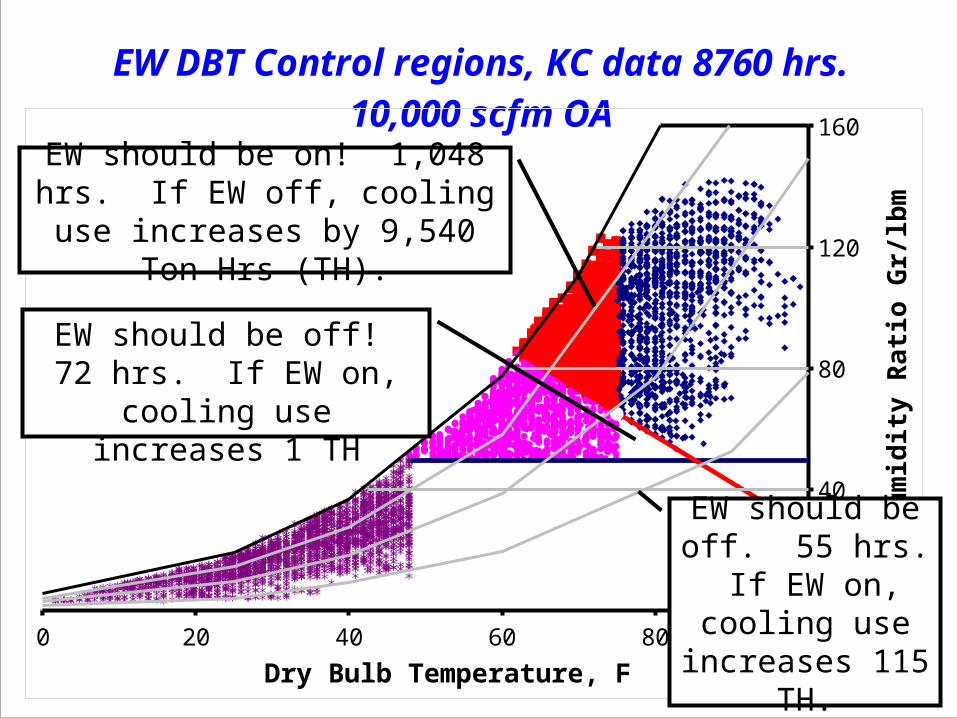
EW DBT Control regions, KC data 8760 hrs.
10,000 scfm OA
0 20 40 60 80 1000
40
80
120
160
Dry Bulb Temperature, F
W, H
umid
ity R
atio
Gr/
lbm
EW should be off! 72 hrs. If EW on, cooling use
increases 1 TH
EW should be off. 55 hrs. If EW on, cooling use increases 115
TH.
EW should be on! 1,048 hrs. If EW off, cooling use increases by
9,540 Ton Hrs (TH).
26
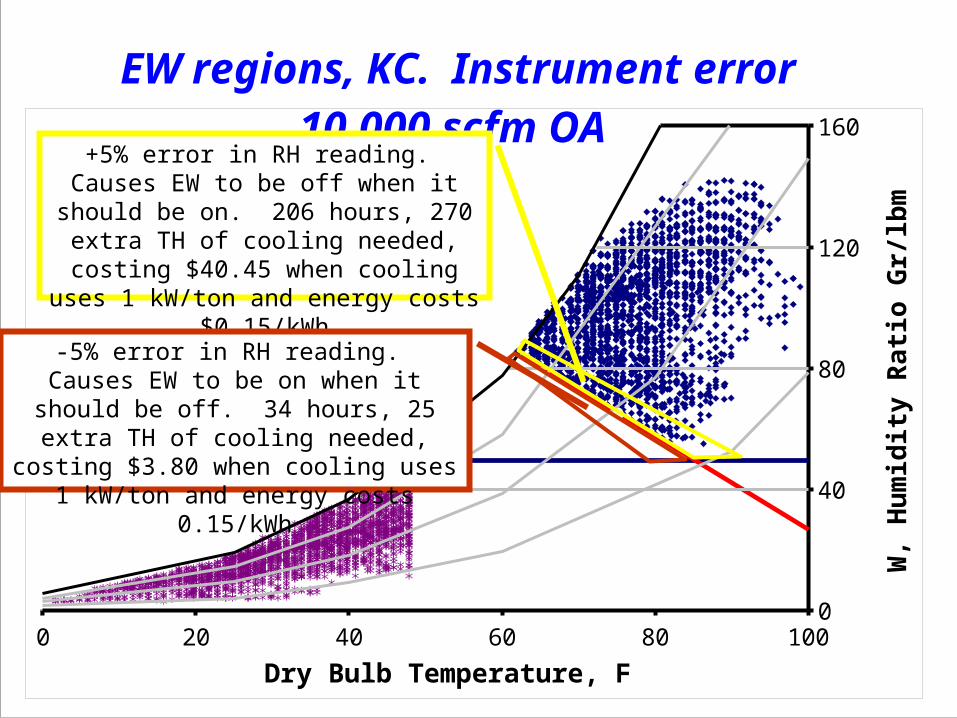
EW regions, KC. Instrument error
10,000 scfm OA
0 20 40 60 80 1000
40
80
120
160
Dry Bulb Temperature, F
W, H
umid
ity R
atio
Gr/
lbm
+5% error in RH reading. Causes EW to be off when it should be on. 206
hours, 270 extra TH of cooling needed, costing $40.45 when cooling uses 1 kW/ton and energy costs $0.15/kWh
-5% error in RH reading. Causes EW to be on when it should be off. 34 hours, 25 extra TH of cooling needed, costing $3.80 when cooling uses 1 kW/ton and energy
costs 0.15/kWh
27
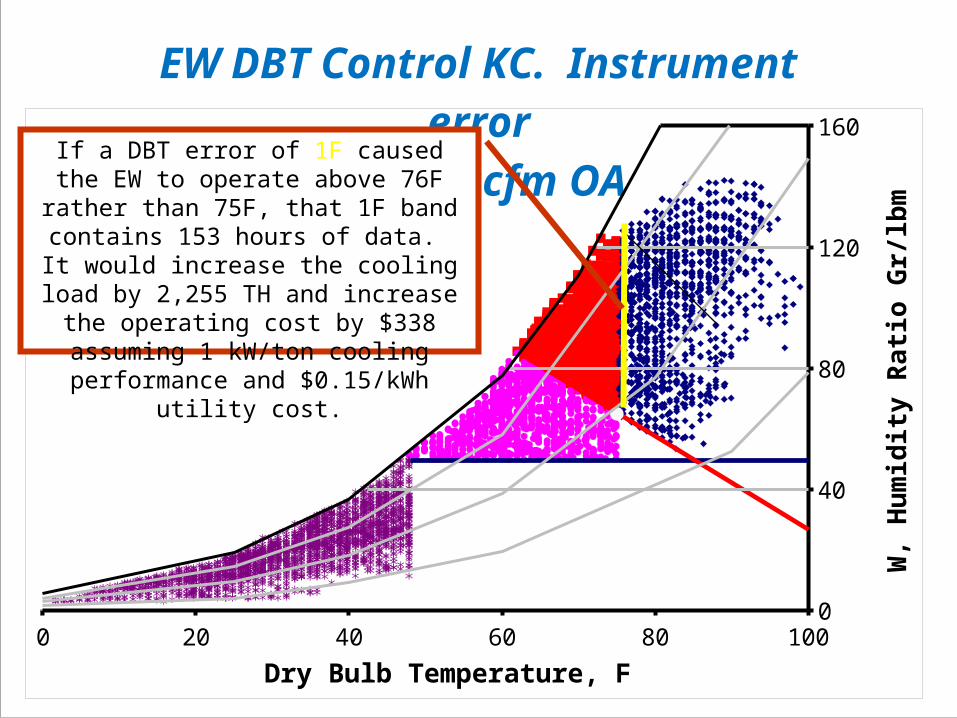
EW DBT Control KC. In-strument error
10,000 scfm OA
0 20 40 60 80 1000
40
80
120
160
Dry Bulb Temperature, F
W, H
umid
ity R
atio
Gr/
lbm
If a DBT error of 1F caused the EW to operate above 76F rather than 75F, that 1F band contains 153 hours of data. It
would increase the cooling load by 2,255 TH and increase the operating cost by
$338 assuming 1 kW/ton cooling performance and $0.15/kWh utility cost.
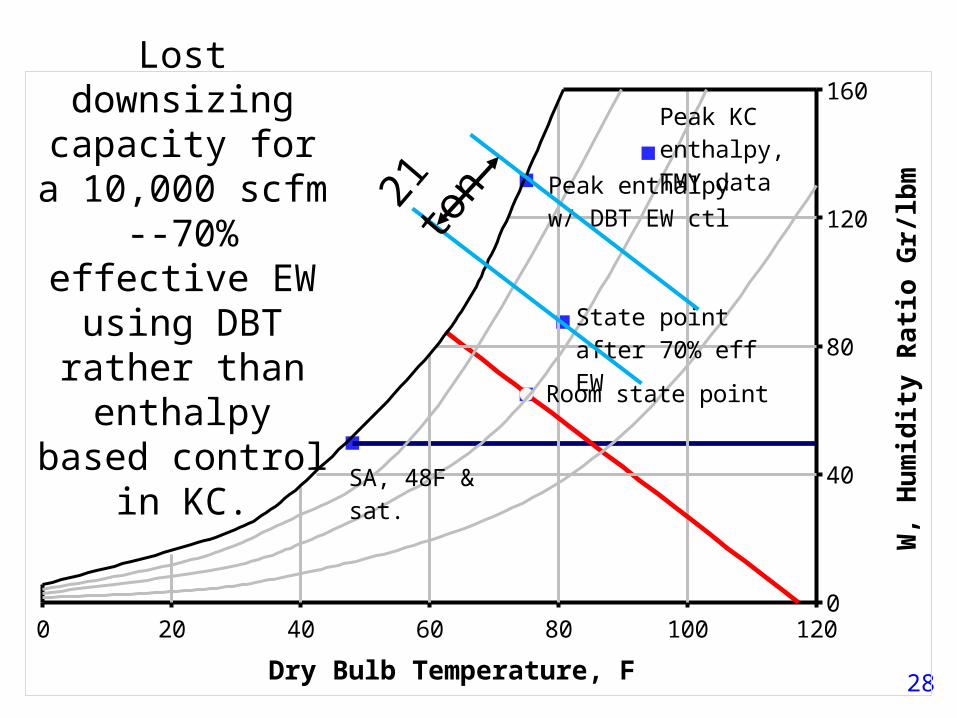
28
0 20 40 60 80 100 1200
40
80
120
160
Dry Bulb Temperature, F
W, H
umid
ity R
atio
Gr/
lbm
Peak KC enthalpy,TMY data
Peak enthalpyw/ DBT EW ctl
State pointafter 70% eff EW
Room state point
SA, 48F & sat.
Lost downsizing capacity for a 10,000 scfm --
70% effective EW using DBT rather
than enthalpy based control in
KC.21
ton
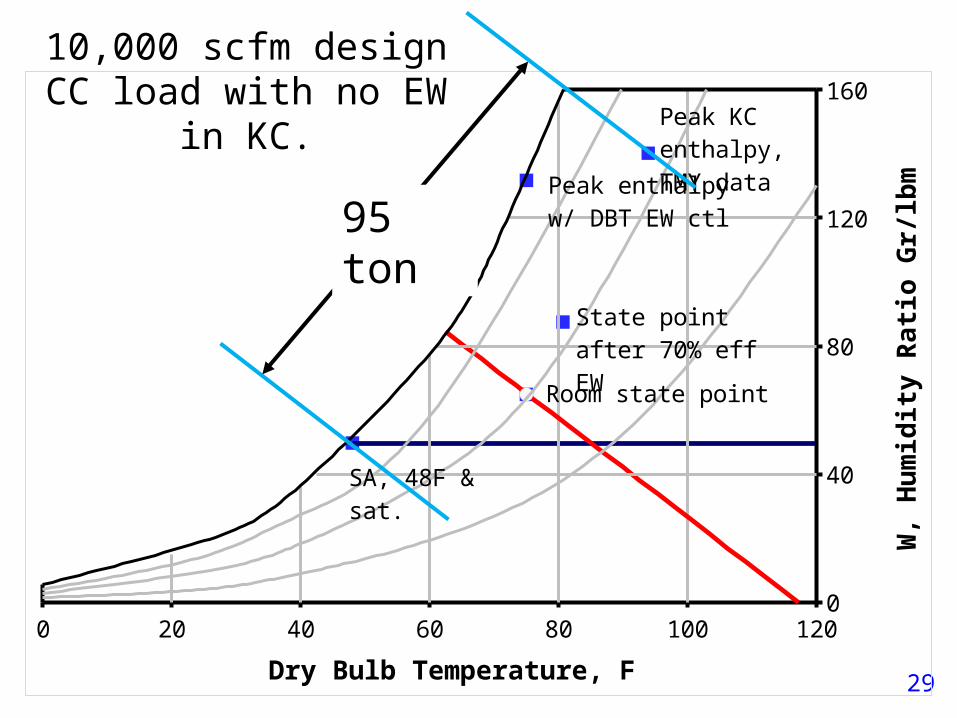
29
0 20 40 60 80 100 1200
40
80
120
160
Dry Bulb Temperature, F
W, H
umid
ity R
atio
Gr/
lbm
Peak KC enthalpy,TMY data
Peak enthalpyw/ DBT EW ctl
State pointafter 70% eff EW
Room state point
SA, 48F & sat.
10,000 scfm design CC load with no EW in KC.
95 ton
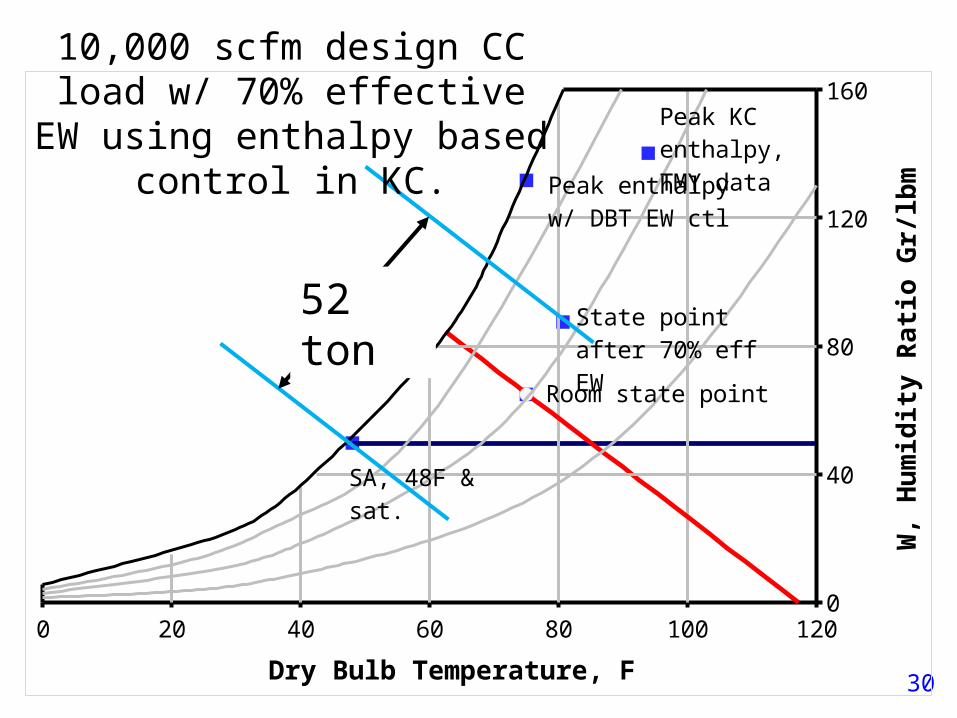
30
0 20 40 60 80 100 1200
40
80
120
160
Dry Bulb Temperature, F
W, H
umid
ity R
atio
Gr/
lbm
Peak KC enthalpy,TMY data
Peak enthalpyw/ DBT EW ctl
State pointafter 70% eff EW
Room state point
SA, 48F & sat.
10,000 scfm design CC load w/ 70% effective EW using
enthalpy based control in KC.
52 ton
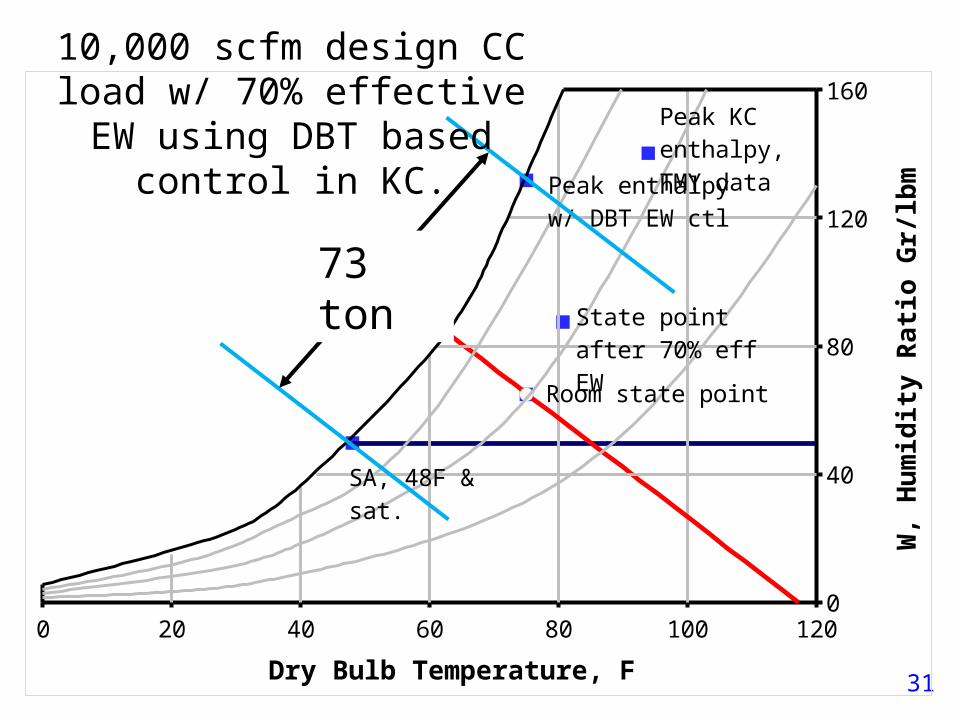
31
0 20 40 60 80 100 1200
40
80
120
160
Dry Bulb Temperature, F
W, H
umid
ity R
atio
Gr/
lbm
Peak KC enthalpy,TMY data
Peak enthalpyw/ DBT EW ctl
State pointafter 70% eff EW
Room state point
SA, 48F & sat.
10,000 scfm design CC load w/ 70% effective EW using DBT
based control in KC.
73 ton
32
Maximize DOAS free cooling,w/ proper EW control,when hydronic terminal equipment used.
33
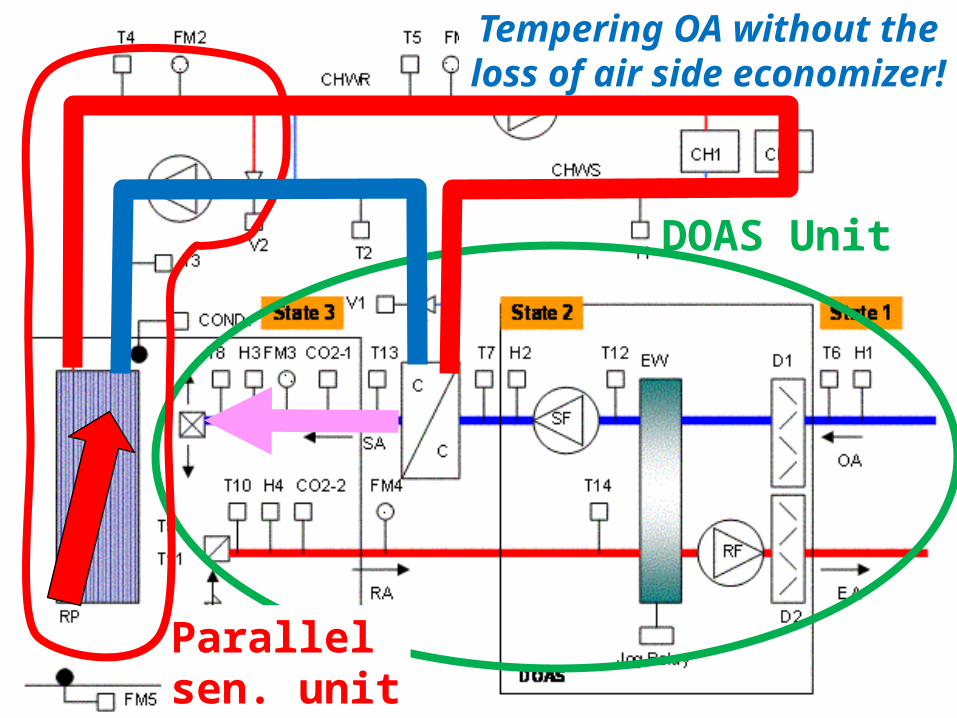
DOAS Unit
Parallel sen. unit
Tempering OA without the loss of air side
economizer!
34
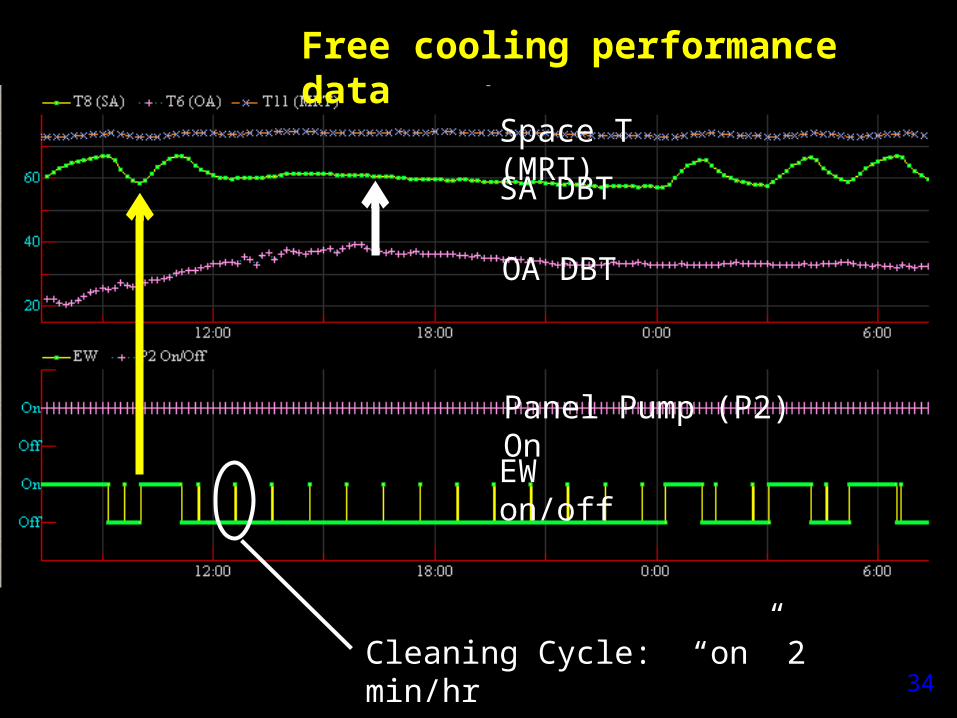
Midnight
Space T (MRT)
SA DBT
OA DBT
Panel Pump (P2) On
EW on/off
Free cooling performance data
Cleaning Cycle: “on” 2 min/hr
35
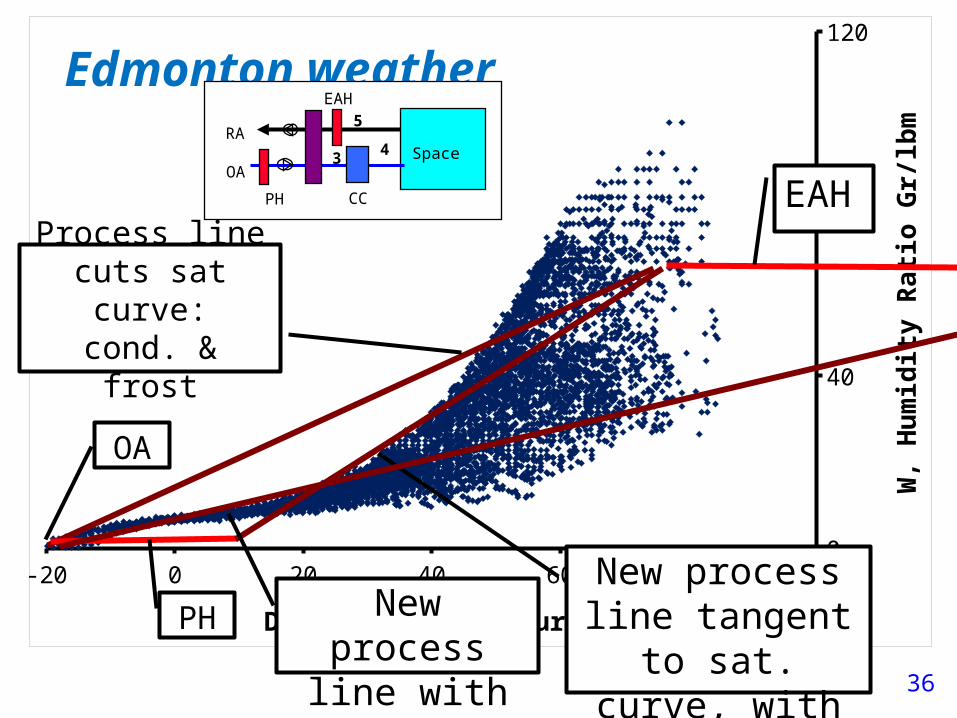
2. EW wheel frost control to minimize energy use.
36
-20 0 20 40 60 80 1000
40
80
120
Edmonton weather
Dry Bulb Temperature, F
W, H
umid
ity R
atio
Gr/
lbm
OA
Process line cuts sat curve:
cond. & frost
New process line tangent to sat. curve, with PH.
EAH
New process line with EAH
PH
OA
RA3 4
5
PH CC
Space
EAH
37
Reduced wheel speed:Another EW frost prevention
control. Very negative capacity consequences
when heat recovery most needed (at -10F, wheel speed drops to 2 rpm to prevent frosting), capacity reduced by >40%.
Suggest avoiding this approach to frost control.
38
3. Control to minimize the use of terminal reheat.
39
Limit terminal reheat energy use Reheat of minimum OA is permitted by
Std. 90.1. Very common in VAV systems.
Two methods used w/ DOAS to limit terminal reheat for time varying occupancy:1. DOAS SA DBT elevated to ~70F.
Generally wastes energy and increases first cost for the parallel terminal sensible cooling equip. (not recommended!)
2. Best way to achieve limited terminal reheat is DCV. (saves H/C energy, fan energy, TER eff) CO2 based Occupancy sensors
40
4. Pressurization control.
41
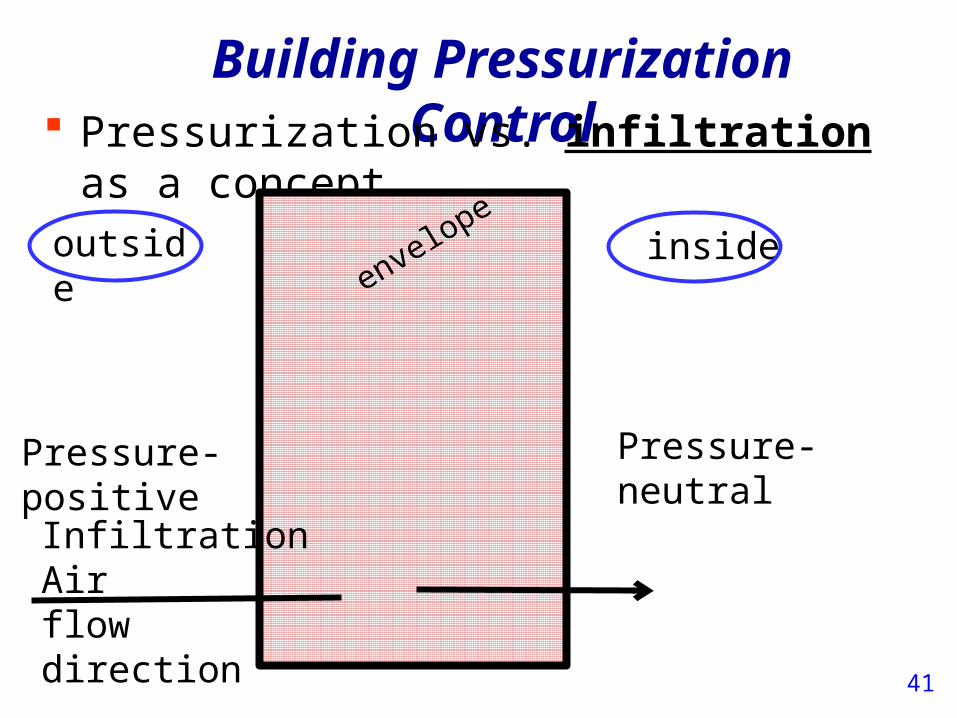
Building Pressurization Control Pressurization vs. infiltration as a
concept.outside inside
Pressure-positive Pressure-neutral
Infiltration Airflow direction
envelope
42
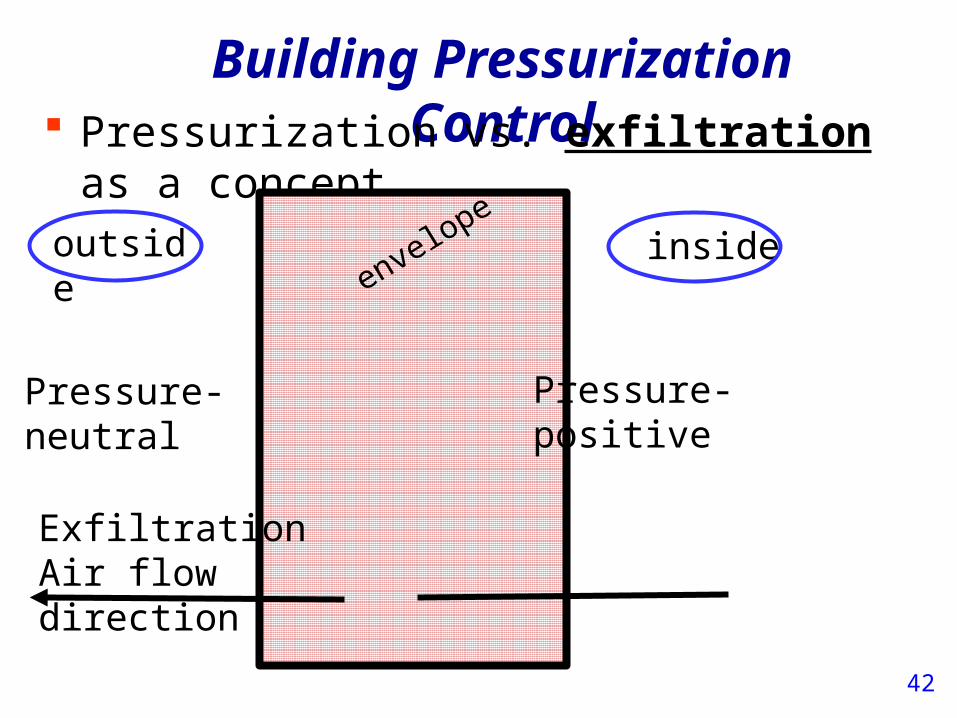
Building Pressurization Control Pressurization vs. exfiltration as a
concept.outside inside
Pressure-positivePressure-neutral
Exfiltration Air flow direction
envelope
43
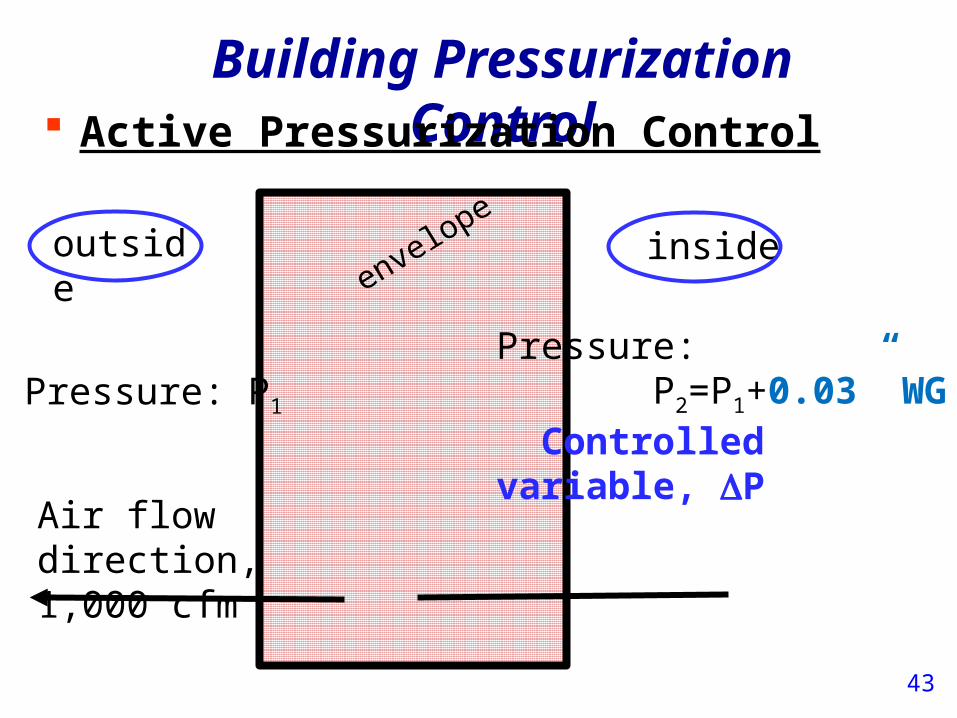
Building Pressurization Control Active Pressurization Control
outside inside
Pressure: P2=P1+0.03” WG Controlled variable, DP
Pressure: P1
Air flow direction, 1,000 cfm
envelope
44
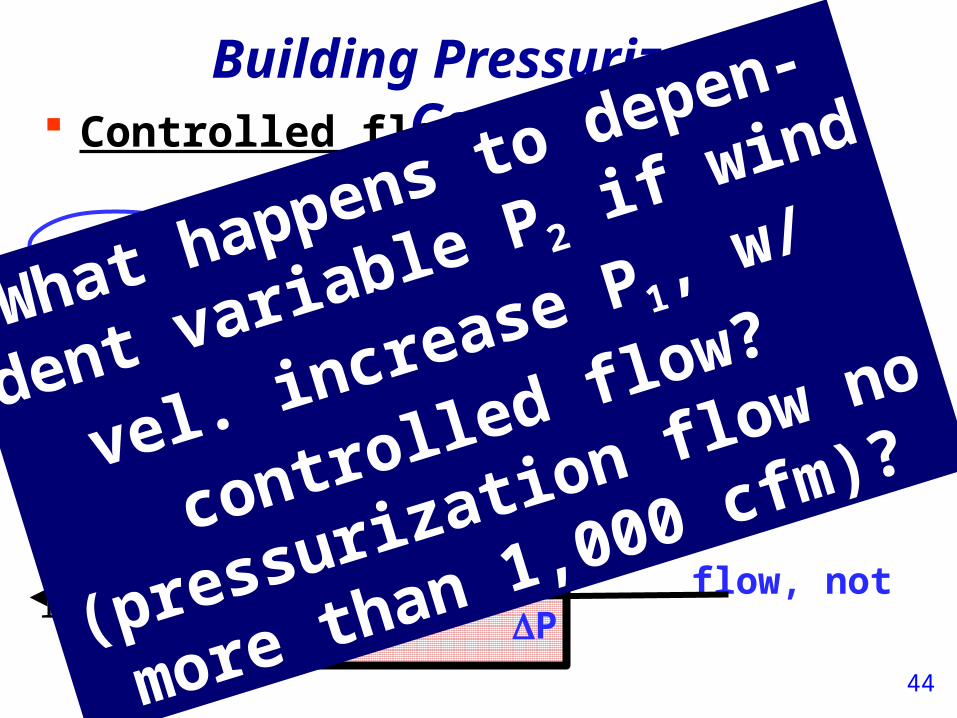
Building Pressurization Control Controlled flow pressuration.
outside inside
Pressure: P2 > P1
Controlled variable: flow, not DP
Pressure: P1
Air flow direction, 1,000 cfm
envelope
What happens to depen-
dent variable P2 if wind
vel. increase P1, w/
controlled flow?
(pressurization flow no
more than 1,000 cfm)?
45
Building Pressurization Control Active Pressurization Control
– Conclusion: It is highly recommended that building pressurization be flow based, not differential pressure based!
46
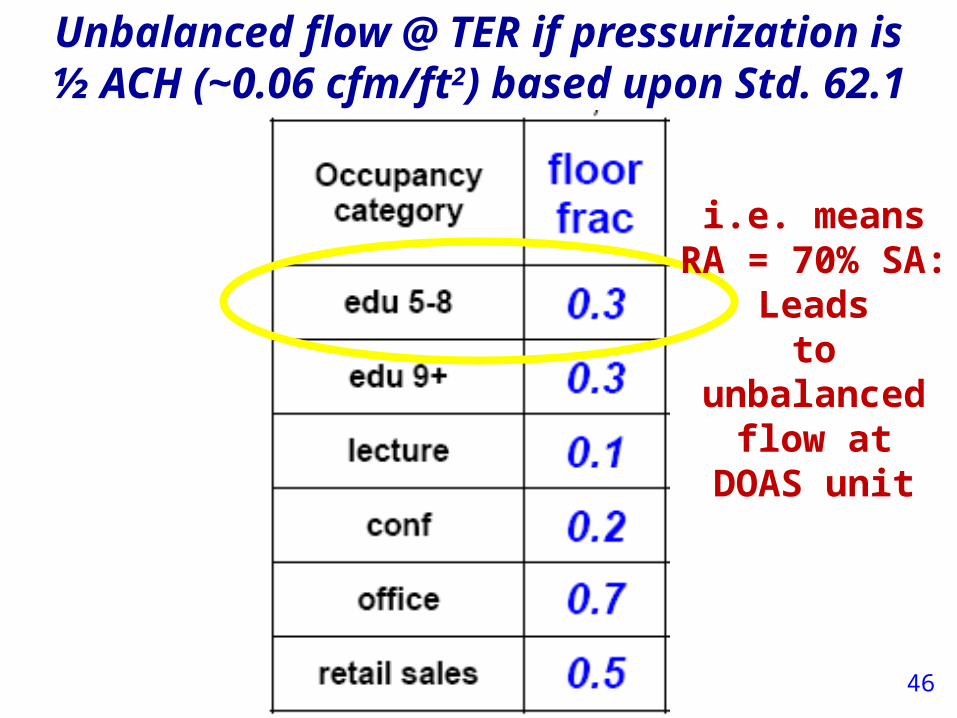
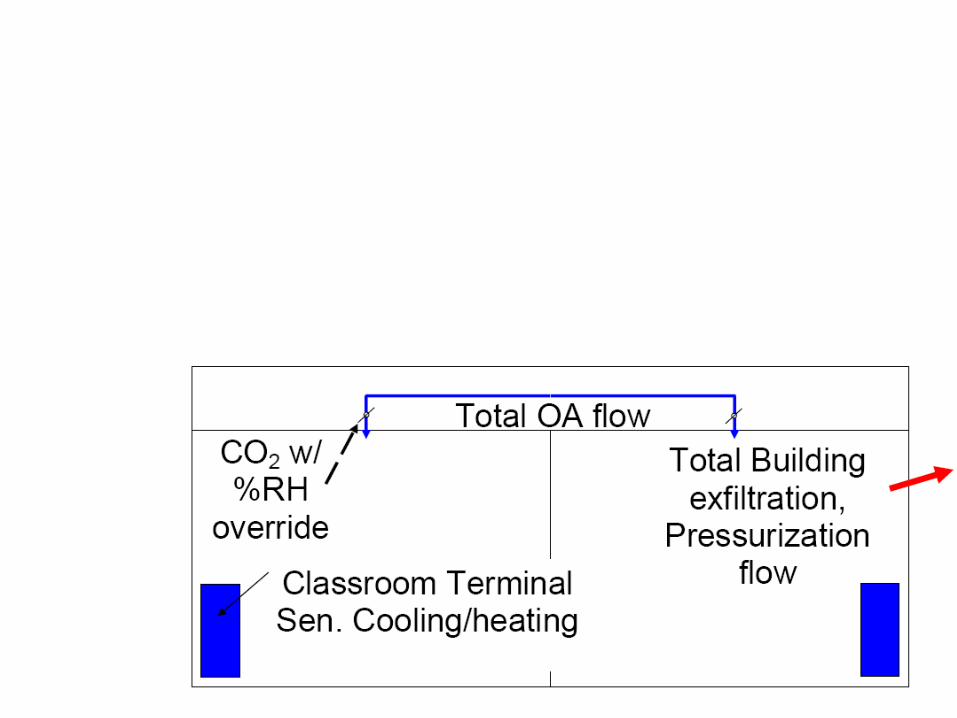
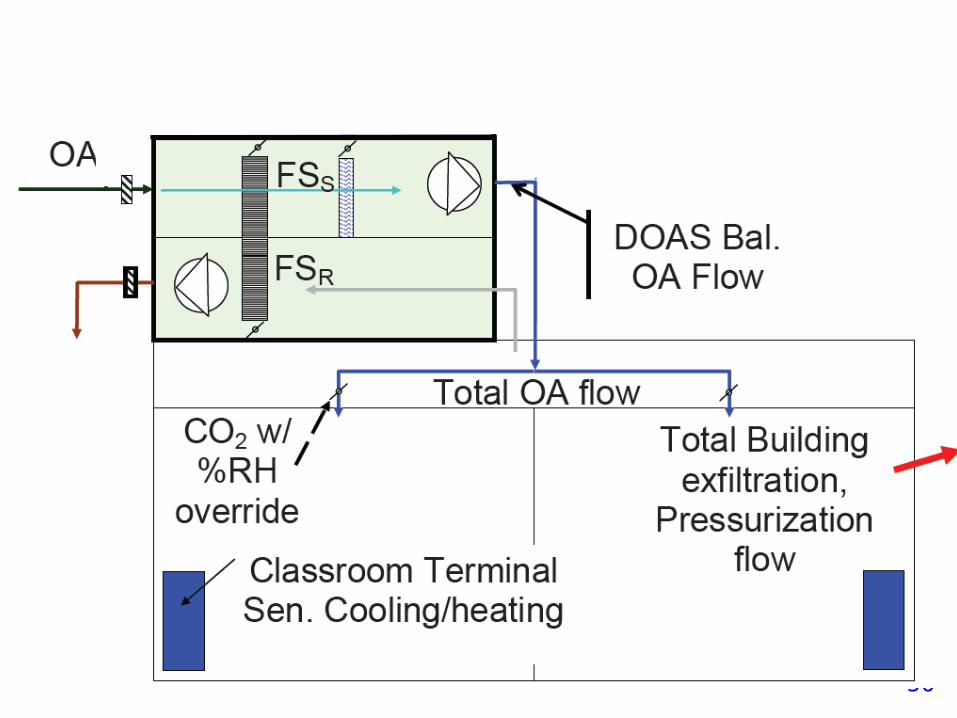
Unbalanced flow @ TER if pressurization is
½ ACH (~0.06 cfm/ft2) based upon Std. 62.1
i.e. meansRA = 70% SA:
Leadsto unbalanced
flow atDOAS unit
47
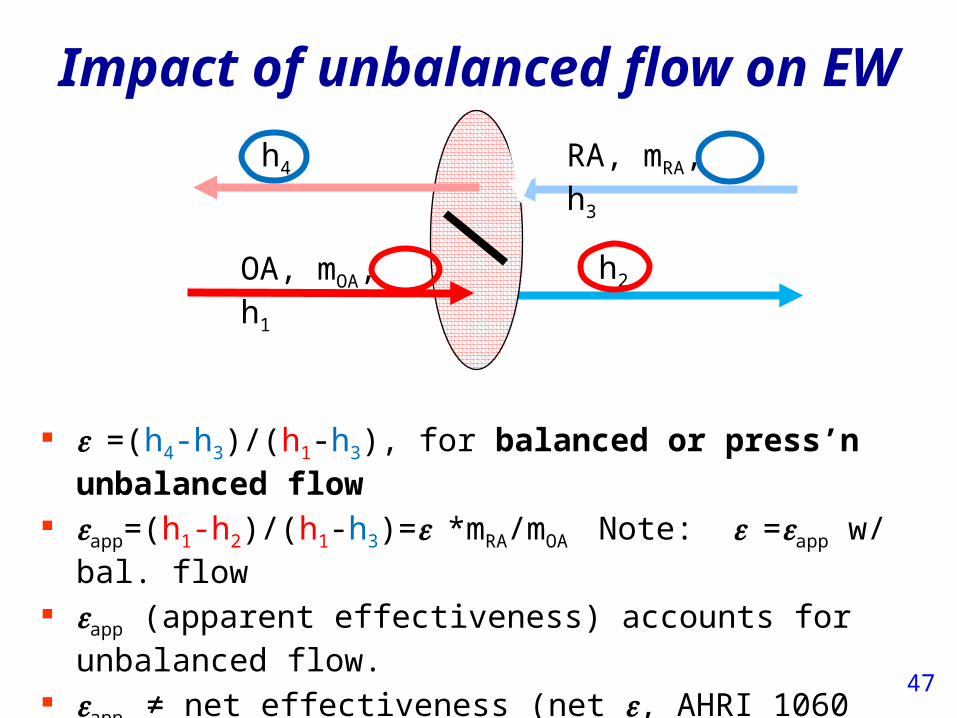
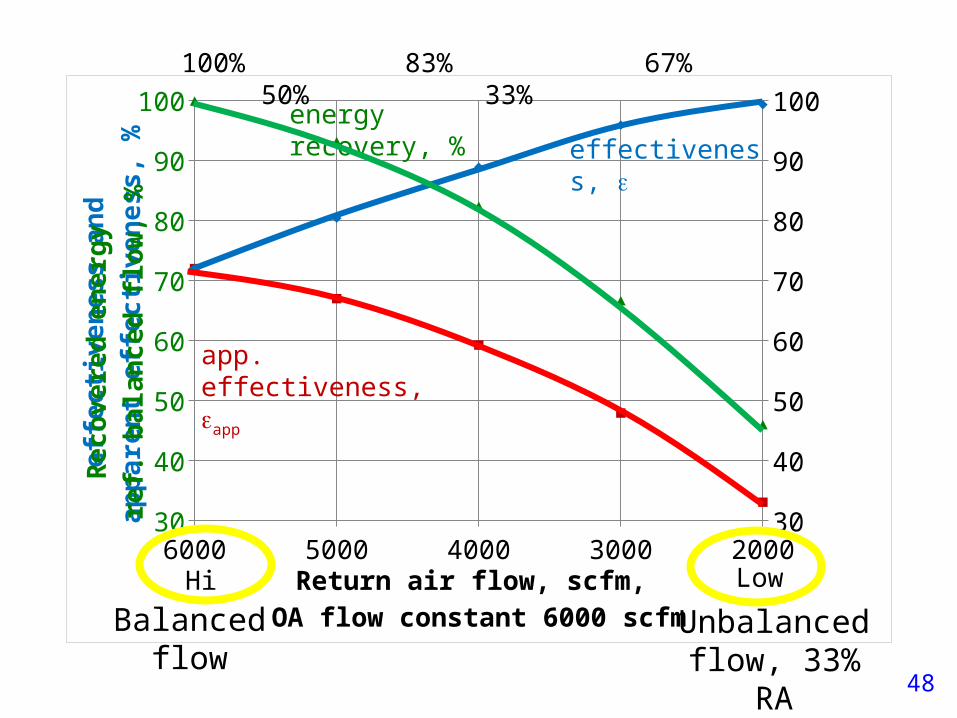
Impact of unbalanced flow on EW
e =(h4-h3)/(h1-h3), for balanced or press’n unbalanced flow
eapp=(h1-h2)/(h1-h3)=e *mRA/mOA Note: e =eapp w/ bal. flow
eapp (apparent effectiveness) accounts for unbalanced flow.
eapp ≠ net effectiveness (net e, AHRI 1060 rating parameter)
net e accounts for leakage between the RA (exh.) and OA
OA, mOA, h1
h4
h2
RA, mRA, h3
48
2000300040005000600030
40
50
60
70
80
90
100
30
40
50
60
70
80
90
100
Return air flow, scfm, OA flow constant 6000 scfm
effe
ctiv
enes
s an
d ap
pare
nt e
ffect
iven
ess,
%R
ecov
ered
ene
rgy
ref.
bala
nced
flow
, %effectiveness, e
app. effectiveness, eapp
energy recovery, %
Hi Low
100% 83% 67% 50% 33%
Balanced flow
Unbalanced flow, 33% RA
49
50
51
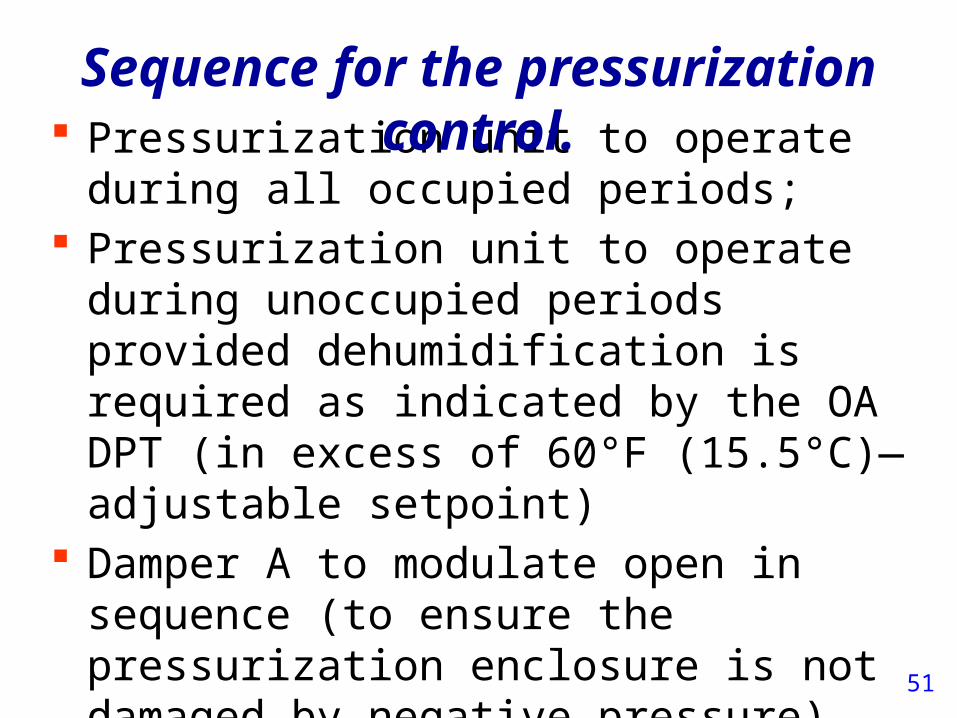
Pressurization unit to operate during all occupied periods;
Pressurization unit to operate during unoccupied periods provided dehumidification is required as indicated by the OA DPT (in excess of 60°F (15.5°C)—adjustable setpoint)
Damper A to modulate open in sequence (to ensure the pressurization enclosure is not damaged by negative pressure) with the fan when the system is to operate.
Sequence for the pressurization control.
52
Sequence for the pressurization control. When the pressurization air fan is to
operate, setpoint (adjustable but initially set to the floor component of Standard 62.1) shall be maintained with a VFD based upon the flow station (FSP). Setpoint adjustable to accom-modate seasonal changes, & unforeseen pressurization or reserve capacity needs;
When pressurization unit is to operate, the CC shall cool the air to setpoint (adjustable, but initially set at 48°F [9°C] DBT) provided the OA DPT >48°F (9°C);
53
Sequence for the pressurization control. When pressurization unit is to operate
and the OA DPT <48°F (9°C), the CC shall cool the air only as required to handle the space sensible load in cooperation with the DOAS; and
When pressurization unit is to operate and cooling is not required, fully open the CC bypass damper. Otherwise, the damper is to be fully closed.
54
Conclusions, Fortunately, DOAS controls are simpler
than VAV control systems. Unfortunately, they require a different
paradigm—something the industry is just coming up to speed on.
A properly designed and controlled DOAS will reduce:– Energy use/demand, – First cost, – Humidity problems and related IEQ issues– Ventilation compliance uncertainty.

55
QUESTIONS