Embed Size (px)
Citation preview
Unclassified ECO/WKP(2017)5 Organisation de Coopération et de Développement Économiques Organisation for Economic Co-operation and Development 24-Jan-2017
___________________________________________________________________________________________
_____________ English - Or. English ECONOMICS DEPARTMENT
DECOUPLING OF WAGES FROM PRODUCTIVITY: MACRO-LEVEL FACTS
ECONOMICS DEPARTMENT WORKING PAPERS No. 1373
By Cyrille Schwellnus, Andreas Kappeler and Pierre-Alain Pionnier
OECD Working Papers should not be reported as representing the official views of the OECD or of its member
countries. The opinions expressed and arguments employed are those of the author(s).
Authorised for publication by Christian Kastrop, Director, Policy Studies Branch, Economics Department.
All Economics Department Working Papers are available at www.oecd.org/eco/workingpapers.
JT03408096
Complete document available on OLIS in its original format
This document and any map included herein are without prejudice to the status of or sovereignty over any territory, to the delimitation of
international frontiers and boundaries and to the name of any territory, city or area.
EC
O/W
KP
(20
17)5
Un
classified
En
glish
- Or. E
ng
lish
ECO/WKP(2017)5
2
OECD Working Papers should not be reported as representing the official views of the OECD or of its member countries. The opinions expressed and arguments employed are those of the author(s). Working Papers describe preliminary results or research in progress by the author(s) and are published to stimulate discussion on a broad range of issues on which the OECD works. Comments on Working Papers are welcomed, and may be sent to OECD Economics Department, 2 rue André Pascal, 75775 Paris Cedex 16, France, or by e-mail to [email protected]. All Economics Department Working Papers are available at www.oecd.org/eco/workingpapers. This document and any map included herein are without prejudice to the status of or sovereignty over any territory, to the delimitation of international frontiers and boundaries and to the name of any territory, city or area. The statistical data for Israel are supplied by and under the responsibility of the relevant Israeli authorities. The use of such data by the OECD is without prejudice to the status of the Golan Heights, East Jerusalem and Israeli settlements in the West Bank under the terms of international law. Latvia was not an OECD Member at the time of preparation of this publication. Accordingly, Latvia does not appear in the list of OECD Members and is not included in the zone aggregates.
© OECD (2017)
You can copy, download or print OECD content for your own use, and you can include excerpts from OECD publications, databases and multimedia products in your own documents, presentations, blogs, websites and teaching materials, provided that suitable acknowledgment of OECD as source and copyright owner is given. All requests for commercial use and translation rights should be submitted to [email protected]
ECO/WKP(2017)5
3
Abstract/Résumé
Decoupling of wages from productivity: Macro-level facts
Over the past two decades, aggregate labour productivity growth in most OECD countries has decoupled
from real median compensation growth, implying that raising productivity is no longer sufficient to raise
real wages for the typical worker. This paper provides a quantitative description of decoupling in OECD
countries over the past two decades, with the results suggesting that it is explained by declines in both
labour shares and the ratio of median to average wages (a partial measure of wage inequality). Labour
shares have declined in about two thirds of the OECD countries covered by the analysis. However, the
contribution of labour shares to decoupling is smaller if sectors are excluded for which labour shares are
driven by changes in commodity and asset prices or for which labour shares are driven by imputation
choices (primary, housing and non-market sectors). The ratio of median to average wages has declined in
all but two of the OECD countries covered by the analysis and appears to reflect disproportionate wage
growth at the very top of the wage distribution rather than stagnating median wages. The causes for these
developments will be analysed in follow-up research.
JEL classification codes: D3, E24, E25.
Keywords: productivity, labour share, wage inequality.
*****
Découplage des salaires et de la productivité : Les faits au niveau macroéconomique
Au cours des deux dernières décennies, la productivité du travail au niveau agrégé et la rémunération réelle
médiane du travail ont divergé dans la plupart des pays de l’OCDE, ce qui signifie que les gains de
productivité n’ont pas permis d’accroître la rémunération réelle du salarié médian. Cet article décrit
quantitativement ce phénomène de découplage au cours des vingt dernières années et suggère qu’il
s’explique à la fois par une baisse de la part de la rémunération dans la valeur ajoutée et du ratio entre le
salaire médian et le salaire moyen (une mesure partielle de l’inégalité salariale). La part de la rémunération
dans la valeur ajoutée a baissé dans les deux tiers des pays de l’OCDE pris en compte dans cette étude.
Néanmoins, sa contribution au phénomène de découplage est moindre si on exclut les secteurs pour
lesquels les évolutions de la part des rémunérations sont liées à des évolutions de prix d’actifs ou de
matières premières ou à des imputations (secteur primaire, secteur immobilier et secteurs non marchands).
Le ratio entre le salaire médian et le salaire moyen a baissé dans tous les pays de l’OCDE pris en compte
dans cette étude, sauf deux. Cette évolution est liée à une évolution hors normes des salaires tout en haut de
la distribution plutôt qu’à la stagnation du salaire médian. Des articles à venir analyseront plus en détail
l’origine de ces phénomènes.
Codes JEL : D3, E24, E25.
Mots-clés : productivité, partage de la valeur ajoutée, inégalité salariale.
ECO/WKP(2017)5
4
TABLE OF CONTENTS
1. Introduction .......................................................................................................................................... 5 2. Macro-level decoupling: Framework and definitions ........................................................................... 6
2.1. Framework ................................................................................................................................... 6 2.2. Definitions ................................................................................................................................... 8
3. The contribution of declining labour shares to decoupling .................................................................. 9 3.1. Gross or net labour shares? .......................................................................................................... 9 3.2. Total-economy labour shares or labour shares excluding the primary, housing and non-market
sectors? ...................................................................................................................................... 11 3.3. Pre- or post-crisis developments? .............................................................................................. 15 3.4. Manufacturing or services? ....................................................................................................... 16
4. The contribution of increasing wage inequality to decoupling ........................................................... 17 5. Conclusion .......................................................................................................................................... 19
REFERENCES .............................................................................................................................................. 20
ANNEX: SUPPLEMENTARY TECHNICAL MATERIAL ........................................................................ 22
1. Evolution of deflators ......................................................................................................................... 22 2. Imputation of compensation of the self-employed ............................................................................. 24 3. Gross versus net labour shares ............................................................................................................ 24 4. Share of housing in total value added ................................................................................................. 26
Tables
Table 1. Changes in labour shares ....................................................................................................... 15 Table A1.1. Real median compensation growth based on value added and consumption deflators ......... 23
Figures
Figure 1. Macro-level decoupling reflects declines in labour shares and increases in wage inequality . 7 Figure 2. Changes in gross and net labour shares ................................................................................. 10 Figure 3. The depreciation share has increased more in countries with large cyclical downturns ....... 11 Figure 4. Changes in the labour share with and without the primary, housing and non-market sectors ..... 13 Figure 5. Cumulated change in labour share excl. primary, housing and non-market sectors.............. 16 Figure 6. The contribution of manufacturing and services to labour share developments ................... 17 Figure 7. The ratio of median to average wages has declined in a wide range of OECD countries ..... 18 Figure 8. Wages of the top 1% of income earners have diverged from the average and the median ... 19 Figure A1.1. Real median compensation based on value added and consumption deflators (OECD
average) ................................................................................................................................. 22 Figure A2.1. Effect of the imputation method for compensation of the self-employed on labour shares .. 24 Figure A3.1. Association between the depreciation rate in volumes and share of ICT capital in volumes 25 Figure A3.2. Value added share of depreciation and share of ICT capital in total capital ......................... 25
Figure A3.3. ICT capital to total capital ratio ............................................................................................. 26
Figure A4.1. Change of ratio of housing to total gross value added ........................................................... 27
Boxes
Box 1. Have increased housing rents contributed to declines in labour shares? ........................................ 12
ECO/WKP(2017)5
5
DECOUPLING OF WAGES FROM PRODUCTIVITY GROWTH: MACRO-LEVEL FACTS
By Cyrille Schwellnus, Andreas Kappeler and Pierre-Alain Pionnier1
1. Introduction
1. In the long run, raising productivity is the only way to raise living standards, with real wages
being the most direct mechanism through which the benefits of productivity growth are transferred to
workers. Over the past two decades, however, aggregate labour productivity growth in most OECD
countries has decoupled from real median compensation growth.2 Raising productivity no longer appears to
be sufficient to raise real wages for the typical worker, suggesting that there is a role for public policies to
support a broader sharing of the benefits of productivity gains in the economy.
2. Public policies can impact the sharing of productivity gains in the economy by influencing the
distribution of income between capital and labour, and by affecting the distribution of labour income
across workers. This paper is the first stage of a research project analysing the extent and the causes of
decoupling of wages from productivity growth in OECD countries over the past two decades. It analyses
whether developments at the macro level mainly reflect changes in labour shares or changes in wage
inequality and assesses whether labour share and wage inequality developments are mainly related to
changes in public policies or to longer-term structural changes.
3. The main results are as follows:
For the analysed OECD countries as a whole, total-economy decoupling over the period 1995-
2014 is explained by declines in total-economy labour shares and also by declines in the ratio of
median to average wages (a partial measure of wage inequality).
For the analysed OECD countries as a whole, labour share declines over the period 1995-2014
are fully accounted for by pre-2005 developments.
Excluding sectors for which labour shares are driven by changes in commodity and asset prices
or for which labour shares are driven by imputation choices (primary, housing and non-market
sectors) lessens the contribution of labour shares to decoupling.
In a number of countries, declines in total-economy labour shares reflect increases in housing
rents, which are related to increases in house prices. For commodity-producing countries,
declines in total-economy labour shares largely reflect increases in commodity rents. These are,
in turn, related to price increases on global markets on which national policies have limited
leverage.
1 . Cyrille Schwellnus and Andreas Kappeler are members of the Economics Department of the OECD.
Pierre-Alain Pionnier is member of the Statistics Directorate of the OECD. The authors would like to thank
Andrea Bassanini and Alexander Hijzen (from the Directorate for Employment, Labour and Social
Affairs), Orsetta Causa, Antoine Goujard, Mikkel Hermansen, Yosuke Jin, Christine Lewis, Catherine L.
Mann, Giuseppe Nicoletti, Rory O’Farrell, Nicolas Ruiz, Jean-Luc Schneider (from the Economics
Department) and Paul Schreyer and Peter van de Ven (from the Statistics Directorate) for helpful
discussions and suggestions. The support of Sarah Michelson (also from the Economics Department) in
putting together the document is gratefully acknowledged.
2. Real compensation growth is based on the value added deflator.
ECO/WKP(2017)5
6
While labour shares have declined significantly in about two thirds of the analysed OECD
countries, all but two countries have experienced significant declines in the ratio of median to
average wages over the past two decades.
The increase in wage inequality as measured by the decoupling of median from average wage
growth appears to reflect disproportionate wage growth at the very top of the wage distribution.
While wage growth at the top 10 percentile of the wage distribution has been similar to growth at
the median, average wage growth for the top 1% has exceeded growth at the median by a
multiple.
4. The remainder of the paper is organised as follows. Section 2 describes the conceptual
framework for decomposing macro-level decoupling into labour share and wage inequality developments,
and provides descriptive evidence for the analysed OECD countries as a whole. Section 3 investigates the
role of the primary, housing, and non-market sectors as well as capital stock depreciation in total-economy
labour share developments. Section 4 analyses the role of disproportionate wage growth of top earners for
wage inequality developments and Section 5 concludes.
2. Macro-level decoupling: Framework and definitions
2.1. Framework
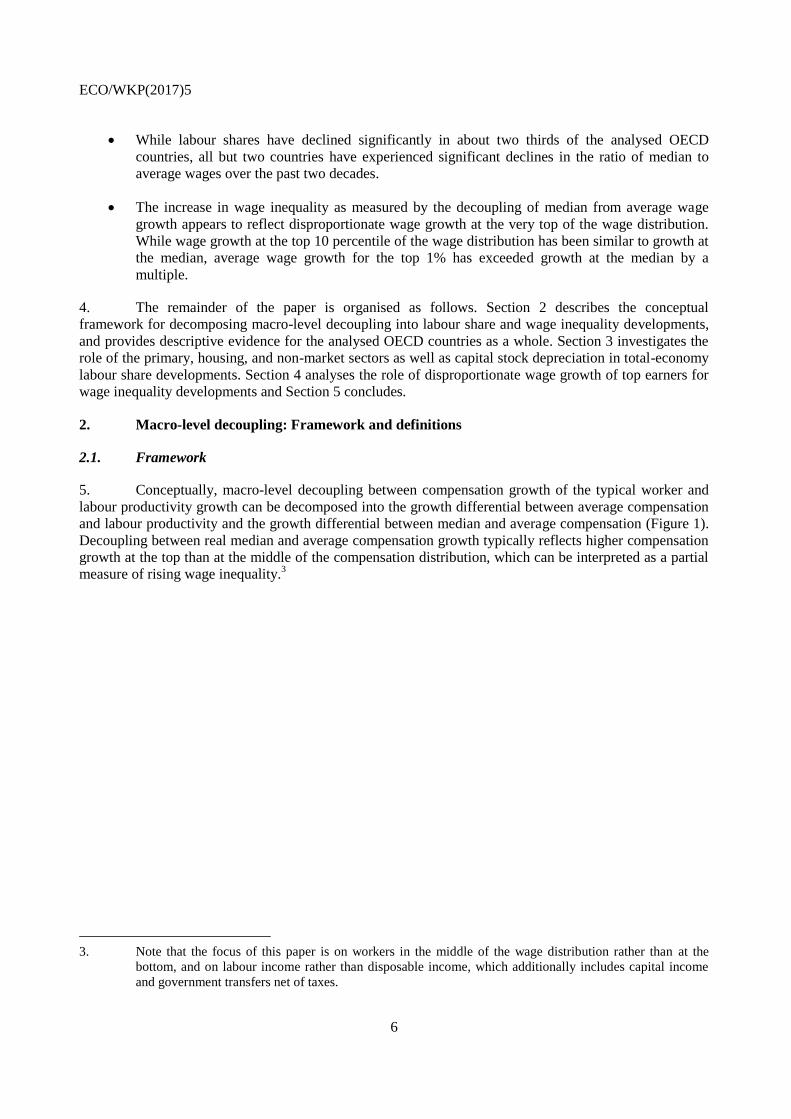
5. Conceptually, macro-level decoupling between compensation growth of the typical worker and
labour productivity growth can be decomposed into the growth differential between average compensation
and labour productivity and the growth differential between median and average compensation (Figure 1).
Decoupling between real median and average compensation growth typically reflects higher compensation
growth at the top than at the middle of the compensation distribution, which can be interpreted as a partial
measure of rising wage inequality.3
3. Note that the focus of this paper is on workers in the middle of the wage distribution rather than at the
bottom, and on labour income rather than disposable income, which additionally includes capital income
and government transfers net of taxes.
ECO/WKP(2017)5
7
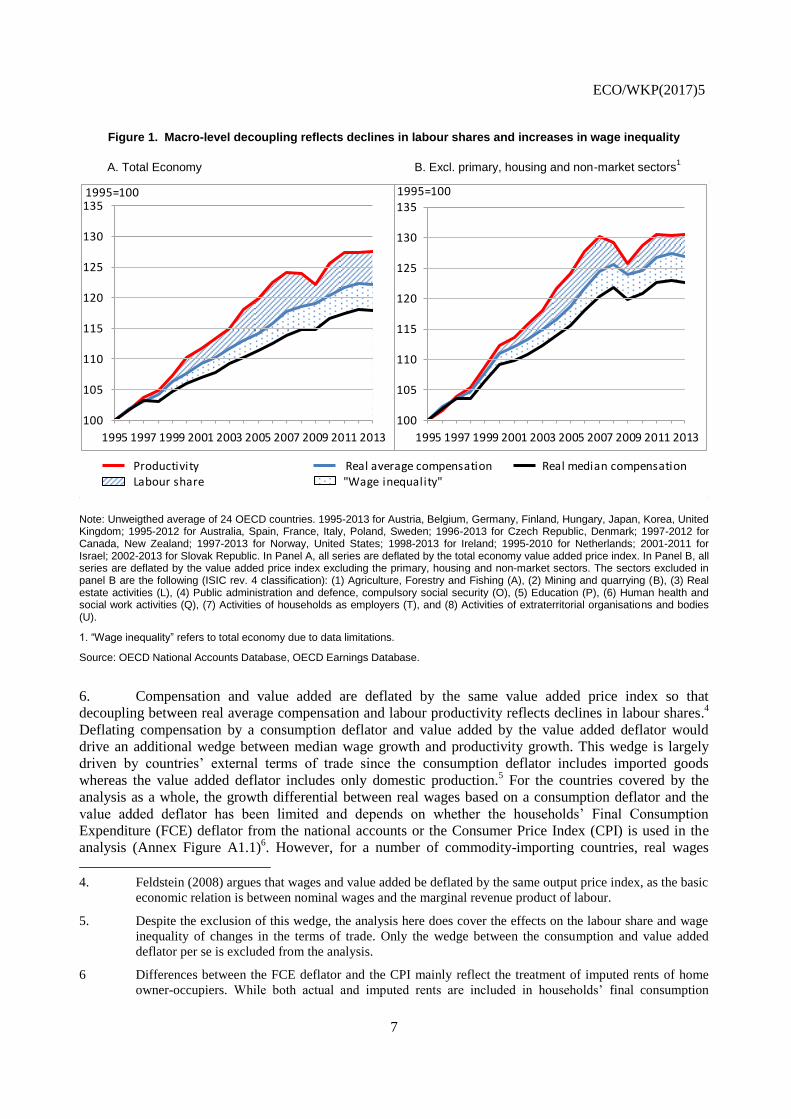
Figure 1. Macro-level decoupling reflects declines in labour shares and increases in wage inequality
A. Total Economy B. Excl. primary, housing and non-market sectors1
Note: Unweigthed average of 24 OECD countries. 1995-2013 for Austria, Belgium, Germany, Finland, Hungary, Japan, Korea, United Kingdom; 1995-2012 for Australia, Spain, France, Italy, Poland, Sweden; 1996-2013 for Czech Republic, Denmark; 1997-2012 for Canada, New Zealand; 1997-2013 for Norway, United States; 1998-2013 for Ireland; 1995-2010 for Netherlands; 2001-2011 for Israel; 2002-2013 for Slovak Republic. In Panel A, all series are deflated by the total economy value added price index. In Panel B, all series are deflated by the value added price index excluding the primary, housing and non-market sectors. The sectors excluded in panel B are the following (ISIC rev. 4 classification): (1) Agriculture, Forestry and Fishing (A), (2) Mining and quarrying (B), (3) Real estate activities (L), (4) Public administration and defence, compulsory social security (O), (5) Education (P), (6) Human health and social work activities (Q), (7) Activities of households as employers (T), and (8) Activities of extraterritorial organisations and bodies (U).
1. “Wage inequality” refers to total economy due to data limitations.
Source: OECD National Accounts Database, OECD Earnings Database.
6. Compensation and value added are deflated by the same value added price index so that
decoupling between real average compensation and labour productivity reflects declines in labour shares.4
Deflating compensation by a consumption deflator and value added by the value added deflator would
drive an additional wedge between median wage growth and productivity growth. This wedge is largely
driven by countries’ external terms of trade since the consumption deflator includes imported goods
whereas the value added deflator includes only domestic production.5 For the countries covered by the
analysis as a whole, the growth differential between real wages based on a consumption deflator and the
value added deflator has been limited and depends on whether the households’ Final Consumption
Expenditure (FCE) deflator from the national accounts or the Consumer Price Index (CPI) is used in the
analysis (Annex Figure A1.1)6. However, for a number of commodity-importing countries, real wages
4. Feldstein (2008) argues that wages and value added be deflated by the same output price index, as the basic
economic relation is between nominal wages and the marginal revenue product of labour.
5. Despite the exclusion of this wedge, the analysis here does cover the effects on the labour share and wage
inequality of changes in the terms of trade. Only the wedge between the consumption and value added
deflator per se is excluded from the analysis.
6 Differences between the FCE deflator and the CPI mainly reflect the treatment of imputed rents of home
owner-occupiers. While both actual and imputed rents are included in households’ final consumption
Productivity Real average compensation Real median compensation Labour share "Wage inequality"
100
105
110
115
120
125
130
135
1995 1997 1999 2001 2003 2005 2007 2009 2011 2013
100
105
110
115
120
125
130
135
1995 1997 1999 2001 2003 2005 2007 2009 2011 2013
1995=100 1995=100
ECO/WKP(2017)5
8
based on a consumption deflator would have grown less than real wages based on the producer price index
irrespectively of the precise measure of the consumption deflator used in the analysis (Annex Table A1.1).
7. The growth differential between real average compensation and labour productivity can directly
be computed from national accounts data, whereas the growth differential between average and median
compensation needs to be approximated using data from the OECD Earnings Database. Average
compensation is computed as the ratio of total compensation to the total number of workers in the economy
while labour productivity is computed as the ratio of gross value added at factor cost to the number of
workers. In this paper, the growth differential between average and median compensation is approximated
by the growth differential between gross average and median wages from the OECD Earnings Database,
which exclude employers’ social contributions.7
8. Decoupling is significantly more pronounced when it is based on productivity and compensation
in the total economy rather than in the non-primary (i.e. excluding agriculture and mining), non-housing
market sector. In line with previous studies on decoupling, this paper uses as a starting point compensation
and value added in the total economy (Figure 1, Panel A).8 However, the total economy includes sectors
for which labour shares are largely determined by fluctuations in commodity and asset prices, such as the
primary and housing sectors, or for which labour shares are driven by imputation choices, such as the non-
market sector. Labour share fluctuations in these sectors may have different distributional implications
from those in the production sector. Once the primary, housing and the non-market sectors are excluded
from the analysis, the decoupling between productivity and average compensation appears more limited
(Figure 1, Panel B).
2.2. Definitions
9. Labour productivity is defined as the ratio of real value added at factor cost to total employment
and real average compensation is defined as the ratio of total real compensation to total employment. Real
value added at factor cost is obtained by deflating nominal value added at factor cost by the corresponding
value added deflator. Total compensation is computed as the sum of the compensation of employees and
the compensation of the self-employed, which is imputed by assuming that hourly compensation of the
self-employed and of dependent employees is the same at the level of individual industries (see Annex 2).
The compensation of employees encompasses remuneration in cash and in kind and includes employees’
and employers’ social contributions. Real compensation is obtained by deflating nominal compensation by
the same value added price index used to deflate value added at factor cost. Value added at factor cost,
compensation of employees, employment and deflators are sourced from the OECD Annual National
Accounts database.
10. Median and average wages are based on the distribution of gross wages, while median
compensation is not directly observed and is approximated by multiplying average compensation by the
ratio of gross median to average wages. Median and average wages are sourced from the OECD Earnings
Database that compiles data on gross wages of full-time workers from a variety of sources, including
household, labour force and enterprise surveys. Gross wages encompass remuneration in cash and in kind,
including regular payments, irregular supplements and employees’ social contributions. They exclude
expenditure for all countries, imputed rents are not included in the basket of goods and services underlying
the CPI for a number of countries. The FCE deflator is therefore more comparable across countries than the
CPI.
7. The approximation is imprecise if developments in employers’ social contributions differ for the median
and average workers, but more precise data are unavailable since national accounts do not report
distributional statistics.
8. See Bivens and Mishel (2015) and Uguccioni (2016) for recent studies on decoupling.
ECO/WKP(2017)5
9
stock options, severance payments, cash government transfers, transport subsidies and employers’ social
contributions. Definitions are not fully consistent across countries, with data referring to weekly or
monthly wages for most countries but to hourly or annual wages for some others.
11. The labour share is defined as the ratio of total nominal labour compensation to value added at
factor cost. Given that nominal value added is expressed at factor cost, i.e. net of taxes less subsidies on
production, the labour share can be fully decomposed into total labour compensation, including an imputed
labour compensation to self-employed workers, and total gross operating surplus (GOS), including the part
of the mixed income of self-employed workers considered as GOS. Aggregate wage inequality is
approximated by the ratio of median to average wages while top income inequality is approximated by the
ratio of median wages of full-time employees to the average wage of the top 1% of income earners from
the World Wealth and Income Database (Alvaredo et al., 2016).
3. The contribution of declining labour shares to decoupling
12. Several recent studies have emphasised that distributional and policy implications of labour share
changes depend on the inclusion of capital depreciation and housing rents in value added (Rognlie, 2015;
Bridgman, 2014).
3.1. Gross or net labour shares?
13. Even though most analyses of labour shares are based on gross value added, only value added net
of capital consumption is available for compensation of workers and capital owners once productive
capital has been restored to its pre-production level.9 From an income distribution perspective, it may
therefore be more appropriate to base labour shares on net rather than gross value added (Bridgman, 2014;
Rognlie, 2015; Cho et al., 2016).
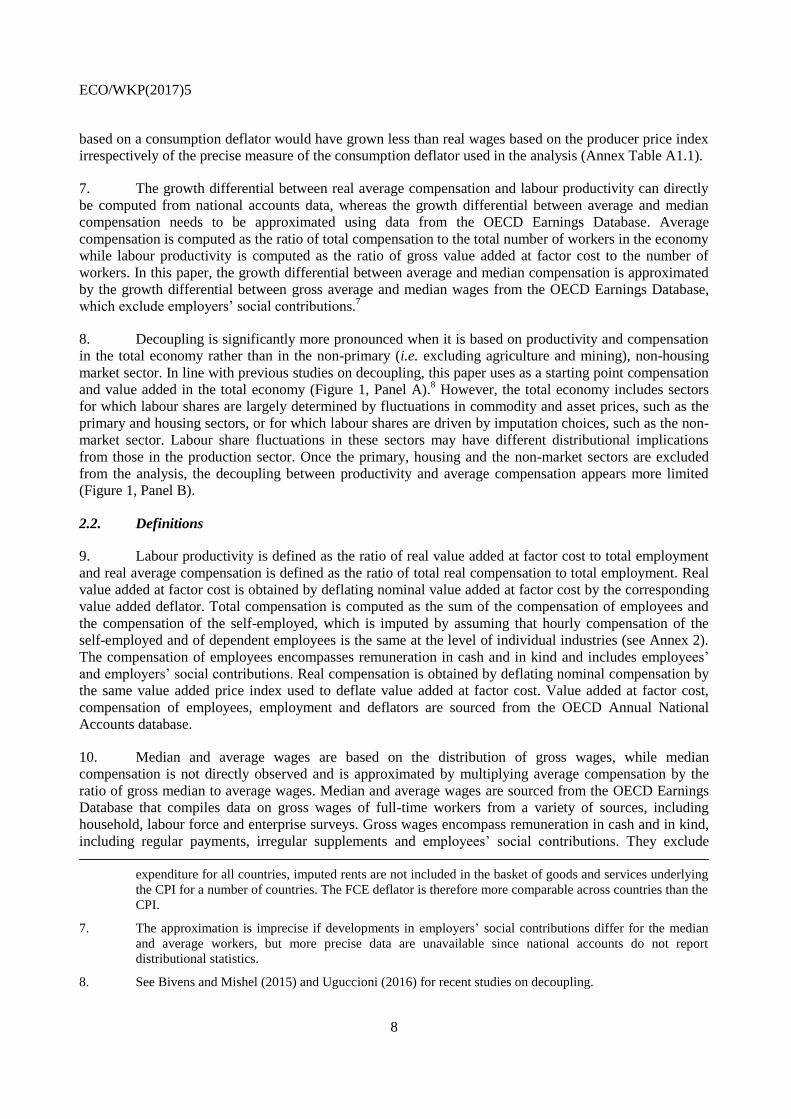
14. For the analysed OECD countries and the G7 countries as a whole, developments in gross and net
labour shares over the period 1995-2014 have been similar (Figure 2). This is consistent with Rognlie
(2015, Figures 1 and 2) who shows that average net and gross labour shares of G7 diverged before 1975
but evolved similarly thereafter. However, for some countries there have been large differences between
net and gross labour share developments.
9 . Analyses based on gross labour shares include (Karabarbounis and Neiman, 2014; Pionnier and Guidetti,
2015; OECD, 2012).
ECO/WKP(2017)5
10
Figure 2. Changes in gross and net labour shares
Percentage points, 1995-2014
Note: Three-year averages starting and ending in indicated years. OECD and G7 refer to unweighted averages for the relevant countries included in the figure. 1995-2013 for Australia, Canada, France, Korea, Latvia, Mexico, Portugal; 1996-2014 for Chile; 1997-2014 for United Kingdom; 1996-2012 for New Zealand.
Source: OECD National Accounts Database.
15. There is little empirical evidence in the national accounts that differences between the evolution
of gross and net labour shares are related to longer-term technological developments. The increase of
around 2 percentage points in the average value added share of capital depreciation for the analysed OECD
countries over the past two decades is commonly attributed to the substitution of rapidly depreciating ICT
capital for more slowly depreciating traditional equipment (see Annex 3). However, the increase in the
share of ICT capital in the total capital stock in volume terms (Annex Figure A3.1) has been offset by the
decline in relative prices so that the substitution of ICT equipment for other types of equipment is unrelated
to the increase in the share of depreciation in value added at current prices (Annex Figure A3.2). In fact,
the share of ICT capital in the total capital stock at current prices has remained broadly constant or has
even declined for the analysed OECD countries (Annex Figure A3.3).
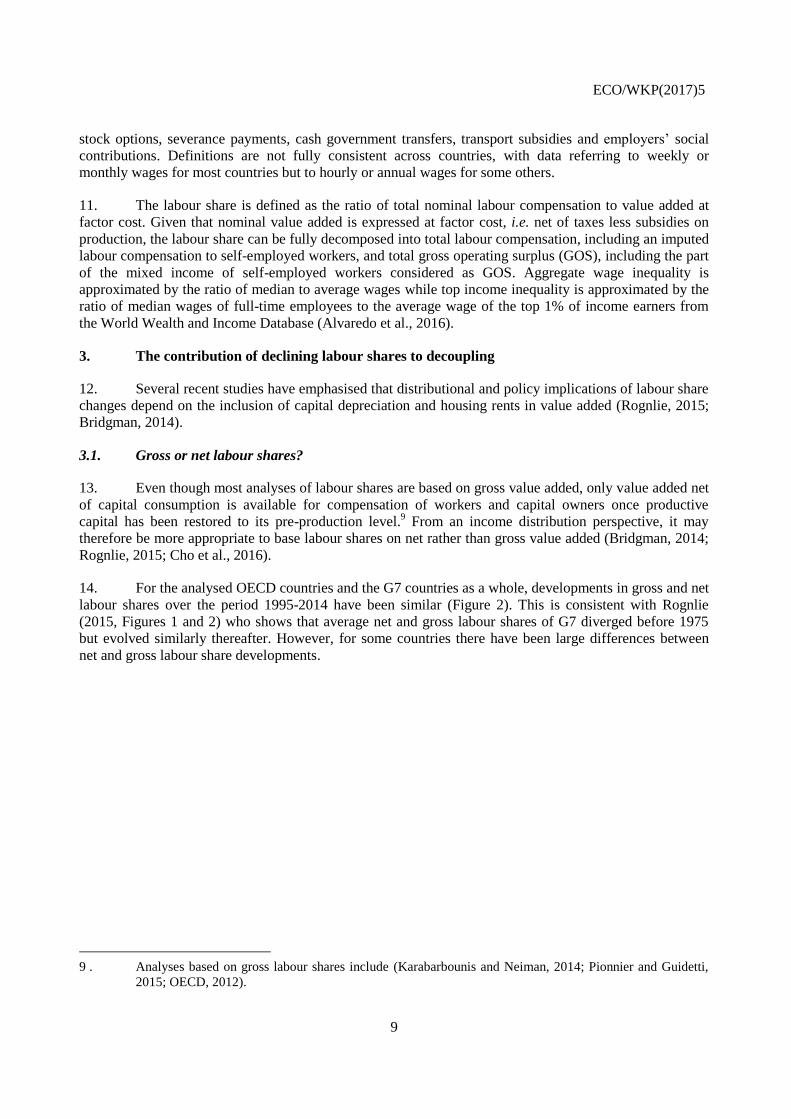
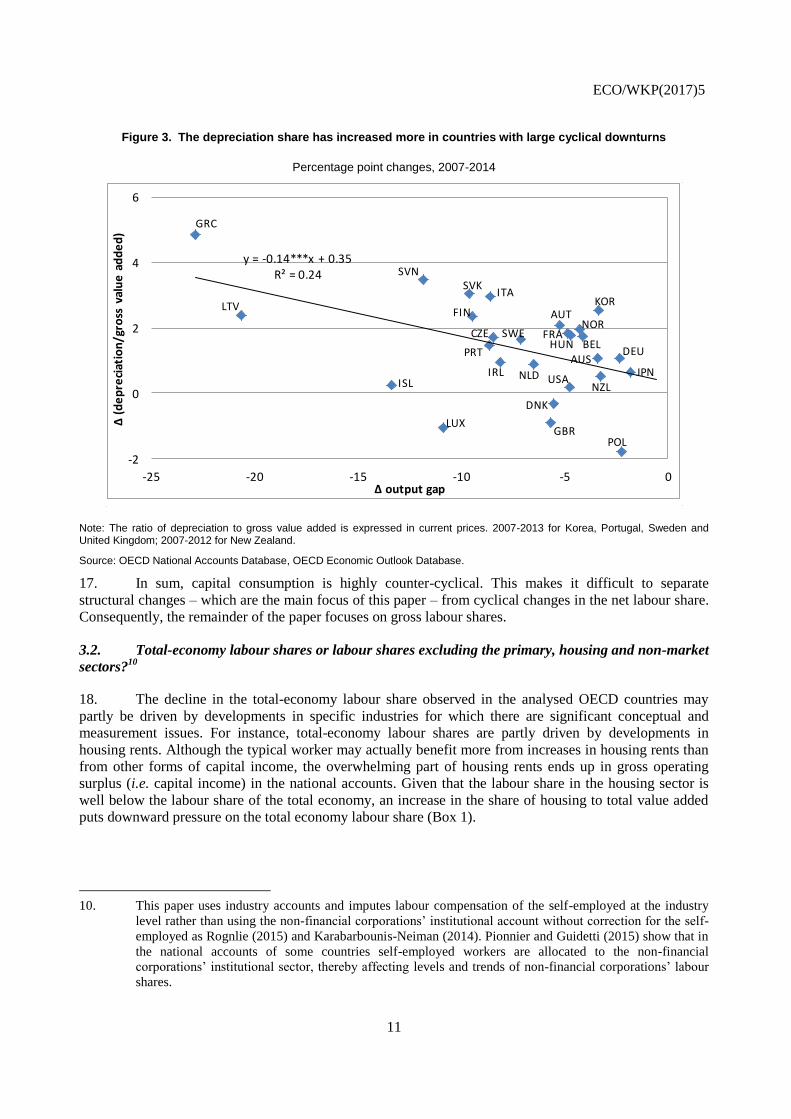
16. There is more support in the data for the hypothesis that the share of depreciation in gross value
added is highly counter-cyclical, which implies that net labour share developments are largely driven by
the business cycle rather than structural developments. The relationship between changes in the share of
depreciation in value added and changes in output gaps appears to be negative (Figure 3). Greece, for
instance, experienced the largest widening of the output gap over 2007 and 2014 and is the country in the
sample for which the share of depreciation in value added increased most. The increase in the value added
share of depreciation appears to mainly reflect cyclical developments rather than a long-term structural
change driven by the long-term decrease in ICT prices.
-35
-30
-25
-20
-15
-10
-5
0
5
10
15
LTV
PO
L
IRL
ISR
KO
R
HU
N
JPN
CH
L
NO
R
CH
E
SVN
EST
ME
X
AU
S
CA
N
OEC
D
PR
T
AU
T
NZL
SVK
USA
GB
R
NLD G
7
DE
U
BE
L
CZE
DN
K
FIN
FRA
ITA
GR
C
SWE
LUX
Total economy net of depreciation
Total economy
ECO/WKP(2017)5
11
Figure 3. The depreciation share has increased more in countries with large cyclical downturns
Percentage point changes, 2007-2014
Note: The ratio of depreciation to gross value added is expressed in current prices. 2007-2013 for Korea, Portugal, Sweden and United Kingdom; 2007-2012 for New Zealand.
Source: OECD National Accounts Database, OECD Economic Outlook Database.
17. In sum, capital consumption is highly counter-cyclical. This makes it difficult to separate
structural changes – which are the main focus of this paper – from cyclical changes in the net labour share.
Consequently, the remainder of the paper focuses on gross labour shares.
3.2. Total-economy labour shares or labour shares excluding the primary, housing and non-market
sectors?10
18. The decline in the total-economy labour share observed in the analysed OECD countries may
partly be driven by developments in specific industries for which there are significant conceptual and
measurement issues. For instance, total-economy labour shares are partly driven by developments in
housing rents. Although the typical worker may actually benefit more from increases in housing rents than
from other forms of capital income, the overwhelming part of housing rents ends up in gross operating
surplus (i.e. capital income) in the national accounts. Given that the labour share in the housing sector is
well below the labour share of the total economy, an increase in the share of housing to total value added
puts downward pressure on the total economy labour share (Box 1).
10. This paper uses industry accounts and imputes labour compensation of the self-employed at the industry
level rather than using the non-financial corporations’ institutional account without correction for the self-
employed as Rognlie (2015) and Karabarbounis-Neiman (2014). Pionnier and Guidetti (2015) show that in
the national accounts of some countries self-employed workers are allocated to the non-financial
corporations’ institutional sector, thereby affecting levels and trends of non-financial corporations’ labour
shares.
y = -0.14***x + 0.35R² = 0.24
-2
0
2
4
6
-25 -20 -15 -10 -5 0
∆ (
de
pre
ciat
ion
/gro
ss v
alu
e a
dd
ed
)
∆ output gap
GRC
SVK
DEU
FIN
FRASWE
PRT
ITA
GBR
SVN
CZE
DNK
NLD
AUT
HUN
NOR
AUSBEL
IRLISL USA
POL
KOR
NZL
JPN
LTV
LUX
ECO/WKP(2017)5
12
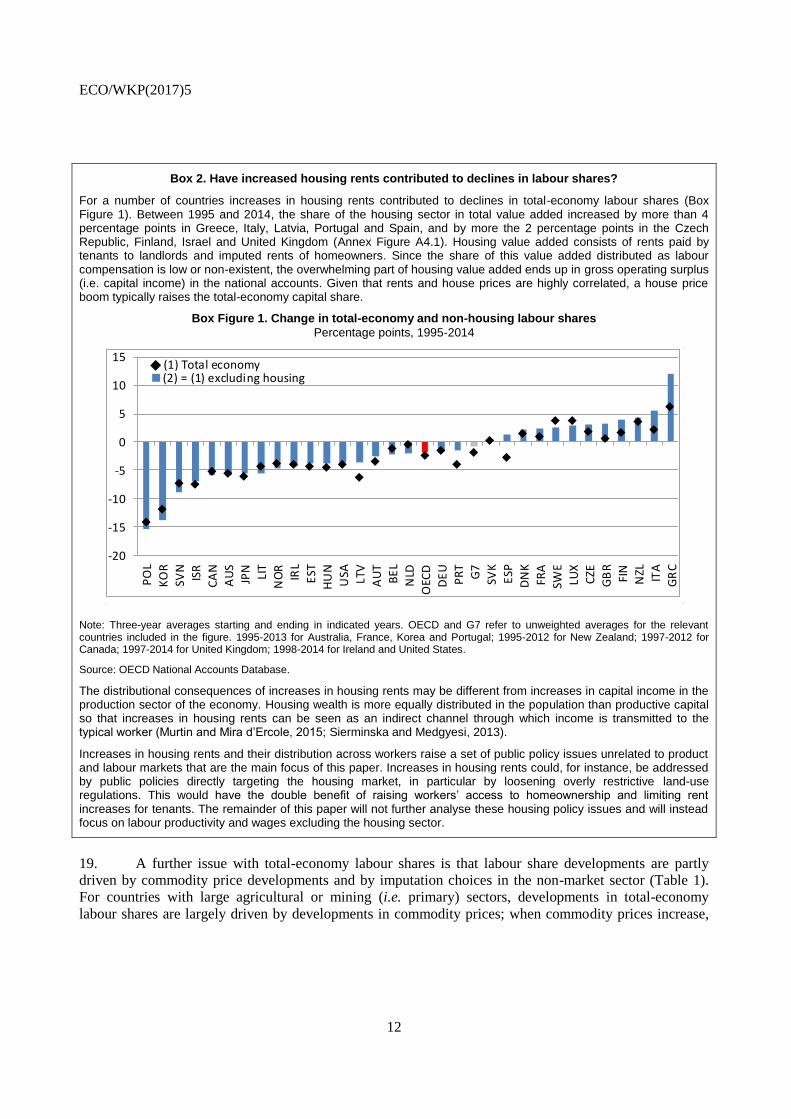
Box 2. Have increased housing rents contributed to declines in labour shares?
For a number of countries increases in housing rents contributed to declines in total-economy labour shares (Box Figure 1). Between 1995 and 2014, the share of the housing sector in total value added increased by more than 4 percentage points in Greece, Italy, Latvia, Portugal and Spain, and by more the 2 percentage points in the Czech Republic, Finland, Israel and United Kingdom (Annex Figure A4.1). Housing value added consists of rents paid by tenants to landlords and imputed rents of homeowners. Since the share of this value added distributed as labour compensation is low or non-existent, the overwhelming part of housing value added ends up in gross operating surplus (i.e. capital income) in the national accounts. Given that rents and house prices are highly correlated, a house price boom typically raises the total-economy capital share.
Box Figure 1. Change in total-economy and non-housing labour shares
Percentage points, 1995-2014
Note: Three-year averages starting and ending in indicated years. OECD and G7 refer to unweighted averages for the relevant countries included in the figure. 1995-2013 for Australia, France, Korea and Portugal; 1995-2012 for New Zealand; 1997-2012 for Canada; 1997-2014 for United Kingdom; 1998-2014 for Ireland and United States.
Source: OECD National Accounts Database.
The distributional consequences of increases in housing rents may be different from increases in capital income in the production sector of the economy. Housing wealth is more equally distributed in the population than productive capital so that increases in housing rents can be seen as an indirect channel through which income is transmitted to the typical worker (Murtin and Mira d’Ercole, 2015; Sierminska and Medgyesi, 2013).
Increases in housing rents and their distribution across workers raise a set of public policy issues unrelated to product and labour markets that are the main focus of this paper. Increases in housing rents could, for instance, be addressed by public policies directly targeting the housing market, in particular by loosening overly restrictive land-use regulations. This would have the double benefit of raising workers’ access to homeownership and limiting rent increases for tenants. The remainder of this paper will not further analyse these housing policy issues and will instead focus on labour productivity and wages excluding the housing sector.
19. A further issue with total-economy labour shares is that labour share developments are partly
driven by commodity price developments and by imputation choices in the non-market sector (Table 1).
For countries with large agricultural or mining (i.e. primary) sectors, developments in total-economy
labour shares are largely driven by developments in commodity prices; when commodity prices increase,
-20
-15
-10
-5
0
5
10
15
PO
L
KO
R
SVN
ISR
CA
N
AU
S
JPN
LIT
NO
R
IRL
EST
HU
N
USA LTV
AU
T
BE
L
NLD
OEC
D
DE
U
PR
T
G7
SVK
ESP
DN
K
FRA
SWE
LUX
CZE
GB
R
FIN
NZL ITA
GR
C
(2) = (1) excluding housing(1) Total economy
ECO/WKP(2017)5
13
aggregate profits rise without commensurate increases in aggregate wages.11
In Norway, for instance,
where the mining sector is large, the non-housing labour share declined by around 5 percentage points over
the period 1995-2014, but it increased by around 1 percentage point when the agriculture, mining and non-
market sectors are excluded (Table 1).12
Moreover, national accounting conventions in the non-market
sector may bias developments in labour shares. Value added in the non-market sector is equal to the sum of
wage compensation and capital consumption, which artificially implies limited variation over time.13
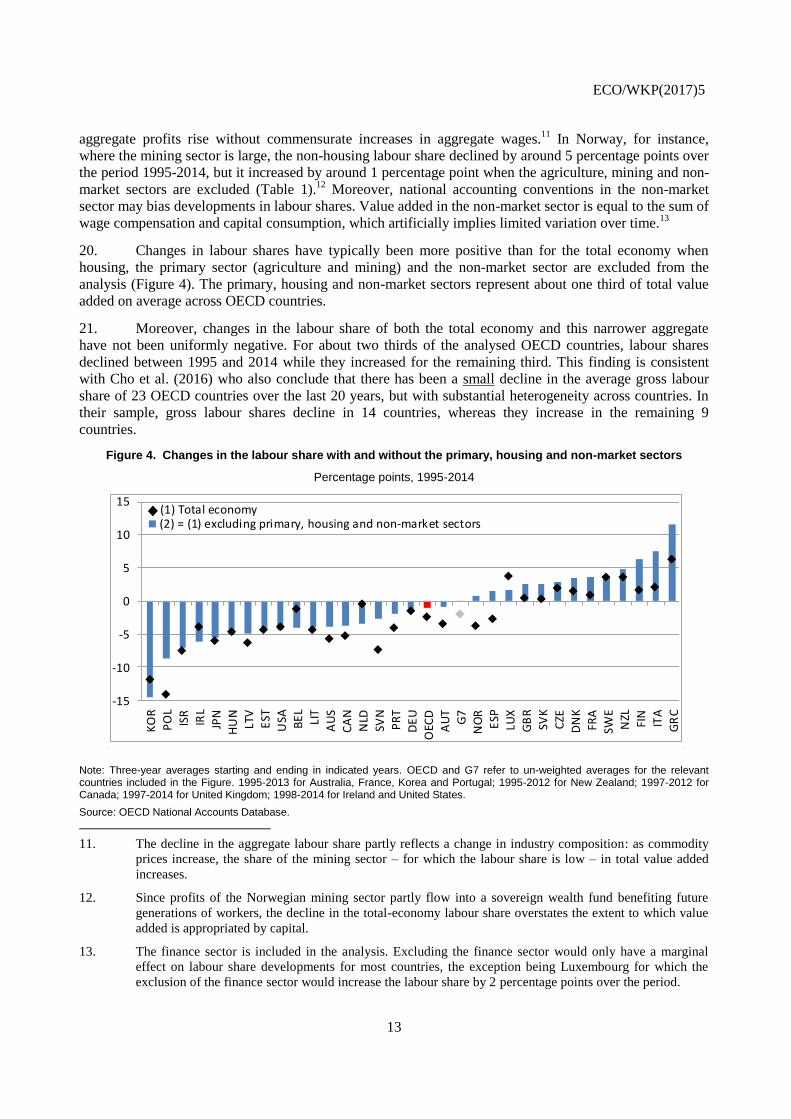
20. Changes in labour shares have typically been more positive than for the total economy when
housing, the primary sector (agriculture and mining) and the non-market sector are excluded from the
analysis (Figure 4). The primary, housing and non-market sectors represent about one third of total value
added on average across OECD countries.
21. Moreover, changes in the labour share of both the total economy and this narrower aggregate
have not been uniformly negative. For about two thirds of the analysed OECD countries, labour shares
declined between 1995 and 2014 while they increased for the remaining third. This finding is consistent
with Cho et al. (2016) who also conclude that there has been a small decline in the average gross labour
share of 23 OECD countries over the last 20 years, but with substantial heterogeneity across countries. In
their sample, gross labour shares decline in 14 countries, whereas they increase in the remaining 9
countries.
Figure 4. Changes in the labour share with and without the primary, housing and non-market sectors
Percentage points, 1995-2014
Note: Three-year averages starting and ending in indicated years. OECD and G7 refer to un-weighted averages for the relevant countries included in the Figure. 1995-2013 for Australia, France, Korea and Portugal; 1995-2012 for New Zealand; 1997-2012 for Canada; 1997-2014 for United Kingdom; 1998-2014 for Ireland and United States.
Source: OECD National Accounts Database.
11. The decline in the aggregate labour share partly reflects a change in industry composition: as commodity
prices increase, the share of the mining sector – for which the labour share is low – in total value added
increases.
12. Since profits of the Norwegian mining sector partly flow into a sovereign wealth fund benefiting future
generations of workers, the decline in the total-economy labour share overstates the extent to which value
added is appropriated by capital.
13. The finance sector is included in the analysis. Excluding the finance sector would only have a marginal
effect on labour share developments for most countries, the exception being Luxembourg for which the
exclusion of the finance sector would increase the labour share by 2 percentage points over the period.
-15
-10
-5
0
5
10
15
KO
R
PO
L
ISR
IRL
JPN
HU
N
LTV
EST
USA BE
L
LIT
AU
S
CA
N
NLD
SVN
PR
T
DE
U
OEC
D
AU
T
G7
NO
R
ESP
LUX
GB
R
SVK
CZE
DN
K
FRA
SWE
NZL
FIN
ITA
GR
C
(2) = (1) excluding primary, housing and non-market sectors(1) Total economy
ECO/WKP(2017)5
14
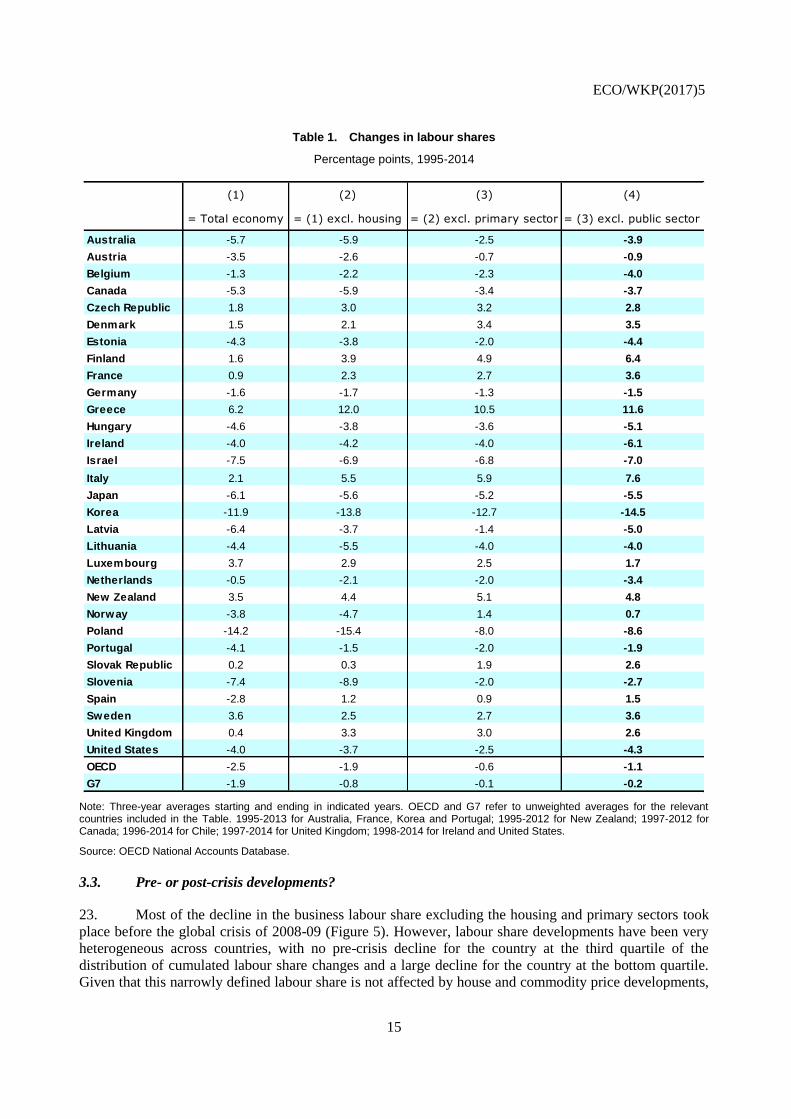
22. For a number of countries, the change in the labour share is significantly more positive when the
housing sector is excluded from the analysis (Table 1, Column 2). For most of these countries, including
Greece, Italy, Spain and the United Kingdom, this reflects house price booms in the run-up to the global
crisis of 2008-09 that were followed by a slow downward adjustment of rents in the subsequent bust so that
the share of rents in value added increased over the period 1995-2014. For countries with large primary
sectors, such as Australia, Canada and Norway, labour share developments are significantly more positive
when the primary sector is excluded from the analysis, which reflects the trend increase in commodity
prices over the period 1995-2014 (Table 1, Column 3). On the whole, for the OECD countries covered by
the analysis the commodity price effect appears to be larger than the house price effect. Given that the
labour share in the non-market sector is broadly stable over the period analysed here, excluding the non-
market sector typically amplifies changes in labour shares stemming from the remaining sectors (Table 1,
Column 4).
ECO/WKP(2017)5
15
Table 1. Changes in labour shares
Percentage points, 1995-2014
Note: Three-year averages starting and ending in indicated years. OECD and G7 refer to unweighted averages for the relevant countries included in the Table. 1995-2013 for Australia, France, Korea and Portugal; 1995-2012 for New Zealand; 1997-2012 for Canada; 1996-2014 for Chile; 1997-2014 for United Kingdom; 1998-2014 for Ireland and United States.
Source: OECD National Accounts Database.
3.3. Pre- or post-crisis developments?
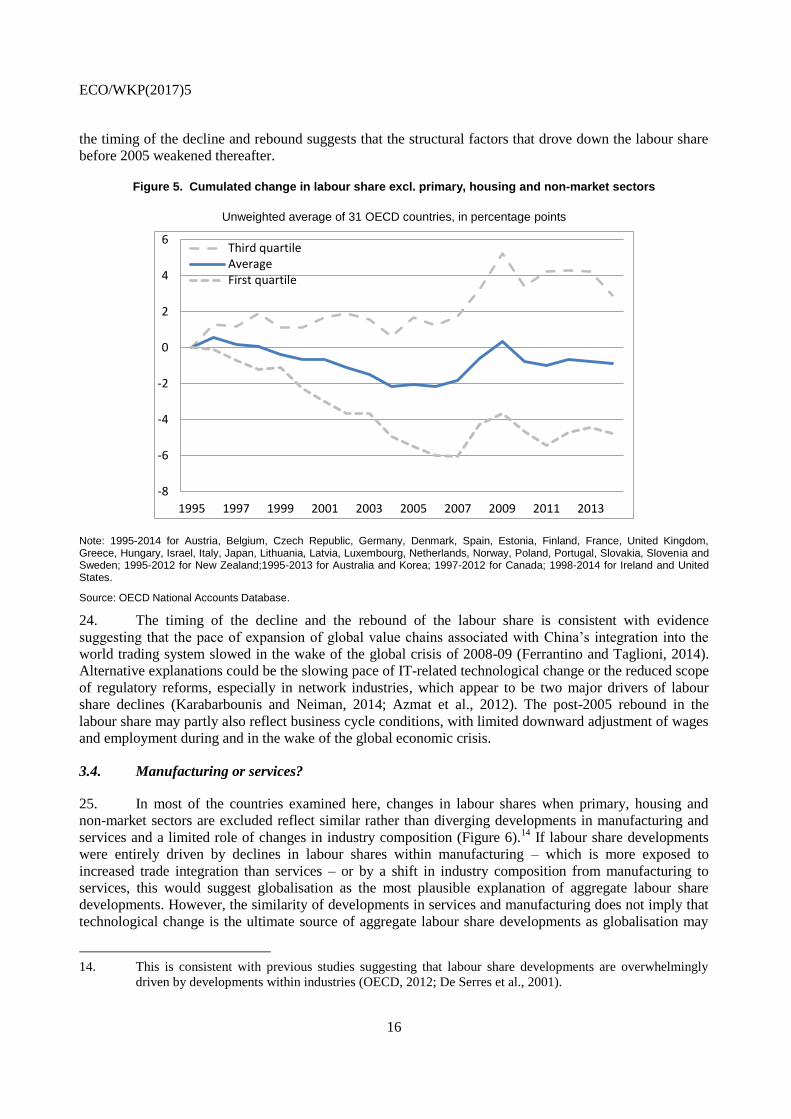
23. Most of the decline in the business labour share excluding the housing and primary sectors took
place before the global crisis of 2008-09 (Figure 5). However, labour share developments have been very
heterogeneous across countries, with no pre-crisis decline for the country at the third quartile of the
distribution of cumulated labour share changes and a large decline for the country at the bottom quartile.
Given that this narrowly defined labour share is not affected by house and commodity price developments,
(1) (2) (3) (4)
= Total economy = (1) excl. housing = (2) excl. primary sector = (3) excl. public sector
Australia -5.7 -5.9 -2.5 -3.9
Austria -3.5 -2.6 -0.7 -0.9
Belgium -1.3 -2.2 -2.3 -4.0
Canada -5.3 -5.9 -3.4 -3.7
Czech Republic 1.8 3.0 3.2 2.8
Denmark 1.5 2.1 3.4 3.5
Estonia -4.3 -3.8 -2.0 -4.4
Finland 1.6 3.9 4.9 6.4
France 0.9 2.3 2.7 3.6
Germany -1.6 -1.7 -1.3 -1.5
Greece 6.2 12.0 10.5 11.6
Hungary -4.6 -3.8 -3.6 -5.1
Ireland -4.0 -4.2 -4.0 -6.1
Israel -7.5 -6.9 -6.8 -7.0
Italy 2.1 5.5 5.9 7.6
Japan -6.1 -5.6 -5.2 -5.5
Korea -11.9 -13.8 -12.7 -14.5
Latvia -6.4 -3.7 -1.4 -5.0
Lithuania -4.4 -5.5 -4.0 -4.0
Luxembourg 3.7 2.9 2.5 1.7
Netherlands -0.5 -2.1 -2.0 -3.4
New Zealand 3.5 4.4 5.1 4.8
Norway -3.8 -4.7 1.4 0.7
Poland -14.2 -15.4 -8.0 -8.6
Portugal -4.1 -1.5 -2.0 -1.9
Slovak Republic 0.2 0.3 1.9 2.6
Slovenia -7.4 -8.9 -2.0 -2.7
Spain -2.8 1.2 0.9 1.5
Sweden 3.6 2.5 2.7 3.6
United Kingdom 0.4 3.3 3.0 2.6
United States -4.0 -3.7 -2.5 -4.3
OECD -2.5 -1.9 -0.6 -1.1
G7 -1.9 -0.8 -0.1 -0.2
ECO/WKP(2017)5
16
the timing of the decline and rebound suggests that the structural factors that drove down the labour share
before 2005 weakened thereafter.
Figure 5. Cumulated change in labour share excl. primary, housing and non-market sectors
Unweighted average of 31 OECD countries, in percentage points
Note: 1995-2014 for Austria, Belgium, Czech Republic, Germany, Denmark, Spain, Estonia, Finland, France, United Kingdom, Greece, Hungary, Israel, Italy, Japan, Lithuania, Latvia, Luxembourg, Netherlands, Norway, Poland, Portugal, Slovakia, Slovenia and Sweden; 1995-2012 for New Zealand;1995-2013 for Australia and Korea; 1997-2012 for Canada; 1998-2014 for Ireland and United States.
Source: OECD National Accounts Database.
24. The timing of the decline and the rebound of the labour share is consistent with evidence
suggesting that the pace of expansion of global value chains associated with China’s integration into the
world trading system slowed in the wake of the global crisis of 2008-09 (Ferrantino and Taglioni, 2014).
Alternative explanations could be the slowing pace of IT-related technological change or the reduced scope
of regulatory reforms, especially in network industries, which appear to be two major drivers of labour
share declines (Karabarbounis and Neiman, 2014; Azmat et al., 2012). The post-2005 rebound in the
labour share may partly also reflect business cycle conditions, with limited downward adjustment of wages
and employment during and in the wake of the global economic crisis.
3.4. Manufacturing or services?
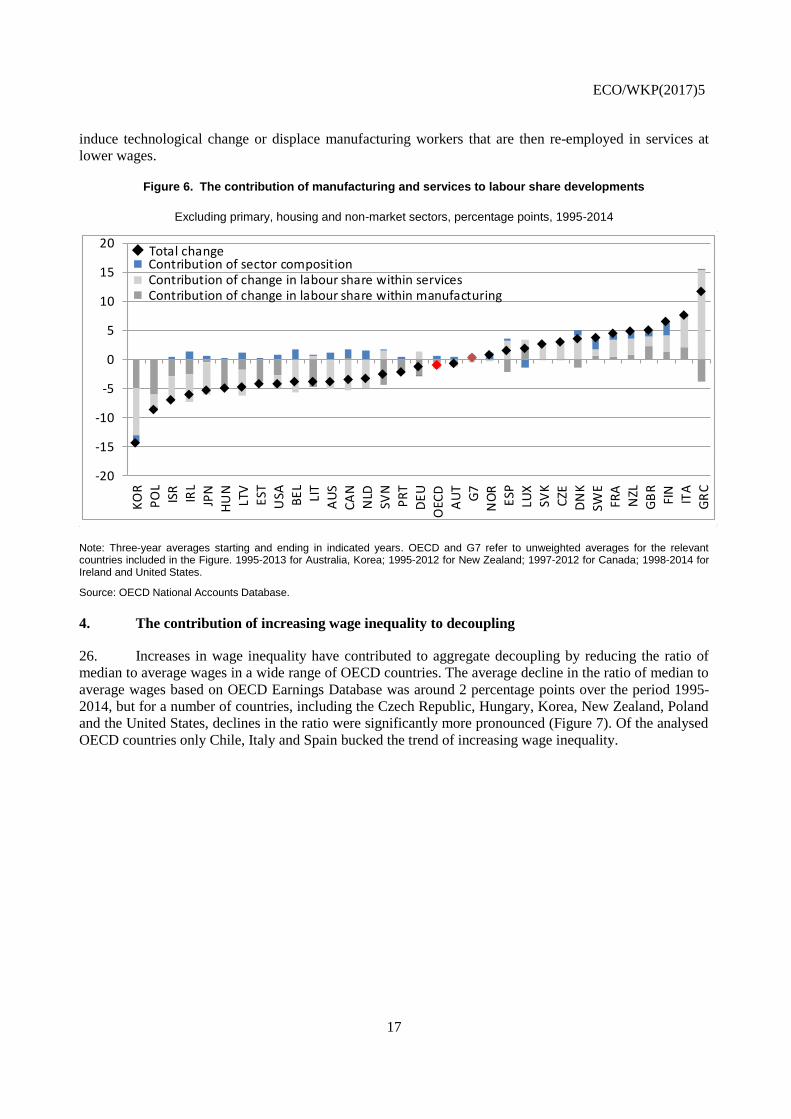
25. In most of the countries examined here, changes in labour shares when primary, housing and
non-market sectors are excluded reflect similar rather than diverging developments in manufacturing and
services and a limited role of changes in industry composition (Figure 6).14
If labour share developments
were entirely driven by declines in labour shares within manufacturing – which is more exposed to
increased trade integration than services – or by a shift in industry composition from manufacturing to
services, this would suggest globalisation as the most plausible explanation of aggregate labour share
developments. However, the similarity of developments in services and manufacturing does not imply that
technological change is the ultimate source of aggregate labour share developments as globalisation may
14. This is consistent with previous studies suggesting that labour share developments are overwhelmingly
driven by developments within industries (OECD, 2012; De Serres et al., 2001).
-8
-6
-4
-2
0
2
4
6
1995 1997 1999 2001 2003 2005 2007 2009 2011 2013
Third quartileAverageFirst quartile
ECO/WKP(2017)5
17
induce technological change or displace manufacturing workers that are then re-employed in services at
lower wages.
Figure 6. The contribution of manufacturing and services to labour share developments
Excluding primary, housing and non-market sectors, percentage points, 1995-2014
Note: Three-year averages starting and ending in indicated years. OECD and G7 refer to unweighted averages for the relevant countries included in the Figure. 1995-2013 for Australia, Korea; 1995-2012 for New Zealand; 1997-2012 for Canada; 1998-2014 for Ireland and United States.
Source: OECD National Accounts Database.
4. The contribution of increasing wage inequality to decoupling
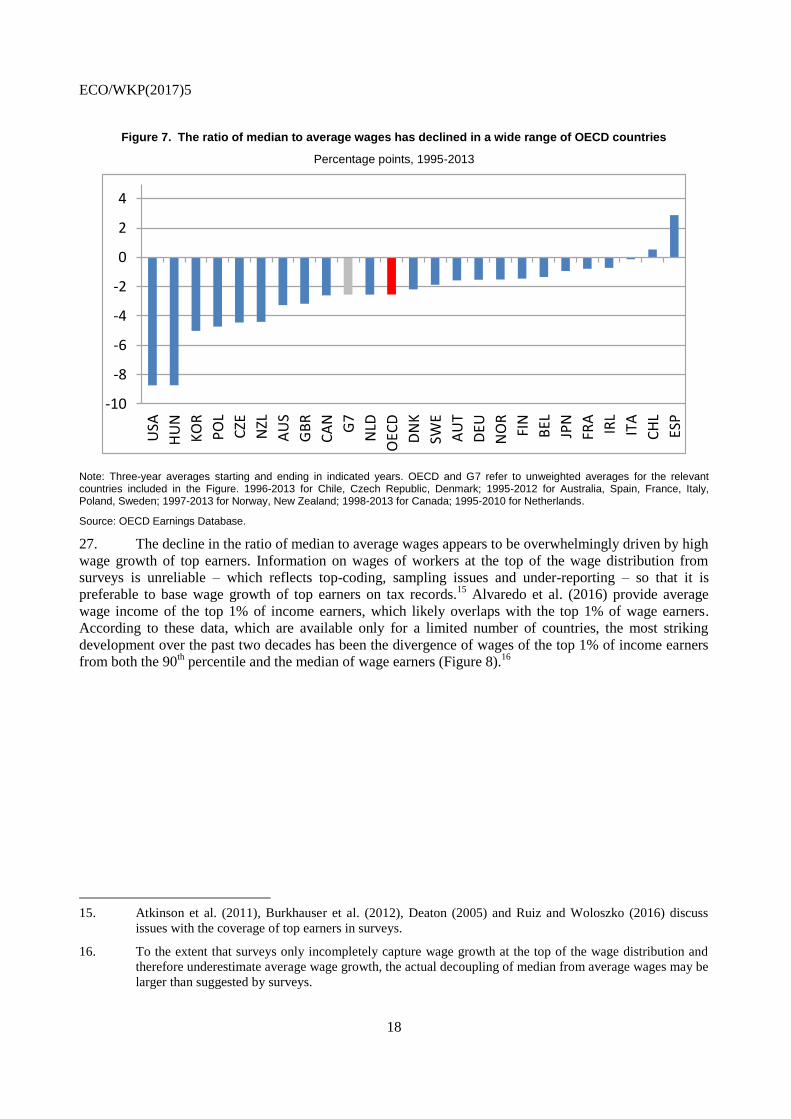
26. Increases in wage inequality have contributed to aggregate decoupling by reducing the ratio of
median to average wages in a wide range of OECD countries. The average decline in the ratio of median to
average wages based on OECD Earnings Database was around 2 percentage points over the period 1995-
2014, but for a number of countries, including the Czech Republic, Hungary, Korea, New Zealand, Poland
and the United States, declines in the ratio were significantly more pronounced (Figure 7). Of the analysed
OECD countries only Chile, Italy and Spain bucked the trend of increasing wage inequality.
-20
-15
-10
-5
0
5
10
15
20
KO
R
PO
L
ISR
IRL
JPN
HU
N
LTV
EST
USA BE
L
LIT
AU
S
CA
N
NLD
SVN
PR
T
DE
U
OEC
D
AU
T
G7
NO
R
ESP
LUX
SVK
CZE
DN
K
SWE
FRA
NZL
GB
R
FIN
ITA
GR
C
Contribution of sector composition Contribution of change in labour share within services Contribution of change in labour share within manufacturing
Total change
ECO/WKP(2017)5
18
Figure 7. The ratio of median to average wages has declined in a wide range of OECD countries
Percentage points, 1995-2013
Note: Three-year averages starting and ending in indicated years. OECD and G7 refer to unweighted averages for the relevant countries included in the Figure. 1996-2013 for Chile, Czech Republic, Denmark; 1995-2012 for Australia, Spain, France, Italy, Poland, Sweden; 1997-2013 for Norway, New Zealand; 1998-2013 for Canada; 1995-2010 for Netherlands.
Source: OECD Earnings Database.
27. The decline in the ratio of median to average wages appears to be overwhelmingly driven by high
wage growth of top earners. Information on wages of workers at the top of the wage distribution from
surveys is unreliable – which reflects top-coding, sampling issues and under-reporting – so that it is
preferable to base wage growth of top earners on tax records.15
Alvaredo et al. (2016) provide average
wage income of the top 1% of income earners, which likely overlaps with the top 1% of wage earners.
According to these data, which are available only for a limited number of countries, the most striking
development over the past two decades has been the divergence of wages of the top 1% of income earners
from both the 90th percentile and the median of wage earners (Figure 8).
16
15. Atkinson et al. (2011), Burkhauser et al. (2012), Deaton (2005) and Ruiz and Woloszko (2016) discuss
issues with the coverage of top earners in surveys.
16. To the extent that surveys only incompletely capture wage growth at the top of the wage distribution and
therefore underestimate average wage growth, the actual decoupling of median from average wages may be
larger than suggested by surveys.
-10
-8
-6
-4
-2
0
2
4
USA
HU
N
KO
R
PO
L
CZE
NZL
AU
S
GB
R
CA
N G7
NLD
OEC
D
DN
K
SWE
AU
T
DEU
NO
R
FIN
BEL
JPN
FRA
IRL
ITA
CH
L
ESP
ECO/WKP(2017)5
19
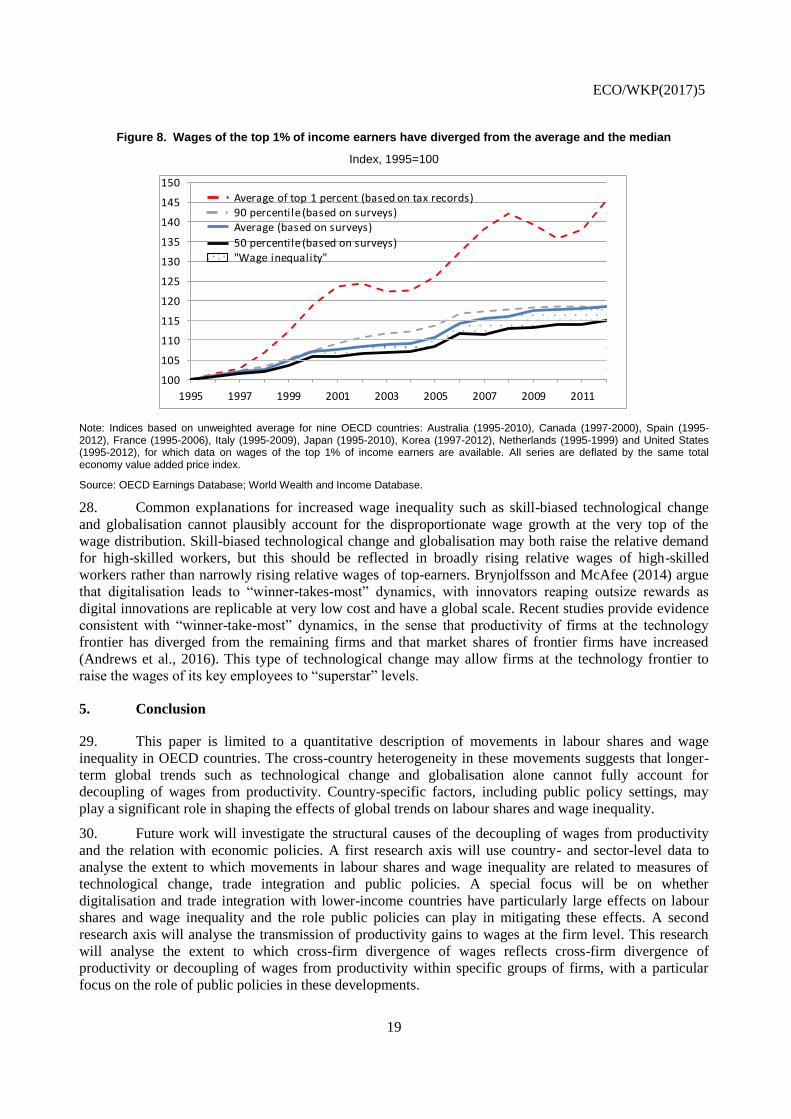
Figure 8. Wages of the top 1% of income earners have diverged from the average and the median
Index, 1995=100
Note: Indices based on unweighted average for nine OECD countries: Australia (1995-2010), Canada (1997-2000), Spain (1995-2012), France (1995-2006), Italy (1995-2009), Japan (1995-2010), Korea (1997-2012), Netherlands (1995-1999) and United States (1995-2012), for which data on wages of the top 1% of income earners are available. All series are deflated by the same total economy value added price index.
Source: OECD Earnings Database; World Wealth and Income Database.
28. Common explanations for increased wage inequality such as skill-biased technological change
and globalisation cannot plausibly account for the disproportionate wage growth at the very top of the
wage distribution. Skill-biased technological change and globalisation may both raise the relative demand
for high-skilled workers, but this should be reflected in broadly rising relative wages of high-skilled
workers rather than narrowly rising relative wages of top-earners. Brynjolfsson and McAfee (2014) argue
that digitalisation leads to “winner-takes-most” dynamics, with innovators reaping outsize rewards as
digital innovations are replicable at very low cost and have a global scale. Recent studies provide evidence
consistent with “winner-take-most” dynamics, in the sense that productivity of firms at the technology
frontier has diverged from the remaining firms and that market shares of frontier firms have increased
(Andrews et al., 2016). This type of technological change may allow firms at the technology frontier to
raise the wages of its key employees to “superstar” levels.
5. Conclusion
29. This paper is limited to a quantitative description of movements in labour shares and wage
inequality in OECD countries. The cross-country heterogeneity in these movements suggests that longer-
term global trends such as technological change and globalisation alone cannot fully account for
decoupling of wages from productivity. Country-specific factors, including public policy settings, may
play a significant role in shaping the effects of global trends on labour shares and wage inequality.
30. Future work will investigate the structural causes of the decoupling of wages from productivity
and the relation with economic policies. A first research axis will use country- and sector-level data to
analyse the extent to which movements in labour shares and wage inequality are related to measures of
technological change, trade integration and public policies. A special focus will be on whether
digitalisation and trade integration with lower-income countries have particularly large effects on labour
shares and wage inequality and the role public policies can play in mitigating these effects. A second
research axis will analyse the transmission of productivity gains to wages at the firm level. This research
will analyse the extent to which cross-firm divergence of wages reflects cross-firm divergence of
productivity or decoupling of wages from productivity within specific groups of firms, with a particular
focus on the role of public policies in these developments.
100
105
110
115
120
125
130
135
140
145
150
1995 1997 1999 2001 2003 2005 2007 2009 2011
Average of top 1 percent (based on tax records)90 percentile (based on surveys)Average (based on surveys)
50 percentile (based on surveys)"Wage inequality"
ECO/WKP(2017)5
20
REFERENCES
Alvaredo F., A. B. Atkinson and S. Morelli (2016), “The challenge of measuring UK wealth
inequality in the 2000s”, Fiscal Studies, Vol. 37, No. 1, pp. 13-33.
Andrews D., C. Criscuolo and P. Gal (2016), “The Global Productivity Slowdown, Technology
Divergence and Public Policy: A Firm Level Perspective”, OECD Economics Department
Working Paper for WP1, ECO/CPE/WP1(2016)26.
Atkinson A., T. Piketty, and E. Saez (2011), “Top Incomes in the Long Run of History”, Journal of
Economic Literature, 2011, No. 49:1, pp. 3–71.
Azmat G., A. Manning and J. Van Reenen (2012), “Privatization and the Decline of Labour’s Share:
International Evidence from Network Industries”, Economica, No. 79/315, pp. 470–92.
Bivens J. and L. Mishels (2015), “Understanding the Historic Divergence Between Productivity and a
Typical Worker’s Pay”, EPI Briefing Papers, No. 406, Economic Policy Institute, Washington.
Bridgman B. (2014), Is Labor's Loss Capital's Gain? Gross versus Net Labor Shares, Bureau of
Economic Analysis, mimeo, October 2014.
Brynjolfsson E. and A. McAfee (2014), The Second Machine Age - Work, Progress, and Prosperity in
a Time of Brilliant Technologies, WW Norton & Company.
Burkhauser R., S. Feng, S. Jenkins, and J. Larrimore (2012), “Recent Trends in Top Incomes Shares
in the United States: Reconciling Estimates from March CPS and IRS Tax Return Data”, The
Review of Economics and Statistics, vol. XCIV, pp. 371-388.
Cho T., S. Hwang and P. Schreyer (2016), “Has the Labour Share Declined? It Depends”, OECD
Statistics Working Papers, forthcoming, OECD Publishing, Paris
Deaton A. (2005), “Measuring Poverty in a Growing World (or Measuring Growth in a Poor World)”,
The Review of Economics and Statistics, vol. LXXXVII, pp. 1-19.
De Serres A., S. Scarpetta and C. de la Maisonneuve (2001), “Falling Wage Shares in Europe and the
United States: How Important is Aggregation Bias?”, Empirica, Vol. 28, pp. 375–400.
Elsby M., B. Hobijn and A. Sahin (2013), “The Decline of the U.S. Labor Share”, Brookings Papers
on Economic Activity, No. 2013-27, September 2013.
Feldstein M. S. (2008), “Did Wages Reflect the Growth in Productivity?”, NBER Working Paper, No.
13953, The National Bureau of Economic Research.
Ferrantino M. and D. Taglioni (2014), “Global Value Chains in the Current Trade Slowdown”, World
Bank Economic Premise No. 137.
International Labour Organisation (2015a), The Labour Share in G20 Economies, ILO, IMF, OECD,
WB, Report prepared for the G20 Employment Working Group Antalya, Turkey, 26-27 February
2015 .
ECO/WKP(2017)5
21
International Labour Organisation (2015a), Income inequality and labour income share in G20
countries: Trends, Impacts and Causes, ILO, IMF, OECD, WB, Report prepared for the G20
Employment Ministers Meeting and Joint Meeting with the G20 Finance Ministers, Ankara,
Turkey, 3-4 September 2015.
Karabarbounis L. and B. Neiman (2014), “The Global Decline of the Labour Share”, Quarterly
Journal of Economics, Vol. 129, No. 1, pp. 61–103.
Murtin F. and M. Mira d’Ercole (2015), “Household wealth inequality across OECD countries: new
OECD evidence”, OECD Statistics Brief, No. 21, OECD Publishing, Paris.
OECD (2012), OECD Employment Outlook 2012, Chapter 3. Labour Losing to Capital: What
Explains the Declining Labour Share?, OECD Publishing, Paris.
Pionnier P-A. and E. Guidetti (2015), “Comparing Profit Shares in Value-Added in Four OECD
Countries: Towards more Harmonized National Accounts”, Statistics Directorate Working
Papers, No. 61, OECD Publishing, Paris.
Rognlie M. (2015), “Deciphering the fall and rise in the net capital share”, Brookings Papers on
Economic Activity, March 19, 2015.
Ruiz N. and N. Woloszko (2016), “What do household surveys suggest about the top 1% incomes and
inequality in OECD countries?”, OECD Economics Department Working Papers , No. 1265,
OECD Publishing, Paris.
Sierminska E. and M. Medgyesi (2013), “The distribution of wealth between households”, Research
note, No. 11/2013, European Commission.
Uguccioni J. (2016), “Decomposing the Productivity-Wage Nexus in Selected OECD Countries,
1986-2013”, CSLS Research Report, forthcoming, Centre for the Study of Living Standards.
United Nations et al. (2009), System of National Accounts 2008, New York.
ECO/WKP(2017)5
22
ANNEX: SUPPLEMENTARY TECHNICAL MATERIAL
1. Evolution of deflators
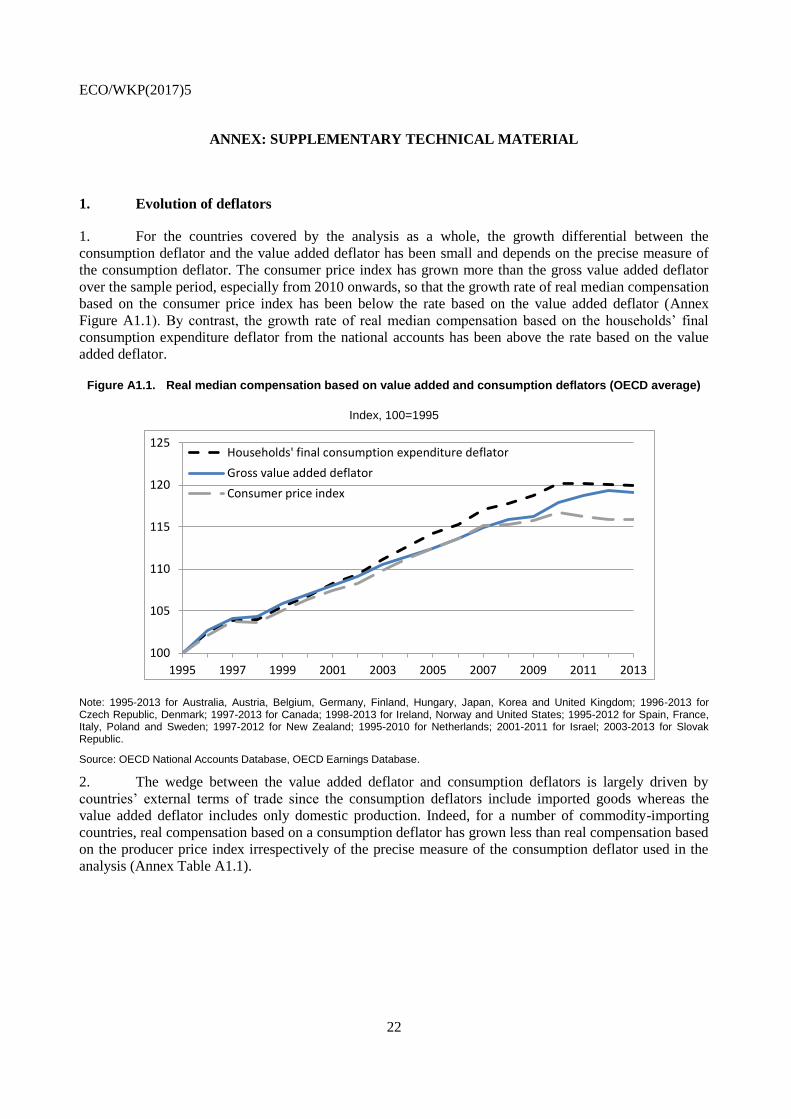
1. For the countries covered by the analysis as a whole, the growth differential between the
consumption deflator and the value added deflator has been small and depends on the precise measure of
the consumption deflator. The consumer price index has grown more than the gross value added deflator
over the sample period, especially from 2010 onwards, so that the growth rate of real median compensation
based on the consumer price index has been below the rate based on the value added deflator (Annex
Figure A1.1). By contrast, the growth rate of real median compensation based on the households’ final
consumption expenditure deflator from the national accounts has been above the rate based on the value
added deflator.
Figure A1.1. Real median compensation based on value added and consumption deflators (OECD average)
Index, 100=1995
Note: 1995-2013 for Australia, Austria, Belgium, Germany, Finland, Hungary, Japan, Korea and United Kingdom; 1996-2013 for Czech Republic, Denmark; 1997-2013 for Canada; 1998-2013 for Ireland, Norway and United States; 1995-2012 for Spain, France, Italy, Poland and Sweden; 1997-2012 for New Zealand; 1995-2010 for Netherlands; 2001-2011 for Israel; 2003-2013 for Slovak Republic.
Source: OECD National Accounts Database, OECD Earnings Database.
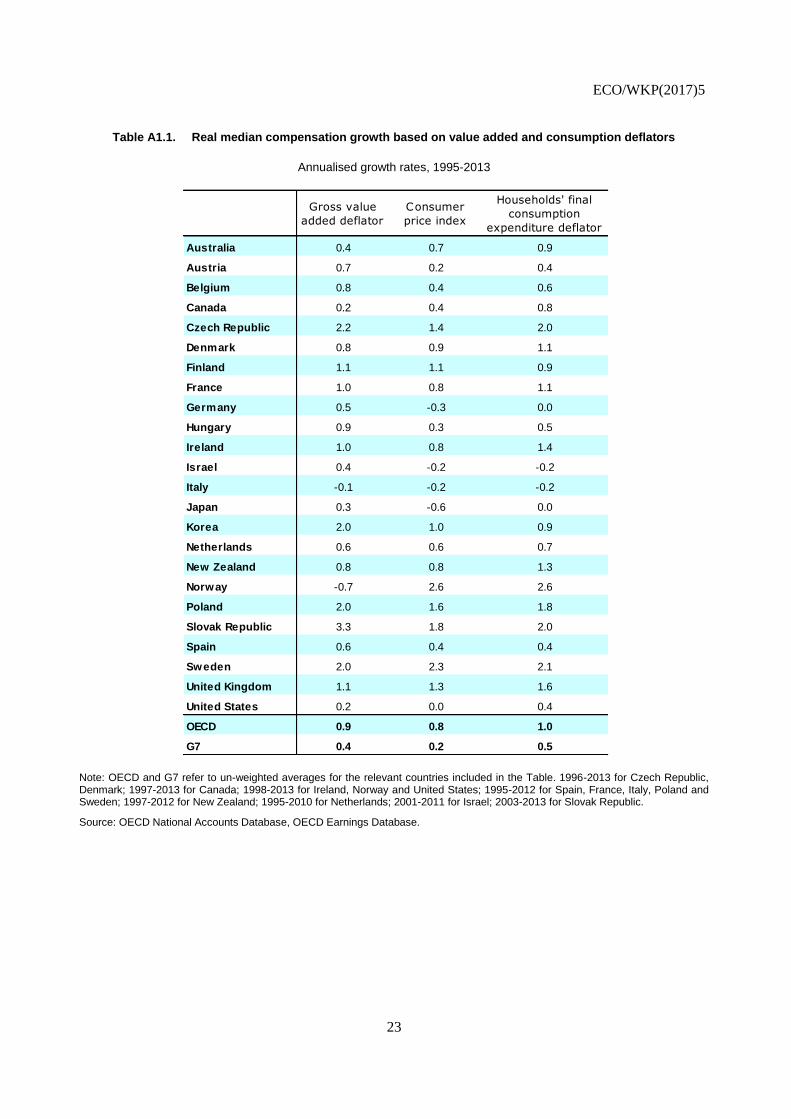
2. The wedge between the value added deflator and consumption deflators is largely driven by
countries’ external terms of trade since the consumption deflators include imported goods whereas the
value added deflator includes only domestic production. Indeed, for a number of commodity-importing
countries, real compensation based on a consumption deflator has grown less than real compensation based
on the producer price index irrespectively of the precise measure of the consumption deflator used in the
analysis (Annex Table A1.1).
100
105
110
115
120
125
1995 1997 1999 2001 2003 2005 2007 2009 2011 2013
Households' final consumption expenditure deflator
Gross value added deflator
Consumer price index
ECO/WKP(2017)5
23
Table A1.1. Real median compensation growth based on value added and consumption deflators
Annualised growth rates, 1995-2013
Note: OECD and G7 refer to un-weighted averages for the relevant countries included in the Table. 1996-2013 for Czech Republic, Denmark; 1997-2013 for Canada; 1998-2013 for Ireland, Norway and United States; 1995-2012 for Spain, France, Italy, Poland and Sweden; 1997-2012 for New Zealand; 1995-2010 for Netherlands; 2001-2011 for Israel; 2003-2013 for Slovak Republic.
Source: OECD National Accounts Database, OECD Earnings Database.
Gross value
added deflator
Consumer
price index
Households' final
consumption
expenditure deflator
Australia 0.4 0.7 0.9
Austria 0.7 0.2 0.4
Belgium 0.8 0.4 0.6
Canada 0.2 0.4 0.8
Czech Republic 2.2 1.4 2.0
Denmark 0.8 0.9 1.1
Finland 1.1 1.1 0.9
France 1.0 0.8 1.1
Germany 0.5 -0.3 0.0
Hungary 0.9 0.3 0.5
Ireland 1.0 0.8 1.4
Israel 0.4 -0.2 -0.2
Italy -0.1 -0.2 -0.2
Japan 0.3 -0.6 0.0
Korea 2.0 1.0 0.9
Netherlands 0.6 0.6 0.7
New Zealand 0.8 0.8 1.3
Norway -0.7 2.6 2.6
Poland 2.0 1.6 1.8
Slovak Republic 3.3 1.8 2.0
Spain 0.6 0.4 0.4
Sweden 2.0 2.3 2.1
United Kingdom 1.1 1.3 1.6
United States 0.2 0.0 0.4
OECD 0.9 0.8 1.0
G7 0.4 0.2 0.5
ECO/WKP(2017)5
24
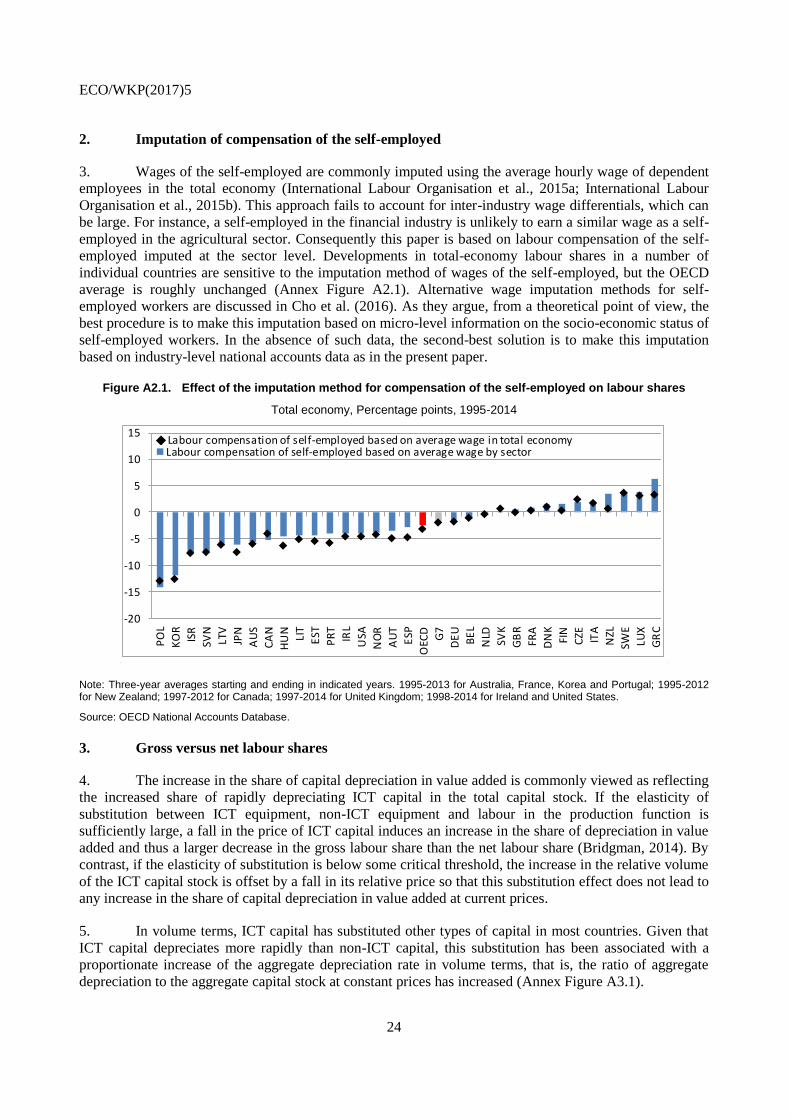
2. Imputation of compensation of the self-employed
3. Wages of the self-employed are commonly imputed using the average hourly wage of dependent
employees in the total economy (International Labour Organisation et al., 2015a; International Labour
Organisation et al., 2015b). This approach fails to account for inter-industry wage differentials, which can
be large. For instance, a self-employed in the financial industry is unlikely to earn a similar wage as a self-
employed in the agricultural sector. Consequently this paper is based on labour compensation of the self-
employed imputed at the sector level. Developments in total-economy labour shares in a number of
individual countries are sensitive to the imputation method of wages of the self-employed, but the OECD
average is roughly unchanged (Annex Figure A2.1). Alternative wage imputation methods for self-
employed workers are discussed in Cho et al. (2016). As they argue, from a theoretical point of view, the
best procedure is to make this imputation based on micro-level information on the socio-economic status of
self-employed workers. In the absence of such data, the second-best solution is to make this imputation
based on industry-level national accounts data as in the present paper.
Figure A2.1. Effect of the imputation method for compensation of the self-employed on labour shares
Total economy, Percentage points, 1995-2014
Note: Three-year averages starting and ending in indicated years. 1995-2013 for Australia, France, Korea and Portugal; 1995-2012 for New Zealand; 1997-2012 for Canada; 1997-2014 for United Kingdom; 1998-2014 for Ireland and United States.
Source: OECD National Accounts Database.
3. Gross versus net labour shares
4. The increase in the share of capital depreciation in value added is commonly viewed as reflecting
the increased share of rapidly depreciating ICT capital in the total capital stock. If the elasticity of
substitution between ICT equipment, non-ICT equipment and labour in the production function is
sufficiently large, a fall in the price of ICT capital induces an increase in the share of depreciation in value
added and thus a larger decrease in the gross labour share than the net labour share (Bridgman, 2014). By
contrast, if the elasticity of substitution is below some critical threshold, the increase in the relative volume
of the ICT capital stock is offset by a fall in its relative price so that this substitution effect does not lead to
any increase in the share of capital depreciation in value added at current prices.
5. In volume terms, ICT capital has substituted other types of capital in most countries. Given that
ICT capital depreciates more rapidly than non-ICT capital, this substitution has been associated with a
proportionate increase of the aggregate depreciation rate in volume terms, that is, the ratio of aggregate
depreciation to the aggregate capital stock at constant prices has increased (Annex Figure A3.1).
-20
-15
-10
-5
0
5
10
15
PO
L
KO
R
ISR
SVN
LTV
JPN
AU
S
CA
N
HU
N
LIT
EST
PR
T
IRL
USA
NO
R
AU
T
ESP
OEC
D G7
DE
U
BE
L
NLD
SVK
GB
R
FRA
DN
K
FIN
CZE ITA
NZL
SWE
LUX
GR
C
Labour compensation of self-employed based on average wage by sectorLabour compensation of self-employed based on average wage in total economy
ECO/WKP(2017)5
25
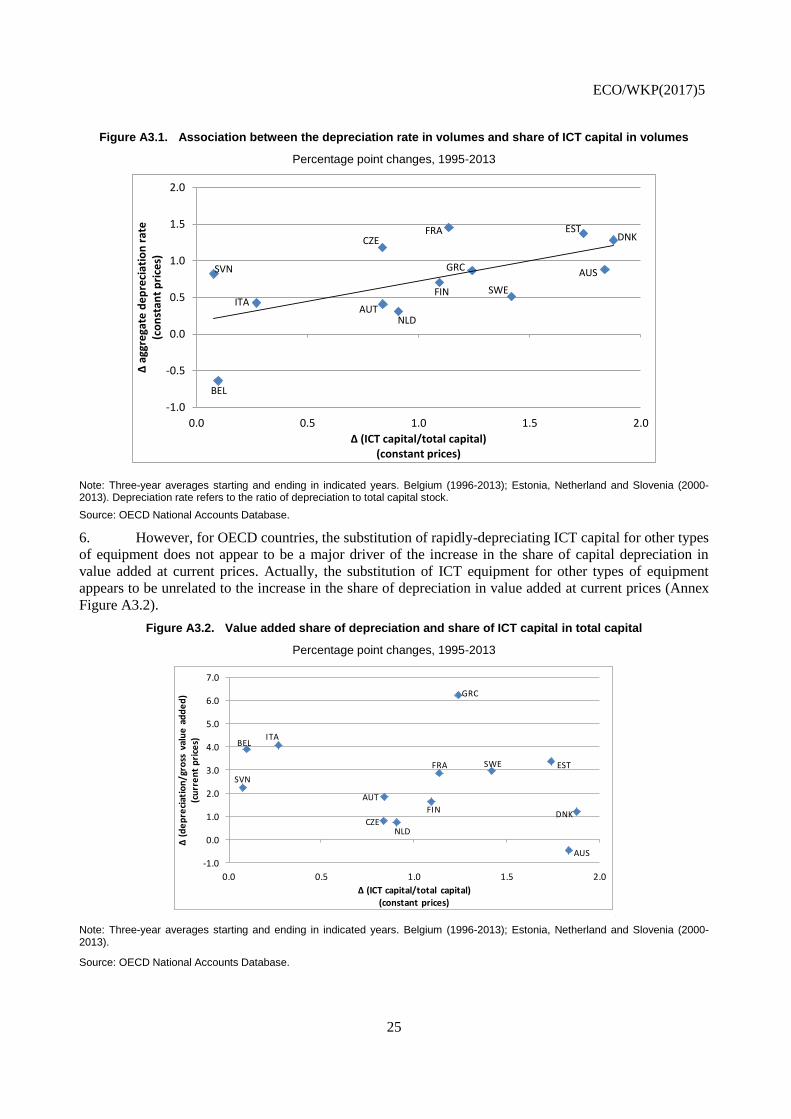
Figure A3.1. Association between the depreciation rate in volumes and share of ICT capital in volumes
Percentage point changes, 1995-2013
Note: Three-year averages starting and ending in indicated years. Belgium (1996-2013); Estonia, Netherland and Slovenia (2000-2013). Depreciation rate refers to the ratio of depreciation to total capital stock.
Source: OECD National Accounts Database.
6. However, for OECD countries, the substitution of rapidly-depreciating ICT capital for other types
of equipment does not appear to be a major driver of the increase in the share of capital depreciation in
value added at current prices. Actually, the substitution of ICT equipment for other types of equipment
appears to be unrelated to the increase in the share of depreciation in value added at current prices (Annex
Figure A3.2).
Figure A3.2. Value added share of depreciation and share of ICT capital in total capital
Percentage point changes, 1995-2013
Note: Three-year averages starting and ending in indicated years. Belgium (1996-2013); Estonia, Netherland and Slovenia (2000-2013).
Source: OECD National Accounts Database.
-1.0
-0.5
0.0
0.5
1.0
1.5
2.0
0.0 0.5 1.0 1.5 2.0
∆ a
ggre
gate
de
pre
ciat
ion
rat
e
(co
nst
ant
pri
ces)
∆ (ICT capital/total capital) (constant prices)
BEL
ITA
SVN
AUT
CZE
NLD
FIN
FRA
GRC
SWE
ESTDNK
AUS
-1.0
0.0
1.0
2.0
3.0
4.0
5.0
6.0
7.0
0.0 0.5 1.0 1.5 2.0
∆ (
de
pre
ciat
ion
/gro
ss v
alu
e a
dd
ed
) (c
urr
en
t p
rice
s)
∆ (ICT capital/total capital) (constant prices)
EST
ITABEL
SVN
AUT
AUS
CZE
GRC
FRA
FIN
SWE
NLD
DNK
ECO/WKP(2017)5
26
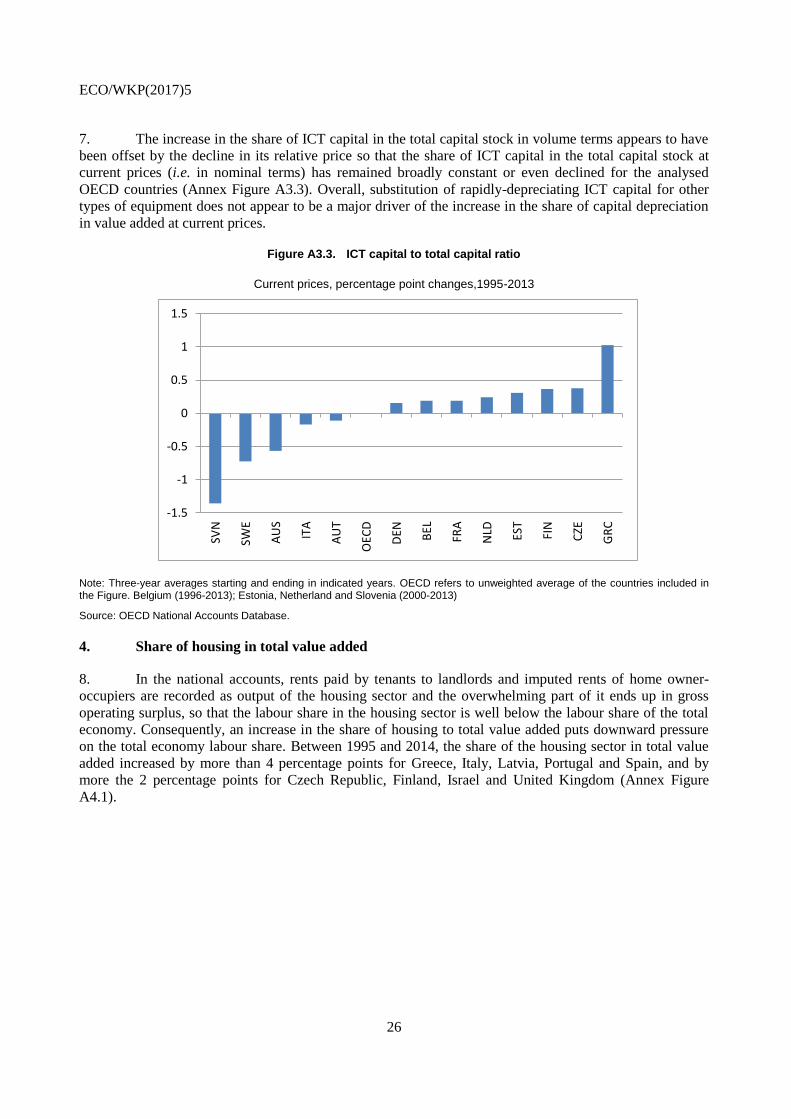
7. The increase in the share of ICT capital in the total capital stock in volume terms appears to have
been offset by the decline in its relative price so that the share of ICT capital in the total capital stock at
current prices (i.e. in nominal terms) has remained broadly constant or even declined for the analysed
OECD countries (Annex Figure A3.3). Overall, substitution of rapidly-depreciating ICT capital for other
types of equipment does not appear to be a major driver of the increase in the share of capital depreciation
in value added at current prices.
Figure A3.3. ICT capital to total capital ratio
Current prices, percentage point changes,1995-2013
Note: Three-year averages starting and ending in indicated years. OECD refers to unweighted average of the countries included in the Figure. Belgium (1996-2013); Estonia, Netherland and Slovenia (2000-2013)
Source: OECD National Accounts Database.
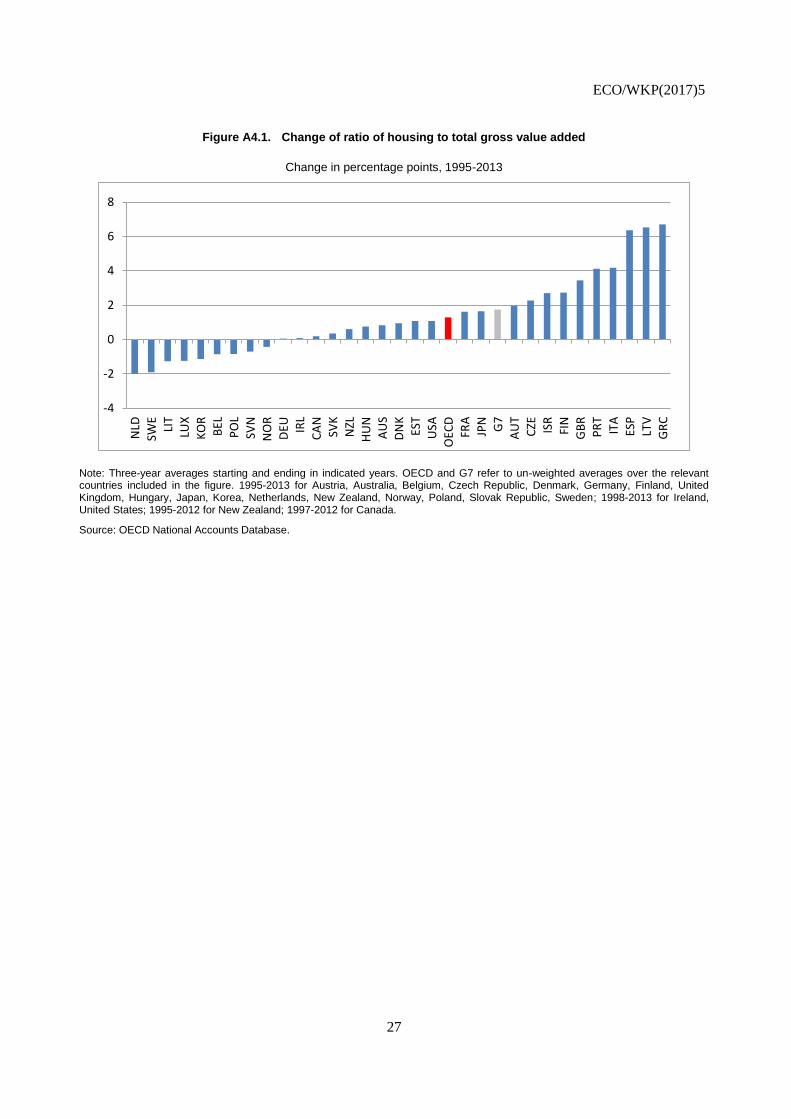
4. Share of housing in total value added
8. In the national accounts, rents paid by tenants to landlords and imputed rents of home owner-
occupiers are recorded as output of the housing sector and the overwhelming part of it ends up in gross
operating surplus, so that the labour share in the housing sector is well below the labour share of the total
economy. Consequently, an increase in the share of housing to total value added puts downward pressure
on the total economy labour share. Between 1995 and 2014, the share of the housing sector in total value
added increased by more than 4 percentage points for Greece, Italy, Latvia, Portugal and Spain, and by
more the 2 percentage points for Czech Republic, Finland, Israel and United Kingdom (Annex Figure
A4.1).
-1.5
-1
-0.5
0
0.5
1
1.5
SVN
SWE
AU
S
ITA
AU
T
OEC
D
DEN BEL
FRA
NLD ES
T
FIN
CZE
GR
C
ECO/WKP(2017)5
27
Figure A4.1. Change of ratio of housing to total gross value added
Change in percentage points, 1995-2013
Note: Three-year averages starting and ending in indicated years. OECD and G7 refer to un-weighted averages over the relevant countries included in the figure. 1995-2013 for Austria, Australia, Belgium, Czech Republic, Denmark, Germany, Finland, United Kingdom, Hungary, Japan, Korea, Netherlands, New Zealand, Norway, Poland, Slovak Republic, Sweden; 1998-2013 for Ireland, United States; 1995-2012 for New Zealand; 1997-2012 for Canada.
Source: OECD National Accounts Database.
-4
-2
0
2
4
6
8
NLD
SWE
LIT
LUX
KO
RB
ELP
OL
SVN
NO
RD
EU IRL
CA
NSV
KN
ZLH
UN
AU
SD
NK
EST
USA
OEC
DFR
AJP
N G7
AU
TC
ZE ISR
FIN
GB
RP
RT
ITA
ESP
LTV
GR
C