Embed Size (px)
Citation preview
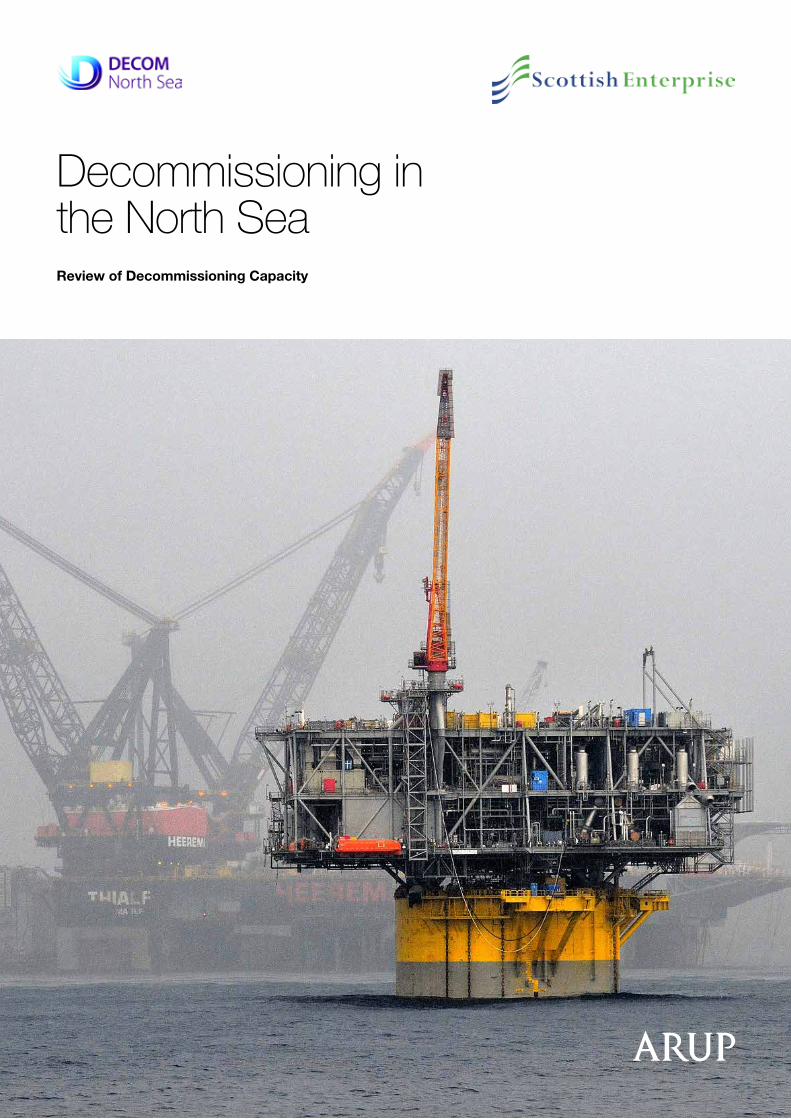
Decommissioning in the North SeaReview of Decommissioning Capacity
2
Decom North Sea Review of Decommissioning Capacity | October 2014
© Boskalis
3
Decom North Sea Review of Decommissioning Capacity | October 2014
Contents
Executive Summary 4
1 Introduction 7
1.1 Background and Context 8
1.2 Drivers and Influencers 9
1.3 The North Sea in Numbers 10
1.4 Decommissioning Approaches 14
2 Analysis of Supply Chain Approach 17
2.1 Analysis Approach 18
2.2 Resource Breakdown Structure 19
2.3 Programme 18
3 Market Forecasts 23
3.1 Market Forecasts of Expenditure 24
3.2 Market Forecasts of Activity 30
4 Critical Supply Chain Elements 39
5 Well Abandonment 45
5.1 Overview 47
5.2 Activity 48
5.3 Supply Chain 50
5.4 Health Check 52
6 Topside and Substructure Removal 55
7.1 Overview 57
7.2 Activity 58
7.3 Supply Chain 60
7.4 Health Check 63
7 Topsides and Substructure 65 Recycling
7.1 Overview 67
7.2 Activity 68
7.3 Supply Chain 70
7.4 Analysis 74
8 People 77
9 Context and Considerations 81
Appendix A: References 87
Appendix B: Criteria Scoring 91
Appendix C: Resources 95
Contents
4
Decom North Sea Review of Decommissioning Capacity | October 2014
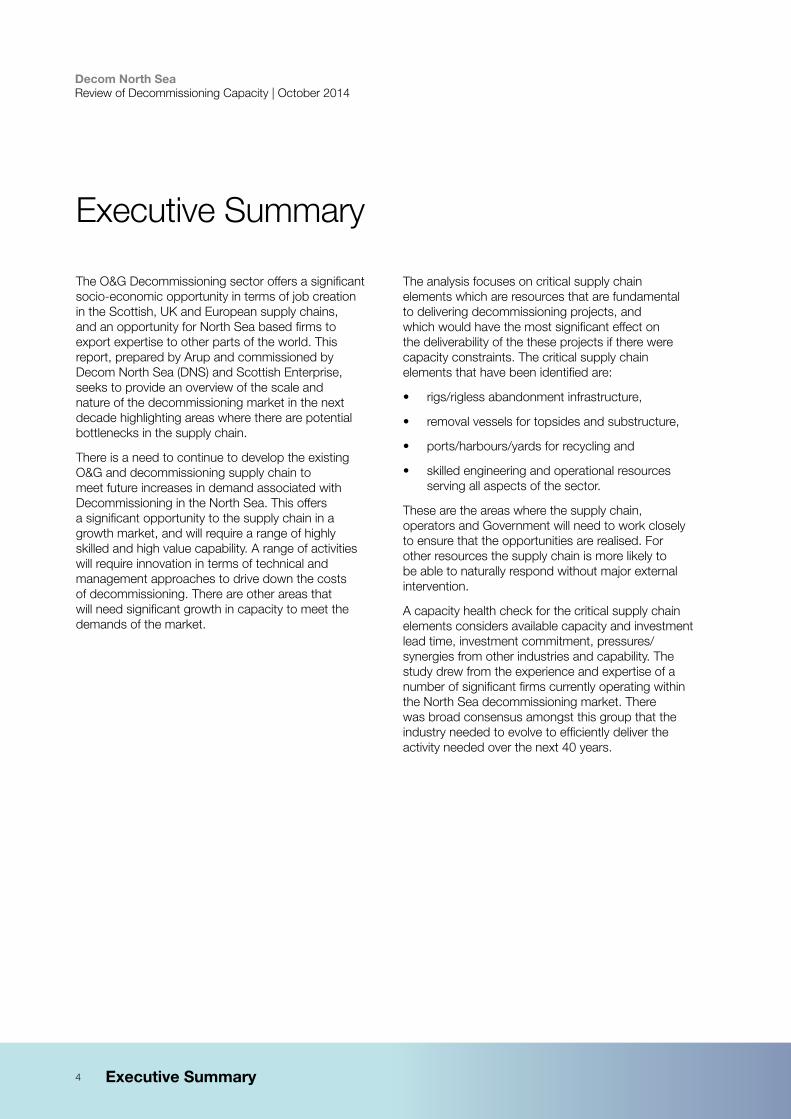
The O&G Decommissioning sector offers a significant socio-economic opportunity in terms of job creation in the Scottish, UK and European supply chains, and an opportunity for North Sea based firms to export expertise to other parts of the world. This report, prepared by Arup and commissioned by Decom North Sea (DNS) and Scottish Enterprise, seeks to provide an overview of the scale and nature of the decommissioning market in the next decade highlighting areas where there are potential bottlenecks in the supply chain.
There is a need to continue to develop the existing O&G and decommissioning supply chain to meet future increases in demand associated with Decommissioning in the North Sea. This offers a significant opportunity to the supply chain in a growth market, and will require a range of highly skilled and high value capability. A range of activities will require innovation in terms of technical and management approaches to drive down the costs of decommissioning. There are other areas that will need significant growth in capacity to meet the demands of the market.
Executive Summary
The analysis focuses on critical supply chain elements which are resources that are fundamental to delivering decommissioning projects, and which would have the most significant effect on the deliverability of the these projects if there were capacity constraints. The critical supply chain elements that have been identified are:
• rigs/rigless abandonment infrastructure,
• removal vessels for topsides and substructure,
• ports/harbours/yards for recycling and
• skilled engineering and operational resources serving all aspects of the sector.
These are the areas where the supply chain, operators and Government will need to work closely to ensure that the opportunities are realised. For other resources the supply chain is more likely to be able to naturally respond without major external intervention.
A capacity health check for the critical supply chain elements considers available capacity and investment lead time, investment commitment, pressures/synergies from other industries and capability. The study drew from the experience and expertise of a number of significant firms currently operating within the North Sea decommissioning market. There was broad consensus amongst this group that the industry needed to evolve to efficiently deliver the activity needed over the next 40 years.
Executive Summary
5
Decom North Sea Review of Decommissioning Capacity | October 2014
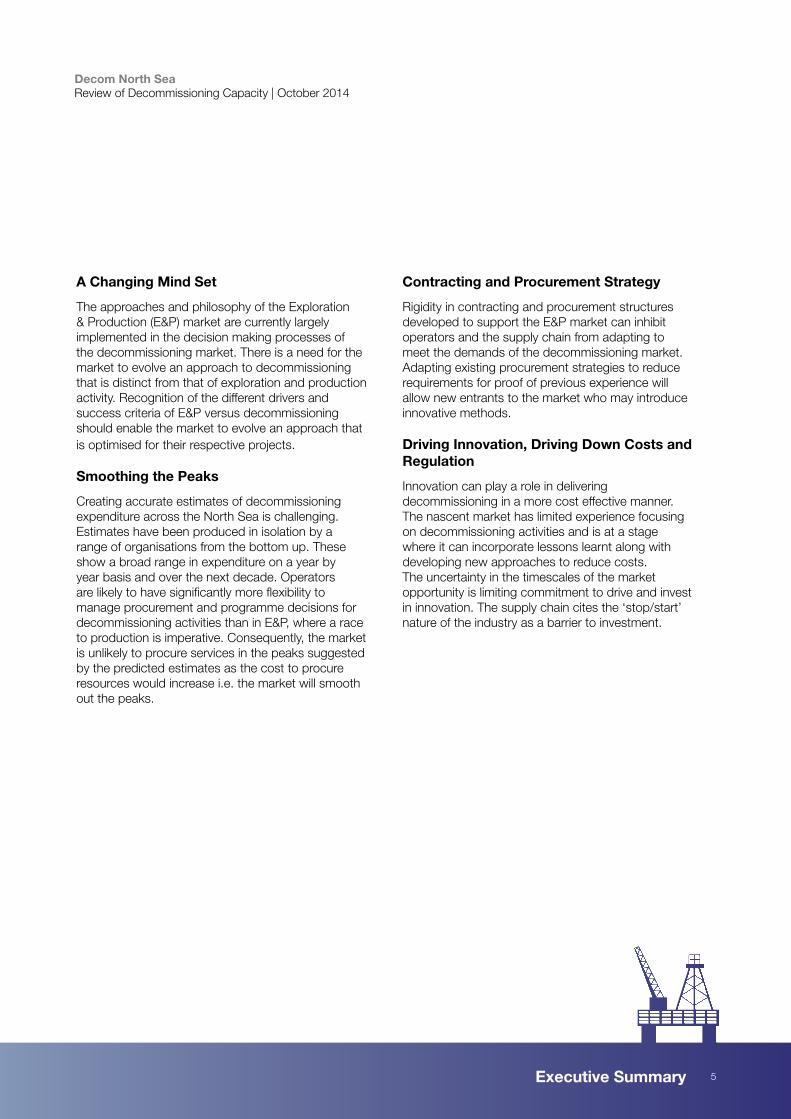
A Changing Mind Set
The approaches and philosophy of the Exploration & Production (E&P) market are currently largely implemented in the decision making processes of the decommissioning market. There is a need for the market to evolve an approach to decommissioning that is distinct from that of exploration and production activity. Recognition of the different drivers and success criteria of E&P versus decommissioning should enable the market to evolve an approach that is optimised for their respective projects.
Smoothing the Peaks
Creating accurate estimates of decommissioning expenditure across the North Sea is challenging. Estimates have been produced in isolation by a range of organisations from the bottom up. These show a broad range in expenditure on a year by year basis and over the next decade. Operators are likely to have significantly more flexibility to manage procurement and programme decisions for decommissioning activities than in E&P, where a race to production is imperative. Consequently, the market is unlikely to procure services in the peaks suggested by the predicted estimates as the cost to procure resources would increase i.e. the market will smooth out the peaks.
Contracting and Procurement Strategy
Rigidity in contracting and procurement structures developed to support the E&P market can inhibit operators and the supply chain from adapting to meet the demands of the decommissioning market. Adapting existing procurement strategies to reduce requirements for proof of previous experience will allow new entrants to the market who may introduce innovative methods.
Driving Innovation, Driving Down Costs and Regulation
Innovation can play a role in delivering decommissioning in a more cost effective manner. The nascent market has limited experience focusing on decommissioning activities and is at a stage where it can incorporate lessons learnt along with developing new approaches to reduce costs. The uncertainty in the timescales of the market opportunity is limiting commitment to drive and invest in innovation. The supply chain cites the ‘stop/start’ nature of the industry as a barrier to investment.
Executive Summary

Decom North Sea Review of Decommissioning Capacity | October 2014
6

Decom North Sea Review of Decommissioning Capacity | October 2014
7
1.0 Introduction
8
Decom North Sea Review of Decommissioning Capacity | October 2014
The Cost
Projected North Sea decommissioning activity estimates vary, with the most conservative estimates predicting the market will require over £30bn of expenditure before 2040 in the UK Continental Shelf (UKCS) alone[1]. As ageing assets reach the end of their economically useful life it is expected that the next 5 to 10 years will see a significant increase in activity, increasing up to an estimated annual spend in excess of £2.5bn per annum[1],[2],[3].
The Opportunity
The Decommissioning Sector offers a significant socio-economic opportunity in terms of job creation in the Scottish, UK and European supply chains, and a foundation from which North Sea based firms can export expertise to other parts of the world. To take full advantage of this opportunity, the industry must build on its existing capacity and capability to service the complex and demanding nature of decommissioning work in the North Sea.
The Objectives
This report, prepared by Arup and commissioned by DNS and Scottish Enterprise, seeks to provide an easily understandable and concise overview of the scale and nature of the decommissioning market. In particular, highlighting areas where there are potential bottlenecks in the supply chain which might impact decommissioning activity levels.
1.1 Background and Context
The Scope
North Sea O&G resources are extracted from the North Sea and proximate areas including the Norwegian Sea and Atlantic Ocean. This area is collectively known as the North Sea within the O&G industry. Four countries have O&G resources rights which they exploit in the North Sea. These are the United Kingdom, Norway, Denmark, and the Netherlands, and it is this area that is the focus of this study.
The Contributors
This report uses a number of existing sources of information to assess the likely scale of demand for decommissioning services. It then draws on Arup’s knowledge of the Sector, along with the expert views of a range of industry leaders in the field, to identify and assess critical areas of capability and capacity. Particular thanks go to the following for their invaluable insight and contributions:
Aker Solutions
CNR International
Halliburton
Marathon Oil
Royal Boskalis Westminster N.V.
Seaway Heavy-lifting
Weatherford International
Wood Group
Introduction | Background and Context
Note: All references can be found in Appendix A
9
Decom North Sea Review of Decommissioning Capacity | October 2014
1.2 Drivers and Influencers
The market drivers are complex and there are many technical, commercial and regulatory influences which will affect the manner in which the market for decommissioning activity is realised. Understanding the opportunities and challenges presented by North Sea O&G decommissioning is best informed by reviewing the market as part of a much more extensive whole, including E&P and other competing industries.
Regulation
A range of international and national legislations impact the North Sea Decommissioning Sector. Of these, OSPAR is particularly significant in terms of influencing decommissioning approach.
OSPAR Decision 98/3 prohibits leaving offshore installations wholly or partly in place unless further derogation are granted. However, it provides certain derogations to concrete structures and the footing of large steel jackets weighing more than 10,000 tonnes, from the fundamental principle that decommissioning should result in full removal of the installation. Derogation is not automatically available and is subject to a detailed assessment and consultation procedure to determine if there are significant reasons to allow the installation (or part thereof) to remain in situ. Furthermore, no derogation is available to steel installations constructed after 9 February 1999 (being the date that Decision 98/3 came into force).
As a result of the OSPAR ruling, the North Sea will lead global decommissioning practice from a total removal perspective.
The Other Industries
Decommissioning offshore installations is one component of offshore industrial activities occurring in the North Sea. These include E&P, offshore wind, marine renewables, power and communications networks, and port and harbour developments.
Understanding the opportunities and challenges presented by North Sea O&G decommissioning therefore needs to be considered in the context of these wider activities.
This broader appreciation will provide a greater understanding of where it competes for resources with other offshore activities, and where possible synergies exist, notably in the area of transferable skills.
The Global Industry
In terms of expenditure, the North Sea represents an important but modest part of an extensive global O&G industry, including onshore and offshore activity across upstream, midstream and downstream Sectors.
The resources supporting the North Sea market tend to be highly mobile and operate in a global, rather than local market. The cycles of the global activity will influence the availability of certain North Sea resources.
Asset Life Cycle
Decommissioning is the final chapter of a whole asset lifecycle, which often stretches back many years to initial fabrication and installation, through maintenance, refurbishment and production, then into the late life asset management cycle, including cessation of production and ultimately decommissioning. The design and management of the asset through its long life cycle will influence the approach to decommissioning and provides important context for the market.
Interdependent Systems
Individual offshore O&G assets, be they platforms, pipelines, wells or utilities, often interact with and are interdependent upon one another to a greater or lesser degree. While these can introduce additional complexities to the decommissioning process, they can offer opportunities to increase the decommissioning process’ efficiency through integrated management of systems and processes.
Introduction | Drivers and Influencers
10
Decom North Sea Review of Decommissioning Capacity | October 2014
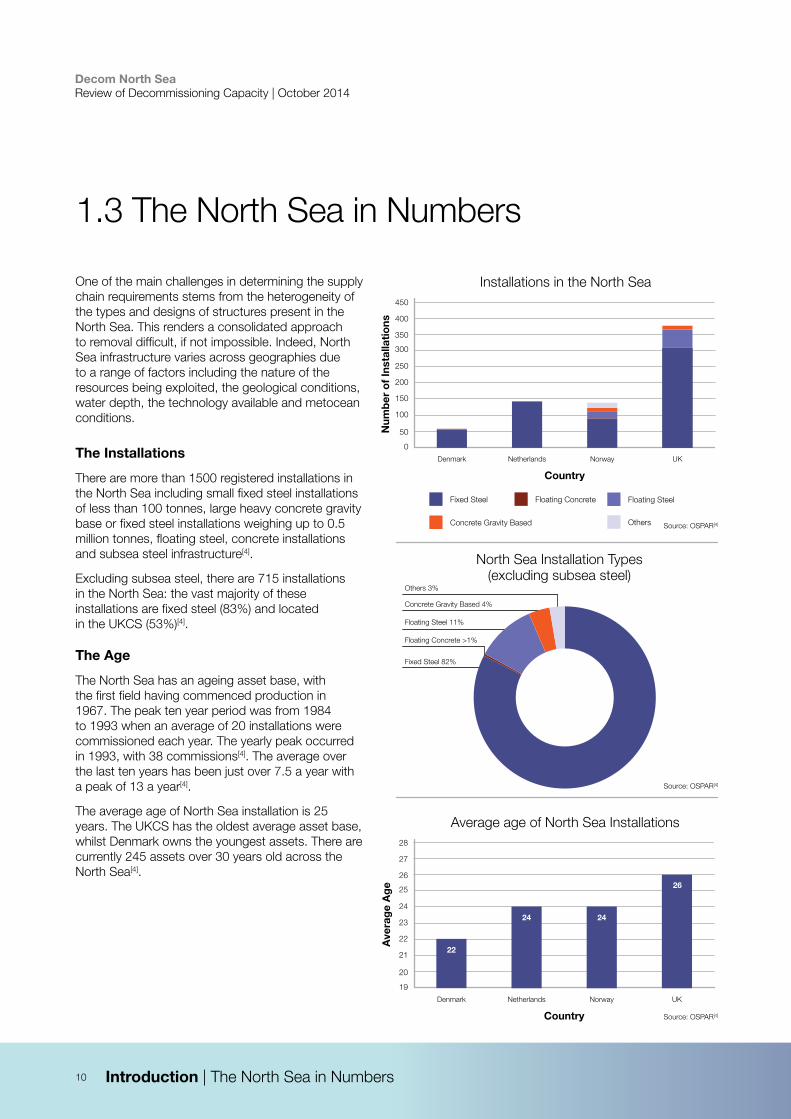
One of the main challenges in determining the supply chain requirements stems from the heterogeneity of the types and designs of structures present in the North Sea. This renders a consolidated approach to removal difficult, if not impossible. Indeed, North Sea infrastructure varies across geographies due to a range of factors including the nature of the resources being exploited, the geological conditions, water depth, the technology available and metocean conditions.
The Installations
There are more than 1500 registered installations in the North Sea including small fixed steel installations of less than 100 tonnes, large heavy concrete gravity base or fixed steel installations weighing up to 0.5 million tonnes, floating steel, concrete installations and subsea steel infrastructure[4].
Excluding subsea steel, there are 715 installations in the North Sea: the vast majority of these installations are fixed steel (83%) and located in the UKCS (53%)[4].
The Age
The North Sea has an ageing asset base, with the first field having commenced production in 1967. The peak ten year period was from 1984 to 1993 when an average of 20 installations were commissioned each year. The yearly peak occurred in 1993, with 38 commissions[4]. The average over the last ten years has been just over 7.5 a year with a peak of 13 a year[4].
The average age of North Sea installation is 25 years. The UKCS has the oldest average asset base, whilst Denmark owns the youngest assets. There are currently 245 assets over 30 years old across the North Sea[4].
1.3 The North Sea in Numbers
Denmark Netherlands Norway UK
Installations in the North Sea
Num
ber
of
Inst
alla
tio
ns
300
200
100
0
400
150
50
250
350
450
Country
Fixed Steel Floating SteelFloating Concrete
Concrete Gravity Based Others Source: OSPAR[4]
Others 3%
Concrete Gravity Based 4%
Floating Steel 11%
Floating Concrete >1%
Fixed Steel 82%
North Sea Installation Types (excluding subsea steel)
Source: OSPAR[4]
Denmark Netherlands Norway UK
Average age of North Sea Installations
Ave
rag
e A
ge 25
23
21
19
27
22
20
24
26
28
Country
22
24 24
26
Source: OSPAR[4]
Introduction | The North Sea in Numbers
11
Decom North Sea Review of Decommissioning Capacity | October 2014
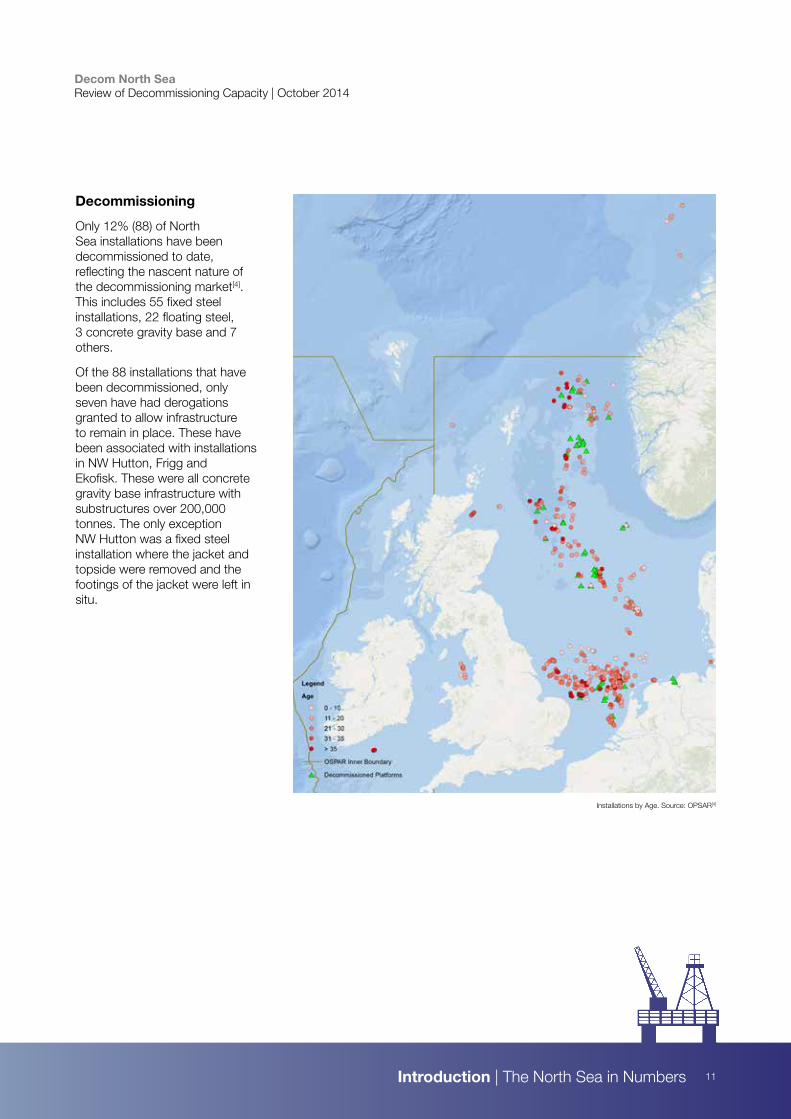
Decommissioning
Only 12% (88) of North Sea installations have been decommissioned to date, reflecting the nascent nature of the decommissioning market[4]. This includes 55 fixed steel installations, 22 floating steel, 3 concrete gravity base and 7 others.
Of the 88 installations that have been decommissioned, only seven have had derogations granted to allow infrastructure to remain in place. These have been associated with installations in NW Hutton, Frigg and Ekofisk. These were all concrete gravity base infrastructure with substructures over 200,000 tonnes. The only exception NW Hutton was a fixed steel installation where the jacket and topside were removed and the footings of the jacket were left in situ.
Installations by Age. Source: OPSAR[4]
Introduction | The North Sea in Numbers
12
Decom North Sea Review of Decommissioning Capacity | October 2014
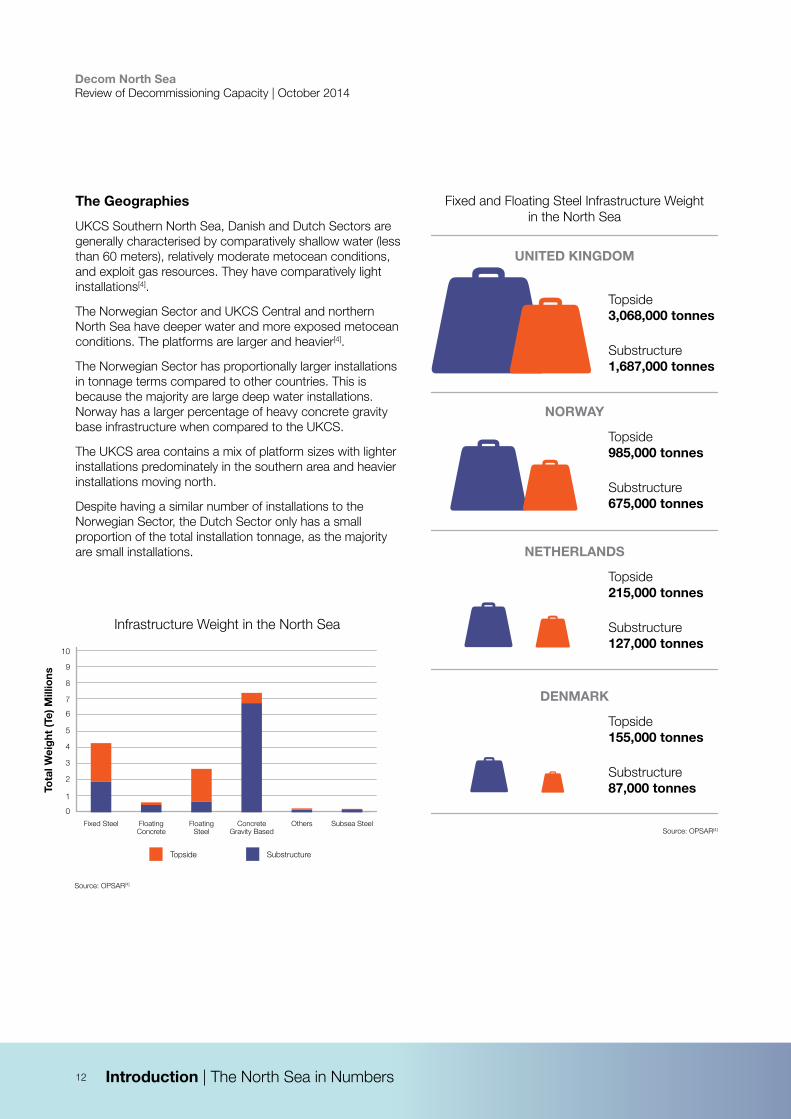
The Geographies
UKCS Southern North Sea, Danish and Dutch Sectors are generally characterised by comparatively shallow water (less than 60 meters), relatively moderate metocean conditions, and exploit gas resources. They have comparatively light installations[4].
The Norwegian Sector and UKCS Central and northern North Sea have deeper water and more exposed metocean conditions. The platforms are larger and heavier[4].
The Norwegian Sector has proportionally larger installations in tonnage terms compared to other countries. This is because the majority are large deep water installations. Norway has a larger percentage of heavy concrete gravity base infrastructure when compared to the UKCS.
The UKCS area contains a mix of platform sizes with lighter installations predominately in the southern area and heavier installations moving north.
Despite having a similar number of installations to the Norwegian Sector, the Dutch Sector only has a small proportion of the total installation tonnage, as the majority are small installations.
Fixed and Floating Steel Infrastructure Weight in the North Sea
Topside3,068,000 tonnes
Substructure1,687,000 tonnes
UNITED KINGDOM
Topside985,000 tonnes
Substructure675,000 tonnes
NORWAY
Topside215,000 tonnes
Substructure127,000 tonnes
NETHERLANDS
Topside155,000 tonnes
Substructure87,000 tonnes
DENMARK
Fixed Steel Floating Concrete
Floating Steel
Concrete Gravity Based
Others Subsea Steel
Infrastructure Weight in the North Sea
Tota
l Wei
ght
(Te)
Mill
ions
6
4
2
0
Topside Substructure
8
10
3
1
5
7
9
Source: OPSAR[4]
Introduction | The North Sea in Numbers
Source: OPSAR[4]
13
Decom North Sea Review of Decommissioning Capacity | October 2014
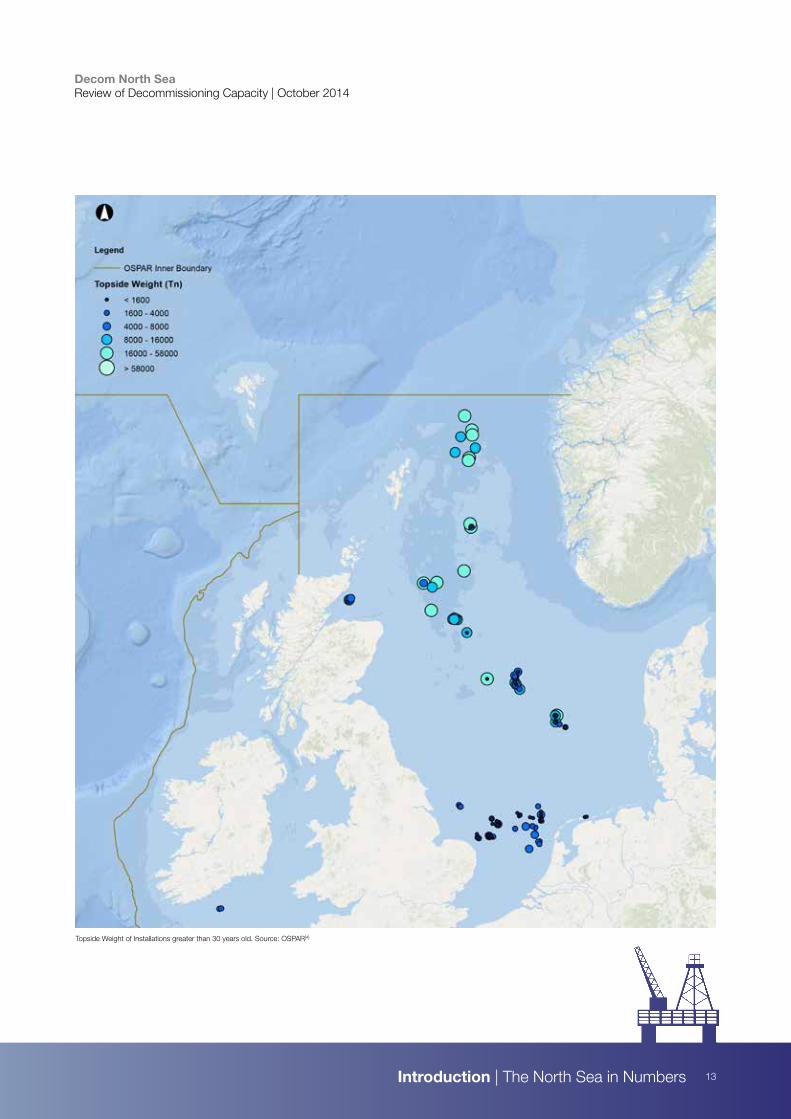
Topside Weight of Installations greater than 30 years old. Source: OSPAR[4]
Introduction | The North Sea in Numbers
14
Decom North Sea Review of Decommissioning Capacity | October 2014
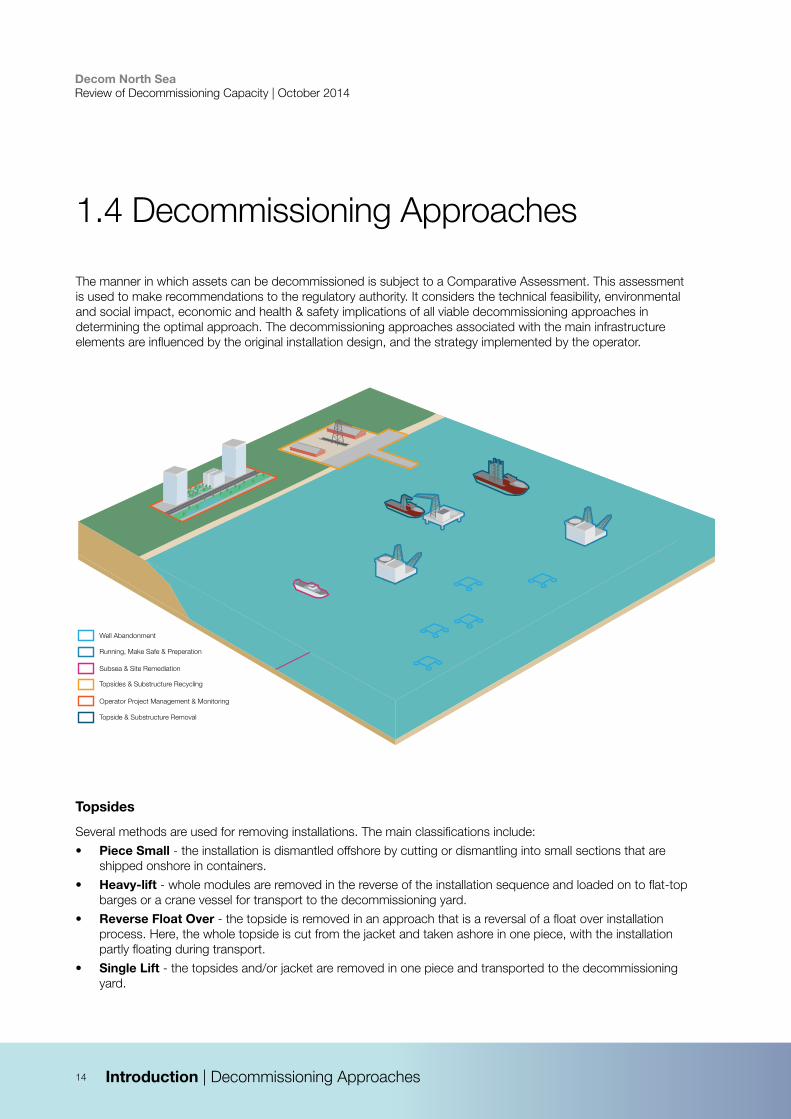
The manner in which assets can be decommissioned is subject to a Comparative Assessment. This assessment is used to make recommendations to the regulatory authority. It considers the technical feasibility, environmental and social impact, economic and health & safety implications of all viable decommissioning approaches in determining the optimal approach. The decommissioning approaches associated with the main infrastructure elements are influenced by the original installation design, and the strategy implemented by the operator.
1.4 Decommissioning Approaches
Well Abandonment
Running, Make Safe & Preperation
Subsea & Site Remediation
Topsides & Substructure Recycling
Operator Project Management & Monitoring
Topside & Substructure Removal
Topsides
Several methods are used for removing installations. The main classifications include:
• Piece Small - the installation is dismantled offshore by cutting or dismantling into small sections that are shipped onshore in containers.
• Heavy-lift - whole modules are removed in the reverse of the installation sequence and loaded on to flat-top barges or a crane vessel for transport to the decommissioning yard.
• Reverse Float Over - the topside is removed in an approach that is a reversal of a float over installation process. Here, the whole topside is cut from the jacket and taken ashore in one piece, with the installation partly floating during transport.
• Single Lift - the topsides and/or jacket are removed in one piece and transported to the decommissioning yard.
Introduction | Decommissioning Approaches
15
Decom North Sea Review of Decommissioning Capacity | October 2014
Substructures
The main classification of substructures includes:
• Steel Installations
• Floating Installations (concrete or steel)
• Concrete Gravity Bases
The majority of substructures will require total removal. For platforms with the option to apply for a derogation, they can be partially removed or left in place if approved.
The main classifications include:
• Heavy-lift [as explained in the section above]
• Reverse Installation [as explained in the section above]
• Single Lift [as explained in the section above]
• Buoyancy where buoyancy tanks are installed on the jacket legs to force the platform to the surface
Wells
Plugging & Abandonment (P&A) is the process by which a well is closed permanently, usually after either logs determine there is insufficient hydrocarbon potential to develop the well, or after production has ceased. Abandonment must be done in a way that protects the downhole and surface environment in perpetuity.
All wells must be plugged and abandoned according to regulations once no longer in use and their connecting platform is being decommissioned. P&A involves plugging off the well generally with cement plugs and salvaging all recoverable equipment. The standards applied in terms of expected integrity vary between jurisdictions. The North Sea has some of the world’s most stringent regulations. In this region, responsibilities for well integrity are enduring and any future failure must be remedied by the operators.
There is a diversity of well infrastructure in the North Sea which is determined by a variety of technical factors associated with the well including type, location, status and geology. Wells are associated with a range of E&P life cycle activities including exploration (identifying resource), appraisal (determining commercial viability) and development (extracting resource). Wells ready to be P&A may have been suspended through installation of a temporary cap. Alternatively, they may be associated with a depleted reservoir.
In order to determine the manner by which a well can be abandoned, data is collected from the well to determine its current condition. Depending on the age and history of the well and the quality of records, it can be challenging to accurately determine the well state. This creates risk in selecting the appropriate abandonment approach. An approach which can only be operated in good conditions may reduce costs if conditions turn out to be favourable but lead to significant additional costs if conditions are unfavourable.
Pipelines
OSPAR have not made any recommendation for pipelines, and therefore there is no obligation to remove them. Agreement must be obtained from the regulating authority on the appropriate approach through consideration in a comparative assessment. Key issues to be considered are pipeline cleanliness, stability, extent of burial and impact on other users of the sea.
There are diverging precedents in the North Sea. Indeed, some pipelines have been decommissioned in situ, while others have been removed to shore. Generally, the smaller pipelines which can be more easily removed without significantly disturbing the seabed are recovered. O&GUK have produced guidelines on the decommissioning of pipelines.
Introduction | Decommissioning Approaches
Decom North Sea Review of Decommissioning Capacity | October 2014
16
© Boskalis
Decom North Sea Review of Decommissioning Capacity | October 2014
17
2.0 Analysis of Supply Chain Approach
18
Decom North Sea Review of Decommissioning Capacity | October 2014
2.1 Analysis Approach
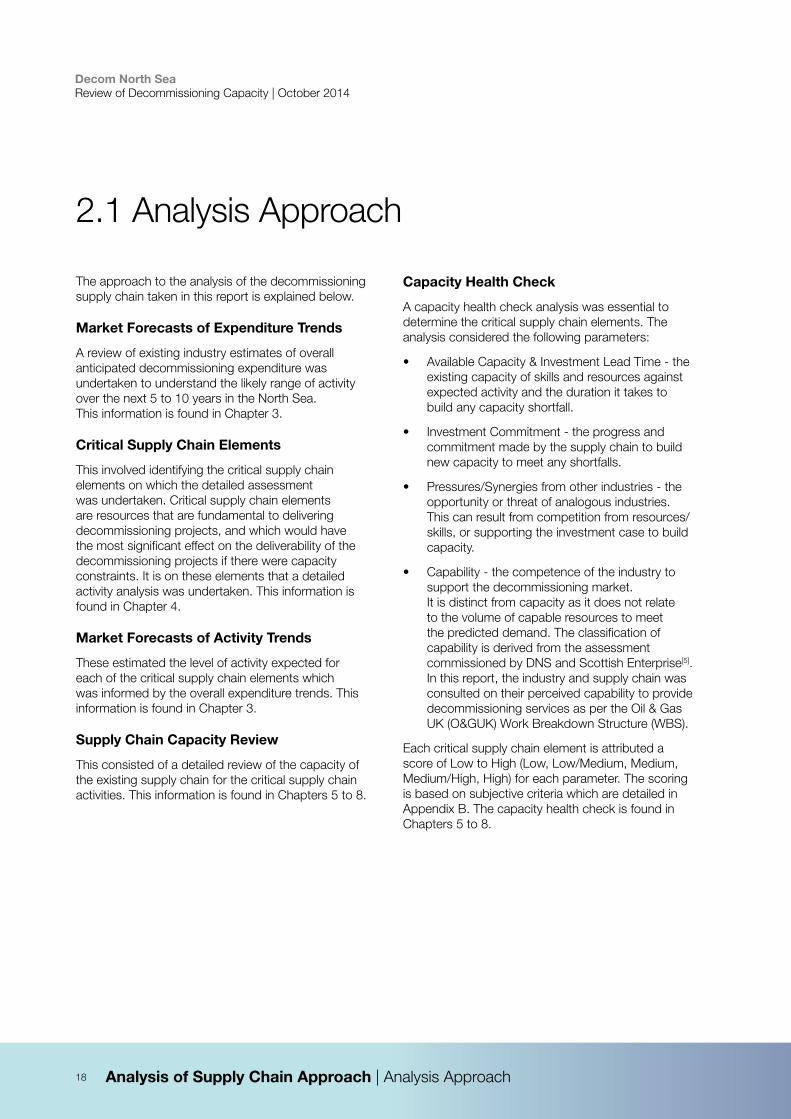
The approach to the analysis of the decommissioning supply chain taken in this report is explained below.
Market Forecasts of Expenditure Trends
A review of existing industry estimates of overall anticipated decommissioning expenditure was undertaken to understand the likely range of activity over the next 5 to 10 years in the North Sea. This information is found in Chapter 3.
Critical Supply Chain Elements
This involved identifying the critical supply chain elements on which the detailed assessment was undertaken. Critical supply chain elements are resources that are fundamental to delivering decommissioning projects, and which would have the most significant effect on the deliverability of the decommissioning projects if there were capacity constraints. It is on these elements that a detailed activity analysis was undertaken. This information is found in Chapter 4.
Market Forecasts of Activity Trends
These estimated the level of activity expected for each of the critical supply chain elements which was informed by the overall expenditure trends. This information is found in Chapter 3.
Supply Chain Capacity Review
This consisted of a detailed review of the capacity of the existing supply chain for the critical supply chain activities. This information is found in Chapters 5 to 8.
Capacity Health Check
A capacity health check analysis was essential to determine the critical supply chain elements. The analysis considered the following parameters:
• Available Capacity & Investment Lead Time - the existing capacity of skills and resources against expected activity and the duration it takes to build any capacity shortfall.
• Investment Commitment - the progress and commitment made by the supply chain to build new capacity to meet any shortfalls.
• Pressures/Synergies from other industries - the opportunity or threat of analogous industries. This can result from competition from resources/skills, or supporting the investment case to build capacity.
• Capability - the competence of the industry to support the decommissioning market. It is distinct from capacity as it does not relate to the volume of capable resources to meet the predicted demand. The classification of capability is derived from the assessment commissioned by DNS and Scottish Enterprise[5]. In this report, the industry and supply chain was consulted on their perceived capability to provide decommissioning services as per the Oil & Gas UK (O&GUK) Work Breakdown Structure (WBS).
Each critical supply chain element is attributed a score of Low to High (Low, Low/Medium, Medium, Medium/High, High) for each parameter. The scoring is based on subjective criteria which are detailed in Appendix B. The capacity health check is found in Chapters 5 to 8.
Analysis of Supply Chain Approach | Analysis Approach
19
Decom North Sea Review of Decommissioning Capacity | October 2014
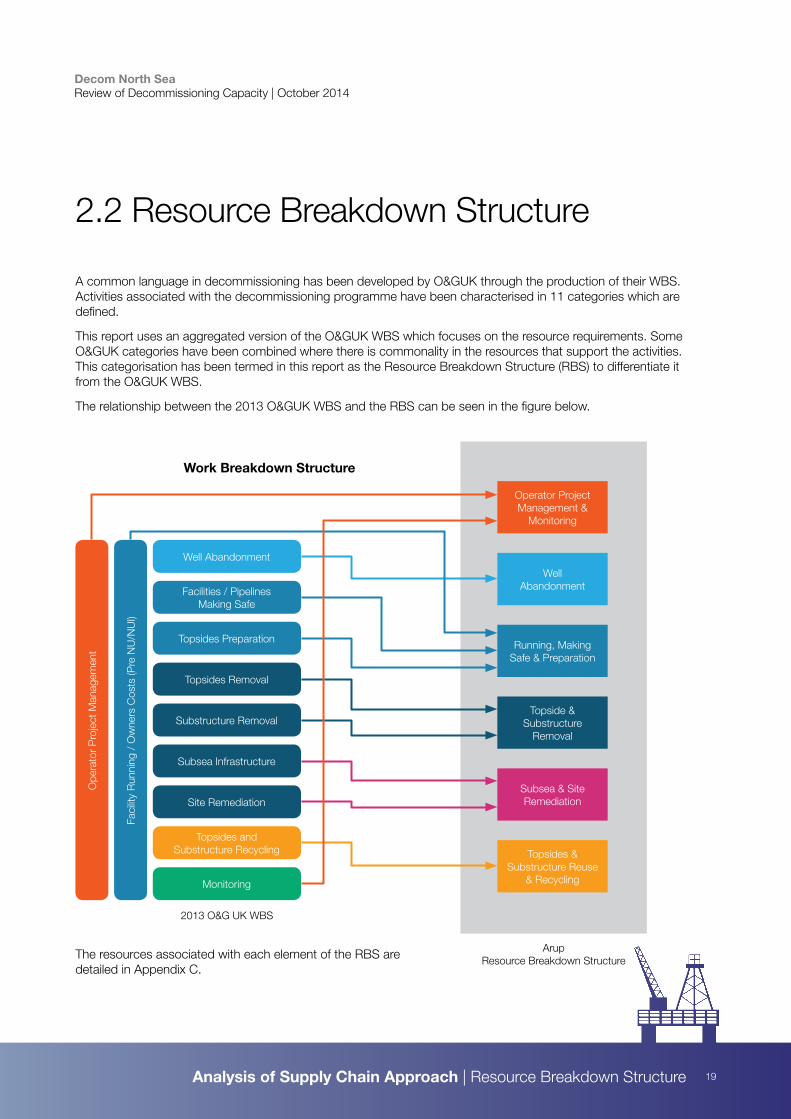
A common language in decommissioning has been developed by O&GUK through the production of their WBS. Activities associated with the decommissioning programme have been characterised in 11 categories which are defined.
This report uses an aggregated version of the O&GUK WBS which focuses on the resource requirements. Some O&GUK categories have been combined where there is commonality in the resources that support the activities. This categorisation has been termed in this report as the Resource Breakdown Structure (RBS) to differentiate it from the O&GUK WBS.
The relationship between the 2013 O&GUK WBS and the RBS can be seen in the figure below.
2.2 Resource Breakdown Structure
Well Abandonment
Facilities / Pipelines Making Safe
Topsides Preparation
Topsides Removal
Substructure Removal
Subsea Infrastructure
Site Remediation
Topsides and Substructure Recycling
Monitoring
Faci
lity
Run
ning
/ O
wne
rs C
osts
(Pre
NU
/NU
I)
Ope
rato
r P
roje
ct M
anag
emen
t
Operator Project Management &
Monitoring
Well Abandonment
Running, Making Safe & Preparation
Topside & Substructure
Removal
Subsea & Site Remediation
Topsides & Substructure Reuse
& Recycling
ArupResource Breakdown Structure
2013 O&G UK WBS
The resources associated with each element of the RBS are detailed in Appendix C.
Work Breakdown Structure
Analysis of Supply Chain Approach | Resource Breakdown Structure
20
Decom North Sea Review of Decommissioning Capacity | October 2014
21
Decom North Sea Review of Decommissioning Capacity | October 2014
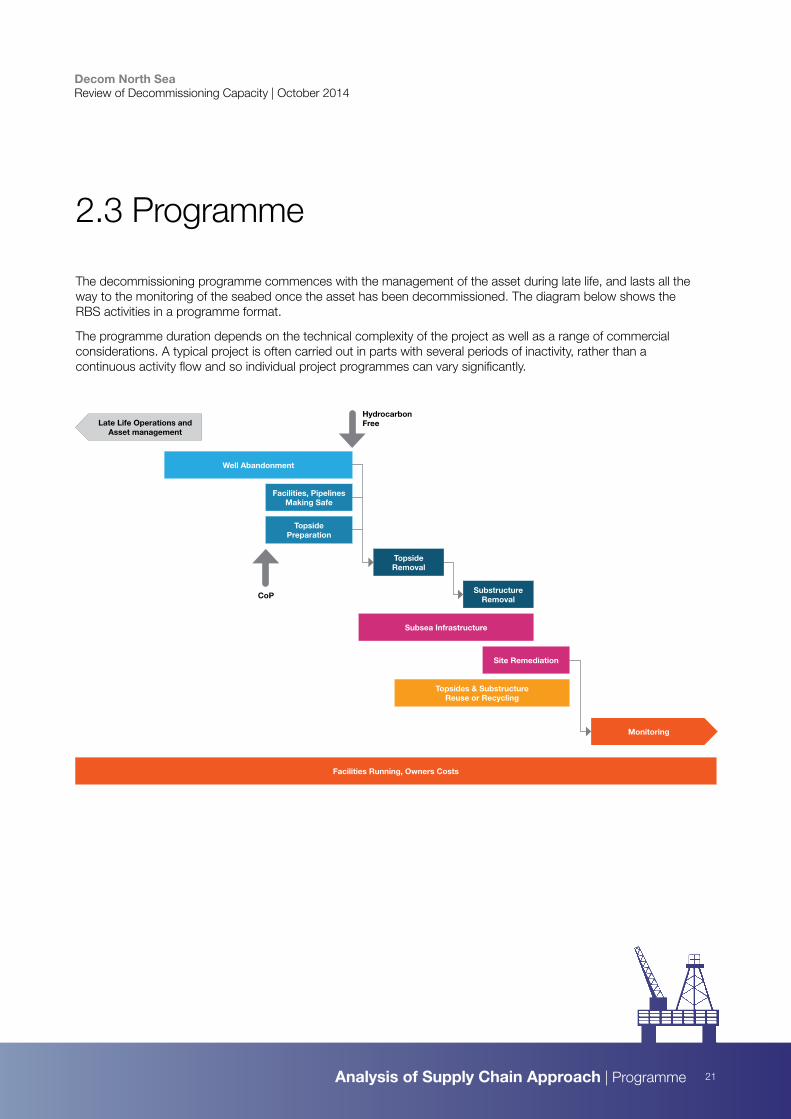
The decommissioning programme commences with the management of the asset during late life, and lasts all the way to the monitoring of the seabed once the asset has been decommissioned. The diagram below shows the RBS activities in a programme format.
The programme duration depends on the technical complexity of the project as well as a range of commercial considerations. A typical project is often carried out in parts with several periods of inactivity, rather than a continuous activity flow and so individual project programmes can vary significantly.
2.3 Programme
Late Life Operations and Asset management
Subsea Infrastructure
Topsides & Substructure Reuse or Recycling
Facilities Running, Owners Costs
Well Abandonment
Facilities, Pipelines Making Safe
Topside Preparation
Topside Removal
Substructure Removal
Site Remediation
Monitoring
Hydrocarbon Free
CoP
Analysis of Supply Chain Approach | Programme
Decom North Sea Review of Decommissioning Capacity | October 2014
22

Decom North Sea Review of Decommissioning Capacity | October 2014
23
3.0 Market Forecasts

24
Decom North Sea Review of Decommissioning Capacity | October 2014
Available market forecasts indicate that the overall decommissioning expenditure in the North Sea could be between £1.1bn and £2.6bn per annum, and is estimated to reach over £17bn for the period between 2014 to 2022[1], [3].
The UKCS is likely to be the largest sector of the North Sea decommissioning market, although Norway is expected to contribute a significant proportion of activity as the end of the decade approaches. Denmark and the Netherlands are likely to contribute a much smaller proportion of activity.
3.1 Market Forecasts of Expenditure
20222014 2015 2016 2017 2018 2019 2020 2021
Annual Estimated North Sea Decommissioning Expenditure
Est
imat
ed E
xpen
dit
ure
(£M
)
£1,500
£1,000
£500
£0
OGUK Insight 2013 Report UK
Mackay 2013 Norway
Mackay 2013 Denmark & Netherlands
£2,000
£2,500
£3,000
Source: Oil & Gas UK[1], Mackay Consultants[3]
Market Forecasts | Market Forecasts of Expenditure
20222014 2015 2016 2017 2018 2019 2020 2021
Annual Estimated North Sea Decommissioning Expenditure
Est
imat
ed E
xpen
dit
ure
(£M
)
£1,200
£800
£400
£0
£1,600
£2,000
£600
£200
£1,000
£1,400
£1,800
Source: Oil & Gas UK[1], Mackay Consultants[3]
OGUK Insight 2013 Report UK
Mackay 2013 Norway
Mackay 2013 Denmark & Netherlands
25
Decom North Sea Review of Decommissioning Capacity | October 2014
Predicting Decommissioning Activity
Accurate estimation of decommissioning expenditure is challenging. Forecasts have been produced by a number of organisations to estimate the profile of decommissioning expenditure in the North Sea over the next decade. These estimates are substantially diverse both in the short and long term.
The estimates are underpinned by assumptions of the costs of decommissioning activities and the programme in which activities are delivered. There is inherent uncertainty in both areas:
• The timing of decommissioning activities is informed by an economic analysis which considers the revenue generated from the asset in terms of productivity and market value of the resource, the costs to operate and maintain the infrastructure and the capital costs of decommissioning. Current trends have seen O&G prices increase, while technology innovation has allowed for improved extraction, increasing the life span of ageing infrastructure
• The costs of decommissioning generally have not to date been reliably predicted, due to the nascent stage of the industry. The evolving market has significant potential to reduce costs through applying innovative approaches that reduce costs and simplify operations.
Data from the Norwegian, Danish, and Dutch Sectors are significantly less detailed and less robust than data from the UKCS. Although these Sectors have fewer installations than the UKCS, they cumulatively represent almost half of the O&G infrastructure in the North Sea.
Profile of Market Activity
There are further limitations in decommissioning estimates which are built from a bottom-up analysis based on individual operators independently declaring their expected decommissioning schedule. These estimates suggest that activity will ramp up in the next decade with a number of peaks and troughs in activity.
However, the market is inherently different to that of E&P activities. In E&P programmes, delays directly impact the timing of subsequent revenue flows and programme drivers are highly significant in procurement decisions, resulting in an industry that has a peaking profile.
For decommissioning, programme delays defer capital expenditure and often have a relatively less significant detrimental impact on project economics. As a result, operators are likely to have higher flexibility to manage procurement and programme decisions, and are unlikely to procure in peak periods so there will be a flattening of the peaks and troughs with the decommissioning market flexing.
Market Forecasts | Market Forecasts of Expenditure
26
Decom North Sea Review of Decommissioning Capacity | October 2014
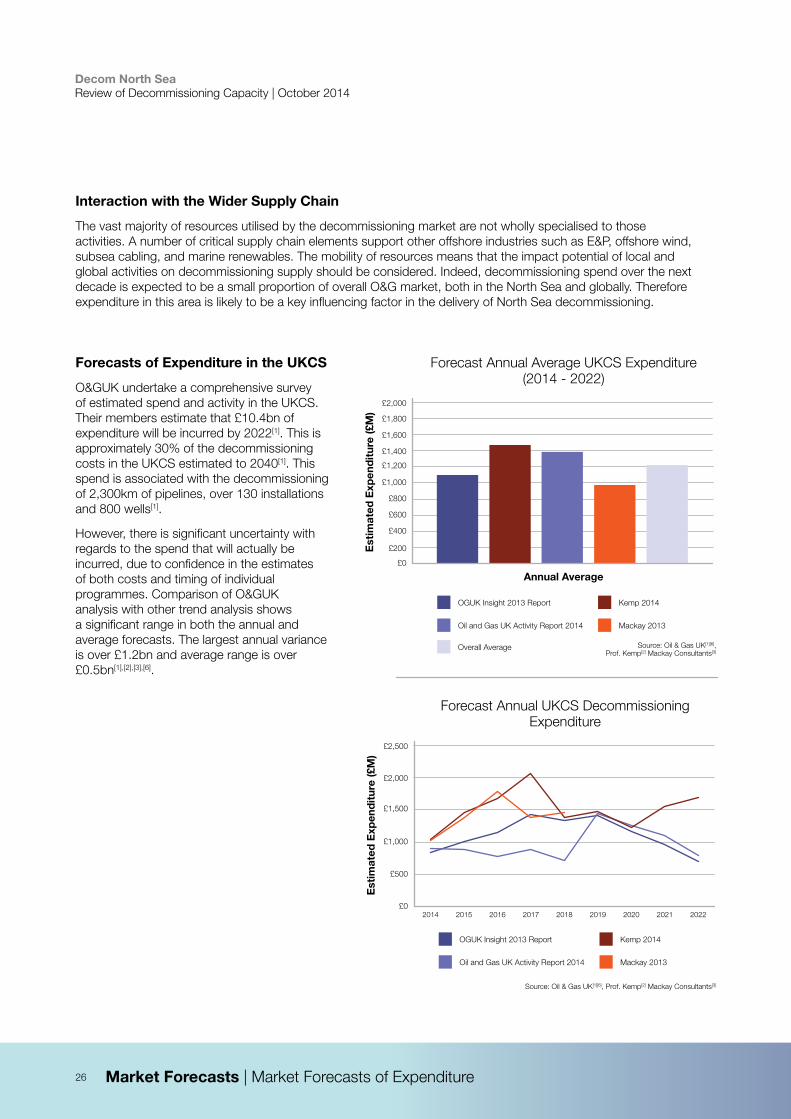
Interaction with the Wider Supply Chain
The vast majority of resources utilised by the decommissioning market are not wholly specialised to those activities. A number of critical supply chain elements support other offshore industries such as E&P, offshore wind, subsea cabling, and marine renewables. The mobility of resources means that the impact potential of local and global activities on decommissioning supply should be considered. Indeed, decommissioning spend over the next decade is expected to be a small proportion of overall O&G market, both in the North Sea and globally. Therefore expenditure in this area is likely to be a key influencing factor in the delivery of North Sea decommissioning.
Forecast Annual UKCS Decommissioning Expenditure
Est
imat
ed E
xpen
dit
ure
(£M
)
£1,500
£1,000
£500
£020222014 2015 2016 2017 2018 2019 2020 2021
OGUK Insight 2013 Report
Oil and Gas UK Activity Report 2014
Kemp 2014
Mackay 2013
£2,000
£2,500
Forecasts of Expenditure in the UKCS
O&GUK undertake a comprehensive survey of estimated spend and activity in the UKCS. Their members estimate that £10.4bn of expenditure will be incurred by 2022[1]. This is approximately 30% of the decommissioning costs in the UKCS estimated to 2040[1]. This spend is associated with the decommissioning of 2,300km of pipelines, over 130 installations and 800 wells[1].
However, there is significant uncertainty with regards to the spend that will actually be incurred, due to confidence in the estimates of both costs and timing of individual programmes. Comparison of O&GUK analysis with other trend analysis shows a significant range in both the annual and average forecasts. The largest annual variance is over £1.2bn and average range is over £0.5bn[1],[2],[3],[6].
Forecast Annual Average UKCS Expenditure (2014 - 2022)
Est
imat
ed E
xpen
dit
ure
(£M
)
£1,200
£800
£400
£0
OGUK Insight 2013 Report
Oil and Gas UK Activity Report 2014
Kemp 2014
Mackay 2013
£1,600
£2,000
£600
£200
£1,000
£1,400
£1,800
Overall Average
Annual Average
Source: Oil & Gas UK[1][6], Prof. Kemp[2] Mackay Consultants[3]
Source: Oil & Gas UK[1][6], Prof. Kemp[2] Mackay Consultants[3]
Market Forecasts | Market Forecasts of Expenditure
27
Decom North Sea Review of Decommissioning Capacity | October 2014
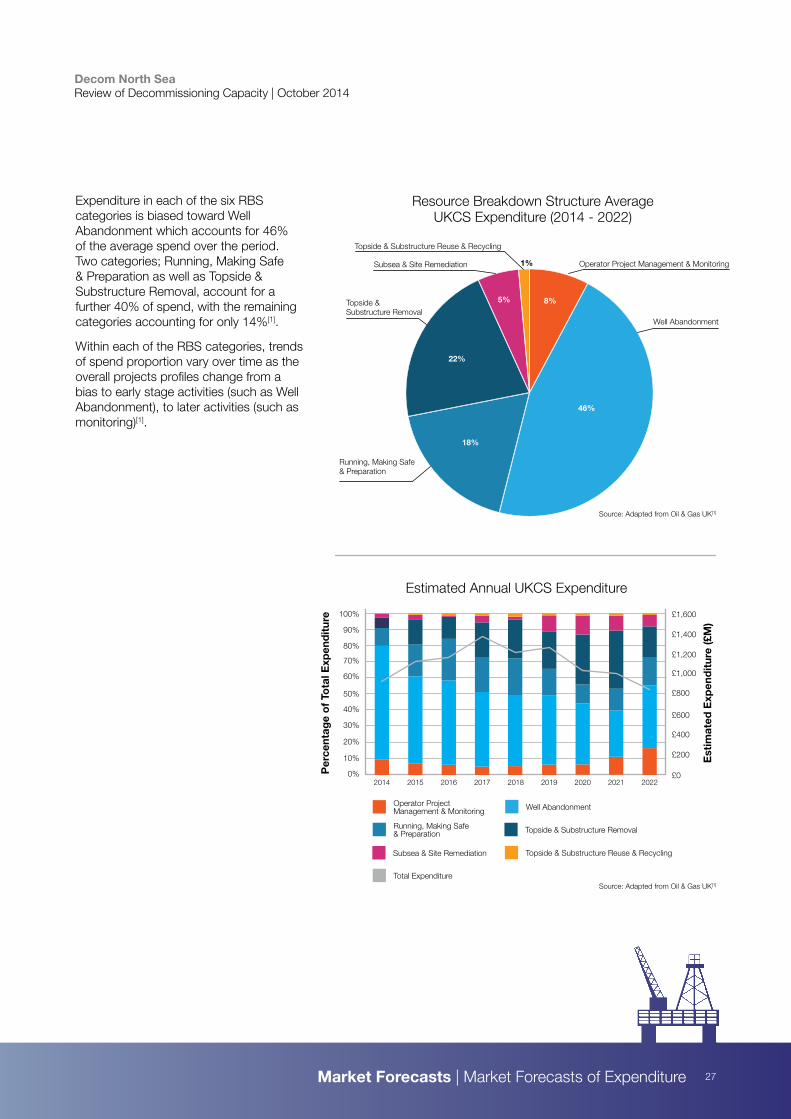
Running, Making Safe & Preparation
Expenditure in each of the six RBS categories is biased toward Well Abandonment which accounts for 46% of the average spend over the period. Two categories; Running, Making Safe & Preparation as well as Topside & Substructure Removal, account for a further 40% of spend, with the remaining categories accounting for only 14%[1].
Within each of the RBS categories, trends of spend proportion vary over time as the overall projects profiles change from a bias to early stage activities (such as Well Abandonment), to later activities (such as monitoring)[1].
Estimated Annual UKCS Expenditure
Operator Project Management & Monitoring
Per
cent
age
of
Tota
l Exp
end
itur
e
70%
60%
50%
40%
30%
20%
0%20222014 2015
Well Abandonment
2016 2017 2018 2019 2020 2021
10%
Topside & Substructure Removal
Topside & Substructure Reuse & Recycling
80%
90%
100%
Est
imat
ed E
xpen
dit
ure
(£M
)
£1,000
£800
£600
£400
£200
£0
£1,200
£1,400
£1,600
Total Expenditure
Resource Breakdown Structure Average UKCS Expenditure (2014 - 2022)
46%
1%
18%
22%
8%5%
Well Abandonment
Topside & Substructure Removal
Running, Making Safe & Preparation
Subsea & Site Remediation
Topside & Substructure Reuse & Recycling
Operator Project Management & Monitoring
Source: Adapted from Oil & Gas UK[1]
Source: Adapted from Oil & Gas UK[1]
Market Forecasts | Market Forecasts of Expenditure
Subsea & Site Remediation
28
Decom North Sea Review of Decommissioning Capacity | October 2014
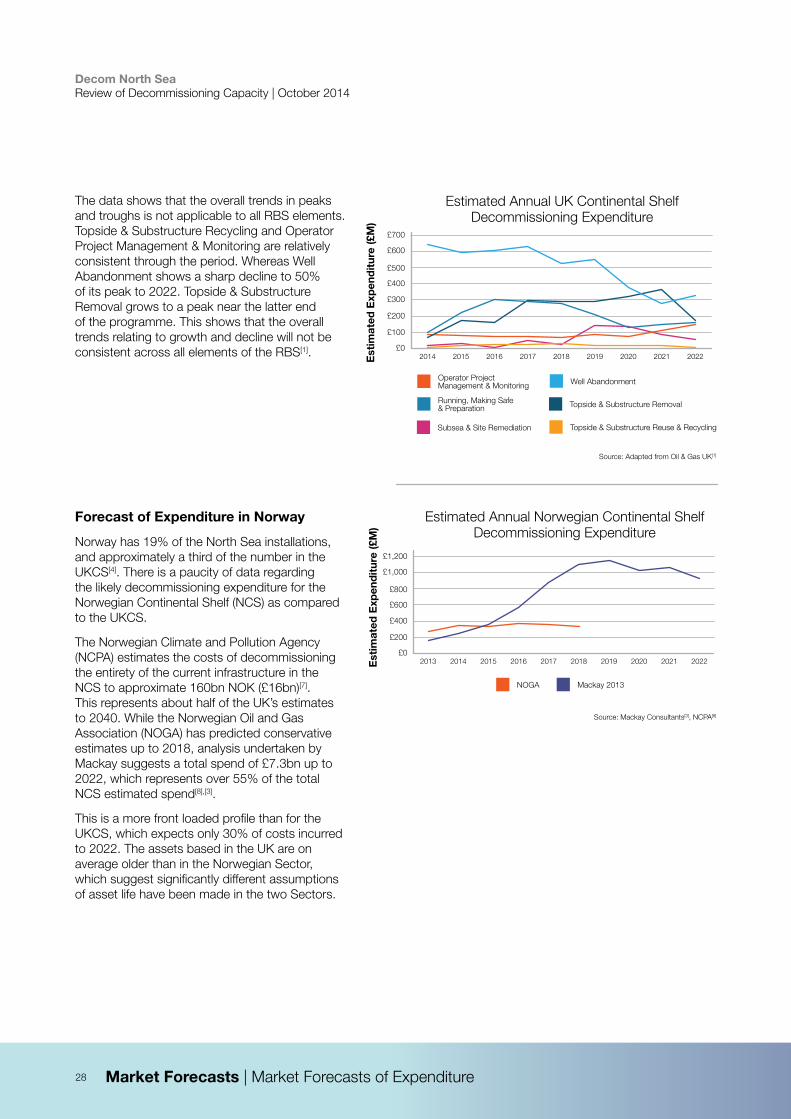
The data shows that the overall trends in peaks and troughs is not applicable to all RBS elements. Topside & Substructure Recycling and Operator Project Management & Monitoring are relatively consistent through the period. Whereas Well Abandonment shows a sharp decline to 50% of its peak to 2022. Topside & Substructure Removal grows to a peak near the latter end of the programme. This shows that the overall trends relating to growth and decline will not be consistent across all elements of the RBS[1].
Forecast of Expenditure in Norway
Norway has 19% of the North Sea installations, and approximately a third of the number in the UKCS[4]. There is a paucity of data regarding the likely decommissioning expenditure for the Norwegian Continental Shelf (NCS) as compared to the UKCS.
The Norwegian Climate and Pollution Agency (NCPA) estimates the costs of decommissioning the entirety of the current infrastructure in the NCS to approximate 160bn NOK (£16bn)[7]. This represents about half of the UK’s estimates to 2040. While the Norwegian Oil and Gas Association (NOGA) has predicted conservative estimates up to 2018, analysis undertaken by Mackay suggests a total spend of £7.3bn up to 2022, which represents over 55% of the total NCS estimated spend[8],[3].
This is a more front loaded profile than for the UKCS, which expects only 30% of costs incurred to 2022. The assets based in the UK are on average older than in the Norwegian Sector, which suggest significantly different assumptions of asset life have been made in the two Sectors.
2022
Estimated Annual Norwegian Continental Shelf Decommissioning Expenditure
NOGA
Est
imat
ed E
xpen
dit
ure
(£M
)
£1,200
£1,000
£800
£600
£400
£200
£02013 2014 2015 2016 2017 2018 2019 2020 2021
Mackay 2013
Source: Adapted from Oil & Gas UK[1]
Source: Mackay Consultants[3], NCPA[8]
Market Forecasts | Market Forecasts of Expenditure
Estimated Annual UK Continental ShelfDecommissioning Expenditure
Est
imat
ed E
xpen
dit
ure
(£M
)
£700
£600
£500
£400
£300
£200
£020222014 2015 2016 2017 2018 2019 2020 2021
£100
Running, Making Safe & Preparation
Operator Project Management & Monitoring Well Abandonment
Topside & Substructure Removal
Topside & Substructure Reuse & RecyclingSubsea & Site Remediation
29
Decom North Sea Review of Decommissioning Capacity | October 2014
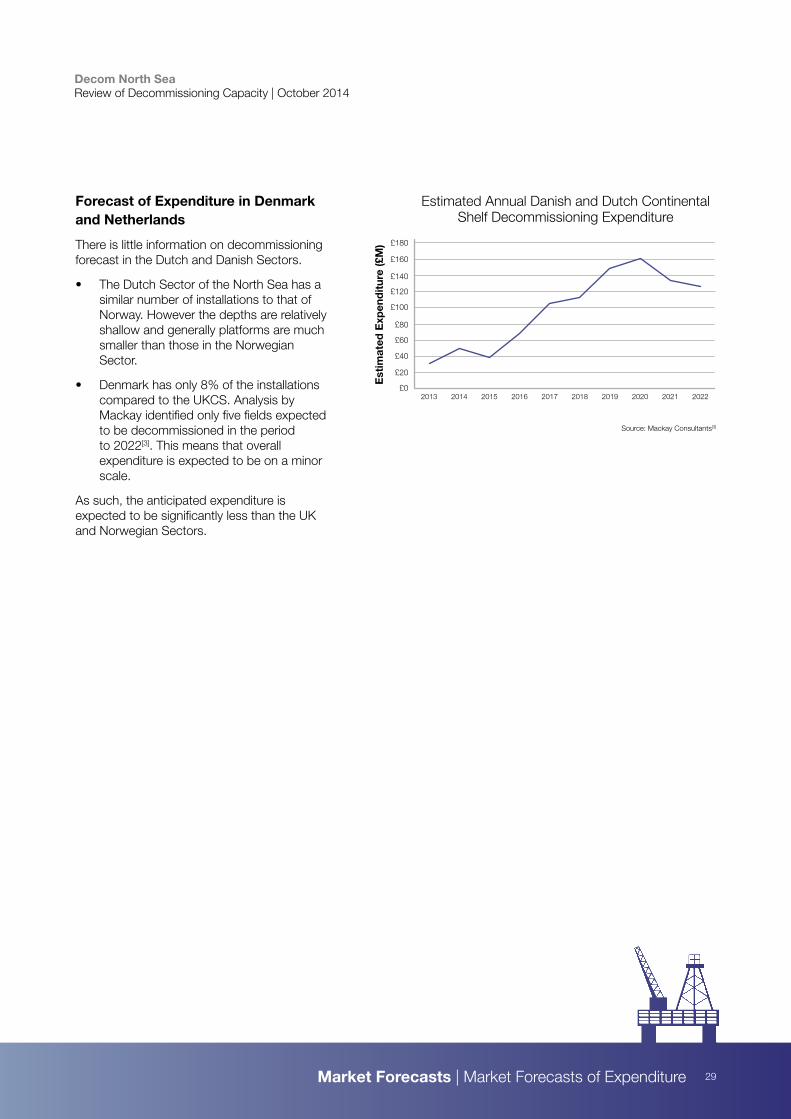
Forecast of Expenditure in Denmark and Netherlands
There is little information on decommissioning forecast in the Dutch and Danish Sectors.
• The Dutch Sector of the North Sea has a similar number of installations to that of Norway. However the depths are relatively shallow and generally platforms are much smaller than those in the Norwegian Sector.
• Denmark has only 8% of the installations compared to the UKCS. Analysis by Mackay identified only five fields expected to be decommissioned in the period to 2022[3]. This means that overall expenditure is expected to be on a minor scale.
As such, the anticipated expenditure is expected to be significantly less than the UK and Norwegian Sectors.
2022
Estimated Annual Danish and Dutch Continental Shelf Decommissioning Expenditure
Est
imat
ed E
xpen
dit
ure
(£M
)
£160
£140
£120
£100
£80
£60
£40
£20
£0
£180
2013 2014 2015 2016 2017 2018 2019 2020 2021
Source: Mackay Consultants[3]
Market Forecasts | Market Forecasts of Expenditure
30
Decom North Sea Review of Decommissioning Capacity | October 2014
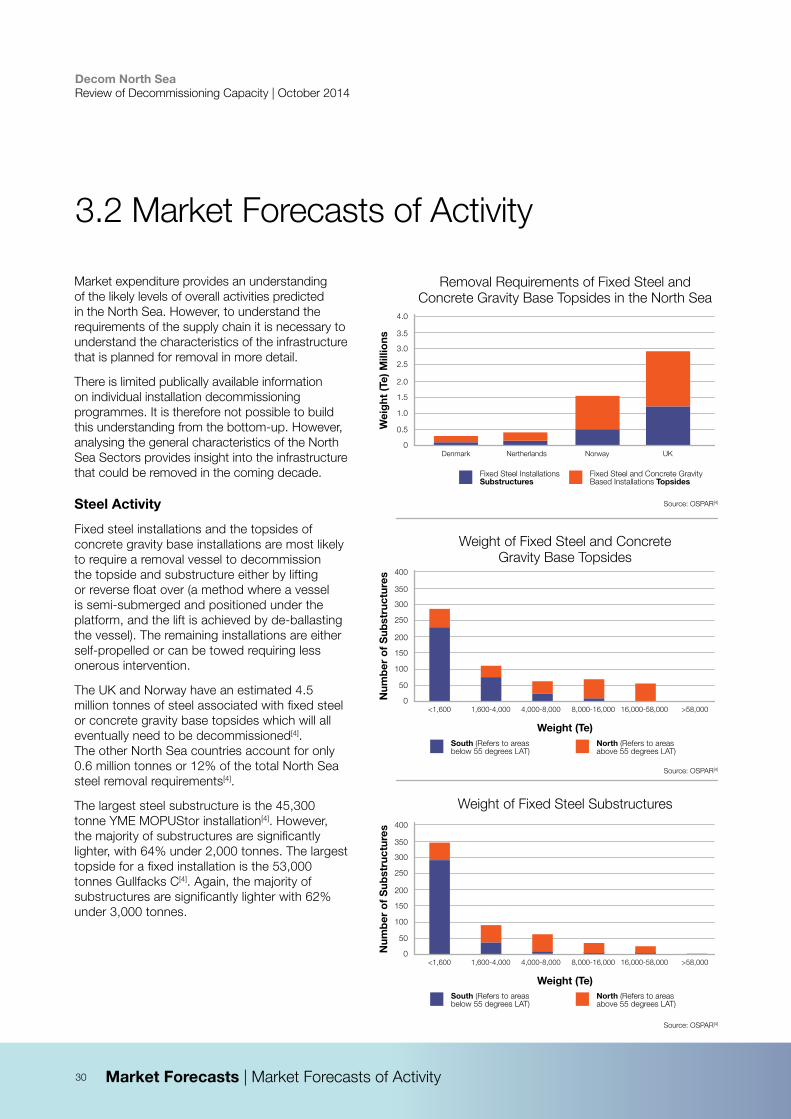
Market expenditure provides an understanding of the likely levels of overall activities predicted in the North Sea. However, to understand the requirements of the supply chain it is necessary to understand the characteristics of the infrastructure that is planned for removal in more detail.
There is limited publically available information on individual installation decommissioning programmes. It is therefore not possible to build this understanding from the bottom-up. However, analysing the general characteristics of the North Sea Sectors provides insight into the infrastructure that could be removed in the coming decade.
Steel Activity
Fixed steel installations and the topsides of concrete gravity base installations are most likely to require a removal vessel to decommission the topside and substructure either by lifting or reverse float over (a method where a vessel is semi-submerged and positioned under the platform, and the lift is achieved by de-ballasting the vessel). The remaining installations are either self-propelled or can be towed requiring less onerous intervention.
The UK and Norway have an estimated 4.5 million tonnes of steel associated with fixed steel or concrete gravity base topsides which will all eventually need to be decommissioned[4]. The other North Sea countries account for only 0.6 million tonnes or 12% of the total North Sea steel removal requirements[4].
The largest steel substructure is the 45,300 tonne YME MOPUStor installation[4]. However, the majority of substructures are significantly lighter, with 64% under 2,000 tonnes. The largest topside for a fixed installation is the 53,000 tonnes Gullfacks C[4]. Again, the majority of substructures are significantly lighter with 62% under 3,000 tonnes.
3.2 Market Forecasts of Activity
Removal Requirements of Fixed Steel and Concrete Gravity Base Topsides in the North Sea
Fixed Steel InstallationsSubstructures
Wei
ght
(Te)
Mill
ions
4.0
3.5
3.0
2.5
2.0
1.5
1.0
0.5
0Denmark Nertherlands Norway UK
Fixed Steel and Concrete Gravity Based Installations Topsides
Source: OSPAR[4]
Weight of Fixed Steel and Concrete Gravity Base Topsides
South (Refers to areas below 55 degrees LAT)
North (Refers to areas above 55 degrees LAT)
<1,600
Num
ber
of
Sub
stru
ctur
es
400
350
300
250
200
150
100
50
0
Weight (Te)
1,600-4,000 4,000-8,000 8,000-16,000 16,000-58,000 >58,000
Source: OSPAR[4]
Source: OSPAR[4]
Market Forecasts | Market Forecasts of Activity
Weight of Fixed Steel Substructures
<1,600
Num
ber
of
Sub
stru
ctur
es
400
350
300
250
200
150
100
50
0
Weight (Te)
1,600-4,000 4,000-8,000 8,000-16,000 16,000-58,000 >58,000
South (Refers to areas below 55 degrees LAT)
North (Refers to areas above 55 degrees LAT)
31
Decom North Sea Review of Decommissioning Capacity | October 2014
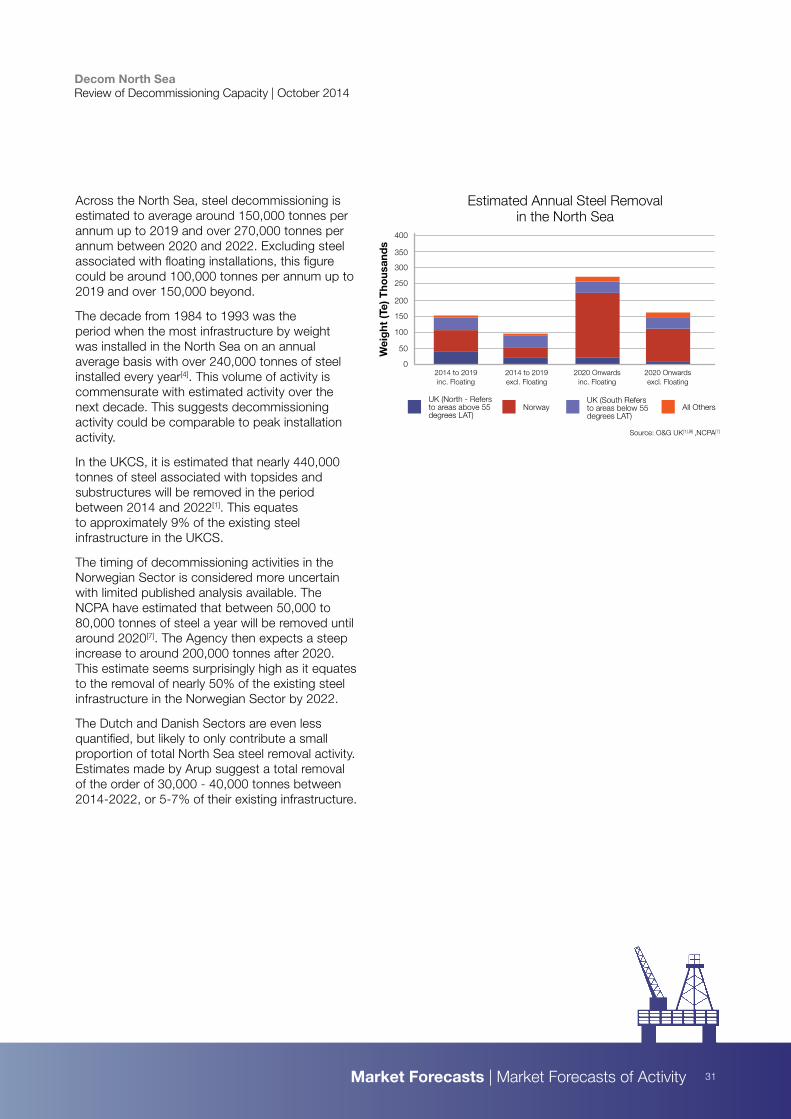
Across the North Sea, steel decommissioning is estimated to average around 150,000 tonnes per annum up to 2019 and over 270,000 tonnes per annum between 2020 and 2022. Excluding steel associated with floating installations, this figure could be around 100,000 tonnes per annum up to 2019 and over 150,000 beyond.
The decade from 1984 to 1993 was the period when the most infrastructure by weight was installed in the North Sea on an annual average basis with over 240,000 tonnes of steel installed every year[4]. This volume of activity is commensurate with estimated activity over the next decade. This suggests decommissioning activity could be comparable to peak installation activity.
In the UKCS, it is estimated that nearly 440,000 tonnes of steel associated with topsides and substructures will be removed in the period between 2014 and 2022[1]. This equates to approximately 9% of the existing steel infrastructure in the UKCS.
The timing of decommissioning activities in the Norwegian Sector is considered more uncertain with limited published analysis available. The NCPA have estimated that between 50,000 to 80,000 tonnes of steel a year will be removed until around 2020[7]. The Agency then expects a steep increase to around 200,000 tonnes after 2020. This estimate seems surprisingly high as it equates to the removal of nearly 50% of the existing steel infrastructure in the Norwegian Sector by 2022.
The Dutch and Danish Sectors are even less quantified, but likely to only contribute a small proportion of total North Sea steel removal activity. Estimates made by Arup suggest a total removal of the order of 30,000 - 40,000 tonnes between 2014-2022, or 5-7% of their existing infrastructure.
Estimated Annual Steel Removal in the North Sea
UK (North - Refers to areas above 55 degrees LAT)
Wei
ght
(Te)
Tho
usan
ds
400
350
300
250
200
150
100
50
02014 to 2019 inc. Floating
2014 to 2019 excl. Floating
2020 Onwards inc. Floating
2020 Onwards excl. Floating
NorwayUK (South Refers to areas below 55 degrees LAT)
All Others
Source: O&G UK[1],[9] ,NCPA[7]
Market Forecasts | Market Forecasts of Activity
32
Decom North Sea Review of Decommissioning Capacity | October 2014
Well Abandonment
Platforms vs Subsea
Wells are either co-located with a platform and have been drilled from a permanent installation to which the well is directly connected, or subsea and drilled from a mobile installation and tied back to a local platform. Platform wells may be abandoned using the platform as an operational base. If the original drilling rig is still present, it can be refurbished and reused to abandon the well. Alternatively, a rig can be retrofitted to the platform, or a rigless alternative can be used. Platform-based operations are significantly more flexible and lower cost than their mobile alternative. Encountering unexpected conditions is also generally less of a concern than for subsea wells, as operations are more easily suspended.
Subsea wells can also be abandoned using a mobile rig such as a drill ship, semi-submersible or jack-up vessel. A light-weight intervention vessel can also be used if a rigless methodology is opted for. The water depth and metocean conditions of well location both influence the appropriate methodology and subsequent vessel requirements.
Rigs vs Rigless
Wells can be abandoned using either rig or rigless approaches. A rig based approach uses vessel or platform drilling rigs, adapted to recover downhole equipment and plug the wells. Rigless alternatives can be utilised for some or all parts of P&A operations to reduce the number of expensive rig days. However, the condition and type of well dictates the potential to use a rigless approach. Currently rigless operations have been biased towards platform based operations due to technology constraints and operators risk appetite. Due to the limitations of rigless methodologies, costs can dramatically increase if unexpected conditions are encountered and a rig needs to be deployed to complete the abandonment. Technology innovation and increased demonstration of rigless approaches is likely to reduce these risks and increase their use in the future with consequential cost reductions for web abandonment activities.
Market Forecasts | Market Forecasts of Activity
33
Decom North Sea Review of Decommissioning Capacity | October 2014
Suspended SNS / CNS / IS
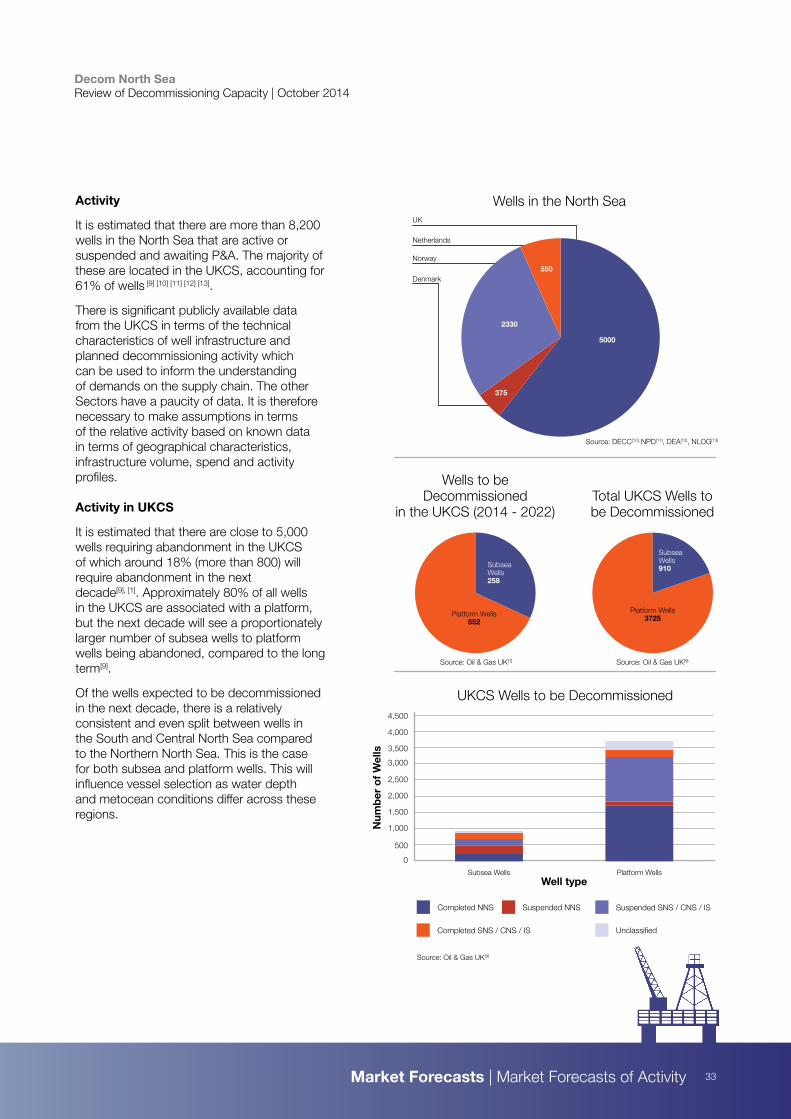
Activity
It is estimated that there are more than 8,200 wells in the North Sea that are active or suspended and awaiting P&A. The majority of these are located in the UKCS, accounting for 61% of wells [9] [10] [11] [12] [13].
There is significant publicly available data from the UKCS in terms of the technical characteristics of well infrastructure and planned decommissioning activity which can be used to inform the understanding of demands on the supply chain. The other Sectors have a paucity of data. It is therefore necessary to make assumptions in terms of the relative activity based on known data in terms of geographical characteristics, infrastructure volume, spend and activity profiles.
Activity in UKCS
It is estimated that there are close to 5,000 wells requiring abandonment in the UKCS of which around 18% (more than 800) will require abandonment in the next decade[9], [1]. Approximately 80% of all wells in the UKCS are associated with a platform, but the next decade will see a proportionately larger number of subsea wells to platform wells being abandoned, compared to the long term[9].
Of the wells expected to be decommissioned in the next decade, there is a relatively consistent and even split between wells in the South and Central North Sea compared to the Northern North Sea. This is the case for both subsea and platform wells. This will influence vessel selection as water depth and metocean conditions differ across these regions.
Subsea Wells Platform Wells
UKCS Wells to be Decommissioned
Num
ber
of
Wel
ls
3,000
2,000
1,000
0
4,000
1,500
500
2,500
3,500
4,500
Well type
Completed NNS Suspended NNS
Unclassified
Total UKCS Wells to be Decommissioned
Subsea Wells 910
Platform Wells 3725
Subsea Wells 258
Platform Wells 552
Wells to be Decommissioned
in the UKCS (2014 - 2022)
Source: Oil & Gas UK[9]Source: Oil & Gas UK[1]
Source: Oil & Gas UK[9]
Market Forecasts | Market Forecasts of Activity
Wells in the North SeaUK
Netherlands
Norway
Denmark
Source: DECC[10], NPD[11], DEA[12], NLOG[13]
5000
2330
550
375
Completed SNS / CNS / IS
34
Decom North Sea Review of Decommissioning Capacity | October 2014
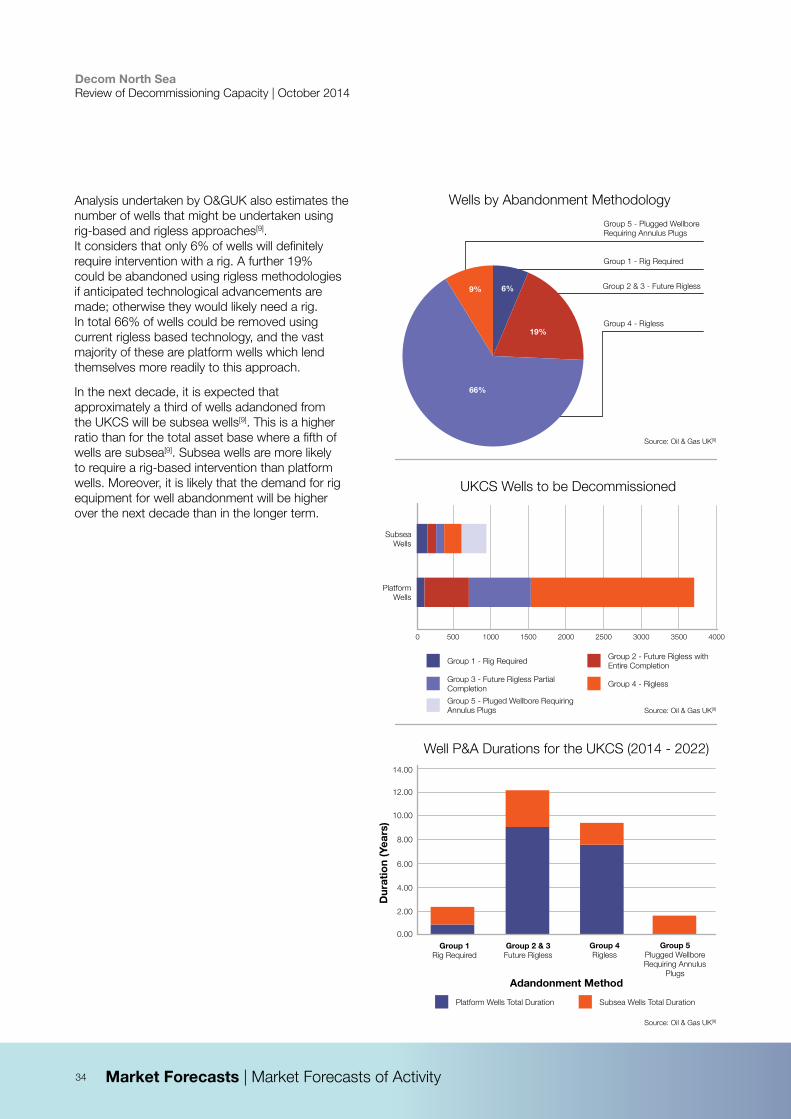
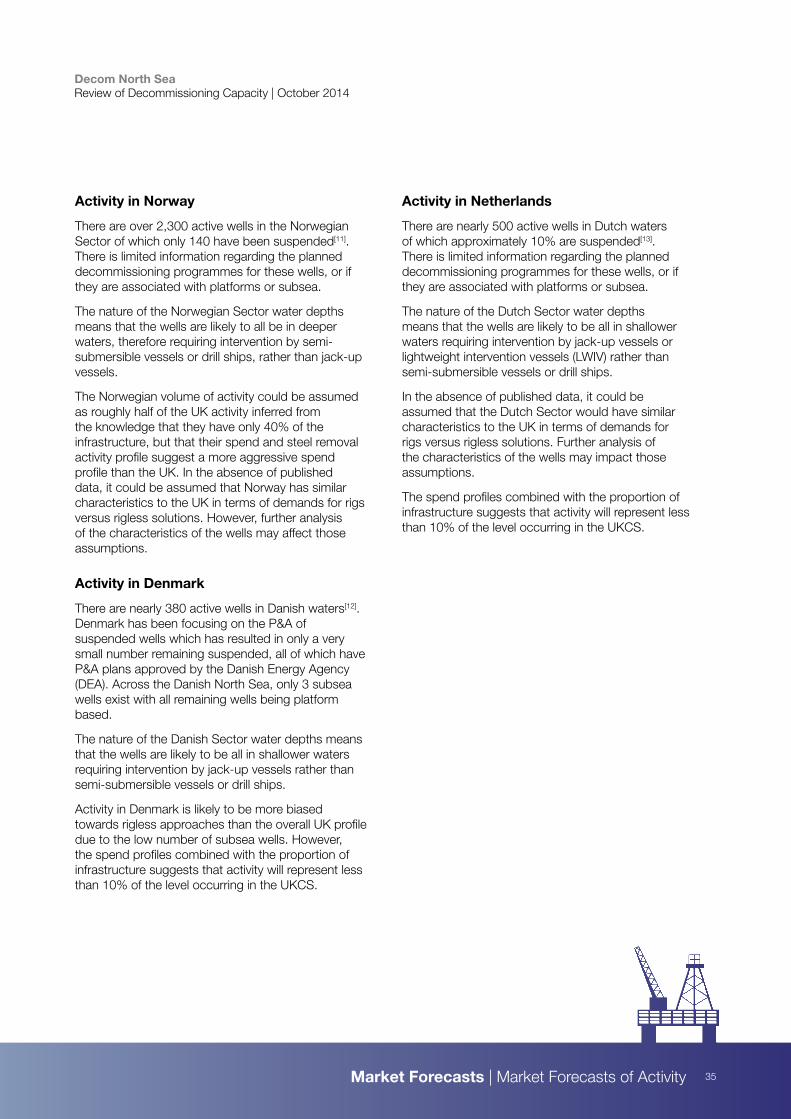
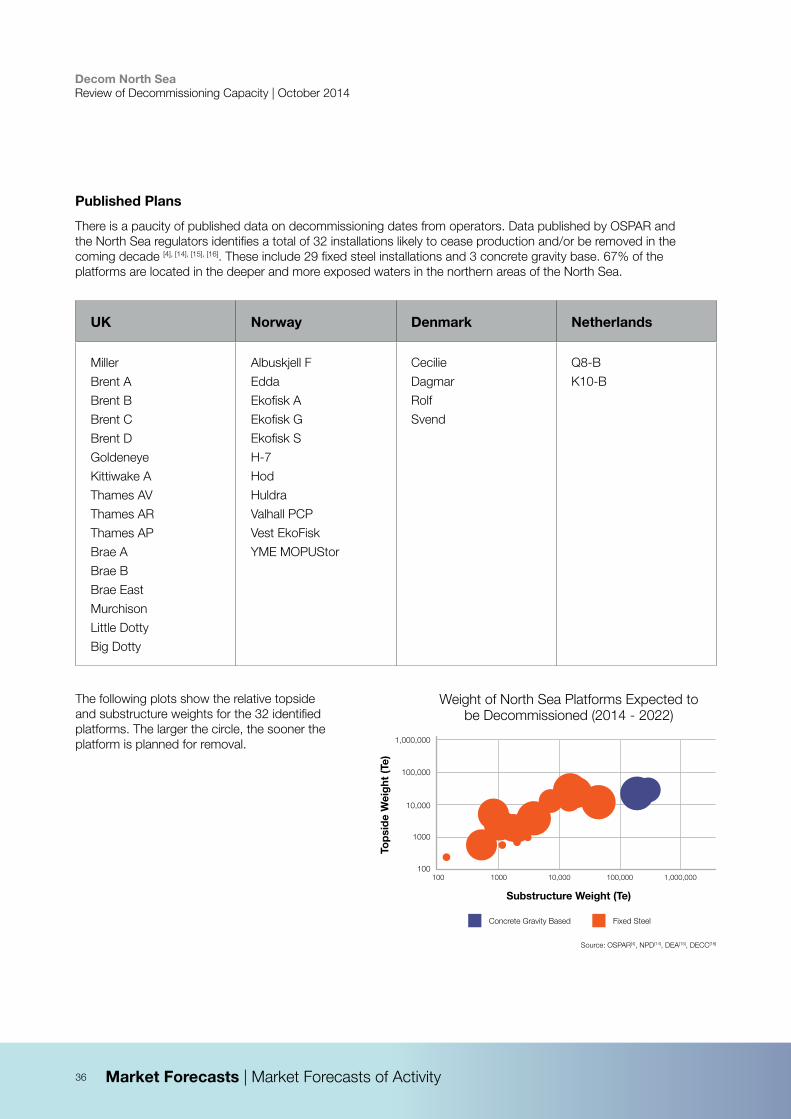
Analysis undertaken by O&GUK also estimates the number of wells that might be undertaken using rig-based and rigless approaches[9]. It considers that only 6% of wells will definitely require intervention with a rig. A further 19% could be abandoned using rigless methodologies if anticipated technological advancements are made; otherwise they would likely need a rig. In total 66% of wells could be removed using current rigless based technology, and the vast majority of these are platform wells which lend themselves more readily to this approach.
In the next decade, it is expected that approximately a third of wells adandoned from the UKCS will be subsea wells[9]. This is a higher ratio than for the total asset base where a fifth of wells are subsea[9]. Subsea wells are more likely to require a rig-based intervention than platform wells. Moreover, it is likely that the demand for rig equipment for well abandonment will be higher over the next decade than in the longer term.
Wells by Abandonment Methodology
Group 5 - Plugged Wellbore Requiring Annulus Plugs
Group 1 - Rig Required
Group 2 & 3 - Future Rigless
Group 4 - Rigless
66%
19%
6%9%
0
UKCS Wells to be Decommissioned
500 1000 1500 2000 2500 3000 3500 4000
Group 1 - Rig Required
Group 3 - Future Rigless Partial Completion
Group 2 - Future Rigless with Entire Completion
Group 4 - Rigless
Group 5 - Pluged Wellbore Requiring Annulus Plugs
Platform Wells
Subsea Wells
Source: Oil & Gas UK[9]
Source: Oil & Gas UK[9]
Well P&A Durations for the UKCS (2014 - 2022)
Platform Wells Total Duration Subsea Wells Total Duration
Group 1Rig Required
Adandonment Method
Group 2 & 3 Future Rigless
Group 4Rigless
Group 5 Plugged Wellbore Requiring Annulus
Plugs
Dur
atio
n (Y
ears
)
0.00
2.00
4.00
6.00
8.00
10.00
12.00
14.00
Source: Oil & Gas UK[9]
Market Forecasts | Market Forecasts of Activity
35
Decom North Sea Review of Decommissioning Capacity | October 2014
Activity in Norway
There are over 2,300 active wells in the Norwegian Sector of which only 140 have been suspended[11]. There is limited information regarding the planned decommissioning programmes for these wells, or if they are associated with platforms or subsea.
The nature of the Norwegian Sector water depths means that the wells are likely to all be in deeper waters, therefore requiring intervention by semi-submersible vessels or drill ships, rather than jack-up vessels.
The Norwegian volume of activity could be assumed as roughly half of the UK activity inferred from the knowledge that they have only 40% of the infrastructure, but that their spend and steel removal activity profile suggest a more aggressive spend profile than the UK. In the absence of published data, it could be assumed that Norway has similar characteristics to the UK in terms of demands for rigs versus rigless solutions. However, further analysis of the characteristics of the wells may affect those assumptions.
Activity in Denmark
There are nearly 380 active wells in Danish waters[12]. Denmark has been focusing on the P&A of suspended wells which has resulted in only a very small number remaining suspended, all of which have P&A plans approved by the Danish Energy Agency (DEA). Across the Danish North Sea, only 3 subsea wells exist with all remaining wells being platform based.
The nature of the Danish Sector water depths means that the wells are likely to be all in shallower waters requiring intervention by jack-up vessels rather than semi-submersible vessels or drill ships.
Activity in Denmark is likely to be more biased towards rigless approaches than the overall UK profile due to the low number of subsea wells. However, the spend profiles combined with the proportion of infrastructure suggests that activity will represent less than 10% of the level occurring in the UKCS.
Activity in Netherlands
There are nearly 500 active wells in Dutch waters of which approximately 10% are suspended[13]. There is limited information regarding the planned decommissioning programmes for these wells, or if they are associated with platforms or subsea.
The nature of the Dutch Sector water depths means that the wells are likely to be all in shallower waters requiring intervention by jack-up vessels or lightweight intervention vessels (LWIV) rather than semi-submersible vessels or drill ships.
In the absence of published data, it could be assumed that the Dutch Sector would have similar characteristics to the UK in terms of demands for rigs versus rigless solutions. Further analysis of the characteristics of the wells may impact those assumptions.
The spend profiles combined with the proportion of infrastructure suggests that activity will represent less than 10% of the level occurring in the UKCS.
Market Forecasts | Market Forecasts of Activity
36
Decom North Sea Review of Decommissioning Capacity | October 2014
Published Plans
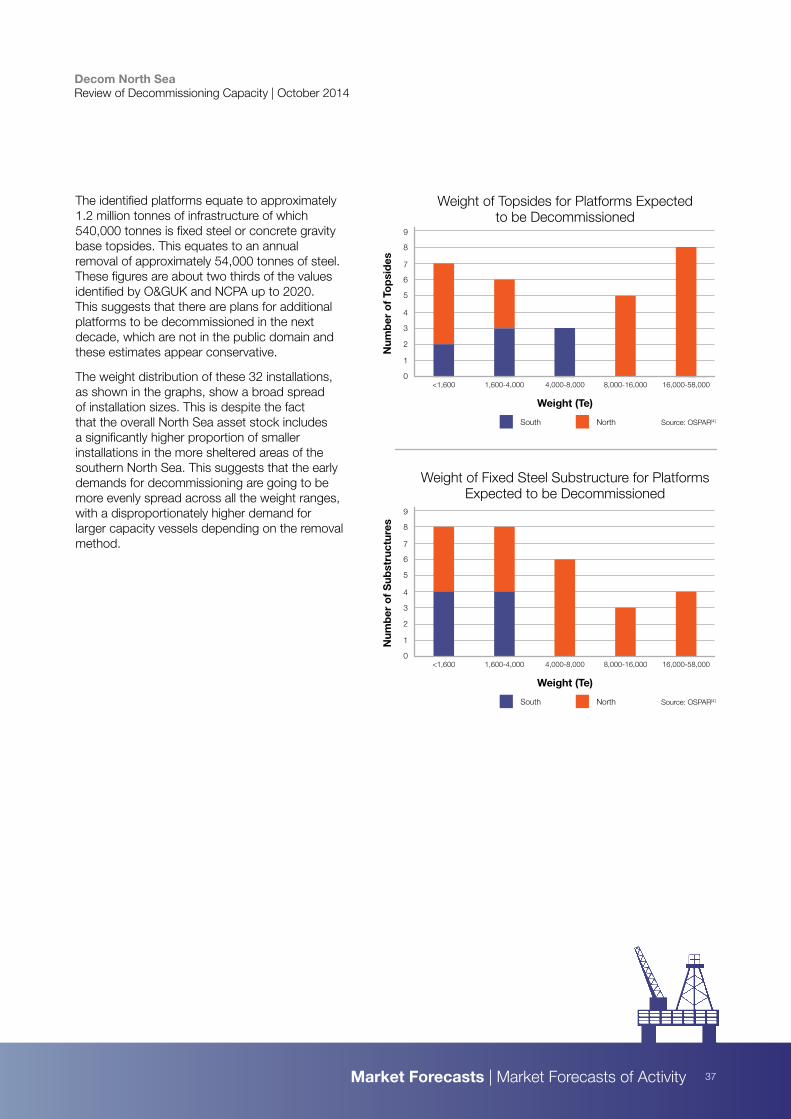
There is a paucity of published data on decommissioning dates from operators. Data published by OSPAR and the North Sea regulators identifies a total of 32 installations likely to cease production and/or be removed in the coming decade [4], [14], [15], [16]. These include 29 fixed steel installations and 3 concrete gravity base. 67% of the platforms are located in the deeper and more exposed waters in the northern areas of the North Sea.
UK Norway Denmark Netherlands
Miller
Brent A
Brent B
Brent C
Brent D
Goldeneye
Kittiwake A
Thames AV
Thames AR
Thames AP
Brae A
Brae B
Brae East
Murchison
Little Dotty
Big Dotty
Albuskjell F
Edda
Ekofisk A
Ekofisk G
Ekofisk S
H-7
Hod
Huldra
Valhall PCP
Vest EkoFisk
YME MOPUStor
Cecilie
Dagmar
Rolf
Svend
Q8-B
K10-B
Weight of North Sea Platforms Expected to be Decommissioned (2014 - 2022)
Top
sid
e W
eig
ht (T
e)
1,000,000
100,000
10,000
1000
100
Substructure Weight (Te)
100 1000 10,000 100,000 1,000,000
Concrete Gravity Based Fixed Steel
Source: OSPAR[4], NPD[14], DEA[15], DECC[16]
The following plots show the relative topside and substructure weights for the 32 identified platforms. The larger the circle, the sooner the platform is planned for removal.
Market Forecasts | Market Forecasts of Activity
37
Decom North Sea Review of Decommissioning Capacity | October 2014
The identified platforms equate to approximately 1.2 million tonnes of infrastructure of which 540,000 tonnes is fixed steel or concrete gravity base topsides. This equates to an annual removal of approximately 54,000 tonnes of steel. These figures are about two thirds of the values identified by O&GUK and NCPA up to 2020. This suggests that there are plans for additional platforms to be decommissioned in the next decade, which are not in the public domain and these estimates appear conservative.
The weight distribution of these 32 installations, as shown in the graphs, show a broad spread of installation sizes. This is despite the fact that the overall North Sea asset stock includes a significantly higher proportion of smaller installations in the more sheltered areas of the southern North Sea. This suggests that the early demands for decommissioning are going to be more evenly spread across all the weight ranges, with a disproportionately higher demand for larger capacity vessels depending on the removal method.
Weight of Topsides for Platforms Expected to be Decommissioned
South North
Num
ber
of
Top
sid
es
8
7
6
5
4
3
2
1
0
Weight (Te)
<1,600 1,600-4,000 4,000-8,000 8,000-16,000 16,000-58,000
9
Weight of Fixed Steel Substructure for Platforms Expected to be Decommissioned
South North
Num
ber
of
Sub
stru
ctur
es 8
7
6
5
4
3
2
1
0
Weight (Te)
<1,600 1,600-4,000 4,000-8,000 8,000-16,000 16,000-58,000
9
Source: OSPAR[4]
Source: OSPAR[4]
Market Forecasts | Market Forecasts of Activity
Decom North Sea Review of Decommissioning Capacity | October 2014
38
Decom North Sea Review of Decommissioning Capacity | October 2014
39
4.0 Critical Supply Chain Elements
40
Decom North Sea Review of Decommissioning Capacity | October 2014
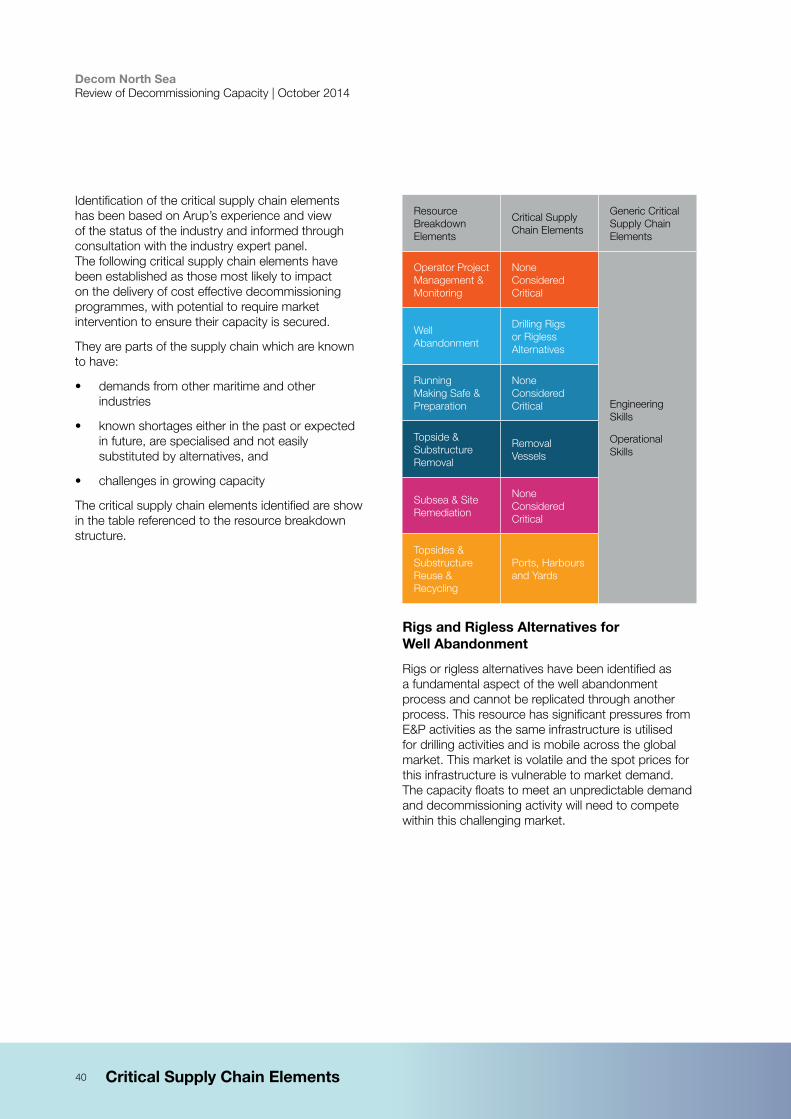
Identification of the critical supply chain elements has been based on Arup’s experience and view of the status of the industry and informed through consultation with the industry expert panel. The following critical supply chain elements have been established as those most likely to impact on the delivery of cost effective decommissioning programmes, with potential to require market intervention to ensure their capacity is secured.
They are parts of the supply chain which are known to have:
• demands from other maritime and other industries
• known shortages either in the past or expected in future, are specialised and not easily substituted by alternatives, and
• challenges in growing capacity
The critical supply chain elements identified are show in the table referenced to the resource breakdown structure.
Resource Breakdown Elements
Critical Supply Chain Elements
Generic Critical Supply Chain Elements
Operator Project Management & Monitoring
None Considered Critical
Engineering Skills
Operational Skills
Well Abandonment
Drilling Rigs or Rigless Alternatives
Running Making Safe & Preparation
None Considered Critical
Topside & Substructure Removal
Removal Vessels
Subsea & Site Remediation
None Considered Critical
Topsides & Substructure Reuse & Recycling
Ports, Harbours and Yards
Rigs and Rigless Alternatives for Well Abandonment
Rigs or rigless alternatives have been identified as a fundamental aspect of the well abandonment process and cannot be replicated through another process. This resource has significant pressures from E&P activities as the same infrastructure is utilised for drilling activities and is mobile across the global market. This market is volatile and the spot prices for this infrastructure is vulnerable to market demand. The capacity floats to meet an unpredictable demand and decommissioning activity will need to compete within this challenging market.
Critical Supply Chain Elements
41
Decom North Sea Review of Decommissioning Capacity | October 2014
Removal Vessels for Topside and Substructure Removal
Removal vessels are a critical part of the decommissioning process and their cost and availability will have a substantial impact on the overall costs of the process. It is likely that vessels with lift capacities of up to 500 tonnes and significantly higher will be utilised by the market regardless of the approach to removal. They are not unique to the decommissioning market and are utilised for E&P as well as offshore wind markets.
The capital costs of a new vessel are significant, and vessel operators will require a substantial commitment to invest in new capacity. The latest new specialist heavy lift vessel, the Pieter Schelte was over 10 years in development and was supported by an investment case from markets other than decommissioning. Although smaller vessels for piece small operations will be significantly less expensive and quicker through the planning process, they would need to be developed in greater volume to deliver the same level of work of the larger vessels.
Ports, Harbours and Yards for Topsides and Substructure Recycling
Although operators could potentially utilise ports, harbours and yards from the global market to carry out decommissioning activities, this would likely be at a significant cost penalty to decommissioning. This is not because it would impact recycling costs, which are only a small proportion of overall costs, but because it would impact on removal costs through increasing vessel costs. It would also reduce the potential for local socio-economic benefits through creation of jobs in the North Sea local markets.
The capital cost of upgrading major infrastructure can be substantial and generally requires high investment certainty to make commitment. In addition to this the timescales can be extremely protracted, with the duration to realise significant new infrastructure from design and development to construction potentially taking up to a decade for a contentious development.
Engineering and Operational Skills for all areas of Decommissioning
Skills capacity is an issue that crosses all aspects of the decommissioning process, and was commonly cited as a potential concern and constraint. The challenges to grow skills capability are distinct to investment in a physical resource such as a vessel or port. They require a collaborative effort between schools, universities, operators, supply chain and Government.
Other Resources
There are a significant number of other resources associated with the decommissioning processes which are detailed in Appendix C. These resources offer a significant opportunity to the supply chain as the market grows. They will require a breadth of highly skilled and high value capacity and capability.
A range of activities will require innovation in terms of technical and management approaches to drive down the costs of decommissioning. Examples include development in cutting tools, or improved logistics management of offshore operations. There are other areas that will need significant growth in capacity to meet the demands of the market, such as a growth in survey capability or support vessels.
There will undoubtedly be constraints in supply of many of these resources depending on the level of market demand. However these areas are of lower capital investment and lead time when compared to the aspects considered as critical supply chain elements. The supply chain is more likely to be able to naturally respond to these opportunities without any market intervention. As such, although they are considered as significant opportunities, they are not assessed in detail as part of this exercise.
A health check of the four critical supply chain elements identified above is provided in Chapters 5 to 9 where each element is considered within the context of the expected activity and in light of current capacity. Engineering and operational skills are considered separately in Chapter 4, as these skills are somewhat transferrable across the RBS.
Critical Supply Chain Elements
Decom North Sea Review of Decommissioning Capacity | October 2014
42
Decom North Sea Review of Decommissioning Capacity | October 2014
43
5.0 Well Abandonment
Decom North Sea Review of Decommissioning Capacity | October 2014
44
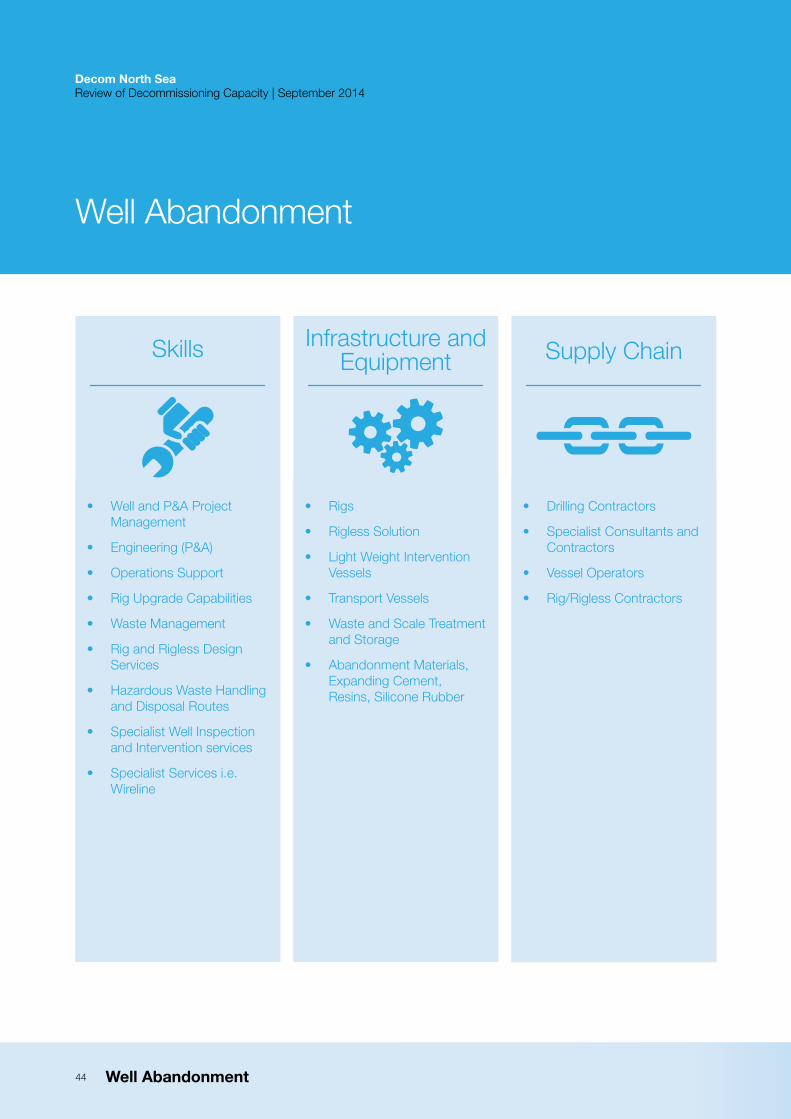
Skills Supply ChainInfrastructure and Equipment
• Well and P&A Project Management
• Engineering (P&A)
• Operations Support
• Rig Upgrade Capabilities
• Waste Management
• Rig and Rigless Design Services
• Hazardous Waste Handling and Disposal Routes
• Specialist Well Inspection and Intervention services
• Specialist Services i.e. Wireline
• Rigs
• Rigless Solution
• Light Weight Intervention Vessels
• Transport Vessels
• Waste and Scale Treatment and Storage
• Abandonment Materials, Expanding Cement, Resins, Silicone Rubber
• Drilling Contractors
• Specialist Consultants and Contractors
• Vessel Operators
• Rig/Rigless Contractors
Well Abandonment
Decom North Sea Review of Decommissioning Capacity | September 2014
Well Abandonment
Decom North Sea Review of Decommissioning Capacity | October 2014
45
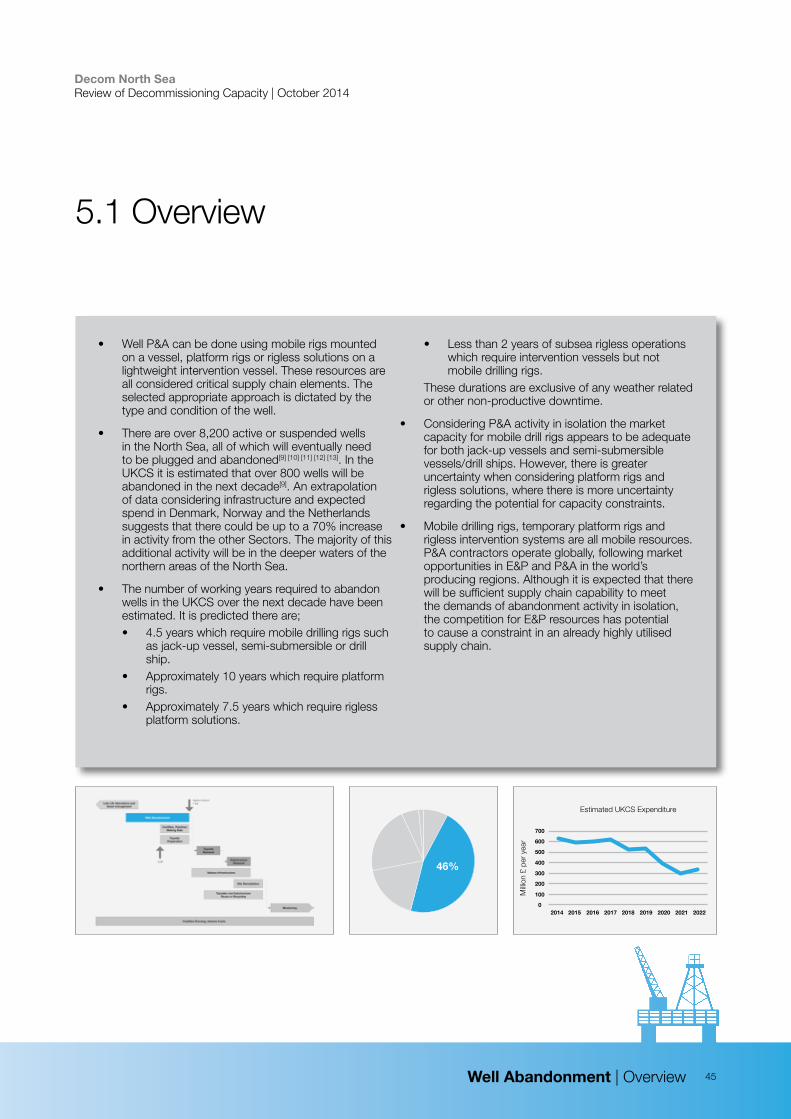
• Well P&A can be done using mobile rigs mounted on a vessel, platform rigs or rigless solutions on a lightweight intervention vessel. These resources are all considered critical supply chain elements. The selected appropriate approach is dictated by the type and condition of the well.
• There are over 8,200 active or suspended wells in the North Sea, all of which will eventually need to be plugged and abandoned[9] [10] [11] [12] [13]. In the UKCS it is estimated that over 800 wells will be abandoned in the next decade[9]. An extrapolation of data considering infrastructure and expected spend in Denmark, Norway and the Netherlands suggests that there could be up to a 70% increase in activity from the other Sectors. The majority of this additional activity will be in the deeper waters of the northern areas of the North Sea.
• The number of working years required to abandon wells in the UKCS over the next decade have been estimated. It is predicted there are; • 4.5 years which require mobile drilling rigs such
as jack-up vessel, semi-submersible or drill ship.
• Approximately 10 years which require platform rigs.
• Approximately 7.5 years which require rigless platform solutions.
• Less than 2 years of subsea rigless operations which require intervention vessels but not mobile drilling rigs.
These durations are exclusive of any weather related or other non-productive downtime.
• Considering P&A activity in isolation the market capacity for mobile drill rigs appears to be adequate for both jack-up vessels and semi-submersible vessels/drill ships. However, there is greater uncertainty when considering platform rigs and rigless solutions, where there is more uncertainty regarding the potential for capacity constraints.
• Mobile drilling rigs, temporary platform rigs and rigless intervention systems are all mobile resources. P&A contractors operate globally, following market opportunities in E&P and P&A in the world’s producing regions. Although it is expected that there will be sufficient supply chain capability to meet the demands of abandonment activity in isolation, the competition for E&P resources has potential to cause a constraint in an already highly utilised supply chain.
5.1 Overview
700
600
500
400
300
200
100
02014 2015 2016 2017 2018 2019 2020 2021 2022
Estimated UKCS Expenditure
Milli
on £
per
yea
r
46%
Well Abandonment | Overview
Decom North Sea Review of Decommissioning Capacity | October 2014
46
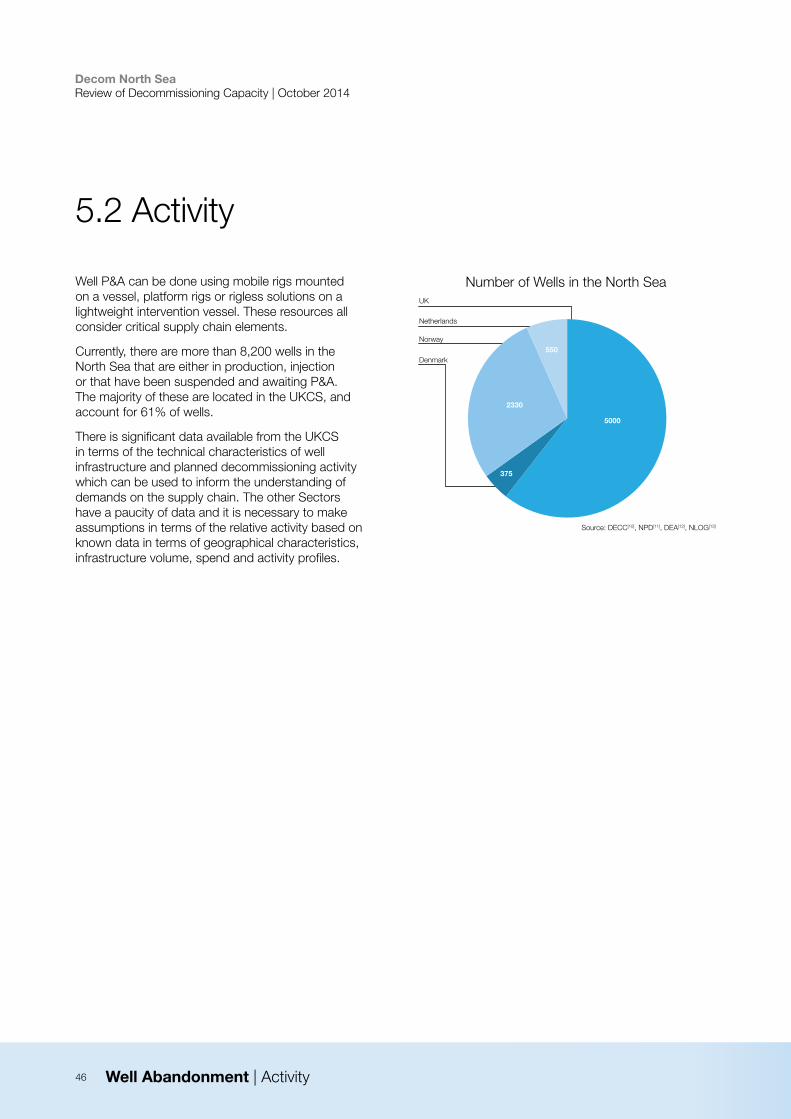
Well P&A can be done using mobile rigs mounted on a vessel, platform rigs or rigless solutions on a lightweight intervention vessel. These resources all consider critical supply chain elements.
Currently, there are more than 8,200 wells in the North Sea that are either in production, injection or that have been suspended and awaiting P&A. The majority of these are located in the UKCS, and account for 61% of wells.
There is significant data available from the UKCS in terms of the technical characteristics of well infrastructure and planned decommissioning activity which can be used to inform the understanding of demands on the supply chain. The other Sectors have a paucity of data and it is necessary to make assumptions in terms of the relative activity based on known data in terms of geographical characteristics, infrastructure volume, spend and activity profiles.
5.2 Activity
Well Abandonment | Activity
Number of Wells in the North SeaUK
Netherlands
Norway
Denmark
Source: DECC[10], NPD[11], DEA[12], NLOG[13]
5000
2330
550
375
Decom North Sea Review of Decommissioning Capacity | October 2014
47
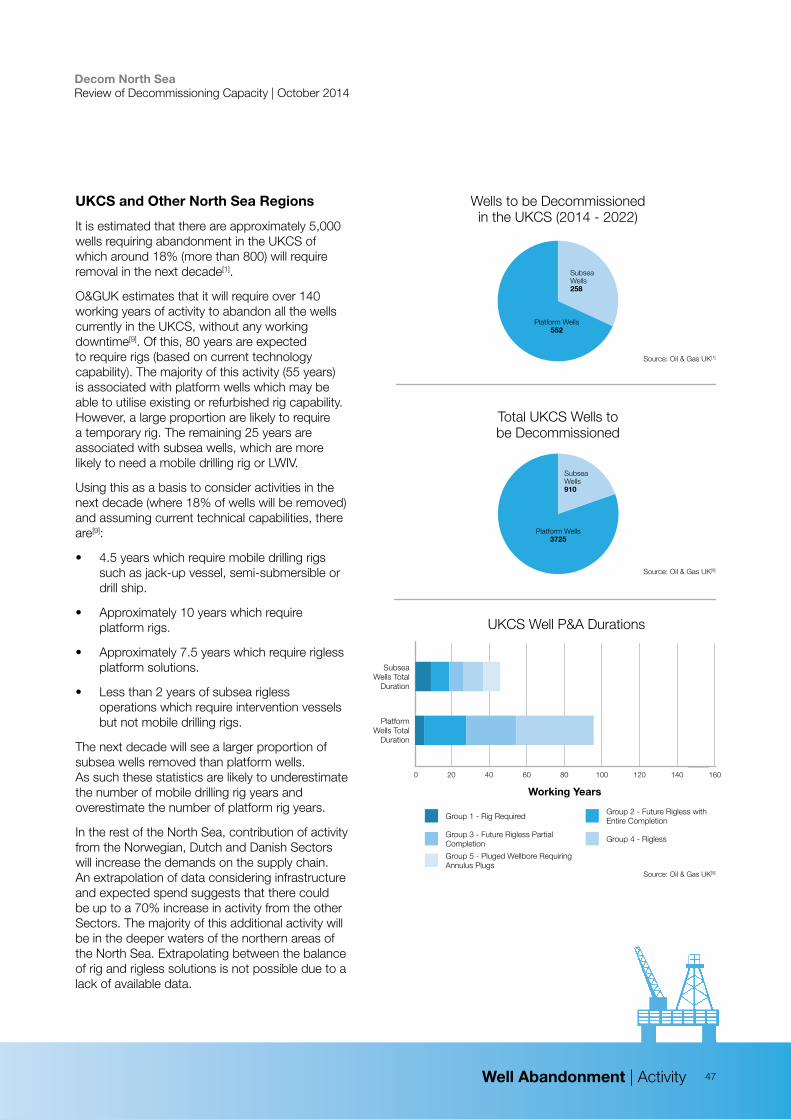
UKCS and Other North Sea Regions
It is estimated that there are approximately 5,000 wells requiring abandonment in the UKCS of which around 18% (more than 800) will require removal in the next decade[1].
O&GUK estimates that it will require over 140 working years of activity to abandon all the wells currently in the UKCS, without any working downtime[9]. Of this, 80 years are expected to require rigs (based on current technology capability). The majority of this activity (55 years) is associated with platform wells which may be able to utilise existing or refurbished rig capability. However, a large proportion are likely to require a temporary rig. The remaining 25 years are associated with subsea wells, which are more likely to need a mobile drilling rig or LWIV.
Using this as a basis to consider activities in the next decade (where 18% of wells will be removed) and assuming current technical capabilities, there are[9]:
• 4.5 years which require mobile drilling rigs such as jack-up vessel, semi-submersible or drill ship.
• Approximately 10 years which require platform rigs.
• Approximately 7.5 years which require rigless platform solutions.
• Less than 2 years of subsea rigless operations which require intervention vessels but not mobile drilling rigs.
The next decade will see a larger proportion of subsea wells removed than platform wells. As such these statistics are likely to underestimate the number of mobile drilling rig years and overestimate the number of platform rig years.
In the rest of the North Sea, contribution of activity from the Norwegian, Dutch and Danish Sectors will increase the demands on the supply chain. An extrapolation of data considering infrastructure and expected spend suggests that there could be up to a 70% increase in activity from the other Sectors. The majority of this additional activity will be in the deeper waters of the northern areas of the North Sea. Extrapolating between the balance of rig and rigless solutions is not possible due to a lack of available data.
Total UKCS Wells to be Decommissioned
Subsea Wells 910
Platform Wells 3725
Subsea Wells 258
Platform Wells 552
Wells to be Decommissioned in the UKCS (2014 - 2022)
Source: Oil & Gas UK[9]
Source: Oil & Gas UK[1]
Well Abandonment | Activity
0
UKCS Well P&A Durations
20 40 60 80 100 120 140 160
Group 1 - Rig Required
Group 3 - Future Rigless Partial Completion
Group 2 - Future Rigless with Entire Completion
Group 4 - Rigless
Group 5 - Pluged Wellbore Requiring Annulus Plugs
Platform Wells Total
Duration
Subsea Wells Total
Duration
Source: Oil & Gas UK[9]
Working Years
Decom North Sea Review of Decommissioning Capacity | October 2014
48
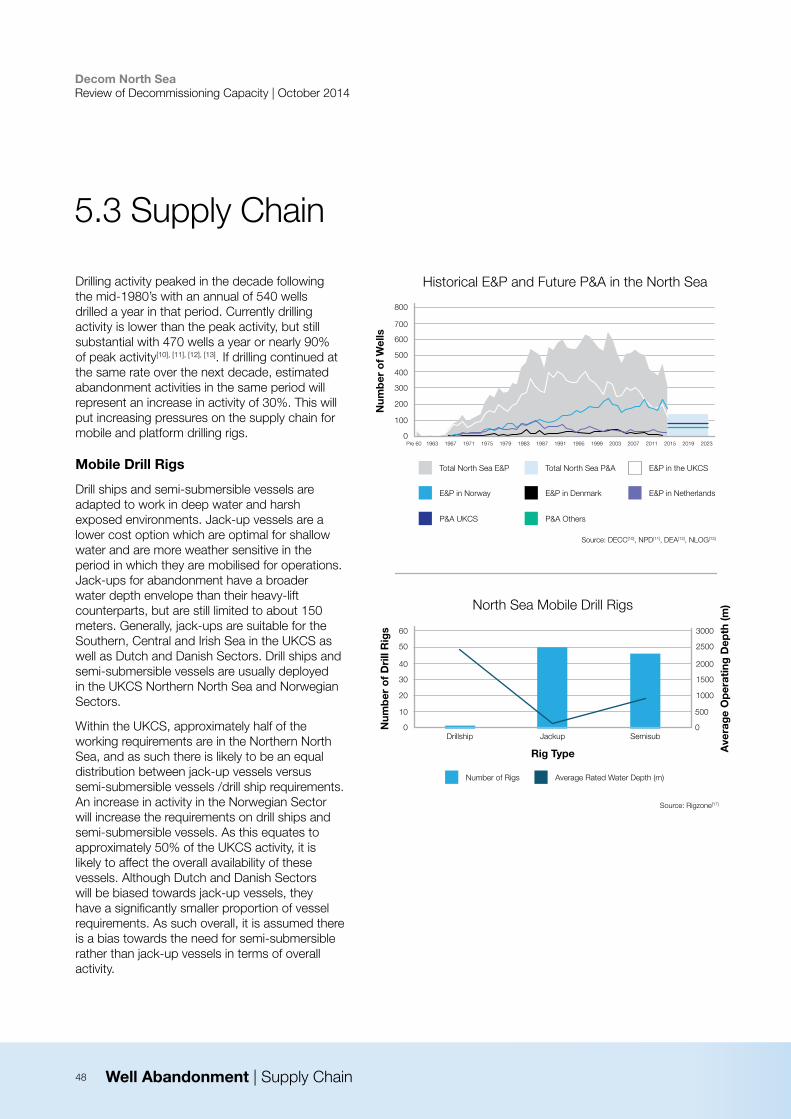
Drilling activity peaked in the decade following the mid-1980’s with an annual of 540 wells drilled a year in that period. Currently drilling activity is lower than the peak activity, but still substantial with 470 wells a year or nearly 90% of peak activity[10], [11], [12], [13]. If drilling continued at the same rate over the next decade, estimated abandonment activities in the same period will represent an increase in activity of 30%. This will put increasing pressures on the supply chain for mobile and platform drilling rigs.
Mobile Drill Rigs
Drill ships and semi-submersible vessels are adapted to work in deep water and harsh exposed environments. Jack-up vessels are a lower cost option which are optimal for shallow water and are more weather sensitive in the period in which they are mobilised for operations. Jack-ups for abandonment have a broader water depth envelope than their heavy-lift counterparts, but are still limited to about 150 meters. Generally, jack-ups are suitable for the Southern, Central and Irish Sea in the UKCS as well as Dutch and Danish Sectors. Drill ships and semi-submersible vessels are usually deployed in the UKCS Northern North Sea and Norwegian Sectors.
Within the UKCS, approximately half of the working requirements are in the Northern North Sea, and as such there is likely to be an equal distribution between jack-up vessels versus semi-submersible vessels /drill ship requirements. An increase in activity in the Norwegian Sector will increase the requirements on drill ships and semi-submersible vessels. As this equates to approximately 50% of the UKCS activity, it is likely to affect the overall availability of these vessels. Although Dutch and Danish Sectors will be biased towards jack-up vessels, they have a significantly smaller proportion of vessel requirements. As such overall, it is assumed there is a bias towards the need for semi-submersible rather than jack-up vessels in terms of overall activity.
5.3 Supply Chain
Historical E&P and Future P&A in the North Sea
Total North Sea E&P
Num
ber
of
Wel
ls
800
700
600
500
400
300
200
100
020231987 1991 1995 1999 2003 2007 2011 2015 2019Pre 60 1963 1967 1971 1975 1979 1983
E&P in Norway
P&A UKCS
Total North Sea P&A
E&P in Denmark
P&A Others
E&P in the UKCS
E&P in Netherlands
North Sea Mobile Drill Rigs
Num
ber
of
Dri
ll R
igs 60
50
40
30
20
10
0Drillship Jackup Semisub
Number of Rigs Average Rated Water Depth (m)
Ave
rag
e O
per
atin
g D
epth
(m)
3000
2500
2000
1500
1000
500
0
Rig Type
Source: DECC[10], NPD[11], DEA[12], NLOG[13]
Source: Rigzone[17]
Well Abandonment | Supply Chain
Decom North Sea Review of Decommissioning Capacity | October 2014
49
Rigzone catalogues that there are 97 mobile drill rigs currently operating in the North Sea, which represents around 12% of the global fleet[17]. These are relatively evenly split between semi-submersible vessels and jack-ups. Even when factoring in weather and other unproductive time, a fleet this size could easily support the 4.5 rig years of adandonment required in the next decade from the UKCS. The additional estimated 70% increase of activity from the other sectors is unlikely to cause a constraint.
However, utilisation of mobile rigs is currently high, with global utilisation of jack-ups and semi-submersible vessels averaging between 79 to 88% last year[18]. The incremental increase in abandonment activity when considered in the back drop of E&P activity, could potentially cause a constraint on mobile rigs, unless greater numbers of the global fleet are deployed in the North Sea.
Platform Rigs
The requirement of drill rigs for platforms is estimated to be more than double the requirement of mobile drilling rigs in terms of working days. The capability of the market to refurbish existing platform rigs will dictate the required capacity for additional rigs to be temporarily installed on the platform. Again, as platform rigs are in demand for drilling activity, there will be a competition for this resource and it has the potential to become a constraint.
Rigless Intervention Systems
Rigless interventions are associated with about 40% of the total working days of all P&A activities. Rigless interventions are estimated to mainly be associated with platform wells, but also with a smaller number of subsea wells. For these operations, the availability of rigless systems must be considered.
There is also a significant number of additional wells that could be abandoned using a rigless solution if technology innovation was stimulated. Indeed, rigless solutions are significantly shorter and lower cost than rig-based alternatives and could offer a more cost effective alternative to operators.
The market is likely to want to move towards using rigless options where risk-based analysis concludes that it is the most cost effective approach. Availably of rigless solutions has the potential to become a constraint in the future, especially if the market confidence increases in its viability.
Well Abandonment | Supply Chain
Decom North Sea Review of Decommissioning Capacity | October 2014
50
Overall Status = Red
There is a high potential for well abandonment resources to cause a supply chain bottleneck based on the considerations detailed above.
Investment Status = Low / Medium
Contractors are reluctant to make commitments to new rigs and rigless systems without certainty in terms of timing of the North Sea decommissioning market. In the Gulf of Mexico an ‘idle iron’
policy had been implemented which places a deadline on abandonment activity. This policy decision has given market certainty and stimulated technology innovation in bringing forward
more rigless solutions. In the North Sea further innovations are necessary to de-risk rigless solutions.
Capability = Low / Medium
Accenture[5] consider well adandonment aligned with the 2011 WBS which considers P&A of wells, rig upgrades and rigless options among others with an average capability for these three of 2.5 out of 5.Rig upgrades were rated the lowest capability with P&A and rigless options performing better. Accenture conclude that the market for associated well services such as drilling, completions and interventions has extensive knowledge, tools, technology, experience and capability. Well Abandonment has been widely identified as a phase requiring focus and there are multiple organisations, events and publications that provide a forum for discussion, debate and knowledge sharing. The presence of global players in the UKCS provides a source of knowledge, technology and experience of complex well situations and well abandonments from other regions.However, while the market for wells services is mature, the specific capability and experience for plugging & abandonment is not as strong. The entry costs for new wells companies in the UKCS are too high, in part due to the cost of compliance to local regulations.
Estimated volume of supply against demand = Low / Medium
Considering P&A activity in isolation the market capacity for mobile drill rigs appears to be adequate for both jack-up vessels and semi-submersible vessels/drill ships. There is more uncertainty when considering platform rigs and rigless solutions where there is more potential for capacity constraints.Rigless solutions are significantly shorter and lower cost than rig-based alternatives and could offer a more cost effective alternative to operators. There are a significant number of additional wells that could be abandoned using a rigless solution if technology innovation is stimulated. The market is likely to want to move towards using rigless options where risk-based analysis concludes that it is the most cost effective approach. Availably of rigless solutions has potential to become a constraint in the future if the market confidence increases in its viability. The lead time to development of rig-based solutions is less than five years to commission and construct new capacity. For rigless solutions, where innovation and demonstration is required this lead time could potentially be even longer.
Pressures and/or synergies from other industries = Low / Medium
Mobile drilling rigs, platform rigs and rigless intervention systems are all mobile resources. P&A contractors operate as a global resource, following the market opportunities from E&P and P&A in the world’s O&G producing regions. Anecdotally well contractors prefer to support new field development, as it is less cost driven and more programme focused than decommissioning.
Currently drilling activity is 470 wells a year or nearly 90% of peak activity which occurred in the 1980s. Although there is expected to be sufficient supply chain capability to meet the demands of abandonment activity in
isolation the competition for E&P resources has potential to cause a constraint in an already well utilised supply chain.
5.4 Health Check
Well Abandonment | Health Check
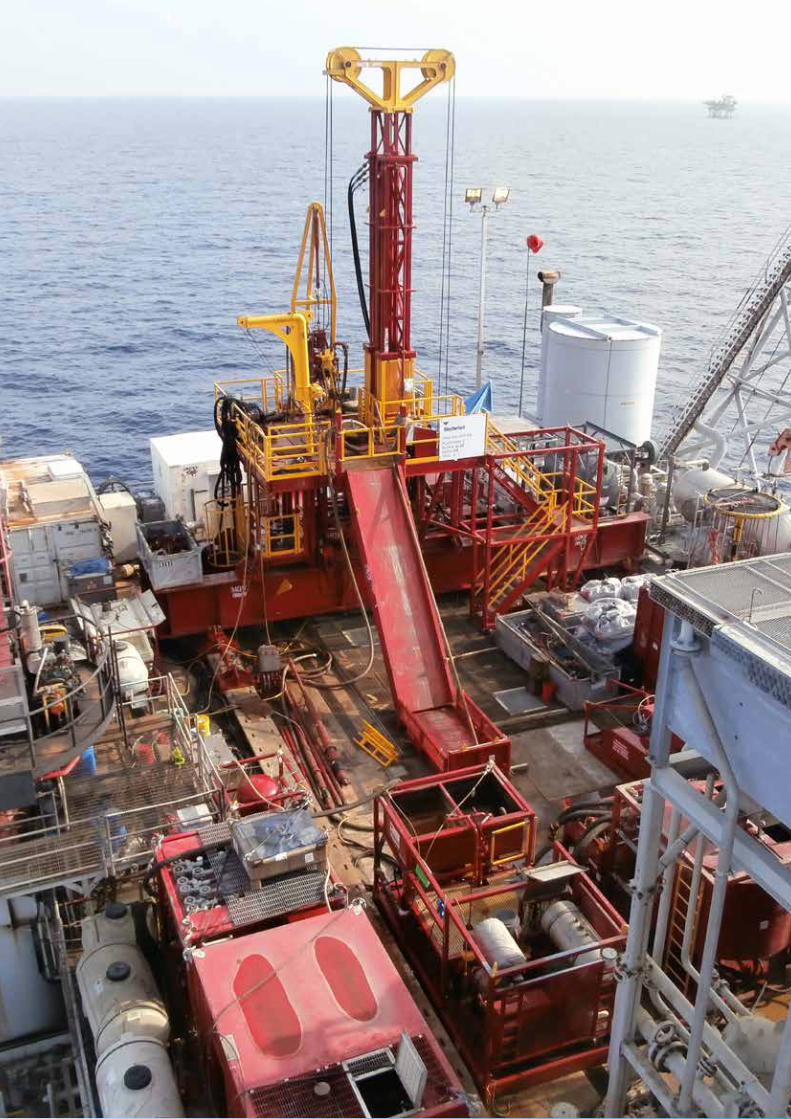
Decom North Sea Review of Decommissioning Capacity | October 2014
51
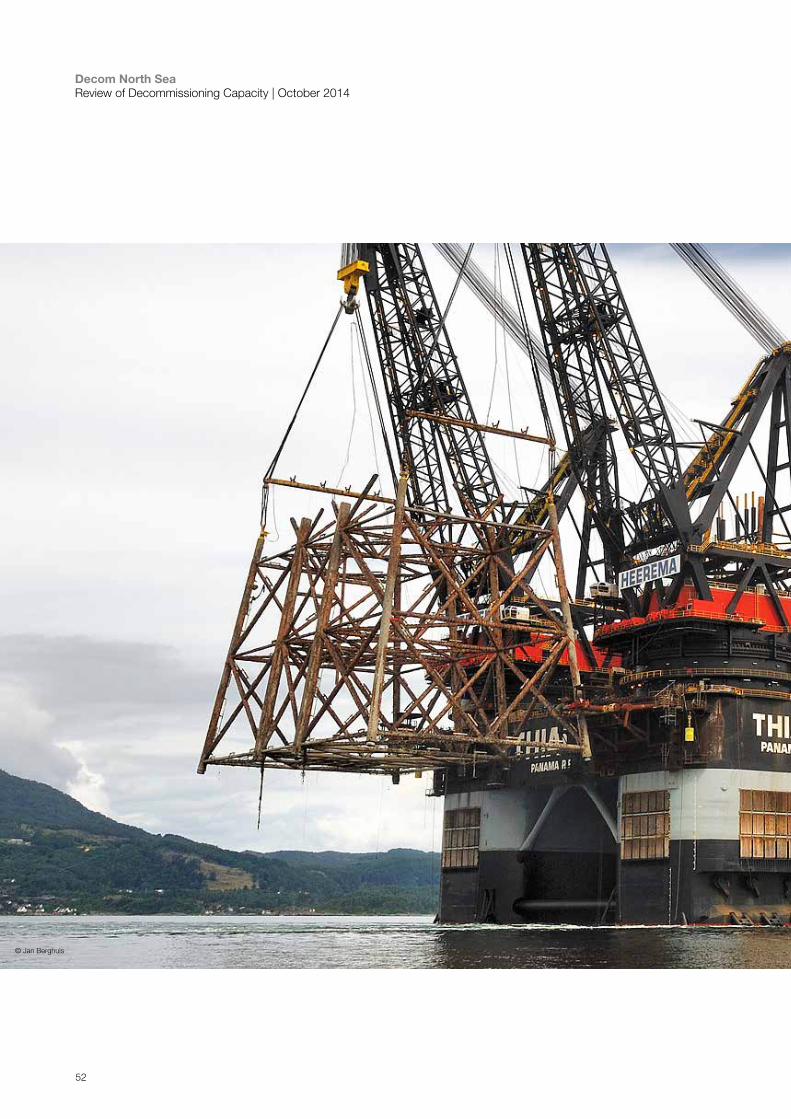
Decom North Sea Review of Decommissioning Capacity | October 2014
52
© Jan Berghuis
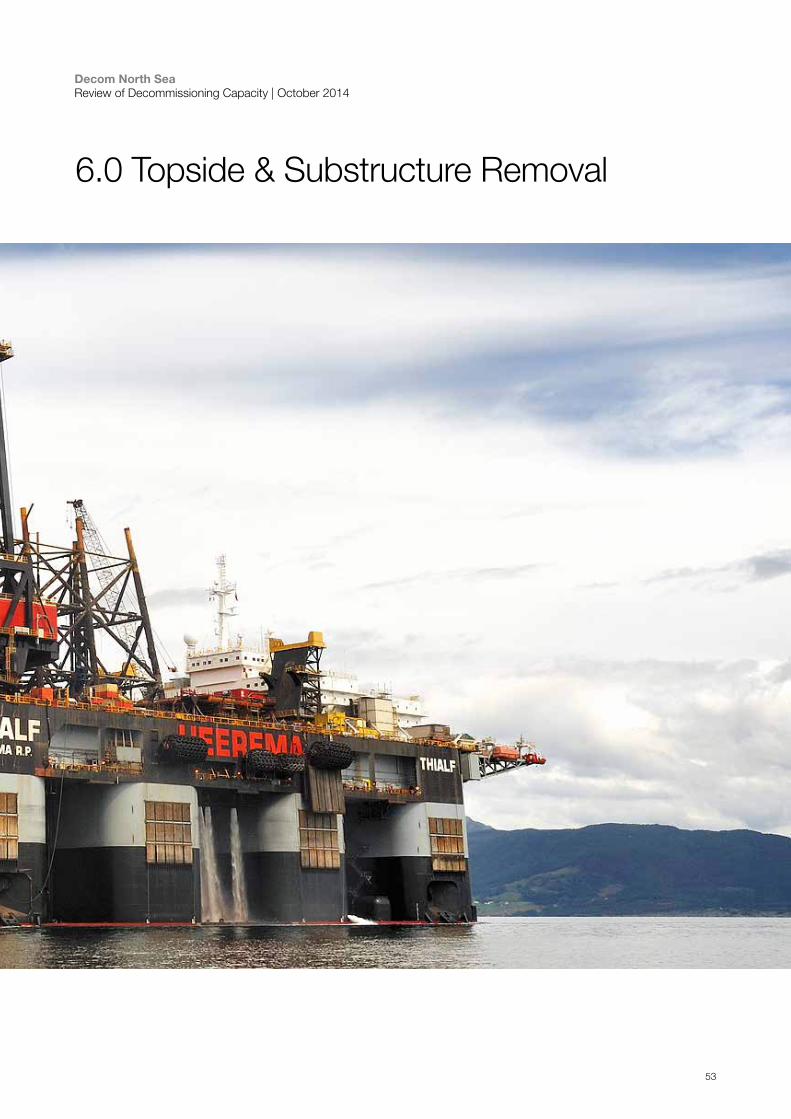
Decom North Sea Review of Decommissioning Capacity | October 2014
53
6.0 Topside & Substructure Removal
Decom North Sea Review of Decommissioning Capacity | October 2014
54
Skills Supply ChainInfrastructure and Equipment
• Detailed Engineering (Topsides and Substructures)
• Naval Architecture
• Offshore Operations
• Transportation
• Removal Vessel
• Transportation Barges
• Anchor Handling Tug Supply (AHTS) Vessels
• Construction Support Vessels (CSV)
• Safety Standby Vessels (SSBV’s)
• Survey Vessels
• Rock Dumping / Backfill Vessels
• Heavy-Lift Vessel Contractors
• Support Vessel Contractors
• Engineering Consultancies
• Specialist Consultancies
Topside & Substructure Removal
Decom North Sea Review of Decommissioning Capacity | September 2014
Topside & Substructure Removal
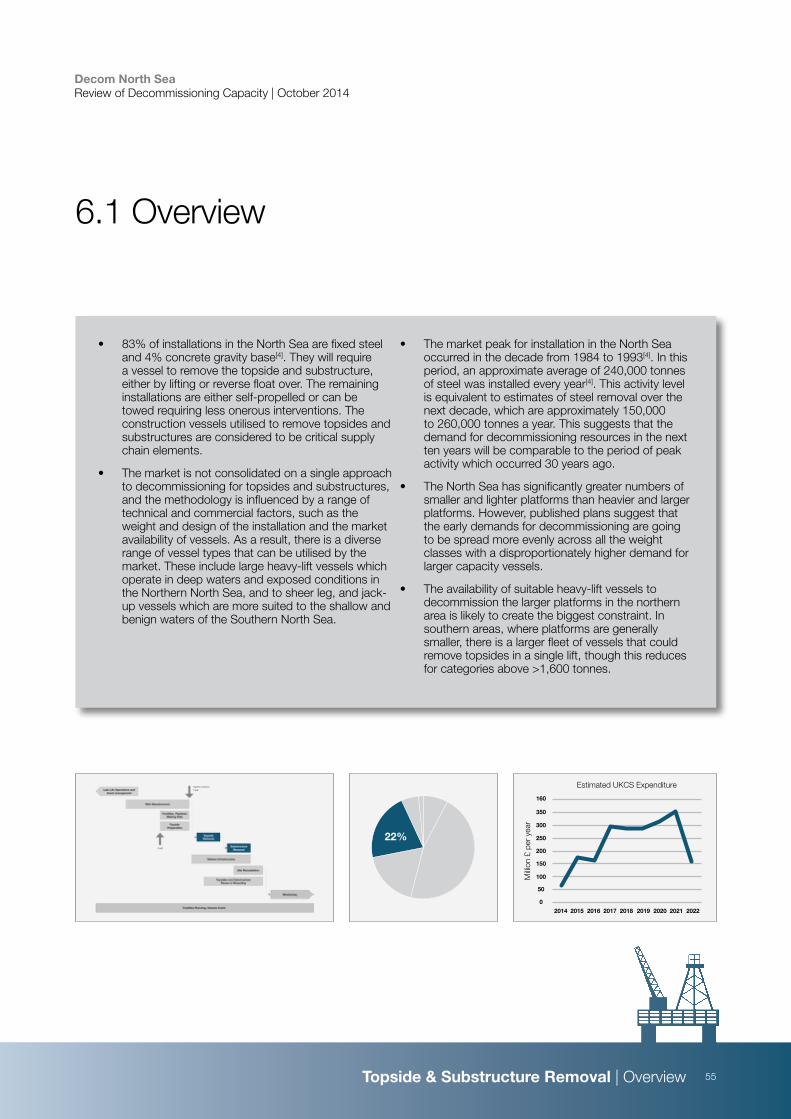
Decom North Sea Review of Decommissioning Capacity | October 2014
55
• 83% of installations in the North Sea are fixed steel and 4% concrete gravity base[4]. They will require a vessel to remove the topside and substructure, either by lifting or reverse float over. The remaining installations are either self-propelled or can be towed requiring less onerous interventions. The construction vessels utilised to remove topsides and substructures are considered to be critical supply chain elements.
• The market is not consolidated on a single approach to decommissioning for topsides and substructures, and the methodology is influenced by a range of technical and commercial factors, such as the weight and design of the installation and the market availability of vessels. As a result, there is a diverse range of vessel types that can be utilised by the market. These include large heavy-lift vessels which operate in deep waters and exposed conditions in the Northern North Sea, and to sheer leg, and jack-up vessels which are more suited to the shallow and benign waters of the Southern North Sea.
• The market peak for installation in the North Sea occurred in the decade from 1984 to 1993[4]. In this period, an approximate average of 240,000 tonnes of steel was installed every year[4]. This activity level is equivalent to estimates of steel removal over the next decade, which are approximately 150,000 to 260,000 tonnes a year. This suggests that the demand for decommissioning resources in the next ten years will be comparable to the period of peak activity which occurred 30 years ago.
• The North Sea has significantly greater numbers of smaller and lighter platforms than heavier and larger platforms. However, published plans suggest that the early demands for decommissioning are going to be spread more evenly across all the weight classes with a disproportionately higher demand for larger capacity vessels.
• The availability of suitable heavy-lift vessels to decommission the larger platforms in the northern area is likely to create the biggest constraint. In southern areas, where platforms are generally smaller, there is a larger fleet of vessels that could remove topsides in a single lift, though this reduces for categories above >1,600 tonnes.
6.1 Overview
160
350
300
250
200
150
100
50
0
2014 2015 2016 2017 2018 2019 2020 2021 2022
Estimated UKCS Expenditure
Milli
on £
per
yea
r
22%
Topside & Substructure Removal | Overview
Decom North Sea Review of Decommissioning Capacity | October 2014
56
The vessels that are required to remove substructures and topsides are critical supply chain elements. The type and location of installation will impact on the vessels and approach to removal.
Fixed Steel
83% of installations in the North Sea are fixed steel with a combined weight of 4.4 million tonnes[4]. There are 535 fixed steel installations with substructures which range from 100 tonnes to over 45,000 tonnes and topsides which range from 70 to 53,000 tonnes[4]. The average substructure weighs 3,500 tonnes and topside 4,300 tonnes.
All fixed steel installations with a substructure under 10,000 tonnes will require removal under OSPAR regulations. This applies to 91% of installations. The remaining 9% may apply for a derogation to leave some or all of the substructure in place.
Both substructures and topsides will need to be removed from site using removal vessels through either single lift, multiple lift, piece small or reverse float over methodologies.
6.2 Activity
Concrete Gravity Base
4% of installations in the North Sea are concrete gravity base substructures[4]. Each structure has a greater average weight than a fixed steel installation and in total they weigh 7.4 million tonnes, almost double the weight of all the fixed steel installations.
OSPAR regulations allow the possibility of a derogation to leave concrete gravity installations in situ at the end of their life. Technical and commercial constraints have meant that all concrete gravity base platforms decommissioned to date have obtained permission to leave their substructures in situ. It is likely that operators will continue to seek derogations for concrete gravity base installations in the absence of further regulator intervention or technical advancements.
It is also likely that the topsides will be removed from site and recycled in a similar method to large fixed steel installations, although these can be technically more challenging than their fixed steel equivalents.
Other Installations
The remaining 13 % of installation types are predominantly floating technology. Although they can range in weight (up to 100,000’s tonnes), they are more straight forward to decommission, either because they can self-propel, or because they can be towed from site[4]. The requirements for vessels will be less onerous than for fixed steel and concrete gravity base.
Activity Focus
The critical supply chain is focused on the removal of fixed steel and the topsides from concrete gravity base installations with removal vessels carrying out either a single lift, multiple lift, piece small or reverse float over.
Topside & Substructure Removal | Activity
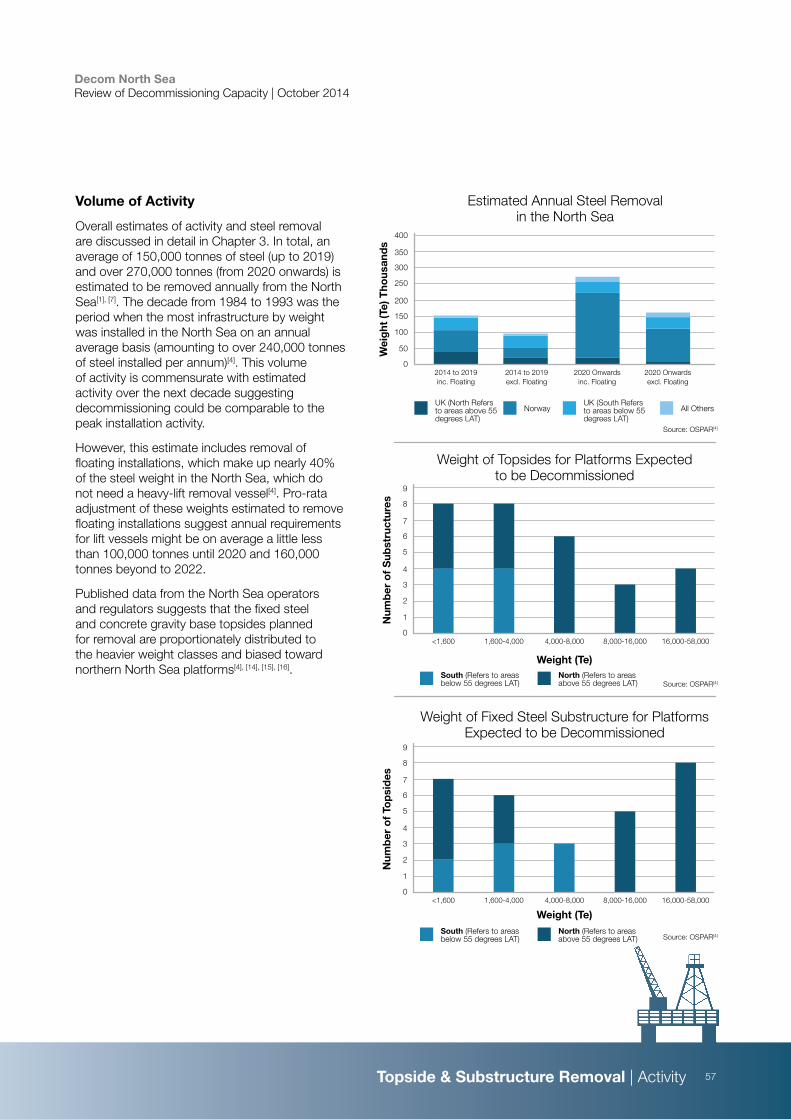
Decom North Sea Review of Decommissioning Capacity | October 2014
57
Volume of Activity
Overall estimates of activity and steel removal are discussed in detail in Chapter 3. In total, an average of 150,000 tonnes of steel (up to 2019) and over 270,000 tonnes (from 2020 onwards) is estimated to be removed annually from the North Sea[1], [7]. The decade from 1984 to 1993 was the period when the most infrastructure by weight was installed in the North Sea on an annual average basis (amounting to over 240,000 tonnes of steel installed per annum)[4]. This volume of activity is commensurate with estimated activity over the next decade suggesting decommissioning could be comparable to the peak installation activity.
However, this estimate includes removal of floating installations, which make up nearly 40% of the steel weight in the North Sea, which do not need a heavy-lift removal vessel[4]. Pro-rata adjustment of these weights estimated to remove floating installations suggest annual requirements for lift vessels might be on average a little less than 100,000 tonnes until 2020 and 160,000 tonnes beyond to 2022.
Published data from the North Sea operators and regulators suggests that the fixed steel and concrete gravity base topsides planned for removal are proportionately distributed to the heavier weight classes and biased toward northern North Sea platforms[4], [14], [15], [16].
Source: OSPAR[4]
Estimated Annual Steel Removal in the North Sea
UK (North Refers to areas above 55 degrees LAT)
Wei
ght
(Te)
Tho
usan
ds
400
350
300
250
200
150
100
50
0
NorwayUK (South Refers to areas below 55 degrees LAT)
All Others
2014 to 2019 inc. Floating
2014 to 2019 excl. Floating
2020 Onwards inc. Floating
2020 Onwards excl. Floating
South (Refers to areas below 55 degrees LAT)
North (Refers to areas above 55 degrees LAT)
Num
ber
of
Sub
stru
ctur
es 8
7
6
5
4
3
2
1
0
Weight (Te)
<1,600 1,600-4,000 4,000-8,000 8,000-16,000 16,000-58,000
9
Source: OSPAR[4]
Weight of Topsides for Platforms Expected to be Decommissioned
Num
ber
of
Top
sid
es
8
7
6
5
4
3
2
1
0
Weight (Te)<1,600 1,600-4,000 4,000-8,000 8,000-16,000 16,000-58,000
9
Source: OSPAR[4]
Weight of Fixed Steel Substructure for Platforms Expected to be Decommissioned
Topside & Substructure Removal | Activity
South (Refers to areas below 55 degrees LAT)
North (Refers to areas above 55 degrees LAT)
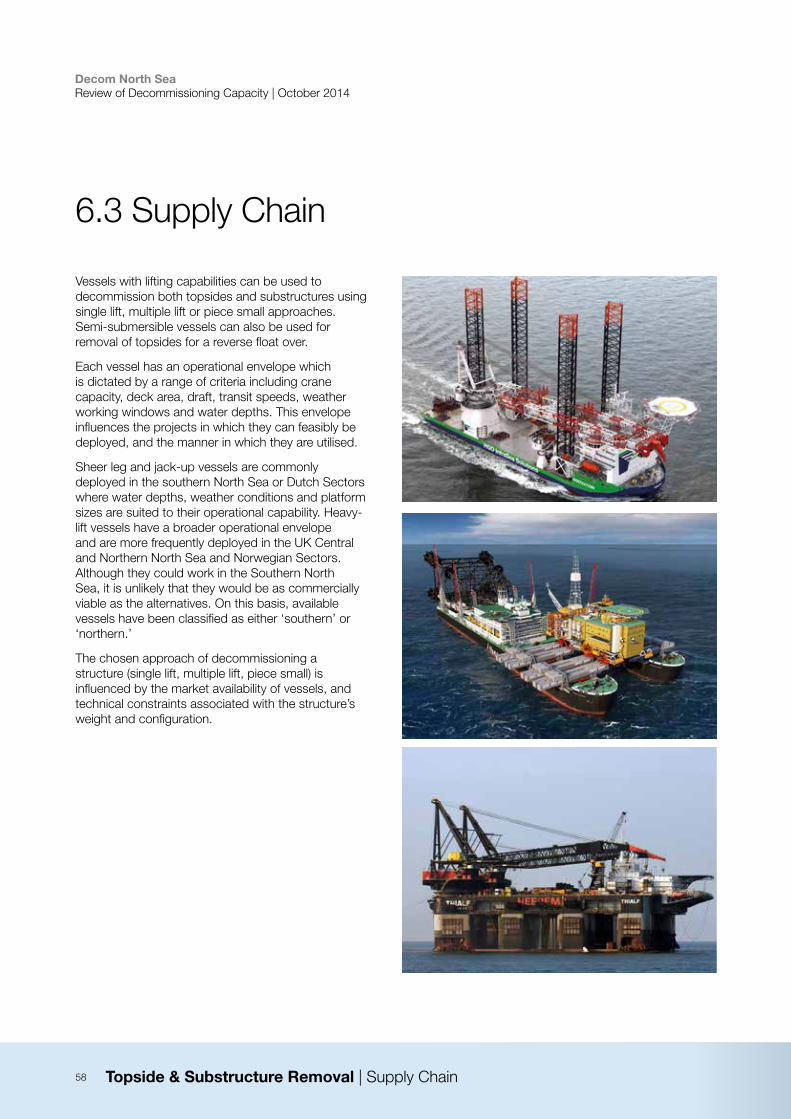
Decom North Sea Review of Decommissioning Capacity | October 2014
58
Vessels with lifting capabilities can be used to decommission both topsides and substructures using single lift, multiple lift or piece small approaches. Semi-submersible vessels can also be used for removal of topsides for a reverse float over.
Each vessel has an operational envelope which is dictated by a range of criteria including crane capacity, deck area, draft, transit speeds, weather working windows and water depths. This envelope influences the projects in which they can feasibly be deployed, and the manner in which they are utilised.
Sheer leg and jack-up vessels are commonly deployed in the southern North Sea or Dutch Sectors where water depths, weather conditions and platform sizes are suited to their operational capability. Heavy-lift vessels have a broader operational envelope and are more frequently deployed in the UK Central and Northern North Sea and Norwegian Sectors. Although they could work in the Southern North Sea, it is unlikely that they would be as commercially viable as the alternatives. On this basis, available vessels have been classified as either ‘southern’ or ‘northern.’
The chosen approach of decommissioning a structure (single lift, multiple lift, piece small) is influenced by the market availability of vessels, and technical constraints associated with the structure’s weight and configuration.
6.3 Supply Chain
Topside & Substructure Removal | Supply Chain
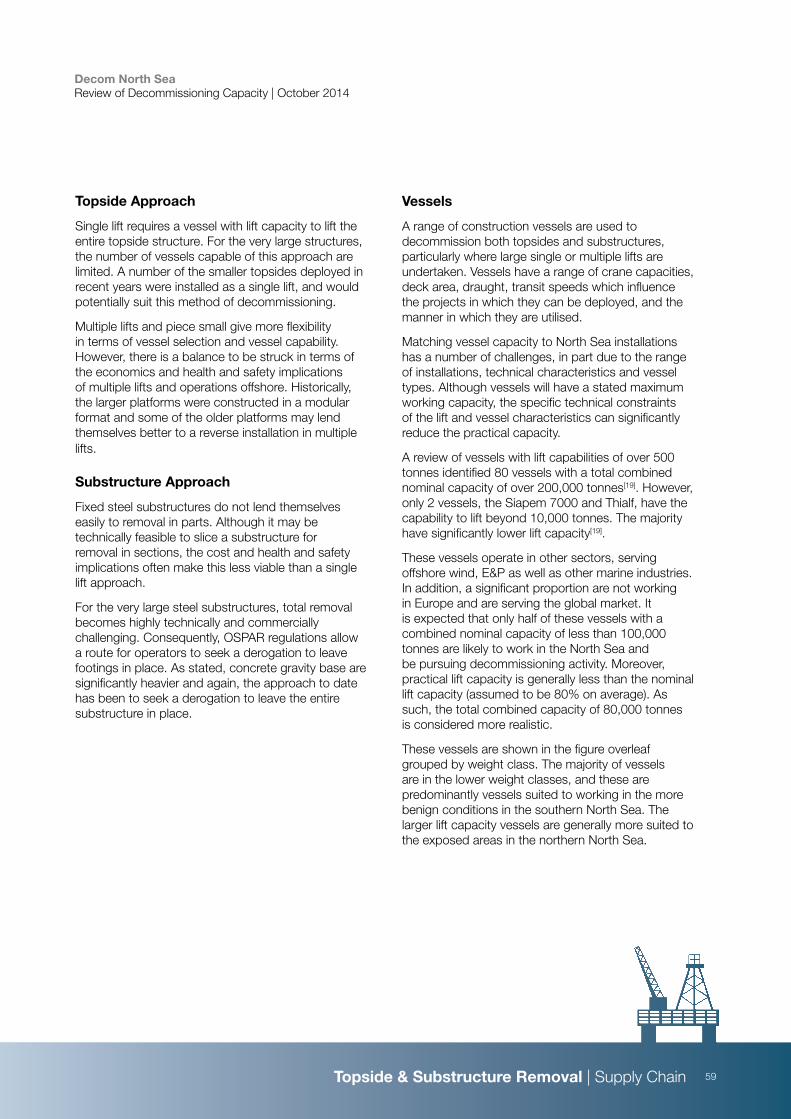
Decom North Sea Review of Decommissioning Capacity | October 2014
59
Topside Approach
Single lift requires a vessel with lift capacity to lift the entire topside structure. For the very large structures, the number of vessels capable of this approach are limited. A number of the smaller topsides deployed in recent years were installed as a single lift, and would potentially suit this method of decommissioning.
Multiple lifts and piece small give more flexibility in terms of vessel selection and vessel capability. However, there is a balance to be struck in terms of the economics and health and safety implications of multiple lifts and operations offshore. Historically, the larger platforms were constructed in a modular format and some of the older platforms may lend themselves better to a reverse installation in multiple lifts.
Substructure Approach
Fixed steel substructures do not lend themselves easily to removal in parts. Although it may be technically feasible to slice a substructure for removal in sections, the cost and health and safety implications often make this less viable than a single lift approach.
For the very large steel substructures, total removal becomes highly technically and commercially challenging. Consequently, OSPAR regulations allow a route for operators to seek a derogation to leave footings in place. As stated, concrete gravity base are significantly heavier and again, the approach to date has been to seek a derogation to leave the entire substructure in place.
Vessels A range of construction vessels are used to decommission both topsides and substructures, particularly where large single or multiple lifts are undertaken. Vessels have a range of crane capacities, deck area, draught, transit speeds which influence the projects in which they can be deployed, and the manner in which they are utilised.
Matching vessel capacity to North Sea installations has a number of challenges, in part due to the range of installations, technical characteristics and vessel types. Although vessels will have a stated maximum working capacity, the specific technical constraints of the lift and vessel characteristics can significantly reduce the practical capacity.
A review of vessels with lift capabilities of over 500 tonnes identified 80 vessels with a total combined nominal capacity of over 200,000 tonnes[19]. However, only 2 vessels, the Siapem 7000 and Thialf, have the capability to lift beyond 10,000 tonnes. The majority have significantly lower lift capacity[19].
These vessels operate in other sectors, serving offshore wind, E&P as well as other marine industries. In addition, a significant proportion are not working in Europe and are serving the global market. It is expected that only half of these vessels with a combined nominal capacity of less than 100,000 tonnes are likely to work in the North Sea and be pursuing decommissioning activity. Moreover, practical lift capacity is generally less than the nominal lift capacity (assumed to be 80% on average). As such, the total combined capacity of 80,000 tonnes is considered more realistic.
These vessels are shown in the figure overleaf grouped by weight class. The majority of vessels are in the lower weight classes, and these are predominantly vessels suited to working in the more benign conditions in the southern North Sea. The larger lift capacity vessels are generally more suited to the exposed areas in the northern North Sea.
Topside & Substructure Removal | Supply Chain
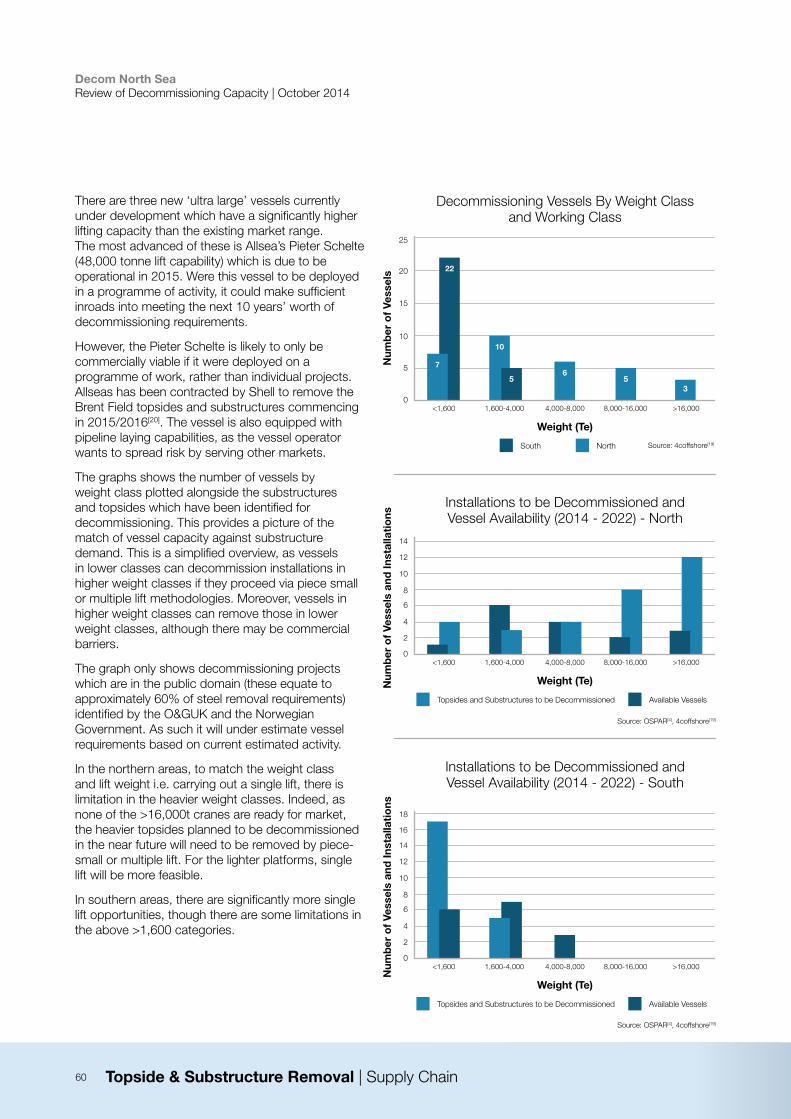
Decom North Sea Review of Decommissioning Capacity | October 2014
60
There are three new ‘ultra large’ vessels currently under development which have a significantly higher lifting capacity than the existing market range. The most advanced of these is Allsea’s Pieter Schelte (48,000 tonne lift capability) which is due to be operational in 2015. Were this vessel to be deployed in a programme of activity, it could make sufficient inroads into meeting the next 10 years’ worth of decommissioning requirements.
However, the Pieter Schelte is likely to only be commercially viable if it were deployed on a programme of work, rather than individual projects. Allseas has been contracted by Shell to remove the Brent Field topsides and substructures commencing in 2015/2016[20]. The vessel is also equipped with pipeline laying capabilities, as the vessel operator wants to spread risk by serving other markets.
The graphs shows the number of vessels by weight class plotted alongside the substructures and topsides which have been identified for decommissioning. This provides a picture of the match of vessel capacity against substructure demand. This is a simplified overview, as vessels in lower classes can decommission installations in higher weight classes if they proceed via piece small or multiple lift methodologies. Moreover, vessels in higher weight classes can remove those in lower weight classes, although there may be commercial barriers.
The graph only shows decommissioning projects which are in the public domain (these equate to approximately 60% of steel removal requirements) identified by the O&GUK and the Norwegian Government. As such it will under estimate vessel requirements based on current estimated activity.
In the northern areas, to match the weight class and lift weight i.e. carrying out a single lift, there is limitation in the heavier weight classes. Indeed, as none of the >16,000t cranes are ready for market, the heavier topsides planned to be decommissioned in the near future will need to be removed by piece-small or multiple lift. For the lighter platforms, single lift will be more feasible.
In southern areas, there are significantly more single lift opportunities, though there are some limitations in the above >1,600 categories.
Decommissioning Vessels By Weight Class and Working Class
South North
Num
ber
of
Vess
els 20
15
10
5
0
Weight (Te)
<1,600 1,600-4,000 4,000-8,000 8,000-16,000 >16,000
25
22
7
10
56
53
Installations to be Decommissioned and Vessel Availability (2014 - 2022) - North
Topsides and Substructures to be Decommissioned Available Vessels
Num
ber
of
Vess
els
and
Inst
alla
tio
ns
12
8
4
0
Weight (Te)
<1,600 1,600-4,000 4,000-8,000 8,000-16,000 >16,000
6
2
10
14
Installations to be Decommissioned and Vessel Availability (2014 - 2022) - South
Topsides and Substructures to be Decommissioned Available Vessels
Num
ber
of
Vess
els
and
Inst
alla
tio
ns
12
8
4
0
Weight (Te)
<1,600 1,600-4,000 4,000-8,000 8,000-16,000 >16,000
6
2
10
14
16
18
Source: 4coffshore[19]
Source: OSPAR[4], 4coffshore[19]
Source: OSPAR[4], 4coffshore[19]
Topside & Substructure Removal | Supply Chain
Decom North Sea Review of Decommissioning Capacity | October 2014
61
Overall Status = Orange
There is a moderate potential for topside and substructure removal resources to cause a supply chain bottleneck based on the considerations detailed above.
Investment Status = Low / Medium
Vessel operators are reluctant to make commitments to new vessels without certainty in terms of timing of the North Sea decommissioning market. There has been commitment to development and construction of new
vessels, such as the Pieter Schelte, which can support the decommissioning market. However, these vessels have generally been justified on the basis of a business case covering a broader market sector.
Capability = Low / Medium
Piece Small and Reverse engineering capacity is higher than that of single lift removal. The market for heavy-lift, while relatively immature for decommissioning, has gained experience from decades of construction in the North Sea. There is more experience in lower weight categories. For lifts greater than 10,000 tonnes there is extremely limited capacity.
Estimated volume of supply against demand = Low / Medium
There are challenges in determining the capacity of the vessel market to respond to decommissioning opportunities. The market peak for installation in the North Sea occurred in the ten years from 1984 to 1993. In this period an approximately average of 240,000 tonnes of steel were installed every year. This activity level is equivalent to estimates of steel removal over the next decade which are approximately 150,000 to 260,000 tonnes a year. This suggests activity over the next ten years will be comparable to the period of peak activity which occurred 30 years ago.In the northern areas, to match the weight class and lift weight i.e. carrying out a single lift, there is limitation in the heavier weight classes. For the lighter platforms single lift will be more feasible.In southern areas there are significantly more single lift opportunities, though there are some limitations in the above >1,600 Categories. If there are shortages in the market there is a long lead time to building new capacity, with vessel development and construction taking approximately 5 years or more. If there is an undersupply, the lead time to developing new capacity could cause constraints in the medium term.
Pressures and/or synergies from other industries = Medium
Vessels operate as a global resource, following the market opportunities from a range of marine industries such as offshore wind, and O&G construction. Jack-up, sheer leg and heavy-lift vessels are in demand from the offshore wind industry for substructure, turbines and substation platforms. There are significant developments planned in UK waters for projects with construction programmes that last for a number of years for each project.The majority of decommissioning vessels are also appropriate for new field development. Anecdotally vessel operators prefer to support new field development, as it is less cost driven and more programme focused than decommissioning. Despite this, current North Sea new construction activity is significantly lower than during peak development. Over the ten year period from 1984 to 1993 there was an average of 20 fixed steel or concrete gravity base installations constructed a year, with a peak of 38. The average number of fixed steel or concrete gravity base installations constructed over the last ten years has been just over 7 a year only 35% of the peak. As such there is less demand from E&P activities than historically occurred.
6.4 Health Check
Topside & Substructure Removal | Health Check
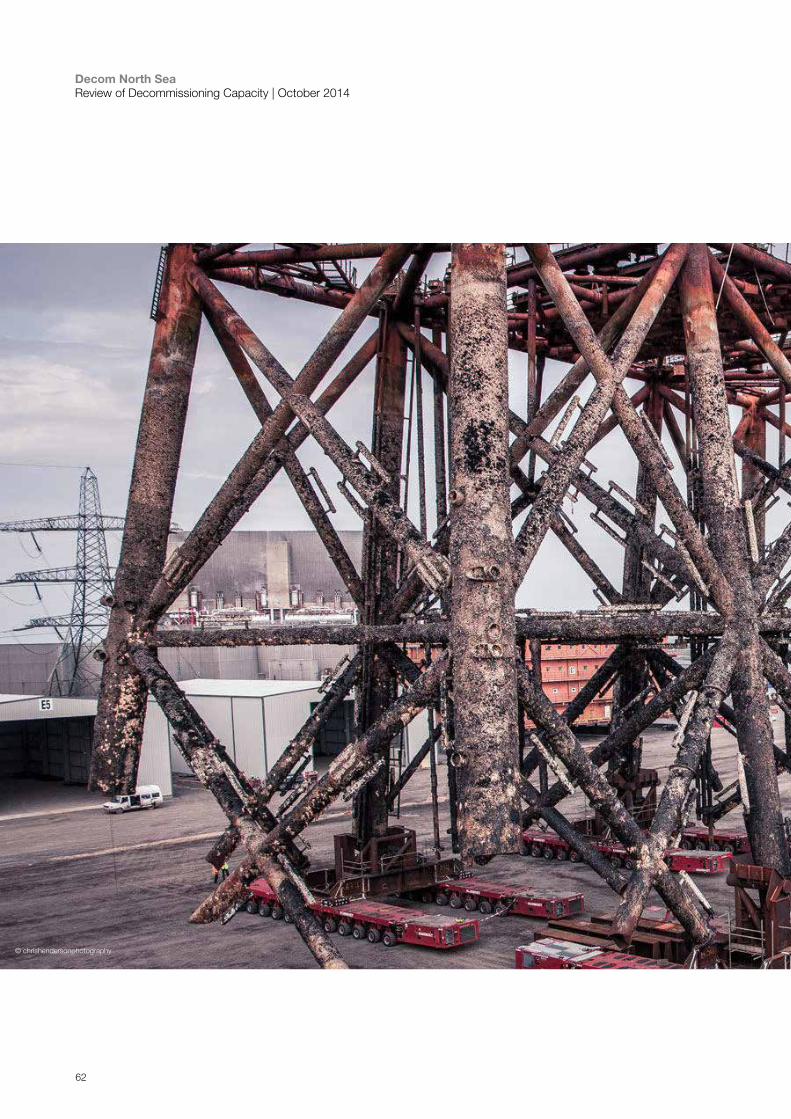
Decom North Sea Review of Decommissioning Capacity | October 2014
62
© chrishendersonphotography
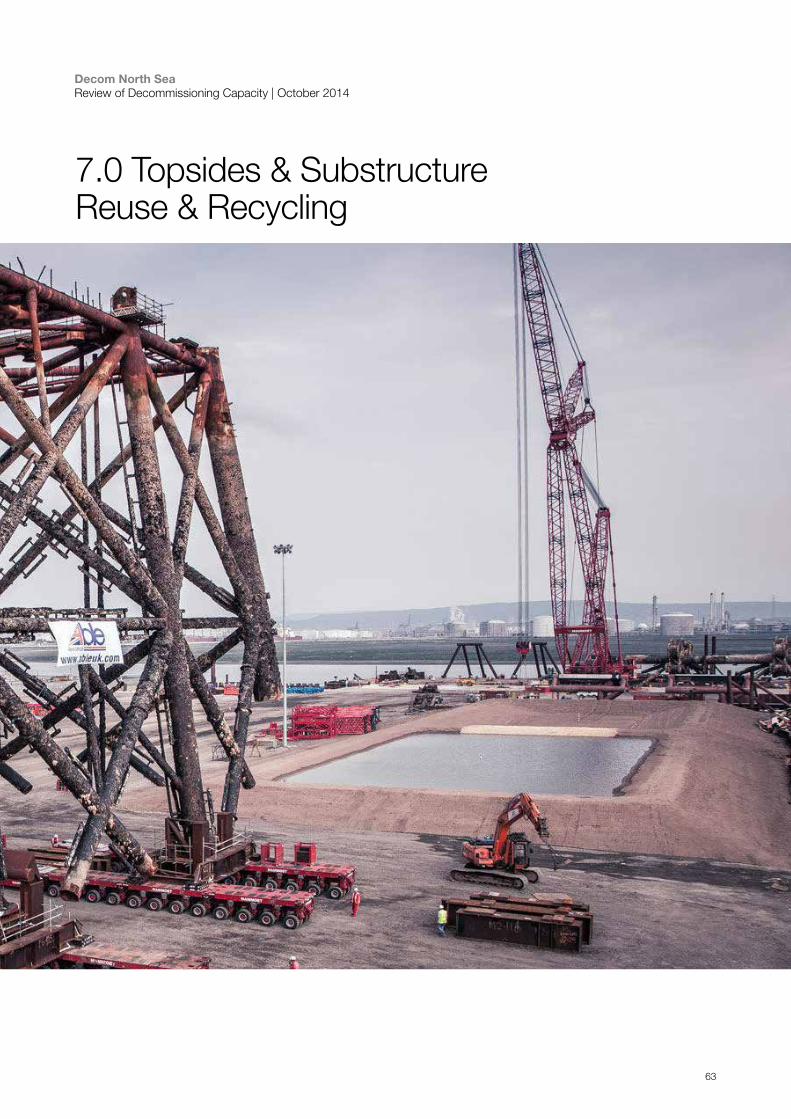
Decom North Sea Review of Decommissioning Capacity | October 2014
63
7.0 Topsides & Substructure Reuse & Recycling
64
Decom North Sea Review of Decommissioning Capacity | October 2014
64
Skills Supply ChainInfrastructure and Equipment
• Waste Material Characterisation
• Onshore Dismantling
• Onshore Environmental
• Waste Management
• Hazardous Material Management and Disposal
• Onshore Cranage
• Cutting Equipment
• Handling Equipment
• Onshore Yard Space
• Quayside Strength and Extent
• Deepwater Access Channel
• Dry Dock
• Metal Recycling Facilities and Logistics
• Engineering Consultants
• Onshore Yard Operators
• Ports and Harbour Operators
• Civil Contractors
• Demolition Contractors
• Waste Reuse & Recycling Contractors
Topsides & Substructure Reuse & Recycling
Decom North Sea Review of Decommissioning Capacity | September 2014
Topside & Substructure Reuse & Recycling
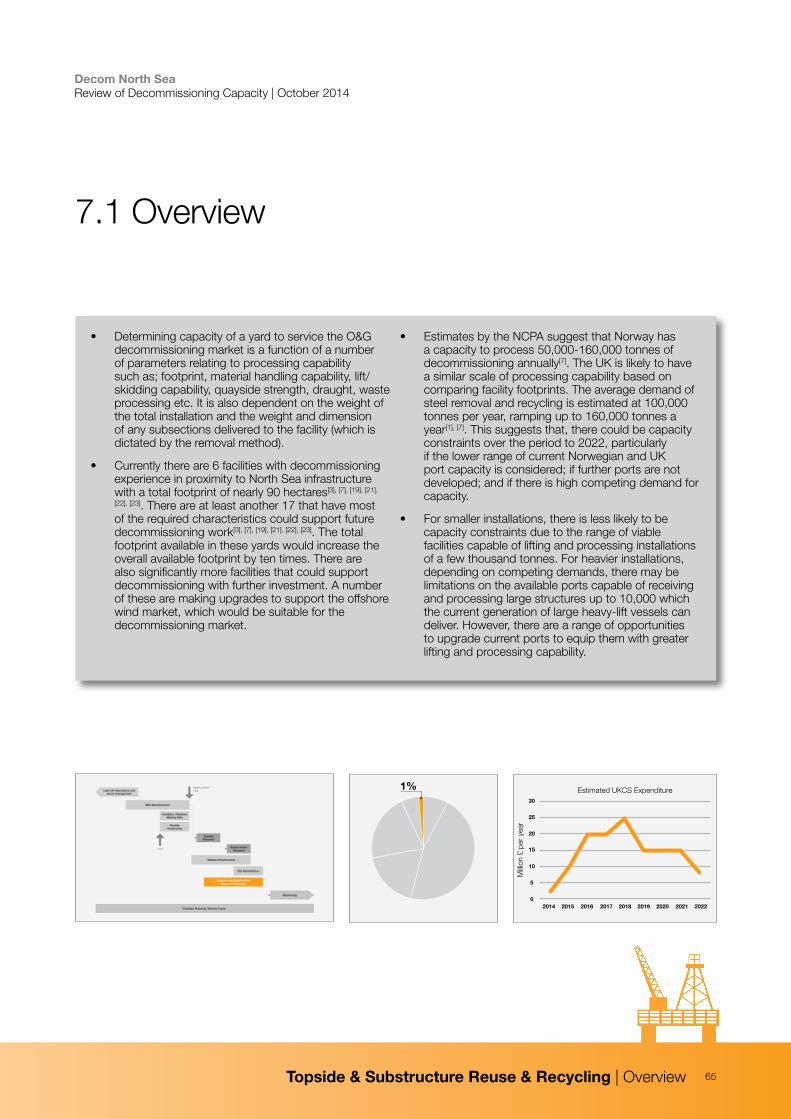
65
Decom North Sea Review of Decommissioning Capacity | October 2014
65
7.1 Overview
30
25
20
15
10
5
02014 2015 2016 2017 2018 2019 2020 2021 2022
Estimated UKCS Expenditure
Milli
on £
per
yea
r
1%
• Determining capacity of a yard to service the O&G decommissioning market is a function of a number of parameters relating to processing capability such as; footprint, material handling capability, lift/skidding capability, quayside strength, draught, waste processing etc. It is also dependent on the weight of the total installation and the weight and dimension of any subsections delivered to the facility (which is dictated by the removal method).
• Currently there are 6 facilities with decommissioning experience in proximity to North Sea infrastructure with a total footprint of nearly 90 hectares[3], [7], [19], [21],
[22], [23]. There are at least another 17 that have most of the required characteristics could support future decommissioning work[3], [7], [19], [21], [22], [23]. The total footprint available in these yards would increase the overall available footprint by ten times. There are also significantly more facilities that could support decommissioning with further investment. A number of these are making upgrades to support the offshore wind market, which would be suitable for the decommissioning market.
• Estimates by the NCPA suggest that Norway has a capacity to process 50,000-160,000 tonnes of decommissioning annually[7]. The UK is likely to have a similar scale of processing capability based on comparing facility footprints. The average demand of steel removal and recycling is estimated at 100,000 tonnes per year, ramping up to 160,000 tonnes a year[1], [7]. This suggests that, there could be capacity constraints over the period to 2022, particularly if the lower range of current Norwegian and UK port capacity is considered; if further ports are not developed; and if there is high competing demand for capacity.
• For smaller installations, there is less likely to be capacity constraints due to the range of viable facilities capable of lifting and processing installations of a few thousand tonnes. For heavier installations, depending on competing demands, there may be limitations on the available ports capable of receiving and processing large structures up to 10,000 which the current generation of large heavy-lift vessels can deliver. However, there are a range of opportunities to upgrade current ports to equip them with greater lifting and processing capability.
Topside & Substructure Reuse & Recycling | Overview
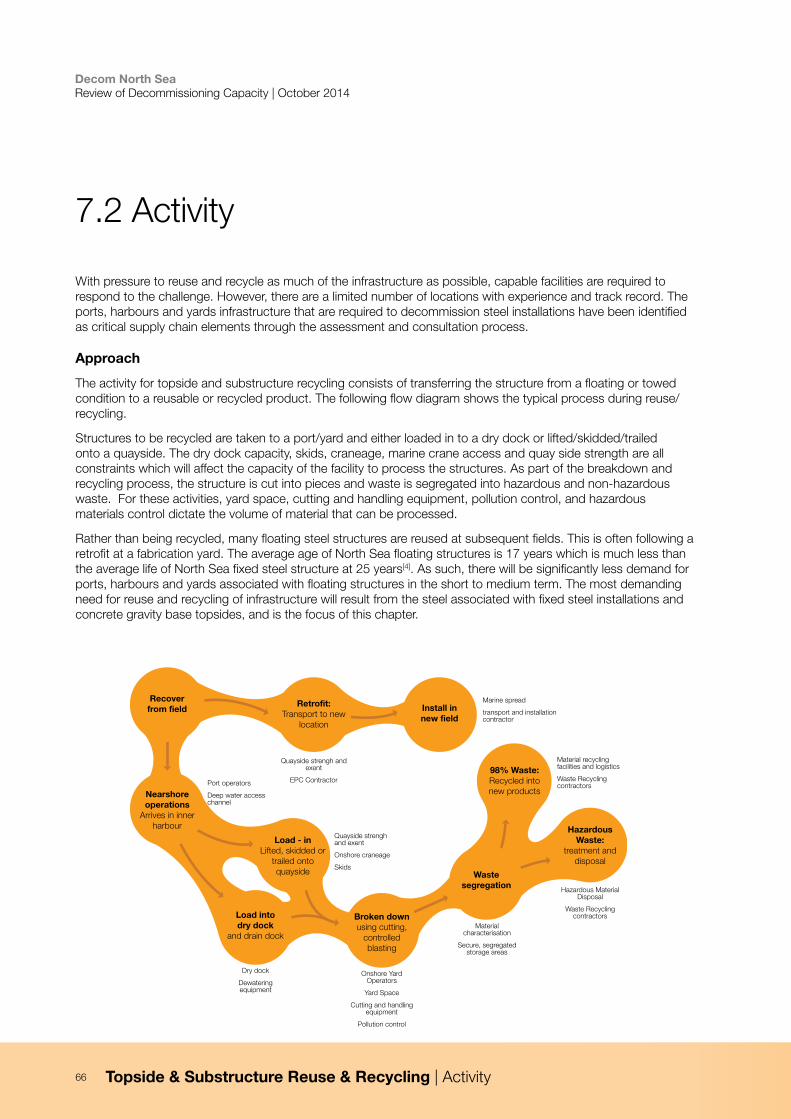
66
Decom North Sea Review of Decommissioning Capacity | October 2014
66
7.2 Activity
Recover from field
Retrofit:Transport to new
location
Install in new field
98% Waste:Recycled into new products
Hazardous Waste:
treatment and disposal
Waste segregation
Broken down using cutting,
controlled blasting
Load - in Lifted, skidded or
trailed onto quayside
Load into dry dock
and drain dock
Nearshore operations
Arrives in inner harbour
Quayside strengh and exent
EPC Contractor
Quayside strengh and exent
Onshore craneage
Skids
Onshore Yard Operators
Yard Space
Cutting and handling equipment
Pollution control
Material characterisation
Secure, segregated storage areas
Hazardous Material Disposal
Waste Recycling contractors
Material recycling facilities and logistics
Waste Recycling contractors
Marine spread
transport and installation contractor
Port operators
Deep water access channel
Dry dock
Dewatering equipment
With pressure to reuse and recycle as much of the infrastructure as possible, capable facilities are required to respond to the challenge. However, there are a limited number of locations with experience and track record. The ports, harbours and yards infrastructure that are required to decommission steel installations have been identified as critical supply chain elements through the assessment and consultation process.
Approach
The activity for topside and substructure recycling consists of transferring the structure from a floating or towed condition to a reusable or recycled product. The following flow diagram shows the typical process during reuse/recycling.
Structures to be recycled are taken to a port/yard and either loaded in to a dry dock or lifted/skidded/trailed onto a quayside. The dry dock capacity, skids, craneage, marine crane access and quay side strength are all constraints which will affect the capacity of the facility to process the structures. As part of the breakdown and recycling process, the structure is cut into pieces and waste is segregated into hazardous and non-hazardous waste. For these activities, yard space, cutting and handling equipment, pollution control, and hazardous materials control dictate the volume of material that can be processed.
Rather than being recycled, many floating steel structures are reused at subsequent fields. This is often following a retrofit at a fabrication yard. The average age of North Sea floating structures is 17 years which is much less than the average life of North Sea fixed steel structure at 25 years[4]. As such, there will be significantly less demand for ports, harbours and yards associated with floating structures in the short to medium term. The most demanding need for reuse and recycling of infrastructure will result from the steel associated with fixed steel installations and concrete gravity base topsides, and is the focus of this chapter.
Topside & Substructure Reuse & Recycling | Activity
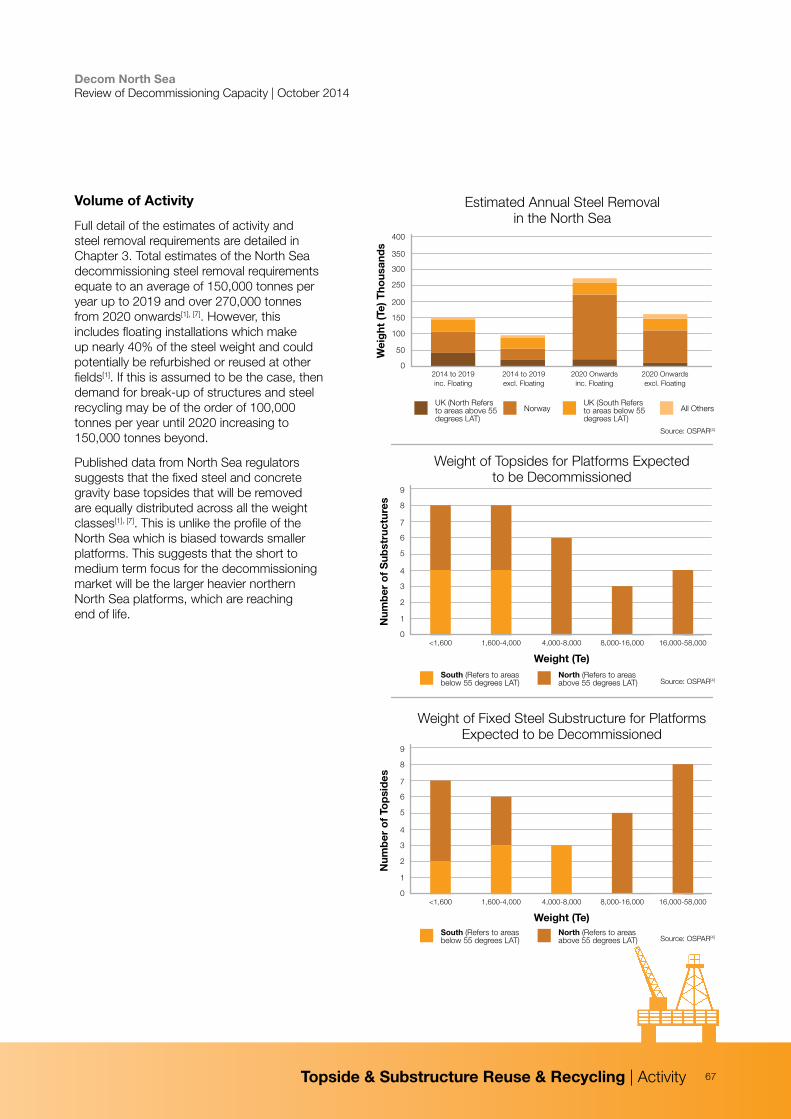
67
Decom North Sea Review of Decommissioning Capacity | October 2014
67
Volume of Activity
Full detail of the estimates of activity and steel removal requirements are detailed in Chapter 3. Total estimates of the North Sea decommissioning steel removal requirements equate to an average of 150,000 tonnes per year up to 2019 and over 270,000 tonnes from 2020 onwards[1], [7]. However, this includes floating installations which make up nearly 40% of the steel weight and could potentially be refurbished or reused at other fields[1]. If this is assumed to be the case, then demand for break-up of structures and steel recycling may be of the order of 100,000 tonnes per year until 2020 increasing to 150,000 tonnes beyond.
Published data from North Sea regulators suggests that the fixed steel and concrete gravity base topsides that will be removed are equally distributed across all the weight classes[1], [7]. This is unlike the profile of the North Sea which is biased towards smaller platforms. This suggests that the short to medium term focus for the decommissioning market will be the larger heavier northern North Sea platforms, which are reaching end of life.
Source: OSPAR[4]
Num
ber
of
Sub
stru
ctur
es 8
7
6
5
4
3
2
1
0
Weight (Te)
<1,600 1,600-4,000 4,000-8,000 8,000-16,000 16,000-58,000
9
Source: OSPAR[4]
Weight of Topsides for Platforms Expected to be Decommissioned
Topside & Substructure Reuse & Recycling | Activity
Num
ber
of
Top
sid
es
8
7
6
5
4
3
2
1
0
Weight (Te)
<1,600 1,600-4,000 4,000-8,000 8,000-16,000 16,000-58,000
9
Source: OSPAR[4]
Weight of Fixed Steel Substructure for Platforms Expected to be Decommissioned
South (Refers to areas below 55 degrees LAT)
North (Refers to areas above 55 degrees LAT)
South (Refers to areas below 55 degrees LAT)
North (Refers to areas above 55 degrees LAT)
Estimated Annual Steel Removal in the North Sea
Wei
ght
(Te)
Tho
usan
ds
400
350
300
250
200
150
100
50
02014 to 2019 inc. Floating
2014 to 2019 excl. Floating
2020 Onwards inc. Floating
2020 Onwards excl. Floating
UK (North Refers to areas above 55 degrees LAT)
NorwayUK (South Refers to areas below 55 degrees LAT)
All Others
68
Decom North Sea Review of Decommissioning Capacity | October 2014
68
Determining the current and future supply chain capacity in the next 10 years is complex due to the technical, commercial and political factors influencing how the supply chain is utilised. The lead time to build new capacity and capability will result in limitations in terms of new facilities in the next few years.
Capability
The type of installations in terms of scale and weight and decommissioning approach (piece small, multiple lift, single lift) will dictate the required port, harbour and yard functional requirements. Smaller installations or piece small approaches will provide for a much lower barrier to entry for the supply chain. For the very large installations, or multiple/single lift approaches the functional requirements are significantly more onerous, and there are less viable facilities in the current supply chain.
The average topside weight in the North Sea is just over 4,000 tonnes[4]. An ideal decommissioning yard to recycle a topside of this size would require the following characteristics:
• Draught sufficient to allow access for appropriate removal vessels.
• Depths in excess of 15 m provides flexibility for larger vessels, although this depth is not common. Alternative approaches such as use of barges can be utilised where there are draught limitations.
• Adequate working space to allow for the topside footprint and an appropriate working space estimated to be approximately 2 ha.
• Quayside with a capacity in excess of 40 tonnes per m2 and capability for lifting, skidding or trailing the topside ‘or’ substructure; or
• A dry dock with footprint of approximately 2 ha with appropriate shape.
Depending on the volume of business and continuity of projects the following characteristics would also be attractive:
• Available and experienced workforce.
• Rail and other transport connections.
• Facilities for treatment and storage/transport of hazardous waste including Naturally Occurring Radioactive Material (NORMs).
• Areas for waste segregation.
• Located within reasonable proximity to the location of the asset that is being decommissioned; and
• A safety focussed and secure licensed worksite.
Smaller lighter substructures and topsides will be more flexible in terms of their functional demands, requiring a lesser footprint, draft and lifting capability. The largest installations will be significantly more limited in terms of the locations which they can utilise.
Waste Transfer
There are regulatory barriers in terms of capacity, as there are limitations in terms of waste that can be transferred across national boundaries. Waste requiring disposal cannot be shipped across international borders. However, waste can be moved across international borders if it is destined for recovery. Capacity must be considered in terms of constraints in North Sea operators considering facilities out with their continental shelf, especially where there are limitations in recovery of the waste products.
7.3 Supply Chain
Topside & Substructure Reuse & Recycling | Supply Chain
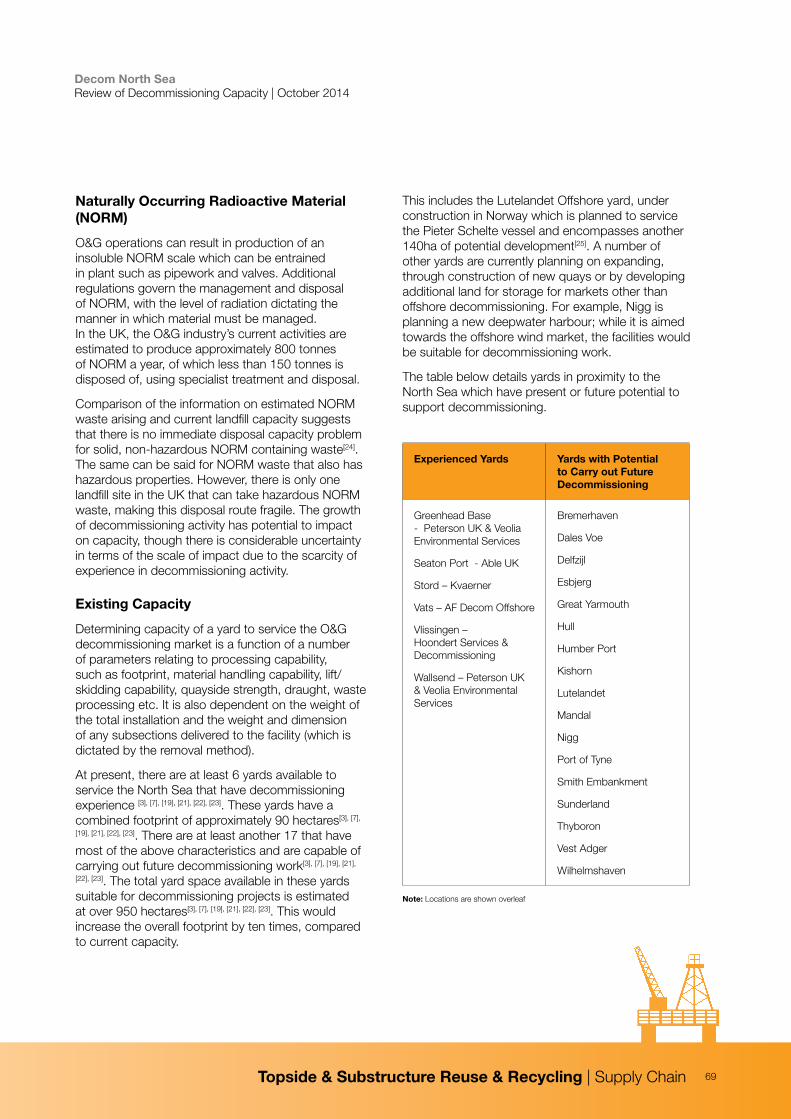
69
Decom North Sea Review of Decommissioning Capacity | October 2014
69
Naturally Occurring Radioactive Material (NORM)
O&G operations can result in production of an insoluble NORM scale which can be entrained in plant such as pipework and valves. Additional regulations govern the management and disposal of NORM, with the level of radiation dictating the manner in which material must be managed. In the UK, the O&G industry’s current activities are estimated to produce approximately 800 tonnes of NORM a year, of which less than 150 tonnes is disposed of, using specialist treatment and disposal.
Comparison of the information on estimated NORM waste arising and current landfill capacity suggests that there is no immediate disposal capacity problem for solid, non-hazardous NORM containing waste[24]. The same can be said for NORM waste that also has hazardous properties. However, there is only one landfill site in the UK that can take hazardous NORM waste, making this disposal route fragile. The growth of decommissioning activity has potential to impact on capacity, though there is considerable uncertainty in terms of the scale of impact due to the scarcity of experience in decommissioning activity.
Existing Capacity
Determining capacity of a yard to service the O&G decommissioning market is a function of a number of parameters relating to processing capability, such as footprint, material handling capability, lift/skidding capability, quayside strength, draught, waste processing etc. It is also dependent on the weight of the total installation and the weight and dimension of any subsections delivered to the facility (which is dictated by the removal method).
At present, there are at least 6 yards available to service the North Sea that have decommissioning experience [3], [7], [19], [21], [22], [23]. These yards have a combined footprint of approximately 90 hectares[3], [7],
[19], [21], [22], [23]. There are at least another 17 that have most of the above characteristics and are capable of carrying out future decommissioning work[3], [7], [19], [21],
[22], [23]. The total yard space available in these yards suitable for decommissioning projects is estimated at over 950 hectares[3], [7], [19], [21], [22], [23]. This would increase the overall footprint by ten times, compared to current capacity.
This includes the Lutelandet Offshore yard, under construction in Norway which is planned to service the Pieter Schelte vessel and encompasses another 140ha of potential development[25]. A number of other yards are currently planning on expanding, through construction of new quays or by developing additional land for storage for markets other than offshore decommissioning. For example, Nigg is planning a new deepwater harbour; while it is aimed towards the offshore wind market, the facilities would be suitable for decommissioning work.
The table below details yards in proximity to the North Sea which have present or future potential to support decommissioning.
Experienced Yards Yards with Potential to Carry out Future Decommissioning
Greenhead Base - Peterson UK & Veolia Environmental Services
Seaton Port - Able UK
Stord – Kvaerner
Vats – AF Decom Offshore
Vlissingen – Hoondert Services & Decommissioning
Wallsend – Peterson UK & Veolia Environmental Services
Bremerhaven
Dales Voe
Delfzijl
Esbjerg
Great Yarmouth
Hull
Humber Port
Kishorn
Lutelandet
Mandal
Nigg
Port of Tyne
Smith Embankment
Sunderland
Thyboron
Vest Adger
Wilhelmshaven
Topside & Substructure Reuse & Recycling | Supply Chain
Note: Locations are shown overleaf
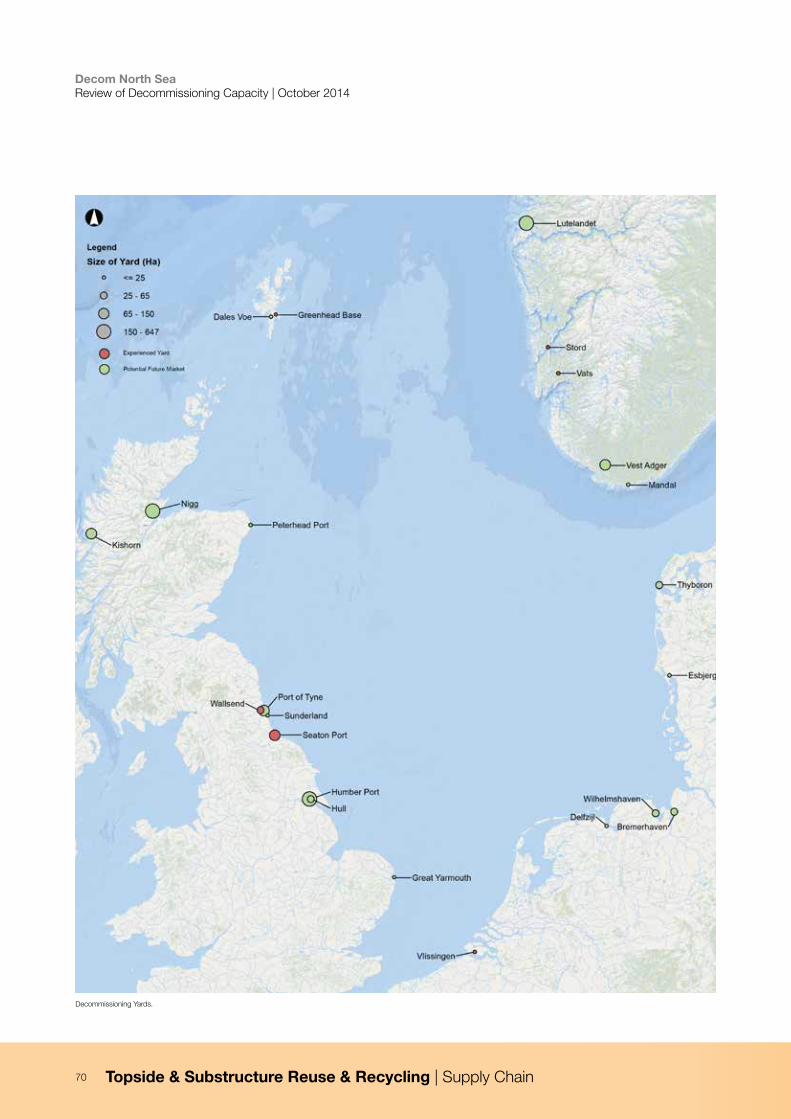
70
Decom North Sea Review of Decommissioning Capacity | October 2014
70
Decommissioning Yards.
Topside & Substructure Reuse & Recycling | Supply Chain
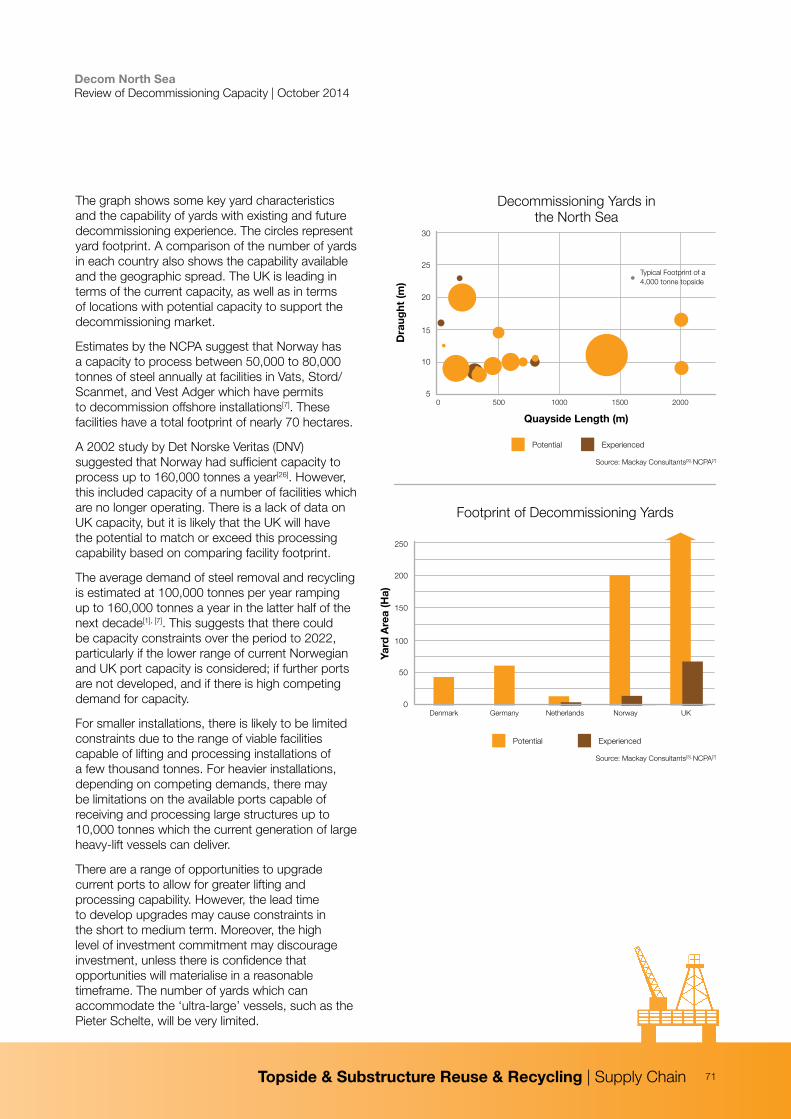
71
Decom North Sea Review of Decommissioning Capacity | October 2014
71
The graph shows some key yard characteristics and the capability of yards with existing and future decommissioning experience. The circles represent yard footprint. A comparison of the number of yards in each country also shows the capability available and the geographic spread. The UK is leading in terms of the current capacity, as well as in terms of locations with potential capacity to support the decommissioning market.
Estimates by the NCPA suggest that Norway has a capacity to process between 50,000 to 80,000 tonnes of steel annually at facilities in Vats, Stord/Scanmet, and Vest Adger which have permits to decommission offshore installations[7]. These facilities have a total footprint of nearly 70 hectares.
A 2002 study by Det Norske Veritas (DNV) suggested that Norway had sufficient capacity to process up to 160,000 tonnes a year[26]. However, this included capacity of a number of facilities which are no longer operating. There is a lack of data on UK capacity, but it is likely that the UK will have the potential to match or exceed this processing capability based on comparing facility footprint.
The average demand of steel removal and recycling is estimated at 100,000 tonnes per year ramping up to 160,000 tonnes a year in the latter half of the next decade[1], [7]. This suggests that there could be capacity constraints over the period to 2022, particularly if the lower range of current Norwegian and UK port capacity is considered; if further ports are not developed, and if there is high competing demand for capacity.
For smaller installations, there is likely to be limited constraints due to the range of viable facilities capable of lifting and processing installations of a few thousand tonnes. For heavier installations, depending on competing demands, there may be limitations on the available ports capable of receiving and processing large structures up to 10,000 tonnes which the current generation of large heavy-lift vessels can deliver.
There are a range of opportunities to upgrade current ports to allow for greater lifting and processing capability. However, the lead time to develop upgrades may cause constraints in the short to medium term. Moreover, the high level of investment commitment may discourage investment, unless there is confidence that opportunities will materialise in a reasonable timeframe. The number of yards which can accommodate the ‘ultra-large’ vessels, such as the Pieter Schelte, will be very limited.
Decommissioning Yards in the North Sea
Dra
ught
(m)
25
20
15
10
5
Quayside Length (m)
0 500 1000 1500 2000
30
Typical Footprint of a 4,000 tonne topside
Potential Experienced
Footprint of Decommissioning Yards
Potential Experienced
Yard
Are
a (H
a)
200
150
100
50
0Denmark Germany Netherlands Norway UK
250
Source: Mackay Consultants[3], NCPA[7]
Source: Mackay Consultants[3], NCPA[7]
Topside & Substructure Reuse & Recycling | Supply Chain
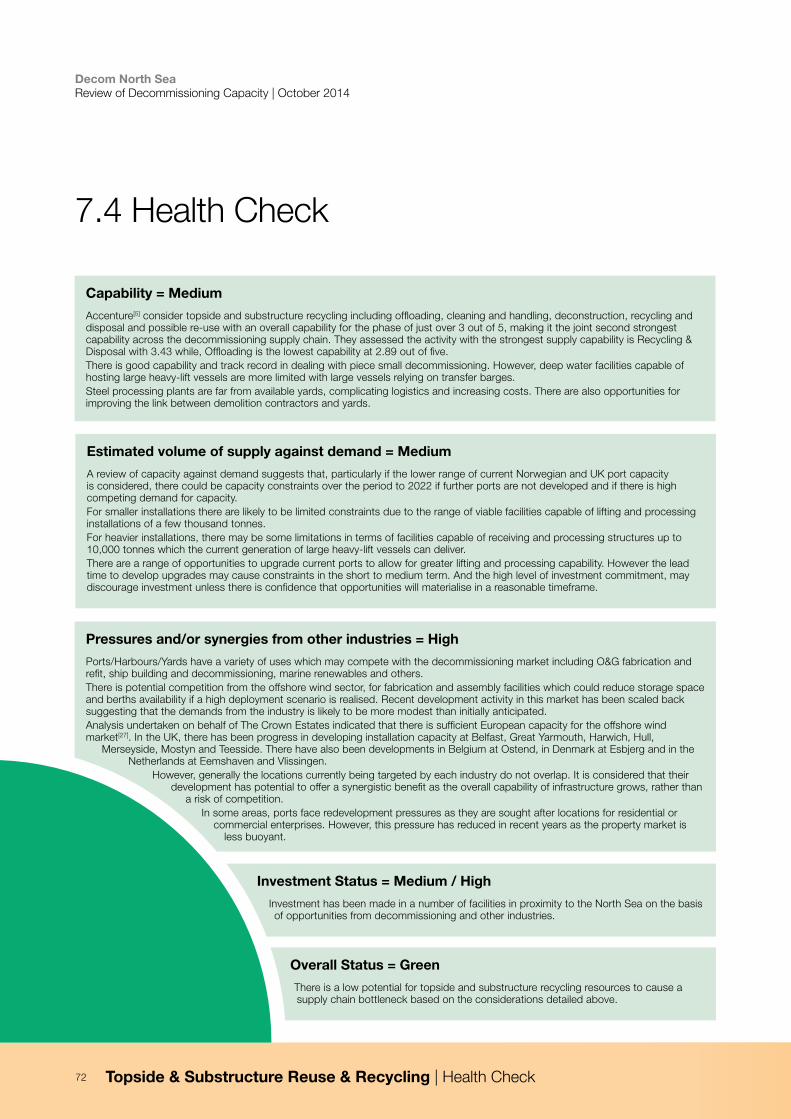
72
Decom North Sea Review of Decommissioning Capacity | October 2014
72
Overall Status = Green
There is a low potential for topside and substructure recycling resources to cause a supply chain bottleneck based on the considerations detailed above.
Investment Status = Medium / High
Investment has been made in a number of facilities in proximity to the North Sea on the basis of opportunities from decommissioning and other industries.
Capability = Medium
Accenture[5] consider topside and substructure recycling including offloading, cleaning and handling, deconstruction, recycling and disposal and possible re-use with an overall capability for the phase of just over 3 out of 5, making it the joint second strongest capability across the decommissioning supply chain. They assessed the activity with the strongest supply capability is Recycling & Disposal with 3.43 while, Offloading is the lowest capability at 2.89 out of five.There is good capability and track record in dealing with piece small decommissioning. However, deep water facilities capable of hosting large heavy-lift vessels are more limited with large vessels relying on transfer barges. Steel processing plants are far from available yards, complicating logistics and increasing costs. There are also opportunities for improving the link between demolition contractors and yards.
Estimated volume of supply against demand = Medium
A review of capacity against demand suggests that, particularly if the lower range of current Norwegian and UK port capacity is considered, there could be capacity constraints over the period to 2022 if further ports are not developed and if there is high competing demand for capacity.For smaller installations there are likely to be limited constraints due to the range of viable facilities capable of lifting and processing installations of a few thousand tonnes. For heavier installations, there may be some limitations in terms of facilities capable of receiving and processing structures up to 10,000 tonnes which the current generation of large heavy-lift vessels can deliver. There are a range of opportunities to upgrade current ports to allow for greater lifting and processing capability. However the lead time to develop upgrades may cause constraints in the short to medium term. And the high level of investment commitment, may discourage investment unless there is confidence that opportunities will materialise in a reasonable timeframe.
Pressures and/or synergies from other industries = High
Ports/Harbours/Yards have a variety of uses which may compete with the decommissioning market including O&G fabrication and refit, ship building and decommissioning, marine renewables and others. There is potential competition from the offshore wind sector, for fabrication and assembly facilities which could reduce storage space and berths availability if a high deployment scenario is realised. Recent development activity in this market has been scaled back suggesting that the demands from the industry is likely to be more modest than initially anticipated. Analysis undertaken on behalf of The Crown Estates indicated that there is sufficient European capacity for the offshore wind market[27]. In the UK, there has been progress in developing installation capacity at Belfast, Great Yarmouth, Harwich, Hull,
Merseyside, Mostyn and Teesside. There have also been developments in Belgium at Ostend, in Denmark at Esbjerg and in the Netherlands at Eemshaven and Vlissingen.
However, generally the locations currently being targeted by each industry do not overlap. It is considered that their development has potential to offer a synergistic benefit as the overall capability of infrastructure grows, rather than
a risk of competition. In some areas, ports face redevelopment pressures as they are sought after locations for residential or
commercial enterprises. However, this pressure has reduced in recent years as the property market is less buoyant.
7.4 Health Check
Topside & Substructure Reuse & Recycling | Health Check
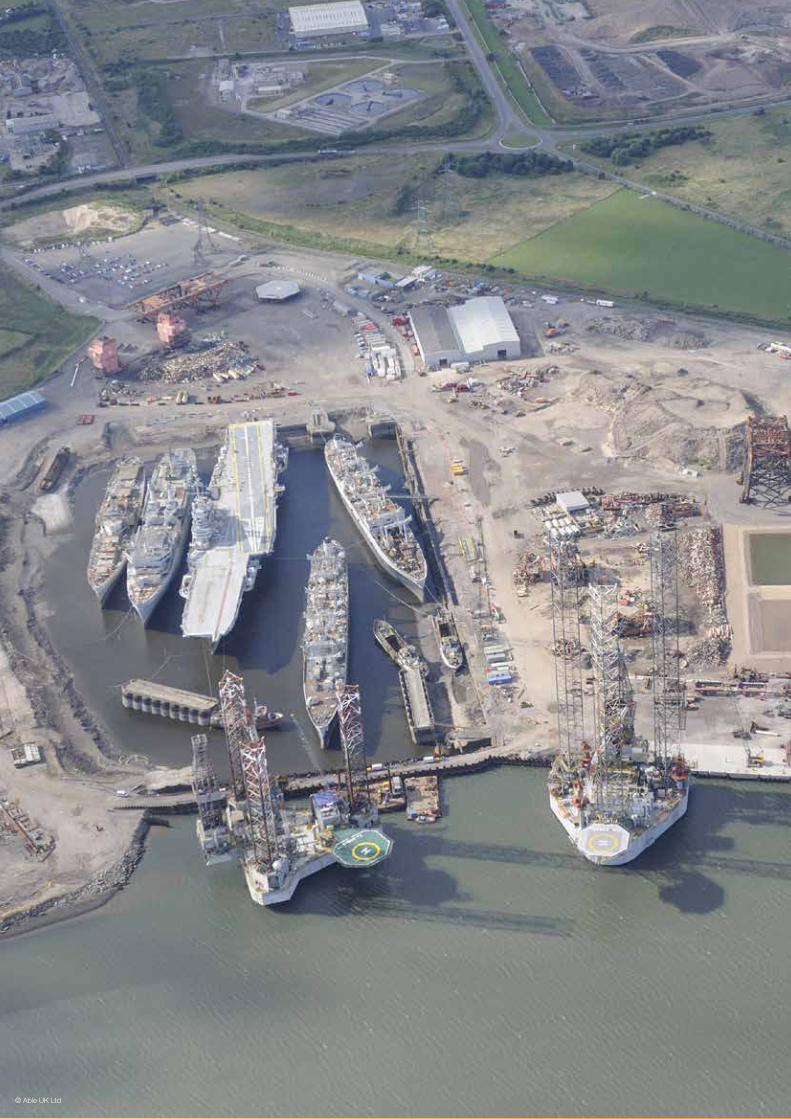
73
Decom North Sea Review of Decommissioning Capacity | October 2014
73
© Able UK Ltd

Decom North Sea Review of Decommissioning Capacity | October 2014
74
© Arup

Decom North Sea Review of Decommissioning Capacity | October 2014
75
8.0 People
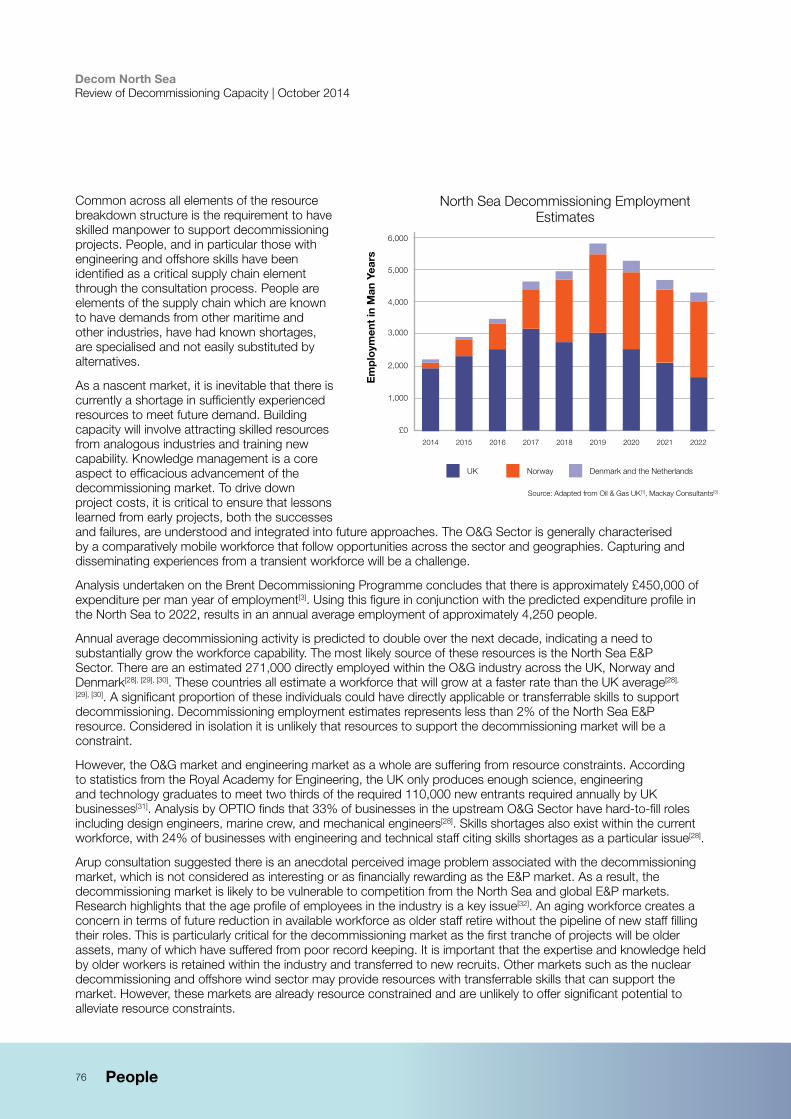
76
Decom North Sea Review of Decommissioning Capacity | October 2014
Common across all elements of the resource breakdown structure is the requirement to have skilled manpower to support decommissioning projects. People, and in particular those with engineering and offshore skills have been identified as a critical supply chain element through the consultation process. People are elements of the supply chain which are known to have demands from other maritime and other industries, have had known shortages, are specialised and not easily substituted by alternatives.
As a nascent market, it is inevitable that there is currently a shortage in sufficiently experienced resources to meet future demand. Building capacity will involve attracting skilled resources from analogous industries and training new capability. Knowledge management is a core aspect to efficacious advancement of the decommissioning market. To drive down project costs, it is critical to ensure that lessons learned from early projects, both the successes and failures, are understood and integrated into future approaches. The O&G Sector is generally characterised by a comparatively mobile workforce that follow opportunities across the sector and geographies. Capturing and disseminating experiences from a transient workforce will be a challenge.
Analysis undertaken on the Brent Decommissioning Programme concludes that there is approximately £450,000 of expenditure per man year of employment[3]. Using this figure in conjunction with the predicted expenditure profile in the North Sea to 2022, results in an annual average employment of approximately 4,250 people.
Annual average decommissioning activity is predicted to double over the next decade, indicating a need to substantially grow the workforce capability. The most likely source of these resources is the North Sea E&P Sector. There are an estimated 271,000 directly employed within the O&G industry across the UK, Norway and Denmark[28], [29], [30]. These countries all estimate a workforce that will grow at a faster rate than the UK average[28],
[29], [30]. A significant proportion of these individuals could have directly applicable or transferrable skills to support decommissioning. Decommissioning employment estimates represents less than 2% of the North Sea E&P resource. Considered in isolation it is unlikely that resources to support the decommissioning market will be a constraint.
However, the O&G market and engineering market as a whole are suffering from resource constraints. According to statistics from the Royal Academy for Engineering, the UK only produces enough science, engineering and technology graduates to meet two thirds of the required 110,000 new entrants required annually by UK businesses[31]. Analysis by OPTIO finds that 33% of businesses in the upstream O&G Sector have hard-to-fill roles including design engineers, marine crew, and mechanical engineers[28]. Skills shortages also exist within the current workforce, with 24% of businesses with engineering and technical staff citing skills shortages as a particular issue[28].
Arup consultation suggested there is an anecdotal perceived image problem associated with the decommissioning market, which is not considered as interesting or as financially rewarding as the E&P market. As a result, the decommissioning market is likely to be vulnerable to competition from the North Sea and global E&P markets. Research highlights that the age profile of employees in the industry is a key issue[32]. An aging workforce creates a concern in terms of future reduction in available workforce as older staff retire without the pipeline of new staff filling their roles. This is particularly critical for the decommissioning market as the first tranche of projects will be older assets, many of which have suffered from poor record keeping. It is important that the expertise and knowledge held by older workers is retained within the industry and transferred to new recruits. Other markets such as the nuclear decommissioning and offshore wind sector may provide resources with transferrable skills that can support the market. However, these markets are already resource constrained and are unlikely to offer significant potential to alleviate resource constraints.
20222014 2015 2016 2017 2018 2019 2020 2021
North Sea Decommissioning Employment Estimates
Em
plo
ymen
t in
Man
Yea
rs
3,000
2,000
1,000
£0
UK Norway Denmark and the Netherlands
4,000
5,000
6,000
Source: Adapted from Oil & Gas UK[1], Mackay Consultants[3]
People
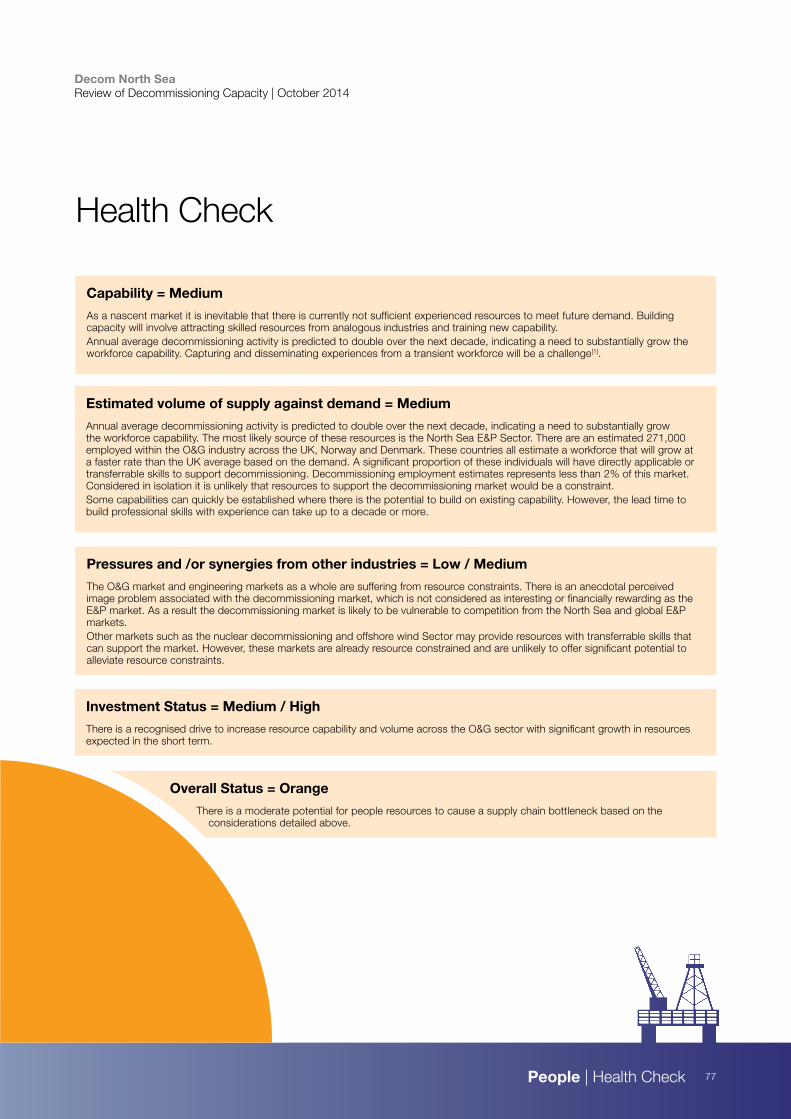
77
Decom North Sea Review of Decommissioning Capacity | October 2014
Overall Status = Orange
There is a moderate potential for people resources to cause a supply chain bottleneck based on the considerations detailed above.
Investment Status = Medium / High
There is a recognised drive to increase resource capability and volume across the O&G sector with significant growth in resources expected in the short term.
Capability = Medium
As a nascent market it is inevitable that there is currently not sufficient experienced resources to meet future demand. Building capacity will involve attracting skilled resources from analogous industries and training new capability. Annual average decommissioning activity is predicted to double over the next decade, indicating a need to substantially grow the workforce capability. Capturing and disseminating experiences from a transient workforce will be a challenge[1].
Estimated volume of supply against demand = Medium
Annual average decommissioning activity is predicted to double over the next decade, indicating a need to substantially grow the workforce capability. The most likely source of these resources is the North Sea E&P Sector. There are an estimated 271,000 employed within the O&G industry across the UK, Norway and Denmark. These countries all estimate a workforce that will grow at a faster rate than the UK average based on the demand. A significant proportion of these individuals will have directly applicable or transferrable skills to support decommissioning. Decommissioning employment estimates represents less than 2% of this market. Considered in isolation it is unlikely that resources to support the decommissioning market would be a constraint. Some capabilities can quickly be established where there is the potential to build on existing capability. However, the lead time to build professional skills with experience can take up to a decade or more.
Pressures and /or synergies from other industries = Low / Medium
The O&G market and engineering markets as a whole are suffering from resource constraints. There is an anecdotal perceived image problem associated with the decommissioning market, which is not considered as interesting or financially rewarding as the E&P market. As a result the decommissioning market is likely to be vulnerable to competition from the North Sea and global E&P markets. Other markets such as the nuclear decommissioning and offshore wind Sector may provide resources with transferrable skills that can support the market. However, these markets are already resource constrained and are unlikely to offer significant potential to alleviate resource constraints.
Health Check
People | Health Check
Decom North Sea Review of Decommissioning Capacity | October 2014
78
© Jan Berghuis
Decom North Sea Review of Decommissioning Capacity | October 2014
79
9.0 Context and Considerations
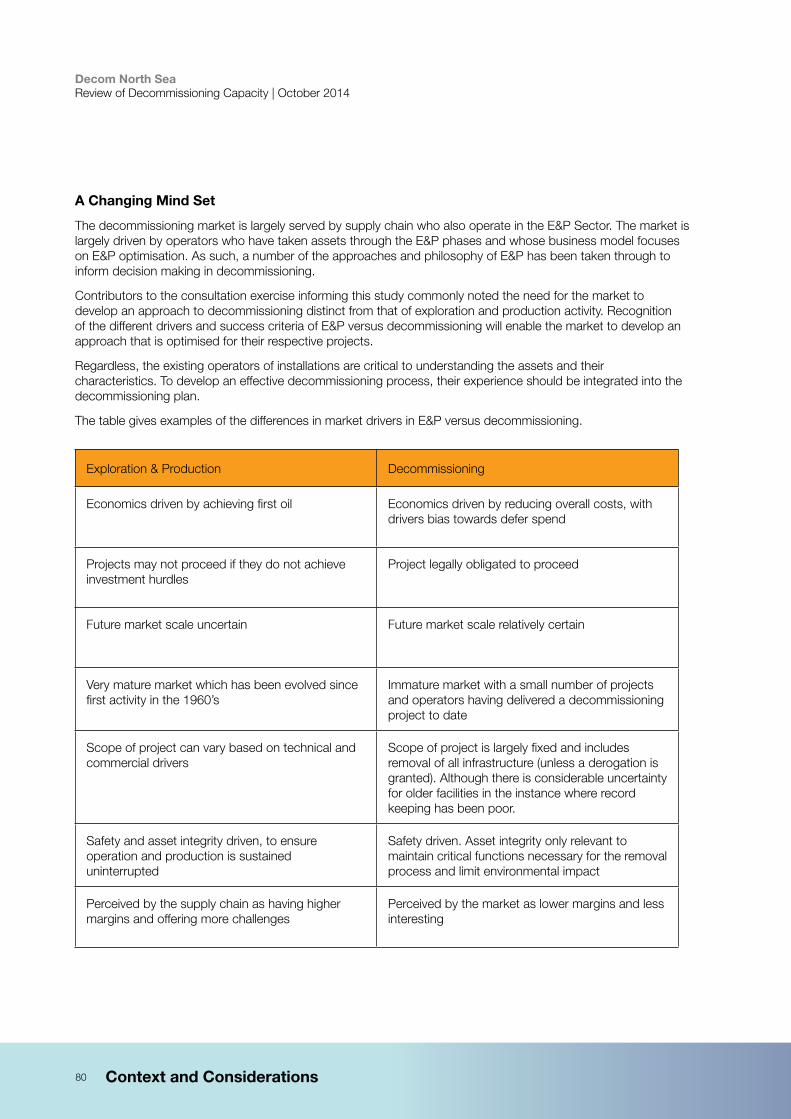
80
Decom North Sea Review of Decommissioning Capacity | October 2014
A Changing Mind Set
The decommissioning market is largely served by supply chain who also operate in the E&P Sector. The market is largely driven by operators who have taken assets through the E&P phases and whose business model focuses on E&P optimisation. As such, a number of the approaches and philosophy of E&P has been taken through to inform decision making in decommissioning.
Contributors to the consultation exercise informing this study commonly noted the need for the market to develop an approach to decommissioning distinct from that of exploration and production activity. Recognition of the different drivers and success criteria of E&P versus decommissioning will enable the market to develop an approach that is optimised for their respective projects.
Regardless, the existing operators of installations are critical to understanding the assets and their characteristics. To develop an effective decommissioning process, their experience should be integrated into the decommissioning plan.
The table gives examples of the differences in market drivers in E&P versus decommissioning.
Exploration & Production Decommissioning
Economics driven by achieving first oil Economics driven by reducing overall costs, with drivers bias towards defer spend
Projects may not proceed if they do not achieve investment hurdles
Project legally obligated to proceed
Future market scale uncertain Future market scale relatively certain
Very mature market which has been evolved since first activity in the 1960’s
Immature market with a small number of projects and operators having delivered a decommissioning project to date
Scope of project can vary based on technical and commercial drivers
Scope of project is largely fixed and includes removal of all infrastructure (unless a derogation is granted). Although there is considerable uncertainty for older facilities in the instance where record keeping has been poor.
Safety and asset integrity driven, to ensure operation and production is sustained uninterrupted
Safety driven. Asset integrity only relevant to maintain critical functions necessary for the removal process and limit environmental impact
Perceived by the supply chain as having higher margins and offering more challenges
Perceived by the market as lower margins and less interesting
Context and Considerations
81
Decom North Sea Review of Decommissioning Capacity | October 2014
Smoothing the Peaks
Creating accurate estimates of decommissioning expenditure across the North Sea is challenging. Estimates have been produced by a range of organisations which show a broad range in variation on a year by year basis and over the next decade. There is inherent uncertainty in terms of the costs of decommissioning and timing of activities which drive these variations.
Estimates of expenditure from all sources show large variations year on year. However there are inherent limitations in decommissioning estimates, which are built from a bottom-up analysis of individual operators independently declaring their expected decommissioning schedule. The rapid development of North Sea infrastructure means that a number of assets will come to the end of their life in similar timescales. This trend would suggest that there will also be peaks in the decommissioning activity, which is reflected in many of the forecasts.
However, the market is inherently different to that of E&P activities. In E&P programme delays directly impact the timing of subsequent revenue flows and so programme drivers are highly significant in procurement decisions. For decommissioning, programme delays defer capital expenditure and often have a less significant detrimental impact on project economics than in E&P projects.
As a result, operators are likely to have significantly more flexibility to manage procurement and programme decisions for decommissioning activities than in E&P. Consequently, the market is unlikely to procure services in the peaks suggested by the predicted estimates as the cost to procure resources would increase i.e. the market will smooth out the peaks.
Contracting and Procurement Strategy
Rigidity in contracting and procurement structures developed to support the E&P market can inhibit operators and the supply chain from adapting to meet the demands of the decommissioning market.
Current procurement procedures generally consider value, approach and experience. This creates a bias towards the limited parts of the supply chain that have existing experience. Adapting existing procurement strategy to reduce requirements for previous experience which will allow new entrants to the market who may introduce innovative methods. This could allow learning from other markets, such as the nuclear or salvage industries to be integrated.
There are a range of contracting strategies pursued by operators which are generally an evolution of E&P activities. Innovative contracting strategies may allow contractors and operators to reduce costs through better allocation of risk and pain-gain mechanisms to better aligning objectives. Examples could include well P&A contracts being extended to cover a programme of wells which could be more efficient than contracting wells as individual projects. Provision of a more flexible window during which operations can be undertaken could allow more efficient programming of resources.
There are also opportunities for the supply chain to collaborate more effectively to develop more comprehensive offerings which respond to contracting strategies.
Context and Considerations
82
Decom North Sea Review of Decommissioning Capacity | October 2014
Driving Innovation, Driving Down Costs and Regulation
Innovation can play a role in delivering decommissioning in a more cost effective manner. The nascent market has limited experience focusing on decommissioning activities and is at a stage where it can incorporate lessons learnt along with developing new approaches to reduce costs. The uncertainty in the timescales of the market opportunity may limit commitment to drive and invest in innovation. The supply chain cites the ‘stop/start’ nature of the industry as a barrier to investment. Investment in the Pieter Schelte is a significant exception, however, opportunities from other markets provided investment confidence to Allseas.
An example of this is the development of a tested rigless approach for well P&A, which could significantly reduce costs. Currently there are limitations in the number of North Sea operators that have accepted a rigless solution due to concerns associated with using novel untested technology. Also, well P&A contractors are not publically committing to develop and test equipment due to the lack of certainty over timing of decommissioning programmes. In the Gulf of Mexico regulatory intervention through the ‘Idle Iron policy’ gave greater certainty in the pipeline of activity which provided the appropriate climate for the supply chain to invest in development of new tools[33].
In the UK the overhaul of the regulatory system offers opportunities for intervention that will motivate the market to reduce costs. Alternative approaches to encouraging the supply chain are increased collaboration between operators in terms of identifying clusters of projects which offer a more attractive contracting opportunity.
Context and Considerations

83
Decom North Sea Review of Decommissioning Capacity | October 2014

Decom North Sea Review of Decommissioning Capacity | October 2014
84
Decom North Sea Review of Decommissioning Capacity | October 2014
85
Appendix A: References
86
Decom North Sea Review of Decommissioning Capacity | October 2014
Sources of Information
The following sources of information were integrated into this analysis:
1. Oil and Gas UK (2013), Decommissioning Insight 2013, Available via; http://www.oilandgasuk.co.uk/cmsfiles/modules/publications/pdfs/OP082.pdf (Accessed 25th September 2014)
2. Prof. Kemp, A. (2014), Prospective Decommissioning Activity and Infrastructure Availability in the UKCS (updated figures), University of Aberdeen. Not publically available
3. Mackay Consultants (2013), Draft Report for Decom North Sea, Not publically available
4. OSPAR (2013), Inventory of Offshore Installations, Available via; http://www.ospar.org/content/content.asp?menu=01511400000000_000000_000000 (Accessed 25th September 2014)
5. Scottish Enterprise, Decom North Sea & Accenture (2013), Decommissioning in the UKCS, Available via; http://www.scottish-enterprise.com/~/media/SE_2013/Knowledge%20Hub/Publication/Decommission%20ing%20UKCS%20study.PDF (Accessed 25th September 2014)
6. Oil & Gas UK (2014), Activity Survey, Available via http://www.oilandgasuk.co.uk/cmsfiles/modules/publications/pdfs/EC040.pdf (Accessed 25th September 2014)
7. Norwegian Climate and Pollution Agency (NCPA) (2010), Decommissioning of Offshore Installations, Available via; http://www.npd.no/Global/Engelsk/3%20-%20Publications/Reports/endelig%20avvikling%20rapport%20engelsk.pdf (Accessed 25th September 2014)
8. Norwegian Oil & Gas Association (NOGA) (2013), Activity Still High – In a Still Uncertain World, Available via; http://www.norskoljeoggass.no/Global/2013%20Dokumenter/Publikasjoner/NOROG%20konjunktur_2013_ENG%20(08).pdf (Accessed 25th September 2014)
9. Oil & Gas UK (2009), North Sea Well Abandonment Study, Not publically available
10. Department of Energy and Climate Change (DECC) (2014), Wells Data Search Tool, Available via; https://itportal.decc.gov.uk/pls/wons/wdep0100.qryWell (Accessed 25th September 2014)
11. Norwegian Petroleum Directorate (NPD) (2014), FactPages – Wellbore (Exploration and Development), Available via; http://factpages.npd.no/factpages/ (Accessed 25th September 2014)
12. Danish Energy Agency (2014), Wells 1935 – 2013, available via; http://www.ens.dk/en/oil-gas/oil-gas-related-data/wells (Accessed 25th September 2014)
13. NL Oil & Gas portal (2014), Boreholes Data, Available via; http://www.nlog.nl/en/pubs/maps/other_maps/other_maps.html (Accessed 25th September 2014)
14. NPD (2014), FactPages - Facility (Fixed), Available via; http://factpages.npd.no/factpages/default.aspx?culture=en (Accessed 26th September 2014)
15. Danish Energy Agency (DEA) (2013), Oil & Gas Production in Denmark and Suboil Use 2013, Available via; http://www.ens.dk/sites/ens.dk/files/dokumenter/publikationer/downloads/danmarks_olie-_og_gasproduktion_2013_uk.pdf (Accessed 25th September 2014)
16. DECC (2014), Pathfinder, Available via; https://www.og.decc.gov.uk/pathfinder/decommissioningindex.html (Accessed 25th September 2014)
17. Rigzone (2014), Worldwide Offshore Rig Utilization, Accessed via; https://www.rigzone.com/data, (Accessed 12th September 2014)
18. Rigzone (2014), Offshore Rig Utilization by Rig Type, Accessed via; https://www.rigzone.com/data/utilization_rigtype.asp, (Accessed 12th September 2014)
19. 4coffshore (2014), Vessel database, Available via; http://www.4coffshore.com/windfarms/vessels.aspx, (Accessed 26th August 2014)
20. DecomWorld News (2014), Available via; http://social.decomworld.com/structures-and-maintenance/shell%E2%80%99s-brent-platform-disposal-and-recycling-contract-goes-able-uk (Accessed 25th September 2014)
Appendix A: References
87
Decom North Sea Review of Decommissioning Capacity | October 2014
21. Infield (2012) Decommissioning: The North Sea in Context, Available via; http://www.oilandgasuk.co.uk/downloadabledocs/1309/5 (Accessed 26th September 2014)
22. Ports.com (2014), North Sea Ports, Available via; http://ports.com/sea/north-sea/ (Accessed 26th September 2014)
23. Achilles Database (2014), Scandinavia Metal- Information Register, Available via; http://www.scanmet.no/files/Achillesdocument.pdf (Accessed 26th September 2014)
24. DECC (2014), Strategy for the Management of NORM Waste in the UK, Available via; https://www.gov.uk/government/uploads/system/uploads/attachment_data/file/335821/Final_strategy_NORM.pdf (Accessed 25th September 2014)
25. Lutelandet Offhore (2014), Decommissioning, Available via; http://llof.no/Facilities/PlatformDecommisioning/tabid/2284/Default.aspx (Accessed 25th September 2014)
26. Det Norske Veritas (DNV) (2002). Decommissioning of offshore installations. Assessment of capacity at Norwegian yards in the period 2001–2020, Report NO.01-4063
27. BVG Associates (2013) Offshore Wind: A 2013 Supply Chain Health Check, Available via, http://www.bvgassociates.co.uk/Portals/0/publications/BVGA%20TCE%20Offshore%20Wind%20SC%20Health%20Check%201311.pdf (Accessed 25th September 2014)
28. OPITO (2014), Upstream Oil & Gas Industry Labour Market Intelligence Summary Findings, Available via; http://online.fliphtml5.com/jgfa/czqp/ (Accessed 25th September 2014)
29. Oil Gas Denmark (2013), Denmark – An Oil Nation, Available via; http://issuu.com/firstpurple/docs/ogd2013_uk-enkeltsidet (Accessed 26th September 2014)
30. NPD (2014), FACTS 2014, Available via; http://www.regjeringen.no/upload/OED/pdf%20filer/Faktaheftet/Fakta2014OG/Facts_2014_nett.pdf (Accessed 25th September 2014)
31. Campaign for Science and Engineering (2014), How to Meet Demand for Engineering Skills, Accessed via; http://sciencecampaign.org.uk/?p=13510 (Accessed 26th September 2014)
32. OPITO (2011), Labour Market Intelligence Survey, Available via; http://www.opito.com/media/downloads/labour-market-intelligence-2011-report.pdf (Accessed 25th September 2014)
33. Bureau of Safety and Environmental Enforcement (BSEE) (2014), Idle Iron Policy, Available via; http://www.bsee.gov/Exploration-and-Production/Decomissioning/Idle-Iron/ (Accessed 26th September 2014)
Appendix A: References

Decom North Sea Review of Decommissioning Capacity | October 2014
88

Decom North Sea Review of Decommissioning Capacity | October 2014
89
Appendix B: Criteria Scoring
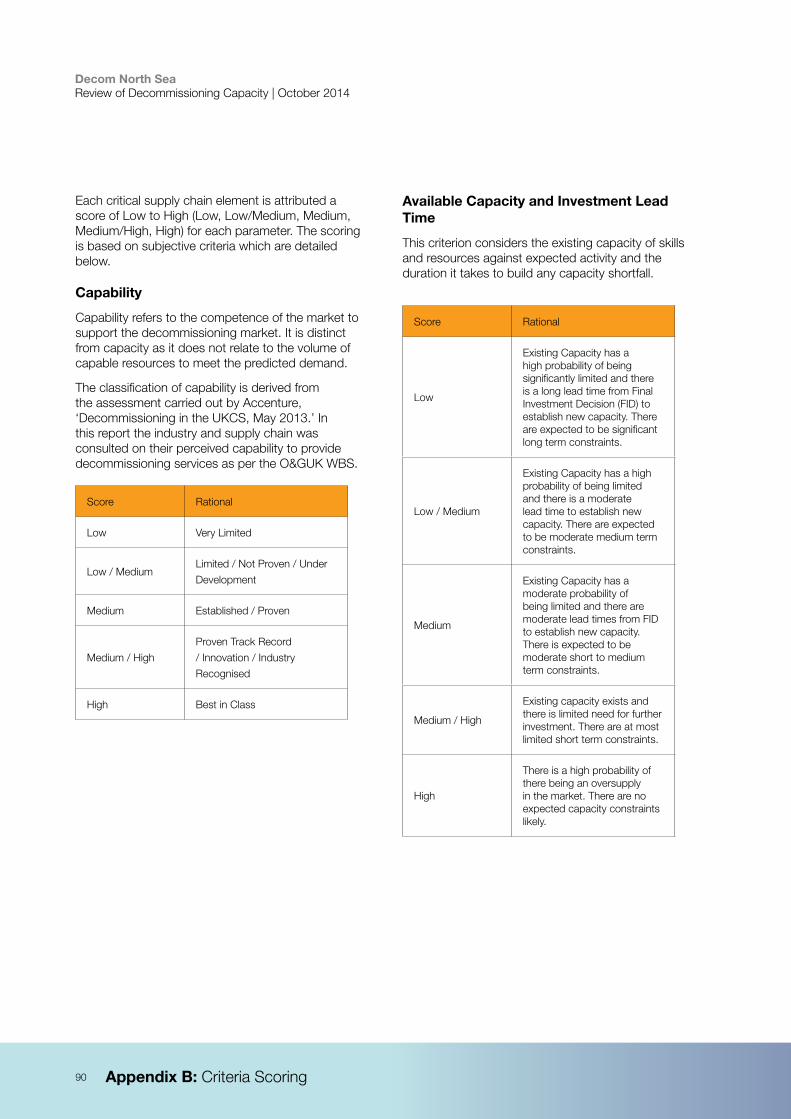
90
Decom North Sea Review of Decommissioning Capacity | October 2014
Each critical supply chain element is attributed a score of Low to High (Low, Low/Medium, Medium, Medium/High, High) for each parameter. The scoring is based on subjective criteria which are detailed below.
Capability
Capability refers to the competence of the market to support the decommissioning market. It is distinct from capacity as it does not relate to the volume of capable resources to meet the predicted demand.
The classification of capability is derived from the assessment carried out by Accenture, ‘Decommissioning in the UKCS, May 2013.’ In this report the industry and supply chain was consulted on their perceived capability to provide decommissioning services as per the O&GUK WBS.
Score Rational
Low Very Limited
Low / MediumLimited / Not Proven / Under
Development
Medium Established / Proven
Medium / High
Proven Track Record
/ Innovation / Industry
Recognised
High Best in Class
Available Capacity and Investment Lead Time
This criterion considers the existing capacity of skills and resources against expected activity and the duration it takes to build any capacity shortfall.
Score Rational
Low
Existing Capacity has a high probability of being significantly limited and there is a long lead time from Final Investment Decision (FID) to establish new capacity. There are expected to be significant long term constraints.
Low / Medium
Existing Capacity has a high probability of being limited and there is a moderate lead time to establish new capacity. There are expected to be moderate medium term constraints.
Medium
Existing Capacity has a moderate probability of being limited and there are moderate lead times from FID to establish new capacity. There is expected to be moderate short to medium term constraints.
Medium / High
Existing capacity exists and there is limited need for further investment. There are at most limited short term constraints.
High
There is a high probability of there being an oversupply in the market. There are no expected capacity constraints likely.
Appendix B: Criteria Scoring
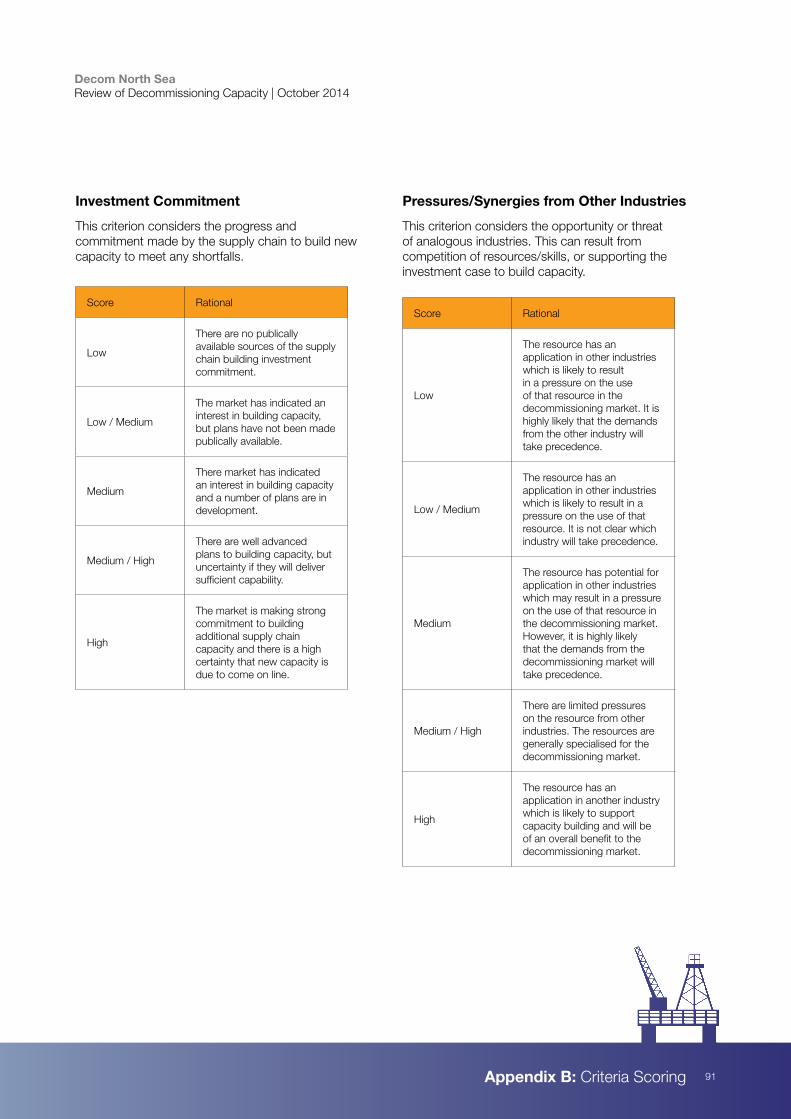
91
Decom North Sea Review of Decommissioning Capacity | October 2014
Investment Commitment
This criterion considers the progress and commitment made by the supply chain to build new capacity to meet any shortfalls.
Score Rational
Low
There are no publically available sources of the supply chain building investment commitment.
Low / Medium
The market has indicated an interest in building capacity, but plans have not been made publically available.
Medium
There market has indicated an interest in building capacity and a number of plans are in development.
Medium / High
There are well advanced plans to building capacity, but uncertainty if they will deliver sufficient capability.
High
The market is making strong commitment to building additional supply chain capacity and there is a high certainty that new capacity is due to come on line.
Pressures/Synergies from Other Industries
This criterion considers the opportunity or threat of analogous industries. This can result from competition of resources/skills, or supporting the investment case to build capacity.
Score Rational
Low
The resource has an application in other industries which is likely to result in a pressure on the use of that resource in the decommissioning market. It is highly likely that the demands from the other industry will take precedence.
Low / Medium
The resource has an application in other industries which is likely to result in a pressure on the use of that resource. It is not clear which industry will take precedence.
Medium
The resource has potential for application in other industries which may result in a pressure on the use of that resource in the decommissioning market. However, it is highly likely that the demands from the decommissioning market will take precedence.
Medium / High
There are limited pressures on the resource from other industries. The resources are generally specialised for the decommissioning market.
High
The resource has an application in another industry which is likely to support capacity building and will be of an overall benefit to the decommissioning market.
Appendix B: Criteria Scoring

Decom North Sea Review of Decommissioning Capacity | October 2014
92

Decom North Sea Review of Decommissioning Capacity | October 2014
93
Appendix C: Resources
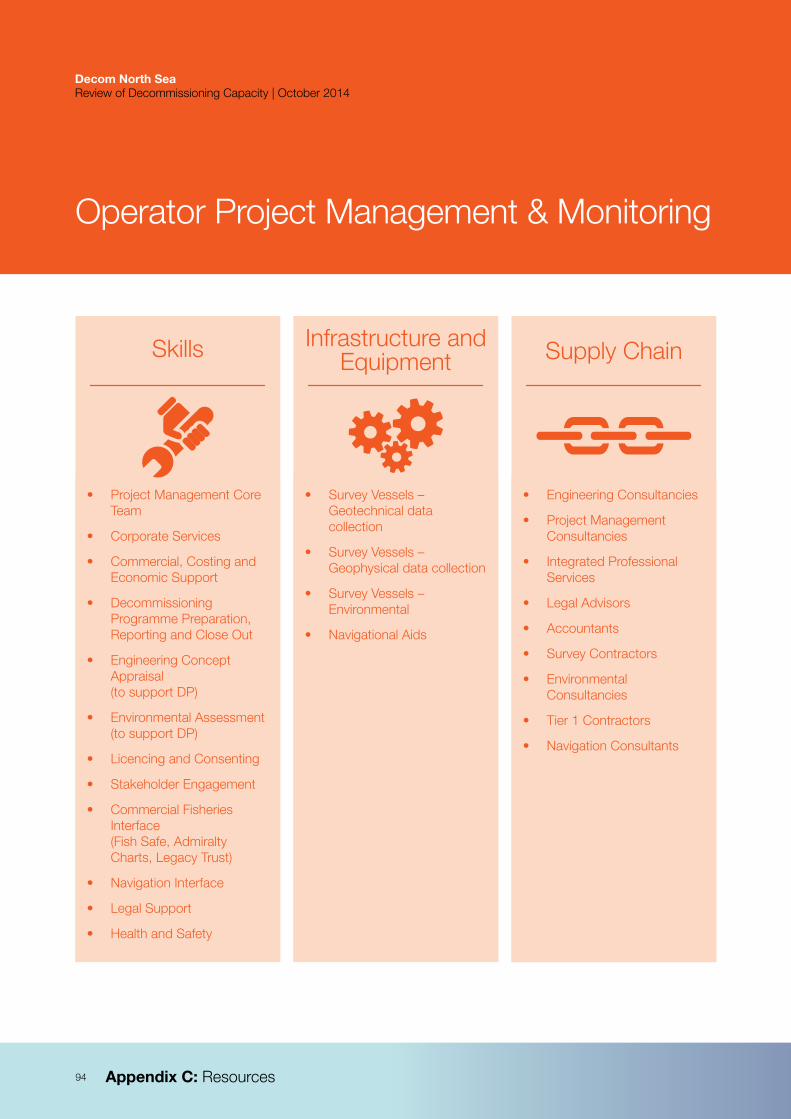
94
Decom North Sea Review of Decommissioning Capacity | October 2014
Operator Project Management & Monitoring
Skills Supply ChainInfrastructure and Equipment
• Project Management Core Team
• Corporate Services
• Commercial, Costing and Economic Support
• Decommissioning Programme Preparation, Reporting and Close Out
• Engineering Concept Appraisal (to support DP)
• Environmental Assessment (to support DP)
• Licencing and Consenting
• Stakeholder Engagement
• Commercial Fisheries Interface (Fish Safe, Admiralty Charts, Legacy Trust)
• Navigation Interface
• Legal Support
• Health and Safety
• Survey Vessels – Geotechnical data collection
• Survey Vessels – Geophysical data collection
• Survey Vessels – Environmental
• Navigational Aids
• Engineering Consultancies
• Project Management Consultancies
• Integrated Professional Services
• Legal Advisors
• Accountants
• Survey Contractors
• Environmental Consultancies
• Tier 1 Contractors
• Navigation Consultants
Decom North Sea Review of Decommissioning Capacity | October 2014
Appendix C: Resources
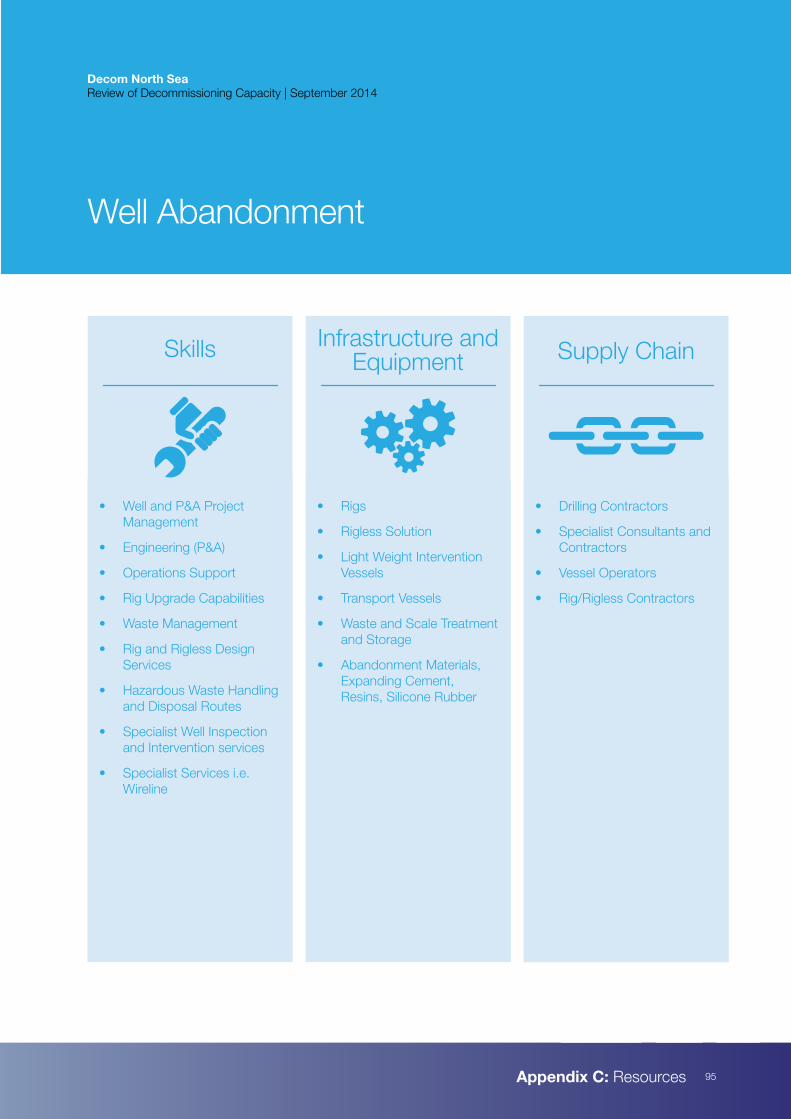
95
Decom North Sea Review of Decommissioning Capacity | October 2014
Appendix C: Resources
Skills Supply ChainInfrastructure and Equipment
• Well and P&A Project Management
• Engineering (P&A)
• Operations Support
• Rig Upgrade Capabilities
• Waste Management
• Rig and Rigless Design Services
• Hazardous Waste Handling and Disposal Routes
• Specialist Well Inspection and Intervention services
• Specialist Services i.e. Wireline
• Rigs
• Rigless Solution
• Light Weight Intervention Vessels
• Transport Vessels
• Waste and Scale Treatment and Storage
• Abandonment Materials, Expanding Cement, Resins, Silicone Rubber
• Drilling Contractors
• Specialist Consultants and Contractors
• Vessel Operators
• Rig/Rigless Contractors
Well Abandonment
Decom North Sea Review of Decommissioning Capacity | September 2014
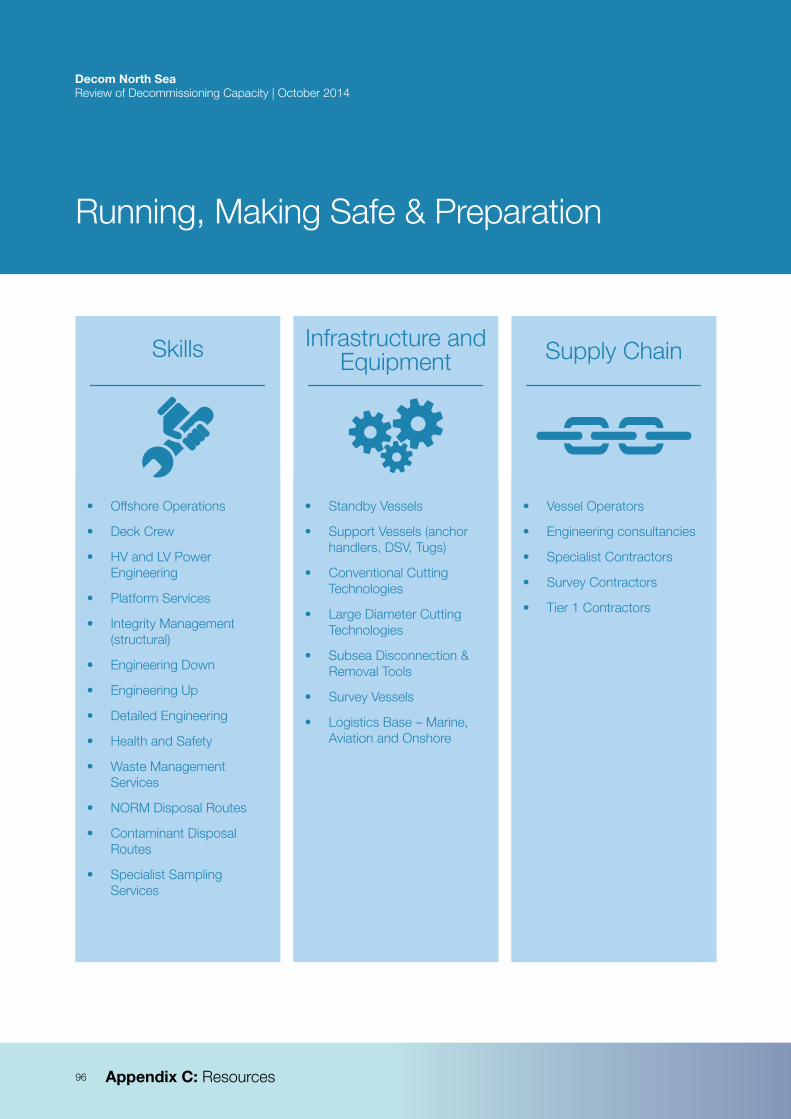
96
Decom North Sea Review of Decommissioning Capacity | October 2014
Skills Supply ChainInfrastructure and Equipment
• Offshore Operations
• Deck Crew
• HV and LV Power Engineering
• Platform Services
• Integrity Management (structural)
• Engineering Down
• Engineering Up
• Detailed Engineering
• Health and Safety
• Waste Management Services
• NORM Disposal Routes
• Contaminant Disposal Routes
• Specialist Sampling Services
• Standby Vessels
• Support Vessels (anchor handlers, DSV, Tugs)
• Conventional Cutting Technologies
• Large Diameter Cutting Technologies
• Subsea Disconnection & Removal Tools
• Survey Vessels
• Logistics Base – Marine, Aviation and Onshore
• Vessel Operators
• Engineering consultancies
• Specialist Contractors
• Survey Contractors
• Tier 1 Contractors
Running, Making Safe & Preparation
Decom North Sea Review of Decommissioning Capacity | October 2014
Appendix C: Resources
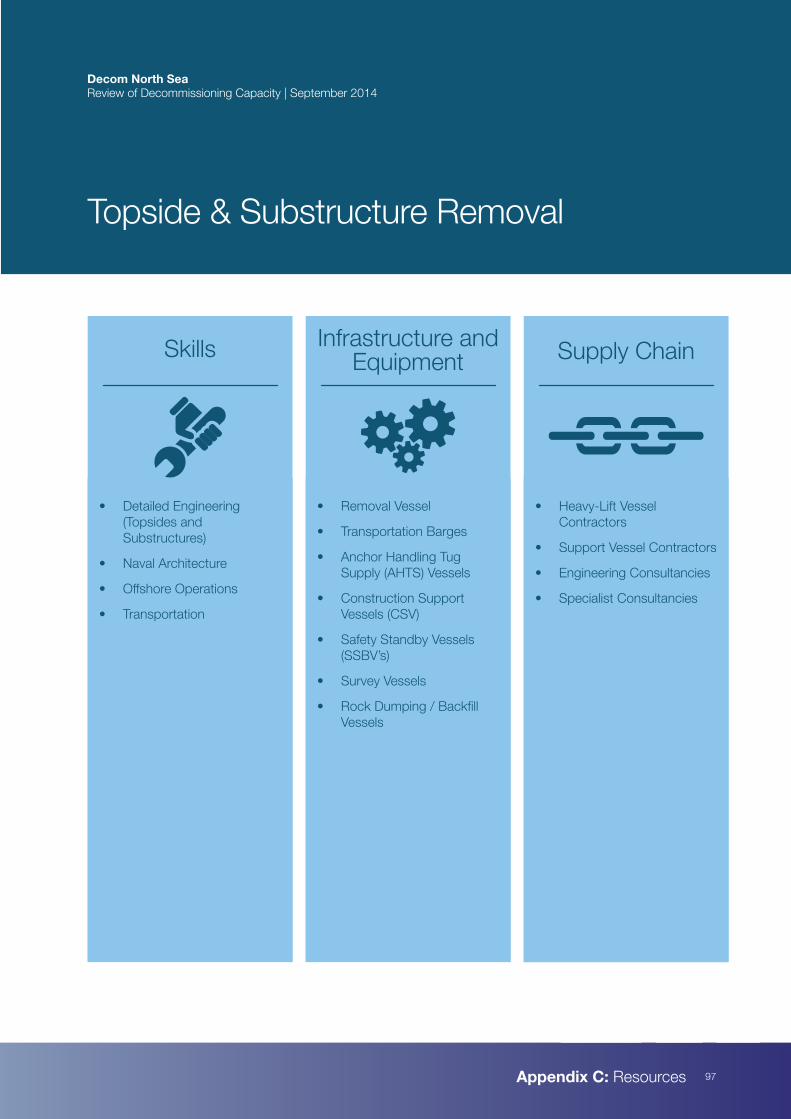
97
Decom North Sea Review of Decommissioning Capacity | October 2014
Appendix C: Resources
Skills Supply ChainInfrastructure and Equipment
• Detailed Engineering (Topsides and Substructures)
• Naval Architecture
• Offshore Operations
• Transportation
• Removal Vessel
• Transportation Barges
• Anchor Handling Tug Supply (AHTS) Vessels
• Construction Support Vessels (CSV)
• Safety Standby Vessels (SSBV’s)
• Survey Vessels
• Rock Dumping / Backfill Vessels
• Heavy-Lift Vessel Contractors
• Support Vessel Contractors
• Engineering Consultancies
• Specialist Consultancies
Topside & Substructure Removal
Decom North Sea Review of Decommissioning Capacity | September 2014
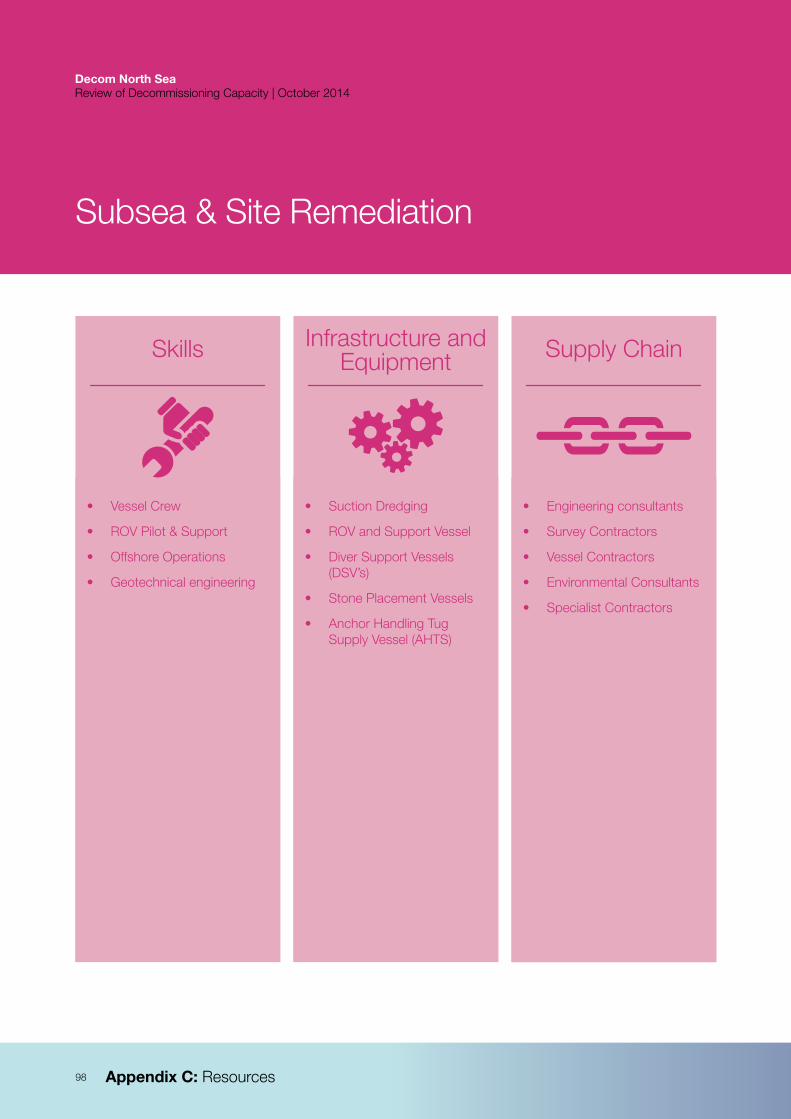
98
Decom North Sea Review of Decommissioning Capacity | October 2014
Skills Supply ChainInfrastructure and Equipment
• Vessel Crew
• ROV Pilot & Support
• Offshore Operations
• Geotechnical engineering
• Suction Dredging
• ROV and Support Vessel
• Diver Support Vessels (DSV’s)
• Stone Placement Vessels
• Anchor Handling Tug Supply Vessel (AHTS)
• Engineering consultants
• Survey Contractors
• Vessel Contractors
• Environmental Consultants
• Specialist Contractors
Subsea & Site Remediation
Decom North Sea Review of Decommissioning Capacity | October 2014
Appendix C: Resources
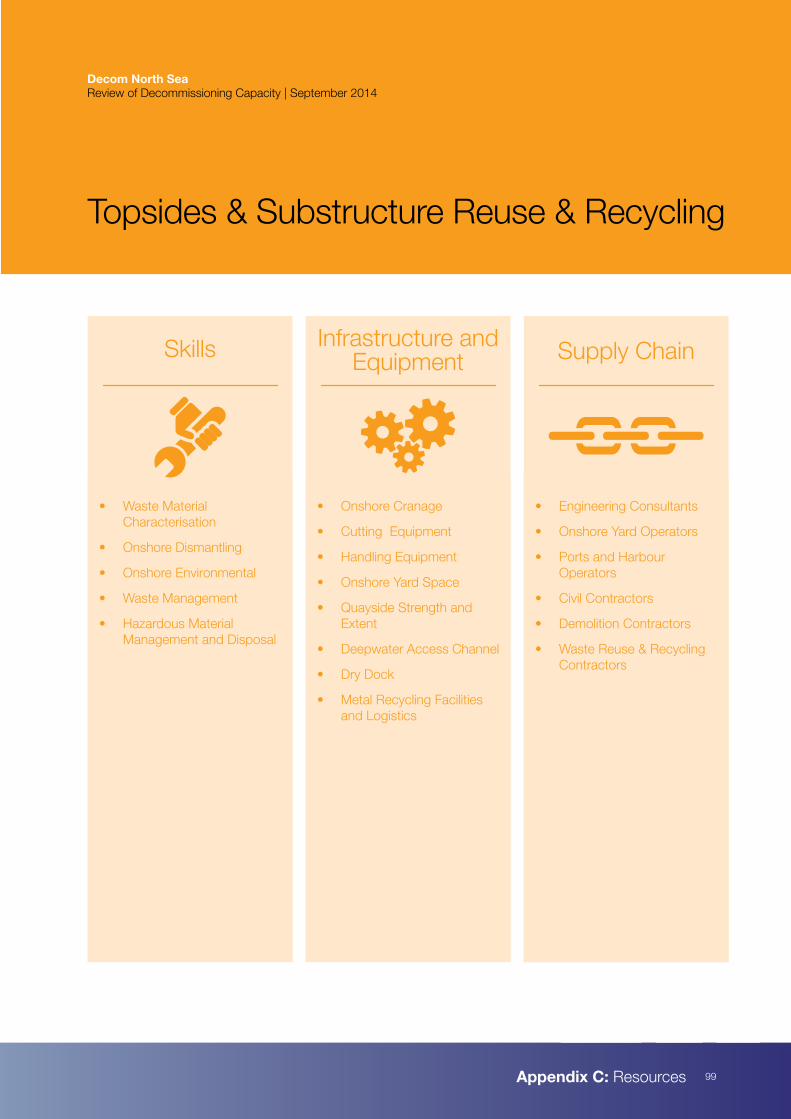
99
Decom North Sea Review of Decommissioning Capacity | October 2014
Appendix C: Resources
Skills Supply ChainInfrastructure and Equipment
• Waste Material Characterisation
• Onshore Dismantling
• Onshore Environmental
• Waste Management
• Hazardous Material Management and Disposal
• Onshore Cranage
• Cutting Equipment
• Handling Equipment
• Onshore Yard Space
• Quayside Strength and Extent
• Deepwater Access Channel
• Dry Dock
• Metal Recycling Facilities and Logistics
• Engineering Consultants
• Onshore Yard Operators
• Ports and Harbour Operators
• Civil Contractors
• Demolition Contractors
• Waste Reuse & Recycling Contractors
Topsides & Substructure Reuse & Recycling
Decom North Sea Review of Decommissioning Capacity | September 2014
Clare Lavelle
ArupScotstoun House South Queensferry Edinburgh EH30 9SE
t +44 (0) 131 331 1999 e [email protected]
Nigel Jenkins
Decom North Sea 33 Albyn Place Aberdeen AB10 1YL
t +44 (0) 1224 452170 e [email protected]
Scottish Enterprise
Atrium Court 50 Waterloo Street Glasgow G2 6HQ
t +44 (0) 845 607 8787 e [email protected]
For further information on this report please contact:
www.scottish-enterprise.comwww.decomnorthsea.comwww.arup.com
Cover Image: The Thialf, Heerema Crane Vessel © Jan Berghuis