Embed Size (px)
Citation preview
Behavioral/Cognitive
Decoding Working Memory of Stimulus Contrast in EarlyVisual Cortex
Yue Xing, Tim Ledgeway, Paul V. McGraw, and Denis SchluppeckSchool of Psychology, University of Nottingham, Nottingham NG7 2RD, United Kingdom
Most studies of the early stages of visual analysis (V1-V3) have focused on the properties of neurons that support processing of elementalfeatures of a visual stimulus or scene, such as local contrast, orientation, or direction of motion. Recent evidence from electrophysiologyand neuroimaging studies, however, suggests that early visual cortex may also play a role in retaining stimulus representations inmemory for short periods. For example, fMRI responses obtained during the delay period between two presentations of an oriented visualstimulus can be used to decode the remembered stimulus orientation with multivariate pattern analysis. Here, we investigated whetherorientation is a special case or if this phenomenon generalizes to working memory traces of other visual features. We found thatmultivariate classification of fMRI signals from human visual cortex could be used to decode the contrast of a perceived stimulus evenwhen the mean response changes were accounted for, suggesting some consistent spatial signal for contrast in these areas. Strikingly, wefound that fMRI responses also supported decoding of contrast when the stimulus had to be remembered. Furthermore, classificationgeneralized from perceived to remembered stimuli and vice versa, implying that the corresponding pattern of responses in early visualcortex were highly consistent. In additional analyses, we show that stimulus decoding here is driven by biases depending on stimuluseccentricity. This places important constraints on the interpretation for decoding stimulus properties for which cortical processing isknown to vary with eccentricity, such as contrast, color, spatial frequency, and temporal frequency.
IntroductionSeveral lines of research suggest that the human brain has a spe-cific cognitive system for holding information to be manipulatedand executed: working memory. Visual short-term memory(VSTM) is a specific subtype that allows the robust maintenanceof stimulus attributes such as contrast, orientation, spatial fre-quency, and speed with high fidelity (Luck and Vogel, 1997; Pas-ternak and Greenlee, 2005). Functional brain imaging hasenabled the exploration of the anatomical and functional corre-lates underlying VSTM first discovered by neurophysiologicaltechniques (Fuster, 1995; Braver et al., 1997; Pessoa et al., 2002;Curtis and D’Esposito, 2003). Although studies largely agree onthe involvement of higher-level cortical areas in this cognitiveprocess (Postle and D’Esposito, 1999; Haxby et al., 2000), there isstill some controversy about the role of early visual cortex inworking memory. Recent fMRI evidence suggests that early sen-sory areas may be involved in retaining stimulus representations,for example, of orientation (Pessoa et al., 2002; Serences et al.,
2009) and spatial frequency (Greenlee et al., 2000; Baumann etal., 2008; Sneve et al., 2011). However, the sustained responses inearly visual cortex may be related to visual attention rather thanVSTM (Offen et al., 2009, 2010; Pooresmaeili et al., 2010). Har-rison and Tong (2009) used multivariate pattern analysis(MVPA) to search for potential signatures of working memoryfor orientation in the pattern of fMRI responses in early visualareas. They found that remembered orientation could be de-coded and that the same neural circuitry that mediates early vi-sual processing (and perception) of orientation is also recruitedduring the working memory period.
The aim of our experiments was to determine whether a dif-ferent stimulus property—the contrast of a stimulus— could bedecoded using multivariate classification and if its representationwas similar when subjects perceived and remembered stimuli.Most neurons in visual cortex show tight tuning for a preferredorientation and are distributed in discrete orientation columns.However, it is not known whether there is an orderly map orclustered spatial representation for contrast (Albrecht and Ham-ilton, 1982; Boynton et al., 1999; Heeger et al., 2000; Kastner et al.,2004). It is also unclear whether multivariate analyses can be usedto decode this stimulus parameter and if its cortical represen-tation is similar when subjects perceive and remember suchstimuli.
The first experiment in this study shows that the stimuluscontrast, as well as the orientation, of a perceived image can bedecoded from event-related BOLD signals in early visual cortex.The second experiment demonstrates that the contrast of a re-membered grating (during periods when no stimulus is dis-played) can be also decoded from the BOLD responses in visual
Received Aug. 3, 2012; revised April 11, 2013; accepted May 6, 2013.Author contributions: Y.X., T.L., P.V.M., and D.S. designed research; Y.X., T.L., P.V.M., and D.S. performed re-
search; Y.X. and D.S. analyzed data; Y.X., T.L., P.V.M., and D.S. wrote the paper.The work was supported by the Wing Yip Charitable Trust, the Fund for Women graduates, and a Chinese Student
Award from The Great Britain-China Educational Trust. Y.X. was supported by a studentship from the School ofPsychology and the International Office of The University of Nottingham. We thank the members of the VisualNeuroscience Group for helpful discussions on the experiments and three referees for their insightful comments andsuggestions.
This article is freely available online through the J Neurosci Author Open Choice option.Correspondence should be addressed to Denis Schluppeck, School of Psychology, University of Nottingham,
Nottingham NG7 2RD, United Kingdom. E-mail: [email protected]:10.1523/JNEUROSCI.3754-12.2013
Copyright © 2013 the authors 0270-6474/13/3310301-11$15.00/0
The Journal of Neuroscience, June 19, 2013 • 33(25):10301–10311 • 10301
cortex. We further show that classifiers generalize between thetwo experiments and that classification accuracies were signifi-cantly higher for behaviorally correct than incorrect trials, indi-cating that signals from early visual cortex contributesignificantly to VSTM of stimulus contrast. Our results also sug-gest that responses from incorrect trials add substantial noise tothe contrast VSTM signals used in decoding.
Materials and MethodsSubjects. Six observers (n � 5 male, n � 1 female) who were experiencedin psychophysics and fMRI experiments and had normal or corrected-to-normal vision took part in this study. All gave written consent. Theprocedures were approved by the Medical School Research Ethics Com-mittee at the University of Nottingham.
Functional MRI acquisition. Each subject participated in at least twoscanning sessions. In session one, a set of 10 –12 functional scans wasobtained to measure the retinotopic organization in early visual cortex,allowing us to functionally define V1, V2, and V3 with standard methods;in the same session, we also acquired high-resolution anatomical T1-weighted MPRAGE images of the whole brain for segmentation andcortical flattening. In the second (and later) sessions, we obtained fMRIdata to perform decoding in the working memory and stimulus contrastparadigms.
MR imaging was performed at 3 T (Achieva; Philips Healthcare) usingan eight-channel SENSE head coil. Foam padding was used to minimizehead movements. During each session, we acquired several functionalscans, including a scan for localizing regions of early visual cortex repre-senting the stimuli and six to eight scans for the main tasks, alternatingbetween scans in which we measured responses to perceived stimuli andscans using the working memory task. For BOLD fMRI, we used a stan-dard T2* (gradient-echo) echo planar imaging pulse sequence (voxel size3 � 3 � 3 mm 3, TE � 35 ms, TR � 1500 ms, flip angle � 75°, FOV �192 � 192 mm 2). Thirty-two slices were oriented approximately perpen-dicularly to the calcarine sulcus. We used parallel imaging with anacceleration (SENSE) factor 2.
Registration, cortical segmentation, and flattening. For flat mapping andvisualization, we segmented T1-weighted anatomical images into graymatter, white matter, and CSF. Inflated and flattened parts of each hemi-sphere corresponding to early visual cortex were obtained using a com-bination of tools (FreeSurfer, Martinos Center for Biomedical Imaging,Massachusetts General Hospital, Harvard Medical School, Boston, MA;mrTools, Heeger lab, Department of Psychology and Center for Neuro-science, New York University, New York, NY; mrVISTA, Wandell lab,Department of Psychology, Stanford University, Stanford, CA) and pro-grams included in the FSL distribution (FMRIB Software Library; Smithet al., 2004).
To register data from each session to the subject-specific, high-resolution,T1-weighted image, a set of low-resolution anatomical images covering thesame volume as the functional images was acquired at either the beginning orthe end of each scanning session (MPRAGE, 1.5 mm inplane, 3 mm slicethickness). These anatomical images and the functional images were thenregistered to the high-resolution anatomical whole-head volume (T1-weighted, 3D MPRAGE, 1 mm isotropic, TE � 3.7 ms, TR � 8.13 ms, FA �8°, TI � 960 ms, and linear phase encoding order) using a robust imageregistration algorithm (Nestares and Heeger, 2000).
Visual stimuli. In all experiments, the stimuli were generated on an AppleMacBook Pro running MATLAB (MathWorks) and the MGL toolbox(http://gru.brain.riken.jp/doku.php/mgl/overview). In the fMRI experi-ments, stimuli on a homogenous gray background were projected from anLCD projector onto a display screen at the feet of our subjects. The displayresolution was 1024 � 768 pixels, covering 20.4° (width) � 15.4° (height) ofvisual angle. Subjects were in the supine position in the scanner bore andviewed the display through an angled mirror. They were asked to maintainfixation at a red cross at the center of the screen during functional MRI scansand performed a task in all scans to control attention (see below). All of thestimuli in the two experiments were moving sinusoidal gratings (spatial fre-quency, 0.75 cycles/°; temporal frequency, 2 Hz) presented in a circular ap-erture with a radius of 5°, centered at fixation.
Retinotopic mapping session. Early visual areas (V1, V2, and V3) foreach subject were identified in a retinotopic mapping session based onthe standard traveling-wave method using rotating wedges and expand-ing rings (Engel et al., 1994; DeYoe et al., 1996; Engel et al., 1997; forreview, see Wandell et al., 2007). The responses to the rings and wedgeswere used to estimate the eccentricity and polar angle of the visual fieldrepresentation, respectively. Following standard methods, areas V1, V2,and V3 were defined in our subjects using the phase reversals in the polarangle maps to locate the upper, lower, and horizontal meridianrepresentations.
Localizer scans. During each functional imaging session of the main exper-iment, we obtained two brief localizer scans (at the beginning and end ofeach session) to identify voxels within V1-V3 corresponding to the retino-topic stimulus locations. We used these to restrict the V1-V3 regions ofinterest (ROIs). Each localizer scan lasted 4 min (160 time points) and con-sisted of grating stimuli and gray background alternating in a simple blockdesign between 12 s “on” and 12 s “off” (fixation). During the on period, wepresented 8 1.5 s epochs of moving gratings each with a random direction ofmotion and at 1 of 5 contrast levels (Michelson contrasts of 10%, 30%, 50%,70%, and 90%). For gamma correction, we used a psychophysical motion-nulling procedure (Ledgeway and Smith, 1994; Ledgeway and Hess, 2002) tomake sure that contrast stimuli would be faithfully reproduced on the LCDprojector display at the MRI scanner and on a CRT display in the psycho-physics laboratory.
Experiment 1: contrast response measurements. To measure the re-sponses in early visual cortex to the stimuli, we presented moving grat-ings (orientation 45° or 135°; spatial frequency, 0.75 cycles/°; temporalfrequency, 2 Hz, same 5 contrast levels used in the localizer scan) in anevent-related design. Stimuli were presented in random order (precededby 1.5 s of fixation to equate for conditions in the working memoryscans). Each stimulus lasted 1.5 s and subjects were asked to respond asquickly as possible to their offset by pressing a button to maintain aconstant attentional state.
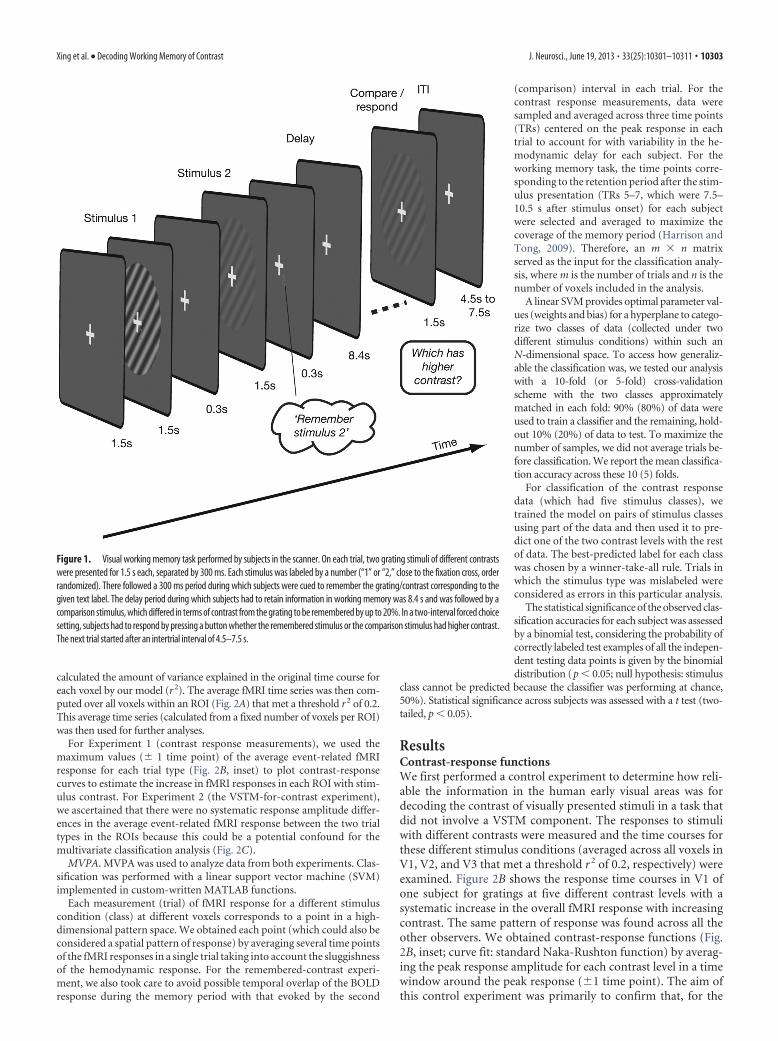
Experiment 2: working memory scans. Consistent with the experimentalparadigm used by Harrison and Tong (2009), we used an event-relateddesign in which each trial comprised visual stimuli presentation, a reten-tion period, and a test interval (Fig. 1). The same stimulus parameterswere used as before except that there were only two levels of contrast inthis experiment. During the stimulus presentation at the beginning ofeach trial, two gratings with different contrasts (30% and 70%) werepresented sequentially. Each grating presentation (in a circular apertureof radius 5° centered at fixation) was accompanied by a small text label(“1” or “2”) rendered in red and displayed with a small offset from thefixation cross; the assignment of the label to the higher or lower contrastgrating was randomized on each trial. The orientation of both gratings ineach trial was chosen to be either 45° or 135°, but remained constantthroughout the trial. After the presentation of the two sample stimuli, thenumeric cue indicated which of the two contrast stimuli the subjectsshould remember and retain in memory for the delay period (fixed,8.4 s). Finally, at the end of each trial, a matching grating (contrast � 20%of the to-be-remembered grating) was displayed and the subjects wereasked to indicate with a press of a button whether the remembered (sam-ple) or matching grating had the higher contrast.
fMRI response time courses. Imaging data were analyzed using a com-bination of custom-written software (mrTools, Heeger lab, Departmentof Psychology and Center for Neuroscience, New York University, NewYork, NY; mrVISTA, Department of Psychology, Stanford University,Stanford, CA) running in MATLAB 7.4. fMRI data were motion cor-rected using a robust motion correction algorithm (Nestares and Heeger,2000), high-pass filtered (cutoff, 0.01 Hz) to remove slow signal drift, andconverted to percent signal change.
Standard event-related analysis methods (Burock et al., 1998; Dale, 1999;Burock and Dale, 2000) were used to reconstruct the time course of fMRIresponse for each trial type at each voxel with no predefined assumption ofthe hemodynamic response function. Details of the methodology have beenreported in detail previously (Gardner et al., 2005; Brouwer and Heeger,2009; Sanchez-Panchuelo et al., 2010). Briefly, we estimated—voxelwise—the best-fitting (least-squares) event-related time course for each stimuluscondition. To estimate the goodness-of-fit of the linear model prediction, we
10302 • J. Neurosci., June 19, 2013 • 33(25):10301–10311 Xing et al. • Decoding Working Memory of Contrast
calculated the amount of variance explained in the original time course foreach voxel by our model (r2). The average fMRI time series was then com-puted over all voxels within an ROI (Fig. 2A) that met a threshold r2 of 0.2.This average time series (calculated from a fixed number of voxels per ROI)was then used for further analyses.
For Experiment 1 (contrast response measurements), we used themaximum values (� 1 time point) of the average event-related fMRIresponse for each trial type (Fig. 2B, inset) to plot contrast-responsecurves to estimate the increase in fMRI responses in each ROI with stim-ulus contrast. For Experiment 2 (the VSTM-for-contrast experiment),we ascertained that there were no systematic response amplitude differ-ences in the average event-related fMRI response between the two trialtypes in the ROIs because this could be a potential confound for themultivariate classification analysis (Fig. 2C).
MVPA. MVPA was used to analyze data from both experiments. Clas-sification was performed with a linear support vector machine (SVM)implemented in custom-written MATLAB functions.
Each measurement (trial) of fMRI response for a different stimuluscondition (class) at different voxels corresponds to a point in a high-dimensional pattern space. We obtained each point (which could also beconsidered a spatial pattern of response) by averaging several time pointsof the fMRI responses in a single trial taking into account the sluggishnessof the hemodynamic response. For the remembered-contrast experi-ment, we also took care to avoid possible temporal overlap of the BOLDresponse during the memory period with that evoked by the second
(comparison) interval in each trial. For thecontrast response measurements, data weresampled and averaged across three time points(TRs) centered on the peak response in eachtrial to account for with variability in the he-modynamic delay for each subject. For theworking memory task, the time points corre-sponding to the retention period after the stim-ulus presentation (TRs 5–7, which were 7.5–10.5 s after stimulus onset) for each subjectwere selected and averaged to maximize thecoverage of the memory period (Harrison andTong, 2009). Therefore, an m � n matrixserved as the input for the classification analy-sis, where m is the number of trials and n is thenumber of voxels included in the analysis.
A linear SVM provides optimal parameter val-ues (weights and bias) for a hyperplane to catego-rize two classes of data (collected under twodifferent stimulus conditions) within such anN-dimensional space. To access how generaliz-able the classification was, we tested our analysiswith a 10-fold (or 5-fold) cross-validationscheme with the two classes approximatelymatched in each fold: 90% (80%) of data wereused to train a classifier and the remaining, hold-out 10% (20%) of data to test. To maximize thenumber of samples, we did not average trials be-fore classification. We report the mean classifica-tion accuracy across these 10 (5) folds.
For classification of the contrast responsedata (which had five stimulus classes), wetrained the model on pairs of stimulus classesusing part of the data and then used it to pre-dict one of the two contrast levels with the restof data. The best-predicted label for each classwas chosen by a winner-take-all rule. Trials inwhich the stimulus type was mislabeled wereconsidered as errors in this particular analysis.
The statistical significance of the observed clas-sification accuracies for each subject was assessedby a binomial test, considering the probability ofcorrectly labeled test examples of all the indepen-dent testing data points is given by the binomialdistribution (p � 0.05; null hypothesis: stimulus
class cannot be predicted because the classifier was performing at chance,50%). Statistical significance across subjects was assessed with a t test (two-tailed, p � 0.05).
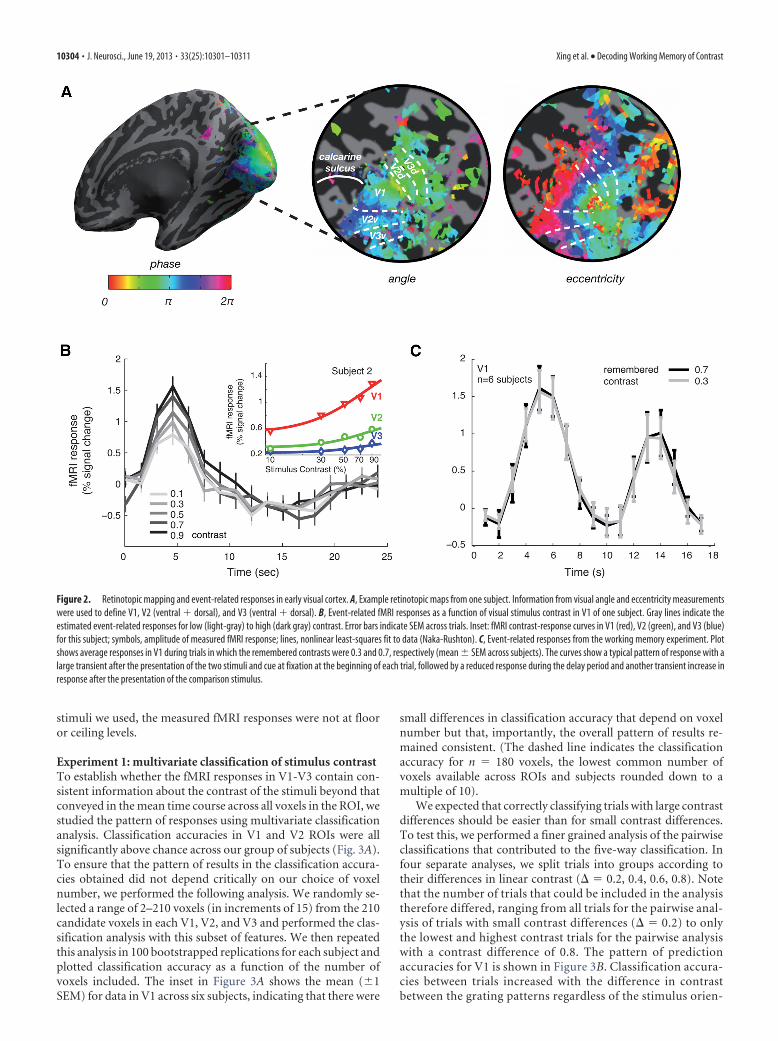
ResultsContrast-response functionsWe first performed a control experiment to determine how reli-able the information in the human early visual areas was fordecoding the contrast of visually presented stimuli in a task thatdid not involve a VSTM component. The responses to stimuliwith different contrasts were measured and the time courses forthese different stimulus conditions (averaged across all voxels inV1, V2, and V3 that met a threshold r 2 of 0.2, respectively) wereexamined. Figure 2B shows the response time courses in V1 ofone subject for gratings at five different contrast levels with asystematic increase in the overall fMRI response with increasingcontrast. The same pattern of response was found across all theother observers. We obtained contrast-response functions (Fig.2B, inset; curve fit: standard Naka-Rushton function) by averag-ing the peak response amplitude for each contrast level in a timewindow around the peak response (�1 time point). The aim ofthis control experiment was primarily to confirm that, for the
Figure 1. Visual working memory task performed by subjects in the scanner. On each trial, two grating stimuli of different contrastswere presented for 1.5 s each, separated by 300 ms. Each stimulus was labeled by a number (“1” or “2,” close to the fixation cross, orderrandomized). There followed a 300 ms period during which subjects were cued to remember the grating/contrast corresponding to thegiven text label. The delay period during which subjects had to retain information in working memory was 8.4 s and was followed by acomparison stimulus, which differed in terms of contrast from the grating to be remembered by up to 20%. In a two-interval forced choicesetting, subjects had to respond by pressing a button whether the remembered stimulus or the comparison stimulus had higher contrast.The next trial started after an intertrial interval of 4.5–7.5 s.
Xing et al. • Decoding Working Memory of Contrast J. Neurosci., June 19, 2013 • 33(25):10301–10311 • 10303
stimuli we used, the measured fMRI responses were not at flooror ceiling levels.
Experiment 1: multivariate classification of stimulus contrastTo establish whether the fMRI responses in V1-V3 contain con-sistent information about the contrast of the stimuli beyond thatconveyed in the mean time course across all voxels in the ROI, westudied the pattern of responses using multivariate classificationanalysis. Classification accuracies in V1 and V2 ROIs were allsignificantly above chance across our group of subjects (Fig. 3A).To ensure that the pattern of results in the classification accura-cies obtained did not depend critically on our choice of voxelnumber, we performed the following analysis. We randomly se-lected a range of 2–210 voxels (in increments of 15) from the 210candidate voxels in each V1, V2, and V3 and performed the clas-sification analysis with this subset of features. We then repeatedthis analysis in 100 bootstrapped replications for each subject andplotted classification accuracy as a function of the number ofvoxels included. The inset in Figure 3A shows the mean (�1SEM) for data in V1 across six subjects, indicating that there were
small differences in classification accuracy that depend on voxelnumber but that, importantly, the overall pattern of results re-mained consistent. (The dashed line indicates the classificationaccuracy for n � 180 voxels, the lowest common number ofvoxels available across ROIs and subjects rounded down to amultiple of 10).
We expected that correctly classifying trials with large contrastdifferences should be easier than for small contrast differences.To test this, we performed a finer grained analysis of the pairwiseclassifications that contributed to the five-way classification. Infour separate analyses, we split trials into groups according totheir differences in linear contrast (� � 0.2, 0.4, 0.6, 0.8). Notethat the number of trials that could be included in the analysistherefore differed, ranging from all trials for the pairwise anal-ysis of trials with small contrast differences (� � 0.2) to onlythe lowest and highest contrast trials for the pairwise analysiswith a contrast difference of 0.8. The pattern of predictionaccuracies for V1 is shown in Figure 3B. Classification accura-cies between trials increased with the difference in contrastbetween the grating patterns regardless of the stimulus orien-
Figure 2. Retinotopic mapping and event-related responses in early visual cortex. A, Example retinotopic maps from one subject. Information from visual angle and eccentricity measurementswere used to define V1, V2 (ventral � dorsal), and V3 (ventral � dorsal). B, Event-related fMRI responses as a function of visual stimulus contrast in V1 of one subject. Gray lines indicate theestimated event-related responses for low (light-gray) to high (dark gray) contrast. Error bars indicate SEM across trials. Inset: fMRI contrast-response curves in V1 (red), V2 (green), and V3 (blue)for this subject; symbols, amplitude of measured fMRI response; lines, nonlinear least-squares fit to data (Naka-Rushton). C, Event-related responses from the working memory experiment. Plotshows average responses in V1 during trials in which the remembered contrasts were 0.3 and 0.7, respectively (mean � SEM across subjects). The curves show a typical pattern of response with alarge transient after the presentation of the two stimuli and cue at fixation at the beginning of each trial, followed by a reduced response during the delay period and another transient increase inresponse after the presentation of the comparison stimulus.
10304 • J. Neurosci., June 19, 2013 • 33(25):10301–10311 Xing et al. • Decoding Working Memory of Contrast
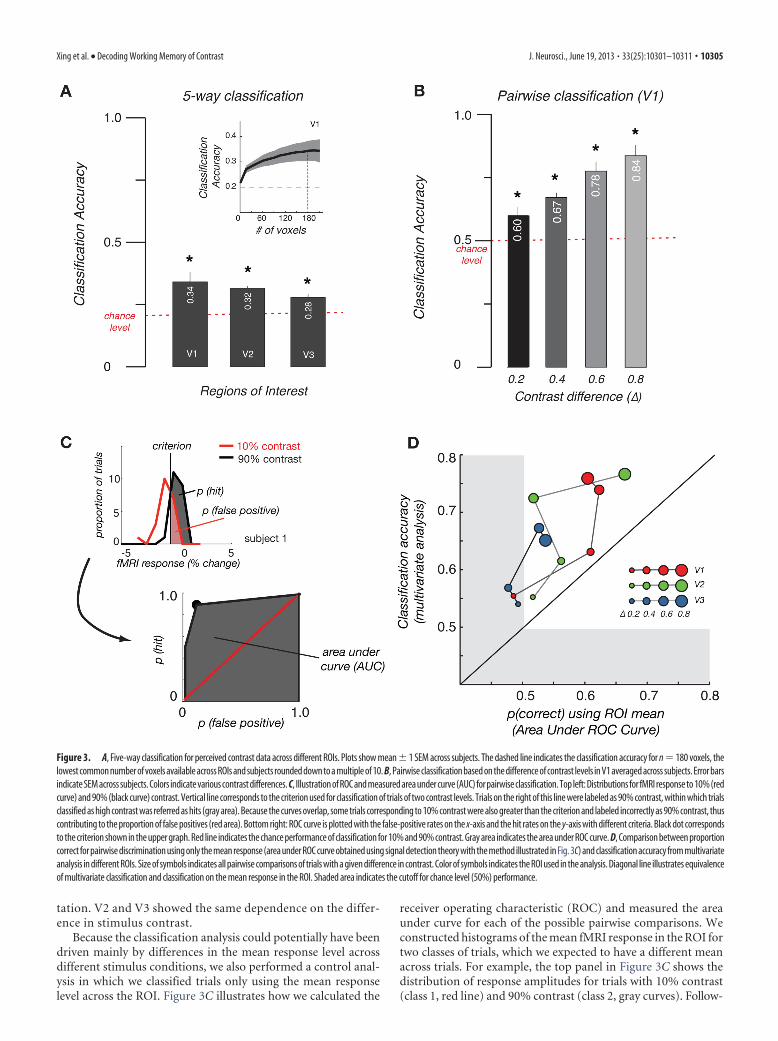
tation. V2 and V3 showed the same dependence on the differ-ence in stimulus contrast.
Because the classification analysis could potentially have beendriven mainly by differences in the mean response level acrossdifferent stimulus conditions, we also performed a control anal-ysis in which we classified trials only using the mean responselevel across the ROI. Figure 3C illustrates how we calculated the
receiver operating characteristic (ROC) and measured the areaunder curve for each of the possible pairwise comparisons. Weconstructed histograms of the mean fMRI response in the ROI fortwo classes of trials, which we expected to have a different meanacross trials. For example, the top panel in Figure 3C shows thedistribution of response amplitudes for trials with 10% contrast(class 1, red line) and 90% contrast (class 2, gray curves). Follow-
Figure 3. A, Five-way classification for perceived contrast data across different ROIs. Plots show mean � 1 SEM across subjects. The dashed line indicates the classification accuracy for n � 180 voxels, thelowest common number of voxels available across ROIs and subjects rounded down to a multiple of 10. B, Pairwise classification based on the difference of contrast levels in V1 averaged across subjects. Error barsindicate SEM across subjects. Colors indicate various contrast differences. C, Illustration of ROC and measured area under curve (AUC) for pairwise classification. Top left: Distributions for fMRI response to 10% (redcurve) and 90% (black curve) contrast. Vertical line corresponds to the criterion used for classification of trials of two contrast levels. Trials on the right of this line were labeled as 90% contrast, within which trialsclassified as high contrast was referred as hits (gray area). Because the curves overlap, some trials corresponding to 10% contrast were also greater than the criterion and labeled incorrectly as 90% contrast, thuscontributing to the proportion of false positives (red area). Bottom right: ROC curve is plotted with the false-positive rates on the x-axis and the hit rates on the y-axis with different criteria. Black dot correspondsto the criterion shown in the upper graph. Red line indicates the chance performance of classification for 10% and 90% contrast. Gray area indicates the area under ROC curve. D, Comparison between proportioncorrect for pairwise discrimination using only the mean response (area under ROC curve obtained using signal detection theory with the method illustrated in Fig. 3C) and classification accuracy from multivariateanalysis in different ROIs. Size of symbols indicates all pairwise comparisons of trials with a given difference in contrast. Color of symbols indicates the ROI used in the analysis. Diagonal line illustrates equivalenceof multivariate classification and classification on the mean response in the ROI. Shaded area indicates the cutoff for chance level (50%) performance.
Xing et al. • Decoding Working Memory of Contrast J. Neurosci., June 19, 2013 • 33(25):10301–10311 • 10305
ing the logic of a standard signal-detection theory analysis, we set acriterion level and estimated the proportion of trials from the twodistributions that fell above that criterion level. This corresponds tothe proportion of “hits” (or correct labelings) and “false alarms” (orincorrect labelings), respectively. Considering the proportion of hitsand false alarms at different criterion levels, we could construct theROC curve. The area under the ROC curve is equivalent to the pro-portion correct that could be achieved in two-way categorizationgiven the distribution of fMRI responses for the two classes of stimuli(Macmillan and Creelman, 2005).
Interestingly, although the classification performance improvedas the contrast difference between the two gratings increased, thoseobtained by only considering the mean response were consistentlyworse than those obtained by multivariate classification. This indi-cates that there is significant categorical information present in thepattern of responses that is not captured in the ROI mean, which canbe exploited by using multivariate methods.
The scatter plot in Figure 3D summarizes the data for the fourdifferent levels of contrast difference and four different ROIs. Forall pairwise comparisons of trials with a given difference in con-trast (size of symbols) in all of the ROIs we considered (color ofsymbols), multivariate classification outperformed classificationbased solely on the mean response in the ROI.
Experiment 2: multivariate classification ofremembered contrastIn the second part of the study, we addressed whether BOLD re-sponses in early visual cortex could be used to classify the remem-bered stimulus contrast of a pattern. We recorded the BOLDresponses when two levels of contrasts (“low,” 30% or “high,” 70%)were remembered. Average time courses in V1 for the two types oftrials across six subjects showed no apparent differences between theresponses during trials when subjects had to remember the low orhigh contrast pattern (Fig. 2C). All subjects’ responses across V1, V2,and V3 in this task showed a similar profile.
The first transient increase in the event-related responses followsthe presentation of the sample gratings and cue at the beginning ofeach trial. The second transient response corresponds to the presen-tation of the test grating. The period in between corresponds to theinterval during which subjects had to remember the contrast of thegrating to allow them to perform the task. We averaged the four timepoints in this time window (see Materials and Methods) and usedthese data as input for our classification analysis.
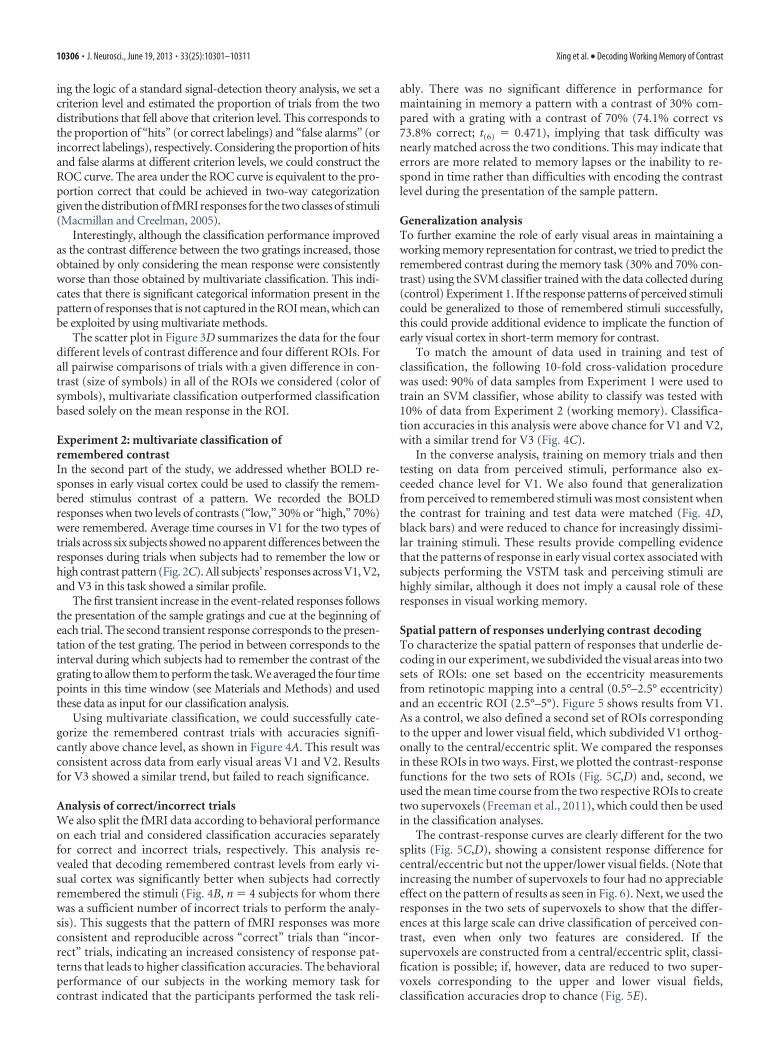
Using multivariate classification, we could successfully cate-gorize the remembered contrast trials with accuracies signifi-cantly above chance level, as shown in Figure 4A. This result wasconsistent across data from early visual areas V1 and V2. Resultsfor V3 showed a similar trend, but failed to reach significance.
Analysis of correct/incorrect trialsWe also split the fMRI data according to behavioral performanceon each trial and considered classification accuracies separatelyfor correct and incorrect trials, respectively. This analysis re-vealed that decoding remembered contrast levels from early vi-sual cortex was significantly better when subjects had correctlyremembered the stimuli (Fig. 4B, n � 4 subjects for whom therewas a sufficient number of incorrect trials to perform the analy-sis). This suggests that the pattern of fMRI responses was moreconsistent and reproducible across “correct” trials than “incor-rect” trials, indicating an increased consistency of response pat-terns that leads to higher classification accuracies. The behavioralperformance of our subjects in the working memory task forcontrast indicated that the participants performed the task reli-
ably. There was no significant difference in performance formaintaining in memory a pattern with a contrast of 30% com-pared with a grating with a contrast of 70% (74.1% correct vs73.8% correct; t(6) � 0.471), implying that task difficulty wasnearly matched across the two conditions. This may indicate thaterrors are more related to memory lapses or the inability to re-spond in time rather than difficulties with encoding the contrastlevel during the presentation of the sample pattern.
Generalization analysisTo further examine the role of early visual areas in maintaining aworking memory representation for contrast, we tried to predict theremembered contrast during the memory task (30% and 70% con-trast) using the SVM classifier trained with the data collected during(control) Experiment 1. If the response patterns of perceived stimulicould be generalized to those of remembered stimuli successfully,this could provide additional evidence to implicate the function ofearly visual cortex in short-term memory for contrast.
To match the amount of data used in training and test ofclassification, the following 10-fold cross-validation procedurewas used: 90% of data samples from Experiment 1 were used totrain an SVM classifier, whose ability to classify was tested with10% of data from Experiment 2 (working memory). Classifica-tion accuracies in this analysis were above chance for V1 and V2,with a similar trend for V3 (Fig. 4C).
In the converse analysis, training on memory trials and thentesting on data from perceived stimuli, performance also ex-ceeded chance level for V1. We also found that generalizationfrom perceived to remembered stimuli was most consistent whenthe contrast for training and test data were matched (Fig. 4D,black bars) and were reduced to chance for increasingly dissimi-lar training stimuli. These results provide compelling evidencethat the patterns of response in early visual cortex associated withsubjects performing the VSTM task and perceiving stimuli arehighly similar, although it does not imply a causal role of theseresponses in visual working memory.
Spatial pattern of responses underlying contrast decodingTo characterize the spatial pattern of responses that underlie de-coding in our experiment, we subdivided the visual areas into twosets of ROIs: one set based on the eccentricity measurementsfrom retinotopic mapping into a central (0.5°–2.5° eccentricity)and an eccentric ROI (2.5°–5°). Figure 5 shows results from V1.As a control, we also defined a second set of ROIs correspondingto the upper and lower visual field, which subdivided V1 orthog-onally to the central/eccentric split. We compared the responsesin these ROIs in two ways. First, we plotted the contrast-responsefunctions for the two sets of ROIs (Fig. 5C,D) and, second, weused the mean time course from the two respective ROIs to createtwo supervoxels (Freeman et al., 2011), which could then be usedin the classification analyses.
The contrast-response curves are clearly different for the twosplits (Fig. 5C,D), showing a consistent response difference forcentral/eccentric but not the upper/lower visual fields. (Note thatincreasing the number of supervoxels to four had no appreciableeffect on the pattern of results as seen in Fig. 6). Next, we used theresponses in the two sets of supervoxels to show that the differ-ences at this large scale can drive classification of perceived con-trast, even when only two features are considered. If thesupervoxels are constructed from a central/eccentric split, classi-fication is possible; if, however, data are reduced to two super-voxels corresponding to the upper and lower visual fields,classification accuracies drop to chance (Fig. 5E).
10306 • J. Neurosci., June 19, 2013 • 33(25):10301–10311 Xing et al. • Decoding Working Memory of Contrast
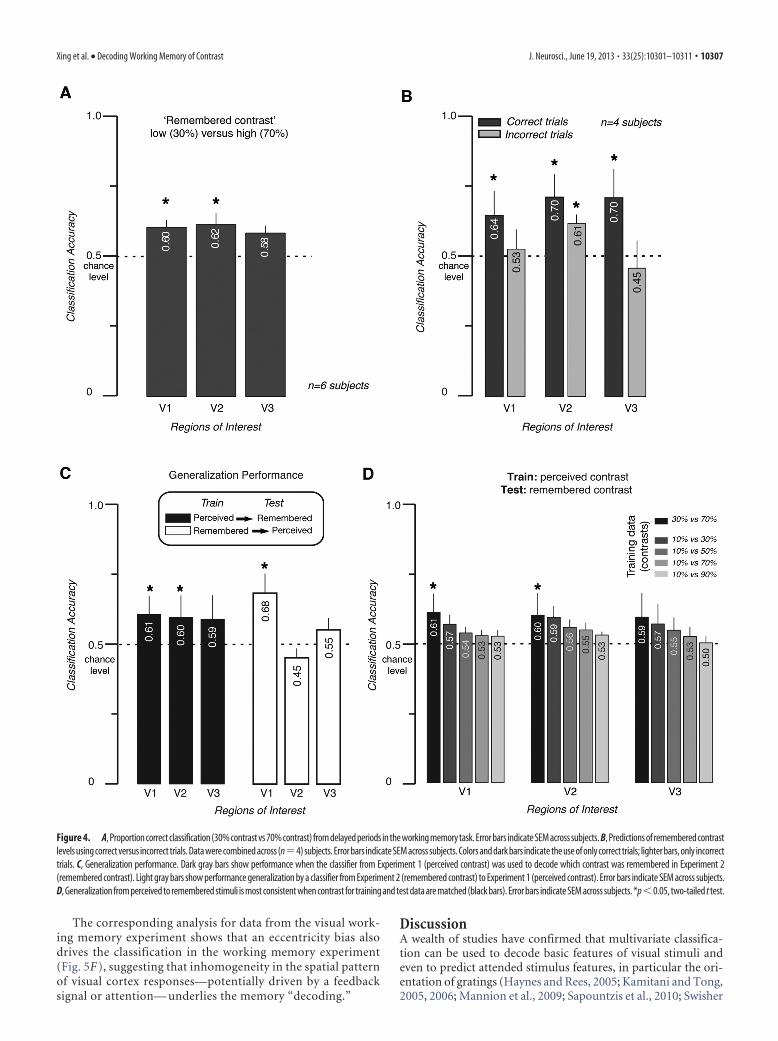
The corresponding analysis for data from the visual work-ing memory experiment shows that an eccentricity bias alsodrives the classification in the working memory experiment(Fig. 5F ), suggesting that inhomogeneity in the spatial patternof visual cortex responses—potentially driven by a feedbacksignal or attention— underlies the memory “decoding.”
DiscussionA wealth of studies have confirmed that multivariate classifica-tion can be used to decode basic features of visual stimuli andeven to predict attended stimulus features, in particular the ori-entation of gratings (Haynes and Rees, 2005; Kamitani and Tong,2005, 2006; Mannion et al., 2009; Sapountzis et al., 2010; Swisher
Figure 4. A, Proportion correct classification (30% contrast vs 70% contrast) from delayed periods in the working memory task. Error bars indicate SEM across subjects. B, Predictions of remembered contrastlevels using correct versus incorrect trials. Data were combined across (n�4) subjects. Error bars indicate SEM across subjects. Colors and dark bars indicate the use of only correct trials; lighter bars, only incorrecttrials. C, Generalization performance. Dark gray bars show performance when the classifier from Experiment 1 (perceived contrast) was used to decode which contrast was remembered in Experiment 2(remembered contrast). Light gray bars show performance generalization by a classifier from Experiment 2 (remembered contrast) to Experiment 1 (perceived contrast). Error bars indicate SEM across subjects.D, Generalization from perceived to remembered stimuli is most consistent when contrast for training and test data are matched (black bars). Error bars indicate SEM across subjects. *p�0.05, two-tailed t test.
Xing et al. • Decoding Working Memory of Contrast J. Neurosci., June 19, 2013 • 33(25):10301–10311 • 10307
Figure 5. Spatial pattern of fMRI responses that drive classification. A, B, Flat map of visual cortex from one subject showing definition of central/eccentric and lower/upper visual field ROIs forV1. White dashed lines indicate borders between V1 and V2v/V2d. C, D, FMRI response as a function of stimulus contrast. Contrast response curves from the central/eccentric (Figure legend continues.)
10308 • J. Neurosci., June 19, 2013 • 33(25):10301–10311 Xing et al. • Decoding Working Memory of Contrast
et al., 2010). However, there is substantial debate concerning thesource of the underlying signal supporting this decoding both forstimulus orientation (Freeman et al., 2011) and other stimulusparameters (Kriegeskorte, 2009).
Here we show that fMRI responses in early visual cortex can alsobe used to reliably decode the stimulus contrasts presented to thesubject. The ability to classify trials with different contrast levels is initself unsurprising because there is a well known shift in mean re-sponse level with increasing contrast, which has previously been wellcharacterized in early visual cortex (Albrecht and Hamilton, 1982;Ohzawa et al., 1985; Boynton et al., 1999; Reich et al., 2001; Gardneret al., 2005). Most neurons in early visual cortex exhibit a monotonicincrease in response as a function of contrast, but some cells showvery different patterns of response saturation (and even supersatu-ration) with contrast (Ledgeway et al., 2005; Peirce, 2007; Hu andWang, 2011). However, unlike stimulus orientation, there is noknown columnar organization for neurons with similar contrast-response functions. Nonetheless, despite the lack of orderly cluster-ing in structure, there may still be spatially local inhomogeneouschanges in the fMRI responses to contrast. Using a multivariate clas-sification analysis that does not take into account shifts in the meanresponse in the ROI therefore cannot untangle whether the ability toclassify is simply due to a global shift in the neuronal response or toredistribution of a differential signal.
In a more fine-grained analysis, we therefore evaluated mul-tivariate classification between stimuli at pairwise contrast levelsand the predicted performance using a univariate (signal detec-tion type) analysis using only the average response in each ROI.We found that multivariate classification became increasinglyaccurate with larger contrast differences in the stimuli (Fig. 3B;Smith et al., 2011). Even trials close in contrast could be discrim-
inated using SVM, where just considering the mean response inthe ROI failed to classify trials correctly. This further supportsMVPA’s increased sensitivity compared with univariate methods(Kriegeskorte et al., 2006).
These results suggest that a spatially specific response patternto different contrasts can drive improved classification perfor-mance. To characterize the spatial pattern (and scale) of re-sponses underlying this multivariate contrast decoding, wesubdivided the visual areas into two sets of ROIs: one based oneccentricity measurements from retinotopic mapping corre-sponding to a central and an eccentric portion of our stimuli,because contrast sensitivity is known to change as a function ofeccentricity (Legge and Kersten, 1987). As a control, we also de-fined another set of ROIs corresponding to the upper and lowervisual fields, where such asymmetries might be less pronounced.We found that even when we reduced the multivariate fMRIresponses to only two features, responses in a central and eccen-tric ROI, classification was possible. Our results do not, however,address directly whether information is present only at the levelof a coarser scale (eccentricity) map or also at fine columnararchitecture, an issue currently the subject of much debate (Gard-ner et al., 2008; Op de Beeck et al., 2008; Gardner, 2010; Swisheret al., 2010; Freeman et al., 2011; Beckett et al., 2012).
To determine whether MVPA could also be used to probe themechanisms underlying working memory of stimulus contrast,we analyzed fMRI responses during a delay period in a visualworking memory task. Given previous findings (Ester et al., 2009;Harrison and Tong, 2009) that a significant working memorytrace exists for specific orientations in early visual cortex, weinvestigated whether a similar result holds for contrast.
We found that information in the fMRI responses duringworking memory trials could be used to decode whether a low-contrast or high-contrast visual pattern was retained in memory.a
Interestingly, there was no significant difference in mean re-sponse in early visual cortex when subjects remembered a low-
aIt should be noted that the experimental design used here (consistent with Harrison and Tong’s paradigm) is notideally suited to estimate sustained delay period activity because the delay duration is fixed (see Schluppeck et al.,2006 for discussion) and by necessity always follows a cue directly. Exact estimation of delay period activity in sucha paradigm is therefore ill posed. However, to the extent that sustained delay period activity can be estimated, therewas variability across our six subjects in the amount of sustained response, which is in agreement with previousreports (Harrison and Tong, 2009).
4
(Figure legend continued.) split ROIs (C) and the upper/lower visual field split ROIs (D). Sym-bols indicate the mean across six subjects. Error bars indicate the SEM across subjects. E, Classi-fication accuracies by contrast difference in stimuli for the perceived contrast experiment usinglower/upper visual field (LVF/UVF) split ROIs (white), central/eccentric split ROIs (black), andthe mean response across all voxels included in the V1 ROI (gray) (Fig. 3B). Mean across subjectsis shown. Error bars indicate the SEM across subjects. F, Classification accuracies for decoding ofremembered contrast. For multivariate classification, accuracies represent cross-validated val-ues obtained with linear SVM. For classification on mean time course across ROI, accuraciesrepresent area under ROC curve (Fig. 3C). *p � 0.05, two-tailed t test.
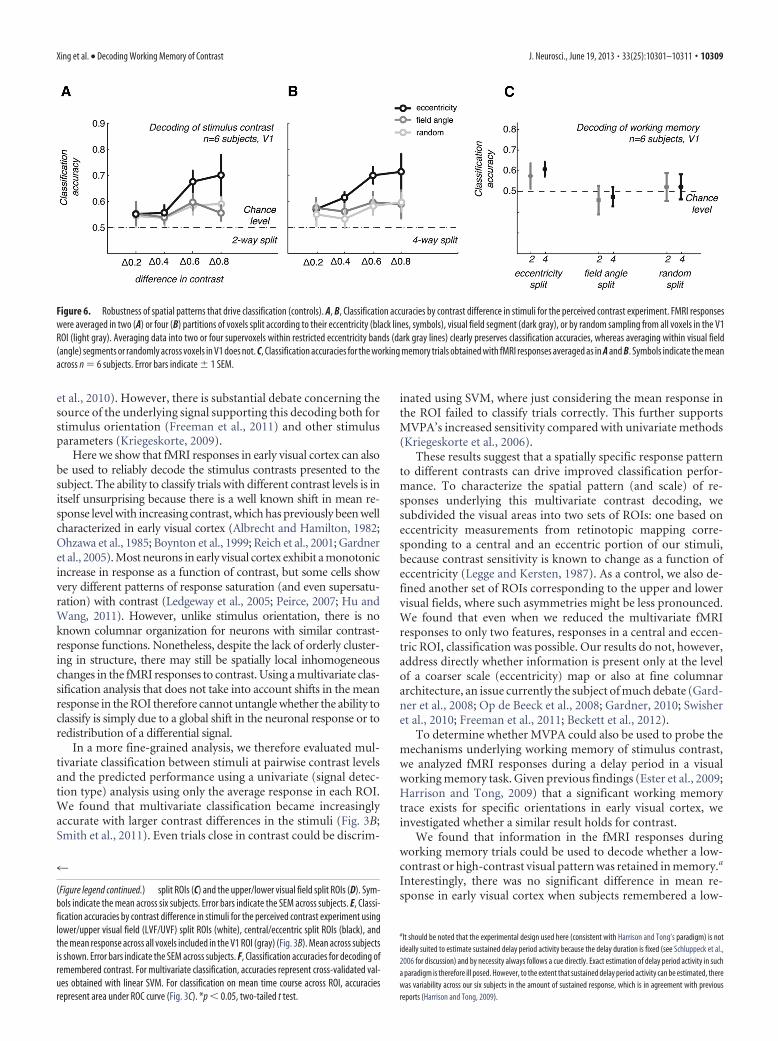
Figure 6. Robustness of spatial patterns that drive classification (controls). A, B, Classification accuracies by contrast difference in stimuli for the perceived contrast experiment. FMRI responseswere averaged in two (A) or four (B) partitions of voxels split according to their eccentricity (black lines, symbols), visual field segment (dark gray), or by random sampling from all voxels in the V1ROI (light gray). Averaging data into two or four supervoxels within restricted eccentricity bands (dark gray lines) clearly preserves classification accuracies, whereas averaging within visual field(angle) segments or randomly across voxels in V1 does not. C, Classification accuracies for the working memory trials obtained with fMRI responses averaged as in A and B. Symbols indicate the meanacross n � 6 subjects. Error bars indicate � 1 SEM.
Xing et al. • Decoding Working Memory of Contrast J. Neurosci., June 19, 2013 • 33(25):10301–10311 • 10309
contrast versus a high-contrast stimulus, suggesting that overallresponse level is not the representation used for rememberingcontrast. The pattern of fMRI responses in early visual cortex,however, contained sufficient information to decode trials intothe two categories. This result is consistent with Offen et al.(2009), who proposed an explanation for the absence of (mean)delay period activity in early visual areas during working memorytasks: opposing excitatory and inhibitory responses from differ-ent subpopulations of neurons in these regions may effectivelycancel each other in the average BOLD signal. Any delay periodactivity in early visual cortex may therefore be obscured in indi-vidual voxels or the mean responses across ROIs.
To address the key issue of whether the pattern of fMRI re-sponses obtained when subjects perceived a given stimulus con-trast is similar to when they remembered it, we assessed the abilityof our classifiers to generalize across the different tasks (Kamitaniand Tong, 2005, 2006; Dinstein et al., 2008; Kay et al., 2008;Brouwer and Heeger, 2009; Harrison and Tong, 2009). In Harri-son and Tong’s (2009) study, they predicted which of two orien-tations were retained in memory with a classifier trained on datafrom visual activity patterns induced by unattended gratings. Inthe present study, generalization was tested by comparing classi-fication with perceived versus remembered stimulus contrasts.We found that classification generalized both from perceived toremembered and vice versa, strongly suggesting that the repre-sentation of information in early visual cortex (specifically V1) issimilar for both tasks.
Intriguingly, when we reduced the multivariate responses intothose of two supervoxels corresponding to a central and an ec-centric portion of our stimuli, classification of remembered con-trasts was still possible. This suggests that a large-scale bias witheccentricity can drive classification for remembered as well asperceived stimuli.
Moreover, we observed a strong dependence of classificationperformance on the behavioral performance of our subjects,which is consistent with previous reports (Williams et al., 2007;Scolari and Serences, 2010). When trials were split according tocorrect and incorrect behavioral performance, we found thatclassification accuracies for correct trials were significantly higherthan for incorrect trials. This suggests that the pattern of re-sponses in early visual cortex is more consistent and repeatableacross correct trials than incorrect trials. If multivariate classifi-cation analysis relies on signals directly related to neural activitysupporting working memory function, then this increased con-sistency in fMRI responses may correspond to decreased noiseand a more reliable neural signal. Activity in early visual cortexduring incorrect trials may be more inconsistent, because thereare several different reasons for making errors, causing morevariability across trials: lapses in attention, eye blinks, failure toencode or retain the matching stimulus, and finger (response)errors.
Some studies suggest that both task-relevant and task-irrelevant features may be encoded together in VSTM (O’Cravenet al., 1999; Wheeler and Treisman, 2002), whereas others haveargued for a task-selective activity pattern in primary visual cor-tex (Woodman and Vogel, 2008; Serences et al., 2009). One pre-vious fMRI experiment used color or orientation as selectedfeatures to evaluate prediction accuracy of MVPA in a workingmemory task (Serences et al., 2009). That study found a signifi-cant change of performance when subjects’ attention wasswitched between the alternate features in different runs. Here,we did not test directly whether the information from two orien-tations that were task irrelevant were retained in memory (sub-
jects only judged stimulus contrast), but, like others (Serences etal., 2009), we used two primary stimulus attributes (orientationand stimulus contrast) to reduce adaptation effects across trials.
Our study shows that fMRI responses in early visual cortexcould be used to decode the contrast of a perceived stimulus(Experiment 1) and that responses in these areas also supportedthe classification of contrast when the stimulus only had to beremembered (Experiment 2). Classifiers trained on data fromeach experiment generalized to the other, suggesting that signalsin early visual cortex are significantly modulated during workingmemory for stimulus contrast on the timescale of seconds andthat the same signals are present during perception and memoryfor this stimulus property. We found that a large-scale bias in theresponses with eccentricity can drive classification for remem-bered as well as perceived stimuli, raising the possibility that aconsistent attentional or feedback signal, rather than activity re-lated to working memory per se, may underlie the significant (butmodest) classification accuracies reported.
Finally, we found substantially improved pattern classifica-tion when we compared data from correct and incorrect trials.When we considered only data from correct trials for classifica-tion, accuracies approximately matched subjects’ behavioral per-formance. This highlights the fact that fMRI responses fromincorrect trials add substantial noise to the contrast VSTM signalsused in decoding, an important consideration for future studies.
ReferencesAlbrecht DG, Hamilton DB (1982) Striate cortex of monkey and cat: con-
trast response function. J Neurophysiol 48:217–237. MedlineBaumann O, Endestad T, Magnussen S, Greenlee MW (2008) Delayed dis-
crimination of spatial frequency for gratings of different orientation: be-havioral and fMRI evidence for low-level perceptual memory stores inearly visual cortex. Exp Brain Res 188:363–369. CrossRef Medline
Beckett A, Peirce JW, Sanchez-Panchuelo RM, Francis S, Schluppeck D(2012) Contribution of large scale biases in decoding of direction-of-motion from high-resolution fMRI data in human early visual cortex.Neuroimage 63:1623–1632. CrossRef Medline
Boynton GM, Demb JB, Glover GH, Heeger DJ (1999) Neuronal basis ofcontrast discrimination. Vision Res 39:257–269. CrossRef Medline
Braver TS, Cohen JD, Nystrom LE, Jonides J, Smith EE, Noll DC (1997) Aparametric study of prefrontal cortex involvement in human workingmemory. Neuroimage 5:49 – 62. CrossRef Medline
Brouwer GJ, Heeger DJ (2009) Decoding and reconstructing color fromresponses in human visual cortex. J Neurosci 29:13992–14003. CrossRefMedline
Burock MA, Dale AM (2000) Estimation and detection of event-relatedfMRI signals with temporally correlated noise: a statistically efficient andunbiased approach. Hum Brain Mapp 11:249 –260. Medline
Burock MA, Buckner RL, Woldorff MG, Rosen BR, Dale AM (1998) Ran-domized event-related experimental designs allow for extremely rapidpresentation rates using functional MRI. Neuroreport 9:3735–3739.CrossRef Medline
Curtis CE, D’Esposito M (2003) Persistent activity in the prefrontal cortexduring working memory. Trends Cogn Sci 7:415– 423. CrossRef Medline
Dale AM (1999) Optimal experimental design for event-related fMRI. HumBrain Mapp 8:109 –114. CrossRef Medline
DeYoe EA, Carman GJ, Bandettini P, Glickman S, Wieser J, Cox R, Miller D,Neitz J (1996) Mapping striate and extrastriate visual areas in humancerebral cortex. Proc Natl Acad Sci U S A 93:2382–2386. CrossRefMedline
Dinstein I, Thomas C, Behrmann M, Heeger DJ (2008) A mirror up tonature. Curr Biol 18:R13–R18. CrossRef Medline
Engel SA, Rumelhart DE, Wandell BA, Lee AT, Glover GH, Chichilnisky EJ,Shadlen MN (1994) fMRI of human visual cortex. Nature 369:525.CrossRef Medline
Engel SA, Glover GH, Wandell BA (1997) Retinotopic organization in hu-man visual cortex and the spatial precision of functional MRI. CerebCortex 7:181–192. CrossRef Medline
Ester EF, Serences JT, Awh E (2009) Spatially global representations in hu-
10310 • J. Neurosci., June 19, 2013 • 33(25):10301–10311 Xing et al. • Decoding Working Memory of Contrast
man primary visual cortex during working memory maintenance. J Neu-rosci 29:15258 –15265. CrossRef Medline
Freeman J, Brouwer GJ, Heeger DJ, Merriam EP (2011) Orientation decod-ing depends on maps, not columns. J Neurosci 31:4792– 4804. CrossRefMedline
Fuster JM (1995) Memory in the cortex of the primate. Biol Res 28:59 –72.Medline
Gardner JL (2010) Is cortical vasculature functionally organized? Neuroim-age 49:1953–1956. CrossRef Medline
Gardner JL, Sun P, Waggoner RA, Ueno K, Tanaka K, Cheng K (2005) Con-trast adaptation and representation in human early visual cortex. Neuron47:607– 620. CrossRef Medline
Gardner JL, Merriam EP, Movshon JA, Heeger DJ (2008) Maps of visualspace in human occipital cortex are retinotopic, not spatiotopic. J Neu-rosci 28:3988 –3999. CrossRef Medline
Greenlee MW, Magnussen S, Reinvang I (2000) Brain regions involved inspatial frequency discrimination: evidence from fMRI. Exp Brain Res132:399 – 403. CrossRef Medline
Harrison SA, Tong F (2009) Decoding reveals the contents of visual workingmemory in early visual areas. Nature 458:632– 635. CrossRef Medline
Haxby JV, Petit L, Ungerleider LG, Courtney SM (2000) Distinguishing thefunctional roles of multiple regions in distributed neural systems for vi-sual working memory. Neuroimage 11:380 –391. CrossRef Medline
Haynes JD, Rees G (2005) Predicting the orientation of invisible stimulifrom activity in human primary visual cortex. Nat Neurosci 8:686 – 691.CrossRef Medline
Heeger DJ, Huk AC, Geisler WS, Albrecht DG (2000) Spikes versus BOLD:what does neuroimaging tell us about neuronal activity? Nat Neurosci3:631– 633. CrossRef Medline
Hu M, Wang Y, Wang Y (2011) Rapid dynamics of contrast responses in thecat primary visual cortex. PLoS One 6:e25410. CrossRef Medline
Kamitani Y, Tong F (2005) Decoding the visual and subjective contents ofthe human brain. Nat Neurosci 8:679 – 685. CrossRef Medline
Kamitani Y, Tong F (2006) Decoding seen and attended motion directionsfrom activity in the human visual cortex. Curr Biol 16:1096 –1102.CrossRef Medline
Kastner S, O’Connor DH, Fukui MM, Fehd HM, Herwig U, Pinsk MA(2004) Functional imaging of the human lateral geniculate nucleus andpulvinar. J Neurophysiol 91:438 – 448. CrossRef Medline
Kay KN, Naselaris T, Prenger RJ, Gallant JL (2008) Identifying natural im-ages from human brain activity. Nature 452:352–355. CrossRef Medline
Kriegeskorte N (2009) Relating population-code representations betweenman, monkey, and computational models. Front Neurosci 3:363–373.CrossRef Medline
Kriegeskorte N, Goebel R, Bandettini P (2006) Information-based func-tional brain mapping. Proc Natl Acad Sci U S A 103:3863–3868. CrossRefMedline
Ledgeway T, Hess RF (2002) Failure of direction identification for brieflypresented second-order motion stimuli: evidence for weak direction se-lectivity of the mechanisms encoding motion. Vision Res 42:1739 –1758.CrossRef Medline
Ledgeway T, Smith AT (1994) Evidence for separate motion-detectingmechanisms for first- and second-order motion in human vision. VisionRes 34:2727–2740. CrossRef Medline
Ledgeway T, Zhan C, Johnson AP, Song Y, Baker CL Jr (2005) Thedirection-selective contrast response of area 18 neurons is different forfirst- and second-order motion. Vis Neurosci 22:87–99. CrossRefMedline
Legge GE, Kersten D (1987) Contrast discrimination in peripheral vision. JOpt Soc Am A 4(8):1594 –1598. CrossRef
Luck SJ, Vogel EK (1997) The capacity of visual working memory for fea-tures and conjunctions. Nature 390:279 –281. CrossRef Medline
Macmillan NA, Creelman CD (2005) Detection theory: a user’s guide, Ed 2.Mahwah, NJ: Erlbaum.
Mannion DJ, McDonald JS, Clifford CW (2009) Discrimination of the localorientation structure of spiral Glass patterns early in human visual cortex.Neuroimage 46:511–515. CrossRef Medline
Nestares O, Heeger DJ (2000) Robust multiresolution alignment of MRIbrain volumes. Magn Reson Med 43:705–715. CrossRef Medline
O’Craven KM, Downing PE, Kanwisher N (1999) fMRI evidence for objectsas the units of attentional selection. Nature 401:584 –587. CrossRefMedline
Offen S, Schluppeck D, Heeger DJ (2009) The role of early visual cortex invisual short-term memory and visual attention. Vision Res 49:1352–1362.CrossRef Medline
Offen S, Gardner JL, Schluppeck D, Heeger DJ (2010) Differential roles forfrontal eye fields (FEFs) and intraparietal sulcus (IPS) in visual workingmemory and visual attention. J Vis 10:28. CrossRef Medline
Ohzawa I, Sclar G, Freeman RD (1985) Contrast gain control in the cat’svisual system. J Neurophysiol 54:651– 667. Medline
Op de Beeck HP, Dicarlo JJ, Goense JB, Grill-Spector K, Papanastassiou A,Tanifuji M, Tsao DY (2008) Fine-scale spatial organization of face andobject selectivity in the temporal lobe: do functional magnetic resonanceimaging, optical imaging, and electrophysiology agree? J Neurosci 28:11796 –11801. CrossRef Medline
Pasternak T, Greenlee MW (2005) Working memory in primate sensorysystems. Nat Rev Neurosci 6:97–107. CrossRef Medline
Peirce JW (2007) The potential importance of saturating and supersaturat-ing contrast response functions in visual cortex. J Vis 7:13. CrossRefMedline
Pessoa L, Gutierrez E, Bandettini P, Ungerleider L (2002) Neural correlatesof visual working memory: fMRI amplitude predicts task performance.Neuron 35:975–987. CrossRef Medline
Pooresmaeili A, Poort J, Thiele A, Roelfsema PR (2010) Separable codes forattention and luminance contrast in the primary visual cortex. J Neurosci30:12701–12711. CrossRef Medline
Postle BR, D’Esposito M (1999) Dissociation of human caudate nucleusactivity in spatial and nonspatial working memory: an event-related fMRIstudy. Brain Res Cogn Brain Res 8:107–115. CrossRef Medline
Reich DS, Mechler F, Victor JD (2001) Temporal coding of contrast in pri-mary visual cortex: when, what, and why. J Neurophysiol 85:1039 –1050.Medline
Sanchez-Panchuelo RM, Francis S, Bowtell R, Schluppeck D (2010) Map-ping human somatosensory cortex in individual subjects with 7T func-tional MRI. J Neurophysiol 103:2544 –2556. CrossRef Medline
Sapountzis P, Schluppeck D, Bowtell R, Peirce JW (2010) A comparison offMRI adaptation and multivariate pattern classification analysis in visualcortex. Neuroimage 49:1632–1640. CrossRef Medline
Schluppeck D, Curtis CE, Glimcher PW, Heeger DJ (2006) Sustained activ-ity in topographic areas of human posterior parietal cortex duringmemory-guided saccades. J Neurosci 26:5098 –5108. CrossRef Medline
Scolari M, Serences JT (2010) Basing perceptual decisions on the most in-formative sensory neurons. J Neurophysiol 104:2266 –2273. CrossRefMedline
Serences JT, Ester EF, Vogel EK, Awh E (2009) Stimulus-specific delay ac-tivity in human primary visual cortex. Psychol Sci 20:207–214. CrossRefMedline
Smith A, Kosillo P, Williams AL (2011) The confounding effect of responseamplitude on MVPA performance measures. Neuroimage 56:525–530.CrossRef Medline
Smith SM, Jenkinson M, Woolrich MW, Beckmann CF, Behrens TE,Johansen-Berg H, Bannister PR, De Luca M, Drobnjak I, Flitney DE,Niazy RK, Saunders J, Vickers J, Zhang Y, De Stefano N, Brady JM, Mat-thews PM (2004) Advances in functional and structural MR image anal-ysis and implementation as FSL. Neuroimage 23:S208 –S219. CrossRefMedline
Sneve MH, Alnæs D, Endestad T, Greenlee MW, Magnussen S (2011) Mod-ulation of activity in human visual area V1 during memory masking. PLoSOne 6:e18651. CrossRef Medline
Swisher JD, Gatenby JC, Gore JC, Wolfe BA, Moon CH, Kim SG, Tong F(2010) Multiscale pattern analysis of orientation-selective activity in theprimary visual cortex. J Neurosci 30:325–330. CrossRef Medline
Wandell BA, Dumoulin SO, Brewer AA (2007) Visual field maps in humancortex. Neuron 56:366 –383. CrossRef Medline
Wheeler ME, Treisman AM (2002) Binding in short-term visual memory. JExp Psychol Gen 131:48 – 64. CrossRef Medline
Williams MA, Dang S, Kanwisher NG (2007) Only some spatial patterns offMRI response are read out in task performance. Nat Neurosci 10:685–686. CrossRef Medline
Woodman GF, Vogel EK (2008) Selective storage and maintenance of anobject’s features in visual working memory. Psychon Bull Rev 15:223–229. CrossRef Medline
Xing et al. • Decoding Working Memory of Contrast J. Neurosci., June 19, 2013 • 33(25):10301–10311 • 10311


![Diagnóstico diferencial clínico en pequeños animales 2641... · Diagnostico diferencial . Indic onten1d0 ABORDAJE CLíNICO DEL DIAGNÓSTICC DIFERENCIAL . liagnosti( diferen 'la]](https://img.pdfslide.us/doc/110x75/5ac5c0137f8b9ae06c8df278/diagnstico-diferencial-clnico-en-pequeos-2641diagnostico-diferencial-indic.jpg)


![RelationshipbetweentheOrganizationandSynthesisofVimentinandthe ... · 2006. 12. 9. · [CANCERRESEARCH45,2632-2641,June1985] RelationshipbetweentheOrganizationandSynthesisofVimentinandthe](https://img.pdfslide.us/doc/110x75/5fdd58b477eca55cbf73c6ee/relationshipbetweentheorganizationandsynthesisofvimentinandthe-2006-12-9.jpg)