Embed Size (px)
Citation preview

Centre for Science and Environment Analysis
1
Decoding winter air pollution in Indo-Gangetic Plain: Pollution beyond NCR Anumita Roychowdhury and Avikal Somvanshi
Centre for Science and Environment, New Delhi, January, 2021
As part of its air quality tracker initiative the Centre for Science and Environment (CSE) has carried out a series of air quality analysis for different regions of the country to get a deeper view of the changing patterns of air quality trends. This seeks to understand the impact of the extraordinary year 2020 that has witnessed one of the biggest disruptions in the recent times. This is an inflexion point but also an indicator of what may change and yet not change despite the disruption. This helps to address some of the basic curiosities related to how low the pollution can get with stopping of activities, regional influence on local air quality, and deeper seasonal patterns that unmask the high local pollution despite the forced change during the lockdown phases. After analyzing the changing trends in Delhi and National Capital region, Rajasthan, Maharashtra, and West Bengal, this analysis unravels the pattern in the Indo-Gangetic Plain – the most vulnerable and difficult region from air quality perspective.
New analysis of winter pollution until 11 January of this year, carried out shows how clean air gains of the lockdown and monsoon period were lost with the reopening of the economy and hostile winter weather like all other regions. While this was expected, the analysis of the real-time data from monitoring stations outside NCR in the larger Indo-Gangetic Plain show newer pattern in winter pollution this year. Even though trapping of winter pollution in the larger Indo Gangetic Plain is high compared to other regions, it was not as high as that of the NCR but it was alarmingly high and synchronized despite large distances. This is the challenge of this landlocked region.
Higher PM2.5 levels is a typical and predictable winter trend when continuous emissions from local sources including vehicles, industry, construction, and episodic pollution from biomass burning get trapped due to meteorological changes. But this year, this trend has set in almost two weeks earlier in the season. There is clear difference in winter pollution pattern between IGP regions north and south of NCR. Even though the average level of PM2.5 for the summer and monsoon months in 2020 is considerably lower than the previous year due to the pandemic related to summer lockdown, the PM2.5 levels this winter have risen beyond the 2019 in almost all monitored cities in Punjab and Haryana (region north of NCR. Cities in central and eastern UP and Bihar (region south of NCR) also show high winter pollution but levels are similar or lower compared to 2019. Combination of the reopening of the economy and changing meteorology is responsible for high winter pollution but this regional variation calls out for more nuanced and robust pollution control strategy. The region cannot rely only on action being taken in Delhi-NCR. This demands speed and scale of action.
This detailed data analysis points to the fact that the air pollution is an IGP wide problem and this requires quicker reforms and action in key sectors of pollution – vehicles, industry, power plants and waste management to control winter pollution and further bend the annual air pollution curve.
Data used in the analysis: The analysis is based on publicly available granular real time data (15-minute averages) from the Central Pollution Control Board’s (CPCB) official online portal Central Control Room for Air Quality Management. 26 cities – Amritsar, Bhatinda, Jalandhar, Khanna, Ludhiana, Mandi Gobindgarh, Patiala, Rupnagar, Chandigarh, Ambala, Fatehabad, Hisar, Kaithal, Kurukshetra, Panchkula, Sirsa, Yamuna Nagar, Agra, Kanpur, Moradabad, Varanasi, Lucknow, Patna, Gaya, Muzaffarpur, and Hajipur have been selected for this analysis because real time data is available for these cities. This has analysed data recorded by 6 air quality monitoring stations at Patna, 5 stations in Lucknow, 2 stations in Gaya and Muzaffarpur, one station each rest of the cities under the Continuous Ambient Air Quality Monitoring System (CAAQMS) of CPCB. Weather data for Amritsar, Ambala, Chandigarh, Lucknow, and Patna has been sourced from the weather stations of Indian Meteorological Department (IMD) located at the airport of each city.

Centre for Science and Environment Analysis
2
Key highlights
Annual average level of PM2.5 not lower in many cities this year despite the lockdown – while several bigger cities have witnessed reduction, smaller towns and cities have experienced increase: The 2020 average PM2.5 level in many cities in upper IGP has climbed up to breach the average concentration recorded in 2019. Fatehabad in northern Haryana is the worst performer with 35 per cent increase from 2019 level. It is followed by Bhatinda at 14 per cent, Agra at 9 per cent, Khanna at 7 per cent, Mandi Gobindgarh at 6 per cent, Moradabad at 5.5 per cent and Kurukshetra at about 1 per cent increase. Jalandhar registered less than one per cent change. Most improvement is noted in Sirsa which is closing 2020 with a 44 per cent lower PM2.5. Varanasi at 31 per cent, Gaya at 27 per cent, Muzaffarpur at 15 per cent and Hisar at 12 per cent are other best performers in the pool. Rest of the cities show improvement in range of 4-12 per cent (See Graph1: Percentage change in PM2.5 annual average in IGP cities). For context, Delhi’s 2020 average is 13 per cent lower than its 2019 level.
Graph1: Percentage change in PM2.5 annual average in IGP cities
Note: Annual average PM2.5 concentration is based on mean of monthly averages. For cities with multiple stations average of only those stations are used which were working in both 2019 and 2020 for all 12 months. Data uptill 31 December 2020. Source: CSE analysis of CPCB’s real time air quality data
Bad November indicates influence of stubble burning: In must be noted that Fatehabad (the worst performer) and Sirsa (the best performer) are neighboring towns; just 40 kms apart. Therefore, this massive variation can’t be attributed to meteorology and has to do with local factors. The annual average of these towns along with other smaller towns like Hisar and Jind in the north-west are heavily influenced episodic pollution caused burning of crop stubbles. Influence is so pronounced that it can elevate their monthly PM2.5 level for November to Delhi’s level but unlike Delhi these towns are directly exposed to the smoke. The elevated November levels don’t linger on for rest of winter in these towns as noted in Delhi (See Graph 2: Smaller Haryana towns have bad November similarly as Delhi). Therefore, any change in stubble burning pattern skews their annual average dramatically and which may possibly be the reason for observed trend in data but further field investigation is needed to determine the real reasons.

Centre for Science and Environment Analysis
3
Graph 2: Smaller Haryana towns have bad November similarly as Delhi
Note: Average PM2.5 concentration for a month is based on mean of all CAAQM stations in the city. Source: CSE analysis of CPCB’s real time air quality data
Average level of PM2.5 has been lowest during this summer and monsoon due to the lockdown but could not prevent the winter spike: The overall PM2.5 average this summer and monsoon has been predictably lower compared to the previous year largely because of the unprecedented economic disruption during the summer lockdown and phased unlocking. But reopening of the economy coinciding with the onset of the winter trapping pollution made PM2.5 levels rose starting October. From the respective cleanest week the weekly average of PM2.5 in Amritsar rose 10 times, in Ambala 9 times, Chandigarh 6 times, Lucknow 11 times, and Patna 11 times to the dirtiest week. These major cities recorded lesser deterioration than Delhi where weekly air quality worsened 14 times but smaller towns beat the capital. Bhatinda deteriorated 23 times, Fatehabad 22 times, Muzaffarpur 19 times, Sirsa 17 times, and Kanpur 16 times. It deteriorated 15 times in Hisar and Kaithal.
There is marked difference between northern cities and eastern cities. The cities in northern recorded their dirtiest week in first half of November same as Delhi-NCR, while eastern cities had their dirtiest week in December.
Dirtiest week for Khanna, Mandi Gobindgarh, Patiala, Rupnagar, Chandigarh, Ambala, Kaithal, Kurukshetra, Yamuna Nagar, Agra, and Moradabad was week ending on 8 November 2020. For Delhi, Amritsar, Bhatinda, Jalandhar, Ludhiana, Fatehabad, Hisar, Panchkula, and Sirsa the dirtiest week on the week ending on 15 November 2020. Hajipur, Patna, and Muzaffarpur the dirtiest week on the week ending on 6 December 2020. Kanpur, Varanasi, and Lucknow the dirtiest week on the week ending on 27 December 2020. Dirtiest week for Gaya was the new year’s week. Cleanest week for Khanna, Rupnagar, Ludhiana, and Panchkula was the week ending on 29 March, 2020. Amritsar and Jalandhar had their cleanest week in April. Patna had its cleanest week in June and July was the cleanest for Agra and Moradabad. Patiala, Chandigarh, Ambala, Kaithal, Kurukshetra, Yamuna Nagar, Delhi, Hisar, Kanpur, Varanasi, Lucknow, and Muzaffarpur had their cleanest week ending on 23 August 2020. Mandi Gobindgarh and Fatehabad had its cleanest week on the week ending 30 August 2020. Bhatinda and Sirsa had their cleanest week ending on 6 September 2020. Hajipur and Gaya had their cleanest week ending on 27 September 2020 (See Graph 3: Change in weekly PM2.5 levels 2020 – Difference between

Centre for Science and Environment Analysis
4
cleanest and most polluted week). The transient change of the lockdown phases could not be sustained without the systemic changes needed to control pollution from vehicles, industry, power plants, and waste.
Graph 3: Change in weekly PM2.5 levels 2020 – Difference between cleanest and most polluted
week
Note: Average PM2.5 concentration for a week is based on mean of all CAAQM stations in the city.
Source: CSE analysis of CPCB’s real time air quality data
Average November PM2.5 level has been considerably higher in northern cities this year: November this year was dirtier across most cities in IGP. The PM2.5 average this November was 310 per cent higher in Fatehabad, 104 per cent in Agra and 57 per cent in Kaithal compared to November 2019. November was also same or dirtier in all Punjab and Haryana cities except Sirsa that registered 16 per cent cleaner November. All cities in central and eastern UP and Bihar had a 4-48 per cent cleaner November. August this year cleaner in all these cities compared to August 2019 except in Bhatinda, Mandi Gobindgarh, Patiala, and Fatehabad (See Graph 4: Difference in winter pollution build-up: 2020 winter vs 2019 winter (monthly averages).
Graph 4: Difference in winter pollution build-up: 2020 winter vs 2019 winter (monthly averages)
Note: Average PM2.5 concentration for a month is based on mean of all CAAQM stations in the city.
Source: CSE analysis of CPCB’s real time air quality data

Centre for Science and Environment Analysis
5
Air quality gets more toxic with the onset of winter - share of tinier PM2.5 in the PM10 increases: The share of tinier and finer particles in the overall coarser PM10 concentration determines the toxicity of air. When the overall share of tinier PM2.5 in the overall coarser PM10 is higher, the air is more toxic as the tiny particles penetrate deep inside the lungs and cut through the blood barrier increasing health risk. Interestingly, during lockdown, when the overall suspended coarser particles had settled down reducing the PM10 levels, the PM2.5 had also come down. But its share was 33 per cent in Amristsar, 39 per cent in Chandigarh, 38 per cent in Patna – higher than it’s usually noted during summer (low 30s). But with the onset of winter the overall level of both have gone up and also the percentage share of PM2.5 in the overall PM10. This rose to high 40s during October and remained high through November averaging at 55 per cent in Amritsar, 48 per cent in Chandigarh, 53 per cent in Patna (See Graph 5: Changing share of percentage share of PM2.5 in PM10 in a) Amritsar b) Chandigarh c) Patna (1 Mar – 8 Dec, 2020)). The share of PM2.5 in PM10 is generally highest on Diwali and it reached 64 per cent in Amritsar, 69 per cent in Chandigarh, and 62 per cent in Patna this year.
Graph 5a: Changing percentage share of PM2.5 in PM10 in Amritsar (1 Mar – 21 Dec, 2020)
Data: CPCB (PM10 and PM2.5), IMD (Temperature and rainfall)
Source: CSE analysis
Graph 5b: Changing percentage share of PM2.5 in PM10 in Chandigarh (1 Mar – 21 Dec, 2020)
Data: CPCB (PM10 and PM2.5), IMD (Temperature and rainfall)
Source: CSE analysis

Centre for Science and Environment Analysis
6
Graph 5c: Changing percentage share of PM2.5 in PM10 in Patna (1 Mar – 21 Dec, 2020)
Data: CPCB (PM10 and PM2.5), IMD (Temperature and rainfall)
Source: CSE analysis
Dirtier Diwali in Lucknow this year but Amritsar, Ambala, Chandigarh, and Patna were cleaner: The average PM2.5 level on Diwali day at Talkatora in Lucknow was 434 μg/m
3 up from 237 μg/m
3 recorded in
2019. This year there was over 100 per cent higher rise in hourly PM2.5 concentration between afternoon and night of Diwali that is mostly caused due to firecracker busting (See Graph 6: How hourly pollution changed on Diwali day in Mumbai). Amritsar was 7 per cent, Chandigarh was 56 per cent, Ambala was 57 per cent, and Patna was 22 per cent cleaner. Diwali also occurred later in November than the previous year.
Graph 6a: How hourly pollution changed on Diwali day in Lucknow
Note: Diwali dates are 27 Oct 2019, and 14 Nov 2020. Citywide is based on average PM2.5 concentration of all CAAQM stations
operational in the city on a given day. Dotted lines represent a specific CAAQM station of the city to showcase variation in PM2.5
concentrations among city’s numerous CAAQM stations.
Source: CSE analysis of CPCB’s real time air quality data
Centre for Science and Environment Analysis
7
Graph 6b: How hourly pollution changed on Diwali day in Amritsar
Note: Diwali dates are 27 Oct 2019, and 14 Nov 2020. Citywide is based on average PM2.5 concentration of all CAAQM stations
operational in the city on a given day. Dotted lines represent a specific CAAQM station of the city to showcase variation in PM2.5
concentrations among city’s numerous CAAQM stations.
Source: CSE analysis of CPCB’s real time air quality data
Graph 6c: How hourly pollution changed on Diwali day in Chandigarh
Note: Diwali dates are 27 Oct 2019, and 14 Nov 2020. Citywide is based on average PM2.5 concentration of all CAAQM stations
operational in the city on a given day. Dotted lines represent a specific CAAQM station of the city to showcase variation in PM2.5
concentrations among city’s numerous CAAQM stations.
Source: CSE analysis of CPCB’s real time air quality data

Centre for Science and Environment Analysis
8
Graph 6d: How hourly pollution changed on Diwali day in Patna
Note: Diwali dates are 27 Oct 2019, and 14 Nov 2020. Citywide is based on average PM2.5 concentration of all CAAQM stations
operational in the city on a given day. Dotted lines represent a specific CAAQM station of the city to showcase variation in PM2.5
concentrations among city’s numerous CAAQM stations.
Source: CSE analysis of CPCB’s real time air quality data
Bad air days started earlier in 2020 winter: The rolling weekly average rose over the 24hr standard or 60 μg/m
3 in Amritsar on October 6 (8 days earlier), Ambala on October 4 (8 days earlier), Lucknow on
September 10 (29 days earlier), and Patna on October 1 (14 days earlier). Overall the winter has been dirtier across. Chandigarh has had a relatively cleaner November with bad air setting in later this year compared to 2019 (See Graph 7: Rate of increase in PM2.5 in a) Amritsar, b) Ambala, c) Lucknow, d) Patna, e) Chandigarh: 2019 vs 2020).
Graph 6a: Rate of increase in PM2.5 in Amritsar: 2019 vs 2020
Note: All values are rolling weekly average. Data: CPCB (PM2.5), IMD (Temperature and rainfall)
Source: CSE analysis

Centre for Science and Environment Analysis
9
Graph 6b: Rate of increase in PM2.5 in Ambala: 2019 vs 2020
Note: All values are rolling weekly average. Data: CPCB (PM2.5), IMD (Temperature and rainfall)
Source: CSE analysis
Graph 6c: Rate of increase in PM2.5 in Lucknow: 2019 vs 2020
Note: All values are rolling weekly average. Data: CPCB (PM2.5), IMD (Temperature and rainfall)
Source: CSE analysis
Graph 6d: Rate of increase in PM2.5 in Patna: 2019 vs 2020
Note: All values are rolling weekly average. Data: CPCB (PM2.5), IMD (Temperature and rainfall)
Source: CSE analysis

Centre for Science and Environment Analysis
10
Graph 6e: Rate of increase in PM2.5 in Chandigarh: 2019 vs 2020
Note: All values are rolling weekly average. Data: CPCB (PM2.5), IMD (Temperature and rainfall)
Source: CSE analysis
Number of days with PM2.5 concentration meeting standard was considerably lower this winter; more poor or worse days: There have been 33 days of standard air days this winter compared to 41 recorded last year in Amritsar. Similarly standard days have been lesser by 11 days in Ambala, 4 days in Lucknow and Patna (See Graph 7: Distribution of days based on PM2.5 concentration and classified according to National Air Quality Index in a) Amritsar, b) Ambala, c) Lucknow, d) Patna, e) Chandigarh during winter (1 Oct –10 Jan) 2019 and 2020). In fact, in Lucknow not a single day met the standard since start of October this winter and 19 days of severe or worse air quality up from 5 days in last winter. Chandigarh bucks the trend and recorded 18 more days this winter with air quality meeting the standard.
Graph 7a: Distribution of days based on PM2.5 concentration and classified according to National Air Quality Index in Amritsar during winter (1 Oct – 10 Jan) 2019 and 2020.
Note: Average PM2.5 concentration for a day is based on single CAAQM station. Source: CSE analysis of CPCB’s realtime air quality data

Centre for Science and Environment Analysis
11
Graph 7b: Distribution of days based on PM2.5 concentration and classified according to National Air Quality Index in Ambala during winter (1 Oct – 10 Jan) 2019 and 2020.
Note: Average PM2.5 concentration for a day is based on single CAAQM station. Source: CSE analysis of CPCB’s realtime air quality data
Graph 7c: Distribution of days based on PM2.5 concentration and classified according to National Air Quality Index in Lucknow during winter (1 Oct – 10 Jan) 2019 and 2020.
Note: Average PM2.5 concentration for a day is based on mean of 3 CAAQM stations of Lucknow. Source: CSE analysis of CPCB’s realtime air quality data
Graph 7d: Distribution of days based on PM2.5 concentration and classified according to National Air Quality Index in Patna during winter (1 Oct – 10 Jan) 2019 and 2020.
Note: Average PM2.5 concentration for a day is based on single CAAQM station at IGSC, Patna. Source: CSE analysis of CPCB’s realtime air quality data

Centre for Science and Environment Analysis
12
Graph 7e: Distribution of days based on PM2.5 concentration and classified according to National Air Quality Index in Chandigarh during winter (1 Oct – 10 Jan) 2019 and 2020.
Note: Average PM2.5 concentration for a day is based on single CAAQM station. Source: CSE analysis of CPCB’s realtime air quality data
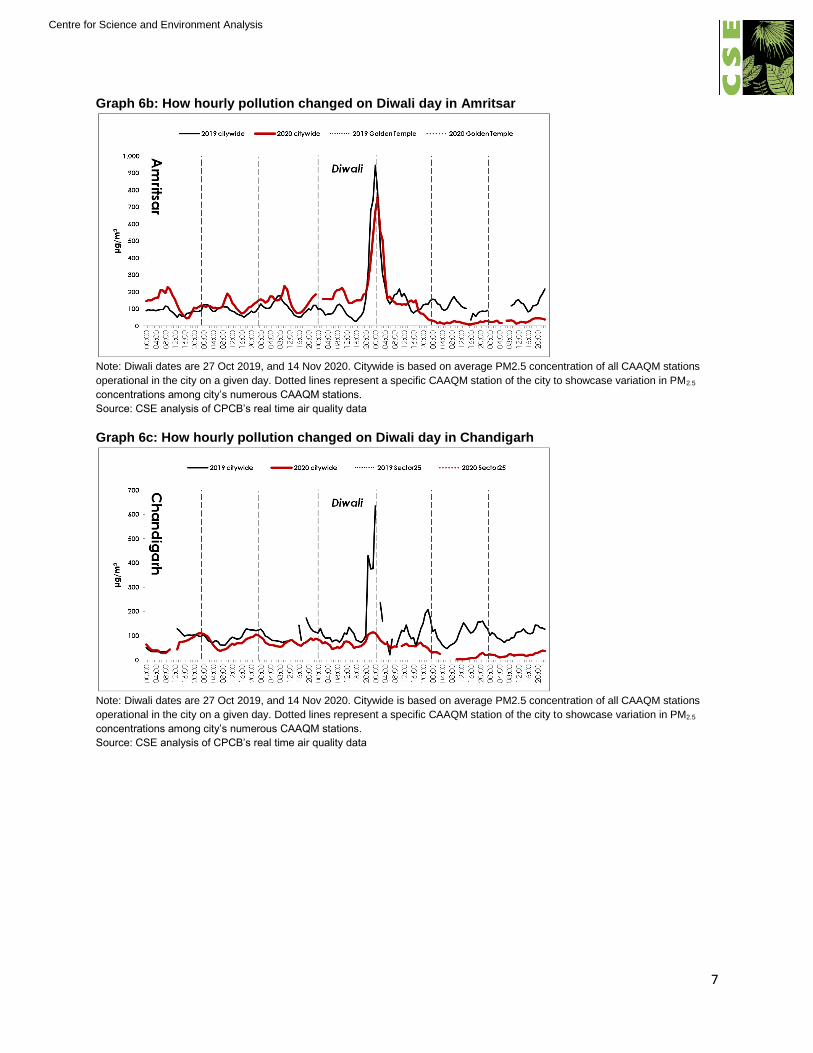
The cyclical ups and down of pollution this winter is less volatile – showing slower rise and fall than pervious winter: This inelastic behavior of PM2.5 levels in IGP cities is in contrast to the trend seen in Delhi-NCR where the trend has been more volatile during winter with frequent quicker rise and drop (See Graph 8: Heatmap of daily PM2.5 concentration in winter a) Amritsar, b) Ambala, c) Lucknow, d) Patna, e) Chandigarh (1 Sept – 21 Dec) of 2018-20). This can’t be the impact of meteorology as Delhi-NCR is exhibiting different trend, therefore it might be due to poor pollution control action among these cities but more investigation is needed to understand the reasons for this.
Graph 8a: Heatmap of Amritsar’s daily PM2.5 concentration in winter (1 Sept – 10 Jan) of 2018, 2019 and 2020
Note: Average PM2.5 concentration for a day is based on a single CAAQM station. Days are colored based on AQI categories. Source: CSE analysis of CPCB’s realtime air quality data
Graph 8b: Heatmap of Ambala’s daily PM2.5 concentration in winter (1 Sept – 10 Jan) of 2019 and 2020
Note: Average PM2.5 concentration for a day is based on a single CAAQM station. Days are colored based on AQI categories. Source: CSE analysis of CPCB’s realtime air quality data

Centre for Science and Environment Analysis
13
Graph 8c: Heatmap of Lucknow’s daily PM2.5 concentration in winter (1 Sept – 10 Jan) of 2018, 2019 and
2020
Note: Average PM2.5 concentration for a day is based on mean of 3 CAAQM stations of Lucknow. Days are colored based on AQI
categories.
Source: CSE analysis of CPCB’s realtime air quality data
Graph 8d: Heatmap of Patna’s daily PM2.5 concentration in winter (1 Sept – 10 Jan) of 2018, 2019 and 2020
Note: Average PM2.5 concentration for a day is based on a single CAAQM station. Days are colored based on AQI categories. Source: CSE analysis of CPCB’s realtime air quality data
Graph 8e: Heatmap of Chandigarh’s daily PM2.5 concentration in winter (1 Sept – 10 Jan) of 2019 and 2020
Note: Average PM2.5 concentration for a day is based on a single CAAQM station. Days are colored based on AQI categories.
Source: CSE analysis of CPCB’s realtime air quality data
Even with comparatively cleaner air during this year, most cities recorded daily spikes similar to those observed in 2019: CSE has compared the annual averages and peak 24hr averages in these cities of IGP between 2019 and 2020. This shows that the smaller towns even with much lower annual average levels of PM2.5 have experienced almost same or higher maximum daily levels during winter

Centre for Science and Environment Analysis
14
when the entire region got air locked (See Graph 9: How annual average and maximum level changed in cities and towns of IGP outside NCR – comparison of 2019 and 2020). Punjab cities have relatively
lower daily peak compared to the rest.
Graph 9: How annual average and maximum level changed in cities and towns of IGP outside NCR – comparison of 2019 and 2020
Note: 2020 numbers are based on data up to 31 Dec 2020. Source: CSE analysis of CPCB’s realtime air quality data
Need deep cuts To avoid winter pollution peaks all cities of Maharashtra will have to reduce the annual average level of pollution to meet the national ambient air quality standards and even bring it further down to be closure to health based guidelines of the World Health Organisation. How the pollution level will play out during the rest of the winter remains to be seen. But it is clear that the region has to take forward its wins so far and raise the level of ambition to drive action across all key sectors of pollution and in the entire region. Enforce power plant standards across the state, minimise use of coal and other dirt fuels in the industry while improving emissions control, scale up public transport and vehicle restraint measures and manage waste to have a zero waste and zero landfill strategy.
Centre for Science and Environment Analysis
15
Annexures: Heatmap of other cities
Graph 8f: Heatmap of Bhatinda’s daily PM2.5 concentration in winter (1 Sept – 10 Jan) of 2018, 2019
and 2020
Note: Average PM2.5 concentration for a day is in μg/m3. Days are colored based on AQI categories, grey cells represent no valid
data for that day. Source: CSE analysis of CPCB’s realtime air quality data
Graph 8g: Heatmap of Jalandhar’s daily PM2.5 concentration in winter (1 Sept – 10 Jan) of 2018,
2019 and 2020
Note: Average PM2.5 concentration for a day is in μg/m3 and is based on mean of two CAAQM stations in the city. Days are colored
based on AQI categories, grey cells represent no valid data for that day. Source: CSE analysis of CPCB’s realtime air quality data
Centre for Science and Environment Analysis
16
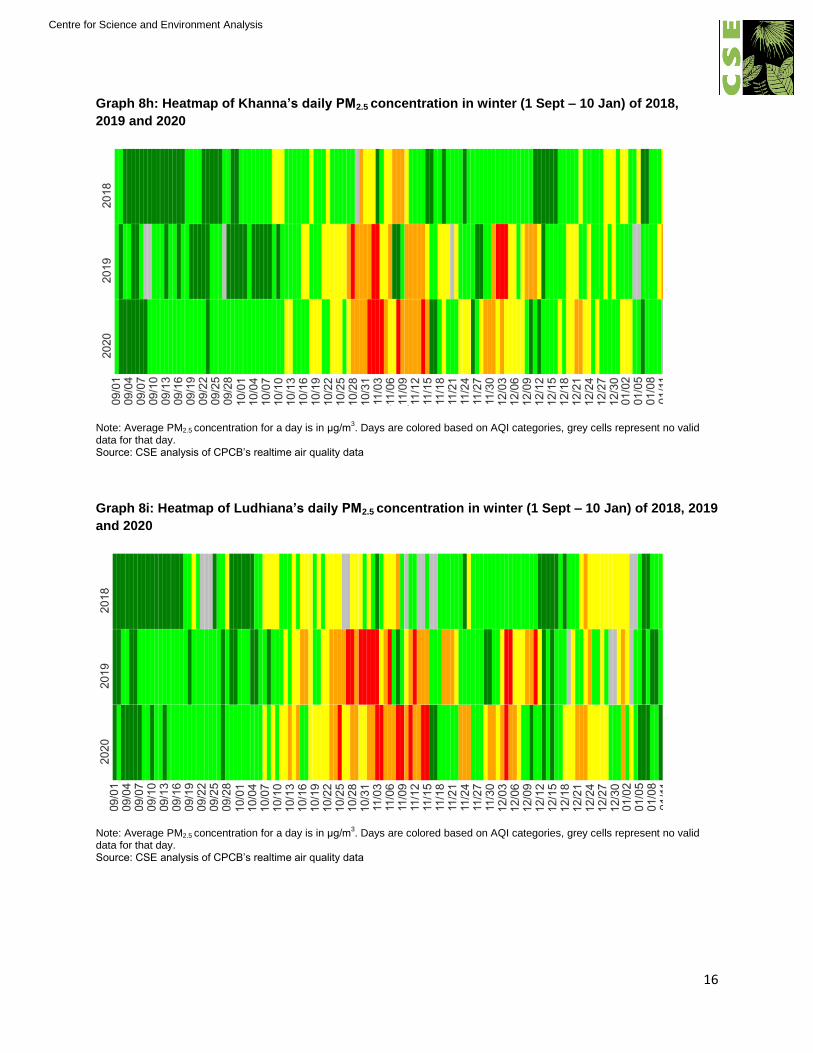
Graph 8h: Heatmap of Khanna’s daily PM2.5 concentration in winter (1 Sept – 10 Jan) of 2018,
2019 and 2020
Note: Average PM2.5 concentration for a day is in μg/m3. Days are colored based on AQI categories, grey cells represent no valid
data for that day. Source: CSE analysis of CPCB’s realtime air quality data
Graph 8i: Heatmap of Ludhiana’s daily PM2.5 concentration in winter (1 Sept – 10 Jan) of 2018, 2019
and 2020
Note: Average PM2.5 concentration for a day is in μg/m3. Days are colored based on AQI categories, grey cells represent no valid
data for that day. Source: CSE analysis of CPCB’s realtime air quality data

Centre for Science and Environment Analysis
17
Graph 8j: Heatmap of Mandi Gobindgarh’s daily PM2.5 concentration in winter (1 Sept – 10 Jan)
of 2018, 2019 and 2020
Note: Average PM2.5 concentration for a day is in μg/m3. Days are colored based on AQI categories, grey cells represent no valid
data for that day. Source: CSE analysis of CPCB’s realtime air quality data
Graph 8k: Heatmap of Patiala’s daily PM2.5 concentration in winter (1 Sept – 10 Jan) of 2018, 2019
and 2020
Note: Average PM2.5 concentration for a day is in μg/m3. Days are colored based on AQI categories, grey cells represent no valid
data for that day. Source: CSE analysis of CPCB’s realtime air quality data

Centre for Science and Environment Analysis
18
Graph 8l: Heatmap of Rupnagar’s daily PM2.5 concentration in winter (1 Sept – 10 Jan) of 2018,
2019 and 2020
Note: Average PM2.5 concentration for a day is in μg/m3. Days are colored based on AQI categories, grey cells represent no valid
data for that day. Source: CSE analysis of CPCB’s realtime air quality data
Graph 8m: Heatmap of Fatehabad’s daily PM2.5 concentration in winter (1 Sept – 10 Jan) of 2019
and 2020
Note: Average PM2.5 concentration for a day is in μg/m3. Days are colored based on AQI categories, grey cells represent no valid
data for that day. Source: CSE analysis of CPCB’s realtime air quality data

Centre for Science and Environment Analysis
19
Graph 8n: Heatmap of Hisar’s daily PM2.5 concentration in winter (1 Sept – 10 Jan) of 2019 and
2020
Note: Average PM2.5 concentration for a day is in μg/m3. Days are colored based on AQI categories, grey cells represent no valid
data for that day. Source: CSE analysis of CPCB’s realtime air quality data
Graph 8o: Heatmap of Kaithal’s daily PM2.5 concentration in winter (1 Sept – 10 Jan) of 2019 and
2020
Note: Average PM2.5 concentration for a day is in μg/m3. Days are colored based on AQI categories, grey cells represent no valid
data for that day. Source: CSE analysis of CPCB’s realtime air quality data
Graph 8p: Heatmap of Kurukshetra’s daily PM2.5 concentration in winter (1 Sept – 10 Jan) of 2018,
2019 and 2020
Note: Average PM2.5 concentration for a day is in μg/m3. Days are colored based on AQI categories, grey cells represent no valid
data for that day. Source: CSE analysis of CPCB’s realtime air quality data

Centre for Science and Environment Analysis
20
Graph 8q: Heatmap of Panchkula’s daily PM2.5 concentration in winter (1 Sept – 10 Jan) of 2018,
2019 and 2020
Note: Average PM2.5 concentration for a day is in μg/m3. Days are colored based on AQI categories, grey cells represent no valid
data for that day. Source: CSE analysis of CPCB’s realtime air quality data
Graph 8r: Heatmap of Sirsa’s daily PM2.5 concentration in winter (1 Sept – 10 Jan) of 2018, 2019
and 2020
Note: Average PM2.5 concentration for a day is in μg/m3. Days are colored based on AQI categories, grey cells represent no valid
data for that day. Source: CSE analysis of CPCB’s realtime air quality data

Centre for Science and Environment Analysis
21
Graph 8s: Heatmap of Yamuna Nagar’s daily PM2.5 concentration in winter (1 Sept – 10 Jan) of
2019 and 2020
Note: Average PM2.5 concentration for a day is in μg/m3. Days are colored based on AQI categories, grey cells represent no valid
data for that day. Source: CSE analysis of CPCB’s realtime air quality data
Graph 8t: Heatmap of Agra’s daily PM2.5 concentration in winter (1 Sept – 10 Jan) of 2018, 2019 and
2020
Note: Average PM2.5 concentration for a day is in μg/m3. Days are colored based on AQI categories, grey cells represent no valid
data for that day. Source: CSE analysis of CPCB’s realtime air quality data

Centre for Science and Environment Analysis
22
Graph 8u: Heatmap of Kanpur’s daily PM2.5 concentration in winter (1 Sept – 10 Jan) of 2018,
2019 and 2020
Note: Average PM2.5 concentration for a day is in μg/m3. Days are colored based on AQI categories, grey cells represent no valid
data for that day. Source: CSE analysis of CPCB’s realtime air quality data
Graph 8v: Heatmap of Moradabad’s daily PM2.5 concentration in winter (1 Sept – 10 Jan) of 2018,
2019 and 2020
Note: Average PM2.5 concentration for a day is in μg/m3. Days are colored based on AQI categories, grey cells represent no valid
data for that day.
Source: CSE analysis of CPCB’s realtime air quality data

Centre for Science and Environment Analysis
23
Graph 8w: Heatmap of Varanasi’s daily PM2.5 concentration in winter (1 Sept – 10 Jan) of 2018,
2019 and 2020
Note: Average PM2.5 concentration for a day is in μg/m3. Days are colored based on AQI categories, grey cells represent no valid
data for that day.
Source: CSE analysis of CPCB’s realtime air quality data
Graph 8x: Heatmap of Gaya’s daily PM2.5 concentration in winter (1 Sept – 10 Jan) of 2018, 2019
and 2020
Note: Average PM2.5 concentration for a day is in μg/m3. Days are colored based on AQI categories, grey cells represent no valid
data for that day.
Source: CSE analysis of CPCB’s realtime air quality data

Centre for Science and Environment Analysis
24
Graph 8y: Heatmap of Muzaffarpur’s daily PM2.5 concentration in winter (1 Sept – 10 Jan) of
2018, 2019 and 2020
Note: Average PM2.5 concentration for a day is in μg/m3. Days are colored based on AQI categories, grey cells represent no valid
data for that day.
Source: CSE analysis of CPCB’s realtime air quality data

Centre for Science and Environment Analysis
25
List of CAAQM stations used in the study
State City Station Name
1 Bihar
Gaya 1 Collectorate, Gaya - BSPCB
2 SFTI Kusdihra, Gaya - BSPCB
Hajipur 1 Industrial Area, Hajipur - BSPCB
Muzaffarpur 1 Muzaffarpur Collectorate, Muzaffarpur - BSPCB
2 Buddha Colony, Muzaffarpur - BSPCB
Patna
1 IGSC Planetarium Complex, Patna - BSPCB
2 Muradpur, Patna - BSPCB
3 Samanpura, Patna - BSPCB
4 Rajbansi Nagar, Patna - BSPCB
5 DRM Office Danapur, Patna - BSPCB
6 Govt. High School Shikarpur, Patna - BSPCB
2 Chandigarh Chandigarh 1 Sector-25, Chandigarh - CPCC
3 Haryana
Ambala 1 Patti Mehar, Ambala - HSPCB
Fatehabad 1 Huda Sector, Fatehabad - HSPCB
Hisar 1 Urban Estate-II, Hisar - HSPCB
Kaithal 1 Rishi Nagar, Kaithal - HSPCB
Kurukshetra 1 Sector-7, Kurukshetra - HSPCB
Panchkula 1 Sector-6, Panchkula - HSPCB
Sirsa 1 F-Block, Sirsa - HSPCB
Yamunanagar 1 Gobind Pura, Yamuna Nagar - HSPCB
4 Punjab
Amritsar 1 Golden Temple, Amritsar - PPCB
Bathinda 1 Hardev Nagar, Bathinda - PPCB
Jalandhar 1 Civil Line, Jalandhar - PPCB
Khanna 1 Kalal Majra, Khanna - PPCB
Ludhiana 1 Punjab Agricultural University, Ludhiana - PPCB
Mandigobindgarh 1 RIMT University, Mandi Gobindgarh - PPCB
Patiala 1 Model Town, Patiala - PPCB
Rupnagar 1 Ratanpura, Rupnagar - Ambuja Cements
5 Uttar_Pradesh
Agra 1 Sanjay Palace, Agra - UPPCB
Kanpur 1 Nehru Nagar, Kanpur - UPPCB
Lucknow
1 Talkatora District Industries Center, Lucknow - CPCB
2 Central School, Lucknow - CPCB
3 Lalbagh, Lucknow - CPCB
4 Nishant Ganj, Lucknow - UPPCB
5 Gomti Nagar, Lucknow - UPPCB
Muradabad 1 Lajpat Nagar, Moradabad - UPPCB
Varanasi 1 Ardhali Bazar, Varanasi - UPPCB