Embed Size (px)
Citation preview

Decoding the genome with an integrative analysistool: Combinatorial CRM DecoderKeunsoo Kang1,*, Joomyeong Kim2, Jae Hoon Chung1 and Daeyoup Lee1,*
1Department of Biological Sciences, Korea Advanced Institute of Science and Technology, 335 Gwahak-ro,Yuseong-gu, Daejeon 305-701, South Korea and 2Department of Biological Sciences, Louisiana StateUniversity, Baton Rouge, LA 70803, USA
Received February 14, 2011; Revised May 31, 2011; Accepted June 9, 2011
ABSTRACT
The identification of genome-wide cis-regulatorymodules (CRMs) and characterization of their asso-ciated epigenetic features are fundamental stepstoward the understanding of gene regulatory net-works. Although integrative analysis of availablegenome-wide information can provide new biologic-al insights, the lack of novel methodologies hasbecome a major bottleneck. Here, we present a com-prehensive analysis tool called combinatorial CRMdecoder (CCD), which utilizes the publicly availableinformation to identify and characterize genome-wide CRMs in a species of interest. CCD first definesa set of the epigenetic features which is significantlyassociated with a set of known CRMs as a codecalled ‘trace code’, and subsequently uses the tracecode to pinpoint putative CRMs throughout the gen-ome. Using 61 genome-wide data sets obtained from17 independent mouse studies, CCD successfullycatalogued �12 600 CRMs (five distinct classes)including polycomb repressive complex 2 target sitesas well as imprinting control regions. Interestingly,we discovered that �4% of the identified CRMsbelong to at least two different classes named‘multi-functional CRM’, suggesting their functionalimportance for regulating spatiotemporal gene ex-pression. From these examples, we show that CCDcan be applied to any potential genome-widedatasets and therefore will shed light on unveilinggenome-wide CRMs in various species.
INTRODUCTION
A cis-regulatory module (CRM) is a short DNA fragmentwhich governs spatial and temporal expression of nearby
genes by interacting with transcription factors (TFs) (1,2).As the basic unit of the gene regulatory network (3,4), theCRM contains multiple transcription factor binding sites(TFBSs) to which a set of TFs binds as an input signal (5–8).Deciphering the relationship between CRMs and asso-ciated input signals is a fundamental step toward under-standing the precise mechanisms of these gene regulatorynetworks.Owing to the popularity of the ChIP-seq method, which
generates a snapshot of genome-wide DNA–protein inter-actions in high resolution, genome-wide occupancy profilesof various TFs and histone modifications have accumu-lated in public data repositories such as the gene expres-sion omnibus (GEO, http://www.ncbi.nlm.nih.gov/geo/)and UCSC genome browser (http://genome.ucsc.edu/).These ChIP-seq datasets may be an ideal source for iden-tifying CRMs since the multiple TFBSs are thought torepresent locations of particular CRMs (9). In this regard,recent studies have accurately predicted tissue-specificCRMs (enhancers) using a few ChIP-seq data sets (10,11),or endeavored to achieve some improvement in CRMprediction with machine learning algorithms (12,13).However, these studies used only a handful of data sets,and their methodologies are not well established to be ap-plicable to other available genome-wide data sets in anunbiased manner.To illustrate the great potential inherent in the integra-
tive analysis of genome-wide data sets, we have developeda comprehensive analysis tool for identifying genome-wideCRMs in a species of interest, called combinatorial CRMdecoder (CCD). The feasibility of CCD is assessed in thisstudy by using nine types of known CRMs (training sets)and 61 feature sets (genome-wide occupancy profiles of 39TFs and 19 histone modifications in various cell types aswell as three computational annotations) that are obtainedfrom 17 independent mouse studies. We validated theCCD algorithm in various aspects and demonstrated keyfeatures of CCD.
*To whom correspondence should be addressed. Tel: +82 42 350 2623; Fax: +82 42 350 2610; Email: [email protected] may also be addressed to Keunsoo Kang. Tel: +82 42 350 2663; Fax: +82 42 350 2610; Email: [email protected]
Published online 30 June 2011 Nucleic Acids Research, 2011, Vol. 39, No. 17 e116doi:10.1093/nar/gkr516
� The Author(s) 2011. Published by Oxford University Press.This is an Open Access article distributed under the terms of the Creative Commons Attribution Non-Commercial License (http://creativecommons.org/licenses/by-nc/3.0), which permits unrestricted non-commercial use, distribution, and reproduction in any medium, provided the original work is properly cited.
at KO
RE
A A
DV
AN
CE
D IN
ST O
F SCIE
NC
E A
ND
TE
CH
NO
LO
GY
on August 25, 2016
http://nar.oxfordjournals.org/D
ownloaded from

MATERIALS AND METHODS
CCD tutorials and additional information can be found inthe website (http://decode.kaist.ac.kr/).
CCD
CCD is a stand-alone program running on Windows,Linux and Mac OS. The executable versions and itssource code can be downloaded freely at the website(http://decode.kaist.ac.kr/).
Definition of the context
CCD requires a single Refseq file of a species of interestfor defining genomic context. The genome is divided intofive sections (‘upstream’, ‘promoter’, ‘genebody’, ‘down-stream’ and ‘intergenic’) based on transcription start sitesof genes. The knowledge of the context is further used togenerate pseudo sets. More detailed information about thecontext is well-described in Supplementary Figure S1A.
Input data sets
CCD requires training sets and feature sets as inputs. Thetraining set (‘trainingset’ directory) is a collection ofknown CRMs, function of which has known a priori.The feature set comprises two types of genome-widedatasets: experimental-driven sets and annotation setswhich are stored in the ‘chipseq’ and ‘annotation’ directo-ries, respectively. We did not manipulate the raw data setsand only used the processed data sets which have alreadybeen confirmed in the original papers. The annotation setcontains genome coordinates of the same type of elementspredicted via computational approaches such as CpGislands and conservation. CCD only needs position infor-mation of elements, thereby adopting the BED format asthe standard format (http://decode.kaist.ac.kr/). Allinputs and the Refseq file should be in the same versionof genome assembly.In the present study, the feature sets were selected if
they met one of the following criteria.
(1) The feature has been reported to be associated withany of the training sets.
(2) The enriched regions of the feature have beenprovided as an additional file.
Total 58 genome-wide ChIP-seq and three annotationdata sets were collected from the literature and used asfeature sets. Full list of the feature sets and referencescan be found in Supplementary Table S1.
CCD score
Each feature set contains the genome coordinates ofelements. In case of the ChIP-seq data sets used in thepresent study, the average length ranged from 10 to7894 bp, and the number of the elements varied from446 to 48 670. Most features (90%, 53 out of 58) showed<0.04-fold genome coverage. These observations suggestthat the occurrences of the features would be very rare.Therefore, CCD assumes that distribution of the featuresfollows the negative binomial distribution. Each signifi-cant feature is scored with the CCD score Sccd, which is
based on cumulative probabilities from the negativebinomial distribution Pnb as well as normalized occurrencerate Onorm. To calculate the cumulative probabilities Pnb,the ‘pnbinom’ function in the Perl module (Math-CDF-0.1, http://search.cpan.org/�callahan/Math-CDF-0.1/)has been incorporated into CCD. Detailed procedure forthe calculation is described in Supplementary Figure S1B.The normalized occurrence rate Onorm is estimated as thedifference between the occurrences of the feature and thepseudo-feature in the training set, and further divided bythe total number of the training set. Finally, the CCDscore Sccd is calculated as follows:
Sccd ¼ � logðPnbÞ �Onorm
Ensembl regulatory build database
Ensembl regulatory build database (Mouse RegulatoryBuild version 4) was downloaded from the website(www.ensembl.org). The database comprises of a total of140 603 unique clusters which are bound (or enriched) byat least one of the following 27 epigenetic features—CTCF, c-MYC, E2F1, ESRRB, KLF4, NANOG,n-MYC, OCT4, STAT3, SMAD1, SOX2, SUZ12,TCFCP2L1, ZFX, p300 and DNase1 in ES cells;H3K4me3, H3K9me3 and H3K36me3 in ES hybridcells; H3K4me3, H3K9me3, H3K27me3 and H3K36me3in NPC (or MEF). To get likely regulatory clusters, weonly used the clusters which contain more than three ofthe above epigenetic features. For comparison, we con-verted their genome coordinates into mm8 genomeassembly by using the liftOver tool (http://genome.ucsc.edu/). A total of 17 562 regulatory clusters were definedand used for comparison analysis.
VISTA enhancer database
We downloaded 745 experimentally validated enhancers(‘positive’ status) from the VISTA enhancer browser(http://enhancer.lbl.gov). These enhancers were used as aconfirmed set for the performance comparison.
RESULTS
Algorithm for the combinatorial CRM decoder
For an analysis, CCD requires the following two types ofinformation for inputs, sets of known CRMs in the samefunctional category (training sets) and genome-wide datasets of epigenetic features (feature sets). An epigeneticfeature refers to one of the followings; a transcriptionfactor, a histone modification or a computational annota-tion such as CpG islands. To integrate a wide assortmentof the feature sets, CCD digitizes binding profiles of thefeatures as one of two digits, either 0 (absence) or 1(presence). The digitized information is the basic dataused in CCD (Figure 1A, blue box). The CRMsfunction by interacting with designated TFs and are alsoassociated with histone modifications (2,14). Therefore,each epigenetic feature that is significantly shared by theCRMs in a training set can be interpreted as a ‘trace’. Bydefining the set of the traces as ‘trace code’ representing
e116 Nucleic Acids Research, 2011, Vol. 39, No. 17 PAGE 2 OF 13
at KO
RE
A A
DV
AN
CE
D IN
ST O
F SCIE
NC
E A
ND
TE
CH
NO
LO
GY
on August 25, 2016
http://nar.oxfordjournals.org/D
ownloaded from

the characteristics of the training set, CCD identifiesgenome-wide CRMs due to these ‘genome-wide’properties of the feature sets. In summary, CCD firstdefines the trace code of each training set, and subse-quently uses the trace codes to detect putative CRMs inthe genome (Figure 1A).
The elements of inputs (training sets and feature sets)may substantially vary in lengths and numbers in general.To define the traces, an approach filtering out randomlyoccurred features is essential. Thus, CCD uses theMatthews correlation coefficient (MCC) which takesinto account true and false positives and negatives ofpeaks (a, b, c and d in Step 2, Figure 1A). MCC is abalanced measure which can be used regardless of differ-ent sizes (15). To estimate MCCs of features, CCD gener-ates pseudo sets by random sampling. The conventionalrandom sampling method randomly selects regions fromthe entire genome. However, this approach may not be
appropriate based on the observations that about half ofthe genome corresponds to the intergenic regions and thetraining sets show varying degrees of genomic context(Figure 1B). Therefore, we adopted a novel samplingmethod called context-dependent random sampling(CDRS). The CDRS method empirically constructspseudo sets (0.1% genome coverage for the training setand the same number of instances with the feature set), thecontext of which is similar to the training set and featureset. Then, the pseudo sets are used to generate a confusiontable (Figure 1A, Steps 1 and 2). To test whether thisapproach can be reliable in various circumstances, wegenerated more than 120 000 random training sets in dif-ferent numbers (10–15 000; the typical number of elementsfor the training set), lengths and contexts. The randomtraining sets were evaluated with 61 different featuresets. The result showed that almost all of the features’MCC values are <0.15 (Figure 1C), and therefore the
Figure 1. Overview of the CCD algorithm. CCD requires training sets and feature sets for analysis. (A) For the feature sets, CCD uses processedgenome-wide data sets (BED format) obtained from the literature (see ‘Materials and Methods’ section). Clusters are defined as regions wherefeatures are located within a user-defined interval. Occurrence of each feature in a cluster is encoded as bits (‘0’ for absence and ‘1’ for presence) (bluebox). With this scheme, CCD generates pseudo sets to calculate the Matthews correlation coefficient (MCC) of each feature and further definessignificant features (traces) (Step 1–3) (see ‘Materials and Methods’ section). Once the trace code has been established (Step 4), putative CRMs canbe identified by searching the entire genome for the clusters where the calculated scores are above the cutoff score (Step 5). (B) The context of thetraining sets used in the present study differs in varying degrees. Therefore, CCD generates pseudo sets according to the context of the given set.(C) A total of 120 000 control sets were randomly generated and used as training sets. Each spot denotes the maximum MCC value. Due to unevendistribution of peaks, MCC values of some random sets (�0.2%) occasionally are >0.15 but their CCD scores are <1 which hardly affect finaloutcome. These non-significant features are not shown.
PAGE 3 OF 13 Nucleic Acids Research, 2011, Vol. 39, No. 17 e116
at KO
RE
A A
DV
AN
CE
D IN
ST O
F SCIE
NC
E A
ND
TE
CH
NO
LO
GY
on August 25, 2016
http://nar.oxfordjournals.org/D
ownloaded from

features greater than or equal to 0.15 will be regarded assignificant features (traces).Once the traces are defined, a measure which estimates
the relative level of the traces’ significance is required.Thus, the CCD score has been created. The CCD scoreis calculated using the cumulative probabilities fromthe negative binomial distribution, and the normalized oc-currence rate which is empirically estimated for each trace(Figure 1A and Supplementary Figure S1B; see ‘Materialsand Methods’ section). These traces and associated CCDscores are called ‘trace code’ and further used to identifygenome-wide putative CRMs (Figure 1A, Step 4).With the trace code, CCD scans the entire genome to
identify clusters showing similar patterns of the traces asthe training set. As a supervised approach, CCD first sumsall CCD scores of the traces in each CRM and arrangesthe CRMs by the calculated scores. Then, a cutoffscore is set by using the user-defined ‘prTHR’ parameter(Figure 1A, Step 5). Finally, CCD searches the entiregenome for clusters where the sum of CCD scores of thetraces is above the cutoff score and consequently definesthem as putative CRMs (Figure 1A, Step 5; SupplementaryFigure S1C). With this strategy, users can take advantageof the ‘prTHR’ parameter to adjust the expected level ofvalidation and putative CRMs prior to run. For example,when prTHR is set to 20, the result always includes 80%(100–20) of CRMs in a training set (which automaticallyvalidates the model) as well as putative CRMs which con-tain traces similar to those found in the given training set.In this way, users can obtain putative CRMs with acertain confidence compared with the training sets.In sum, CCD requires sets of known CRMs (training
sets) and genome-wide data sets (feature sets) for analysis.CCD first defines trace codes of the training sets and sub-sequently searches the entire genome for the clustersshowing similar trace codes which is controlled by theuser-defined ‘prTHR’. Theses clusters are designated asputative CRMs. To gain biological insights of the identi-fied CRMs, the CCD outputs are specifically designed forthe available related tools such as R, GREAT and UCSCgenome browser (Figure 2).
Trace codes represent the properties of cis-regulatorymodules
The prominent advantage of CCD is that any kind of epi-genetic features can be evaluated as to whether or notthey are significantly associated with particular types ofCRMs. To demonstrate the key features of CCD, varioustypes of known CRMs were obtained from five independ-ent studies and used as training sets (Table 1). For fea-ture sets, the following genome-wide data sets wereselected to assess the reliability of the CCD algorithm invarious aspects. First, 25 epigenetic features were collectedfrom the same studies of the training sets to validate thetrace code system (10,11,16–18). Second, 10 epigeneticfeatures (at least two independent sets of Ezh2, Jarid2,Suz12 and H3K27me3 in ES cells) were chosen to confirmthe unbiased performance of CCD (16–20). Third, fivegenome-wide binding profiles of enhancer-associatedprotein p300, each from ES cells, embryo tissues
(forebrain, midbrain and limb) and adult liver, wereincluded to assess whether target CRMs of the p300 arealtered in different cell types (10,17,21). Furthermore, anadditional 21 epigenetic features including transcriptionfactors, histone modifications and computational annota-tions were also evaluated (16–27). Total nine training setsand 61 feature sets were analyzed in the current study(Supplementary Table S1).
Even with a wide assortment of the feature sets, CCDsuccessfully identified 23 (Nanog MTL), 26 (ncMycMTL), 17 (Other MTL), 12 (ES enhancer), 13 (CNenhancer), 10 (Embryo enhancer), 4 (ICR), 23 (Jarid2target) and 26 (Jarid1a target) traces in the training sets(Supplementary Table S2 and Spreadsheet 1 inSupplementary Data). To validate the defined trace codes,the traces were compared with the known featuresdescribed in the original studies of the training sets. Asexpected, CCD successfully detected all previously knownfeatures (100%, 29/29) as parts of the trace codesillustrating that the reliability of the trace code system issatisfactory (Figure 3A and Supplementary Table S2).
The quality and number of peaks in feature sets mayvary depending on which programs (algorithms) are used.The addition of weak peaks may influence the outcome ofthe CCD algorithm. To evaluate the effect of additionalweak peaks, we generated three or four different sets ofJarid1a (negative control), Jarid2, Ezh2 and Suz12 fromthe same original raw data (GSE18776) by using MACSwith different P-value thresholds (1E-03, 1E-05, 1E-07 and1E-09), and analyzed them with the Jarid2 target (TR8)set. Since CCD filters out non-significant features efficient-ly by using the MCC value, all of the Jarid1a sets were notincluded in the trace code (Figure 3B). In case of theJarid2, Ezh2 and Suz12 sets which are the traces for theJarid2 target set, the sets consisting of <40 000 peaks were
Figure 2. Outline of CCD framework. CCD requires two inputs,training sets and feature sets. With the inputs, CCD first definestrace codes for the training sets. Then, it scans the entire genome toidentify putative CRMs by using the trace codes. CCD outputs can beanalyzed with the following available tools; R (heatmap, http://www.r-project.org/), GREAT (functional annotation, http://great.stanford.edu/) and UCSC genome browser (visualization, http://genome.ucsc.edu/). Additional information can be found in the webpage (http://decode.kaist.ac.kr/).
e116 Nucleic Acids Research, 2011, Vol. 39, No. 17 PAGE 4 OF 13
at KO
RE
A A
DV
AN
CE
D IN
ST O
F SCIE
NC
E A
ND
TE
CH
NO
LO
GY
on August 25, 2016
http://nar.oxfordjournals.org/D
ownloaded from

still regarded as traces. Although the number of predictedCRMs was increased as the additional weak peaks wereincluded, the quality of the predicted CRMs can becontrolled by using the ‘prTHR’. For example, totals of4512 and 7890 putative CRMs were predicted by using the‘1E-09’ and ‘1E-07’ sets with default settings, respectively.By adjusting the ‘prTHR’, 98.8% (4457) of the putativeCRMs in the former result was identified with the latterset. These results showed that the CCD algorithm is
tolerable to the variations of peak numbers within atypical range (<40 000), and the addition of weak peaksresults in an increase in the number of putative CRMs. Ingeneral, we recommend users to use <40 000 peaks for asingle ChIP-seq data set. More number of peaks can beused only if users have confidence that weak peaks are alsogenuine binding regions of protein.The trace code, a combination of significant features,
can reflect the relationship between a particular type of
Figure 3. CCD identified all previously reported features (Supplementary Table S2) as parts of the trace codes for the training sets. (A) Thesignificant features were weighted with CCD scores. (B) Several sets of Jarid1a, Jarid2, Ezh2 and Suz12, which contain different numbers ofpeaks, were obtained from the same original raw set (GSE18776) by using MACS. The MCC values of the sets were plotted. Unfilled marksand filled marks denote original sets and newly generated sets, respectively. Black marks indicate non-significant feature sets.
Table 1. List of the training sets
ID Name Description Property Count Avg. bp Ref.
TR1 Nanog MTL MTL in mouseembryonic stem cells
(Nanog-Oct4-Sox2) clusters 1554 218 17TR2 ncMyc MTL Myc-specific (n-Myc or c-Myc) clusters 1178 223TR3 Other MTL Other clusters 255 229TR4 ES enhancer Enhancers ES enhancer 25 357TR5 CN enhancer Neuronal activity-regulated enhancer 12 631 1000 11TR6 Embryo enhancer Mixture of embryonic forebrain,
midbrain and limb tissues specific enhancers75 1163 10
TR7 ICR ICRs Putative or verified imprinting control regions 20 6619 16TR8 Jarid2 target Jarid2 binding sites Jarid2 binding sites near promoters 1393 3601 18TR9 Jarid1a target Jarid1a binding sites Jarid1a binding sites near promoters 2443 934
ES, embryonic stem cell; CN, cortical neuron; Other, E2f1, Esrrb, Klf4, Smad1, Stat3, Tcfcp2l1, Zfx.
PAGE 5 OF 13 Nucleic Acids Research, 2011, Vol. 39, No. 17 e116
at KO
RE
A A
DV
AN
CE
D IN
ST O
F SCIE
NC
E A
ND
TE
CH
NO
LO
GY
on August 25, 2016
http://nar.oxfordjournals.org/D
ownloaded from

CRMs and features. For instance, recent studies havedemonstrated that Jarid2 is a novel subunit of the poly-comb repressive complex 2 (PRC2) (18,20,28,29). By usingthe Jarid2 target set (comprising 1393 binding sites ofJARID2 protein) and 61 feature sets as inputs, CCD in-variably pinpoints the associated epigenetic features ofPRC2—the components of PRC2 (Jarid2, Suz12 andEzh2), a component of polycomb repressive complex 1(Ring1B), histone modifications (H3K27me3, H3K4me2and H3K4me3), CpG islands and Eset as the tracecode, whereas none of the other features are included(Figure 3A and Supplementary Table S2). Since most ofthe traces except Eset are known to be components orassociated features of PRC2 (28–32), the result demon-strates the unbiased algorithm of CCD and furtherstrengthens the connection between Jarid2 and PRC2.Thus, we designated the Jarid2 target set as PRC2 targetset. In case of the enhancer sets (TR4, TR5 and TR6),enhancer-associated histone modifications (H3K4me1 orH3K4me2) are defined as parts of the trace codes consist-ent with the previous reports (11,14). Intriguingly, eachtype of enhancer is only related to p300 in the same celltype of the enhancer set, suggesting that target enhancersof p300 may vary with different cell types (SupplementaryTable S2).In addition, the trace code is capable of explaining some
biological questions as well. For instance, TBX3 and theorphan nuclear receptor NR5A2 (also known as LRH-1)have been reported to share binding targets with OCT4(also known as POU5F1), SOX2, NANOG, SMAD1 andESRRB (26,27,33). Our integrative analysis via CCDsimply reveals that the Nanog MTL set (TR1) is signifi-cantly occupied by all the above factors as well asTCFCP2L1, KLF4, E2F1, STAT3, p300, CTCF andactive histone modifications (H3K4me1, H3K4me2 andH3K4me3) in ES cells (Supplementary Table S2).Therefore, the result implies that the known property ofNR5A2 and TBX3, which enhance reprogramming effi-ciency, can be explained by the extensive binding of theNR5A2 and TBX3 to the Nanog MTLs (35.7 and 10.9%of the CRMs) (Spreadsheet 1 in Supplementary Data).The great advantage of the trace code system is that it
can discover unnoticed connections between CRMs andepigenetic features. For instance, imprinting control re-gions (ICRs) controlling monoallelic expression of genesin the imprinted domains can be regarded as CRMs (34–36).There is growing evidence that repressive (H3K9me3 andH4K20me3) histone modifications are enriched at theICRs in an allele-specific manner (37,38). However, thisis based on observations from a small fraction of theICRs. To validate the above facts and identify unnoticedepigenetic features possibly associated with the ICRs, a set(TR7) of twenty ICRs was analyzed with 61 features byusing CCD. Surprisingly, the analysis reveals that the fol-lowing epigenetic features are extensively enriched at mostICRs in ES cells—H4K20me3 (18/20), H3K9me3 (17/20)and Eset (18/20) (Spreadsheet 1 in Supplementary Data).In addition, manual investigation of the ICRs confirmedthat the Sgce-Peg10 and Rasgrf1 domains also containhigh enrichment of the H3K9me3 and H4K20me3 in theES cells (Supplementary Figures S2O and P), suggesting
that the processed ChIP-seq data missed these marks dueto the algorithm of peak identification (16). Notably, thehistone H3 Lys 9 methyltransferase ESET, which wasreported to bind to 15 ICRs in ES cells (25), turned outto be enriched at 18 ICRs with the above histone modifi-cations (Supplementary Figures S2 and S3). Basedon these observations, we propose that H3K9me3,H4K20me3 and Eset are the key epigenetic featuresassociated with the ICRs in the early-stage embryo (EScells).
Overall, these results strongly suggest that the tracecode can represent the unique characteristics of certaintypes of CRMs.
Identification and characterization of genome-widecis-regulatory modules
To specify the training sets with the defined trace codes,heatmap analysis was performed by using R with the CCDoutput. We also analyzed three randomly subsampled setsfrom the original training sets. The result indicates thatsome training sets may belong to the same functionalclasses according to the similar patterns of the tracecodes (Figure 4). All of the subsampled sets show almostsimilar trace codes with the originals implying that thevariation of number of instances is marginal. Based onthe dendrogram in the heatmap, the following trainingsets are regarded as distinct classes; Nanog MTL (multitranscription factor-binding loci) (class I), embryo enhan-cer (class II), ICR (class III), ncMyc MTL (class IV) andPRC2 target (class V) sets.
With the defined trace codes, CCD is able to identifygenome-wide putative CRMs. To catalogue genome-wideCRMs with high confidence, we empirically determined acutoff score (prTHR) for each class to contain similaroccurrence of significant features as compare to that onthe given known CRMs (R2> 0.75) (Figure 5A). Forinstance, we set a cutoff score (prTHR=10, 777.29CCD score) for the PRC2 target set (class V) since thenumber of identified CRMs using a high cutoff score(prTHR=AVG; average of sum of CCD scores in thetraining set, 970.52 CCD score) were less than that ofthe training set (Supplementary Figure S4A). Manual in-vestigation of the Hoxd cluster reveals that the definedcutoff score is enough to identify the previously knownPRC2 target sites (Supplementary Figure S4B) (39), andhence we applied this strategy to the rest four classes.
Using the defined cutoff scores, CCD successfully pin-pointed genome-wide CRMs in the mouse genomeincluding 2797 (class I), 2455 (class II), 176 (class III),5557 (class IV) and 2160 (class V) CRMs (Spreadsheet 2in Supplementary Data). Due to the CCD algorithm, asubset of CRMs in the given training set is alwaysguaranteed to be identified along with putative CRMs.For example, 40% of the known ICRs (8 out of 20,prTHR=60) near the Impact, Peg3, Airn, Peg13, Nnat,Snurf, H19 and Meg3 imprinted genes were obtainedalong with 168 newly predicted CRMs in the ICR result.The newly predicted CRMs are not located aroundthe computationally predicted imprinted genes (www.geneimprint.com). Nevertheless, it will be interesting to
e116 Nucleic Acids Research, 2011, Vol. 39, No. 17 PAGE 6 OF 13
at KO
RE
A A
DV
AN
CE
D IN
ST O
F SCIE
NC
E A
ND
TE
CH
NO
LO
GY
on August 25, 2016
http://nar.oxfordjournals.org/D
ownloaded from

examine the genes around these CRMs since they areenriched (or bound) by unique features (H3K9me3,H4K20me3 and Eset) similar to the known ICRs. Inaddition, the identified CRMs contain similar occurrenceof significant features compared to the training sets. Forinstance, 74.9, 45.5 and 59.1% of the predicted NanogMTL CRMs (class I) are occupied by NANOG, OCT4and SOX2 of which the proportions are similar with thetraining set (NANOG—83.9%, OCT4—58.7% andSOX2—72.3%). The genome-wide distributions of theidentified CRMs depend on the classes (Figure 5B). Incase of the class IV (ncMyc MTL) CRMs, the genomiclocations are biased toward the promoter regions, whereasthe class I (Nanog MTL) CRMs seem to be distributedrandomly with respect to genomic context.
To validate the putative CRMs in terms of biologicalrelevance, functional annotation analysis was conductedby using GREAT (see ‘Materials and methods’ section)(http://great.stanford.edu/), which unpacks genomic re-gions based on the annotation of the nearby genes. Thetop 300 newly identified CRMs for each class were ana-lyzed with the default parameters (FDR=0.05). Theanalysis reveals that the annotated functions of the puta-tive CRMs are well correlated with previously knownfacts, thereby confirming the CCD framework(Supplementary Table S3). For instance, the NanogMTL (class I) candidates are involved in stem cell main-tenance (binomial P=3.5E-05) and differentiation (bino-mial P=8.1E-05) in the GO Biological Process category.In case of the embryo enhancer (class II) candidates, the
CRMs are located near the genes affecting ‘abnormal mor-phology’ (eight terms, binomial P< 4.1E-04) in the MousePhenotype category and ‘compartment specification’(binomial P=7.4E-07) in the GO Biological Processcategory. The most striking example was obtained fromthe analysis of the PRC2 target (class V) candidates. Themajority of significantly associated genes near the CRMsare related to ‘negative regulation’ (or ‘positive regula-tion’) (21 terms, binomial P< 7.2E-05) in the GOBiological Process and ‘abnormal morphology’ (27terms, binomial P< 1.7E-04) in the Mouse Phenotypecategories, consistent with the known properties ofPRC2 (40,41).
Comparison of CCD with the Ensembl regulatorybuild method
There are limited numbers of experimentally validatedCRMs. The VISTA enhancer browser is a central resourcefor the experimentally validated CRMs showing enhanceractivity in a single embryonic timepoint (http://enhancer.lbl.gov) (42). To evaluate the performance of CCDcompared to the Ensembl regulatory build method, weused 745 experimentally validated enhancers from theVISTA enhancer browser as a confirmed data set (see‘Materials and Methods’ section). The Ensembl regulatorydatabase is comprised of best-guessed regulatory elementspredicted by an overlapping approach using a variety ofgenome-wide epigenomic data sets. Despite a large numberof predicted CRMs in the Ensembl regulatory database(17 562) as compared to CCD (12 636), the database
Figure 4. Unique trace codes are present in all training sets. Total 61 features extracted from the literature were used as feature sets (SupplementaryTable S1). Both of the original (star marked row) and three randomly subsampled training sets show the similar trace codes. For each training set,the CCD scores of traces were rescaled into 10 levels and these rescaled scores were used to draw the heatmap. According to the patterns of the tracecodes, the training sets were categorized into five classes (I–V, bottom).
PAGE 7 OF 13 Nucleic Acids Research, 2011, Vol. 39, No. 17 e116
at KO
RE
A A
DV
AN
CE
D IN
ST O
F SCIE
NC
E A
ND
TE
CH
NO
LO
GY
on August 25, 2016
http://nar.oxfordjournals.org/D
ownloaded from

only includes 2.1% of experimentally confirmed enhan-cers (16 out of 745), whereas the identified CRMs byCCD contain 27.0% of the enhancers (201 out of 745).The accurate identification of the CRMs is based on notonly the CCD algorithm but also a wealth of epigeneticinformation used in the present study. The averagenumber of associated features with the identified CRMsis significantly higher than the Ensembl regulatorydatabase (Figure 6A). Therefore, more genome-wideCRMs can be discovered and classified by integratingmore training sets and feature sets which will be availablein near future with CCD.In contrast to the Ensembl regulatory method, CCD
has several unique properties. First, CCD can categorize
identified CRMs according to their trace codes. Forinstance, a large domain (�240 kb) contains three genes(Plk1s1, Xrn2 and Nkx2-4) and an experimentallyvalidated enhancer in the 12th intron of the Plk1s1 gene(Figure 6B). The Ensembl regulatory build method pre-dicted three CRMs in this region, whereas CCD identi-fied six CRMs. Notably, CCD exactly identified thevalidated enhancer (VISTA enhancer) which theEnsembl regulatory build method failed to detect, andprecisely classified it as embryo enhancer. Second, CCDcan also measure the relative contribution of the featuresto the CRMs using the CCD score. For example, p300(CCD score=72) is the top feature that contributesmost significantly to the embryo enhancer CRM
Figure 5. Identification of genome-wide CRMs. (A) CCD identified a total of 12 636 CRMs which belong to the five classes (I–V) in the mousegenome. The patterns of occurrences of features in the identified CRMs were compared with those of the known CRMs. The following prTHRs wereused: 20 (class I), 30 (class II), 60 (class III), 30 (class IV) and 10 (class V). (B) Genome-wide distributions of the identified CRMs were examined infive sections (Supplementary Figure S1A).
e116 Nucleic Acids Research, 2011, Vol. 39, No. 17 PAGE 8 OF 13
at KO
RE
A A
DV
AN
CE
D IN
ST O
F SCIE
NC
E A
ND
TE
CH
NO
LO
GY
on August 25, 2016
http://nar.oxfordjournals.org/D
ownloaded from

overlapped with the VISTA enhancer (Figure 6B). Third,CCD enables users to adjust the level of expected resultby using the prTHR parameter. The default parameter(prTHR=AVG) is very stringent, and thus only 40.4%of the Ensembl regulatory elements were overlapped(Figure 6C). These numbers can be increased bylowering the prTHR parameter. With prTHR=20,CCD identified 64.3% of the Ensembl regulatoryelements. Overall, these results demonstrate that CCD isa flexible application and performs better than Ensemblat identifying the experimentally validated CRMs inVISTA.
Integrative analysis of the cis-regulatory modules ingenome-wide level
Visualization is a powerful alternative approach toexamine data in detail. Therefore, CCD provides anoutput (‘UCSC_’) to visualize all identified CRMs andfeatures by means of the UCSC genome browser (http://genome.ucsc.edu/). With the advantage of the ChIP-seqtechnology, mapping of the CRMs produces a high-resolution map of genome-wide CRMs which can be a
valuable source for researchers (Supplementary Figure S5).For instance, manual investigations of the regions near thetranscription start site (TSS) of Trit1, Coro1c and Klf7genes reveal that a single CRM in each locus is occupiedby p300s in embryo forebrain, midbrain and limb tissues(Supplementary Figure S6). Based on the trace code, theseCRMs are highly likely to be enhancers which may affectexpression of the genes in the embryo forebrain, midbrainand limb tissues.The H19-Igf2 and Meg3-Dlk1 imprinted domains are
known to share several intriguing features (43);(i) similar distances between the genes in each domain,(ii) non-coding RNAs (products of H19 and Meg3),(iii) monoallelic expression pattern of the genes. Byexamining two domains on the high-resolution map, wefound that both promoter regions of the protein-codinggenes, Igf2 and Dlk1, are bound by PRC2 in ES cells(Supplementary Figure S3). This result supports aprevious report that Igf2 expression depends on PRC2(44) and also provides explicit evidence that these twodomains are likely controlled by similar mechanisms,since both domains contain the same set of the CRMs
Figure 6. Comparison to the Ensembl regulatory build database. (A) The boxplot represents the average feature number of the CRMs which wereidentified by different methods (or parameters). The following prTHRs were used—20: 80% of the CRMs in a training set will be identifiedwith putative CRMs, AVG (default): the cutoff score is set to average of sum of CCD scores in a training set and VAR: the same prTHRs usedin Figure 5; *P< 0.001, two tailed t-test. (B) A locus (chr2:146 539 923–146 781 533, mm8) containing three genes (Plk1s1, Xrn2 and Nkx2-4) anddifferent types of CRMs. A CRM (blue box) showing enhancer activity experimentally is located in the 12th intron of the Plk1s1 gene. Ensembldetected three CRMs (ENSMUSR00000182442, ENSMUSR00000182448 and ENSMUSR00000131065). CCD identified six CRMs and categorizedthem into four classes (cyan—class I, magenta—class II, green—class III and red—class V). The top four features which contain high CCD scores ineach identified CRM are indicated by name (CCD score). Detailed information of the features’ CCD score is provided as Spreadsheet 1 inSupplementary Data. (C) The identified CRMs by CCD and Ensembl were compared using Venn diagrams.
PAGE 9 OF 13 Nucleic Acids Research, 2011, Vol. 39, No. 17 e116
at KO
RE
A A
DV
AN
CE
D IN
ST O
F SCIE
NC
E A
ND
TE
CH
NO
LO
GY
on August 25, 2016
http://nar.oxfordjournals.org/D
ownloaded from

(ICR and PRC2 target) (Supplementary Figure S3).Interestingly, additional examination of the imprinteddomains around the other 18 ICRs reveals that the pro-moter regions of Rasgrf1, Grb10 and Gnas are also boundby PRC2 in ES cells (Supplementary Figures S2P–R).Further investigations are required to confirm whetherPRC2 is involved in the general mechanism of genomicimprinting. Complete results for all 20 ICRs can be foundin the Supplementary Figures S2 and S3.Investigations of the regions encoding four transcrip-
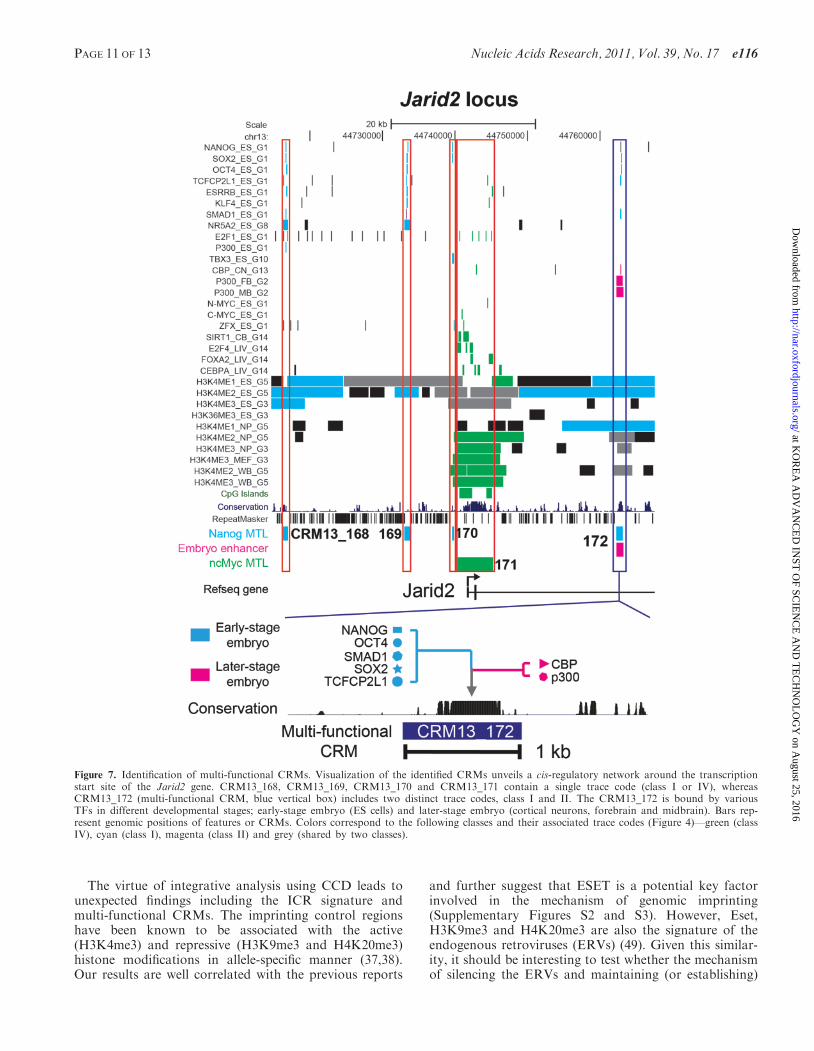
tion factors (OCT4, KLF4, NANOG and SOX2) ex-pressed highly in ES cells show that CCD successfullypinpoints several CRMs regardless of genomic context(Supplementary Figure S7). For example, four NanogMTL CRMs are located at �1-, 2-, 3- and 15-kbupstream regions from the TSS of the Oct4 gene. ThreeNanog MTL CRMs are positioned at �52-, 56- and 67-kbdownstream from the TSS of the Klf4 gene and threeNanog MTL CRMs are resided in �0.1-, 4- and 42-kbaway from the Nanog gene. Intriguingly, two CRMs(CRM3_102 and CRM3_105) positioned around theSox2 gene harbors two or three different trace codes(Embryo enhancer, Nanog MTL or ncMyc MTL)(Supplementary Figure S7D). This result hints that someCRMs may contain different trace codes together, and wecall these ‘multi-functional CRMs’.To further elucidate the multi-functional CRMs, the
five distinct classes (I–V) are intersected. Surprisingly,only 481 out of 12 636 identified CRMs overlap with atleast two different trace codes demonstrating that a smallnumber of the multi-functional CRMs do indeed exist(Spreadsheet 3 in Supplementary Data and SupplementaryFigure S8). Due to the rarity, we postulate that themulti-functional CRMs may be located near genes thatare critical for gene regulation. In consistent with theassumption, the functions of genes near the multi-functional CRMs are significantly related to establishmentor maintenance of chromatin architecture (binomialP=2.4E-06) such as Jmjd1a, Jmjd3, Mbd3, Arid1a,Smarcc1, Smarcd1, Smarcd2 and Chd3 (SupplementaryTable S4). Among the genes, Jarid2 should be specificallyexpressed during development according to its critical roleinvolved in global gene silencing (40,41). Interestingly, fiveCRMs (four Nanog MTLs and one ncMyc MTL) andone multi-functional CRM (Nanog MTL/Embryoenhancer) are located within regions spanning from �53to +22kb around the gene’s TSS, indicating that thegene appears to be regulated by a complex cis-regulatorynetwork (Figure 7). The multi-functional CRM is highlyconserved and bound by TCFCP2L1, NANOG, OCT4,SMAD1, SOX2 in early-stage embryo (ES cells) andCBP, p300 in later-stage embryo (cortical neurons, fore-brain and midbrain). Based on the trace codes, thisCRM appears to regulate the spatial and temporal ex-pression of Jarid2 by interacting with the above com-binations of TFs in two different developmentstages, although additional investigations are required.The complete map of the identified genome-wideCRMs can be viewed on the website (http://decode.kaist.ac.kr/).
DISCUSSION
The progressive increase of the genome-wide data sets,especially from the ChIP-seq method, gives rise to aneed for novel applications which fully exploit the datasets for particular purposes. Although integrativeanalysis of the genome-wide data sets holds great potential(45–48), there are no generalized methodologies to inte-grate a variety of genome-wide data sets in an unbiasedmanner. To resolve the above issue and apply it for iden-tifying genome-wide CRMs, combinatorial CRM decoder(CCD) has been developed. As a generalized platform,CCD has several remarkable advantages. First, any kindof ‘genome-wide’ data sets can be used as the feature sets,since it independently models background distribution ofeach feature based on the negative binomial distributioncoupled with the CDRS method (Figure 1). Second,previously unnoticed relationships between epigeneticfeatures and CRMs can be identified by analyzingvarious data sets altogether. Owing to the rapid growthof genome-wide ChIP-seq data sets, this property will in-creasingly accelerate the identification of new associationsbetween the epigenetic features and CRMs without priorknowledge. For example, based on the extensive bindingof the NR5A2 and TBX3 to the Nanog MTLs (35.7 and10.9% of the CRMs), we postulate that TCFCP2L1 mayimprove the reprogramming efficiency further due to itssignificant association with the Nanog MTLs (56.4% ofthe CRMs) compared to the pseudo set (0.3% of thepseudo-CRMs) (Spreadsheet 2 in Supplementary Data).Third, the performance can be superior to the otherCRM prediction tools due to the basic data sources, ex-perimentally derived (ChIP-seq) datasets rather than com-putational predictions. Fourth, the biological relevance ofidentified CRMs can easily be assessed with the availabletools including R, GREAT and UCSC genome browser(Figure 2). Furthermore, it can also be used to decode thegenomes of other species by utilizing appropriate inputdata sets. The CCD program and tutorials can be foundon our website (http://decode.kaist.ac.kr/).
In the present study, our extensive evaluationsdemonstrated that the algorithm of CCD is robust andreliable. By using the MCC value, CCD will automaticallydiscriminate features for the training set. If there is a singlesignificant feature among input features, then theidentified CRMs will be the binding regions of the singlefeature, which might be biased due to the lack of infor-mation. In this regard, we believe that a variety of fea-tures results in better outcomes as shown in this study(Figure 6A). Subsequent analysis of a large number ofvarious data sets further verified the reliability of the al-gorithm by identifying all previously known features(100%, 29/29) as parts of the trace codes (Figure 3Aand Supplementary Table S2). These remarkable perform-ances are based on the ‘trace code system’. With 9 trainingsets (Table 1), we showed that the trace code is sufficientto represent the characteristics of CRMs (Figure 3 andSupplementary Table S2). Accordingly, it enabled us toidentify genome-wide CRMs including the PRC2 targetsites (Spreadsheet 3 in Supplementary) in an unbiasedmanner.
e116 Nucleic Acids Research, 2011, Vol. 39, No. 17 PAGE 10 OF 13
at KO
RE
A A
DV
AN
CE
D IN
ST O
F SCIE
NC
E A
ND
TE
CH
NO
LO
GY
on August 25, 2016
http://nar.oxfordjournals.org/D
ownloaded from
The virtue of integrative analysis using CCD leads tounexpected findings including the ICR signature andmulti-functional CRMs. The imprinting control regionshave been known to be associated with the active(H3K4me3) and repressive (H3K9me3 and H4K20me3)histone modifications in allele-specific manner (37,38).Our results are well correlated with the previous reports
and further suggest that ESET is a potential key factorinvolved in the mechanism of genomic imprinting(Supplementary Figures S2 and S3). However, Eset,H3K9me3 and H4K20me3 are also the signature of theendogenous retroviruses (ERVs) (49). Given this similar-ity, it should be interesting to test whether the mechanismof silencing the ERVs and maintaining (or establishing)
Figure 7. Identification of multi-functional CRMs. Visualization of the identified CRMs unveils a cis-regulatory network around the transcriptionstart site of the Jarid2 gene. CRM13_168, CRM13_169, CRM13_170 and CRM13_171 contain a single trace code (class I or IV), whereasCRM13_172 (multi-functional CRM, blue vertical box) includes two distinct trace codes, class I and II. The CRM13_172 is bound by variousTFs in different developmental stages; early-stage embryo (ES cells) and later-stage embryo (cortical neurons, forebrain and midbrain). Bars rep-resent genomic positions of features or CRMs. Colors correspond to the following classes and their associated trace codes (Figure 4)—green (classIV), cyan (class I), magenta (class II) and grey (shared by two classes).
PAGE 11 OF 13 Nucleic Acids Research, 2011, Vol. 39, No. 17 e116
at KO
RE
A A
DV
AN
CE
D IN
ST O
F SCIE
NC
E A
ND
TE
CH
NO
LO
GY
on August 25, 2016
http://nar.oxfordjournals.org/D
ownloaded from

the ICRs are mediated by the same regulatory complexes.Another intriguing finding is the multi-functional CRMs(Figure 7 and Supplementary Figure S8). Although theanalysis of data sets from various sources may lead tothe identification of false positive CRMs, we showedthat our approach is very effective and eventually dis-covers the multi-functional CRMs. Therefore, we arguethat the data sets from different cell types still providecharacteristic patterns of CRMs in the given time-pointand can be used at least for identifying CRMs. Based onthe distinct trace codes, the multi-functional CRMsbelong to at least two different classes (Spreadsheet 3 inSupplementary Data). We propose that they are likely thekey CRMs which determine the temporal and spatialexpression of nearby genes by interacting with morethan two combinations of TFs (input signals). Furtherinvestigations are needed to elucidate whether the multi-functional CRMs represent the general property of CRMsor a special type of CRMs, since the CRMs tend to harbormultiple TFBSs.With the great capability of the integrative analysis,
CCD will shed light on unveiling the gene regulatorynetworks by assisting the growth of genome-wide associ-ation studies.
SUPPLEMENTARY DATA
Supplementary Data are available at NAR Online.
ACKNOWLEDGEMENTS
The authors thank Dr Jennifer M. Huang for her excellentediting.
FUNDING
Epigenomic Research Program for Human Stem Cells(2007-2004134); Research Program for New Drug TargetDiscovery (2007-0052983); Ministry of Education, Science& Technology, South Korea. Funding for open accesscharge: Brain Korea 21.
Conflict of interest statement. None declared.
REFERENCES
1. Levine,M. and Davidson,E.H. (2005) Gene regulatory networksfor development. Proc. Natl Acad. Sci. USA, 102, 4936–4942.
2. Segal,E., Raveh-Sadka,T., Schroeder,M., Unnerstall,U. andGaul,U. (2008) Predicting expression patterns from regulatorysequence in Drosophila segmentation. Nature, 451, 535–540.
3. Wyrick,J.J. and Young,R.A. (2002) Deciphering gene expressionregulatory networks. Curr. Opin. Genet. Dev., 12, 130–136.
4. Stathopoulos,A. and Levine,M. (2005) Genomic regulatorynetworks and animal development. Dev. Cell, 9, 449–462.
5. Berman,B.P., Nibu,Y., Pfeiffer,B.D., Tomancak,P., Celniker,S.E.,Levine,M., Rubin,G.M. and Eisen,M.B. (2002) Exploitingtranscription factor binding site clustering to identifycis-regulatory modules involved in pattern formation in theDrosophila genome. Proc. Natl Acad. Sci. USA, 99, 757–762.
6. Ochoa-Espinosa,A. and Small,S. (2006) Developmentalmechanisms and cis-regulatory codes. Curr. Opin. Genet. Dev., 16,165–170.
7. Janga,S.C., Collado-Vides,J. and Babu,M.M. (2008)Transcriptional regulation constrains the organization of genes oneukaryotic chromosomes. Proc. Natl Acad. Sci. USA, 105,15761–15766.
8. Kang,K., Chung,J.H. and Kim,J. (2009) Evolutionary conservedmotif finder (ECMFinder) for genome-wide identification ofclustered YY1- and CTCF-binding sites. Nucleic Acids Res., 37,2003–2013.
9. Zinzen,R.P., Girardot,C., Gagneur,J., Braun,M. and Furlong,E.E.(2009) Combinatorial binding predicts spatio-temporal cis-regulatory activity. Nature, 462, 65–70.
10. Visel,A., Blow,M.J., Li,Z., Zhang,T., Akiyama,J.A., Holt,A.,Plajzer-Frick,I., Shoukry,M., Wright,C., Chen,F. et al. (2009)ChIP-seq accurately predicts tissue-specific activity of enhancers.Nature, 457, 854–858.
11. Kim,T.K., Hemberg,M., Gray,J.M., Costa,A.M., Bear,D.M.,Wu,J., Harmin,D.A., Laptewicz,M., Barbara-Haley,K.,Kuersten,S. et al. (2010) Widespread transcription at neuronalactivity-regulated enhancers. Nature, 465, 182–187.
12. Kantorovitz,M.R., Kazemian,M., Kinston,S., Miranda-Saavedra,D., Zhu,Q., Robinson,G.E., Gottgens,B., Halfon,M.S.and Sinha,S. (2009) Motif-blind, genome-wide discovery ofcis-regulatory modules in Drosophila and mouse. Dev. Cell, 17,568–579.
13. Won,K.J., Agarwal,S., Shen,L., Shoemaker,R., Ren,B. andWang,W. (2009) An integrated approach to identifying cis-regulatory modules in the human genome. PLoS ONE, 4, e5501.
14. Heintzman,N.D., Hon,G.C., Hawkins,R.D., Kheradpour,P.,Stark,A., Harp,L.F., Ye,Z., Lee,L.K., Stuart,R.K., Ching,C.W.et al. (2009) Histone modifications at human enhancers reflectglobal cell-type-specific gene expression. Nature, 459, 108–112.
15. Matthews,B.W. (1975) Comparison of the predicted and observedsecondary structure of T4 phage lysozyme. Biochim. Biophys.Acta, 405, 442–451.
16. Mikkelsen,T.S., Ku,M., Jaffe,D.B., Issac,B., Lieberman,E.,Giannoukos,G., Alvarez,P., Brockman,W., Kim,T.K., Koche,R.P.et al. (2007) Genome-wide maps of chromatin state in pluripotentand lineage-committed cells. Nature, 448, 553–560.
17. Chen,X., Xu,H., Yuan,P., Fang,F., Huss,M., Vega,V.B., Wong,E.,Orlov,Y.L., Zhang,W., Jiang,J. et al. (2008) Integration ofexternal signaling pathways with the core transcriptional networkin embryonic stem cells. Cell, 133, 1106–1117.
18. Peng,J.C., Valouev,A., Swigut,T., Zhang,J., Zhao,Y., Sidow,A.and Wysocka,J. (2009) Jarid2/Jumonji coordinates control ofPRC2 enzymatic activity and target gene occupancy inpluripotent cells. Cell, 139, 1290–1302.
19. Ku,M., Koche,R.P., Rheinbay,E., Mendenhall,E.M., Endoh,M.,Mikkelsen,T.S., Presser,A., Nusbaum,C., Xie,X., Chi,A.S. et al.(2008) Genomewide analysis of PRC1 and PRC2 occupancyidentifies two classes of bivalent domains. PLoS Genet., 4,e10000242.
20. Pasini,D., Cloos,P.A., Walfridsson,J., Olsson,L., Bukowski,J.P.,Johansen,J.V., Bak,M., Tommerup,N., Rappsilber,J. and Helin,K.(2010) JARID2 regulates binding of the Polycomb repressivecomplex 2 to target genes in ES cells. Nature, 464, 306–310.
21. MacIsaac,K.D., Lo,K.A., Gordon,W., Motola,S., Mazor,T. andFraenkel,E. (2010) A quantitative model of transcriptionalregulation reveals the influence of binding location on expression.PLoS Comput. Biol., 6, e10000773.
22. Meissner,A., Mikkelsen,T.S., Gu,H., Wernig,M., Hanna,J.,Sivachenko,A., Zhang,X., Bernstein,B.E., Nusbaum,C., Jaffe,D.B.et al. (2008) Genome-scale DNA methylation maps of pluripotentand differentiated cells. Nature, 454, 766–770.
23. Wederell,E.D., Bilenky,M., Cullum,R., Thiessen,N., Dagpinar,M.,Delaney,A., Varhol,R., Zhao,Y., Zeng,T., Bernier,B. et al. (2008)Global analysis of in vivo Foxa2-binding sites in mouse adultliver using massively parallel sequencing. Nucleic Acids Res., 36,4549–4564.
24. Nishiyama,A., Xin,L., Sharov,A.A., Thomas,M., Mowrer,G.,Meyers,E., Piao,Y., Mehta,S., Yee,S., Nakatake,Y. et al. (2009)Uncovering early response of gene regulatory networks in ESCsby systematic induction of transcription factors. Cell Stem Cell, 5,420–433.
e116 Nucleic Acids Research, 2011, Vol. 39, No. 17 PAGE 12 OF 13
at KO
RE
A A
DV
AN
CE
D IN
ST O
F SCIE
NC
E A
ND
TE
CH
NO
LO
GY
on August 25, 2016
http://nar.oxfordjournals.org/D
ownloaded from

25. Yuan,P., Han,J., Guo,G., Orlov,Y.L., Huss,M., Loh,Y.H.,Yaw,L.P., Robson,P., Lim,B. and Ng,H.H. (2009) Eset partnerswith Oct4 to restrict extraembryonic trophoblast lineage potentialin embryonic stem cells. Genes Dev., 23, 2507–2520.
26. Han,J., Yuan,P., Yang,H., Zhang,J., Soh,B.S., Li,P., Lim,S.L.,Cao,S., Tay,J., Orlov,Y.L. et al. (2010) Tbx3 improves thegerm-line competency of induced pluripotent stem cells. Nature,463, 1096–1100.
27. Heng,J.C., Feng,B., Han,J., Jiang,J., Kraus,P., Ng,J.H.,Orlov,Y.L., Huss,M., Yang,L., Lufkin,T. et al. (2010) The nuclearreceptor Nr5a2 can replace Oct4 in the reprogramming of murinesomatic cells to pluripotent cells. Cell Stem Cell, 6, 167–174.
28. Landeira,D., Sauer,S., Poot,R., Dvorkina,M., Mazzarella,L.,Jørgensen,H.F., Pereira,C.F., Leleu,M., Piccolo,F.M.,Spivakov,M. et al. (2010) Jarid2 is a PRC2 component inembryonic stem cells required for multi-lineage differentiation andrecruitment of PRC1 and RNA Polymerase II to developmentalregulators. Nat. Cell Biol., 12, 618–624.
29. Li,G., Margueron,R., Ku,M., Chambon,P., Bernstein,B.E. andReinberg,D. (2010) Jarid2 and PRC2, partners in regulating geneexpression. Genes Dev., 24, 368–380.
30. Azuara,V., Perry,P., Sauer,S., Spivakov,M., Jørgensen,H.F.,John,R.M., Gouti,M., Casanova,M., Warnes,G.,Merkenschlager,M. et al. (2006) Chromatin signatures ofpluripotent cell lines. Nat. Cell Biol., 8, 532–538.
31. Bernstein,B.E., Mikkelsen,T.S., Xie,X., Kamal,M., Huebert,D.J.,Cuff,J., Fry,B., Meissner,A., Wernig,M., Plath,K. et al. (2006) Abivalent chromatin structure marks key developmental genes inembryonic stem cells. Cell, 125, 315–326.
32. Eskeland,R., Leeb,M., Grimes,G.R., Kress,C., Boyle,S.,Sproul,D., Gilbert,N., Fan,Y., Skoultchi,A.I., Wutz,A. et al.(2010) Ring1B compacts chromatin structure and represses geneexpression independent of histone ubiquitination. Mol. Cell, 38,452–464.
33. Ivanova,N., Dobrin,R., Lu,R., Kotenko,I., Levorse,J.,DeCoste,C., Schafer,X., Lun,Y. and Lemischka,I.R. (2006)Dissecting self-renewal in stem cells with RNA interference.Nature, 442, 533–538.
34. Reik,W. and Walter,J. (2001) Genomic imprinting: parentalinfluence on the genome. Nat. Rev. Genet., 2, 21–32.
35. Edwards,C.A. and Ferguson-Smith,A.C. (2007) Mechanismsregulating imprinted genes in clusters. Curr. Opin. Cell Biol., 19,281–289.
36. Bartolomei,M.S. (2009) Genomic imprinting: employing andavoiding epigenetic processes. Genes Dev., 23, 2124–2133.
37. Delaval,K., Govin,J., Cerqueira,F., Rousseaux,S., Khochbin,S.and Feil,R. (2007) Differential histone modifications mark mouseimprinting control regions during spermatogenesis. EMBO J., 26,720–729.
38. Regha,K., Sloane,M.A., Huang,R., Pauler,F.M., Warczok,K.E.,Melikant,B., Radolf,M., Martens,J.H., Schotta,G., Jenuwein,T.et al. (2007) Active and repressive chromatin are interspersedwithout spreading in an imprinted gene cluster in the mammaliangenome. Mol. Cell, 27, 353–366.
39. Soshnikova,N. and Duboule,D. (2009) Epigenetic temporalcontrol of mouse Hox genes in vivo. Science, 324, 1320–1323.
40. Boyer,L.A., Plath,K., Zeitlinger,J., Brambrink,T., Medeiros,L.A.,Lee,T.I., Levine,S.S., Wernig,M., Tajonar,A., Ray,M.K. et al.(2006) Polycomb complexes repress developmental regulators inmurine embryonic stem cells. Nature, 441, 349–353.
41. Simon,J.A. and Kingston,R.E. (2009) Mechanisms of polycombgene silencing: knowns and unknowns. Nat. Rev. Mol. Cell Biol.,10, 697–708.
42. Visel,A., Minovitsky,S., Dubchak,I. and Pennacchio,L.A. (2007)VISTA Enhancer Browser–a database of tissue-specific humanenhancers. Nucleic Acids Res., 35, D88–D92.
43. Paulsen,M., Takada,S., Youngson,N.A., Benchaib,M., Charlier,C.,Segers,K., Georges,M. and Ferguson-Smith,A.C. (2001)Comparative sequence analysis of the imprinted Dlk1-Gtl2 locusin three mammalian species reveals highly conserved genomicelements and refines comparison with the Igf2-H19 region.Genome Res., 11, 2085–2094.
44. Li,T., Hu,J.F., Qiu,X., Ling,J., Chen,H., Wang,S., Hou,A.,Vu,T.H. and Hoffman,A.R. (2008) CTCF regulates allelicexpression of Igf2 by orchestrating a promoter-polycombrepressive complex 2 intrachromosomal loop. Mol. Cell Biol., 28,6473–6482.
45. Farnham,P.J. (2009) Insights from genomic profiling oftranscription factors. Nat. Rev. Genet., 10, 605–616.
46. Park,P.J. (2009) ChIP-seq: advantages and challenges of amaturing technology. Nat. Rev. Genet., 10, 669–680.
47. Alexander,R.P., Fang,G., Rozowsky,J., Snyder,M. andGerstein,M.B. (2010) Annotating non-coding regions of thegenome. Nat. Rev. Genet., 11, 559–571.
48. Hawkins,R.D., Hon,G.C. and Ren,B. (2010) Next-generationgenomics: an integrative approach. Nat. Rev. Genet., 11, 476–486.
49. Matsui,T., Leung,D., Miyashita,H., Maksakova,I.A., Miyachi,H.,Kimura,H., Tachibana,M., Lorincz,M.C. and Shinkai,Y. (2010)Proviral silencing in embryonic stem cells requires the histonemethyltransferase ESET. Nature, 464, 927–931.
PAGE 13 OF 13 Nucleic Acids Research, 2011, Vol. 39, No. 17 e116
at KO
RE
A A
DV
AN
CE
D IN
ST O
F SCIE
NC
E A
ND
TE
CH
NO
LO
GY
on August 25, 2016
http://nar.oxfordjournals.org/D
ownloaded from