Embed Size (px)
Citation preview

nature neuroscience VOLUME 17 | NUMBER 11 | NOVEMBER 2014 1463
A fundamental goal of neuroscience is to better understand the human nervous system. The human brain comprises billions of neurons and supporting cells in a complex network. Efforts to understand brain physiology and pathology often start from a reductionist approach to comprehensively characterize different neurons. Historically, new tools that allowed better characterization of neurons have augmented the understanding of nervous system function and dysfunction and galvanized important advances in this field. Through his meticulous observations of Golgi-stained neural tissues1, not only did Santiago Ramón y Cajal reveal the existence of strikingly diverse neurons as discrete functional entities, but he also generated numerous insights regarding potential modes of synaptic transmission from axons to dendrites and information flow within brain circuits. Technological advances in histology and microscopy have enabled characterization and comparison of neuronal microstructures under physiological and pathological conditions. Similarly, the advent of electrophysiology and patch-clamp techniques revolutionized the neuroscience field by monitoring dynamic membrane properties of neurons in real time.
NGS describes a group of sequencing technologies that can read relatively short nucleotide sequences of millions to billions DNA fragments in parallel. Since the first commercial release of an NGS platform less than a decade ago2, sequencing technology has advanced at a staggering pace. Sequencing throughput has increased more than 10,000-fold, resulting in a rapid decline in per-base sequencing cost. NGS was quickly grafted to numerous assays—such as genomic DNA mutation screening, bisulfite sequencing, chromatin capture and
immunoprecipitation—turning them into unbiased genome-wide assays. Moreover, NGS has catalyzed the development of a number of new biological assays. Together, these advances have allowed a more comprehensive and mechanistic description of molecular signature of cells.
The transcriptome and the epigenome form two major categories of information that can be acquired through various NGS-based assays. The transcriptome reflects an unbiased gene-expression profile of RNA molecules. The epigenome reflects the genome-wide distribu-tion of various epigenetic features, which include modifications of cytosine in genomic DNA, post-translational modifications of histone tails, position of nucleosomes, location of accessible genomic loci and three-dimensional (3D) interactions between genomic regions. The transcriptome represents the current molecular state of a given cell population, whereas the epigenome reveals both stable and dynamic properties that modulate the transcriptome. The abilities to eluci-date the molecular signature of a specific cell population and cellular states by transcriptome analysis and to identify epigenomic influences through NGS technology are revolutionizing every field of biology.
Neuroscience applications of NGS are only beginning to be explored, but this technology has great potential to enhance under-standing of the nervous system. In this Review we seek to provide a foundation for understanding and adapting NGS technology within the neuroscience field. First, we highlight technical challenges for implementing NGS in this domain. Second, we provide information about classes of epigenome- and transcriptome-based assays. Third, we try to demystify various NGS platforms and actual sequencing processes (further information on analytical tools of NGS in neuro-science can be found in ref. 3).
Unique considerations and questions in neuroscienceThanks to recent advances in NGS, transcriptomic and epigenomic data for multiple tissue and cell types are rapidly accumulating. Moreover, a nationwide effort to understand DNA regulatory ele-ments by the Encyclopedia of DNA Elements (ENCODE) consortium
1Graduate Program in Cellular and Molecular Medicine, Johns Hopkins University School of Medicine, Baltimore, Maryland, USA. 2Institute for Cell Engineering, Johns Hopkins University School of Medicine, Baltimore, Maryland, USA. 3Department of Neurology, Johns Hopkins University School of Medicine, Baltimore, Maryland, USA. 4The Solomon Snyder Department of Neuroscience, Johns Hopkins University School of Medicine, Baltimore, Maryland, USA. Correspondence should be addressed to H.S. ([email protected]).
Received 27 May; accepted 14 August; published online 28 October 2014; doi:10.1038/nn.3814
Decoding neural transcriptomes and epigenomes via high-throughput sequencingJaehoon Shin1,2, Guo-li Ming1–4 & Hongjun Song1–4
The mammalian brain is an evolutionary marvel in which engraving and re-engraving of cellular states enable complex information processing and lifelong maintenance. Understanding the mechanisms by which neurons alter and maintain their molecular signatures during information processing is a fundamental goal of neuroscience. Next-generation sequencing (NGS) technology is rapidly transforming the ability to probe the molecular basis of neuronal function. NGS can define not only the complete molecular signatures of cells by transcriptome analyses but also the cascade of events that induce or maintain such signatures by epigenetic analyses. Here we offer some general and practical information to demystify NGS technology and highlight its potential to the neuroscience field. We start with discussion of the complexity of the nervous system, then introduce various applications of NGS with practical considerations and describe basic principles underlying various NGS technologies. Finally, we discuss emerging NGS-related technologies for the neuroscience field.
r e v i e wfocus on big datanp
g©
2014
Nat
ure
Am
eric
a, In
c. A
ll rig
hts
rese
rved
.

1464 VOLUME 17 | NUMBER 11 | NOVEMBER 2014 nature neuroscience
r e v i e w
is collecting transcriptome and epigenome data from more than 300 cell and tissue types. It is becoming increasingly evident that mammalian nervous systems have unusual transcriptomic and epi-genetic features compared to most other tissues and cell types. First, neurons radically alter their transcriptome within minutes upon elec-trical activity4–6. More surprisingly, neurons substantially alter their DNA methylation status, or methylome, upon activation, behavioral perturbation and drug treatment7–11. These observations have over-turned the dogma that DNA methylation is a stable and irrevers-ible epigenetic mark in differentiated cells12. Second, mammalian neurons carry high levels of the DNA demethylation intermediate, 5-hydroxymethylcytosine (5-hmC)13. Up to 1% of all cytosines in neurons are 5-hmC, which is much more abundant than the 0.2% 5-hmC of all cytosines in most somatic tissues. Third, 5-methylcytosine (5-mC), which appears predominantly only at cytosines followed by guanine bases (CpG) in most somatic tissues, also appears frequently at cytosines followed by non-guanine bases (CpH)14,15. Fourth, the brain has an abundance of various regulatory RNA species that have not been well characterized, such as enhancer RNA (eRNA), piwi-interacting RNA (piRNA), microRNA (miRNA) variants (isomiRs) and endogenous small interfering RNA (endosiRNA)16–19. For the majority of these transcriptome and epigenome features, little is known about their functional significance.
Neurons have more elaborate processes than most other somatic cell types and therefore require extensive macromolecule transportation. As an alternative to long-distance transport, neurons take advantage of local protein translation at distal synapses20. Thus, RNA molecule distribution within the neuronal cytoplasm is important and calls for in situ transcriptome analysis. Neurons dramatically alter their tran-scriptome and potentially epigenome upon external signals; there-fore, temporal heterogeneity, in addition to cell type–specific and subcellular heterogeneity, is significant. To fully understand neuronal properties in a complex network, extracting neuronal transcriptome or epigenome from the intact environment is also desired.
Deconstructing the complexity of the nervous systemClassical assays in the neuroscience field are cell type–specific and often have single-cell resolution. From the beginning of modern neuroscience, the advent of Golgi staining technology allowed detailed observation of a few cells of interest from complex neuronal networks and populations of glial cells. Histological and microscopic observa-tions enabled detailed morphological characterization of particular neural subtypes. Electrophysiology and patch-clamp techniques reveal physiological properties of individual neurons. In contrast, NGS normally requires a large amount of input material, up to thou-sands or millions of cells depending on the assay. The requirement of such large samples is one of the reasons why early NGS studies were applied to cancer cell lines and embryonic stem cells more often than somatic tissues, including the brain.
The mammalian brain is a complex organ with a highly heterogene-ous makeup of cell types. Half of all cells are glial cells in most brain regions. There are thousands of neuronal cell types that differ in shape, size, connection, electrical properties and, potentially, transcriptome and epigenome. Even in the same neuronal subtype, molecular signatures can differ according to the signal input and local environment. Therefore, the source of brain transcriptome and epigenome data usually comprises a highly heterogeneous group of cells, which can mask important signals. Depending on the question or phenomenon under investigation, cell type or region specificity may not be required to generate useful data21. However, studies in neuroscience often deal with subtle differences that require very low noise; thus, sample preparation for transcriptome or
epigenome assays is the first challenge in adopting NGS. Likewise, in interpreting sequencing data from the mammalian nervous system, one has to keep in mind its heterogeneity, which can lead to discrepan-cies between classical approaches and results from NGS. The ultimate solution for heterogeneity is single-cell transcriptome and epigenome analysis, which in many cases is not yet feasible. In the interim, there are a number of ways to circumvent the issue of heterogeneity.
Microdissection and laser-capture microdissection. One way of reducing cellular heterogeneity of the brain is to mechanically separate regions of interest using microdissection (Fig. 1a). Microdissection has been used to identify brain nuclei–specific gene expression and in biochemistry studies of different brain nuclei since the 1960s. Most brain regions, however, have layers or structures that cannot be mechanically separated. Moreover, each microstructure contains diverse types of neurons and glial cells. Thus, even microdissected tissue specimens still contain heterogeneous neuronal and glial cell types. Laser-capture microdissection (LCM) is a more sophisticated and precise method of physical separation method (Fig. 1b). LCM is not, however, free of the problem of contamination by unwanted cell types. Moreover, the sample quantity is often too small to proceed with many current genetic, epigenetic or transcriptomic approaches.
Fluorescence-activated cell sorting. Since its development in 1960s, fluorescence-activated cell sorting (FACS) has been an essential modality for fields of immunology, hematology, stem cells and lym-phoma or leukemia. FACS uses fluorescently labeled cells or antibodies targeting specific epitopes of cells, which then are passed through thin capillaries where single cell–containing droplets are electrostatically guided into separate collection tubes according to the fluorescence wavelengths and light-refraction property of cells (Fig. 1c). FACS is not, however, widely used in epigenetic or transcriptome studies, for multiple reasons. First, the antigen should be well characterized and specifically expressed in the cell population of interest. Second, it often takes hours to go through the processes of tissue digestion, sample staining and FACS at 37 °C or room temperature. Cell viability and, more importantly, molecular characteristics can change during the preparation process. However, if only nuclei are required, FACS can also be applied for nuclear sorting22. Nuclear sorting can be applied to fresh-frozen brain samples, a common preservation method for primary human postmortem tissues. Nuclear sorting, however, can be used only for a subset of epigenome studies23,24.
Genetic tagging methods. It is possible to express nuclear membrane protein25,26 or ribosomal protein27–29 marked by biological tags only in cell types of interest. The labeled nuclei can be affinity purified for further analyses, such as nuclear RNA profiling or epigenome profiling. The tagged ribosomes can be immunoprecipitated and the associated mRNA molecules can be sequenced to generate cell type–specific transcriptomes (Fig. 1d). Unlike FACS, genetic labeling does not entail a lengthy sample-preparation procedure.
Single-cell analyses. Genetic approaches use only one molecule marker to define a cell type, which normally is not sufficient, and do not solve the problem of temporal heterogeneity within the same population upon stimulation. The highest degree of specificity is achieved through single-cell epigenome and transcriptome studies (Fig. 1e). To date, single-cell transcriptome is the most widely used single-cell sequencing technology30–33. At present, very few studies have described single-cell methylomes or 3D DNA interactomes34,35. Indeed, combining single-cell genomics with classical approaches,
npg
© 2
014
Nat
ure
Am
eric
a, In
c. A
ll rig
hts
rese
rved
.

nature neuroscience VOLUME 17 | NUMBER 11 | NOVEMBER 2014 1465
r e v i e w
such as electrophysiology, quantification of protein or mRNA (immunohistochemistry or RNA in situ) in the same cells would be very powerful. Although amplification bias is an issue, the single-cell approach could be a major breakthrough for decoding the complex nervous system.
Decoding neuronal identity and cellular statesProtein abundance is controlled by multiple factors, including mRNA abundance, translation rate and protein degradation rate, but the amount of mRNA is the primary contributing factor and explains 40–80% of variance in protein abundance in mammalian cells36–38. The transcriptome is an unbiased snapshot of the structure and abundance of RNA molecules. Using transcriptome analysis, we can begin to not only map gene-function relationships at the cellular level but also better understand the pathophysiology of abnormal neuro-nal behavior. At the same time, analysis of the epigenome offers a mechanistic explanation for the cell type– or cellular state–specific transcriptome. Understanding how various transcriptomes arise from invariable genomes is a fundamentally challenging task. The genome consists of a long one-dimensional stretch of letters without punctua-tion marks or line breaks. Less than 3% of the human genome contains protein-coding information. There are no universally conserved and unique sequences for transcription start sites or transcription termina-tion sites. Coding regions (exons) are not continuous but interspersed among kilobases of introns. Yet, cellular transcriptional machineries can locate coding regions, initiate transcription at designated tran-scription start sites, precisely splice out introns from pre-mRNAs and stitch exons together to generate mature mRNAs. Moreover, different cells guide transcriptional machinery to different parts of the genome to express a particular set of genes and isoforms, which is the basis for the striking diversity of the transcriptome. Epigenetic mechanisms underpin the diverse, tightly controlled transcriptome, which is essential for complex and harmonious cellular networks in multicellular organisms.
In addition to having cell type– and maturation stage–specific tran-scriptomes during development, neurons change their transcriptome rapidly in response to stimuli. More importantly, neurons often have to ‘remember’ the incidence of stimulus for a long period of time. Although the importance of epigenetic mechanisms in brain functions was suggested decades ago39, it was not until the advent of NGS that it was possible to characterize global epigenomic and transcriptomic changes. NGS is a versatile tool and here we summarize transcriptome and epigenome assays that can be connected to NGS (Fig. 2).
TranscriptomeOne of the most rapidly adopted applications of NGS is profiling of gene expression (Fig. 2d). In the Gene Expression Omnibus (GEO), where most published data sets are uploaded, there are more than 2,500 RNA sequencing (RNA-seq) data sets, and this number is rap-idly increasing as its older counterpart, gene-expression microarray, is used less often. It is worth pointing out the differences between these technologies and why RNA-seq is preferred. First, RNA-seq has a wider dynamic range of estimating the amount of each mRNA molecule. Second, because RNA-seq quantifies expression digitally, the estimated expression levels are highly accurate and reproduc-ible across different experiments40. Third, RNA-seq does not have an a priori set for detecting and quantifying transcripts and is thus capable of quantifying the abundance of isoforms, splicing variants or even post-transcriptional RNA base modification (RNA editing) in each transcript. Isoform information is important in neuronal RNA-seq, because alternative splicing is especially common in the nervous system41. Fourth, RNA-seq can reveal novel rare transcripts. Indeed, 85% of the human genome is transcribed. Although we do not understand the function of most noncoding RNAs, their abun-dance is especially high in the mammalian brain and they show region-specific expression, suggestive of tight regulation and an important role in cellular function42,43. RNA-seq, however, requires multiple steps of data processing to achieve meaningful data from raw sequencing reads3.
There are two primary considerations when performing RNA-seq: how to select mRNA molecules from total RNA, and whether to pre-serve strand information. mRNA is the only RNA species that has the potential to be translated into functional proteins. The relative abundance of each mRNA molecule indirectly but tightly correlates with protein abundance and thus represents the molecular signature of cells. mRNA, however, comprises only 5% of total RNA in mam-malian cells. Most of the remaining 95% of total cellular RNA con-sists primarily of ribosomal RNA (rRNA) and transfer RNA (tRNA). The existence of rRNA and tRNA species is not a problem when per-forming quantitative PCR (qPCR) using target-specific amplification. Poly(T) primers to selectively reverse transcribe the mRNA are no longer used for RNA sequencing because long transcripts have a 3′ bias due to the suboptimal processivity of reverse transcriptase44. There are two ways of enriching mRNA molecules. The first is via pos-itive selection to pull down polyadenylated mRNA molecules using
Microdissection Fluorescence-activatedcell sorting (FACS)
LysisCelldissociation
Genetic labeling (TRAP)
Laser onto desired cells to melt polymer
Laser-capture microdissection (LCM)
Single-cell genomics
Single-cell harvestlysis
Tissue section on glass slide
Thermolabilepolymer
Light Light
Genetically labeled celltype–specific ribosomal protein
FACS based on cell type–specific antigen
a
Amplification
Bead
b
c d
e
Figure 1 Tackling the complexity of the mammalian brain. To achieve transcriptomes or epigenomes from a particular cell type in the brain, careful sample preparation is necessary. (a) Microdissection is a physical dissection technique to separate small anatomical structures under the microscope. (b) Laser- capture microdissection (LCM) is a more sophisticated way of selecting cells from a tissue section. (c) FACS technology can sort the dissociated cells on the basis of genetic labeling of surface antigens. (d) Genetic labeling uses genetically tagged ribosomal protein or transcription factors to allow pulldown of biological molecules only from cell types of interest. (e) Single-cell studies can achieve high specificity but involve heavy amplification of the starting material.
npg
© 2
014
Nat
ure
Am
eric
a, In
c. A
ll rig
hts
rese
rved
.

1466 VOLUME 17 | NUMBER 11 | NOVEMBER 2014 nature neuroscience
r e v i e w
poly(T) magnetic beads. The selected poly(A) mRNA molecules are then fragmented and reverse transcribed to generate short frag-ments of double-stranded DNA. The second is via negative selection to remove unwanted RNA species using complementary oligonucleotides. Species-specific antisense oligonucleotides targeting rRNA are mainly used. Owing to remaining rRNA contamination, an rRNA-depleted RNA sample requires deeper sequencing runs than poly(A)-selected samples in general. rRNA-depleted RNA samples contain poly(A) mRNA as well as non-poly(A) noncoding RNA species45. If the goal of the RNA-seq is to achieve a snapshot of the cellular molecular signature, positive selection of mRNA using poly(T) magnetic beads is more economi-cal and straightforward than rRNA depletion. However, if the goal is to look for comprehensive characterization of neuronal states with regulatory RNA species, negative selection through rRNA depletion is likely to provide a more holistic view. Neurons have various non-poly(A) RNA species, and recently identified RNA species such as eRNA4 or miRNA sequestrating circular RNA46, are speculated to be especially important in mammalian brain functions.
Another decision to be made is whether or not to preserve RNA strand information. Unlike DNA molecules, which almost invariably are double stranded in cells, RNA molecules exist as single-stranded threads. mRNA molecules contain protein-encoding information and function as a blueprint for protein synthesis, whereas antisense mRNA molecules contain no coding information. The function of the antisense transcript is not well understood, but it has been hypothesized to have a role for sense gene-expression levels47–49 or
alternative splicing50. Antisense transcription is pervasive in the mammalian genome, and the brain is not an exception45. If strand information does not exist, sequencing reads from antisense mRNA are considered to come from sense mRNA by mapping software with annotations, which misrepresent the expression level51. Considering the significant amount of unannotated RNA species in the brain, strand information is imperative for building a precise transcrip-tome. Multiple library-preparation protocols can preserve the strand information with different complexity and performance52 (Box 1 and Fig. 3). There are different types of transcriptome assays for different purposes. Transcriptional activity can be assayed by global run-on sequencing (GRO-seq) and native elongating transcript sequencing (NET-seq), which sequence only the short nascent RNA synthesized by RNA polymerase II (refs. 53,54) (Fig. 2j). Translational activity can be assayed by ribosomal profiling, which sequences only regions of mRNA that are covered by ribosomes55 (Fig. 2e). RNA species that are bound by specific RNA-binding proteins can be assayed by cross-linking immunoprecipitation sequencing (CLIP-seq)56 (Fig. 2c). The distribution of post-transcriptional RNA base modifi-cations can be determined by antibody-mediated enrichment of the modified base of interest, followed by NGS57,58. Although all these technologies are not widely used in the neuroscience field, they will provide important and novel insights in the nervous system3.
c
LAD: DamID
f
RNA subcellularlocalization: FISSEQ
Protein-RNA interaction:CLIP-seq
mRNA abundance: RNA-seq
a b
Translational activity:ribosomal profiling
deLong range
interaction:5C, Hi-C, ChIA-PET
k
j
i
g Histone modification:ChIP-seq
Transcriptional activity:GRO-seq, NET-seq
TF binding sites: ChIP-seq
Accessible chromatin: DNase-seq, FAIRE-seq
h DNA modification: bisulfite sequencingderivatives
NN
NN
O
NH2
R
NH
O
H2NN
N
N
NHN
O
N
N
N
N
OH
2
NN
N
ONH NH2
N
NH2N
OR
O
O
O
OOP
O O
O
O
OOP
O O
NHN
O
N
N
N
N
OH
2
OO
O
OP
O O
O OP
O O
OO
O
O
O O
OO
OO
O O
OOO
O
O O – – – –
– – – –
O O
O O
PPPP
Figure 2 Cellular properties that can be determined by today’s NGS-powered assays. Specific configurations of nucleotides probed or enriched in each assay are colored yellow. (a) LADs can be assayed by DamID technology, which uses bacterial adenine methyltransferase genetically introduced into lamin B1 to label DNA proximal to nuclear lamina. (b) Subcellular localization of RNA molecules can be assayed by fluorescence in situ RNA sequencing (FISSEQ)144. (c) Protein-RNA interactions can be assayed by cross-linking immunoprecipitation sequencing (CLIP-seq), which uses ultraviolet light to cross-link RNA and protein to capture the interaction. (d) mRNA abundance can be assayed by mRNA sequencing. (e) Ribosomal profiling can show the translational activity of each mRNA molecule by sequencing only the ribosome-associated part of the mRNA. (f) Chromosomal long-range interactions can be assayed by 5C, HiC or ChIA-PET. (g) Histone modifications can be assayed by ChIP-seq targeting specific post-translational modifications of histone molecules. (h) Cytosine modifications can be assayed by WGBS or TAB-seq as well as antibody and chemical capture sequencings for modification of 5-mC, 5-hmC, 5-fC or 5-caC. (i) Active regulatory elements on accessible chromatin can be assayed by DNase-seq or FAIRE-seq. (j) Nascent transcription activity can be captured through genomic run-on assay sequencing (GRO-seq) or native elongating transcript sequencing (NET-seq). (k) Transcription factor binding sites can be assayed by ChIP-seq with transcription factor–specific antibodies.
npg
© 2
014
Nat
ure
Am
eric
a, In
c. A
ll rig
hts
rese
rved
.

nature neuroscience VOLUME 17 | NUMBER 11 | NOVEMBER 2014 1467
r e v i e w
Histone modificationsAs transcriptome analysis aims to provide molecular underpinnings for cellular phenotypes and characteristics, epigenome analysis aims to provide mechanistic explanations for a given transcriptome. Eight core histone proteins (two each of H2A, H2B, H3 and H4) and the surrounding DNA together form the nucleosome, a basic building block of chromatin. Each histone molecule is subject to more than 11 types of post-translational modifications, such as methylation, acetylation, phosphorylation or ubiquitylation, at more than 100 amino acid residues, most frequently at N-terminal residues protrud-ing from the nucleosome core59,60. Not all histone modifications have independent functions, as many frequently occur together in specific combinations in cell lines61 and mouse brains62. A few modifications are extensively characterized in terms of genomic location and their corre-lation with transcriptional activities of nearby genes63. Histone acetyla-tion is generally positively correlated with nearby gene-expression activity, potentially through destabilizing chromatin folding and compaction64,65 or by recruiting bromodomain-containing tran-scription activators66. The positive effect of general augmentation of histone acetylation in learning and memory suggests an interesting role for epigenetic regulation in brain function and opens up pos-sibilities for clinical applications67,68. On the other hand, histone methylation is correlated with more diverse genomic functional
elements, depending on the extent (mono-, di- or tri-methylation) and the location of substrate amino acids of the methylation on histone tails. Lysine methylation is well known to occur at certain genomic functional elements and forms the bedrock of the histone-code hypothesis for annotating genomic features69. For example, trimeth-ylated histone H3 at Lys4 (H3K4me3) marks active promoters when it is combined with acetylated H3 at Lys27 (H3K27ac) or H3K9ac, whereas H3K4me3 marks inactive or poised promoters when it is combined with H3K27me3 in the seven cell lines in the ENCODE project69,70. Histone methylation in brain functions, however, has not been extensively studied.
Histone modifications can be assayed by chromatin immuno-precipitation (ChIP) followed by qPCR (ChIP-qPCR) or by NGS (ChIP-seq) (Fig. 2g). ChIP uses antibodies to query genomic regions that directly interact with a protein or post-translational modification of interest. ChIP-seq is an assay to interrogate population-wide average binding profiles, and generally requires large sample quantities, often up to a few million cells, although some protocols use only hundreds or thousands of cells71. The resolution of histone ChIP is determined by the size of genomic DNA fragments that are pulled down. Genomic DNA can be fragmented by sonication after formaldehyde-mediated cross-linking or by micrococcal nuclease (MNase), with or without cross-linking. The key for a successful ChIP is the quality of antibodies. It is best to use extensively validated antibodies, such as those used in ENCODE projects (https://genome.ucsc.edu/ENCODE/antibodies.html). The quantity of ChIP-DNA is usually not measurable by spectrophotometer without staining reagents, and the quality of ChIP-DNA is generally worse than DNA from other assays because of formaldehyde cross-linking and sonication. To study the combinato-rial histone code, bioinformatic overlapping of ChIP-seq results from various histone modifications is crucial3.
DNA modifications5-mC is a central epigenetic mark crucial for mammalian develop-ment, X chromosome inactivation and genomic imprinting. A series of recent studies led to exciting discoveries of oxidation products of DNA methylation, such as 5-hmC, 5-formylcytosine (5-fC) or 5-carboxylcytosine (5-caC), along with the methylcytosine dioxygenase Tet enzyme family72–75. Tet enzymes can sequentially oxidize 5-mC to 5-hmC, and then to 5-fC and further to 5-caC. In addition, 5-hydroxymethyluracil (5-hmU) can be generated from 5-hmC deamination76 or from thymine via TET-mediated oxidation77.
Box 1 Strand-specific RNA library generation
The key to preserving strand information is to add two different adapters at 5′ and 3′ end of fragmented single-stranded RNA or cDNA molecules before amplifying the double-stranded library. All protocols use differ-ent strategies to add adapters but share library preparation protocols once double-stranded DNA is generated (Fig. 3). There are multiple strand-specific RNA sequencing protocols available. We introduce three methods that use different strategies but have comparable performance.
RNA ligation. This method starts from mRNA fragmentation. A 3′ RNA adapter is first ligated to the fragmented mRNA and then a 5′ RNA adapter is ligated. Using the two known adapter sequences, the library is reverse transcribed and amplified.
SMART. This method also starts from mRNA fragmentation. First, a primer containing an adapter sequence generates the first strand to the 5′ end of mRNA fragment. Moloney murine leukemia virus reverse transcriptase (MMLV-RT) has the activity of adding multiple cytosines without a template when it reaches the end of its template RNA. Because a template-switch oligonucleotide (TS oligo) has GGG at the 3′ end, it can anneal to the template-free CCC generated by MMLV-RT. MMLV-RT then further reverse transcribes using the TS oligo as a template, which adds another primer at the 3′ end of the cDNA. Using the two known adapter sequences, the library is amplified.
dUTP second strand. This procedure also starts from shearing the mRNA. mRNA is reverse transcribed using a random primer to generate the first strand. Instead of dTTP, dUTP is used to generated the second strand. The double stranded DNA is made into a library using Y-shape adapters (Fig. 3). Because the second strand contains uridine bases, it can be removed by the uridine-specific excision reagent enzyme. Because the Y-shape adapter introduces different adapter sequences at the 5′ and 3′ ends, the directionality can be determined retrospectively.
CCCGGG
GGGCCC
UUU
UUU
GGGCCC
3′ RNA adapter ligation
5′ RNA adapter ligation
1st strand RT
2nd strand generation
1st strand RT
Nontemplate C addition
TS oligo dependent RT
2nd strand generation
1st strand RT
2nd strand generationwith dUTP
Library generationwith Y adapters
Purified mRNA by poly(T) magnetic beads or rRNA depletion
Fragmentation
U
U
Uracil-specific digestion
a RNA ligation SMART dUTP second strand
AAAAAAA...AAA
AAAAAAA...AAA
b c
Figure 3 Three widely used protocols for strand-specific RNA sequencing library preparation. (a) The RNA ligation protocol sequentially adds two different adapters at the 5′ and 3′ ends of fragmented RNA. (b) The SMART protocol adds a 5′ adapter using a template-switching oligonucleotide (TS oligo). (c) The dUTP second-strand protocol adds dUTP when generating the second strand from cDNA to selectively digest the second strand after library preparation with Y-shaped adapters.
npg
© 2
014
Nat
ure
Am
eric
a, In
c. A
ll rig
hts
rese
rved
.

1468 VOLUME 17 | NUMBER 11 | NOVEMBER 2014 nature neuroscience
r e v i e w
5-hmU, 5-fC and 5-caC are readily recognized and cleaved by thymine- DNA glycosylase (TDG) to generate abasic sites, which are then repaired back to unmodified cytosine74,78. Unlike histone modi-fications, which are well conserved from yeasts to humans, DNA methylation shows striking diversity in regulatory mechanisms and genome-wide profiles among various organisms79. Even within meta-zoan species, genome-wide DNA methylation profiles are radically diverse: flies have no detectable cytosine methylation, whereas humans have the most cytosines methylated in the CpG context. The biological function of DNA modifications remains elusive. Contrary to the com-mon view that it functions as a suppressor, methylation of promoter DNA is neither sufficient nor necessary for suppressing expression but rather is important in maintaining the state of transcriptional suppression80–84. DNA methylation recruits DNA methylation binding domain (MBD) proteins, which then recruit histone deacetylases to suppress gene expression85. Thus, promoter methylation is suggested to serve as a stable marking to allow suppression of nearby genes. The function of gene-body or enhancer methylation in neurons is even less understood. A genome-wide study reported that DNA methylation in enhancer regions is negatively correlated with enhancer activity, recapitulating the effect of promoter methylation86. Gene-body meth-ylation has been suggested to enhance gene expression by repelling the binding of the polycomb repressive complex or suppressing spurious transcription start sites, which compete with the authentic promoter87,88; however, in neurons gene-body methylation is anti-correlated with gene expression6.
DNA methylation is crucial for mammalian brain development and function and is highly dynamic in mature neurons89. Postmitotic neu-rons express DNA methyltransferase-3A (Dnmt3a), and Tet enzymes, even though neurons do not divide and transfer methyl groups to new substrate. Neurons contain high levels of methylcytosine in CpH contexts (H represents A, C and T), as well as 5-hmC. The presence
of CpH methylation suggests DNA de novo methyltransferase activity by Dnmt3a15, and 5-hmC suggests Tet enzyme activity72,90. DNA methylation in the brain is altered upon neuronal activity, contextual learning or drug addiction6–8,91–93. Alteration of DNA methylation is not just an epiphenomenon, but a crucial regulatory mechanism for brain functions, such as learning and memory94. There are a number of assays to achieve genome-wide profiles of DNA methylation, each with strengths and weaknesses.
Whole-genome bisulfite sequencing (WGBS). Bisulfite sequencing uses a chemical reaction of nucleophilic addition of bisulfite group to the carbon-6 position, followed by hydrolytic deamination and desul-fonation, which generates uracil from cytosine95,96 (Figs. 2h and 4). Because the nucleophilic attack of bisulfite ions is not as efficient with an electron donating group, such as a methyl group or hydroxymethyl group at the carbon-5 position, 5-mC and 5-hmC do not undergo sulfonation, and thus remain unchanged97–99. In contrast, 5-fC and 5-caC have electron withdrawing groups and undergo sulfonation and deamination by bisulfite reaction100. Thus, bisulfite conversion leaves 5-mC and 5-hmC unaffected and recognized as C (unmodified cyto-sine), whereas C, 5-fC and 5-caC are converted to uracil and recog-nized as T in the sequencing reaction (Fig. 4b). It is worth noting that in bisulfite sequencing results, regardless of whether they are from WGBS or locus-specific Sanger sequencing, bisulfite unconverted bases are in fact 5-mC and 5-hmC combined. Selective detection of 5-hmC is possible with additional steps before bisulfite reaction. One example is Tet-assisted bisulfite sequencing (TAB-seq)101,102. After selectively protecting 5-hmC by glycosylation, purified Tet enzymes can oxidize 5-mC in vitro to 5-fC and 5-caC, leaving glycosylated 5-hmC unaffected. Upon bisulfite conversion, only 5-hmC is read as C by DNA polymerase, whereas C, 5-mC, 5-fC and 5-caC are read as T by DNA polymerase in sequencing reaction (Fig. 4b). When performing
R = H : CytosineR = CH3 : 5-mCR = CH2OH : 5-hmCR = COH : 5-fCR = COOH : 5-caC
AlkalineRT
Acidic50 °C
+ HSO3– – HSO3
–
Adenine
Acidic50 °C
Denaturation
1. SulfonationFast: C, 5-fC, 5-caC
Very slow: 5-mC, 5-hmC
2. DeaminationSlow
(rate-limiting step)
3. DesulfonationFast
C 5-mC 5-hmC 5-fC 5-caCRegular sequencing
Bisulfite-seq
TAB-seq
Read as CRead as T
Fragmented genomic DNA (WGBS or targeted BS)MspI-digested genomic DNA (RRBS)
Ligation of methylated adapter
Denaturation BiotinylatedRNA bait
Library containingregion of interest
BB
Streptavidinbeads
BB
Pull down
Target enrichment(targeted BS)
Wash outunbound library
a
b
c
Bisulfite reaction
PCR amplification
R
NH+
N O
NH2
RNH
+
N O
NH2
R
–O3S
NH
N O
R
–O3S
NH4+ O
NH
N O
R
O
N
N O
NH2
R
NH
O
H2N
N
N
N
NH
N O
R
N
N
N
N
OH 2
N
Guanine
N
N O
NH2
H2O
2
3
45
6 1
Figure 4 Bisulfite sequencing. (a) Cytosine modifications occur at the 5-carbon position of the cytosine base. Because the 5-carbon is not involved in base pairing, all four modifications do not affect the interaction with a guanine base. Bisulfite-induced deamination comprises three steps: (1) sulfonation, (2) deamination and (3) desulfonation. Sulfonation is an addition of a sulfonyl group to the 4-carbon position of a cytosine base. Sulfonation is efficient for C, 5-fC and 5-caC but very slow for 5-mC and 5-hmC. Deamination reactions can occur only after the addition of a sulfonyl group. The desulfonation step is facilitated at high pH. C, 5-fC and 5-caC go through the bisulfite reaction and deamination and so pair with adenine bases after bisulfite conversion. However, 5-mC and 5-hmC do not go through the bisulfite reaction so still pair with guanine bases after bisulfite conversion. (b) Because sequencing uses DNA polymerase, C, 5-fC and 5-caC are deaminated and are read as T after bisulfite conversion. In contrast, 5-mC and 5-hmC are not deaminated and are read as C after bisulfite conversion. TAB-seq first protects 5-hmC and oxidizes 5-mC into 5-fC or 5-caC, so that only 5-hmC is read as C after bisulfite conversion. (c) Methylated adapters should be used in making libraries for bisulfite sequencing so that the adapter sequence is unaffected by the bisulfite reaction. RNA bait complementary to regions of interest can be used for target-enrichment bisulfite sequencing. Target enrichment is done after denaturing of the library and before the bisulfite reaction.
npg
© 2
014
Nat
ure
Am
eric
a, In
c. A
ll rig
hts
rese
rved
.

nature neuroscience VOLUME 17 | NUMBER 11 | NOVEMBER 2014 1469
r e v i e w
WGBS or TAB-seq, the DNA library is generated before bisulfite conversion (in the case of TAB-seq, after Tet-assisted oxidation and before bisulfite conversion), using fully methylated adapters (Fig. 4c). The following bisulfite reaction converts only the DNA insert, leaving methylated adapters unaffected, thus the bisulfite-converted library can go through amplification and sequencing. There are many dif-ficulties and caveats for genome-wide 5-mC or 5-hmC profiling. First, the required amount of sequencing for reasonable coverage is much higher than for other NGS applications. For example, the amount of sequencing to achieve tenfold coverage is 30 billion bases for human genome. Tenfold coverage, however, is often not enough to detect small differences, as a unit of variability for tenfold coverage sequenc-ing data is 10%. Second, mapping is challenging because of increased ambiguity: T from sequencing read can come from either a T or from a bisulfite-converted C. Sequencing reads from genomic regions with low complexity often become impossible to map, thus necessitating even greater depth for WGBS. Third, the amount of data for the whole genome is very large and more difficult to handle3.
Reduced representation bisulfite sequencing (RRBS). RRBS is a way of enriching CpG-rich regions of the genome103. The genomic DNA is first digested with the restriction enzyme MspI, which cuts CCGG sequences regardless of the methylation status of the central CpG. The library is generated using fully methylated adapters and then bisulfite converted. Short inserts are eliminated during the DNA-purification step, and the DNA library with long inserts is not as efficiently ampli-fied during library amplification and cluster generation at sequenc-ing104. As a result, RRBS preferentially queries the methylation status of genomic regions where the density of CCGG sites is relatively high (one CCGG site in every 40–220 bp), whereas the average is 1,745 bp between CCGG sites in humans105. CpG islands by defini-tion have higher frequency of CpG dinucleotides, and thus a higher chance of having more CCGG sites than the average genome. Indeed, RRBS preferentially profiles CpG islands and promoter regions with high coverage. Using RRBS, 10 million reads is enough to profile 60% of promoters with >100-fold coverage, whereas WGBS requires 300 million reads to achieve 10-fold coverage. The promoters, however,
are not the primary regions where methylation varies. Genome-wide studies show that tissue-specific differentially methylated regions are primarily located at distal regulatory regions106. Regions where methylation changes occur during reprogramming, upon differen-tiation or owing to tumorigenesis are also primarily located at distal regulatory regions or CpG island shores out of CpG islands80,107,108. Moreover, activity-dependent methylation changes in the brain hap-pen primarily in regions outside of promoters6. These differentially methylated regions have a moderate frequency of CpG dinucleotides and moderate levels of methylation. RRBS covers around 25% of CpG island shores and around 20% of H3K4me2 regions, which mark promoters and enhancers109.
Targeted bisulfite sequencing. To include important distal regula-tory regions but reduce the sequencing cost, one can capture potential regulatory regions to perform targeted bisulfite sequencing. The most widely used approach for bisulfite target enrichment is to capture DNA with RNA probes that are complementary to the regions of interest110 (Fig. 4c). Capturing is done after library preparation with fully methylated adapters and before bisulfite conversion. Predefined sets of RNA probes are commercially available, and one can add cus-tomized RNA probes targeting regions of interest. Capture-based bisulfite sequencing generates single-base resolution methylation maps of regions of interest. Although commercial kits for target enrichment contain most known promoters, CpG shores and potential distal regu-latory regions, it is not always possible to correctly guess important regions dispersed throughout genome, particularly considering that the DNA regulatory element map is far from being complete.
Affinity enrichment. In contrast to the above-described approaches that generate methylation maps with single-base resolution, affinity-enrichment methods are based on target region enrichment of short
dA tailing
Adapterligation
PCRamplification
Y-shape adapter
Amplifying primer
dATP
Library generation scheme
End-blunted DNA fragments
Completed library
ATGC
Single nucleotide incorporation
(3) Cleavage and washingout of one strand
(1) Library annealing (2) Bridging amplification
Cluster generation
Sequencing by synthesis
a b
c
Sequencing primer
T
Phosphorothioate bond
5′ phosphate
3′ T
Barcodesequence
d
Structure of adapter
Detect color from flow cellBridging amplification
for paired-end sequencing
Preparation forpaired-end sequencing
e
Figure 5 Overview of NGS technology using Illumina technology as an example. (a) The library is composed of fragments of double-stranded DNA that can be recognized by the NGS sequencer. DNA to be sequenced is flanked by adapter sequences. The DNA to be sequenced should first be fragmented down to 200–600 bp, and fragment ends should be enzymatically blunted. A 3′ dA tail is then added using DNA polymerase without 3′–5′ exonuclease activity. dA tailing prevents concatemerization of DNA fragments and allows the use of a dT-tailed adapter, which minimizes adapter dimer formation. A Y-shaped adapter is then ligated using A-T base pairing, and the correctly ligated libraries are amplified. (b) The 5′ end of the Y-shaped adapter contains a phosphate group and the 3′ end contains dT. Phosphorothioate bonds provide resistance to nuclease. (c) Cluster generation on the surface of the flow cell. (1) Denatured libraries are annealed to the short oligonucleotides on the surface of the flow cell. The distance between DNA molecules should be long enough to prevent overlapping clusters. (2) Bridging amplification generates clusters. (3) One strand from the double-strand DNA library is cleaved and washed out for unidirectional sequencing. (d) Primers for inserts are annealed for the sequencing of the insert DNA. In each sequencing cycle, protected and fluorescently labeled A, T, G and C bases are applied. After the addition of each nucleotide, the sequencing reaction is stopped, and the image is taken. Because the newly added nucleotides within each cluster are identical, the signal is high enough to be detected by a light sensor. After the image is taken the protection group and the fluorescent molecules are removed. (e) When the first-strand sequencing reaction is finished, the synthesized strand is removed and the process is repeated for the opposite strand.
npg
© 2
014
Nat
ure
Am
eric
a, In
c. A
ll rig
hts
rese
rved
.

1470 VOLUME 17 | NUMBER 11 | NOVEMBER 2014 nature neuroscience
r e v i e w
reads containing specific modifications, similarly to ChIP-seq. DNA is fragmented into small pieces, and the size of the DNA fragment determines the resolution of the assay. The specific modification of interest is pulled down with antibodies to specific DNA modifications, high-affinity binding proteins or chemical capture methods13,100,111. Captured fragments, which contain a higher amount of the DNA modification of interest, are then made into libraries and sequenced. Regions of the genome with higher enrichment of sequencing reads are considered regions with increased modification. Although affinity enrichment is economical and can distinguish among different DNA modifications, it is difficult to appreciate small differences between samples, owing to the inherently qualitative nature of affinity enrich-ment. Moreover, affinity enrichment is less sensitive for regions with low density of target DNA modifications.
Illumina Infinium HumanMethylation450 Array (450k). Despite relying on microarray technology, 450k generates a single-base- resolution methylation map for selected loci of the human genome. Probes on the microarray target specific CpG sites of interest after bisulfite reaction. After addition of one fluorescently labeled nucleo-tide, the detector measures fluorescence intensity to calculate the methylation level. Although it is available only for human samples and for restricted targets, it is widely used, especially in the clinical field, owing to its low cost.
Detecting protein-DNA interactionsDNA-binding proteins include histones, RNA transcription machin-ery and transcription factors. Although there are known DNA motifs for >100 transcription factors, motifs of 5–15 nucleotides are far from explaining the cell type– or state-specific transcription factor binding sites and transcription in vivo112. There are also non–sequence-specific DNA binding proteins, such as nucleosome remodelers or RNA polymerase complex. Thus, protein-DNA interactions should be assayed in each cell type and cellular state of interest. The most popular approach to detect the genomic location of protein-DNA interaction is through ChIP (Fig. 2k). ChIP depends on the ability of formaldehyde to reversibly cross-link nitrogen atoms in nucleotide bases and side chains of amino acids (primarily lysine and arginine)113. Because the size of the formaldehyde molecule is small, the distance that it can cross-link is about 2 Å, so it captures only the direct interaction between protein and DNA or RNA113. Cross-linked DNA has to be fragmented, often with a sonicator, and pulled down by antibodies to proteins of interest. ChIP was first applied to determine locus-specific binding, using Southern blot or qPCR, one locus at a time114. Genome-wide profiles of protein-DNA interactions were initially achieved by ChIP followed by microarray (ChIP-chip)115 and later by ChIP-seq116,117. ChIP-seq has since been adapted for numerous assays and is a major con-tributor of data in the ENCODE project, with hundreds of ChIP-seq data sets for more than 300 cell or tissue types in four different organisms (Drosophila melanogaster, Caenorhabditis elegans, mouse and human) that are publicly available (http://genome.ucsc.edu/ENCODE/dataMa-trix/encodeChipMatrixHuman.html and http://genome.ucsc.edu/ENCODE/dataMatrix/encodeChipMatrixMouse.html for human and mouse, respectively).
One major limitation of conventional cross-link–sonication ChIP-seq is its low resolution118. The resolution of ChIP-seq is determined by fragmentation of DNA and is often hundreds of base pairs. The actual transcription factor binding sites are often an order of magni-tude shorter. There are a few ways to enhance the resolution of ChIP-seq. First, MNase digestion of chromatin enables one to specifically digest unbound DNA and achieve a high-resolution map of histone
modification or transcription factor binding sites119. MNase is a non-specific endo- and exonuclease with minimal sequence preference120. Because MNase digestion is an enzymatic process, cross-linking is often not required, which further prevents epitope disruption. Second, using lambda exonuclease, after cross-linking and sonica-tion, one can achieve single-base resolution of the protein-DNA interaction profile121. Lambda exonuclease is a highly processive enzyme that digests single-stranded DNA in the 5′–3′ direction. After cross-linking and sonication, the lambda exonuclease digests from the 5′ end to the DNA-protein cross-link point. Thus, the 5′ end of the resulting single-stranded DNA fragment is where the actual DNA-protein cross-link occurred.
As opposed to ChIP-seq, DNase-seq and formaldehyde-assisted isolation of regulatory elements (FAIRE)-seq provide a genome-wide map of open chromatin structure (Fig. 2i). Because they enable inves-tigators to locate all the active DNA regulatory elements, DNase-seq or FAIRE-seq are becoming more popular. DNase I is a nonspecific endonuclease that cleaves accessible genomic regions. As opposed to MNase with exonuclease activity, DNase I cleaves the accessible loca-tion of genomic DNA and leaves the cleaved ends intact. This property of DNase I has allowed it to be used for identifying open chroma-tin associated with cis-regulatory elements of the genome122,123. DNase-seq can reveal genomic regions occupied by any transcription factor. Studies from ENCODE consortium reported that DNase-seq signal with transcription factor binding motifs accurately predict experimental ChIP-seq signal124. One potential application for DNase-seq is DNase footprinting. Although DNase I preferentially cleaves within open chromatin regions of the genome, the exact genomic locations where transcription factors reside are protected and thus have lower coverage in sequencing results. With enough coverage, DNase-seq data can locate transcription factor binding sites within open chromatin at single-base resolution. However, a recent study argued that a large proportion of transcription factor footprinting is an artifact of the sequence specificity of DNase I, so caution must be taken when interpreting DNase footprinting data125. Depending on the protocol, DNase-seq generates libraries from single- or double-hit fragments of DNA126,127. Short DNA fragments with double hits are size selected and directly generated into the library. In contrast, single-hit DNA cleavage sites are ligated with adapters containing type IIs restriction enzyme recognition sites, so that short DNA is liberated by restriction enzyme digestion. The key for DNase-seq is accurate titration of the DNase I digestion condition through monitoring the enrichment of known regulatory regions by qPCR. FAIRE-seq is an independent way to achieve genome-wide distribution of active regulatory elements. Because nucleosome dis-ruption is a hallmark of active regulatory chromatin, FAIRE-seq uses formaldehyde to selectively cross-link nucleosome-associated regions of DNA128. After sonication and phenol-chloroform extrac-tion, only DNA fragments that are not associated with nucleosome are dissolved in the aqueous phase. Owing to its relative simplicity, FAIRE-seq is becoming more widely used. Data generated by the two methods are largely overlapping but still differ in important ways129. For example, the methods overlap at most transcription start sites, as well as enhancers, but DNase-seq is biased toward promoters, whereas FAIRE-seq preferentially finds enhancers129.
DNase-seq and FAIRE-seq have drawbacks. First, although DNase-seq and FAIRE-seq can profile active regulatory DNA elements, they cannot provide information about whether DNA elements are enhanc-ers, promoters or insulators. The characterization of DNA elements can be achieved only by ChIP-seq for specific transcription factors. Second, although DNase-seq and FAIRE-seq reveal activity of given
npg
© 2
014
Nat
ure
Am
eric
a, In
c. A
ll rig
hts
rese
rved
.
nature neuroscience VOLUME 17 | NUMBER 11 | NOVEMBER 2014 1471
r e v i e w
elements, there is no information about which gene is connected to the activity of distal regulatory DNA elements. The regulatory elements are not always associated with the closest gene and indeed often regulate remote promoters in complex combinations130,131. The physical connection between two genomic regions can provide insight for functional connections between two loci of genome.
Chromatin 3D interactionLong-range, 3D DNA interactions can be assayed by chromatin inter-action assays, namely chromatin locus-specific chromosome confor-mation capture (3C) and its derivatives, such as 3C-on-chip (4C), 3C carbon copy (5C), Hi-C, and chromatin interaction analysis by paired-end tag sequencing (ChIA-PET)132–136 (Fig. 2f). All chromatin- capture assays use proximity ligation after cross-linking. 3C, 4C and 5C can reveal 3D DNA interactions among two or more targeted regions, which make them relatively low throughput, although 5C reveals the interactome among thousands of loci135. HiC uses NGS to provide an unbiased interaction map of any genomic regions. By contrast, Chia-PET specifically shows the interaction map mediated by certain transcription factors through a specific antibody pulldown step after proximity ligation. Currently, there is no genome-wide chromatin 3D interaction map for mammalian brains. Future efforts should pro-vide better insight in the functional connections between epigenetic changes at distal regulatory regions and changes in gene expression. Certain regions of the genome are located in close proximity to nuclear lamina. These nuclear lamina-associated domains (LADs) have dis-tinct chromatin features and transcriptional activity and are develop-mentally tightly regulated. LAD can be assayed using DNA adenine methyltransferase identification137 (DamID) (Fig. 2a). DamID uses bacterial adenine methyltransferase genetically introduced into lamin B1 to label DNA proximal to nuclear lamina, which is then pulled down by specific antibodies to N6-methyladenine.
Demystifying NGS technologiesCurrent NGS technologies use clever tricks and ingenious tech-nologies to run millions of sequencing reactions on a solid surface. Unlike conventional Sanger sequencing, which reads the sequence after synthesizing DNA, NGS detects the sequences while synthesiz-ing DNA. NGS normally consists of two steps: generating clusters of identical single-stranded DNA molecules on small spots of flow-cell surface or on microbeads by PCR amplification; and detecting the signals from each cluster while adding nucleotides (Fig. 5 and Box 2). Although the first step—cluster generation—is crucial for NGS technologies to amplify signals from each nucleotide addition to detectable level, there are technologies already available to circumvent the clustering step by achieving high-enough sensitivity to detect single molecular reactions. Each sequencing approach has benefits and drawbacks (Box 3).
Emerging sequencing technologies relevant to neuroscienceNGS-related technologies are evolving rapidly in two key aspects. First, the power of sequencing machines is rapidly increasing in terms of throughput, speed and read length. Second, new assays are emerging to probe novel aspects of epigenome or transcriptome.
Allele-specific combinatory epigenetic signatures. Most epigenome or transcriptome information describes a correlation between two or more features in the genome. However, it is still not clear whether the occurrence of two epigenomic or transcriptomic features at the same genomic region is actually on the same allele or even within the same cells. For example, it will be interesting to know whether the bivalent
region of H3K4me3 and H3K27me3 modifications actually occur on the same histone molecules or if promoter DNA methylation actually suppresses nearby gene expression at the same allele. A recent study suggested that nucleosomes at bivalent domains have H3K4me3 and H3K27me3 on the opposite tails but not at the same tail138. It is often difficult, however, to study the enrichment of two epigenetic marks because each step of ChIP is accompanied by large sample loss. There are a few studies that performed ChIP-bisulfite sequencing to query the methylation status of protein-bound DNA13,139,140. We expect to see many more such studies in the future.
Single-cell analysis of genomic DNA, transcriptome and epig-enome. As we discuss above, circumventing cellular heterogeneity is one of the major issues for NGS-related tools in neuroscience.
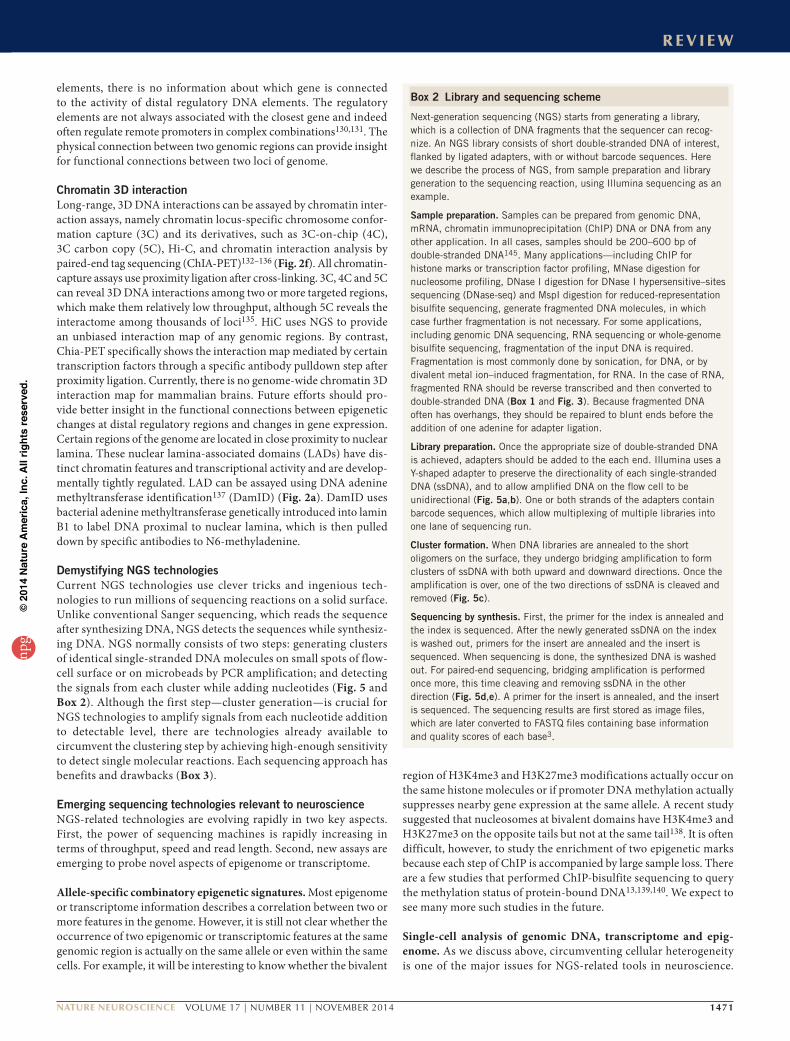
Box 2 Library and sequencing scheme
Next-generation sequencing (NGS) starts from generating a library, which is a collection of DNA fragments that the sequencer can recog-nize. An NGS library consists of short double-stranded DNA of interest, flanked by ligated adapters, with or without barcode sequences. Here we describe the process of NGS, from sample preparation and library generation to the sequencing reaction, using Illumina sequencing as an example.
Sample preparation. Samples can be prepared from genomic DNA, mRNA, chromatin immunoprecipitation (ChIP) DNA or DNA from any other application. In all cases, samples should be 200–600 bp of double-stranded DNA145. Many applications—including ChIP for histone marks or transcription factor profiling, MNase digestion for nucleosome profiling, DNase I digestion for DNase I hypersensitive–sites sequencing (DNase-seq) and MspI digestion for reduced-representation bisulfite sequencing, generate fragmented DNA molecules, in which case further fragmentation is not necessary. For some applications, including genomic DNA sequencing, RNA sequencing or whole-genome bisulfite sequencing, fragmentation of the input DNA is required. Fragmentation is most commonly done by sonication, for DNA, or by divalent metal ion–induced fragmentation, for RNA. In the case of RNA, fragmented RNA should be reverse transcribed and then converted to double-stranded DNA (Box 1 and Fig. 3). Because fragmented DNA often has overhangs, they should be repaired to blunt ends before the addition of one adenine for adapter ligation.
Library preparation. Once the appropriate size of double-stranded DNA is achieved, adapters should be added to the each end. Illumina uses a Y-shaped adapter to preserve the directionality of each single-stranded DNA (ssDNA), and to allow amplified DNA on the flow cell to be unidirectional (Fig. 5a,b). One or both strands of the adapters contain barcode sequences, which allow multiplexing of multiple libraries into one lane of sequencing run.
Cluster formation. When DNA libraries are annealed to the short oligomers on the surface, they undergo bridging amplification to form clusters of ssDNA with both upward and downward directions. Once the amplification is over, one of the two directions of ssDNA is cleaved and removed (Fig. 5c).
Sequencing by synthesis. First, the primer for the index is annealed and the index is sequenced. After the newly generated ssDNA on the index is washed out, primers for the insert are annealed and the insert is sequenced. When sequencing is done, the synthesized DNA is washed out. For paired-end sequencing, bridging amplification is performed once more, this time cleaving and removing ssDNA in the other direction (Fig. 5d,e). A primer for the insert is annealed, and the insert is sequenced. The sequencing results are first stored as image files, which are later converted to FASTQ files containing base information and quality scores of each base3.
npg
© 2
014
Nat
ure
Am
eric
a, In
c. A
ll rig
hts
rese
rved
.

1472 VOLUME 17 | NUMBER 11 | NOVEMBER 2014 nature neuroscience
r e v i e w
Single-cell NGS assays are necessary to associate epigenomic or transcriptomic data with single-cell–level electrophysiological or morphological neuronal properties. Currently available single-cell NGS assays include mRNA sequencing, genome sequencing, RRBS and HiC. The inherent problem in most single-cell studies is the potential bias introduced by heavy amplifications. Genomic sequencing is carried out after whole-genome amplification by Phi29 DNA polymerase, which has exceptional strand-displace-ment activity and processivity141. Whole genomes can be ampli-fied with minimal bias using Phi29 DNA polymerase with random primers, even from single cells142. mRNA amplification, by con-trast, has to be more robust in maintaining relative amounts even after a large number of amplification rounds. Recently, investigators introduced ‘Smart-seq’, in which two adapter sequences are added at both ends of cDNA by the template-switching activity of Moloney murine leukemia virus (MMLV) reverse transcriptase before multi-ple rounds of amplification30. The amplification bias of Smart-seq is much lower than the previous poly(A) addition technology143, and the method is relatively easy to perform. Recently, single-cell RRBS and Hi-C became feasible34,35, but single-cell ChIP-seq, DNase-seq and FAIRE-seq have not yet. It would be informative to achieve more than two forms of sequencing information simultaneously—such as the DNA methylome and the transcriptome from the same cells. The subcellular location of RNA is also important information, especially
in neurons. In a recent report, intracellular reverse transcription and cluster formation followed by ligation-mediated fluorescence in situ RAN sequencing (FISSEQ) enabled RNA-seq of whole RNA molecules with their intracellular localization144 (Fig. 2b). Although the current technology preferentially shows the sequence of rRNA, this in vivo sequencing has great potential, especially in the neuro-science field.
ConclusionIn less than a decade, NGS has changed the way and scale at which biology is studied. Many new tools are now available to characterize cells at the genome-wide level, including their DNA modifications, histone modifications, transcription factor binding, chromatin 3D interactions, accessible chromatin, the RNA transcriptome and many more. More and more new assays are becoming available, and NGS itself is rapidly evolving. The rate increase in power and efficiency of NGS is far ahead of what would be predicted from maxims such as Moore’s law. This revolutionary change benefits the entire field of biology, including neuroscience. The nervous system is one of the most complex systems in nature, and neuroepigenetics is emerging as a field in its own right. Along with high-throughput brain-network studies, NGS can be a major driving force in catalyzing a paradigm shift in the understanding of brain function and dysfunction in the years to come.
Box 3 Basic principles of leading sequencing technologies Illumina HiSeq X, HiSeq 2500, NextSeq 500 and MiSeq. Illumina sequencers are currently the most widely used sequencing platform in the next-generation sequencing (NGS) field. Illumina uses flow-cell surface for clustering DNA through ‘bridging amplification’, which generates clusters with millions of identical, single-stranded (ss), surface-attached DNA molecules145,146 (Fig. 5c). After primer annealing, fluorescently labeled dATP, dGTP, dCTP and dTTP are added to the 3′ end of the primer according to the complementary base of the template strand (Fig. 5d). The fluorescently labeled nucleotides are chemically protected at the 3′ hydroxyl group, which prevents the addition of more than a single nucleotide per cycle. The camera then takes a picture of the flow cell to detect the fluorescence from the last incorporated nucleotide of each cluster. The 3′ hydroxyl protection group as well as the fluorophore is enzymatically cleaved to proceed to the next cycle of the sequencing reaction. This stepwise addition of sequencing reactions is desirable when sequencing homopolymer (repeating stretch of one kind of nucleotide), which is generally problematic for other sequencing platforms147. In addition, the throughput of Illumina sequencers per sequencing run is 10–100 times higher than that of other sequencing platforms. Paired-end sequencing capabilities are also well established, and these can compensate for the shorter read length and offer increased accuracy by reading the same DNA template twice. The potential problem of Illumina sequencing technology is that the accumulation of uncleaved fluorophores or protection groups from each step can induce high noise and increase substitution errors in the later sequencing cycles.
Life Technologies Ion Torrent and Ion Proton ion semiconductor sequencers. Ion semiconductor sequencers use emulsion PCR to clonally amplify DNA library fragments on the surface of microbeads. The beads are then placed in microwells, which can measure small changes in pH during incorporation of nucleotides. The sequencing reaction is done by sequential addition and washing of unmodified dATP, dGTP, dCTP and dTTP so that only complementary bases at the 3′ end of growing DNA strand can be incorporated. The small pH change due to the liberated pyrophosphate ion during DNA polymerization is measured and converted to the nucleotide. When there is a stretch of the same nucleotide, multiple nucleotides can be incorporated at a single step, and pH change is proportional to the number of bases. Because the ion semiconductor sequencer processes the sequencing reaction with simple addition and washing of nucleotides, the speed of the sequencing run is much faster than with other sequencing technologies. The major problem is the low performance at homopolymers with more than eight bases.
Pacific Biosciences PacBio RS II single-molecule, real-time sequencer. The single-molecule, real-time (SMRT) sequencer sequences from a single molecule and thus does not require cluster generation. Single DNA polymerase (Phi29) is attached on the bottom of zeptoliter-sized (10−21 l) chambers and polymerizes complementary DNA to template ssDNA148. Fluorescently labeled dATP, dGTP, dCTP and dTTP are added to the liquid phase, and only complementary nucleotides are incorporated to the 3′ end of growing DNA. When a nucleotide is incorporated to the 3′ end of growing DNA, the fluorescent molecule at the end of phosphate group leaves the chamber. Although any fluorescently labeled nucleotides can freely get in and out of the chamber, only the incorporated one will stay substantially longer, close to the bottom of the chamber during the enzymatic nucleotide incorporation step. The detector on the bottom of the device will detect the fluorescence and call the base according to the color of the fluorescence it detects. Because the SMRT sequencer does not halt the natural polymerization reaction, the sequencing is very fast, and read length is substantially longer than that of other NGS platforms. A drawback of the SMRT sequencer is its low accuracy—it has error rates >10%. The smaller throughput can also be problematic, as most epigenetic assays require a large number of reads with a short read length precise enough to locate where the reads are from.
Oxford Nanopore Technologies MinION. The Oxford Nanopore MinION is also a single-molecule, real-time sequencer that sequences by measuring electric current changes of small pores as ssDNA molecules pass through them149. When DNA molecules pass through the pores, which can pass only ssDNA molecules, the resulting change in ion current through each nanopore is measured in real time by the detector. A, T, G and C as well as modi-fied cytosines each have a distinct size and affect the ion current differently. This technology is very promising but is at a very early stage. At present, sequencing results contain systemic errors revealed in a test trial150.
npg
© 2
014
Nat
ure
Am
eric
a, In
c. A
ll rig
hts
rese
rved
.

nature neuroscience VOLUME 17 | NUMBER 11 | NOVEMBER 2014 1473
r e v i e w
AckNoWleDGMeNTSWe thank K. Christian for comments. The work in the authors’ laboratories was supported by the US National Institutes of Health (H.S. and G.-I.M.), the Simons Foundation (SFARI 240011, H.S.) MSCRF (G.-I.M.) and the Dr. Miriam and Sheldon G. Adelson Medical Research Foundation. J.S. was supported by a fellowship from Samsung.
coMPeTING FINANcIAl INTeReSTSThe authors declare no competing financial interests.
Reprints and permissions information is available online at http://www.nature.com/reprints/index.html.
1. Llinás, R.R. The contribution of Santiago Ramon y Cajal to functional neuroscience. Nat. Rev. Neurosci. 4, 77–80 (2003).
2. Margulies, M. et al. Genome sequencing in microfabricated high-density picolitre reactors. Nature 437, 376–380 (2005).
3. Maze, I. et al. Analytical tools and current challenges in the modern era of neuroepigenomics. Nat. Neurosci. 17, 1476–1490 (2014).
4. Kim, T.K. et al. Widespread transcription at neuronal activity-regulated enhancers. Nature 465, 182–187 (2010).
5. Saha, R.N. et al. Rapid activity-induced transcription of Arc and other IEGs relies on poised RNA polymerase II. Nat. Neurosci. 14, 848–856 (2011).
6. Guo, J.U. et al. Neuronal activity modifies the DNA methylation landscape in the adult brain. Nat. Neurosci. 14, 1345–1351 (2011).
7. Ma, D.K. et al. Neuronal activity-induced Gadd45b promotes epigenetic DNA demethylation and adult neurogenesis. Science 323, 1074–1077 (2009).
8. Miller, C.A. et al. Cortical DNA methylation maintains remote memory. Nat. Neurosci. 13, 664–666 (2010).
9. Miller, C.A. & Sweatt, J.D. Covalent modification of DNA regulates memory formation. Neuron 53, 857–869 (2007).
10. Fragou, D. et al. Effect of chronic heroin and cocaine administration on global DNA methylation in brain and liver. Toxicol. Lett. 218, 260–265 (2013).
11. Vialou, V., Feng, J., Robison, A.J. & Nestler, E.J. Epigenetic mechanisms of depression and antidepressant action. Annu. Rev. Pharmacol. Toxicol. 53, 59–87 (2013).
12. Bird, A. DNA methylation patterns and epigenetic memory. Genes Dev. 16, 6–21 (2002).
13. Guo, J.U. et al. Genome-wide antagonism between 5-hydroxymethylcytosine and DNA methylation in the adult mouse brain. Front. Biol. 9, 66–74 (2014).
14. Lister, R. et al. Global epigenomic reconfiguration during mammalian brain development. Science 341, 1237905 (2013).
15. Guo, J.U. et al. Distribution, recognition and regulation of non-CpG methylation in the adult mammalian brain. Nat. Neurosci. 17, 215–222 (2014).
16. Lee, E.J. et al. Identification of piRNAs in the central nervous system. RNA 17, 1090–1099 (2011).
17. Martí, E. et al. A myriad of miRNA variants in control and Huntington’s disease brain regions detected by massively parallel sequencing. Nucleic Acids Res. 38, 7219–7235 (2010).
18. Giraldez, A.J. et al. MicroRNAs regulate brain morphogenesis in zebrafish. Science 308, 833–838 (2005).
19. Smalheiser, N.R., Lugli, G., Thimmapuram, J., Cook, E.H. & Larson, J. Endogenous siRNAs and noncoding RNA-derived small RNAs are expressed in adult mouse hippocampus and are up-regulated in olfactory discrimination training. RNA 17, 166–181 (2011).
20. Bodian, D. A suggestive relationship of nerve cell RNA with specific synaptic sites. Proc. Natl. Acad. Sci. USA 53, 418–425 (1965).
21. Jones, M.J. et al. Distinct DNA methylation patterns of cognitive impairment and trisomy 21 in Down syndrome. BMC Med. Genomics 6, 58 (2013).
22. Shulha, H.P. et al. Human-specific histone methylation signatures at transcription start sites in prefrontal neurons. PLoS Biol. 10, e1001427 (2012).
23. Tilgner, H. et al. Deep sequencing of subcellular RNA fractions shows splicing to be predominantly co-transcriptional in the human genome but inefficient for lncRNAs. Genome Res. 22, 1616–1625 (2012).
24. Bonn, S. et al. Cell type-specific chromatin immunoprecipitation from multicellular complex samples using BiTS-ChIP. Nat. Protoc. 7, 978–994 (2012).
25. Deal, R.B. & Henikoff, S. A simple method for gene expression and chromatin profiling of individual cell types within a tissue. Dev. Cell 18, 1030–1040 (2010).
26. Steiner, F.A., Talbert, P.B., Kasinathan, S., Deal, R.B. & Henikoff, S. Cell-type-specific nuclei purification from whole animals for genome-wide expression and chromatin profiling. Genome Res. 22, 766–777 (2012).
27. Sanz, E. et al. Cell-type-specific isolation of ribosome-associated mRNA from complex tissues. Proc. Natl. Acad. Sci. USA 106, 13939–13944 (2009).
28. Doyle, J.P. et al. Application of a translational profiling approach for the comparative analysis of CNS cell types. Cell 135, 749–762 (2008).
29. Heiman, M. et al. A translational profiling approach for the molecular characterization of CNS cell types. Cell 135, 738–748 (2008).
30. Ramsköld, D. et al. Full-length mRNA-seq from single-cell levels of RNA and individual circulating tumor cells. Nat. Biotechnol. 30, 777–782 (2012).
31. Grindberg, R.V. et al. RNA-sequencing from single nuclei. Proc. Natl. Acad. Sci. USA 110, 19802–19807 (2013).
32. Shalek, A.K. et al. Single-cell transcriptomics reveals bimodality in expression and splicing in immune cells. Nature 498, 236–240 (2013).
33. Xue, Z. et al. Genetic programs in human and mouse early embryos revealed by single-cell RNA sequencing. Nature 500, 593–597 (2013).
34. Nagano, T. et al. Single-cell Hi-C reveals cell-to-cell variability in chromosome structure. Nature 502, 59–64 (2013).
35. Guo, H. et al. Single-cell methylome landscapes of mouse embryonic stem cells and early embryos analyzed using reduced representation bisulfite sequencing. Genome Res. 23, 2126–2135 (2013).
36. Schwanhäusser, B. et al. Global quantification of mammalian gene expression control. Nature 473, 337–342 (2011).
37. Vogel, C. & Marcotte, E.M. Insights into the regulation of protein abundance from proteomic and transcriptomic analyses. Nat. Rev. Genet. 13, 227–232 (2012).
38. Li, J.J., Bickel, P.J. & Biggin, M.D. System-wide analyses have underestimated protein abundances and the importance of transcription in mammals. PeerJ 2, e270 (2014).
39. Crick, F. Memory and molecular turnover. Nature 312, 101 (1984).40. Marioni, J.C., Mason, C.E., Mane, S.M., Stephens, M. & Gilad, Y. RNA-seq: an
assessment of technical reproducibility and comparison with gene expression arrays. Genome Res. 18, 1509–1517 (2008).
41. Lee, C.J. & Irizarry, K. Alternative splicing in the nervous system: an emerging source of diversity and regulation. Biol. Psychiatry 54, 771–776 (2003).
42. Kapranov, P. et al. The majority of total nuclear-encoded non-ribosomal RNA in a human cell is ‘dark matter’ un-annotated RNA. BMC Biol. 8, 149 (2010).
43. Mercer, T.R., Dinger, M.E., Sunkin, S.M., Mehler, M.F. & Mattick, J.S. Specific expression of long noncoding RNAs in the mouse brain. Proc. Natl. Acad. Sci. USA 105, 716–721 (2008).
44. Wang, Z., Gerstein, M. & Snyder, M. RNA-Seq: a revolutionary tool for transcriptomics. Nat. Rev. Genet. 10, 57–63 (2009).
45. Djebali, S. et al. Landscape of transcription in human cells. Nature 489, 101–108 (2012).
46. Hansen, T.B. et al. Natural RNA circles function as efficient microRNA sponges. Nature 495, 384–388 (2013).
47. Katayama, S. et al. Antisense transcription in the mammalian transcriptome. Science 309, 1564–1566 (2005).
48. Morris, K.V., Santoso, S., Turner, A.M., Pastori, C. & Hawkins, P.G. Bidirectional transcription directs both transcriptional gene activation and suppression in human cells. PLoS Genet. 4, e1000258 (2008).
49. Modarresi, F. et al. Inhibition of natural antisense transcripts in vivo results in gene-specific transcriptional upregulation. Nat. Biotechnol. 30, 453–459 (2012).
50. Derrien, T. et al. The GENCODE v7 catalog of human long noncoding RNAs: analysis of their gene structure, evolution, and expression. Genome Res. 22, 1775–1789 (2012).
51. Trapnell, C. et al. Transcript assembly and quantification by RNA-Seq reveals unannotated transcripts and isoform switching during cell differentiation. Nat. Biotechnol. 28, 511–515 (2010).
52. Levin, J.Z. et al. Comprehensive comparative analysis of strand-specific RNA sequencing methods. Nat. Methods 7, 709–715 (2010).
53. Core, L.J., Waterfall, J.J. & Lis, J.T. Nascent RNA sequencing reveals widespread pausing and divergent initiation at human promoters. Science 322, 1845–1848 (2008).
54. Churchman, L.S. & Weissman, J.S. Nascent transcript sequencing visualizes transcription at nucleotide resolution. Nature 469, 368–373 (2011).
55. Ingolia, N.T., Lareau, L.F. & Weissman, J.S. Ribosome profiling of mouse embryonic stem cells reveals the complexity and dynamics of mammalian proteomes. Cell 147, 789–802 (2011).
56. Yeo, G.W. et al. An RNA code for the FOX2 splicing regulator revealed by mapping RNA-protein interactions in stem cells. Nat. Struct. Mol. Biol. 16, 130–137 (2009).
57. Dominissini, D. et al. Topology of the human and mouse m6A RNA methylomes revealed by m6A-seq. Nature 485, 201–206 (2012).
58. Bonaguidi, M.A., Song, J., Ming, G.L. & Song, H. A unifying hypothesis on mammalian neural stem cell properties in the adult hippocampus. Curr. Opin. Neurobiol. 22, 754–761 (2012).
59. Luger, K., Mader, A.W., Richmond, R.K., Sargent, D.F. & Richmond, T.J. Crystal structure of the nucleosome core particle at 2.8-Å resolution. Nature 389, 251–260 (1997).
60. Tan, M. et al. Identification of 67 histone marks and histone lysine crotonylation as a new type of histone modification. Cell 146, 1016–1028 (2011).
61. Garcia, B.A., Pesavento, J.J., Mizzen, C.A. & Kelleher, N.L. Pervasive combinatorial modification of histone H3 in human cells. Nat. Methods 4, 487–489 (2007).
62. Tweedie-Cullen, R.Y. et al. Identification of combinatorial patterns of post-translational modifications on individual histones in the mouse brain. PLoS ONE 7, e36980 (2012).
63. Jenuwein, T. & Allis, C.D. Translating the histone code. Science 293, 1074–1080 (2001).
64. Garcia-Ramirez, M., Rocchini, C. & Ausio, J. Modulation of chromatin folding by histone acetylation. J. Biol. Chem. 270, 17923–17928 (1995).
65. Tse, C., Sera, T., Wolffe, A.P. & Hansen, J.C. Disruption of higher-order folding by core histone acetylation dramatically enhances transcription of nucleosomal arrays by RNA polymerase III. Mol. Cell. Biol. 18, 4629–4638 (1998).
npg
© 2
014
Nat
ure
Am
eric
a, In
c. A
ll rig
hts
rese
rved
.

1474 VOLUME 17 | NUMBER 11 | NOVEMBER 2014 nature neuroscience
r e v i e w
66. Filippakopoulos, P. et al. Histone recognition and large-scale structural analysis of the human bromodomain family. Cell 149, 214–231 (2012).
67. Fischer, A., Sananbenesi, F., Wang, X., Dobbin, M. & Tsai, L.H. Recovery of learning and memory is associated with chromatin remodelling. Nature 447, 178–182 (2007).
68. Guan, J.S. et al. HDAC2 negatively regulates memory formation and synaptic plasticity. Nature 459, 55–60 (2009).
69. Ernst, J. et al. Mapping and analysis of chromatin state dynamics in nine human cell types. Nature 473, 43–49 (2011).
70. Consortium, E.P. et al. An integrated encyclopedia of DNA elements in the human genome. Nature 489, 57–74 (2012).
71. Adli, M. & Bernstein, B.E. Whole-genome chromatin profiling from limited numbers of cells using nano-ChIP-seq. Nat. Protoc. 6, 1656–1668 (2011).
72. Tahiliani, M. et al. Conversion of 5-methylcytosine to 5-hydroxymethylcytosine in mammalian DNA by MLL partner TET1. Science 324, 930–935 (2009).
73. Kriaucionis, S. & Heintz, N. The nuclear DNA base 5-hydroxymethylcytosine is present in Purkinje neurons and the brain. Science 324, 929–930 (2009).
74. He, Y.F. et al. Tet-mediated formation of 5-carboxylcytosine and its excision by TDG in mammalian DNA. Science 333, 1303–1307 (2011).
75. Ito, S. et al. Tet proteins can convert 5-methylcytosine to 5-formylcytosine and 5-carboxylcytosine. Science 333, 1300–1303 (2011).
76. Guo, J.U., Su, Y., Zhong, C., Ming, G.L. & Song, H. Hydroxylation of 5-methylcytosine by TET1 promotes active DNA demethylation in the adult brain. Cell 145, 423–434 (2011).
77. Pfaffeneder, T. et al. Tet oxidizes thymine to 5-hydroxymethyluracil in mouse embryonic stem cell DNA. Nat. Chem. Biol. 10, 574–581 (2014).
78. Maiti, A. & Drohat, A.C. Thymine DNA glycosylase can rapidly excise 5-formylcytosine and 5-carboxylcytosine: potential implications for active demethylation of CpG sites. J. Biol. Chem. 286, 35334–35338 (2011).
79. Zemach, A., McDaniel, I.E., Silva, P. & Zilberman, D. Genome-wide evolutionary analysis of eukaryotic DNA methylation. Science 328, 916–919 (2010).
80. Stadler, M.B. et al. DNA-binding factors shape the mouse methylome at distal regulatory regions. Nature 480, 490–495 (2011).
81. Feng, Y.Q. et al. DNA methylation supports intrinsic epigenetic memory in mammalian cells. PLoS Genet. 2, e65 (2006).
82. Raynal, N.J. et al. DNA methylation does not stably lock gene expression but instead serves as a molecular mark for gene silencing memory. Cancer Res. 72, 1170–1181 (2012).
83. Buschhausen, G., Wittig, B., Graessmann, M. & Graessmann, A. Chromatin structure is required to block transcription of the methylated herpes simplex virus thymidine kinase gene. Proc. Natl. Acad. Sci. USA 84, 1177–1181 (1987).
84. Klose, R.J. & Bird, A.P. Genomic DNA methylation: the mark and its mediators. Trends Biochem. Sci. 31, 89–97 (2006).
85. Nan, X. et al. Transcriptional repression by the methyl-CpG-binding protein MeCP2 involves a histone deacetylase complex. Nature 393, 386–389 (1998).
86. Lister, R. et al. Human DNA methylomes at base resolution show widespread epigenomic differences. Nature 462, 315–322 (2009).
87. Wu, H. et al. Dnmt3a-dependent nonpromoter DNA methylation facilitates transcription of neurogenic genes. Science 329, 444–448 (2010).
88. Maunakea, A.K. et al. Conserved role of intragenic DNA methylation in regulating alternative promoters. Nature 466, 253–257 (2010).
89. Ma, D.K. et al. Epigenetic choreographers of neurogenesis in the adult mammalian brain. Nat. Neurosci. 13, 1338–1344 (2010).
90. Ramsahoye, B.H. et al. Non-CpG methylation is prevalent in embryonic stem cells and may be mediated by DNA methyltransferase 3a. Proc. Natl. Acad. Sci. USA 97, 5237–5242 (2000).
91. LaPlant, Q. et al. Dnmt3a regulates emotional behavior and spine plasticity in the nucleus accumbens. Nat. Neurosci. 13, 1137–1143 (2010).
92. Anier, K., Malinovskaja, K., Aonurm-Helm, A., Zharkovsky, A. & Kalda, A. DNA methylation regulates cocaine-induced behavioral sensitization in mice. Neuropsychopharmacology 35, 2450–2461 (2010).
93. Lubin, F.D., Roth, T.L. & Sweatt, J.D. Epigenetic regulation of BDNF gene transcription in the consolidation of fear memory. J. Neurosci. 28, 10576–10586 (2008).
94. Day, J.J. & Sweatt, J.D. DNA methylation and memory formation. Nat. Neurosci. 13, 1319–1323 (2010).
95. Shapiro, R., Servis, R.E. & Welcher, M. Reactions of uracil and cytosine derivatives with sodium bisulfite. J. Am. Chem. Soc. 92, 422–424 (1970).
96. Hayatsu, H., Wataya, Y., Kai, K. & Iida, S. Reaction of sodium bisulfite with uracil, cytosine, and their derivatives. Biochemistry 9, 2858–2865 (1970).
97. Frommer, M. et al. A genomic sequencing protocol that yields a positive display of 5-methylcytosine residues in individual DNA strands. Proc. Natl. Acad. Sci. USA 89, 1827–1831 (1992).
98. Shiragami, M., Kudo, I., Iida, S. & Hayatsu, H. Formation of diastereomers of 5,6-dihydrothymine-6-sulfonate by deamination of 5-methylcytosine with bisulfite. Chem. Pharm. Bull. (Tokyo) 23, 3027–3029 (1975).
99. Huang, Y. et al. The behaviour of 5-hydroxymethylcytosine in bisulfite sequencing. PloS ONE 5, e8888 (2010).
100. Song, C.X. et al. Genome-wide profiling of 5-formylcytosine reveals its roles in epigenetic priming. Cell 153, 678–691 (2013).
101. Yu, M. et al. Base-resolution analysis of 5-hydroxymethylcytosine in the mammalian genome. Cell 149, 1368–1380 (2012).
102. Yu, M. et al. Tet-assisted bisulfite sequencing of 5-hydroxymethylcytosine. Nat. Protoc. 7, 2159–2170 (2012).
103. Gu, H. et al. Preparation of reduced representation bisulfite sequencing libraries for genome-scale DNA methylation profiling. Nat. Protoc. 6, 468–481 (2011).
104. Boyle, P. et al. Gel-free multiplexed reduced representation bisulfite sequencing for large-scale DNA methylation profiling. Genome Biol. 13, R92 (2012).
105. Jabbari, K. & Bernardi, G. Cytosine methylation and CpG, TpG (CpA) and TpA frequencies. Gene 333, 143–149 (2004).
106. Hon, G.C. et al. Epigenetic memory at embryonic enhancers identified in DNA methylation maps from adult mouse tissues. Nat. Genet. 45, 1198–1206 (2013).
107. Doi, A. et al. Differential methylation of tissue- and cancer-specific CpG island shores distinguishes human induced pluripotent stem cells, embryonic stem cells and fibroblasts. Nat. Genet. 41, 1350–1353 (2009).
108. Irizarry, R.A. et al. The human colon cancer methylome shows similar hypo- and hypermethylation at conserved tissue-specific CpG island shores. Nat. Genet. 41, 178–186 (2009).
109. Gu, H. et al. Preparation of reduced representation bisulfite sequencing libraries for genome-scale DNA methylation profiling. Nat. Protoc. 6, 468–481 (2011).
110. Ivanov, M. et al. In-solution hybrid capture of bisulfite-converted DNA for targeted bisulfite sequencing of 174 ADME genes. Nucleic Acids Res. 41, e72 (2013).
111. Shen, L. et al. Genome-wide analysis reveals TET- and TDG-dependent 5-methylcytosine oxidation dynamics. Cell 153, 692–706 (2013).
112. Mathelier, A. et al. JASPAR 2014: an extensively expanded and updated open-access database of transcription factor binding profiles. Nucleic Acids Res. 42, D142–D147 (2014).
113. Orlando, V., Strutt, H. & Paro, R. Analysis of chromatin structure by in vivo formaldehyde cross-linking. Methods 11, 205–214 (1997).
114. Solomon, M.J., Larsen, P.L. & Varshavsky, A. Mapping protein-DNA interactions in vivo with formaldehyde: evidence that histone H4 is retained on a highly transcribed gene. Cell 53, 937–947 (1988).
115. Iyer, V.R. et al. Genomic binding sites of the yeast cell-cycle transcription factors SBF and MBF. Nature 409, 533–538 (2001).
116. Barski, A. et al. High-resolution profiling of histone methylations in the human genome. Cell 129, 823–837 (2007).
117. Johnson, D.S., Mortazavi, A., Myers, R.M. & Wold, B. Genome-wide mapping of in vivo protein-DNA interactions. Science 316, 1497–1502 (2007).
118. Zentner, G.E. & Henikoff, S. Surveying the epigenomic landscape, one base at a time. Genome Biol. 13, 250 (2012).
119. Kasinathan, S., Orsi, G.A., Zentner, G.E., Ahmad, K. & Henikoff, S. High-resolution mapping of transcription factor binding sites on native chromatin. Nat. Methods 11, 203–209 (2014).
120. Allan, J., Fraser, R.M., Owen-Hughes, T. & Keszenman-Pereyra, D. Micrococcal nuclease does not substantially bias nucleosome mapping. J. Mol. Biol. 417, 152–164 (2012).
121. Rhee, H.S. & Pugh, B.F. Comprehensive genome-wide protein-DNA interactions detected at single-nucleotide resolution. Cell 147, 1408–1419 (2011).
122. Galas, D.J. & Schmitz, A. DNAse footprinting: a simple method for the detection of protein-DNA binding specificity. Nucleic Acids Res. 5, 3157–3170 (1978).
123. Weintraub, H. & Groudine, M. Chromosomal subunits in active genes have an altered conformation. Science 193, 848–856 (1976).
124. Arvey, A., Agius, P., Noble, W.S. & Leslie, C. Sequence and chromatin determinants of cell-type-specific transcription factor binding. Genome Res. 22, 1723–1734 (2012).
125. He, H.H. et al. Refined DNase-seq protocol and data analysis reveals intrinsic bias in transcription factor footprint identification. Nat. Methods 11, 73–78 (2014).
126. Hesselberth, J.R. et al. Global mapping of protein-DNA interactions in vivo by digital genomic footprinting. Nat. Methods 6, 283–289 (2009).
127. Boyle, A.P. et al. High-resolution genome-wide in vivo footprinting of diverse transcription factors in human cells. Genome Res. 21, 456–464 (2011).
128. Giresi, P.G., Kim, J., McDaniell, R.M., Iyer, V.R. & Lieb, J.D. FAIRE (formaldehyde-assisted isolation of regulatory elements) isolates active regulatory elements from human chromatin. Genome Res. 17, 877–885 (2007).
129. Song, L. et al. Open chromatin defined by DNaseI and FAIRE identifies regulatory elements that shape cell-type identity. Genome Res. 21, 1757–1767 (2011).
130. Spilianakis, C.G., Lalioti, M.D., Town, T., Lee, G.R. & Flavell, R.A. Interchromosomal associations between alternatively expressed loci. Nature 435, 637–645 (2005).
131. Thurman, R.E. et al. The accessible chromatin landscape of the human genome. Nature 489, 75–82 (2012).
132. Dekker, J., Rippe, K., Dekker, M. & Kleckner, N. Capturing chromosome conformation. Science 295, 1306–1311 (2002).
133. Simonis, M. et al. Nuclear organization of active and inactive chromatin domains uncovered by chromosome conformation capture-on-chip (4C). Nat. Genet. 38, 1348–1354 (2006).
134. Dostie, J. et al. Chromosome Conformation Capture Carbon Copy (5C): a massively parallel solution for mapping interactions between genomic elements. Genome Res. 16, 1299–1309 (2006).
135. Lieberman-Aiden, E. et al. Comprehensive mapping of long-range interactions reveals folding principles of the human genome. Science 326, 289–293 (2009).
npg
© 2
014
Nat
ure
Am
eric
a, In
c. A
ll rig
hts
rese
rved
.

nature neuroscience VOLUME 17 | NUMBER 11 | NOVEMBER 2014 1475
r e v i e w
136. Wei, C.L. et al. A global map of p53 transcription-factor binding sites in the human genome. Cell 124, 207–219 (2006).
137. Guelen, L. et al. Domain organization of human chromosomes revealed by mapping of nuclear lamina interactions. Nature 453, 948–951 (2008).
138. Voigt, P. et al. Asymmetrically modified nucleosomes. Cell 151, 181–193 (2012).
139. Statham, A.L. et al. Bisulfite sequencing of chromatin immunoprecipitated DNA (BisChIP-seq) directly informs methylation status of histone-modified DNA. Genome Res. 22, 1120–1127 (2012).
140. Brinkman, A.B. et al. Sequential ChIP-bisulfite sequencing enables direct genome-scale investigation of chromatin and DNA methylation cross-talk. Genome Res. 22, 1128–1138 (2012).
141. Blanco, L. & Salas, M. Characterization and purification of a phage phi 29-encoded DNA polymerase required for the initiation of replication. Proc. Natl. Acad. Sci. USA 81, 5325–5329 (1984).
142. Dean, F.B. et al. Comprehensive human genome amplification using multiple displacement amplification. Proc. Natl. Acad. Sci. USA 99, 5261–5266 (2002).
143. Tang, F. et al. mRNA-Seq whole-transcriptome analysis of a single cell. Nat. Methods 6, 377–382 (2009).
144. Lee, J.H. et al. Highly multiplexed subcellular RNA sequencing in situ. Science 343, 1360–1363 (2014).
145. Bentley, D.R. et al. Accurate whole human genome sequencing using reversible terminator chemistry. Nature 456, 53–59 (2008).
146. Fedurco, M., Romieu, A., Williams, S., Lawrence, I. & Turcatti, G. BTA, a novel reagent for DNA attachment on glass and efficient generation of solid-phase amplified DNA colonies. Nucleic Acids Res. 34, e22 (2006).
147. Loman, N.J. et al. Performance comparison of benchtop high-throughput sequencing platforms. Nat. Biotechnol. 30, 434–439 (2012).
148. Eid, J. et al. Real-time DNA sequencing from single polymerase molecules. Science 323, 133–138 (2009).
149. Branton, D. et al. The potential and challenges of nanopore sequencing. Nat. Biotechnol. 26, 1146–1153 (2008).
150. Schreiber, J. et al. Error rates for nanopore discrimination among cytosine, methylcytosine, and hydroxymethylcytosine along individual DNA strands. Proc. Natl. Acad. Sci. USA 110, 18910–18915 (2013).
npg
© 2
014
Nat
ure
Am
eric
a, In
c. A
ll rig
hts
rese
rved
.
![Nuclear Transcriptomes at High Resolution Using Retooled ...Breakthrough Technologies Nuclear Transcriptomes at High Resolution Using Retooled INTACT1[OPEN] Mauricio A. Reynoso,a,2](https://img.pdfslide.us/doc/110x75/601744cf4c195c175d7edb9a/nuclear-transcriptomes-at-high-resolution-using-retooled-breakthrough-technologies.jpg)