Embed Size (px)
Citation preview

Declining Inequality in Latin America: Labor Markets & Redistributive
Policies
Nora LustigTulane University
New Challenges for Growth and Productivity
The Growth Dialogue – G24
Washington, DC -- September 25, 2013 1
Inequality in Latin America is high… …but declining since around 2000Decline is pervasive and significant• Larger than the rise in inequality in 1990s• Important contribution to the decline in
poverty• In countries with high growth & low growth• In countries with left and nonleft
governments• In commodity exporters and importers 2
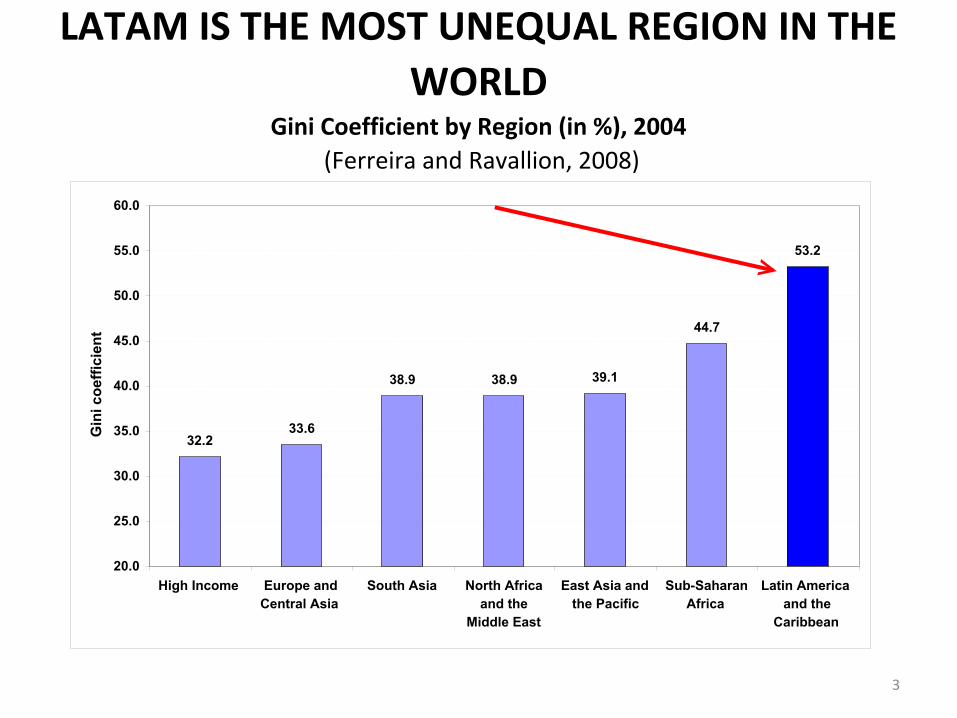
LATAM IS THE MOST UNEQUAL REGION IN THE WORLD
Gini Coefficient by Region (in %), 2004 (Ferreira and Ravallion, 2008)
32.233.6
38.9 38.9 39.1
44.7
53.2
20.0
25.0
30.0
35.0
40.0
45.0
50.0
55.0
60.0
High Income Europe andCentral Asia
South Asia North Africaand the
Middle East
East Asia andthe Pacific
Sub-SaharanAfrica
Latin Americaand the
Caribbean
Gin
i coe
ffici
ent
3
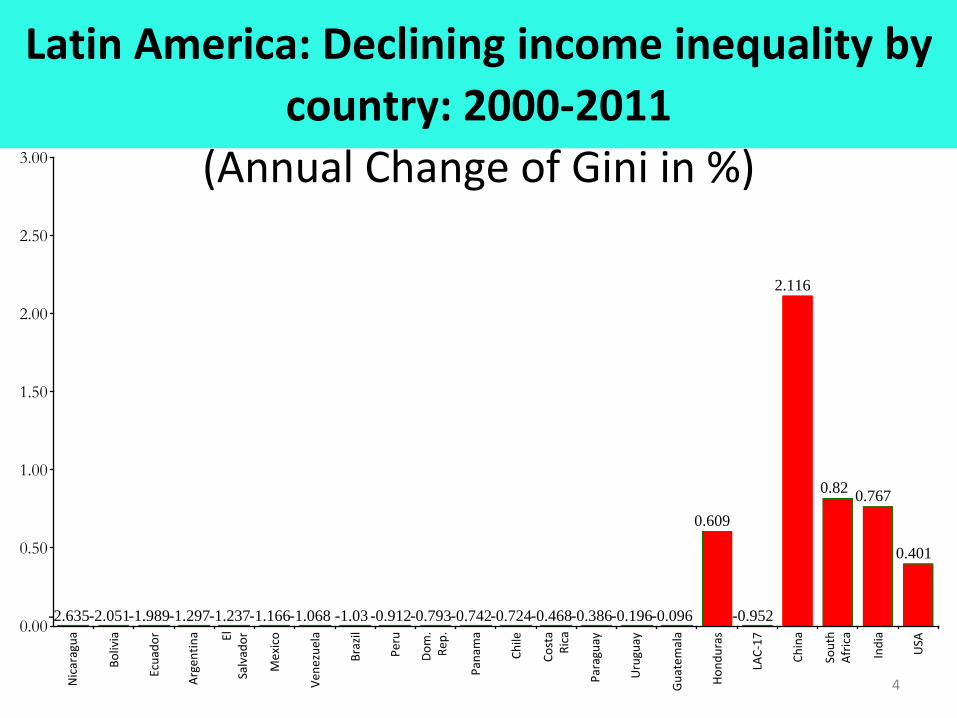
Latin America: Declining income inequality by country: 2000-2011
(Annual Change of Gini in %)
Nic
arag
ua
Boliv
ia
Ecua
dor
Arge
ntin
a El
Salv
ador
Mex
ico
Vene
zuel
a
Braz
il
Peru
Dom
. Re
p.
Pana
ma
Chile
Cost
a Ri
ca
Para
guay
Uru
guay
Guat
emal
a
Hond
uras
LAC-
17
Chin
a
Sout
h Af
rica
Indi
a
USA
0.00
0.50
1.00
1.50
2.00
2.50
3.00
-2.635-2.051-1.989-1.297-1.237-1.166-1.068 -1.03 -0.912-0.793-0.742-0.724-0.468-0.386-0.196-0.096
0.609
-0.952
2.116
0.82 0.767
0.401
4
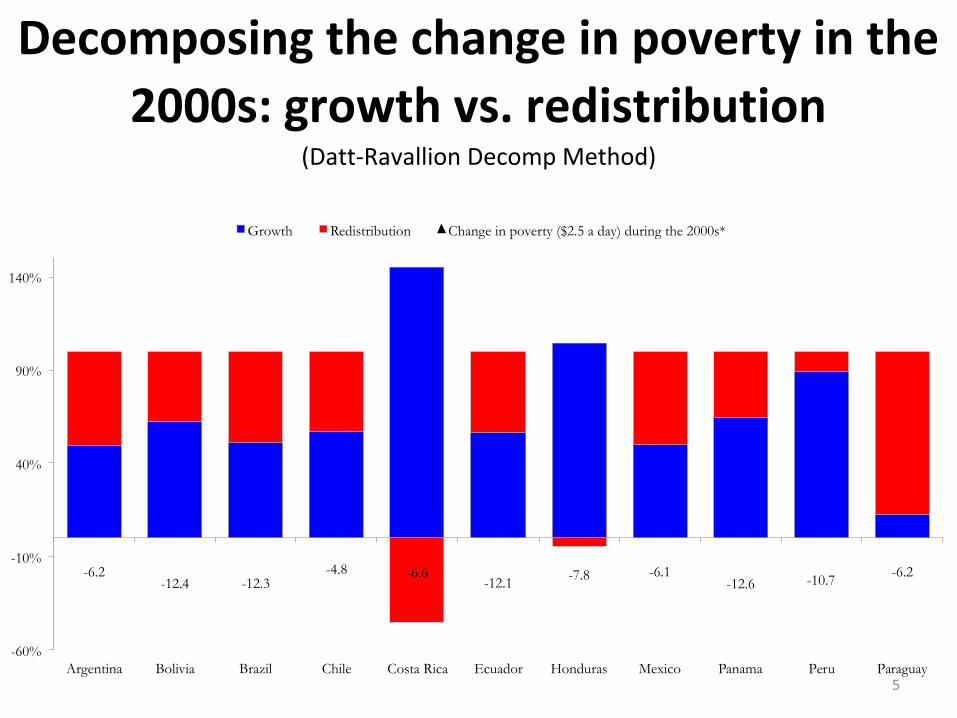
Decomposing the change in poverty in the 2000s: growth vs. redistribution
(Datt-Ravallion Decomp Method)
-6.2 -12.4 -12.3
-4.8 -6.6 -12.1 -7.8 -6.1
-12.6 -10.7 -6.2
-60%
-10%
40%
90%
140%
Argentina Bolivia Brazil Chile Costa Rica Ecuador Honduras Mexico Panama Peru Paraguay
Growth Redistribution Change in poverty ($2.5 a day) during the 2000s*
5
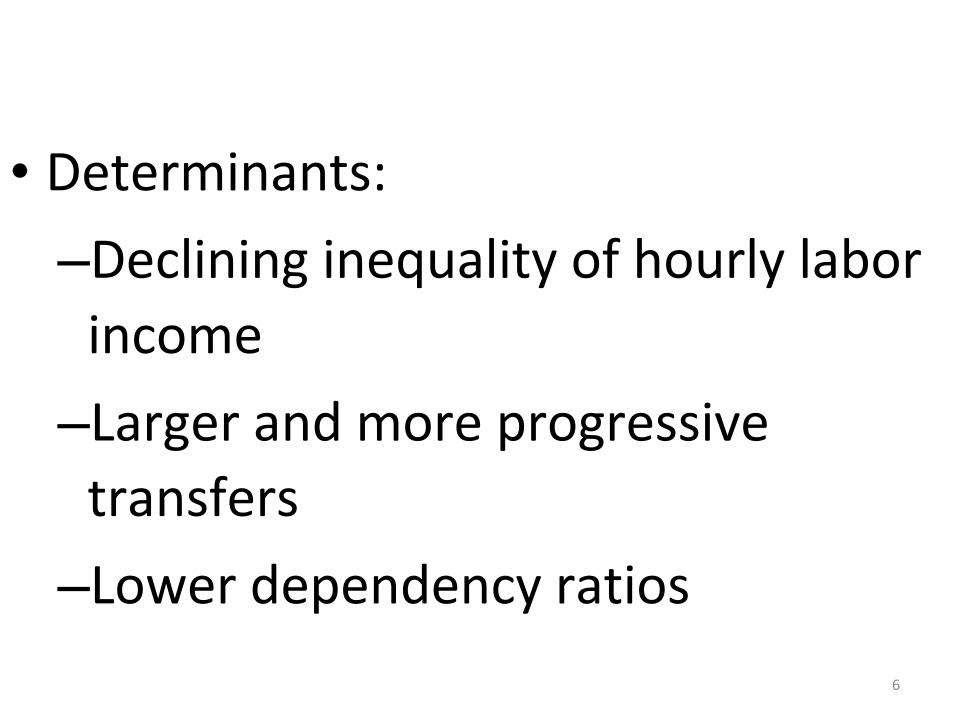
• Determinants:–Declining inequality of hourly labor
income–Larger and more progressive
transfers–Lower dependency ratios
6
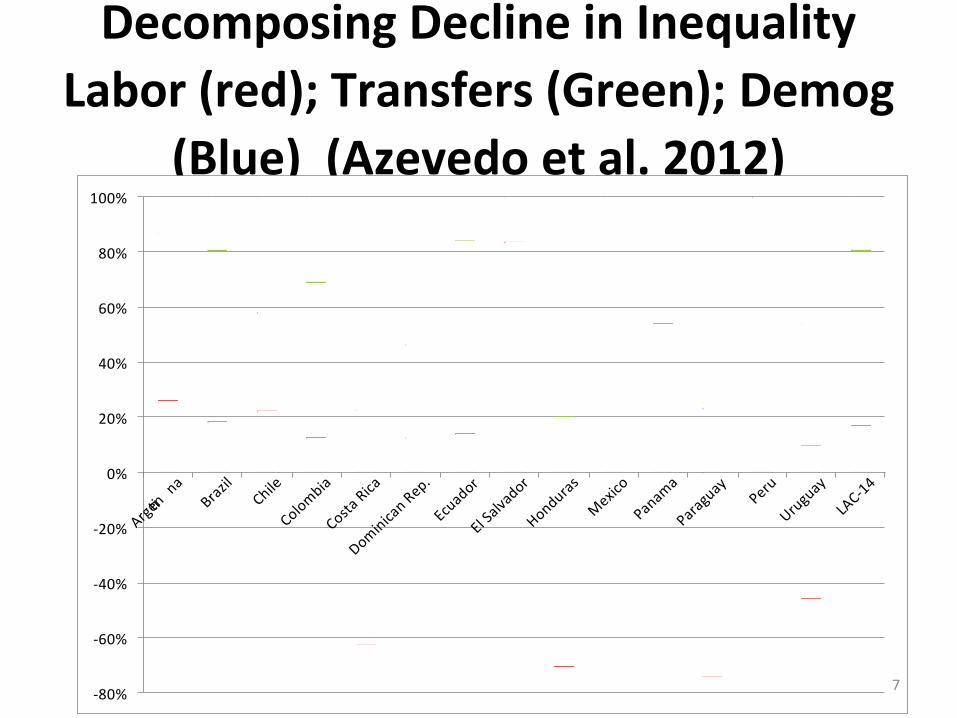
Decomposing Decline in InequalityLabor (red); Transfers (Green); Demog
(Blue) (Azevedo et al. 2012)
-80%
-60%
-40%
-20%
0%
20%
40%
60%
80%
100%
Argenna
BrazilChile
Colombia
CostaRica
Dominican Rep.
Ecuador
El Salvador
Honduras
Mexico
Panama
ParaguayPeru
Uruguay
LAC-14
7
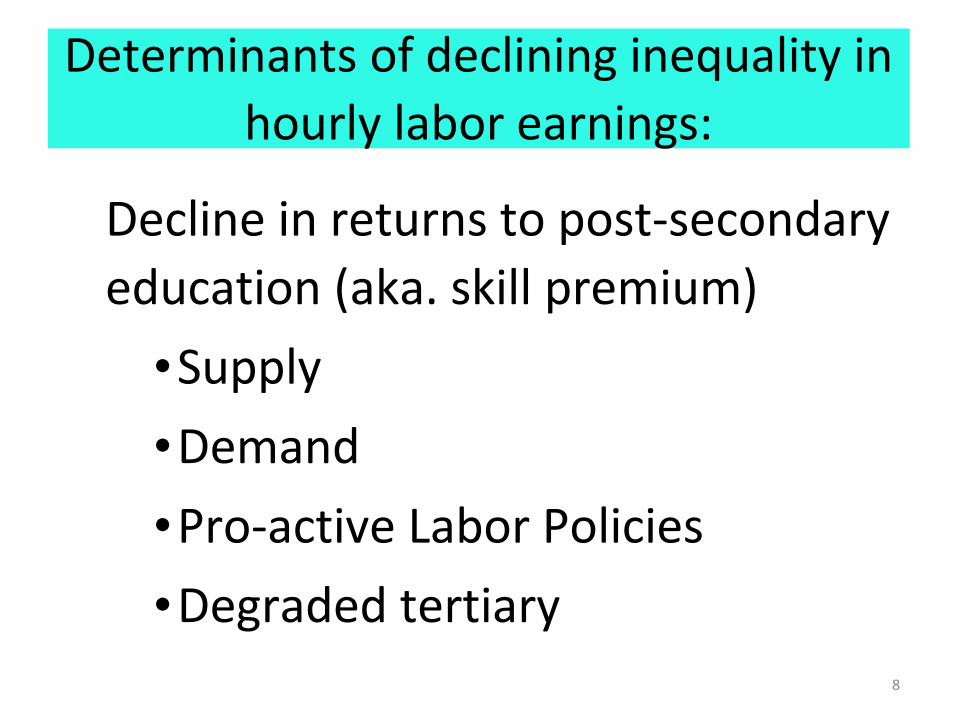
Determinants of declining inequality in hourly labor earnings:
Decline in returns to post-secondary education (aka. skill premium)
•Supply•Demand•Pro-active Labor Policies•Degraded tertiary
8
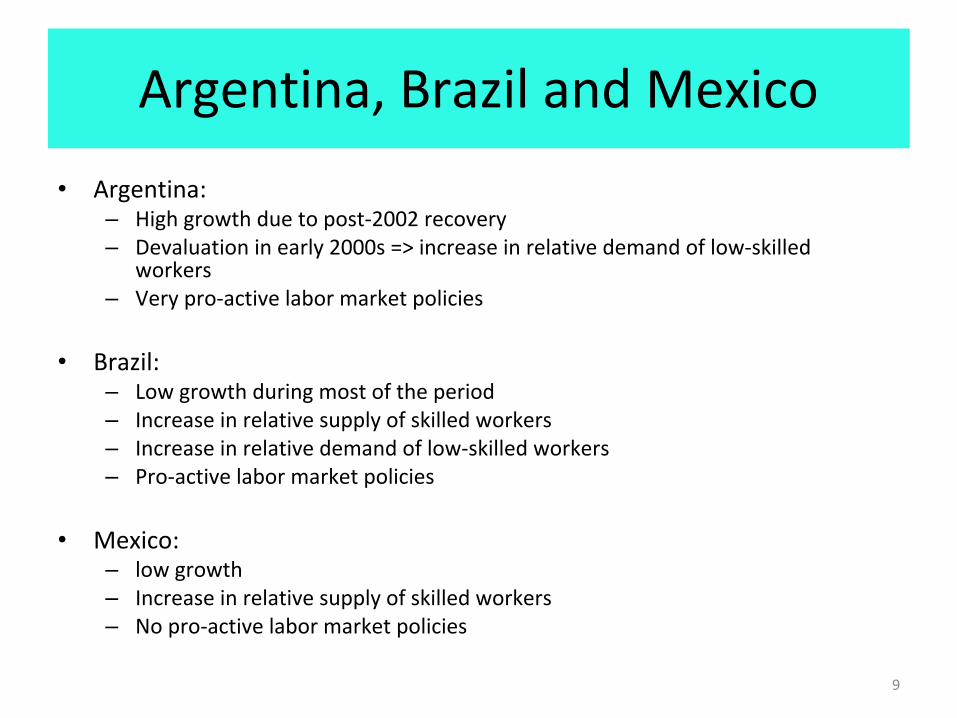
Argentina, Brazil and Mexico• Argentina:
– High growth due to post-2002 recovery– Devaluation in early 2000s => increase in relative demand of low-skilled
workers – Very pro-active labor market policies
• Brazil: – Low growth during most of the period – Increase in relative supply of skilled workers– Increase in relative demand of low-skilled workers– Pro-active labor market policies
• Mexico: – low growth – Increase in relative supply of skilled workers– No pro-active labor market policies
9
How redistributive are Latin American governments?
• Decomposition of changes in inequality by income source show that transfers is, on average, the second most important proximate determinant of decline in overall inequality
• Benefit and tax incidence analysis for 11 countries
• www.commitmentoequity.org
10
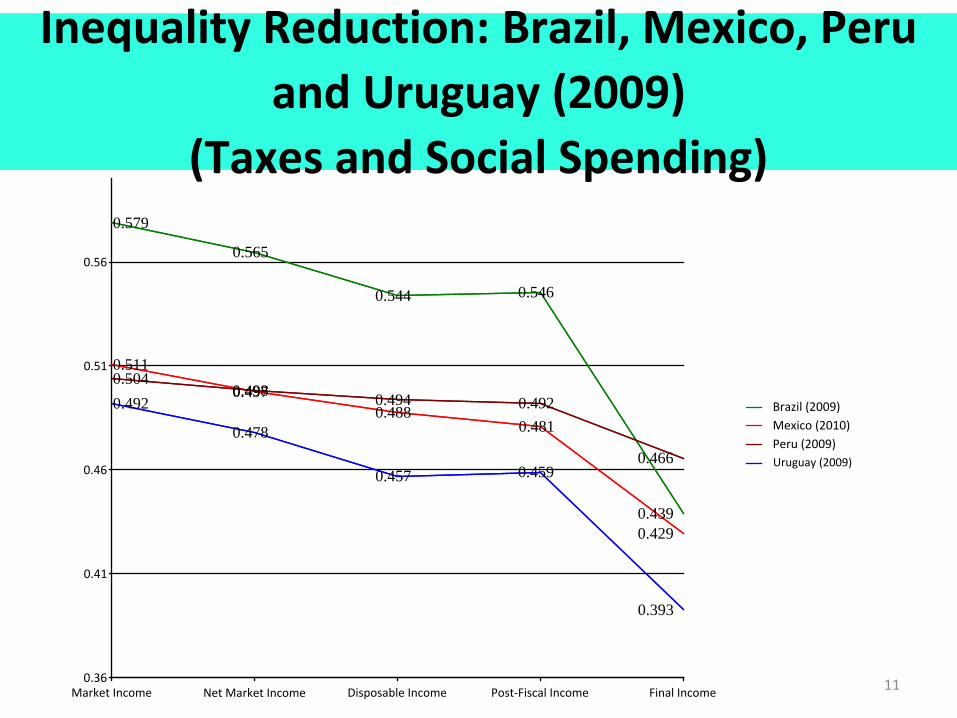
Inequality Reduction: Brazil, Mexico, Peru and Uruguay (2009)
(Taxes and Social Spending)
Market Income Net Market Income Disposable Income Post-Fiscal Income Final Income0.36
0.41
0.46
0.51
0.56
0.579
0.565
0.544 0.546
0.439
0.511
0.4970.488
0.481
0.429
0.5040.498
0.494 0.492
0.466
0.492
0.478
0.457 0.459
0.393
Brazil (2009)Mexico (2010)Peru (2009)Uruguay (2009)
11
Inequality Reduction: Mexico 1996 vs. 2010
(Impact of Social Spending)
12
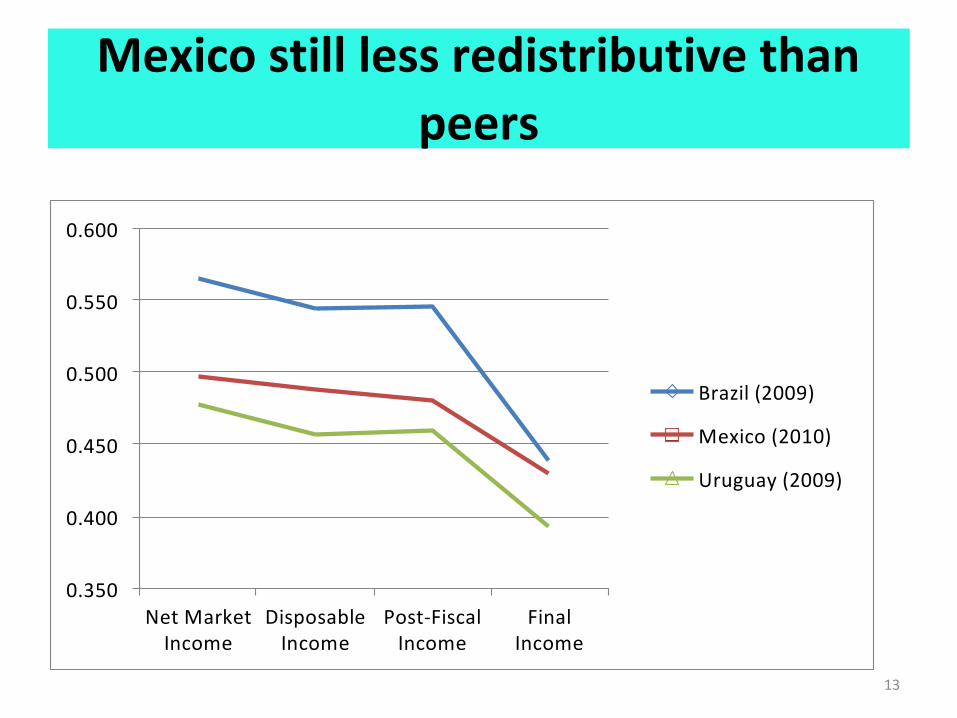
Mexico still less redistributive than peers
13
0.350
0.400
0.450
0.500
0.550
0.600
Net MarketIncome
DisposableIncome
Post-FiscalIncome
FinalIncome
Brazil (2009)
Mexico (2010)
Uruguay (2009)
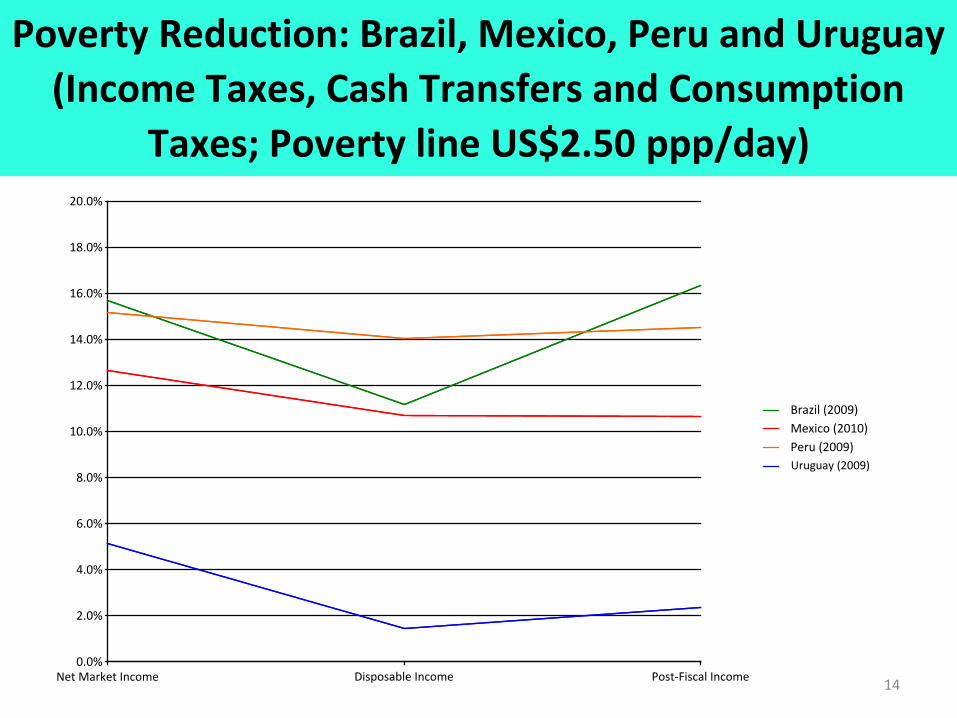
Poverty Reduction: Brazil, Mexico, Peru and Uruguay (Income Taxes, Cash Transfers and Consumption
Taxes; Poverty line US$2.50 ppp/day)
14Net Market Income Disposable Income Post-Fiscal Income0.0%
2.0%
4.0%
6.0%
8.0%
10.0%
12.0%
14.0%
16.0%
18.0%
20.0%
Brazil (2009)Mexico (2010)Peru (2009)Uruguay (2009)
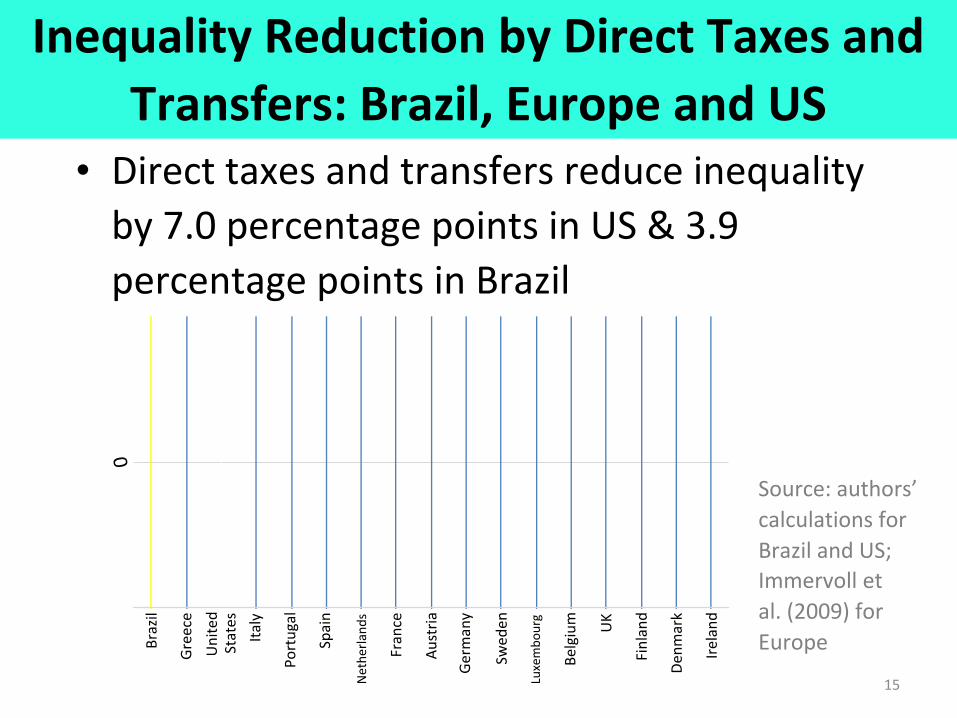
Inequality Reduction by Direct Taxes and Transfers: Brazil, Europe and US
• Direct taxes and transfers reduce inequality by 7.0 percentage points in US & 3.9 percentage points in Brazil
Braz
il
Gree
ceU
nite
d St
ates
Italy
Port
ugal
Spai
n
Net
herla
nds
Fran
ce
Aust
ria
Germ
any
Swed
en
Luxe
mbo
urg
Belg
ium UK
Finl
and
Denm
ark
Irela
nd
0
Source: authors’ calculations for Brazil and US; Immervoll et al. (2009) for Europe
15
How should we measure inequality to monitor how equitable societies are?
Two points:• Regardless of the measure of choice=> before/after
government taxes and transfers• Data:
– Household surveys a good source mainly for labor income and government transfers
– But rich are not captured; use tax returns as suggested by Top Incomes Project (Alvaredo, Atkinson, Piketty, Saez)
16
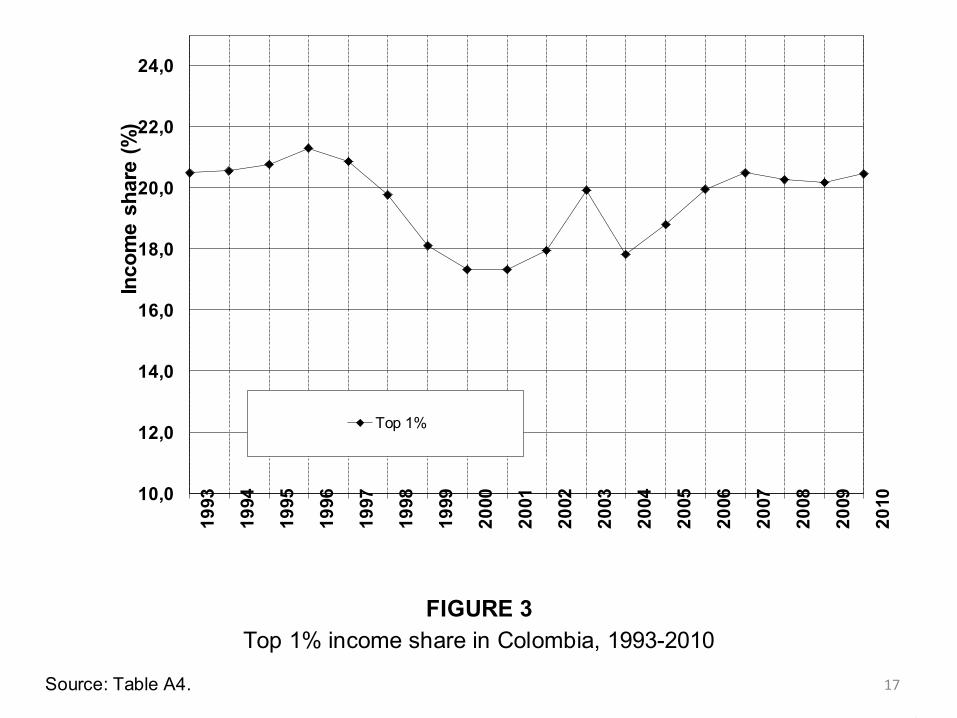
FIGURE 3Top 1% income share in Colombia, 1993-2010
Source: Table A4.
10,0
12,0
14,0
16,0
18,0
20,0
22,0
24,0
1993
1994
1995
1996
1997
1998
1999
2000
2001
2002
2003
2004
2005
2006
2007
2008
2009
2010
Inco
me
shar
e (%
)
Top 1%
17
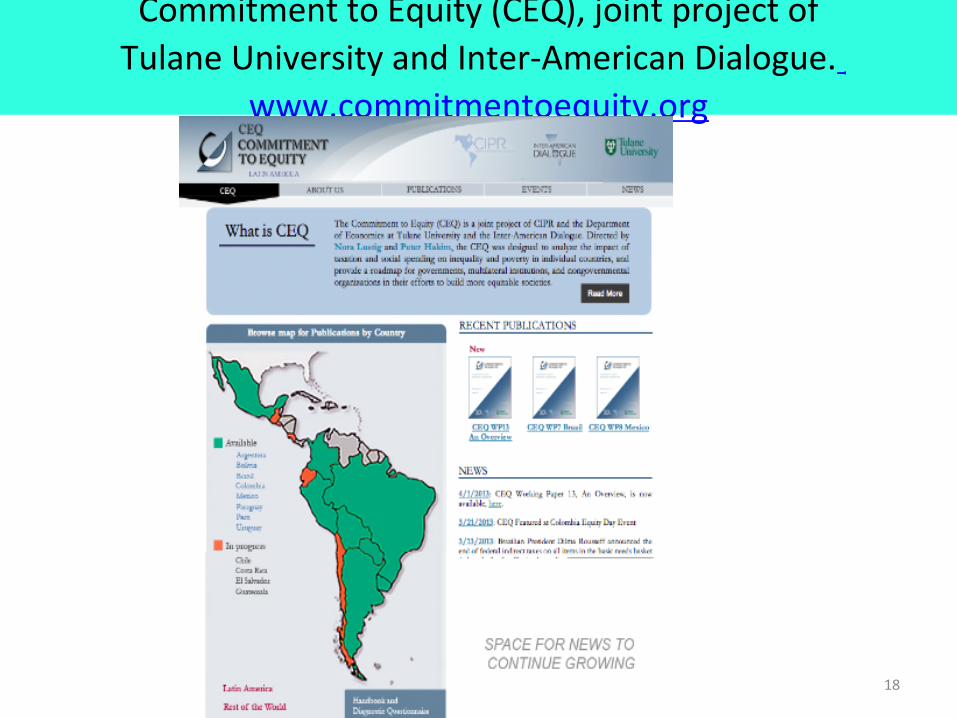
Commitment to Equity (CEQ), joint project of Tulane University and Inter-American Dialogue.
www.commitmentoequity.org
18
References• Alvaredo, Facundo and Juliana Londoño (2013) “High Incomes and Personal Taxation in
a Developing Economy: Colombia 1993-2010,” CEQ Working Paper No. 12, March. • Azevedo, J. P., G. Inchauste, and V. Sanfelice (2012) “Decomposing the Recent Inequality
Decline in Latin America”, Mimeo, The World Bank.• Campos, Raymundo, Gerardo Esquivel and Nora Lustig (2013) ´The Rise and Fall of
Income Inequality in Mexico, 1989–2010,” in Giovanni Andrea Cornia (editor), title not yet specified, Oxford University Press, forthcoming.
• Gasparini, L., S. Galiani, G. Cruces, and P. Acosta (2011) “Educational Upgrading and Returns to Skills in Latin America. Evidence from a Supply-Demand Framework,
• Higgins, S., N. Lustig, W. Ruble and T. Smeeding. “Comparing Taxation, Transfers, and Redistribution in Brazil and the United States,” paper presented at the IARIW Conference, Rio, Brazil, September 13, 2013.
• Lustig, N., L.F. Lopez-Calva and E. Ortiz (2013) “Declining Inequality in Latin America in the 2000s: The Cases of Argentina, Brazil, and Mexico,” World Development, Vol. 44, 129-141.
• Lustig, Nora and Carola Pessino (2014) “Social Spending and Income Redistribution in Argentina in the 2000s: the Rising Role of Noncontributory Pensions,” Public Finance Review.
• Lustig, Nora et. al. (2013)“The Impact of Taxes and Social Spending on Inequality and Poverty in Argentina, Bolivia, Brazil, Mexico, Peru and Uruguay: an Overview,” CEQ Working Paper No. 13.
19
References for Incidence Analysis Argentina: Lustig, Nora, Luis F. Lopez-Calva and Eduardo Ortiz-Juarez (2013) ´Deconstructing the Decline in Inequality in Latin America,´ chapter for Essays in Honor of Enrique IglesiasBrazil: Higgins, Sean and Claudiney Pereira. 2014. The Effects of Brazil’s High Taxation and Social Spending on the Distribution of Household Income. Forthcoming in Lustig, Nora, Carola Pessino, and John Scott, Eds. “Fiscal Policy, Poverty and Redistribution in Latin America,” Public Finance Review. Mexico: Scott, John. 2014. Redistributive Impact and Efficiency of Mexico’s Fiscal System. Forthcoming in Lustig, Nora, Carola Pessino, and John Scott, Eds. “Fiscal Policy, Poverty and Redistribution in Latin America,” Public Finance Review. Peru: Jaramillo, Miguel. 2014. The Incidence of Social Spending and Taxes in Peru. Forthcoming in Lustig, Nora, Carola Pessino, and John Scott, Eds. “Fiscal Policy, Poverty and Redistribution in Latin America,” Public Finance Review. Uruguay: Bucheli, Marisa, Nora Lustig, Máximo Rossi, and Florencia Amábile. 2014. Social Spending, Taxes, and Income Redistribution in Uruguay. Forthcoming in Lustig, Nora, Carola Pessino, and John Scott, Eds. “Fiscal Policy, Poverty and Redistribution in Latin America,” Public Finance Review.
Slide 5:Lopez-Calva, L., N. Lustig, J. Scott and A. Castaneda. Gasto social, redistribución del ingreso y reducción de la pobreza en México: 1996 y 2010. Book chapter (in-progress)For more on Commitment to Equity (CEQ) visit www.commitmentoequity.org
20

Thank you!
21