Embed Size (px)
Citation preview
Decline of the Retail Store ETF Schedule of Portfolio Investments February 29, 2020 (Unaudited)
Investments Principal
Amount ($) Value ($) SHORT-TERM INVESTMENTS - 81.0% REPURCHASE AGREEMENTS(a) - 81.0% Repurchase Agreements with various
counterparties, rates 1.58% - 1.59%, dated 2/28/2020, due 3/2/2020, total to be received $8,085,850
(Cost $8,084,783) 8,084,783 8,084,783 Total Investments - 81.0%
(Cost $8,084,783) 8,084,783 Other Assets Less Liabilities - 19.0% 1,899,100 Net Assets - 100.0% 9,983,883
(a) The Fund invests in Repurchase Agreements jointly with other funds in the Trust. See "Repurchase Agreements" in the Notes to Schedules of Portfolio of Investments to view the details of each individual agreement and counterparty as well as a description of the securities subject to repurchase.
Swap Agreements Decline of the Retail Store ETF had the following open non-exchange traded total return swap agreements as of February 29, 2020:
Notional
Amount ($) Termination
Date1 Counterparty Rate Paid
(Received)2 Underlying Instrument
Value and Unrealized
Appreciation/ (Depreciation)
($)
(5,926,718)
2/8/2021 Credit Suisse International (1.67)%
Solactive-ProShares Bricks and Mortar Retail Store Index (80,142)
(4,043,123)
1/6/2021 Societe Generale (0.47)%
Solactive-ProShares Bricks and Mortar Retail Store Index 733,239
(9,969,841)
653,097
Total Unrealized Appreciation 733,239
Total Unrealized Depreciation (80,142)
1 Agreements may be terminated at will by either party without penalty. Payment is due at termination/maturity. 2 Reflects the floating financing rate, as of February 29, 2020, on the notional amount of the swap agreement paid to the
counterparty or received from the counterparty, excluding any commissions. This amount is included as part of the unrealized appreciation/(depreciation).
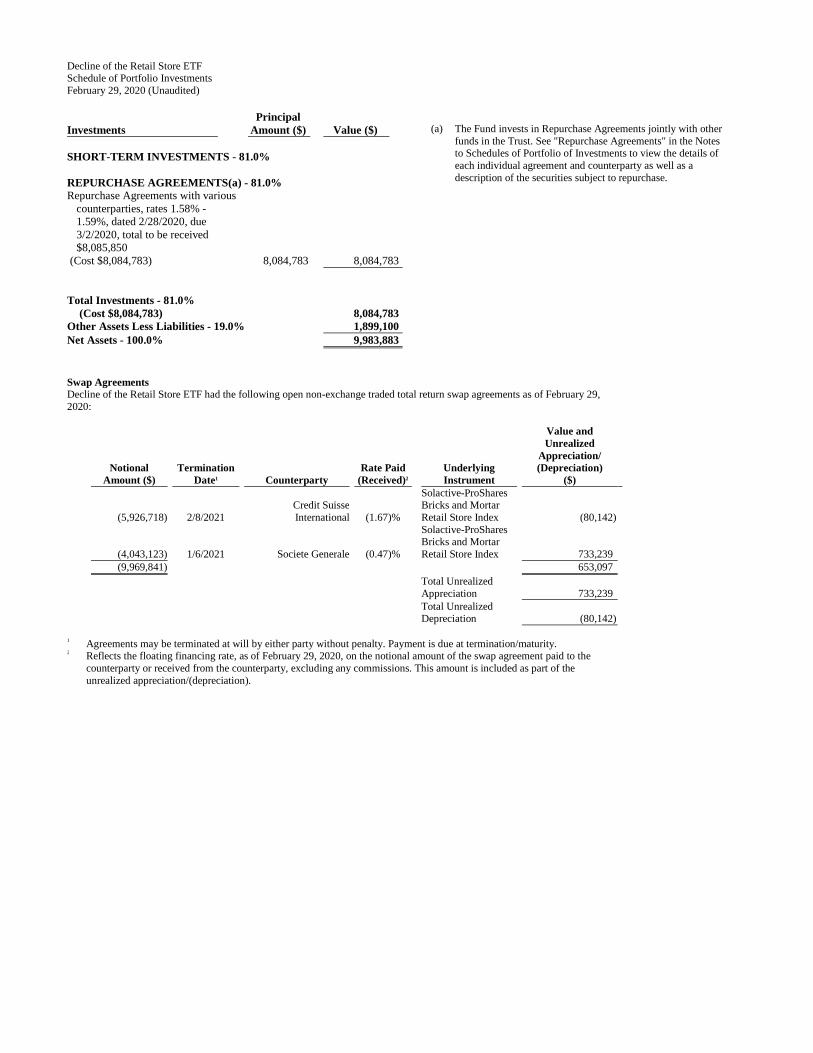
DJ Brookfield Global Infrastructure ETF Schedule of Portfolio Investments February 29, 2020 (Unaudited)
Investments Shares Value ($) COMMON STOCKS - 90.0%
Construction & Engineering - 5.6% Ferrovial SA 59,473 1,699,157 Vinci SA 62,910 6,318,515
8,017,672 Diversified Telecommunication Services - 2.3% Cellnex Telecom SA(a) 33,377 1,616,457 China Tower Corp. Ltd., Class H(a) 5,485,551 1,330,044 Infrastrutture Wireless Italiane SpA(a) 29,488 301,118
3,247,619 Electric Utilities - 8.4% AusNet Services 213,761 236,037 Edison International 40,377 2,712,931 Elia Group SA/NV 4,059 403,732 Eversource Energy 36,453 3,151,726 Fortis, Inc. 57,016 2,307,401 Hydro One Ltd.(a) 37,596 754,581 Red Electrica Corp. SA 53,563 1,025,625 Spark Infrastructure Group 206,690 284,108 Terna Rete Elettrica Nazionale SpA 173,317 1,146,086
12,022,227 Equity Real Estate Investment Trusts (REITs) - 14.9% American Tower Corp. 49,977 11,334,783 CorEnergy Infrastructure Trust, Inc. 1,404 49,000 Crown Castle International Corp. 46,911 6,721,877 SBA Communications Corp. 12,705 3,367,968
21,473,628 Gas Utilities - 9.9% APA Group 144,982 1,014,377 Atmos Energy Corp. 13,466 1,390,365 Beijing Enterprises Holdings Ltd. 59,267 250,146 Chesapeake Utilities Corp. 1,870 159,885 China Gas Holdings Ltd. 256,509 937,846 China Resources Gas Group Ltd. 101,706 507,551 Enagas SA 30,798 795,587 ENN Energy Holdings Ltd. 93,304 1,033,586 Hong Kong & China Gas Co. Ltd. 1,214,714 2,337,487 Italgas SpA 59,656 364,322 Kunlun Energy Co. Ltd. 492,263 343,542 National Fuel Gas Co. 9,712 355,556 New Jersey Resources Corp. 10,748 379,512 Northwest Natural Holding Co. 3,413 224,473 ONE Gas, Inc. 5,948 488,569 Snam SpA 268,853 1,326,994 Southwest Gas Holdings, Inc. 6,179 399,658 Spire, Inc. 5,729 429,961 Toho Gas Co. Ltd. 12,270 419,200 Tokyo Gas Co. Ltd. 48,178 975,084 Towngas China Co. Ltd.* 125,484 72,763
14,206,464 Media - 0.6% Eutelsat Communications SA 20,994 283,678 SES SA, FDR 47,389 543,031
826,709 Multi-Utilities - 11.3% ACEA SpA 5,527 115,563 CenterPoint Energy, Inc. 56,668 1,304,497 Consolidated Edison, Inc. 37,429 2,950,154 National Grid plc 464,392 5,851,790 NiSource, Inc. 42,147 1,138,812
Investments Shares Value ($) NorthWestern Corp. 5,678 399,390 Sempra Energy 31,806 4,445,843 Unitil Corp. 1,631 91,890
16,297,939 Oil, Gas & Consumable Fuels - 22.6% Antero Midstream Corp. 33,478 145,964 Cheniere Energy, Inc.* 26,157 1,341,593 Enbridge, Inc. 250,442 9,321,723 EnLink Midstream LLC* 28,964 110,353 Inter Pipeline Ltd. 51,365 759,999 Keyera Corp. 26,597 638,447 Kinder Morgan, Inc. 219,779 4,213,163 Koninklijke Vopak NV 8,228 391,944 ONEOK, Inc. 46,515 3,103,481 Pembina Pipeline Corp. 64,221 2,313,344 Plains GP Holdings LP, Class A* 20,520 282,560 Tallgrass Energy LP, Class A 16,957 374,241 Targa Resources Corp. 26,265 850,986 TC Energy Corp. 115,624 6,026,489 Williams Cos., Inc. (The) 136,477 2,599,887
32,474,174 Transportation Infrastructure - 8.9% Aena SME SA(a) 9,073 1,452,340 Aeroports de Paris 4,028 594,970 ASTM SpA 9,017 223,176 Atlantia SpA 58,195 1,245,377 Atlas Arteria Ltd. 104,529 546,125 Auckland International Airport Ltd. 116,461 572,888 Beijing Capital International Airport Co. Ltd., Class H 202,078 157,618 China Merchants Port Holdings Co. Ltd. 161,983 238,143 COSCO SHIPPING Ports Ltd. 209,808 139,693 Flughafen Zurich AG (Registered) 2,348 354,342 Fraport AG Frankfurt Airport Services Worldwide 4,577 287,705 Getlink SE 53,391 859,360 Grupo Aeroportuario del Centro Norte SAB de CV, ADR 5,314 276,753 Grupo Aeroportuario del Pacifico SAB de CV, ADR 4,654 504,401 Grupo Aeroportuario del Sureste SAB de CV, ADR 2,523 421,341 Hamburger Hafen und Logistik AG 2,664 56,289 Hutchison Port Holdings Trust 685,794 100,812 Japan Airport Terminal Co. Ltd. 8,976 351,184 Jiangsu Expressway Co. Ltd., Class H 149,979 173,356 Shenzhen Expressway Co. Ltd., Class H 85,428 103,347 Sydney Airport 135,570 686,224 Transurban Group 322,053 3,115,551 Westshore Terminals Investment Corp. 5,642 59,226 Yuexiu Transport Infrastructure Ltd. 110,254 85,572 Zhejiang Expressway Co. Ltd., Class H 176,202 133,140
12,738,933 Water Utilities - 5.5% American States Water Co. 4,165 318,997 American Water Works Co., Inc. 20,359 2,517,594

DJ Brookfield Global Infrastructure ETF Schedule of Portfolio Investments February 29, 2020 (Unaudited)
Investments Shares Value ($) Beijing Enterprises Water Group Ltd.* 743,115 345,103 California Water Service Group 5,408 259,368 China Water Affairs Group Ltd. 108,225 86,219 Cia de Saneamento Basico do Estado de Sao Paulo, ADR* 42,230 550,257 Essential Utilities, Inc. 24,353 1,047,423 Pennon Group plc 52,026 719,081 Severn Trent plc 29,507 932,569 SJW Group 2,929 179,196 United Utilities Group plc 84,378 1,021,485
7,977,292 TOTAL COMMON STOCKS (Cost $120,770,127) 129,282,657 MASTER LIMITED PARTNERSHIPS - 9.1%
Multi-Utilities - 0.6% Brookfield Infrastructure Partners LP 17,677 893,396
Oil, Gas & Consumable Fuels - 8.5% BP Midstream Partners LP 5,201 69,277 Cheniere Energy Partners LP 4,704 159,466 CNX Midstream Partners LP 4,726 55,341 Crestwood Equity Partners LP 5,361 111,723 DCP Midstream LP 10,081 157,163 Enable Midstream Partners LP 6,101 37,826 Energy Transfer LP 259,633 2,876,734 Enterprise Products Partners LP 167,951 3,919,976 EQM Midstream Partners LP 9,266 160,858 Genesis Energy LP 12,413 123,261 Holly Energy Partners LP 4,941 102,476 Magellan Midstream Partners LP 25,771 1,405,808 MPLX LP 42,634 865,044 Noble Midstream Partners LP 3,745 57,486 NuStar Energy LP 11,037 250,540 Phillips 66 Partners LP 6,395 347,696 Plains All American Pipeline LP 48,941 669,023 Shell Midstream Partners LP 14,470 247,582 TC PipeLines LP 6,086 230,964 Western Midstream Partners LP 22,478 293,563
12,141,807 TOTAL MASTER LIMITED PARTNERSHIPS (Cost $16,735,936) 13,035,203 CLOSED END FUNDS - 0.5%
Capital Markets - 0.5% 3i Infrastructure plc 73,816 280,617 Hicl Infrastructure plc 229,098 505,229
TOTAL CLOSED END FUNDS (Cost $745,395) 785,846
Investments Principal
Amount ($) Value ($) SHORT-TERM INVESTMENTS - 0.4% REPURCHASE AGREEMENTS(b) - 0.4% Repurchase Agreements with various
counterparties, rates 1.58% - 1.59%, dated 2/28/2020, due 3/2/2020, total to be received $629,779
(Cost $629,696) 629,696 629,696 Total Investments - 100.0%
(Cost $138,881,154) 143,733,402 Liabilities in excess of other assets - 0.0%(c) (36,007) Net Assets - 100.0% 143,697,395
* Non-income producing security. (a) Security exempt from registration pursuant to Regulation S
under the Securities Act of 1933. Regulation S applies to securities offerings that are made outside of the United States and do not involve direct selling efforts in the United States and as such may have restrictions on resale.
(b) The Fund invests in Repurchase Agreements jointly with other funds in the Trust. See "Repurchase Agreements" in the Notes to Schedules of Portfolio of Investments to view the details of each individual agreement and counterparty as well as a description of the securities subject to repurchase.
(c) Represents less than 0.05% of net assets.
Abbreviations ADR American Depositary Receipt FDR Fiduciary Depositary Receipt

DJ Brookfield Global Infrastructure ETF Schedule of Portfolio Investments February 29, 2020 (Unaudited)
DJ Brookfield Global Infrastructure ETF invested, as a percentage of net assets, in the following countries as of February 29, 2020: United States 49.6% Canada 16.1% United Kingdom 6.5% France 5.6% Spain 4.6% Australia 4.1% Hong Kong 3.6% Italy 3.3% China 2.1% Japan 1.2% Mexico 0.6% New Zealand 0.4% Brazil 0.4% Luxembourg 0.4% Belgium 0.3% Netherlands 0.3% Switzerland 0.2% Germany 0.2% Singapore 0.1% Other 1 0.4% 100.0%
1 Includes any non-equity securities and net other assets (liabilities).
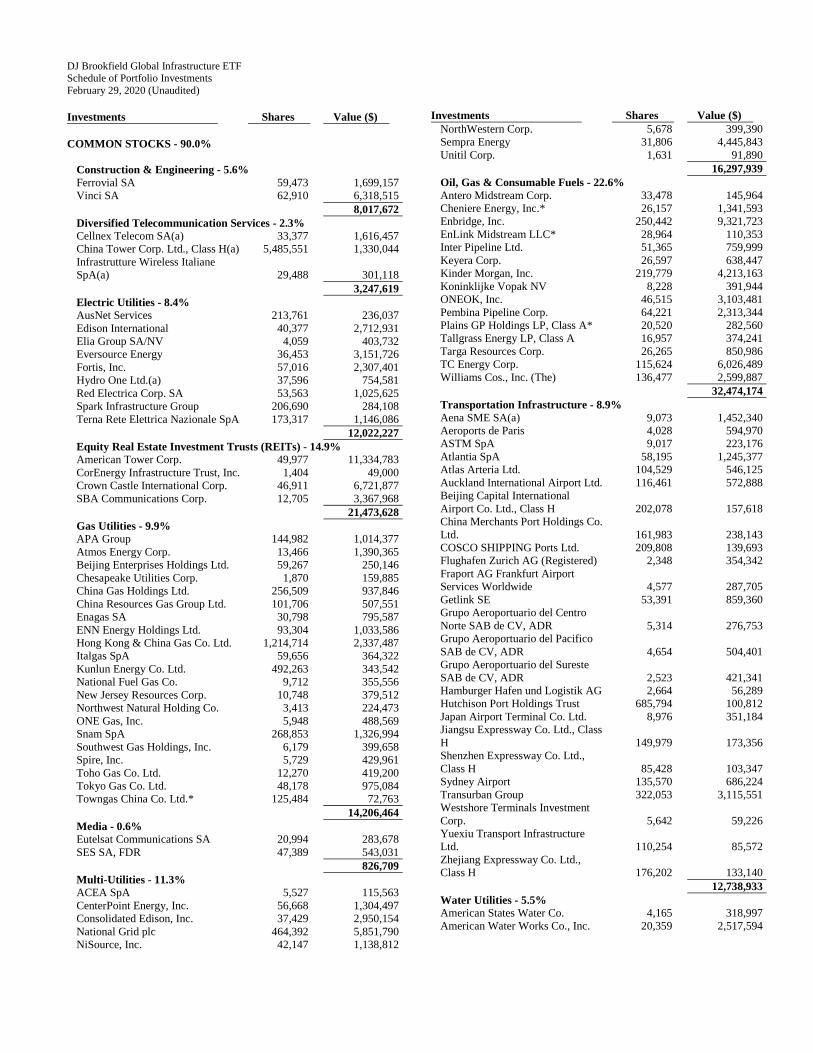
Equities for Rising Rates ETF Schedule of Portfolio Investments February 29, 2020 (Unaudited)
Investments Shares Value ($) COMMON STOCKS - 99.5%
Aerospace & Defense - 1.7% Textron, Inc. 739 30,003
Air Freight & Logistics - 1.8% FedEx Corp. 216 30,493
Airlines - 3.8% American Airlines Group, Inc. 768 14,631 Delta Air Lines, Inc. 370 17,068 Southwest Airlines Co. 402 18,568 United Airlines Holdings, Inc.* 247 15,213
65,480 Banks - 12.0% Bank of America Corp. 1,853 52,811 Citigroup, Inc. 822 52,164 Citizens Financial Group, Inc. 1,619 51,306 Regions Financial Corp. 3,818 51,619
207,900 Capital Markets - 13.1% Charles Schwab Corp. (The) 1,355 55,216 Morgan Stanley 1,282 57,729 Northern Trust Corp. 612 53,709 Raymond James Financial, Inc. 725 60,631
227,285 Chemicals - 13.9% Celanese Corp. 354 33,184 DuPont de Nemours, Inc. 685 29,386 Eastman Chemical Co. 558 34,323 International Flavors & Fragrances, Inc.(a) 343 41,084 LyondellBasell Industries NV, Class A 465 33,229 Mosaic Co. (The) 2,059 35,065 PPG Industries, Inc. 328 34,260
240,531 Containers & Packaging - 2.0% International Paper Co. 952 35,186
Electrical Equipment - 3.4% Eaton Corp. plc 345 31,298 Emerson Electric Co. 428 27,439
58,737 Energy Equipment & Services - 4.3% Halliburton Co. 2,237 37,939 Schlumberger Ltd. 1,365 36,978
74,917 Hotels, Restaurants & Leisure - 3.6% Carnival Corp. 426 14,254 Las Vegas Sands Corp. 313 18,251 Royal Caribbean Cruises Ltd. 164 13,187 Wynn Resorts Ltd. 156 16,845
62,537 Insurance - 6.0% Lincoln National Corp. 1,116 50,655 Prudential Financial, Inc. 703 53,042
103,697 Machinery - 4.9% Caterpillar, Inc. 221 27,457 Cummins, Inc. 181 27,383
Investments Shares Value ($) Parker-Hannifin Corp. 158 29,194
84,034 Media - 1.0% Discovery, Inc., Class A* 660 16,962
Metals & Mining - 3.8% Freeport-McMoRan, Inc. 3,353 33,396 Nucor Corp. 771 31,881
65,277 Oil, Gas & Consumable Fuels - 18.0% Concho Resources, Inc. 640 43,533 ConocoPhillips 841 40,721 Devon Energy Corp. 2,122 34,462 EOG Resources, Inc. 657 41,562 Marathon Oil Corp. 4,051 33,542 Noble Energy, Inc. 2,217 35,095 Pioneer Natural Resources Co. 360 44,201 Valero Energy Corp. 585 38,756
311,872 Road & Rail - 1.8% CSX Corp. 450 31,702
Specialty Retail - 1.1% Best Buy Co., Inc. 251 18,988
Trading Companies & Distributors - 3.3% Fastenal Co. 886 30,319 United Rentals, Inc.* 194 25,701
56,020 TOTAL COMMON STOCKS (Cost $2,278,263) 1,721,621 SECURITIES LENDING REINVESTMENTS(b) - 2.2% INVESTMENT COMPANIES - 2.2%
BlackRock Liquidity FedFund, Institutional Class 1.49% (Cost $38,423) 38,423 38,423
Investments Principal
Amount ($) Value ($) SHORT-TERM INVESTMENTS - 0.2% REPURCHASE AGREEMENTS(c) - 0.2% Repurchase Agreements with various
counterparties, rates 1.58% - 1.59%, dated 2/28/2020, due 3/2/2020, total to be received $3,767
(Cost $3,767) 3,767 3,767 Total Investments - 101.9%
(Cost $2,320,453) 1,763,811 Liabilities in excess of other assets - (1.9%) (33,725) Net Assets - 100.0% 1,730,086

Equities for Rising Rates ETF Schedule of Portfolio Investments February 29, 2020 (Unaudited)
* Non-income producing security. (a) The security or a portion of this security is on loan at February
29, 2020. The total value of securities on loan at February 29, 2020 was $36,892, collateralized in the form of cash with a value of $38,423 that was reinvested in the securities shown in the Securities Lending Reinvestment section of the Schedule of Investments.
(b) The security was purchased with cash collateral held from securities on loan at February 29, 2020. The total value of securities purchased was $38,423.
(c) The Fund invests in Repurchase Agreements jointly with other funds in the Trust. See "Repurchase Agreements" in the Notes to Schedules of Portfolio of Investments to view the details of each individual agreement and counterparty as well as a description of the securities subject to repurchase.

Global Listed Private Equity ETF Schedule of Portfolio Investments February 29, 2020 (Unaudited)
Investments Shares Value ($) COMMON STOCKS - 88.2%
Capital Markets - 63.3% 3i Group plc 144,969 1,873,590 Apollo Investment Corp. 26,088 397,581 Ares Capital Corp. 110,447 1,898,584 AURELIUS Equity Opportunities SE & Co. KGaA 10,769 313,617 BlackRock TCP Capital Corp. 23,218 303,924 Brait SE* 185,313 77,214 FS KKR Capital Corp. 198,956 1,054,467 Gimv NV 7,410 426,192 Goldman Sachs BDC, Inc. 13,460 260,451 Golub Capital BDC, Inc. 49,780 829,335 Hercules Capital, Inc. 39,760 524,832 IP Group plc* 300,395 256,511 Main Street Capital Corp. 21,202 782,990 New Mountain Finance Corp. 34,969 447,253 Oaktree Specialty Lending Corp. 49,194 241,050 Prospect Capital Corp. 120,388 663,338 Ratos AB, Class B 88,339 270,459 Solar Capital Ltd. 15,858 296,069 TCG BDC, Inc. 22,157 268,986 TPG Specialty Lending, Inc. 25,476 533,467
11,719,910 Diversified Financial Services - 21.2% Eurazeo SE 13,967 934,383 Onex Corp. 30,953 1,737,842 Wendel SA 10,233 1,250,547
3,922,772 Internet & Direct Marketing Retail - 3.7% Rocket Internet SE*(a) 30,939 675,930
TOTAL COMMON STOCKS (Cost $18,147,887) 16,318,612 CLOSED END FUNDS - 9.3%
Capital Markets - 9.3% Apax Global Alpha Ltd.(a) 171,568 326,664 HBM Healthcare Investments AG Class A* 2,298 528,769 HgCapital Trust plc 143,460 439,610 NB Global Floating Rate Income Fund Ltd. 153,158 172,414 Princess Private Equity Holding Ltd. 23,698 262,922
TOTAL CLOSED END FUNDS (Cost $1,431,018) 1,730,379 MASTER LIMITED PARTNERSHIPS - 1.9%
Diversified Financial Services - 1.9% Compass Diversified Holdings (Cost $336,706) 19,695 361,009
Investments Principal
Amount ($) Value ($) SHORT-TERM INVESTMENTS - 0.5% REPURCHASE AGREEMENTS(b) - 0.5% Repurchase Agreements with various
counterparties, rates 1.58% - 1.59%, dated 2/28/2020, due 3/2/2020, total to be received $87,795
(Cost $87,784) 87,784 87,784 Total Investments - 99.9%
(Cost $20,003,395) 18,497,784 Other Assets Less Liabilities - 0.1% 10,687 Net Assets - 100.0% 18,508,471
* Non-income producing security. (a) Security exempt from registration pursuant to Regulation S
under the Securities Act of 1933. Regulation S applies to securities offerings that are made outside of the United States and do not involve direct selling efforts in the United States and as such may have restrictions on resale.
(b) The Fund invests in Repurchase Agreements jointly with other funds in the Trust. See "Repurchase Agreements" in the Notes to Schedules of Portfolio of Investments to view the details of each individual agreement and counterparty as well as a description of the securities subject to repurchase.

Global Listed Private Equity ETF Schedule of Portfolio Investments February 29, 2020 (Unaudited)
Global Listed Private Equity ETF invested, as a percentage of net assets, in the following countries as of February 29, 2020: United States 47.9% United Kingdom 18.0% France 11.8% Canada 9.4% Germany 5.3% Switzerland 2.8% Belgium 2.3% Sweden 1.5% South Africa 0.4% Other 1 0.6% 100.0%
1 Includes any non-equity securities and net other assets (liabilities).

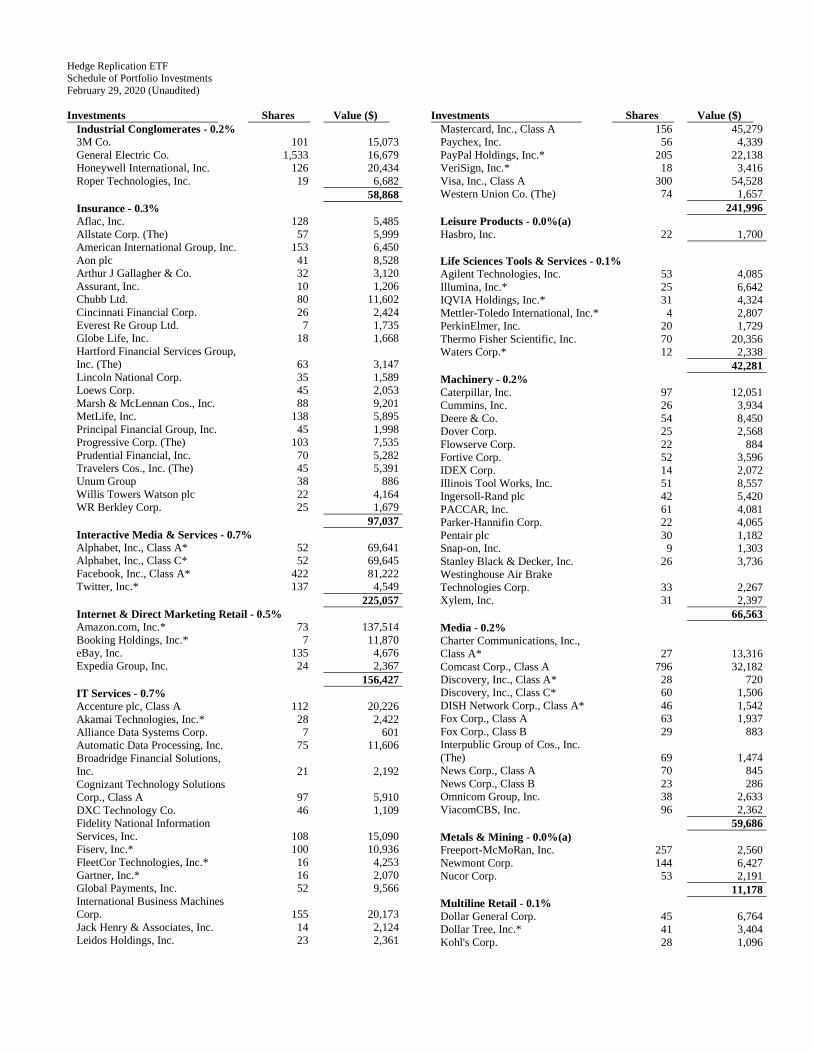
Hedge Replication ETF Schedule of Portfolio Investments February 29, 2020 (Unaudited)
Investments Shares Value ($) COMMON STOCKS - 12.7%
Aerospace & Defense - 0.3% Arconic, Inc. 69 2,025 Boeing Co. (The) 94 25,860 General Dynamics Corp. 41 6,547 Huntington Ingalls Industries, Inc. 7 1,439 L3Harris Technologies, Inc. 39 7,712 Lockheed Martin Corp. 43 15,904 Northrop Grumman Corp. 27 8,879 Raytheon Co. 49 9,239 Textron, Inc. 40 1,624 TransDigm Group, Inc. 8 4,463 United Technologies Corp. 143 18,674
102,366 Air Freight & Logistics - 0.1% CH Robinson Worldwide, Inc. 23 1,585 Expeditors International of Washington, Inc. 29 2,042 FedEx Corp. 42 5,929 United Parcel Service, Inc., Class B 123 11,130
20,686 Airlines - 0.0%(a) Alaska Air Group, Inc. 22 1,110 American Airlines Group, Inc. 70 1,334 Delta Air Lines, Inc. 101 4,659 Southwest Airlines Co. 83 3,834 United Airlines Holdings, Inc.* 38 2,340
13,277 Auto Components - 0.0%(a) Aptiv plc 45 3,515 BorgWarner, Inc. 37 1,169
4,684 Automobiles - 0.0%(a) Ford Motor Co. 684 4,761 General Motors Co. 221 6,740 Harley-Davidson, Inc. 28 853
12,354 Banks - 0.6% Bank of America Corp. 1,420 40,470 Citigroup, Inc. 383 24,305 Citizens Financial Group, Inc. 77 2,440 Comerica, Inc. 25 1,316 Fifth Third Bancorp 126 3,074 First Republic Bank 29 2,917 Huntington Bancshares, Inc. 183 2,245 JPMorgan Chase & Co. 549 63,744 KeyCorp 174 2,845 M&T Bank Corp. 23 3,229 People's United Financial, Inc. 80 1,119 PNC Financial Services Group, Inc. (The) 76 9,606 Regions Financial Corp. 171 2,312 SVB Financial Group* 8 1,665 Truist Financial Corp. 235 10,843 US Bancorp 249 11,564 Wells Fargo & Co. 675 27,574 Zions Bancorp NA 31 1,239
212,507 Beverages - 0.2% Brown-Forman Corp., Class B 33 2,027 Coca-Cola Co. (The) 676 36,159
Investments Shares Value ($) Constellation Brands, Inc., Class A 29 4,999 Molson Coors Beverage Co., Class B 34 1,687 Monster Beverage Corp.* 67 4,181 PepsiCo, Inc. 245 32,347
81,400 Biotechnology - 0.3% AbbVie, Inc. 260 22,285 Alexion Pharmaceuticals, Inc.* 39 3,667 Amgen, Inc. 104 20,772 Biogen, Inc.* 31 9,560 Gilead Sciences, Inc. 221 15,328 Incyte Corp.* 31 2,338 Regeneron Pharmaceuticals, Inc.* 14 6,224 Vertex Pharmaceuticals, Inc.* 45 10,081
90,255 Building Products - 0.0%(a) Allegion plc 17 1,955 AO Smith Corp. 25 989 Fortune Brands Home & Security, Inc. 24 1,482 Johnson Controls International plc 136 4,973 Masco Corp. 51 2,107
11,506 Capital Markets - 0.4% Ameriprise Financial, Inc. 22 3,109 Bank of New York Mellon Corp. (The) 147 5,865 BlackRock, Inc. 21 9,723 Cboe Global Markets, Inc. 20 2,280 Charles Schwab Corp. (The) 202 8,232 CME Group, Inc. 63 12,526 E*TRADE Financial Corp. 39 1,785 Franklin Resources, Inc. 50 1,088 Goldman Sachs Group, Inc. (The) 56 11,243 Intercontinental Exchange, Inc. 97 8,654 Invesco Ltd. 67 965 MarketAxess Holdings, Inc. 7 2,270 Moody's Corp. 28 6,721 Morgan Stanley 216 9,726 MSCI, Inc. 15 4,432 Nasdaq, Inc. 21 2,154 Northern Trust Corp. 38 3,335 Raymond James Financial, Inc. 22 1,840 S&P Global, Inc. 43 11,434 State Street Corp. 64 4,359 T. Rowe Price Group, Inc. 41 4,838
116,579 Chemicals - 0.2% Air Products & Chemicals, Inc. 38 8,345 Albemarle Corp. 19 1,555 Celanese Corp. 22 2,062 CF Industries Holdings, Inc. 38 1,401 Corteva, Inc. 132 3,590 Dow, Inc. 130 5,253 DuPont de Nemours, Inc. 130 5,577 Eastman Chemical Co. 23 1,415 Ecolab, Inc. 44 7,940 FMC Corp. 22 2,048 International Flavors & Fragrances, Inc.(b) 19 2,276 Linde plc 94 17,955

Hedge Replication ETF Schedule of Portfolio Investments February 29, 2020 (Unaudited)
Investments Shares Value ($) LyondellBasell Industries NV, Class A 45 3,216 Mosaic Co. (The) 63 1,073 PPG Industries, Inc. 41 4,283 Sherwin-Williams Co. (The) 15 7,751
75,740 Commercial Services & Supplies - 0.1% Cintas Corp. 15 4,001 Copart, Inc.* 37 3,126 Republic Services, Inc. 38 3,430 Rollins, Inc. 25 936 Waste Management, Inc. 68 7,535
19,028 Communications Equipment - 0.1% Arista Networks, Inc.* 9 1,738 Cisco Systems, Inc. 743 29,668 F5 Networks, Inc.* 10 1,200 Juniper Networks, Inc. 60 1,273 Motorola Solutions, Inc. 30 4,970
38,849 Construction & Engineering - 0.0%(a) Jacobs Engineering Group, Inc. 23 2,124 Quanta Services, Inc. 25 953
3,077 Construction Materials - 0.0%(a) Martin Marietta Materials, Inc. 10 2,275 Vulcan Materials Co. 23 2,766
5,041 Consumer Finance - 0.1% American Express Co. 117 12,862 Capital One Financial Corp. 82 7,237 Discover Financial Services 55 3,607 Synchrony Financial 105 3,056
26,762 Containers & Packaging - 0.1% Amcor plc 286 2,666 Avery Dennison Corp. 15 1,717 Ball Corp. 58 4,087 International Paper Co. 69 2,550 Packaging Corp. of America 17 1,541 Sealed Air Corp. 28 849 Westrock Co. 46 1,529
14,939 Distributors - 0.0%(a) Genuine Parts Co. 25 2,181 LKQ Corp.* 54 1,597
3,778 Diversified Consumer Services - 0.0%(a) H&R Block, Inc. 36 744
Diversified Financial Services - 0.2% Berkshire Hathaway, Inc., Class B* 343 70,775
Diversified Telecommunication Services - 0.3% AT&T, Inc. 1,281 45,117 CenturyLink, Inc. 174 2,100 Verizon Communications, Inc. 725 39,266
86,483 Electric Utilities - 0.3% Alliant Energy Corp. 42 2,189 American Electric Power Co., Inc. 86 7,676 Duke Energy Corp. 128 11,738 Edison International 63 4,233
Investments Shares Value ($) Entergy Corp. 36 4,209 Evergy, Inc. 40 2,614 Eversource Energy 57 4,928 Exelon Corp. 171 7,372 FirstEnergy Corp. 96 4,275 NextEra Energy, Inc. 85 21,485 Pinnacle West Capital Corp. 20 1,790 PPL Corp. 128 3,841 Southern Co. (The) 185 11,166 Xcel Energy, Inc. 92 5,733
93,249 Electrical Equipment - 0.1% AMETEK, Inc. 40 3,440 Eaton Corp. plc 72 6,532 Emerson Electric Co. 107 6,860 Rockwell Automation, Inc. 21 3,853
20,685 Electronic Equipment, Instruments & Components - 0.1% Amphenol Corp., Class A 52 4,767 CDW Corp. 25 2,855 Corning, Inc. 136 3,245 FLIR Systems, Inc. 23 977 IPG Photonics Corp.* 6 766 Keysight Technologies, Inc.* 34 3,222 TE Connectivity Ltd. 59 4,889 Zebra Technologies Corp., Class A* 9 1,899
22,620 Energy Equipment & Services - 0.0%(a) Baker Hughes Co. 115 1,850 Halliburton Co. 155 2,629 Helmerich & Payne, Inc. 19 701 National Oilwell Varco, Inc. 69 1,291 Schlumberger Ltd. 244 6,610 TechnipFMC plc 75 1,113
14,194 Entertainment - 0.2% Activision Blizzard, Inc. 134 7,789 Electronic Arts, Inc.* 51 5,170 Live Nation Entertainment, Inc.* 24 1,458 Netflix, Inc.* 76 28,046 Take-Two Interactive Software, Inc.* 20 2,150 Walt Disney Co. (The) 315 37,060
81,673 Equity Real Estate Investment Trusts (REITs) - 0.4% Alexandria Real Estate Equities, Inc. 21 3,190 American Tower Corp. 78 17,690 Apartment Investment & Management Co., Class A 26 1,244 AvalonBay Communities, Inc. 24 4,814 Boston Properties, Inc. 25 3,224 Crown Castle International Corp. 72 10,317 Digital Realty Trust, Inc. 37 4,444 Duke Realty Corp. 66 2,143 Equinix, Inc. 15 8,592 Equity Residential 61 4,581 Essex Property Trust, Inc. 12 3,400 Extra Space Storage, Inc. 22 2,208 Federal Realty Investment Trust 13 1,512 Healthpeak Properties, Inc. 88 2,784 Host Hotels & Resorts, Inc. 127 1,839

Hedge Replication ETF Schedule of Portfolio Investments February 29, 2020 (Unaudited)
Investments Shares Value ($) Iron Mountain, Inc. 51 1,551 Kimco Realty Corp. 76 1,319 Mid-America Apartment Communities, Inc. 20 2,585 Prologis, Inc. 129 10,872 Public Storage 26 5,437 Realty Income Corp. 57 4,126 Regency Centers Corp. 30 1,723 SBA Communications Corp. 20 5,302 Simon Property Group, Inc. 53 6,523 SL Green Realty Corp. 15 1,177 UDR, Inc. 52 2,339 Ventas, Inc. 66 3,549 Vornado Realty Trust 27 1,447 Welltower, Inc. 71 5,312 Weyerhaeuser Co. 132 3,429
128,673 Food & Staples Retailing - 0.2% Costco Wholesale Corp. 78 21,929 Kroger Co. (The) 142 3,994 Sysco Corp. 89 5,932 Walgreens Boots Alliance, Inc. 131 5,994 Walmart, Inc. 248 26,705
64,554 Food Products - 0.1% Archer-Daniels-Midland Co. 98 3,690 Campbell Soup Co. 30 1,354 Conagra Brands, Inc. 86 2,295 General Mills, Inc. 106 5,194 Hershey Co. (The) 26 3,744 Hormel Foods Corp. 50 2,080 JM Smucker Co. (The) 20 2,060 Kellogg Co. 44 2,661 Kraft Heinz Co. (The) 110 2,725 Lamb Weston Holdings, Inc. 25 2,172 McCormick & Co., Inc. (Non-Voting) 22 3,216 Mondelez International, Inc., Class A 253 13,358 Tyson Foods, Inc., Class A 52 3,527
48,076 Gas Utilities - 0.0%(a) Atmos Energy Corp. 21 2,168
Health Care Equipment & Supplies - 0.5% Abbott Laboratories 309 23,802 ABIOMED, Inc.* 7 1,052 Align Technology, Inc.* 13 2,839 Baxter International, Inc. 89 7,429 Becton Dickinson and Co. 47 11,177 Boston Scientific Corp.* 245 9,161 Cooper Cos., Inc. (The) 8 2,597 Danaher Corp. 112 16,193 DENTSPLY SIRONA, Inc. 39 1,920 Edwards Lifesciences Corp.* 37 7,579 Hologic, Inc.* 47 2,215 IDEXX Laboratories, Inc.* 15 3,818 Intuitive Surgical, Inc.* 21 11,213 Medtronic plc 235 23,657 ResMed, Inc. 25 3,974 STERIS plc 15 2,379 Stryker Corp. 57 10,864 Teleflex, Inc. 7 2,345
Investments Shares Value ($) Varian Medical Systems, Inc.* 16 1,967 Zimmer Biomet Holdings, Inc. 37 5,038
151,219 Health Care Providers & Services - 0.4% AmerisourceBergen Corp. 26 2,192 Anthem, Inc. 44 11,312 Cardinal Health, Inc. 52 2,710 Centene Corp.* 102 5,408 Cigna Corp. 66 12,074 CVS Health Corp. 229 13,552 DaVita, Inc.* 16 1,242 HCA Healthcare, Inc. 46 5,843 Henry Schein, Inc.* 25 1,524 Humana, Inc. 23 7,353 Laboratory Corp. of America Holdings* 17 2,987 McKesson Corp. 31 4,336 Quest Diagnostics, Inc. 23 2,439 UnitedHealth Group, Inc. 167 42,578 Universal Health Services, Inc., Class B 14 1,732
117,282 Health Care Technology - 0.0%(a) Cerner Corp. 55 3,810
Hotels, Restaurants & Leisure - 0.2% Carnival Corp. 71 2,376 Chipotle Mexican Grill, Inc.* 5 3,868 Darden Restaurants, Inc. 22 2,145 Hilton Worldwide Holdings, Inc. 49 4,763 Las Vegas Sands Corp. 59 3,440 Marriott International, Inc., Class A 48 5,952 McDonald's Corp. 132 25,630 MGM Resorts International 91 2,235 Norwegian Cruise Line Holdings Ltd.* 38 1,416 Royal Caribbean Cruises Ltd. 30 2,412 Starbucks Corp. 206 16,157 Wynn Resorts Ltd. 17 1,836 Yum! Brands, Inc. 52 4,641
76,871 Household Durables - 0.1% DR Horton, Inc. 59 3,143 Garmin Ltd. 25 2,210 Leggett & Platt, Inc. 24 952 Lennar Corp., Class A 49 2,957 Mohawk Industries, Inc.* 10 1,211 Newell Brands, Inc. 68 1,049 NVR, Inc.* 1 3,667 PulteGroup, Inc. 46 1,849 Whirlpool Corp. 10 1,279
18,317 Household Products - 0.2% Church & Dwight Co., Inc. 43 2,989 Clorox Co. (The) 22 3,507 Colgate-Palmolive Co. 150 10,136 Kimberly-Clark Corp. 60 7,871 Procter & Gamble Co. (The) 437 49,482
73,985 Independent Power and Renewable Electricity Producers - 0.0%(a) AES Corp. 118 1,974 NRG Energy, Inc. 45 1,495
3,469
Hedge Replication ETF Schedule of Portfolio Investments February 29, 2020 (Unaudited)
Investments Shares Value ($) Industrial Conglomerates - 0.2% 3M Co. 101 15,073 General Electric Co. 1,533 16,679 Honeywell International, Inc. 126 20,434 Roper Technologies, Inc. 19 6,682
58,868 Insurance - 0.3% Aflac, Inc. 128 5,485 Allstate Corp. (The) 57 5,999 American International Group, Inc. 153 6,450 Aon plc 41 8,528 Arthur J Gallagher & Co. 32 3,120 Assurant, Inc. 10 1,206 Chubb Ltd. 80 11,602 Cincinnati Financial Corp. 26 2,424 Everest Re Group Ltd. 7 1,735 Globe Life, Inc. 18 1,668 Hartford Financial Services Group, Inc. (The) 63 3,147 Lincoln National Corp. 35 1,589 Loews Corp. 45 2,053 Marsh & McLennan Cos., Inc. 88 9,201 MetLife, Inc. 138 5,895 Principal Financial Group, Inc. 45 1,998 Progressive Corp. (The) 103 7,535 Prudential Financial, Inc. 70 5,282 Travelers Cos., Inc. (The) 45 5,391 Unum Group 38 886 Willis Towers Watson plc 22 4,164 WR Berkley Corp. 25 1,679
97,037 Interactive Media & Services - 0.7% Alphabet, Inc., Class A* 52 69,641 Alphabet, Inc., Class C* 52 69,645 Facebook, Inc., Class A* 422 81,222 Twitter, Inc.* 137 4,549
225,057 Internet & Direct Marketing Retail - 0.5% Amazon.com, Inc.* 73 137,514 Booking Holdings, Inc.* 7 11,870 eBay, Inc. 135 4,676 Expedia Group, Inc. 24 2,367
156,427 IT Services - 0.7% Accenture plc, Class A 112 20,226 Akamai Technologies, Inc.* 28 2,422 Alliance Data Systems Corp. 7 601 Automatic Data Processing, Inc. 75 11,606 Broadridge Financial Solutions, Inc. 21 2,192 Cognizant Technology Solutions Corp., Class A 97 5,910 DXC Technology Co. 46 1,109 Fidelity National Information Services, Inc. 108 15,090 Fiserv, Inc.* 100 10,936 FleetCor Technologies, Inc.* 16 4,253 Gartner, Inc.* 16 2,070 Global Payments, Inc. 52 9,566 International Business Machines Corp. 155 20,173 Jack Henry & Associates, Inc. 14 2,124 Leidos Holdings, Inc. 23 2,361
Investments Shares Value ($) Mastercard, Inc., Class A 156 45,279 Paychex, Inc. 56 4,339 PayPal Holdings, Inc.* 205 22,138 VeriSign, Inc.* 18 3,416 Visa, Inc., Class A 300 54,528 Western Union Co. (The) 74 1,657
241,996 Leisure Products - 0.0%(a) Hasbro, Inc. 22 1,700
Life Sciences Tools & Services - 0.1% Agilent Technologies, Inc. 53 4,085 Illumina, Inc.* 25 6,642 IQVIA Holdings, Inc.* 31 4,324 Mettler-Toledo International, Inc.* 4 2,807 PerkinElmer, Inc. 20 1,729 Thermo Fisher Scientific, Inc. 70 20,356 Waters Corp.* 12 2,338
42,281 Machinery - 0.2% Caterpillar, Inc. 97 12,051 Cummins, Inc. 26 3,934 Deere & Co. 54 8,450 Dover Corp. 25 2,568 Flowserve Corp. 22 884 Fortive Corp. 52 3,596 IDEX Corp. 14 2,072 Illinois Tool Works, Inc. 51 8,557 Ingersoll-Rand plc 42 5,420 PACCAR, Inc. 61 4,081 Parker-Hannifin Corp. 22 4,065 Pentair plc 30 1,182 Snap-on, Inc. 9 1,303 Stanley Black & Decker, Inc. 26 3,736 Westinghouse Air Brake Technologies Corp. 33 2,267 Xylem, Inc. 31 2,397
66,563 Media - 0.2% Charter Communications, Inc., Class A* 27 13,316 Comcast Corp., Class A 796 32,182 Discovery, Inc., Class A* 28 720 Discovery, Inc., Class C* 60 1,506 DISH Network Corp., Class A* 46 1,542 Fox Corp., Class A 63 1,937 Fox Corp., Class B 29 883 Interpublic Group of Cos., Inc. (The) 69 1,474 News Corp., Class A 70 845 News Corp., Class B 23 286 Omnicom Group, Inc. 38 2,633 ViacomCBS, Inc. 96 2,362
59,686 Metals & Mining - 0.0%(a) Freeport-McMoRan, Inc. 257 2,560 Newmont Corp. 144 6,427 Nucor Corp. 53 2,191
11,178 Multiline Retail - 0.1% Dollar General Corp. 45 6,764 Dollar Tree, Inc.* 41 3,404 Kohl's Corp. 28 1,096

Hedge Replication ETF Schedule of Portfolio Investments February 29, 2020 (Unaudited)
Investments Shares Value ($) Macy's, Inc. 55 728 Nordstrom, Inc. 19 659 Target Corp. 89 9,167
21,818 Multi-Utilities - 0.1% Ameren Corp. 43 3,397 CenterPoint Energy, Inc. 89 2,049 CMS Energy Corp. 50 3,021 Consolidated Edison, Inc. 58 4,572 Dominion Energy, Inc. 144 11,258 DTE Energy Co. 34 3,797 NiSource, Inc. 67 1,810 Public Service Enterprise Group, Inc. 88 4,515 Sempra Energy 49 6,849 WEC Energy Group, Inc. 54 4,986
46,254 Oil, Gas & Consumable Fuels - 0.4% Apache Corp. 67 1,670 Cabot Oil & Gas Corp. 73 1,017 Chevron Corp. 331 30,895 Cimarex Energy Co. 19 628 Concho Resources, Inc. 36 2,449 ConocoPhillips 192 9,297 Devon Energy Corp. 69 1,121 Diamondback Energy, Inc. 28 1,736 EOG Resources, Inc. 102 6,452 Exxon Mobil Corp. 742 38,168 Hess Corp. 45 2,528 HollyFrontier Corp. 27 909 Kinder Morgan, Inc. 343 6,575 Marathon Oil Corp. 142 1,176 Marathon Petroleum Corp. 114 5,406 Noble Energy, Inc. 86 1,361 Occidental Petroleum Corp. 158 5,173 ONEOK, Inc. 72 4,804 Phillips 66 79 5,914 Pioneer Natural Resources Co. 29 3,561 Valero Energy Corp. 71 4,704 Williams Cos., Inc. (The) 214 4,077
139,621 Personal Products - 0.0%(a) Coty, Inc., Class A 54 499 Estee Lauder Cos., Inc. (The), Class A 39 7,160
7,659 Pharmaceuticals - 0.6% Allergan plc 58 11,059 Bristol-Myers Squibb Co. 411 24,274 Eli Lilly & Co. 148 18,667 Johnson & Johnson 461 61,995 Merck & Co., Inc. 446 34,146 Mylan NV* 91 1,564 Perrigo Co. plc 23 1,166 Pfizer, Inc. 970 32,417 Zoetis, Inc. 83 11,058
196,346 Professional Services - 0.0%(a) Equifax, Inc. 22 3,125 IHS Markit Ltd. 70 4,987 Nielsen Holdings plc 64 1,165 Robert Half International, Inc. 21 1,059
Investments Shares Value ($) Verisk Analytics, Inc. 28 4,343
14,679 Real Estate Management & Development - 0.0%(a) CBRE Group, Inc., Class A* 59 3,312
Road & Rail - 0.1% CSX Corp. 136 9,581 JB Hunt Transport Services, Inc. 15 1,447 Kansas City Southern 18 2,712 Norfolk Southern Corp. 46 8,388 Old Dominion Freight Line, Inc. 10 1,938 Union Pacific Corp. 122 19,497
43,563 Semiconductors & Semiconductor Equipment - 0.6% Advanced Micro Devices, Inc.* 195 8,869 Analog Devices, Inc. 65 7,088 Applied Materials, Inc. 162 9,415 Broadcom, Inc. 69 18,811 Intel Corp. 762 42,306 KLA Corp. 27 4,150 Lam Research Corp. 25 7,336 Maxim Integrated Products, Inc. 47 2,614 Microchip Technology, Inc. 42 3,810 Micron Technology, Inc.* 194 10,197 NVIDIA Corp. 107 28,897 Qorvo, Inc.* 21 2,112 QUALCOMM, Inc. 200 15,660 Skyworks Solutions, Inc. 29 2,905 Texas Instruments, Inc. 163 18,605 Xilinx, Inc. 44 3,674
186,449 Software - 1.0% Adobe, Inc.* 85 29,335 ANSYS, Inc.* 15 3,633 Autodesk, Inc.* 38 7,254 Cadence Design Systems, Inc.* 49 3,241 Citrix Systems, Inc. 22 2,275 Fortinet, Inc.* 24 2,450 Intuit, Inc. 46 12,229 Microsoft Corp. 1,337 216,607 NortonLifeLock, Inc. 103 1,960 Oracle Corp. 381 18,844 salesforce.com, Inc.* 156 26,582 ServiceNow, Inc.* 34 11,087 Synopsys, Inc.* 26 3,586
339,083 Specialty Retail - 0.3% Advance Auto Parts, Inc. 12 1,596 AutoZone, Inc.* 4 4,130 Best Buy Co., Inc. 40 3,026 CarMax, Inc.* 28 2,445 Gap, Inc. (The) 39 559 Home Depot, Inc. (The) 191 41,608 L Brands, Inc. 43 931 Lowe's Cos., Inc. 134 14,280 O'Reilly Automotive, Inc.* 14 5,162 Ross Stores, Inc. 64 6,962 Tiffany & Co. 19 2,538 TJX Cos., Inc. (The) 213 12,737 Tractor Supply Co. 21 1,859 Ulta Beauty, Inc.* 9 2,314
100,147

Hedge Replication ETF Schedule of Portfolio Investments February 29, 2020 (Unaudited)
Investments Shares Value ($) Technology Hardware, Storage & Peripherals - 0.6% Apple, Inc. 731 199,826 Hewlett Packard Enterprise Co. 229 2,929 HP, Inc. 261 5,426 NetApp, Inc. 40 1,869 Seagate Technology plc 40 1,918 Western Digital Corp. 53 2,945 Xerox Holdings Corp. 33 1,062
215,975 Textiles, Apparel & Luxury Goods - 0.1% Capri Holdings Ltd.* 27 697 Hanesbrands, Inc. 66 874 NIKE, Inc., Class B 218 19,485 PVH Corp. 13 963 Ralph Lauren Corp. 8 844 Tapestry, Inc. 49 1,149 Under Armour, Inc., Class A* 35 497 Under Armour, Inc., Class C* 36 449 VF Corp. 58 4,176
29,134 Tobacco - 0.1% Altria Group, Inc. 327 13,201 Philip Morris International, Inc. 272 22,269
35,470 Trading Companies & Distributors - 0.0%(a) Fastenal Co. 101 3,456 United Rentals, Inc.* 13 1,722 WW Grainger, Inc. 7 1,943
7,121 Water Utilities - 0.0%(a) American Water Works Co., Inc. 31 3,833
Wireless Telecommunication Services - 0.0%(a) T-Mobile US, Inc.* 56 5,049
TOTAL COMMON STOCKS (Cost $4,089,257) 4,287,981
Investments Number of
Rights Value ($) RIGHTS - 0.0%
Biotechnology - 0.0% Tobira Therapeutics, Inc., CVR*(c)(d) (Cost $–) 10 —
Investments Shares Value ($) SECURITIES LENDING REINVESTMENTS(e) - 0.0%(a) INVESTMENT COMPANIES - 0.0%(a)
BlackRock Liquidity FedFund, Institutional Class 1.49% (Cost $1,996) 1,996 1,996
Investments Principal
Amount ($) Value ($) SHORT-TERM INVESTMENTS - 82.0% REPURCHASE AGREEMENTS(f) - 14.1% Repurchase Agreements with various
counterparties, rates 1.58% - 1.59%, dated 2/28/2020, due 3/2/2020, total to be received $4,738,155
(Cost $4,737,529) 4,737,529 4,737,529 U.S. TREASURY OBLIGATIONS - 67.9%
U.S. Treasury Bills 1.53%, 5/7/2020(g) (Cost $22,834,902) 22,900,000 22,848,195
TOTAL SHORT-TERM INVESTMENTS (Cost $27,572,431) 27,585,724 Total Investments - 94.7%
(Cost $31,663,684) 31,875,701 Other Assets Less Liabilities - 5.3% 1,769,844 Net Assets - 100.0% 33,645,545

Hedge Replication ETF Schedule of Portfolio Investments February 29, 2020 (Unaudited)
* Non-income producing security. (a) Represents less than 0.05% of net assets. (b) The security or a portion of this security is on loan at February
29, 2020. The total value of securities on loan at February 29, 2020 was $1,916, collateralized in the form of cash with a value of $1,996 that was reinvested in the securities shown in the Securities Lending Reinvestment section of the Schedule of Investments.
(c) Security fair valued as of February 29, 2020 in accordance with procedures approved by the Board of Trustees. Total value of all such securities at February 29, 2020 amounted to $0, which represents approximately 0.00% of net assets of the Fund.
(d) Illiquid security. (e) The security was purchased with cash collateral held from
securities on loan at February 29, 2020. The total value of securities purchased was $1,996.
(f) The Fund invests in Repurchase Agreements jointly with other funds in the Trust. See "Repurchase Agreements" in the Notes to Schedules of Portfolio of Investments to view the details of each individual agreement and counterparty as well as a description of the securities subject to repurchase.
(g) The rate shown was the current yield as of February 29, 2020.
Abbreviations CVR Contingent Value Rights - No defined expiration

Hedge Replication ETF Schedule of Portfolio Investments February 29, 2020 (Unaudited)
Futures Contracts Sold Hedge Replication ETF had the following open short futures contracts as of February 29, 2020:
Number of Contracts
Expiration Date
Trading Currency Notional Amount
Value and Unrealized
Appreciation E-Mini Euro 1 3/16/2020 USD $ 69,056
$ 1,017
Swap Agreements Hedge Replication ETF had the following open non-exchange traded total return swap agreements as of February 29, 2020:
Notional
Amount ($) Termination
Date1 Counterparty Rate Paid
(Received)2 Underlying Instrument
Value and Unrealized
Appreciation/ (Depreciation)
($)
41,359
11/8/2021 Credit Suisse International 1.92%
S&P 500® Total Return Index (1,687)
612,048
11/8/2021 Credit Suisse International 1.42%
iShares® MSCI Emerging Markets ETF3 (46,389)
1,842,403
11/8/2021 Credit Suisse International 1.37%
iShares® MSCI EAFE ETF3 (153,457)
2,535,030
11/8/2021 Credit Suisse International 1.82%
Russell 2000® Total Return Index (213,403)
86,222
11/6/2020 Morgan Stanley & Co.
International plc 2.17% S&P 500® Total Return Index 4,917
234,384
12/7/2020 Morgan Stanley & Co.
International plc 1.82%
iShares® MSCI Emerging Markets ETF3 92,492
1,476
1/6/2021 Societe Generale 1.67% Russell 2000® Total Return Index (114)
237,265
1/6/2021 Societe Generale 1.92%
iShares® MSCI Emerging Markets ETF3 (25,954)
288,940
1/6/2021 Societe Generale 2.27% iShares® MSCI EAFE ETF3 (35,016)
2,953
11/8/2021 UBS AG 1.67% Russell 2000® Total Return Index (228)
566,532
11/8/2021 UBS AG 1.47%
iShares® MSCI Emerging Markets ETF3 (22,894)
602,049
11/8/2021 UBS AG 1.67% iShares® MSCI EAFE ETF3 (46,501)
7,050,661
(448,234)
Total Unrealized Appreciation 97,409
Total Unrealized Depreciation (545,643)
1 Agreements may be terminated at will by either party without penalty. Payment is due at termination/maturity. 2 Reflects the floating financing rate, as of February 29, 2020, on the notional amount of the swap agreement paid to the
counterparty or received from the counterparty, excluding any commissions. This amount is included as part of the unrealized appreciation/(depreciation).
3 In order to facilitate the daily valuation of these swap transactions as of close of business New York time, one or more financial products traded on a U.S. exchange are used as the reference entity as a surrogate for the respective underlying index for the purposes of both daily valuation calculation as well as final settlement of the swap.
Abbreviations
USD U.S. Dollar

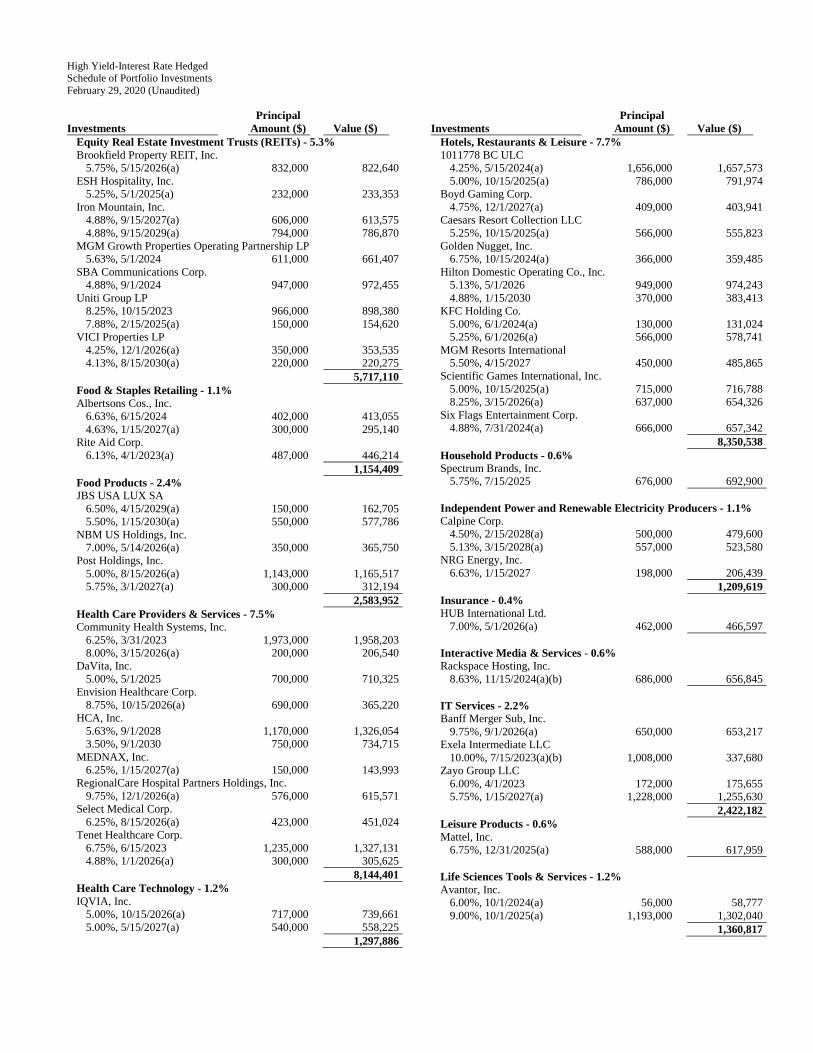
High Yield-Interest Rate Hedged Schedule of Portfolio Investments February 29, 2020 (Unaudited)
Investments Principal
Amount ($) Value ($) CORPORATE BONDS - 96.3%
Aerospace & Defense - 4.0% Bombardier, Inc.
7.50%, 3/15/2025(a) 1,610,000 1,589,875 7.88%, 4/15/2027(a) 150,000 148,875
SSL Robotics LLC 9.75%, 12/31/2023(a) 210,000 223,188
TransDigm, Inc. 6.25%, 3/15/2026(a) 1,903,000 2,014,806 5.50%, 11/15/2027(a) 349,000 348,564
4,325,308 Air Freight & Logistics - 0.8% XPO Logistics, Inc.
6.50%, 6/15/2022(a) 400,000 399,760 6.75%, 8/15/2024(a) 475,000 501,125
900,885 Auto Components - 3.2% Allison Transmission, Inc.
5.00%, 10/1/2024(a) 580,000 586,502 Goodyear Tire & Rubber Co. (The)
5.13%, 11/15/2023 614,000 609,211 Icahn Enterprises LP
6.25%, 2/1/2022 680,000 691,642 6.25%, 5/15/2026 150,000 153,766
Panther BF Aggregator 2 LP 6.25%, 5/15/2026(a) 500,000 513,600 8.50%, 5/15/2027(a) 902,000 916,702
3,471,423 Automobiles - 0.7% Tesla, Inc.
5.30%, 8/15/2025(a) 766,000 765,042
Capital Markets - 0.3% MSCI, Inc.
4.00%, 11/15/2029(a) 350,000 362,705
Chemicals - 1.0% NOVA Chemicals Corp.
4.88%, 6/1/2024(a) 505,000 487,744 5.25%, 6/1/2027(a) 675,000 641,466
1,129,210 Commercial Services & Supplies - 2.5% Allied Universal Holdco LLC
6.63%, 7/15/2026(a) 450,000 471,937 9.75%, 7/15/2027(a) 488,000 518,598
Aramark Services, Inc. 5.00%, 2/1/2028(a) 500,000 522,500
Intrado Corp. 8.50%, 10/15/2025(a) 611,000 410,897
Prime Security Services Borrower LLC 5.75%, 4/15/2026(a) 554,000 570,454 6.25%, 1/15/2028(a) 200,000 192,700
2,687,086 Communications Equipment - 1.1% CommScope Technologies LLC
6.00%, 6/15/2025(a) 1,057,000 990,937 CommScope, Inc.
6.00%, 3/1/2026(a) 183,000 187,837 1,178,774
Investments Principal
Amount ($) Value ($) Construction & Engineering - 0.3% Brand Industrial Services, Inc.
8.50%, 7/15/2025(a) 317,000 307,094
Consumer Finance - 2.1% Ally Financial, Inc.
5.75%, 11/20/2025 419,000 470,671 Navient Corp.
6.50%, 6/15/2022 385,000 401,363 Springleaf Finance Corp.
6.13%, 3/15/2024 254,000 267,675 7.13%, 3/15/2026 1,044,000 1,158,840
2,298,549 Containers & Packaging - 1.8% Ball Corp.
5.25%, 7/1/2025 466,000 508,033 Mauser Packaging Solutions Holding Co.
5.50%, 4/15/2024(a) 91,000 90,632 7.25%, 4/15/2025(a) 789,000 764,691
Reynolds Group Issuer, Inc. 5.13%, 7/15/2023(a) 615,000 621,150
1,984,506 Distributors - 0.5% Performance Food Group, Inc.
5.50%, 10/15/2027(a) 528,000 557,040
Diversified Financial Services - 2.2% MPH Acquisition Holdings LLC
7.13%, 6/1/2024(a) 661,000 614,875 Refinitiv US Holdings, Inc.
6.25%, 5/15/2026(a) 295,000 316,668 8.25%, 11/15/2026(a) 829,000 912,729
Verscend Escrow Corp. 9.75%, 8/15/2026(a) 460,000 500,227
2,344,499 Diversified Telecommunication Services - 4.1% CCO Holdings LLC
5.13%, 5/1/2027(a) 1,494,000 1,553,312 4.75%, 3/1/2030(a) 500,000 514,062
CenturyLink, Inc. 5.13%, 12/15/2026(a) 773,000 778,797
Frontier Communications Corp. 10.50%, 9/15/2022 859,000 389,771 11.00%, 9/15/2025 1,793,000 820,298
Level 3 Financing, Inc. 4.63%, 9/15/2027(a) 421,000 429,420
4,485,660 Electric Utilities - 1.5% Vistra Operations Co. LLC
5.63%, 2/15/2027(a) 813,000 833,325 5.00%, 7/31/2027(a) 800,000 808,000
1,641,325 Energy Equipment & Services - 0.6% Weatherford International Ltd.
11.00%, 12/1/2024(a) 630,000 602,532
Entertainment - 1.9% Netflix, Inc.
4.88%, 4/15/2028 983,000 1,034,814 5.88%, 11/15/2028 953,000 1,071,458
2,106,272
High Yield-Interest Rate Hedged Schedule of Portfolio Investments February 29, 2020 (Unaudited)
Investments Principal
Amount ($) Value ($) Equity Real Estate Investment Trusts (REITs) - 5.3% Brookfield Property REIT, Inc.
5.75%, 5/15/2026(a) 832,000 822,640 ESH Hospitality, Inc.
5.25%, 5/1/2025(a) 232,000 233,353 Iron Mountain, Inc.
4.88%, 9/15/2027(a) 606,000 613,575 4.88%, 9/15/2029(a) 794,000 786,870
MGM Growth Properties Operating Partnership LP 5.63%, 5/1/2024 611,000 661,407
SBA Communications Corp. 4.88%, 9/1/2024 947,000 972,455
Uniti Group LP 8.25%, 10/15/2023 966,000 898,380 7.88%, 2/15/2025(a) 150,000 154,620
VICI Properties LP 4.25%, 12/1/2026(a) 350,000 353,535 4.13%, 8/15/2030(a) 220,000 220,275
5,717,110 Food & Staples Retailing - 1.1% Albertsons Cos., Inc.
6.63%, 6/15/2024 402,000 413,055 4.63%, 1/15/2027(a) 300,000 295,140
Rite Aid Corp. 6.13%, 4/1/2023(a) 487,000 446,214
1,154,409 Food Products - 2.4% JBS USA LUX SA
6.50%, 4/15/2029(a) 150,000 162,705 5.50%, 1/15/2030(a) 550,000 577,786
NBM US Holdings, Inc. 7.00%, 5/14/2026(a) 350,000 365,750
Post Holdings, Inc. 5.00%, 8/15/2026(a) 1,143,000 1,165,517 5.75%, 3/1/2027(a) 300,000 312,194
2,583,952 Health Care Providers & Services - 7.5% Community Health Systems, Inc.
6.25%, 3/31/2023 1,973,000 1,958,203 8.00%, 3/15/2026(a) 200,000 206,540
DaVita, Inc. 5.00%, 5/1/2025 700,000 710,325
Envision Healthcare Corp. 8.75%, 10/15/2026(a) 690,000 365,220
HCA, Inc. 5.63%, 9/1/2028 1,170,000 1,326,054 3.50%, 9/1/2030 750,000 734,715
MEDNAX, Inc. 6.25%, 1/15/2027(a) 150,000 143,993
RegionalCare Hospital Partners Holdings, Inc. 9.75%, 12/1/2026(a) 576,000 615,571
Select Medical Corp. 6.25%, 8/15/2026(a) 423,000 451,024
Tenet Healthcare Corp. 6.75%, 6/15/2023 1,235,000 1,327,131 4.88%, 1/1/2026(a) 300,000 305,625
8,144,401 Health Care Technology - 1.2% IQVIA, Inc.
5.00%, 10/15/2026(a) 717,000 739,661 5.00%, 5/15/2027(a) 540,000 558,225
1,297,886
Investments Principal
Amount ($) Value ($) Hotels, Restaurants & Leisure - 7.7% 1011778 BC ULC
4.25%, 5/15/2024(a) 1,656,000 1,657,573 5.00%, 10/15/2025(a) 786,000 791,974
Boyd Gaming Corp. 4.75%, 12/1/2027(a) 409,000 403,941
Caesars Resort Collection LLC 5.25%, 10/15/2025(a) 566,000 555,823
Golden Nugget, Inc. 6.75%, 10/15/2024(a) 366,000 359,485
Hilton Domestic Operating Co., Inc. 5.13%, 5/1/2026 949,000 974,243 4.88%, 1/15/2030 370,000 383,413
KFC Holding Co. 5.00%, 6/1/2024(a) 130,000 131,024 5.25%, 6/1/2026(a) 566,000 578,741
MGM Resorts International 5.50%, 4/15/2027 450,000 485,865
Scientific Games International, Inc. 5.00%, 10/15/2025(a) 715,000 716,788 8.25%, 3/15/2026(a) 637,000 654,326
Six Flags Entertainment Corp. 4.88%, 7/31/2024(a) 666,000 657,342
8,350,538 Household Products - 0.6% Spectrum Brands, Inc.
5.75%, 7/15/2025 676,000 692,900
Independent Power and Renewable Electricity Producers - 1.1% Calpine Corp.
4.50%, 2/15/2028(a) 500,000 479,600 5.13%, 3/15/2028(a) 557,000 523,580
NRG Energy, Inc. 6.63%, 1/15/2027 198,000 206,439
1,209,619 Insurance - 0.4% HUB International Ltd.
7.00%, 5/1/2026(a) 462,000 466,597
Interactive Media & Services - 0.6% Rackspace Hosting, Inc.
8.63%, 11/15/2024(a)(b) 686,000 656,845
IT Services - 2.2% Banff Merger Sub, Inc.
9.75%, 9/1/2026(a) 650,000 653,217 Exela Intermediate LLC
10.00%, 7/15/2023(a)(b) 1,008,000 337,680 Zayo Group LLC
6.00%, 4/1/2023 172,000 175,655 5.75%, 1/15/2027(a) 1,228,000 1,255,630
2,422,182 Leisure Products - 0.6% Mattel, Inc.
6.75%, 12/31/2025(a) 588,000 617,959
Life Sciences Tools & Services - 1.2% Avantor, Inc.
6.00%, 10/1/2024(a) 56,000 58,777 9.00%, 10/1/2025(a) 1,193,000 1,302,040
1,360,817

High Yield-Interest Rate Hedged Schedule of Portfolio Investments February 29, 2020 (Unaudited)
Investments Principal
Amount ($) Value ($) Machinery - 0.6% Navistar International Corp.
6.63%, 11/1/2025(a) 623,000 645,322
Media - 10.3% AMC Networks, Inc.
5.00%, 4/1/2024 600,000 603,000 Clear Channel Worldwide Holdings, Inc.
9.25%, 2/15/2024(a) 773,000 821,954 5.13%, 8/15/2027(a) 498,000 499,355
CSC Holdings LLC 6.50%, 2/1/2029(a) 453,000 500,520 5.75%, 1/15/2030(a) 1,000,000 1,057,500
Diamond Sports Group LLC 5.38%, 8/15/2026(a) 1,000,000 922,020 6.63%, 8/15/2027(a)(b) 1,016,000 819,556
DISH DBS Corp. 7.75%, 7/1/2026 1,121,000 1,204,582
iHeartCommunications, Inc. 8.38%, 5/1/2027 660,000 716,727
Meredith Corp. 6.88%, 2/1/2026 730,000 731,971
Nexstar Broadcasting, Inc. 5.63%, 7/15/2027(a) 594,000 614,820
Sirius XM Radio, Inc. 4.63%, 7/15/2024(a) 350,000 360,832 5.00%, 8/1/2027(a) 792,000 825,763
TEGNA, Inc. 4.63%, 3/15/2028(a) 150,000 145,222 5.00%, 9/15/2029(a) 950,000 938,125
Terrier Media Buyer, Inc. 8.88%, 12/15/2027(a) 466,000 462,505
11,224,452 Metals & Mining - 2.3% First Quantum Minerals Ltd.
7.25%, 4/1/2023(a) 712,000 683,520 7.50%, 4/1/2025(a) 506,000 480,700
Novelis Corp. 5.88%, 9/30/2026(a) 732,000 756,050 4.75%, 1/30/2030(a) 638,000 629,227
2,549,497 Oil, Gas & Consumable Fuels - 5.0% Cheniere Energy Partners LP
5.25%, 10/1/2025 350,000 350,766 4.50%, 10/1/2029(a) 1,162,000 1,113,916
Chesapeake Energy Corp. 11.50%, 1/1/2025(a) 500,000 285,000
CrownRock LP 5.63%, 10/15/2025(a) 746,000 718,025
Endeavor Energy Resources LP 5.75%, 1/30/2028(a) 454,000 443,649
Matador Resources Co. 5.88%, 9/15/2026 550,000 492,250
MEG Energy Corp. 7.13%, 2/1/2027(a) 500,000 471,635
PBF Holding Co. LLC 6.00%, 2/15/2028(a) 500,000 493,750
Targa Resources Partners LP 5.88%, 4/15/2026 959,000 987,866 5.50%, 3/1/2030(a) 100,000 98,970
5,455,827
Investments Principal
Amount ($) Value ($) Pharmaceuticals - 3.1% Bausch Health Cos., Inc.
7.00%, 3/15/2024(a) 500,000 514,790 6.13%, 4/15/2025(a) 1,593,000 1,624,382
Endo Dac 6.00%, 7/15/2023(a) 737,000 578,619
Par Pharmaceutical, Inc. 7.50%, 4/1/2027(a) 630,000 665,280
3,383,071 Professional Services - 0.6% Jaguar Holding Co. II
6.38%, 8/1/2023(a) 616,000 635,638
Real Estate Management & Development - 0.5% Howard Hughes Corp. (The)
5.38%, 3/15/2025(a) 569,000 575,942
Road & Rail - 1.0% Uber Technologies, Inc.
8.00%, 11/1/2026(a) 690,000 717,845 7.50%, 9/15/2027(a) 323,000 336,727
1,054,572 Software - 3.0% Change Healthcare Holdings LLC
5.75%, 3/1/2025(a) 525,000 530,906 Infor US, Inc.
6.50%, 5/15/2022 680,000 680,979 NortonLifeLock, Inc.
5.00%, 4/15/2025(a) 150,000 152,016 Solera LLC
10.50%, 3/1/2024(a) 936,000 989,586 SS&C Technologies, Inc.
5.50%, 9/30/2027(a) 923,000 966,566 3,320,053
Specialty Retail - 2.4% PetSmart, Inc.
7.13%, 3/15/2023(a) 924,000 900,623 5.88%, 6/1/2025(a) 234,000 235,474
Staples, Inc. 7.50%, 4/15/2026(a) 1,000,000 996,252 10.75%, 4/15/2027(a) 500,000 478,600
2,610,949 Technology Hardware, Storage & Peripherals - 1.2% Dell International LLC
5.88%, 6/15/2021(a) 703,000 707,183 7.13%, 6/15/2024(a) 242,000 253,192
Xerox Corp. 4.12%, 3/15/2023(c) 291,000 296,733
1,257,108 Thrifts & Mortgage Finance - 1.0% Quicken Loans, Inc.
5.75%, 5/1/2025(a) 350,000 358,603 5.25%, 1/15/2028(a) 668,000 691,180
1,049,783 Trading Companies & Distributors - 2.6% Beacon Roofing Supply, Inc.
4.88%, 11/1/2025(a) 702,000 677,220 Herc Holdings, Inc.
5.50%, 7/15/2027(a) 500,000 518,700 United Rentals North America, Inc.
6.50%, 12/15/2026 237,000 252,713

High Yield-Interest Rate Hedged Schedule of Portfolio Investments February 29, 2020 (Unaudited)
Investments Principal
Amount ($) Value ($) 4.88%, 1/15/2028 1,334,000 1,369,084
2,817,717 Wireless Telecommunication Services - 2.2% Sprint Corp.
7.63%, 3/1/2026 359,000 423,516 7.25%, 2/1/2028(a) 400,000 400,960
T-Mobile USA, Inc. 6.50%, 1/15/2026 1,278,000 1,345,478 4.75%, 2/1/2028 244,000 254,065
2,424,019 TOTAL CORPORATE BONDS (Cost $106,642,721) 104,827,075 Investments Shares Value ($) SECURITIES LENDING REINVESTMENTS(d) - 1.1% INVESTMENT COMPANIES - 1.1%
BlackRock Liquidity FedFund, Institutional Class 1.49% (Cost $1,159,350) 1,159,350 1,159,350
Investments Principal
Amount ($) Value ($) SHORT-TERM INVESTMENTS - 0.2% REPURCHASE AGREEMENTS(e) - 0.2% Repurchase Agreements with various
counterparties, rates 1.58% - 1.59%, dated 2/28/2020, due 3/2/2020, total to be received $210,834
(Cost $210,806) 210,806 210,806 Total Investments - 97.6%
(Cost $108,012,877) 106,197,231 Other Assets Less Liabilities - 2.4% 2,659,332 Net Assets - 100.0% 108,856,563
(a) Securities exempt from registration under Rule 144A or section 4(2), of the Securities Act of 1933. Under procedures approved by the Board of Trustees, such securities have been determined to be liquid by the investment adviser and may be resold, normally to qualified institutional buyers in transactions exempt from registration.
(b) The security or a portion of this security is on loan at February 29, 2020. The total value of securities on loan at February 29, 2020 was $1,095,069, collateralized in the form of cash with a value of $1,159,350 that was reinvested in the securities shown in the Securities Lending Reinvestment section of the Schedule of Investments.
(c) Step bond. Interest rate is a fixed rate for an initial period that either resets at a specific date or may reset in the future at a contingent upon predetermined trigger. The interest rate shown was the current rate as of February 29, 2020.
(d) The security was purchased with cash collateral held from securities on loan at February 29, 2020. The total value of securities purchased was $1,159,350.
(e) The Fund invests in Repurchase Agreements jointly with other funds in the Trust. See "Repurchase Agreements" in the Notes to Schedules of Portfolio of Investments to view the details of each individual agreement and counterparty as well as a description of the securities subject to repurchase.

High Yield-Interest Rate Hedged Schedule of Portfolio Investments February 29, 2020 (Unaudited)
Futures Contracts Sold High Yield-Interest Rate Hedged had the following open short futures contracts as of February 29, 2020:
Number of Contracts
Expiration Date
Trading Currency Notional Amount
Value and Unrealized
Depreciation U.S. Treasury 10 Year Note 155 6/19/2020 USD $ 20,886,250
$ (181,275)
U.S. Treasury 2 Year Note 250 6/30/2020 USD 54,582,031
(163,463)
U.S. Treasury 5 Year Note 342 6/30/2020 USD 41,980,500
(316,127)
$ (660,865)
Abbreviations
USD U.S. Dollar

Inflation Expectations ETF Schedule of Portfolio Investments February 29, 2020 (Unaudited)
Investments Principal
Amount ($) Value ($) U.S. TREASURY OBLIGATIONS - 81.7%
U.S. Treasury Inflation Linked Bonds 0.25%, 2/15/2050 (Cost $6,019,970) 5,743,472 6,017,452
SHORT-TERM INVESTMENTS - 30.5% REPURCHASE AGREEMENTS(a) - 30.5% Repurchase Agreements with various
counterparties, rates 1.58% - 1.59%, dated 2/28/2020, due 3/2/2020, total to be received $2,248,306
(Cost $2,248,010) 2,248,010 2,248,010 Total Investments - 112.2%
(Cost $8,267,980) 8,265,462 Liabilities in excess of other assets - (12.2%) (899,844) Net Assets - 100.0% 7,365,618
(a) The Fund invests in Repurchase Agreements jointly with other funds in the Trust. See "Repurchase Agreements" in the Notes to Schedules of Portfolio of Investments to view the details of each individual agreement and counterparty as well as a description of the securities subject to repurchase.

Inflation Expectations ETF Schedule of Portfolio Investments February 29, 2020 (Unaudited)
Swap Agreements Inflation Expectations ETF had the following open non-exchange traded total return swap agreements as of February 29, 2020:
Notional
Amount ($) Termination
Date1 Counterparty Rate Paid
(Received)2 Underlying Instrument
Value and Unrealized
Appreciation/ (Depreciation)
($)
1,985,828
11/8/2021 Citibank NA 1.41%
FTSE 30-Year TIPS (Treasury Rate-Hedged) Index (long exposure to 30-year Treasury Inflation-Protected Securities (TIPS) bond)3 341,435
4,399,079
11/8/2021 Citibank NA 1.32%
FTSE 30-Year TIPS (Treasury Rate-Hedged) Index (long exposure to 30-year Treasury Bond inverse index)4 (1,252,678)
729,504
11/8/2021 Societe Generale 1.72%
FTSE 30-Year TIPS (Treasury Rate-Hedged) Index (long exposure to 30-year Treasury Inflation-Protected Securities (TIPS) bond)3 72,625
5,479,495
11/8/2021 Societe Generale 1.17%
FTSE 30-Year TIPS (Treasury Rate-Hedged) Index (long exposure to 30-year Treasury Bond inverse index)4 (336,504)
12,593,906
(1,175,122)
Total Unrealized Appreciation 414,060
Total Unrealized Depreciation (1,589,182)
1 Agreements may be terminated at will by either party without penalty. Payment is due at termination/maturity. 2 Reflects the floating financing rate, as of February 29, 2020, on the notional amount of the swap agreement paid to the
counterparty or received from the counterparty, excluding any commissions. This amount is included as part of the unrealized appreciation/(depreciation).
3 See the U.S. Treasury Obligations section of the preceding Schedule of Portfolio Investments for the representative components of the underlying reference instrument and their relative weightings.
4 Certain underlying component disclosures related to this index may be found on the website at www.proshares.com/media/FTSE30-Year_TIPS_February.pdf.

Investment Grade-Interest Rate Hedged Schedule of Portfolio Investments February 29, 2020 (Unaudited)
Investments Principal
Amount ($) Value ($) CORPORATE BONDS - 96.5%
Aerospace & Defense - 1.5% Lockheed Martin Corp.
4.07%, 12/15/2042 605,000 746,870 United Technologies Corp.
6.13%, 7/15/2038 415,000 617,727 5.70%, 4/15/2040 1,599,000 2,334,782 4.50%, 6/1/2042 75,000 96,227
3,795,606 Air Freight & Logistics - 0.5% United Parcel Service, Inc.
6.20%, 1/15/2038 816,000 1,197,945
Automobiles - 1.3% Daimler Finance North America LLC
8.50%, 1/18/2031 518,000 799,729 Ford Motor Co.
7.45%, 7/16/2031 107,000 121,446 4.75%, 1/15/2043 1,500,000 1,290,182
General Motors Co. 6.25%, 10/2/2043 121,000 136,197 5.20%, 4/1/2045 1,103,000 1,100,857
3,448,411 Banks - 30.2% Banco Santander SA
4.25%, 4/11/2027 949,000 1,056,527 3.80%, 2/23/2028 572,000 618,531 4.38%, 4/12/2028 576,000 651,384 3.31%, 6/27/2029 760,000 819,080
Bank of America Corp. 4.45%, 3/3/2026 156,000 175,970 3.50%, 4/19/2026 463,000 505,859 4.25%, 10/22/2026 985,000 1,099,939 6.11%, 1/29/2037 976,000 1,343,044 7.75%, 5/14/2038 902,000 1,460,180 5.88%, 2/7/2042 442,000 650,155 5.00%, 1/21/2044 891,000 1,207,337
Bank of America NA 6.00%, 10/15/2036 420,000 589,381
Bank of Nova Scotia (The) 4.50%, 12/16/2025 485,000 548,052 2.70%, 8/3/2026 500,000 525,635
Barclays plc 4.38%, 1/12/2026 2,279,000 2,514,763 5.25%, 8/17/2045 140,000 177,850 4.95%, 1/10/2047 252,000 314,352
Citigroup, Inc. 5.50%, 9/13/2025 606,000 710,764 3.70%, 1/12/2026 1,595,000 1,748,062 4.60%, 3/9/2026 442,000 501,067 3.40%, 5/1/2026 691,000 748,465 4.30%, 11/20/2026 931,000 1,032,468 4.45%, 9/29/2027 2,651,000 2,993,998 5.88%, 1/30/2042 63,000 93,590
Cooperatieve Rabobank UA 3.75%, 7/21/2026 133,000 144,195 5.25%, 8/4/2045 1,925,000 2,547,566
Credit Suisse Group Funding Guernsey Ltd. 4.55%, 4/17/2026 1,803,000 2,034,181 4.88%, 5/15/2045 390,000 509,183
Investments Principal
Amount ($) Value ($) Fifth Third Bancorp
8.25%, 3/1/2038 523,000 871,860 HSBC Holdings plc
4.30%, 3/8/2026 617,000 685,698 3.90%, 5/25/2026 1,014,000 1,110,260 4.38%, 11/23/2026 500,000 543,341 6.50%, 5/2/2036 992,000 1,359,700 6.80%, 6/1/2038 478,000 687,191 5.25%, 3/14/2044 1,888,000 2,392,617
ING Groep NV 3.95%, 3/29/2027 2,243,000 2,513,585 4.05%, 4/9/2029 122,000 138,932
JPMorgan Chase & Co. 4.25%, 10/1/2027 455,000 514,484 6.40%, 5/15/2038 604,000 896,261 5.50%, 10/15/2040 1,476,000 2,047,085 5.60%, 7/15/2041 1,283,000 1,817,069 5.40%, 1/6/2042 748,000 1,040,602 4.95%, 6/1/2045 962,000 1,282,523
Lloyds Banking Group plc 4.58%, 12/10/2025 769,000 840,075 4.65%, 3/24/2026 204,000 223,409 3.75%, 1/11/2027 473,000 512,721 4.55%, 8/16/2028 924,000 1,062,572 4.34%, 1/9/2048 1,450,000 1,641,475
Mitsubishi UFJ Financial Group, Inc. 3.85%, 3/1/2026 2,561,000 2,847,725 2.76%, 9/13/2026 714,000 751,875 3.68%, 2/22/2027 1,646,000 1,817,404 3.29%, 7/25/2027 300,000 324,522 3.96%, 3/2/2028 300,000 338,582 4.05%, 9/11/2028 300,000 340,356 3.74%, 3/7/2029 300,000 336,596 3.75%, 7/18/2039 256,000 298,709
Mizuho Financial Group, Inc. 2.84%, 9/13/2026 419,000 442,593 3.17%, 9/11/2027 1,321,000 1,424,108
National Australia Bank Ltd. 2.50%, 7/12/2026 672,000 700,054
PNC Bank NA 4.05%, 7/26/2028 610,000 693,778
Royal Bank of Canada 4.65%, 1/27/2026 329,000 380,516
Royal Bank of Scotland Group plc 4.80%, 4/5/2026 629,000 719,222
Sumitomo Mitsui Financial Group, Inc. 3.78%, 3/9/2026 1,661,000 1,834,918 2.63%, 7/14/2026 1,584,000 1,654,106 3.01%, 10/19/2026 29,000 30,764 3.45%, 1/11/2027 426,000 465,113 3.36%, 7/12/2027 438,000 479,356 3.04%, 7/16/2029 1,143,000 1,215,135
Wells Fargo & Co. 3.55%, 9/29/2025 806,000 876,506 3.00%, 4/22/2026 1,867,000 1,978,449 4.10%, 6/3/2026 1,588,000 1,752,837 3.00%, 10/23/2026 1,299,000 1,376,035 5.38%, 11/2/2043 182,000 239,619 5.61%, 1/15/2044 28,000 38,083 4.65%, 11/4/2044 328,000 400,299 4.40%, 6/14/2046 468,000 554,642 4.75%, 12/7/2046 204,000 257,303

Investment Grade-Interest Rate Hedged Schedule of Portfolio Investments February 29, 2020 (Unaudited)
Investments Principal
Amount ($) Value ($) Wells Fargo Bank NA
6.60%, 1/15/2038 517,000 785,500 Westpac Banking Corp.
2.85%, 5/13/2026 1,880,000 1,988,494 2.70%, 8/19/2026 523,000 550,853 3.40%, 1/25/2028 150,000 166,878 4.42%, 7/24/2039 154,000 179,986
77,743,954 Beverages - 1.4% Anheuser-Busch InBev Worldwide, Inc.
4.95%, 1/15/2042 338,000 424,103 3.75%, 7/15/2042 973,000 1,045,245
Coca-Cola Co. (The) 2.88%, 10/27/2025 525,000 567,089 2.25%, 9/1/2026 768,000 810,258
Molson Coors Beverage Co. 5.00%, 5/1/2042 660,000 747,529
3,594,224 Biotechnology - 0.6% AbbVie, Inc.
4.40%, 11/6/2042 1,250,000 1,441,451
Capital Markets - 5.7% Goldman Sachs Group, Inc. (The)
4.25%, 10/21/2025 4,000 4,369 6.75%, 10/1/2037 3,630,000 5,151,525 6.25%, 2/1/2041 1,563,000 2,296,052 5.15%, 5/22/2045 5,000 6,436
Jefferies Group LLC 4.15%, 1/23/2030 493,000 536,631
Morgan Stanley 5.00%, 11/24/2025 1,196,000 1,380,268 3.88%, 1/27/2026 1,785,000 1,972,944 3.13%, 7/27/2026 119,000 126,853 4.35%, 9/8/2026 569,000 636,626 3.63%, 1/20/2027 274,000 299,740 4.30%, 1/27/2045 1,336,000 1,648,601 4.38%, 1/22/2047 569,000 718,438
14,778,483 Chemicals - 0.2% Dow Chemical Co. (The)
7.38%, 11/1/2029 389,000 534,562
Communications Equipment - 1.1% Cisco Systems, Inc.
5.90%, 2/15/2039 889,000 1,322,778 5.50%, 1/15/2040 1,056,000 1,536,362
2,859,140 Consumer Finance - 1.4% Ally Financial, Inc.
8.00%, 11/1/2031 1,086,000 1,506,879 American Express Co.
4.05%, 12/3/2042 429,000 542,023 Ford Motor Credit Co. LLC
4.39%, 1/8/2026 1,685,000 1,687,470 3,736,372
Diversified Financial Services - 5.1% Berkshire Hathaway, Inc.
4.50%, 2/11/2043 423,000 540,468 GE Capital International Funding Co. Unlimited Co.
3.37%, 11/15/2025 1,850,000 1,972,494 4.42%, 11/15/2035 2,385,000 2,726,479
Investments Principal
Amount ($) Value ($) Shell International Finance BV
2.50%, 9/12/2026 107,000 111,108 4.13%, 5/11/2035 1,150,000 1,384,732 6.38%, 12/15/2038 1,358,000 2,046,746 5.50%, 3/25/2040 440,000 610,306 4.55%, 8/12/2043 559,000 698,066 4.38%, 5/11/2045 1,842,000 2,270,007 4.00%, 5/10/2046 575,000 672,945 3.75%, 9/12/2046 115,000 131,321
13,164,672 Diversified Telecommunication Services - 5.7% AT&T, Inc.
5.35%, 9/1/2040 1,450,000 1,844,421 5.55%, 8/15/2041 220,000 284,720
Telefonica Emisiones SA 4.10%, 3/8/2027 237,000 263,238 7.05%, 6/20/2036 1,805,000 2,602,350 5.21%, 3/8/2047 195,000 239,593 4.90%, 3/6/2048 1,271,000 1,546,029
Verizon Communications, Inc. 4.13%, 3/16/2027 908,000 1,032,967 4.50%, 8/10/2033 1,140,000 1,397,822 4.27%, 1/15/2036 1,355,000 1,627,521 5.25%, 3/16/2037 450,000 601,141 4.13%, 8/15/2046 582,000 703,391 4.86%, 8/21/2046 1,752,000 2,312,729 4.52%, 9/15/2048 29,000 37,506 5.01%, 4/15/2049 43,000 59,356
14,552,784 Electric Utilities - 0.9% Duke Energy Florida LLC
6.40%, 6/15/2038 836,000 1,260,905 FirstEnergy Corp.
Series C, 7.38%, 11/15/2031 658,000 961,409
2,222,314 Energy Equipment & Services - 0.4% Baker Hughes a GE Co. LLC
5.13%, 9/15/2040 303,000 368,566 Halliburton Co.
7.45%, 9/15/2039 411,000 609,770 978,336
Entertainment - 1.4% NBCUniversal Media LLC
4.45%, 1/15/2043 1,232,000 1,515,546 TWDC Enterprises 18 Corp.
3.00%, 2/13/2026 104,000 113,013 1.85%, 7/30/2026 972,000 992,397 2.95%, 6/15/2027(a) 486,000 531,584 4.13%, 6/1/2044 292,000 366,727
3,519,267 Equity Real Estate Investment Trusts (REITs) - 0.4% Weyerhaeuser Co.
7.38%, 3/15/2032 680,000 987,612
Food & Staples Retailing - 0.9% Walmart, Inc.
5.25%, 9/1/2035 387,000 544,245 6.50%, 8/15/2037 1,088,000 1,697,617
2,241,862

Investment Grade-Interest Rate Hedged Schedule of Portfolio Investments February 29, 2020 (Unaudited)
Investments Principal
Amount ($) Value ($) Food Products - 0.5% Kraft Heinz Foods Co.
5.00%, 6/4/2042 1,041,000 1,037,305 Unilever Capital Corp.
5.90%, 11/15/2032 171,000 241,287 1,278,592
Health Care Equipment & Supplies - 0.9% Medtronic, Inc.
4.38%, 3/15/2035 232,000 295,314 4.63%, 3/15/2045 1,486,000 2,011,011
2,306,325 Health Care Providers & Services - 1.9% Anthem, Inc.
4.65%, 1/15/2043 468,000 548,561 Ascension Health
3.95%, 11/15/2046 258,000 320,066 UnitedHealth Group, Inc.
3.85%, 6/15/2028 750,000 850,072 4.63%, 7/15/2035 839,000 1,048,794 6.88%, 2/15/2038 112,000 171,263 4.75%, 7/15/2045 1,476,000 1,894,112
4,832,868 Industrial Conglomerates - 1.2% General Electric Co.
6.75%, 3/15/2032 553,000 752,527 5.88%, 1/14/2038 560,000 728,238 6.88%, 1/10/2039 1,100,000 1,532,876
3,013,641 Insurance - 1.3% AXA SA
8.60%, 12/15/2030 481,000 711,279 Manulife Financial Corp.
4.15%, 3/4/2026 552,000 627,351 MetLife, Inc.
4.05%, 3/1/2045 1,751,000 2,098,237 3,436,867
IT Services - 2.5% International Business Machines Corp.
3.45%, 2/19/2026 87,000 95,204 3.30%, 5/15/2026 11,000 12,024 3.50%, 5/15/2029 1,657,000 1,858,889 4.15%, 5/15/2039 1,455,000 1,759,021 4.00%, 6/20/2042 1,712,000 2,033,203 4.25%, 5/15/2049 538,000 670,887
6,429,228 Machinery - 0.4% Caterpillar, Inc.
3.80%, 8/15/2042 978,000 1,165,166
Media - 3.2% Comcast Corp.
4.25%, 1/15/2033 734,000 882,925 6.50%, 11/15/2035 38,000 57,237 4.65%, 7/15/2042 817,000 1,025,182 4.75%, 3/1/2044 803,000 1,036,852
Time Warner Cable LLC 6.55%, 5/1/2037 425,000 553,338 7.30%, 7/1/2038 927,000 1,269,847 6.75%, 6/15/2039 1,187,000 1,537,495
Time Warner Entertainment Co. LP 8.38%, 7/15/2033 136,000 200,098
Investments Principal
Amount ($) Value ($) ViacomCBS, Inc.
6.88%, 4/30/2036 35,000 47,881 4.38%, 3/15/2043 1,495,000 1,605,478
8,216,333 Metals & Mining - 3.3% BHP Billiton Finance USA Ltd.
4.13%, 2/24/2042 1,786,000 2,188,081 5.00%, 9/30/2043 373,000 502,276
Rio Tinto Finance USA Ltd. 5.20%, 11/2/2040 512,000 709,856
Southern Copper Corp. 6.75%, 4/16/2040 669,000 918,796 5.25%, 11/8/2042 629,000 731,528 5.88%, 4/23/2045 587,000 752,266
Vale Overseas Ltd. 6.25%, 8/10/2026 882,000 1,034,860 6.88%, 11/21/2036 194,000 255,554 6.88%, 11/10/2039 1,043,000 1,382,632
8,475,849 Multiline Retail - 0.6% Target Corp.
4.00%, 7/1/2042 349,000 425,895 3.63%, 4/15/2046 940,000 1,078,818
1,504,713 Multi-Utilities - 0.5% Berkshire Hathaway Energy Co.
6.13%, 4/1/2036 980,000 1,397,067
Oil, Gas & Consumable Fuels - 6.4% Canadian Natural Resources Ltd.
6.25%, 3/15/2038 596,000 777,255 Cenovus Energy, Inc.
6.75%, 11/15/2039 631,000 780,635 CNOOC Finance 2015 USA LLC
4.38%, 5/2/2028 475,000 546,104 ConocoPhillips
6.50%, 2/1/2039 1,244,000 1,842,039 ConocoPhillips Holding Co.
6.95%, 4/15/2029 892,000 1,217,196 Ecopetrol SA
5.88%, 5/28/2045 907,000 1,083,865 Hess Corp.
5.60%, 2/15/2041 645,000 695,996 Kinder Morgan Energy Partners LP
6.95%, 1/15/2038 512,000 686,225 Kinder Morgan, Inc.
7.75%, 1/15/2032 577,000 841,147 Nexen, Inc.
6.40%, 5/15/2037 833,000 1,220,745 Occidental Petroleum Corp.
6.45%, 9/15/2036 830,000 981,965 Phillips 66
5.88%, 5/1/2042 726,000 986,687 Suncor Energy, Inc.
6.50%, 6/15/2038 476,000 677,736 Total Capital SA
3.88%, 10/11/2028 1,100,000 1,257,865 TransCanada PipeLines Ltd.
6.20%, 10/15/2037 277,000 375,507 7.63%, 1/15/2039 500,000 781,702
Valero Energy Corp. 6.63%, 6/15/2037 768,000 1,043,129

Investment Grade-Interest Rate Hedged Schedule of Portfolio Investments February 29, 2020 (Unaudited)
Investments Principal
Amount ($) Value ($) Williams Cos., Inc. (The)
6.30%, 4/15/2040 585,000 721,275 16,517,073
Pharmaceuticals - 6.0% AstraZeneca plc
3.38%, 11/16/2025 905,000 991,482 6.45%, 9/15/2037 1,109,000 1,642,077 4.00%, 9/18/2042 421,000 503,357 4.38%, 11/16/2045 600,000 777,876
GlaxoSmithKline Capital, Inc. 3.88%, 5/15/2028 693,000 794,867 6.38%, 5/15/2038 1,328,000 2,052,791
Johnson & Johnson 5.95%, 8/15/2037 500,000 759,133
Merck & Co., Inc. 4.15%, 5/18/2043 848,000 1,074,847
Novartis Capital Corp. 4.40%, 5/6/2044 743,000 953,579
Pfizer, Inc. 3.00%, 12/15/2026 396,000 431,231 4.00%, 12/15/2036 114,000 138,791 7.20%, 3/15/2039 2,547,000 4,319,042
Wyeth LLC 5.95%, 4/1/2037 677,000 992,830
15,431,903 Software - 1.8% Microsoft Corp.
4.50%, 10/1/2040 662,000 864,633 5.30%, 2/8/2041 394,000 568,533
Oracle Corp. 6.50%, 4/15/2038 57,000 86,636 6.13%, 7/8/2039 1,027,000 1,531,844 5.38%, 7/15/2040 1,144,000 1,572,656
4,624,302 Specialty Retail - 0.8% Home Depot, Inc. (The)
5.88%, 12/16/2036 1,478,000 2,134,487
Technology Hardware, Storage & Peripherals - 1.8% Apple, Inc.
3.85%, 5/4/2043 1,745,000 2,087,876 4.45%, 5/6/2044 320,000 412,527 3.45%, 2/9/2045 1,443,000 1,626,783 4.38%, 5/13/2045 100,000 127,718
HP, Inc. 6.00%, 9/15/2041 415,000 475,772
4,730,676 Tobacco - 1.1% Altria Group, Inc.
5.38%, 1/31/2044 894,000 1,053,855 Philip Morris International, Inc.
6.38%, 5/16/2038 800,000 1,154,784 4.25%, 11/10/2044 575,000 665,290
2,873,929 Wireless Telecommunication Services - 3.6% America Movil SAB de CV
6.13%, 3/30/2040 1,174,000 1,707,522 4.38%, 7/16/2042 514,000 626,879
Telefonica Europe BV 8.25%, 9/15/2030 103,000 152,275
Vodafone Group plc 4.38%, 5/30/2028 1,052,000 1,208,686
Investments Principal
Amount ($) Value ($) 6.15%, 2/27/2037 1,080,000 1,498,187 5.00%, 5/30/2038 804,000 984,627 5.25%, 5/30/2048 1,840,000 2,319,628 4.25%, 9/17/2050 644,000 708,755
9,206,559 TOTAL CORPORATE BONDS (Cost $218,603,250) 248,372,573 Investments Shares Value ($) SECURITIES LENDING REINVESTMENTS(b) - 0.2% INVESTMENT COMPANIES - 0.2%
BlackRock Liquidity FedFund, Institutional Class 1.49% (Cost $472,813) 472,813 472,813
Investments Principal
Amount ($) Value ($) SHORT-TERM INVESTMENTS - 2.8% REPURCHASE AGREEMENTS(c) - 2.8% Repurchase Agreements with various
counterparties, rates 1.58% - 1.59%, dated 2/28/2020, due 3/2/2020, total to be received $7,117,163
(Cost $7,116,225) 7,116,225 7,116,225 Total Investments - 99.5%
(Cost $226,192,288) 255,961,611 Other Assets Less Liabilities - 0.5% 1,267,428 Net Assets - 100.0% 257,229,039
(a) The security or a portion of this security is on loan at February 29, 2020. The total value of securities on loan at February 29, 2020 was $464,862, collateralized in the form of cash with a value of $472,813 that was reinvested in the securities shown in the Securities Lending Reinvestment section of the Schedule of Investments.
(b) The security was purchased with cash collateral held from securities on loan at February 29, 2020. The total value of securities purchased was $472,813.
(c) The Fund invests in Repurchase Agreements jointly with other funds in the Trust. See "Repurchase Agreements" in the Notes to Schedules of Portfolio of Investments to view the details of each individual agreement and counterparty as well as a description of the securities subject to repurchase.

Investment Grade-Interest Rate Hedged Schedule of Portfolio Investments February 29, 2020 (Unaudited)
Futures Contracts Sold Investment Grade-Interest Rate Hedged had the following open short futures contracts as of February 29, 2020:
Number of Contracts
Expiration Date
Trading Currency Notional Amount
Value and Unrealized
Depreciation U.S. Treasury 10 Year Note 630 6/19/2020 USD $ 84,892,500
$ (871,106)
U.S. Treasury Long Bond 797 6/19/2020 USD 135,689,250
(2,103,463)
U.S. Treasury Ultra Bond 167 6/19/2020 USD 34,652,500
(741,745)
$ (3,716,314)
Abbreviations
USD U.S. Dollar

K-1 Free Crude Oil Strategy ETF Consolidated Schedule of Portfolio Investments February 29, 2020 (Unaudited)
Investments Principal
Amount ($) Value ($) SHORT-TERM INVESTMENTS - 87.1% REPURCHASE AGREEMENTS(a) - 87.1% Repurchase Agreements with various
counterparties, rates 1.58% - 1.59%, dated 2/28/2020, due 3/2/2020, total to be received $13,691,996
(Cost $13,690,190) 13,690,190 13,690,190 Total Investments - 87.1%
(Cost $13,690,190) 13,690,190 Other Assets Less Liabilities - 12.9% 2,035,174 Net Assets - 100.0% 15,725,364
(a) The Fund invests in Repurchase Agreements jointly with other funds in the Trust. See "Repurchase Agreements" in the Notes to Schedules of Portfolio of Investments to view the details of each individual agreement and counterparty as well as a description of the securities subject to repurchase.

K-1 Free Crude Oil Strategy ETF Consolidated Schedule of Portfolio Investments February 29, 2020 (Unaudited)
Futures Contracts Purchased K-1 Free Crude Oil Strategy ETF had the following open long futures contracts as of February 29, 2020:
Number of Contracts
Expiration Date
Trading Currency Notional Amount
Value and Unrealized
Depreciation WTI Crude Oil 350 4/21/2020 USD $ 15,729,000
$ (2,223,352)
Abbreviations
USD U.S. Dollar

Large Cap Core Plus Schedule of Portfolio Investments February 29, 2020 (Unaudited)
Investments Shares Value ($) COMMON STOCKS(a) - 94.2%
Aerospace & Defense - 2.8% Arconic, Inc. 30,445 893,561 Boeing Co. (The) 4,138 1,138,405 General Dynamics Corp. 7,822 1,249,095 L3Harris Technologies, Inc. 14,011 2,770,395 Lockheed Martin Corp. 10,049 3,716,824 Northrop Grumman Corp. 6,904 2,270,311 Raytheon Co. 14,283 2,693,203 Textron, Inc. 12,322 500,273 United Technologies Corp. 26,500 3,460,635
18,692,702 Air Freight & Logistics - 0.0%(b) CH Robinson Worldwide, Inc. 3,784 260,718
Airlines - 0.9% Alaska Air Group, Inc. 13,637 688,123 American Airlines Group, Inc. 65,987 1,257,052 Delta Air Lines, Inc. 42,998 1,983,498 United Airlines Holdings, Inc.* 31,241 1,924,133
5,852,806 Auto Components - 0.2% BorgWarner, Inc. 33,823 1,068,807
Automobiles - 0.7% Ford Motor Co. 192,701 1,341,199 General Motors Co. 77,485 2,363,293 Harley-Davidson, Inc. 31,850 970,469
4,674,961 Banks - 4.3% Bank of America Corp. 96,824 2,759,484 Citigroup, Inc. 17,844 1,132,380 Citizens Financial Group, Inc. 62,463 1,979,453 Comerica, Inc. 38,236 2,012,743 Fifth Third Bancorp 85,888 2,095,667 Huntington Bancshares, Inc. 168,680 2,069,704 JPMorgan Chase & Co. 46,328 5,379,144 KeyCorp 129,244 2,113,139 People's United Financial, Inc. 111,408 1,558,598 PNC Financial Services Group, Inc. (The) 14,335 1,811,944 Regions Financial Corp. 149,747 2,024,579 SVB Financial Group* 9,393 1,955,247 Wells Fargo & Co. 32,905 1,344,169
28,236,251 Beverages - 1.0% Coca-Cola Co. (The) 41,171 2,202,237 Constellation Brands, Inc., Class A 10,793 1,860,497 Monster Beverage Corp.* 11,373 709,789 PepsiCo, Inc. 13,811 1,823,466
6,595,989 Biotechnology - 1.7% AbbVie, Inc. 6,188 530,373 Alexion Pharmaceuticals, Inc.* 21,922 2,061,326 Amgen, Inc. 3,509 700,853 Biogen, Inc.* 7,344 2,264,816 Gilead Sciences, Inc. 4,138 287,012 Incyte Corp.* 32,813 2,474,428 Vertex Pharmaceuticals, Inc.* 14,405 3,227,152
11,545,960
Investments Shares Value ($) Building Products - 0.4% AO Smith Corp. 14,378 568,650 Johnson Controls International plc 35,634 1,303,135 Masco Corp. 14,617 603,975
2,475,760 Capital Markets - 3.1% Ameriprise Financial, Inc. 14,925 2,108,902 Cboe Global Markets, Inc. 20,175 2,299,950 Charles Schwab Corp. (The) 19,690 802,368 CME Group, Inc. 10,393 2,066,336 Franklin Resources, Inc. 12,762 277,701 Intercontinental Exchange, Inc. 34,444 3,073,094 Invesco Ltd. 128,757 1,854,101 MarketAxess Holdings, Inc. 7,391 2,397,123 Morgan Stanley 48,898 2,201,877 Nasdaq, Inc. 21,748 2,230,257 T. Rowe Price Group, Inc. 11,800 1,392,518
20,704,227 Chemicals - 1.3% Air Products & Chemicals, Inc. 2,538 557,370 CF Industries Holdings, Inc. 32,602 1,201,710 DuPont de Nemours, Inc. 6,769 290,390 International Flavors & Fragrances, Inc.(c) 16,573 1,985,114 Linde plc 20,853 3,983,132 PPG Industries, Inc. 2,376 248,173 Sherwin-Williams Co. (The) 472 243,906
8,509,795 Commercial Services & Supplies - 1.0% Copart, Inc.* 21,474 1,814,124 Republic Services, Inc. 26,134 2,358,855 Waste Management, Inc. 24,077 2,667,972
6,840,951 Communications Equipment - 0.9% Arista Networks, Inc.* 9,115 1,760,289 Cisco Systems, Inc. 52,760 2,106,707 Motorola Solutions, Inc. 14,152 2,344,703
6,211,699 Construction Materials - 0.4% Martin Marietta Materials, Inc. 9,012 2,050,501 Vulcan Materials Co. 5,555 668,044
2,718,545 Consumer Finance - 0.8% Capital One Financial Corp. 15,900 1,403,334 Discover Financial Services 30,773 2,018,093 Synchrony Financial 72,125 2,098,838
5,520,265 Containers & Packaging - 1.0% International Paper Co. 52,127 1,926,614 Packaging Corp. of America 17,824 1,615,211 Sealed Air Corp. 38,153 1,156,417 Westrock Co. 52,939 1,760,222
6,458,464 Distributors - 0.3% LKQ Corp.* 68,147 2,015,788
Diversified Consumer Services - 0.3% H&R Block, Inc. 85,268 1,762,489
Diversified Financial Services - 0.9% Berkshire Hathaway, Inc., Class B* 29,743 6,137,171

Large Cap Core Plus Schedule of Portfolio Investments February 29, 2020 (Unaudited)
Investments Shares Value ($) Diversified Telecommunication Services - 0.9% AT&T, Inc. 91,873 3,235,767 CenturyLink, Inc. 20,448 246,808 Verizon Communications, Inc. 49,202 2,664,780
6,147,355 Electric Utilities - 2.2% American Electric Power Co., Inc. 30,768 2,746,352 Entergy Corp. 20,620 2,410,684 Evergy, Inc. 28,036 1,832,153 Exelon Corp. 60,386 2,603,240 NextEra Energy, Inc. 1,584 400,372 Southern Co. (The) 36,740 2,217,626 Xcel Energy, Inc. 39,138 2,439,080
14,649,507 Electrical Equipment - 0.5% AMETEK, Inc. 25,212 2,168,232 Emerson Electric Co. 13,474 863,818
3,032,050 Electronic Equipment, Instruments & Components - 0.7% Corning, Inc. 43,405 1,035,643 Keysight Technologies, Inc.* 24,496 2,321,241 Knowles Corp.* 1 9 TE Connectivity Ltd. 17,445 1,445,667
4,802,560 Energy Equipment & Services - 0.7% Baker Hughes Co. 85,804 1,380,586 Helmerich & Payne, Inc. 48,289 1,781,381 TechnipFMC plc 109,838 1,629,996
4,791,963 Entertainment - 1.1% Electronic Arts, Inc.* 17,731 1,797,391 Netflix, Inc.* 7,421 2,738,572 Take-Two Interactive Software, Inc.* 2,428 260,961 Walt Disney Co. (The) 21,527 2,532,652
7,329,576 Equity Real Estate Investment Trusts (REITs) - 5.9% American Tower Corp. 1,227 278,283 Apartment Investment & Management Co., Class A 44,002 2,105,056 AvalonBay Communities, Inc. 12,647 2,536,862 Crown Castle International Corp. 5,622 805,576 Duke Realty Corp. 65,872 2,138,864 Equity Residential 33,120 2,487,312 Essex Property Trust, Inc. 7,249 2,054,077 Federal Realty Investment Trust 19,309 2,246,409 Healthpeak Properties, Inc. 70,190 2,220,812 Host Hotels & Resorts, Inc. 124,439 1,801,877 Iron Mountain, Inc. 47,654 1,449,158 Kimco Realty Corp. 53,646 930,758 Mid-America Apartment Communities, Inc. 17,847 2,306,903 Prologis, Inc. 34,839 2,936,231 Public Storage 10,693 2,236,120 Simon Property Group, Inc. 19,747 2,430,461 UDR, Inc. 46,845 2,107,088 Ventas, Inc. 34,071 1,831,998 Vornado Realty Trust 36,078 1,933,059 Welltower, Inc. 33,825 2,530,786
39,367,690 Food & Staples Retailing - 0.9% Costco Wholesale Corp. 8,450 2,375,633 Kroger Co. (The) 66,751 1,877,706
Investments Shares Value ($) Sysco Corp. 10,155 676,831 Walmart, Inc. 11,986 1,290,652
6,220,822 Food Products - 1.1% Campbell Soup Co. 6,887 310,741 Conagra Brands, Inc. 30,761 821,011 General Mills, Inc. 19,369 949,081 Hershey Co. (The) 15,147 2,181,017 Lamb Weston Holdings, Inc. 6,934 602,495 Tyson Foods, Inc., Class A 33,509 2,272,916
7,137,261 Health Care Equipment & Supplies - 3.5% Abbott Laboratories 12,309 948,162 ABIOMED, Inc.* 5,832 876,316 Align Technology, Inc.* 8,664 1,891,784 Baxter International, Inc. 34,469 2,877,127 Boston Scientific Corp.* 80,494 3,009,671 Cooper Cos., Inc. (The) 3,872 1,256,735 Edwards Lifesciences Corp.* 13,774 2,821,466 IDEXX Laboratories, Inc.* 9,560 2,433,116 Intuitive Surgical, Inc.* 3,439 1,836,289 Medtronic plc 43,979 4,427,366 Teleflex, Inc. 2,982 999,030
23,377,062 Health Care Providers & Services - 3.1% AmerisourceBergen Corp. 23,855 2,011,454 Cardinal Health, Inc. 25,446 1,326,245 Centene Corp.* 25,176 1,334,831 Cigna Corp. 17,165 3,140,165 CVS Health Corp. 56,000 3,314,080 HCA Healthcare, Inc. 12,391 1,573,781 Humana, Inc. 8,467 2,706,731 McKesson Corp. 11,581 1,619,719 UnitedHealth Group, Inc. 11,879 3,028,670 Universal Health Services, Inc., Class B 2,091 258,740
20,314,416 Hotels, Restaurants & Leisure - 2.0% Carnival Corp. 58,139 1,945,331 Chipotle Mexican Grill, Inc.* 2,958 2,288,250 Darden Restaurants, Inc. 15,851 1,545,472 Hilton Worldwide Holdings, Inc. 24,484 2,379,845 McDonald's Corp. 4,669 906,580 Norwegian Cruise Line Holdings Ltd.* 39,382 1,467,373 Royal Caribbean Cruises Ltd. 20,657 1,661,029 Starbucks Corp. 14,805 1,161,156
13,355,036 Household Durables - 1.5% DR Horton, Inc. 42,728 2,276,121 Garmin Ltd. 24,032 2,124,188 Leggett & Platt, Inc. 26,487 1,050,474 Lennar Corp., Class A 37,157 2,242,053 PulteGroup, Inc. 20,109 808,382 Whirlpool Corp. 8,931 1,141,918
9,643,136 Household Products - 1.2% Church & Dwight Co., Inc. 30,308 2,107,012 Clorox Co. (The) 12,050 1,921,011 Procter & Gamble Co. (The) 33,703 3,816,191
7,844,214 Industrial Conglomerates - 0.3% 3M Co. 2,650 395,486

Large Cap Core Plus Schedule of Portfolio Investments February 29, 2020 (Unaudited)
Investments Shares Value ($) General Electric Co. 42,919 466,959 Honeywell International, Inc. 3,008 487,807 Roper Technologies, Inc. 1,157 406,917
1,757,169 Insurance - 3.8% Allstate Corp. (The) 24,443 2,572,626 Arthur J Gallagher & Co. 24,534 2,391,820 Assurant, Inc. 16,867 2,033,992 Everest Re Group Ltd. 8,556 2,120,861 Globe Life, Inc. 22,072 2,045,191 Hartford Financial Services Group, Inc. (The) 43,407 2,168,180 Loews Corp. 42,813 1,953,557 Principal Financial Group, Inc. 34,924 1,550,276 Progressive Corp. (The) 29,679 2,171,316 Prudential Financial, Inc. 30,621 2,310,354 Unum Group 69,216 1,613,425 WR Berkley Corp. 31,117 2,089,195
25,020,793 Interactive Media & Services - 2.9% Alphabet, Inc., Class A* 4,460 5,973,055 Alphabet, Inc., Class C* 4,456 5,968,054 Facebook, Inc., Class A* 37,204 7,160,654 Twitter, Inc.* 7,895 262,114
19,363,877 Internet & Direct Marketing Retail - 2.4% Amazon.com, Inc.* 7,209 13,579,954 eBay, Inc. 73,700 2,552,968
16,132,922 IT Services - 4.7% Accenture plc, Class A 9,957 1,798,135 Akamai Technologies, Inc.* 22,054 1,907,892 Alliance Data Systems Corp. 20,212 1,735,807 Broadridge Financial Solutions, Inc. 4,470 466,489 DXC Technology Co. 62,653 1,510,564 Fiserv, Inc.* 23,381 2,556,946 Gartner, Inc.* 11,801 1,526,931 International Business Machines Corp. 3,116 405,547 Jack Henry & Associates, Inc. 14,633 2,220,411 Leidos Holdings, Inc. 9,313 955,979 Mastercard, Inc., Class A 10,858 3,151,535 Paychex, Inc. 28,120 2,178,738 PayPal Holdings, Inc.* 20,250 2,186,798 VeriSign, Inc.* 11,187 2,122,733 Visa, Inc., Class A 22,786 4,141,583 Western Union Co. (The) 93,934 2,103,182
30,969,270 Leisure Products - 0.0%(b) Hasbro, Inc. 2,825 218,231
Life Sciences Tools & Services - 1.1% Agilent Technologies, Inc. 28,669 2,209,520 IQVIA Holdings, Inc.* 16,423 2,290,844 Mettler-Toledo International, Inc.* 3,139 2,202,636 Thermo Fisher Scientific, Inc. 1,461 424,859 Waters Corp.* 1,241 241,859
7,369,718 Machinery - 2.5% Cummins, Inc. 15,097 2,284,025 Dover Corp. 21,269 2,185,177 IDEX Corp. 13,986 2,069,928
Investments Shares Value ($) Illinois Tool Works, Inc. 17,445 2,926,922 PACCAR, Inc. 31,761 2,124,811 Parker-Hannifin Corp. 12,492 2,308,147 Pentair plc 36,766 1,448,213 Snap-on, Inc. 2,905 420,499 Westinghouse Air Brake Technologies Corp. 8,733 599,957
16,367,679 Media - 1.8% Charter Communications, Inc., Class A* 5,319 2,623,171 Comcast Corp., Class A 105,122 4,250,083 Discovery, Inc., Class A* 76,239 1,959,342 DISH Network Corp., Class A* 19,438 651,562 Fox Corp., Class A 10,896 334,943 News Corp., Class A 90,863 1,097,171 Omnicom Group, Inc. 3,515 243,519 ViacomCBS, Inc. 18,658 459,173
11,618,964 Metals & Mining - 0.7% Freeport-McMoRan, Inc. 203,365 2,025,516 Newmont Corp. 35,256 1,573,475 Nucor Corp. 20,104 831,300
4,430,291 Multiline Retail - 0.6% Dollar General Corp. 4,210 632,763 Macy's, Inc. 16,901 223,600 Nordstrom, Inc. 10,544 365,877 Target Corp. 24,808 2,555,224
3,777,464 Multi-Utilities - 1.3% CenterPoint Energy, Inc. 91,778 2,112,730 DTE Energy Co. 18,615 2,078,737 Public Service Enterprise Group, Inc. 48,117 2,468,883 Sempra Energy 1,862 260,271 WEC Energy Group, Inc. 17,595 1,624,546
8,545,167 Oil, Gas & Consumable Fuels - 3.6% Cabot Oil & Gas Corp. 123,296 1,717,513 Chevron Corp. 44,796 4,181,259 Cimarex Energy Co. 6,788 224,343 Devon Energy Corp. 84,631 1,374,408 Diamondback Energy, Inc. 32,973 2,044,326 EOG Resources, Inc. 24,684 1,561,510 Exxon Mobil Corp. 58,646 3,016,750 Hess Corp. 42,682 2,397,875 HollyFrontier Corp. 7,840 264,051 Marathon Petroleum Corp. 48,182 2,284,790 ONEOK, Inc. 11,015 734,921 Phillips 66 11,021 825,032 Valero Energy Corp. 12,129 803,546 Williams Cos., Inc. (The) 115,910 2,208,086
23,638,410 Personal Products - 0.1% Estee Lauder Cos., Inc. (The), Class A 3,921 719,896
Pharmaceuticals - 3.0% Bristol-Myers Squibb Co. 56,638 3,345,040 Eli Lilly & Co. 4,008 505,529 Johnson & Johnson 39,125 5,261,530 Merck & Co., Inc. 58,421 4,472,712

Large Cap Core Plus Schedule of Portfolio Investments February 29, 2020 (Unaudited)
Investments Shares Value ($) Perrigo Co. plc 5,478 277,680 Pfizer, Inc. 78,959 2,638,810 Zoetis, Inc. 24,751 3,297,575
19,798,876 Professional Services - 0.2% Robert Half International, Inc. 27,763 1,399,533
Road & Rail - 0.7% CSX Corp. 20,693 1,457,822 Norfolk Southern Corp. 15,011 2,737,256 Union Pacific Corp. 2,522 403,040
4,598,118 Semiconductors & Semiconductor Equipment - 3.4% Advanced Micro Devices, Inc.* 43,186 1,964,099 Applied Materials, Inc. 27,529 1,599,986 Broadcom, Inc. 7,139 1,946,234 Intel Corp. 101,996 5,662,818 KLA Corp. 10,003 1,537,561 NVIDIA Corp. 3,831 1,034,638 Qorvo, Inc.* 19,880 1,999,531 QUALCOMM, Inc. 43,283 3,389,059 Texas Instruments, Inc. 19,952 2,277,321 Xilinx, Inc. 17,321 1,446,130
22,857,377 Software - 6.9% Adobe, Inc.* 6,379 2,201,521 Autodesk, Inc.* 15,059 2,874,462 Cadence Design Systems, Inc.* 34,275 2,266,949 Citrix Systems, Inc. 20,628 2,132,729 Fortinet, Inc.* 21,707 2,215,416 Intuit, Inc. 12,097 3,215,987 Microsoft Corp. 139,564 22,610,764 NortonLifeLock, Inc. 119,074 2,265,978 Oracle Corp. 38,051 1,882,003 Paycom Software, Inc.* 3,102 876,780 salesforce.com, Inc.* 7,545 1,285,668 Synopsys, Inc.* 16,624 2,292,948
46,121,205 Specialty Retail - 1.1% AutoZone, Inc.* 458 472,890 Best Buy Co., Inc. 8,472 640,907 Gap, Inc. (The) 27,252 390,521 Home Depot, Inc. (The) 15,567 3,391,115 Ross Stores, Inc. 24,887 2,707,208
7,602,641 Technology Hardware, Storage & Peripherals - 3.9% Apple, Inc. 74,388 20,334,704 Hewlett Packard Enterprise Co. 44,869 573,874 HP, Inc. 85,545 1,778,480 NetApp, Inc. 26,112 1,219,953 Xerox Holdings Corp. 61,745 1,988,189
25,895,200 Textiles, Apparel & Luxury Goods - 1.0% Hanesbrands, Inc. 117,559 1,556,481 NIKE, Inc., Class B 19,618 1,753,457 Ralph Lauren Corp. 18,900 1,994,139 Under Armour, Inc., Class A* 106,502 1,511,263
6,815,340 Tobacco - 0.2% Altria Group, Inc. 14,235 574,667 Philip Morris International, Inc. 12,383 1,013,796
1,588,463
Investments Shares Value ($) Trading Companies & Distributors - 0.3% United Rentals, Inc.* 13,376 1,772,052 WW Grainger, Inc. 1,390 385,781
2,157,833 Wireless Telecommunication Services - 0.4% T-Mobile US, Inc.* 29,404 2,651,065
TOTAL COMMON STOCKS (Cost $633,385,456) 625,711,498 SECURITIES LENDING REINVESTMENTS(d) - 0.2% INVESTMENT COMPANIES - 0.2%
BlackRock Liquidity FedFund, Institutional Class 1.49% (Cost $1,161,797) 1,161,797 1,161,797
Investments Principal
Amount ($) Value ($) SHORT-TERM INVESTMENTS - 5.2% REPURCHASE AGREEMENTS(e) - 5.2% Repurchase Agreements with various
counterparties, rates 1.58% - 1.59%, dated 2/28/2020, due 3/2/2020, total to be received $34,270,523
(Cost $34,266,004) 34,266,004 34,266,004 Total Investments - 99.6%
(Cost $668,813,257) 661,139,299 Other Assets Less Liabilities - 0.4% 2,816,926 Net Assets - 100.0% 663,956,225
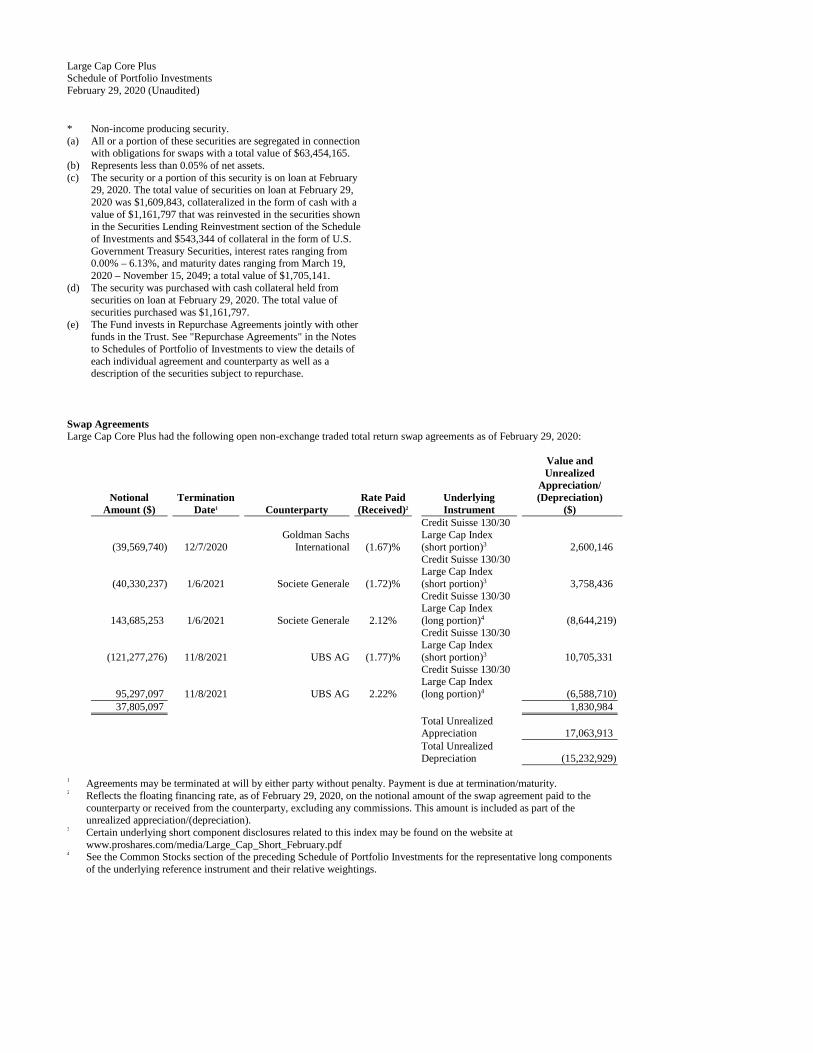
Large Cap Core Plus Schedule of Portfolio Investments February 29, 2020 (Unaudited)
* Non-income producing security. (a) All or a portion of these securities are segregated in connection
with obligations for swaps with a total value of $63,454,165. (b) Represents less than 0.05% of net assets. (c) The security or a portion of this security is on loan at February
29, 2020. The total value of securities on loan at February 29, 2020 was $1,609,843, collateralized in the form of cash with a value of $1,161,797 that was reinvested in the securities shown in the Securities Lending Reinvestment section of the Schedule of Investments and $543,344 of collateral in the form of U.S. Government Treasury Securities, interest rates ranging from 0.00% – 6.13%, and maturity dates ranging from March 19, 2020 – November 15, 2049; a total value of $1,705,141.
(d) The security was purchased with cash collateral held from securities on loan at February 29, 2020. The total value of securities purchased was $1,161,797.
(e) The Fund invests in Repurchase Agreements jointly with other funds in the Trust. See "Repurchase Agreements" in the Notes to Schedules of Portfolio of Investments to view the details of each individual agreement and counterparty as well as a description of the securities subject to repurchase.
Swap Agreements Large Cap Core Plus had the following open non-exchange traded total return swap agreements as of February 29, 2020:
Notional
Amount ($) Termination
Date1 Counterparty Rate Paid
(Received)2 Underlying Instrument
Value and Unrealized
Appreciation/ (Depreciation)
($)
(39,569,740)
12/7/2020 Goldman Sachs
International (1.67)%
Credit Suisse 130/30 Large Cap Index (short portion)3 2,600,146
(40,330,237)
1/6/2021 Societe Generale (1.72)%
Credit Suisse 130/30 Large Cap Index (short portion)3 3,758,436
143,685,253
1/6/2021 Societe Generale 2.12%
Credit Suisse 130/30 Large Cap Index (long portion)4 (8,644,219)
(121,277,276)
11/8/2021 UBS AG (1.77)%
Credit Suisse 130/30 Large Cap Index (short portion)3 10,705,331
95,297,097
11/8/2021 UBS AG 2.22%
Credit Suisse 130/30 Large Cap Index (long portion)4 (6,588,710)
37,805,097
1,830,984
Total Unrealized Appreciation 17,063,913
Total Unrealized Depreciation (15,232,929)
1 Agreements may be terminated at will by either party without penalty. Payment is due at termination/maturity. 2 Reflects the floating financing rate, as of February 29, 2020, on the notional amount of the swap agreement paid to the
counterparty or received from the counterparty, excluding any commissions. This amount is included as part of the unrealized appreciation/(depreciation).
3 Certain underlying short component disclosures related to this index may be found on the website at www.proshares.com/media/Large_Cap_Short_February.pdf
4 See the Common Stocks section of the preceding Schedule of Portfolio Investments for the representative long components of the underlying reference instrument and their relative weightings.

Long Online /Short Stores ETF Schedule of Portfolio Investments February 29, 2020 (Unaudited)
Investments Shares Value ($) COMMON STOCKS(a) - 89.7%
Internet & Direct Marketing Retail - 89.7% 1-800-Flowers.com, Inc., Class A* 51,975 937,629 Alibaba Group Holding Ltd., ADR* 19,673 4,091,984 Amazon.com, Inc.* 3,916 7,376,765 Baozun, Inc., ADR* 7,738 245,449 Chewy, Inc., Class A* 49,112 1,453,715 eBay, Inc. 39,688 1,374,792 Etsy, Inc.* 29,040 1,678,803 Farfetch Ltd., Class A* 37,462 418,451 Fiverr International Ltd.* 4,518 142,227 Groupon, Inc.* 822,509 1,102,162 Grubhub, Inc.* 27,857 1,340,200 JD.com, Inc., ADR* 19,545 752,678 Jumia Technologies AG, ADR* 11,429 46,973 MercadoLibre, Inc.* 1,205 742,316 Pinduoduo, Inc., ADR* 23,131 827,627 Quotient Technology, Inc.* 129,361 1,157,781 Qurate Retail, Inc., Series A* 169,392 1,155,254 Shutterstock, Inc.* 35,110 1,353,139 Stamps.com, Inc.* 9,772 1,378,927 Stitch Fix, Inc., Class A*(b) 55,747 1,339,601 Uxin Ltd., ADR* 40,808 68,149 Vipshop Holdings Ltd., ADR* 59,719 766,195 Wayfair, Inc., Class A* 20,194 1,276,463 Yunji, Inc., ADR* 17,615 73,102
TOTAL COMMON STOCKS (Cost $32,677,929) 31,100,382 SECURITIES LENDING REINVESTMENTS(c) - 4.0% INVESTMENT COMPANIES - 4.0%
BlackRock Liquidity FedFund, Institutional Class 1.49% (Cost $1,388,146) 1,388,146 1,388,146
Investments Principal
Amount ($) Value ($) SHORT-TERM INVESTMENTS - 0.9% REPURCHASE AGREEMENTS(d) - 0.9% Repurchase Agreements with various
counterparties, rates 1.58% - 1.59%, dated 2/28/2020, due 3/2/2020, total to be received $296,567
(Cost $296,529) 296,529 296,529 Total Investments - 94.6%
(Cost $34,362,604) 32,785,057 Other Assets Less Liabilities - 5.4% 1,876,795 Net Assets - 100.0% 34,661,852
* Non-income producing security. (a) All or a portion of these securities are segregated in connection
with obligations for swaps with a total value of $1,874,493. (b) The security or a portion of this security is on loan at February
29, 2020. The total value of securities on loan at February 29, 2020 was $1,339,600, collateralized in the form of cash with a value of $1,388,146 that was reinvested in the securities shown in the Securities Lending Reinvestment section of the Schedule of Investments.
(c) The security was purchased with cash collateral held from securities on loan at February 29, 2020. The total value of securities purchased was $1,388,146.
(d) The Fund invests in Repurchase Agreements jointly with other funds in the Trust. See "Repurchase Agreements" in the Notes to Schedules of Portfolio of Investments to view the details of each individual agreement and counterparty as well as a description of the securities subject to repurchase.
Abbreviations ADR American Depositary Receipt

Long Online /Short Stores ETF Schedule of Portfolio Investments February 29, 2020 (Unaudited)
Swap Agreements Long Online /Short Stores ETF had the following open non-exchange traded total return swap agreements as of February 29, 2020:
Notional
Amount ($) Termination
Date1 Counterparty Rate Paid
(Received)2 Underlying Instrument
Value and Unrealized
Appreciation ($)
(10,011,979)
11/8/2021 Credit Suisse International (1.67)%
Solactive-ProShares Bricks and Mortar Retail Store Index 1,081,488
2,699,285
11/8/2021 Credit Suisse International 1.87%
ProShares Online Retail Index 121,701
(7,288,788)
1/6/2021 Societe Generale (0.47)%
Solactive-ProShares Bricks and Mortar Retail Store Index 1,292,463
871,243
1/6/2021 Societe Generale 2.02% ProShares Online Retail Index 48,943
(13,730,239)
2,544,595
Total Unrealized Appreciation 2,544,595
1 Agreements may be terminated at will by either party without penalty. Payment is due at termination/maturity. 2 Reflects the floating financing rate, as of February 29, 2020, on the notional amount of the swap agreement paid to the
counterparty or received from the counterparty, excluding any commissions. This amount is included as part of the unrealized appreciation/(depreciation).

Managed Futures Strategy ETF Consolidated Schedule of Portfolio Investments February 29, 2020 (Unaudited)
Investments Principal
Amount ($) Value ($) SHORT-TERM INVESTMENTS - 96.1% REPURCHASE AGREEMENTS(a) - 96.1% Repurchase Agreements with various
counterparties, rates 1.58% - 1.59%, dated 2/28/2020, due 3/2/2020, total to be received $2,420,876
(Cost $2,420,557) 2,420,557 2,420,557 Total Investments - 96.1%
(Cost $2,420,557) 2,420,557 Other Assets Less Liabilities - 3.9% 99,461 Net Assets - 100.0% 2,520,018
(a) The Fund invests in Repurchase Agreements jointly with other funds in the Trust. See "Repurchase Agreements" in the Notes to Schedules of Portfolio of Investments to view the details of each individual agreement and counterparty as well as a description of the securities subject to repurchase.

Managed Futures Strategy ETF Consolidated Schedule of Portfolio Investments February 29, 2020 (Unaudited)
Managed Futures Strategy ETF had the following open long and short futures contracts as of February 29, 2020: Futures Contracts Purchased
Number of Contracts
Expiration Date
Trading Currency Notional Amount
Value and Unrealized
Appreciation/ (Depreciation)
Cocoa 3 5/13/2020 USD $ 80,160
$ (5,038)
Cotton No. 2 2 5/6/2020 USD 61,490
(6,826)
Foreign Exchange CHF/USD 1 3/16/2020 USD 129,588
197
Foreign Exchange GBP/USD 2 3/16/2020 USD 159,975
(4,761)
Gold 1 4/28/2020 USD 50,134
(462)
Silver 3 5/27/2020 USD 49,371
(3,918)
Sugar No. 11 4 4/30/2020 USD 63,347
(1,960)
U.S. Treasury 10 Year Note 3 6/19/2020 USD 404,250
10,881
U.S. Treasury Long Bond 1 6/19/2020 USD 170,250
10,092
Wheat 2 12/14/2020 USD 54,350
(2,680)
$ (4,475)
Futures Contracts Sold
Number of Contracts
Expiration Date
Trading Currency Notional Amount
Value and Unrealized
Appreciation/ (Depreciation)
Coffee 'C' 1 5/18/2020 USD $ 41,756
$ (4,147)
Copper 1 5/27/2020 USD 63,500
523
Corn 3 5/14/2020 USD 55,237
2,730
E-Mini Crude Oil 1 3/19/2020 USD 22,380
3,030
E-Mini Euro 3 3/16/2020 USD 206,991
(773)
E-Mini Natural Gas 11 3/26/2020 USD 46,310
5,589
Foreign Exchange AUD/USD 2 3/16/2020 USD 130,480
3,665
Foreign Exchange CAD/USD 2 3/17/2020 USD 149,230
1,165
Foreign Exchange JPY/USD 2 3/16/2020 USD 232,050
(355)
Lean Hogs 2 4/15/2020 USD 49,820
10,495
Live Cattle 3 4/30/2020 USD 129,090
14,392
NY Harbor ULSD 1 3/31/2020 USD 62,047
6,802
Soybean 1 5/14/2020 USD 44,637
110
$ 43,226
$ 38,751
Abbreviations
AUD Australian Dollar CAD Canadian Dollar CHF Swiss Franc GBP British Pound JPY Japanese Yen USD U.S. Dollar

Merger ETF Schedule of Portfolio Investments February 29, 2020 (Unaudited)
Investments Shares Value ($) COMMON STOCKS - 87.9%
Auto Components - 2.6% Delphi Technologies plc* 9,028 127,475
Biotechnology - 2.9% Ra Pharmaceuticals, Inc.* 2,986 139,625
Capital Markets - 7.7% E*TRADE Financial Corp. 2,600 119,028 Legg Mason, Inc. 2,810 139,994 TD Ameritrade Holding Corp. 2,670 112,754
371,776 Commercial Services & Supplies - 2.9% Advanced Disposal Services, Inc.* 4,214 139,315
Communications Equipment - 3.9% Acacia Communications, Inc.* 2,747 188,197
Diversified Financial Services - 2.8% FGL Holdings 11,675 133,562
Diversified Telecommunication Services - 3.5% Zayo Group Holdings, Inc.* 4,797 167,847
Electric Utilities - 2.9% El Paso Electric Co. 2,055 139,473
Electrical Equipment - 3.3% OSRAM Licht AG* 3,128 161,090
Electronic Equipment, Instruments & Components - 11.6% Fitbit, Inc., Class A* 19,678 125,742 Ingenico Group SA 1,045 147,607 KEMET Corp. 5,329 138,980 Tech Data Corp.* 1,056 150,364
562,693 Health Care Equipment & Supplies - 3.0% Wright Medical Group NV* 4,716 142,659
142,659 Hotels, Restaurants & Leisure - 6.1% Caesars Entertainment Corp.* 11,226 142,683 Stars Group, Inc. (The)* 6,712 153,817
296,500 IT Services - 5.5% Altran Technologies SA 8,370 134,258 InterXion Holding NV* 1,551 131,664
265,922 Metals & Mining - 2.1% AK Steel Holding Corp.* 44,161 102,012
Oil, Gas & Consumable Fuels - 2.9% Tallgrass Energy LP, Class A 6,315 139,372
Pharmaceuticals - 3.5% Allergan plc 886 168,934
Real Estate Management & Development - 3.4% Unizo Holdings Co. Ltd. 2,970 163,287
Investments Shares Value ($) Semiconductors & Semiconductor Equipment - 2.9% Cypress Semiconductor Corp. 6,109 141,057
Software - 8.7% ForeScout Technologies, Inc.* 4,275 139,108 LogMeIn, Inc. 1,624 138,422 RIB Software SE 4,510 144,286
421,816 Specialty Retail - 2.9% Tiffany & Co. 1,037 138,533
Trading Companies & Distributors - 2.8% Aircastle Ltd. 4,290 136,636
TOTAL COMMON STOCKS (Cost $4,253,627) 4,247,781
Investments Number of
Rights Value ($) RIGHTS - 0.1%
Chemicals - 0.1% Schulman A, Inc., CVR*(a)(b) (Cost $–) 4,250 2,223
Investments Principal
Amount ($) Value ($) SHORT-TERM INVESTMENTS - 10.4% REPURCHASE AGREEMENTS(c) - 10.4% Repurchase Agreements with various
counterparties, rates 1.58% - 1.59%, dated 2/28/2020, due 3/2/2020, total to be received $504,903
(Cost $504,837) 504,837 504,837 Total Investments - 98.4%
(Cost $4,758,464) 4,754,841 Other Assets Less Liabilities - 1.6% 78,748 Net Assets - 100.0% 4,833,589
* Non-income producing security. (a) Security fair valued as of February 29, 2020 in accordance with
procedures approved by the Board of Trustees. Total value of all such securities at February 29, 2020 amounted to $2,223, which represents approximately 0.05% of net assets of the Fund.
(b) Illiquid security. (c) The Fund invests in Repurchase Agreements jointly with other
funds in the Trust. See "Repurchase Agreements" in the Notes to Schedules of Portfolio of Investments to view the details of each individual agreement and counterparty as well as a description of the securities subject to repurchase.
Abbreviations CVR Contingent Value Rights - No defined expiration
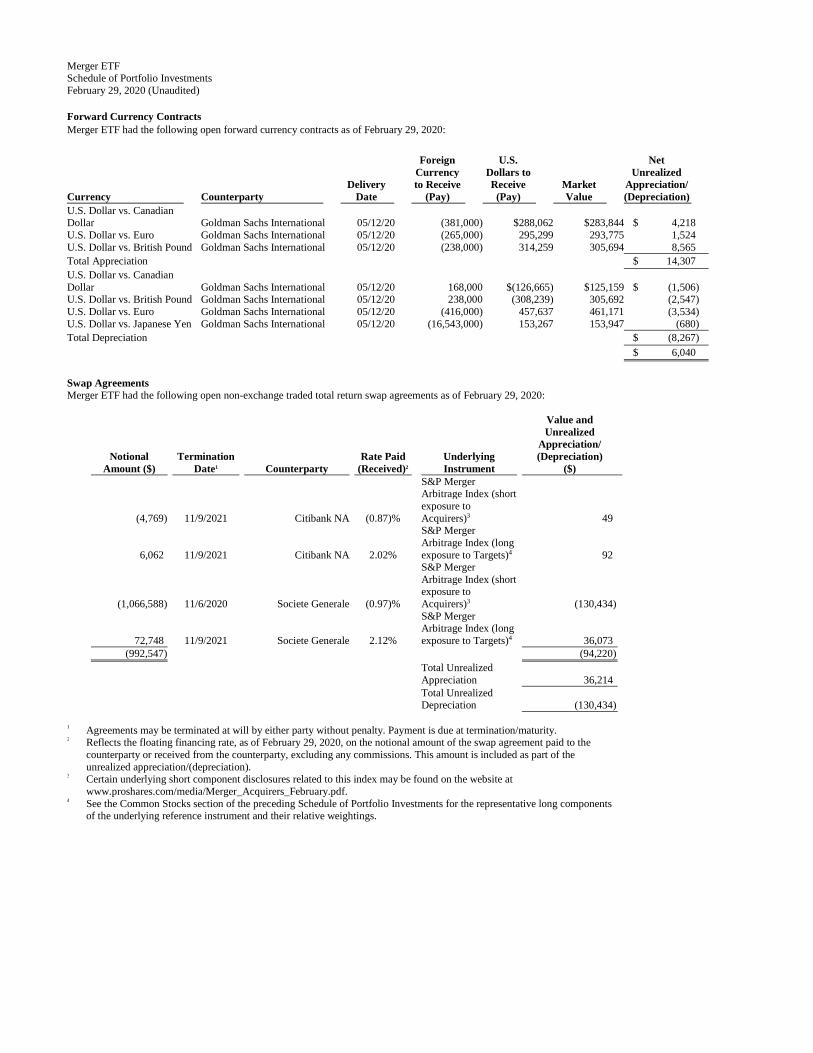
Merger ETF Schedule of Portfolio Investments February 29, 2020 (Unaudited)
Forward Currency Contracts Merger ETF had the following open forward currency contracts as of February 29, 2020:
Currency Counterparty Delivery
Date
Foreign Currency to Receive
(Pay)
U.S. Dollars to Receive
(Pay) Market Value
Net Unrealized
Appreciation/ (Depreciation)
U.S. Dollar vs. Canadian Dollar Goldman Sachs International 05/12/20 (381,000) $288,062 $283,844 $ 4,218 U.S. Dollar vs. Euro Goldman Sachs International 05/12/20 (265,000) 295,299 293,775 1,524 U.S. Dollar vs. British Pound Goldman Sachs International 05/12/20 (238,000) 314,259 305,694 8,565 Total Appreciation $ 14,307 U.S. Dollar vs. Canadian Dollar Goldman Sachs International 05/12/20 168,000 $(126,665) $125,159 $ (1,506) U.S. Dollar vs. British Pound Goldman Sachs International 05/12/20 238,000 (308,239) 305,692 (2,547) U.S. Dollar vs. Euro Goldman Sachs International 05/12/20 (416,000) 457,637 461,171 (3,534) U.S. Dollar vs. Japanese Yen Goldman Sachs International 05/12/20 (16,543,000) 153,267 153,947 (680) Total Depreciation $ (8,267) $ 6,040
Swap Agreements Merger ETF had the following open non-exchange traded total return swap agreements as of February 29, 2020:
Notional
Amount ($) Termination
Date1 Counterparty Rate Paid
(Received)2 Underlying Instrument
Value and Unrealized
Appreciation/ (Depreciation)
($)
(4,769) 11/9/2021 Citibank NA (0.87)%
S&P Merger Arbitrage Index (short exposure to Acquirers)3 49
6,062 11/9/2021 Citibank NA 2.02%
S&P Merger Arbitrage Index (long exposure to Targets)4 92
(1,066,588) 11/6/2020 Societe Generale (0.97)%
S&P Merger Arbitrage Index (short exposure to Acquirers)3 (130,434)
72,748 11/9/2021 Societe Generale 2.12%
S&P Merger Arbitrage Index (long exposure to Targets)4 36,073
(992,547) (94,220)
Total Unrealized Appreciation 36,214
Total Unrealized Depreciation (130,434)
1 Agreements may be terminated at will by either party without penalty. Payment is due at termination/maturity. 2 Reflects the floating financing rate, as of February 29, 2020, on the notional amount of the swap agreement paid to the
counterparty or received from the counterparty, excluding any commissions. This amount is included as part of the unrealized appreciation/(depreciation).
3 Certain underlying short component disclosures related to this index may be found on the website at www.proshares.com/media/Merger_Acquirers_February.pdf.
4 See the Common Stocks section of the preceding Schedule of Portfolio Investments for the representative long components of the underlying reference instrument and their relative weightings.

Merger ETF Schedule of Portfolio Investments February 29, 2020 (Unaudited)
Merger ETF invested, as a percentage of net assets, in the following countries as of February 29, 2020: United States 66.5% Germany 6.3% France 5.9% Japan 3.4% Canada 3.2% Netherlands 2.7% Other 1 12.0% 100.0%
1 Includes any non-equity securities and net other assets (liabilities).

Morningstar Alternatives Solution ETF Schedule of Portfolio Investments February 29, 2020 (Unaudited)
Investments Shares Value ($) EXCHANGE TRADED FUNDS - 100.0%
ProShares DJ Brookfield Global Infrastructure ETF(a)(b) 32,391 1,413,057 ProShares Global Listed Private Equity ETF(a) 28,208 876,987 ProShares Hedge Replication ETF(a)(b) 39,329 1,782,784 ProShares Inflation Expectations ETF(a) 6,826 172,664 ProShares Managed Futures Strategy ETF(a) 18,803 729,744 ProShares Merger ETF(a) 43,589 1,682,099 ProShares RAFITM Long/Short(a) 19,037 635,360
TOTAL EXCHANGE TRADED FUNDS (Cost $7,358,822) 7,292,695 SECURITIES LENDING REINVESTMENTS(c) - 19.7% INVESTMENT COMPANIES - 19.7%
BlackRock Liquidity FedFund, Institutional Class 1.49% (Cost $1,439,056) 1,439,056 1,439,056
Investments Principal
Amount ($) Value ($) SHORT-TERM INVESTMENTS - 0.2% REPURCHASE AGREEMENTS(d) - 0.2% Repurchase Agreements with various
counterparties, rates 1.58% - 1.59%, dated 2/28/2020, due 3/2/2020, total to be received $13,466
(Cost $13,465) 13,465 13,465 Total Investments - 119.9%
(Cost $8,811,343) 8,745,216 Liabilities in excess of other assets - (19.9%) (1,448,732) Net Assets - 100.0% 7,296,484
(a) Affiliated company as defined under the Investment Company Act of 1940.
(b) The security or a portion of this security is on loan at February 29, 2020. The total value of securities on loan at February 29, 2020 was $1,394,816, collateralized in the form of cash with a value of $1,439,056 that was reinvested in the securities shown in the Securities Lending Reinvestment section of the Schedule of Investments.
(c) The security was purchased with cash collateral held from securities on loan at February 29, 2020. The total value of securities purchased was $1,439,056.
(d) The Fund invests in Repurchase Agreements jointly with other funds in the Trust. See "Repurchase Agreements" in the Notes to Schedules of Portfolio of Investments to view the details of each individual agreement and counterparty as well as a description of the securities subject to repurchase.

Morningstar Alternatives Solution ETF Schedule of Portfolio Investments February 29, 2020 (Unaudited)
Investment in a company which was affiliated for the period ending February 29, 2020, was as follows:
Exchange Traded Funds
Value May 31, 2019
Purchases at Cost
Sales at Value
Shares February 29, 2020
Value February 29, 2020
Change in Unrealized
Appreciation (Depreciation)
Dividend Income
Net Realized Gain/(Loss)
ProShares DJ Brookfield Global Infrastructure ETF $ 973,414 $ 548,472 $ 76,501 32,391 $ 1,413,057 $ (33,488) $ 31,598 $ 1,160
ProShares Global Listed Private Equity ETF 110,381 892,616 38,733 28,208 876,987 (86,309) 53,946 (968)
ProShares Hedge Replication ETF 1,199,242 583,654 12,580 39,329 1,782,784 11,927 11,724 541
ProShares Inflation Expectations ETF 143,720 51,345 10,609 6,826 172,664 (10,980) 2,906 (812)
ProShares Managed Futures Strategy ETF 1,340,718 273,276 863,047 18,803 729,744 (5,399) 9,632 (15,804)
ProShares Merger ETF 1,990,503 219,310 578,197 43,589 1,682,099 44,852 11,975 5,631 ProShares RAFITM
Long/Short 892,220 378,763 607,778 19,037 635,360 21,731 8,532 (49,576) $ 6,650,198 $ 2,947,436 $ 2,187,445 188,183 $ 7,292,695 $ (57,666) $ 130,313 $ (59,828)

MSCI EAFE Dividend Growers ETF Schedule of Portfolio Investments February 29, 2020 (Unaudited)
Investments Shares Value ($) COMMON STOCKS - 99.5%
Aerospace & Defense - 3.4% BAE Systems plc 199,179 1,547,839 Meggitt plc 200,374 1,387,182 Safran SA 10,662 1,453,419
4,388,440 Air Freight & Logistics - 1.1% DSV PANALPINA A/S 14,774 1,480,625
Auto Components - 1.2% Koito Manufacturing Co. Ltd. 38,979 1,539,429
Banks - 1.2% Skandinaviska Enskilda Banken AB, Class A 159,619 1,505,457
Beverages - 2.2% Asahi Group Holdings Ltd. 38,362 1,475,940 Diageo plc 40,829 1,442,233
2,918,173 Building Products - 1.2% Kingspan Group plc 24,953 1,563,719
Capital Markets - 2.2% Partners Group Holding AG 1,712 1,469,778 St James's Place plc 109,898 1,425,485
2,895,263 Chemicals - 3.4% Croda International plc 24,976 1,452,810 FUCHS PETROLUB SE (Preference) 37,571 1,424,636 Novozymes A/S, Class B 29,833 1,504,553
4,381,999 Diversified Financial Services - 5.7% Eurazeo SE 23,245 1,547,328 Groupe Bruxelles Lambert SA 16,304 1,466,399 L E Lundbergforetagen AB, Class B 36,170 1,481,108 Mitsubishi UFJ Lease & Finance Co. Ltd. 265,173 1,516,820 Tokyo Century Corp. 35,547 1,476,388
7,488,043 Diversified Telecommunication Services - 1.1% Telenor ASA 94,147 1,494,436
Electric Utilities - 3.5% CK Infrastructure Holdings Ltd. 233,621 1,591,838 Red Electrica Corp. SA 78,986 1,504,890 SSE plc 75,320 1,470,993
4,567,721 Electronic Equipment, Instruments & Components - 2.3% Halma plc 57,671 1,420,963 Hexagon AB, Class B 28,804 1,522,927
2,943,890 Equity Real Estate Investment Trusts (REITs) - 2.3% Link REIT 164,627 1,525,214 Mirvac Group 750,760 1,471,520
2,996,734 Food & Staples Retailing - 2.5% Koninklijke Ahold Delhaize NV 64,652 1,504,140
Investments Shares Value ($) Sundrug Co. Ltd. 54,630 1,709,324
3,213,464 Food Products - 4.6% Associated British Foods plc 48,593 1,399,630 Chocoladefabriken Lindt & Spruengli AG, Class PC 191 1,485,852 Kerry Group plc, Class A 12,579 1,589,001 Nestle SA (Registered) 15,070 1,538,994
6,013,477 Gas Utilities - 3.6% APA Group 216,667 1,500,336 Enagas SA 60,434 1,553,379 Hong Kong & China Gas Co. Ltd. 847,571 1,631,398
4,685,113 Health Care Equipment & Supplies - 3.6% Asahi Intecc Co. Ltd. 65,316 1,565,913 Coloplast A/S, Class B 11,650 1,549,417 Sysmex Corp. 24,454 1,568,602
4,683,932 Health Care Providers & Services - 5.6% Alfresa Holdings Corp. 82,942 1,457,915 Fresenius Medical Care AG & Co. KGaA 20,670 1,573,908 Fresenius SE & Co. KGaA 31,493 1,467,283 Ramsay Health Care Ltd. 31,298 1,372,400 Ryman Healthcare Ltd. 151,715 1,435,044
7,306,550 Hotels, Restaurants & Leisure - 3.3% Carnival plc 41,154 1,279,982 Compass Group plc 65,232 1,425,203 Flutter Entertainment plc 14,710 1,550,864
4,256,049 Household Durables - 3.7% Rinnai Corp. 23,559 1,609,696 SEB SA 12,930 1,692,993 Sekisui Chemical Co. Ltd. 100,300 1,496,154
4,798,843 Industrial Conglomerates - 1.2% Jardine Strategic Holdings Ltd. 52,680 1,512,443
Insurance - 3.2% Legal & General Group plc 402,146 1,335,519 Prudential plc 85,815 1,388,778 Sampo OYJ, Class A 37,196 1,506,841
4,231,138 Interactive Media & Services - 1.1% REA Group Ltd. 21,979 1,393,289
Life Sciences Tools & Services - 1.2% Sartorius Stedim Biotech 8,275 1,560,697
Machinery - 3.4% Kurita Water Industries Ltd. 56,982 1,476,519 Spirax-Sarco Engineering plc 13,791 1,478,800 Techtronic Industries Co. Ltd. 188,404 1,524,290
4,479,609 Multiline Retail - 1.2% Pan Pacific International Holdings Corp. 94,458 1,565,762
Multi-Utilities - 1.1% AGL Energy Ltd. 117,395 1,448,715

MSCI EAFE Dividend Growers ETF Schedule of Portfolio Investments February 29, 2020 (Unaudited)
Investments Shares Value ($) Oil, Gas & Consumable Fuels - 1.0% Washington H Soul Pattinson & Co. Ltd. 109,051 1,372,463
Personal Products - 2.3% Kobayashi Pharmaceutical Co. Ltd. 21,195 1,542,491 L'Oreal SA 5,697 1,508,146
3,050,637 Pharmaceuticals - 5.7% Novartis AG (Registered) 17,017 1,428,412 Novo Nordisk A/S, Class B 25,804 1,501,249 Roche Holding AG 4,698 1,503,147 Sanofi 16,310 1,503,666 UCB SA 17,211 1,579,737
7,516,211 Professional Services - 2.3% Intertek Group plc 21,570 1,451,957 Wolters Kluwer NV 22,153 1,613,828
3,065,785 Real Estate Management & Development - 1.1% Daito Trust Construction Co. Ltd. 14,537 1,479,104
Road & Rail - 1.2% MTR Corp. Ltd. 284,589 1,601,328
Software - 2.2% AVEVA Group plc 24,190 1,355,799 Micro Focus International plc 161,360 1,526,621
2,882,420 Specialty Retail - 2.2% JD Sports Fashion plc 149,267 1,405,155 USS Co. Ltd. 96,773 1,530,568
2,935,723 Textiles, Apparel & Luxury Goods - 4.5% Burberry Group plc 64,128 1,350,707 Cie Financiere Richemont SA (Registered) 22,454 1,517,115 EssilorLuxottica SA 10,913 1,475,647 LVMH Moet Hennessy Louis Vuitton SE 3,738 1,522,713
5,866,182 Tobacco - 1.1% Imperial Brands plc 70,362 1,397,351
Trading Companies & Distributors - 3.5% Ashtead Group plc 46,974 1,433,397 Bunzl plc 66,376 1,585,425 ITOCHU Corp. 70,244 1,602,982
4,621,804 Transportation Infrastructure - 1.1% Transurban Group 152,847 1,463,439
Wireless Telecommunication Services - 1.2% KDDI Corp. 53,653 1,521,076
TOTAL COMMON STOCKS (Cost $128,210,797) 130,086,533
Investments Principal
Amount ($) Value ($) SHORT-TERM INVESTMENTS - 0.4% REPURCHASE AGREEMENTS(a) - 0.4% Repurchase Agreements with various
counterparties, rates 1.58% - 1.59%, dated 2/28/2020, due 3/2/2020, total to be received $543,330
(Cost $543,258) 543,258 543,258 Total Investments - 99.9%
(Cost $128,754,055) 130,629,791 Other Assets Less Liabilities - 0.1% 84,338 Net Assets - 100.0% 130,714,129
(a) The Fund invests in Repurchase Agreements jointly with other funds in the Trust. See "Repurchase Agreements" in the Notes to Schedules of Portfolio of Investments to view the details of each individual agreement and counterparty as well as a description of the securities subject to repurchase.
Abbreviations OYJ Public Limited Company Preference A special type of equity investment that shares in
the earnings of the company, has limited voting rights, and may have a dividend preference. Preference shares may also have liquidation preference.

MSCI EAFE Dividend Growers ETF Schedule of Portfolio Investments February 29, 2020 (Unaudited)
MSCI EAFE Dividend Growers ETF invested, as a percentage of net assets, in the following countries as of February 29, 2020: United Kingdom 22.9% Japan 20.0% France 9.4% Australia 7.7% Switzerland 6.8% Hong Kong 6.0% Denmark 4.6% Ireland 3.6% Sweden 3.5% Germany 3.4% Netherlands 2.4% Spain 2.3% Belgium 2.3% China 1.2% Finland 1.2% Norway 1.1% New Zealand 1.1% Other 1 0.5% 100.0%
1 Includes any non-equity securities and net other assets (liabilities).

MSCI Emerging Markets Dividend Growers ETF Schedule of Portfolio Investments February 29, 2020 (Unaudited)
Investments Shares Value ($) COMMON STOCKS - 100.0%
Banks - 13.2% Absa Group Ltd. 43,271 366,971 Bancolombia SA, ADR 7,697 365,454 Bank Central Asia Tbk. PT 171,722 376,418 Bank Rakyat Indonesia Persero Tbk. PT 1,306,450 381,532 Capitec Bank Holdings Ltd. 4,384 365,331 E.Sun Financial Holding Co. Ltd. 475,170 455,876 Grupo Financiero Inbursa SAB de CV, Class O 341,694 366,640 Itau Unibanco Holding SA, ADR 54,173 383,003 Nedbank Group Ltd. 31,481 356,401 Public Bank Bhd. 98,725 400,521
3,818,147 Chemicals - 4.2% Asian Paints Ltd. 16,151 402,379 Berger Paints India Ltd. 51,942 407,770 Pidilite Industries Ltd. 19,053 399,475
1,209,624 Construction & Engineering - 2.7% China Railway Group Ltd., Class H 699,708 394,960 Larsen & Toubro Ltd., GDR(a) 23,837 388,067
783,027 Construction Materials - 1.2% Grupo Argos SA 81,833 348,799
Consumer Finance - 1.4% Bajaj Finance Ltd. 6,326 391,464
Diversified Financial Services - 4.9% FirstRand Ltd. 102,135 360,877 PSG Group Ltd. 28,867 345,294 Remgro Ltd. 34,176 350,523 RMB Holdings Ltd. 79,853 358,622
1,415,316 Electronic Equipment, Instruments & Components - 3.0% Hangzhou Hikvision Digital Technology Co. Ltd., Class A 80,000 400,572 Leyard Optoelectronic Co. Ltd., Class A 432,987 456,525
857,097 Food & Staples Retailing - 4.0% BIM Birlesik Magazalar A/S 53,794 414,760 Clicks Group Ltd. 24,309 366,972 SPAR Group Ltd. (The) 35,836 376,737
1,158,469 Food Products - 4.1% Indofood CBP Sukses Makmur Tbk. PT 529,805 379,421 Nestle Malaysia Bhd. 12,056 409,017 Ottogi Corp. 949 388,352
1,176,790 Gas Utilities - 2.8% China Gas Holdings Ltd. 110,393 403,618 China Resources Gas Group Ltd. 81,083 404,635
808,253 Health Care Providers & Services - 4.0% Bangkok Dusit Medical Services PCL, Class F 567,092 398,968
Investments Shares Value ($) Shanghai Pharmaceuticals Holding Co. Ltd., Class A 141,300 377,407 Sinopharm Group Co. Ltd., Class H 122,800 378,876
1,155,251 Hotels, Restaurants & Leisure - 1.3% Jollibee Foods Corp. 115,035 383,638
Household Durables - 2.9% Haier Electronics Group Co. Ltd. 139,345 398,639 Zhejiang Supor Co. Ltd., Class A 41,900 440,280
838,919 Household Products - 2.7% Hindustan Unilever Ltd. 13,471 405,945 Unilever Indonesia Tbk. PT 776,808 369,522
775,467 Industrial Conglomerates - 3.9% Alfa SAB de CV, Class A 619,539 395,651 Ayala Corp. 28,331 368,206 SK Holdings Co. Ltd. 2,239 353,963
1,117,820 Insurance - 2.6% Ping An Insurance Group Co. of China Ltd., Class H 36,106 401,358 Sanlam Ltd. 85,423 355,819
757,177 Interactive Media & Services - 1.4% Tencent Holdings Ltd. 8,005 396,399
Internet & Direct Marketing Retail - 1.2% Naspers Ltd., Class N 2,330 355,615
IT Services - 2.7% Infosys Ltd., ADR 38,616 388,863 Tata Consultancy Services Ltd. 13,585 376,514
765,377 Media - 1.4% China South Publishing & Media Group Co. Ltd., Class A 242,000 389,139
Oil, Gas & Consumable Fuels - 3.4% LUKOIL PJSC, ADR 4,204 362,973 Reliance Industries Ltd. 20,513 377,658 Rosneft Oil Co. PJSC, GDR(a) 38,778 234,607
975,238 Personal Products - 2.7% Godrej Consumer Products Ltd. 48,491 376,613 Marico Ltd. 100,419 415,702
792,315 Pharmaceuticals - 2.7% China Medical System Holdings Ltd. 303,684 374,005 Yunnan Baiyao Group Co. Ltd., Class A 35,600 400,767
774,772 Real Estate Management & Development - 11.1% Aldar Properties PJSC 694,330 400,773 Ayala Land, Inc. 518,359 396,587 China Fortune Land Development Co. Ltd., Class A 119,332 402,724 China Overseas Land & Investment Ltd. 116,493 390,801 China Resources Land Ltd. 92,437 426,313 China Vanke Co. Ltd., Class H 107,488 413,680

MSCI Emerging Markets Dividend Growers ETF Schedule of Portfolio Investments February 29, 2020 (Unaudited)
Investments Shares Value ($) Longfor Group Holdings Ltd.(a) 88,077 407,335 Shanghai Lujiazui Finance & Trade Zone Development Co. Ltd., Class B 475,305 376,442
3,214,655 Specialty Retail - 2.7% China International Travel Service Corp. Ltd., Class A 36,700 412,153 Foschini Group Ltd. (The) 45,635 364,875
777,028 Textiles, Apparel & Luxury Goods - 1.4% Page Industries Ltd. 1,321 405,377
Thrifts & Mortgage Finance - 2.6% Housing Development Finance Corp. Ltd. 12,981 391,359 LIC Housing Finance Ltd. 82,705 367,011
758,370 Tobacco - 1.4% ITC Ltd. 147,661 404,204
Transportation Infrastructure - 3.7% Grupo Aeroportuario del Pacifico SAB de CV, Class B 32,583 353,690 Grupo Aeroportuario del Sureste SAB de CV, Class B 21,447 354,007 International Container Terminal Services, Inc. 178,132 370,417
1,078,114 Water Utilities - 1.4% Guangdong Investment Ltd. 207,601 389,901
Wireless Telecommunication Services - 1.3% America Movil SAB de CV, Series L 473,082 373,024
TOTAL COMMON STOCKS (Cost $30,122,885) 28,844,786
Investments Principal
Amount ($) Value ($) SHORT-TERM INVESTMENTS - 0.3% REPURCHASE AGREEMENTS(b) - 0.3% Repurchase Agreements with various
counterparties, rates 1.58% - 1.59%, dated 2/28/2020, due 3/2/2020, total to be received $79,464
(Cost $79,453) 79,453 79,453 Total Investments - 100.3%
(Cost $30,202,338) 28,924,239 Liabilities in excess of other assets - (0.3%) (79,052) Net Assets - 100.0% 28,845,187
(a) Security exempt from registration pursuant to Regulation S under the Securities Act of 1933. Regulation S applies to securities offerings that are made outside of the United States and do not involve direct selling efforts in the United States and as such may have restrictions on resale.
(b) The Fund invests in Repurchase Agreements jointly with other funds in the Trust. See "Repurchase Agreements" in the Notes to Schedules of Portfolio of Investments to view the details of each individual agreement and counterparty as well as a description of the securities subject to repurchase.
Abbreviations ADR American Depositary Receipt GDR Global Depositary Receipt PJSC Public Joint Stock Company
.

MSCI Emerging Markets Dividend Growers ETF Schedule of Portfolio Investments February 29, 2020 (Unaudited)
MSCI Emerging Markets Dividend Growers ETF invested, as a percentage of net assets, in the following countries as of February 29, 2020: China 30.6% India 20.4% South Africa 15.0% Mexico 6.4% Philippines 5.3% Indonesia 5.2% Malaysia 2.8% South Korea 2.6% Colombia 2.5% Russia 2.1% Taiwan 1.6% Turkey 1.4% United Arab Emirates 1.4% Thailand 1.4% Brazil 1.3% Other 1 0.0%*
100.0%
1 Includes any non-equity securities and net other assets (liabilities). * Amount represents less than 0.05%.
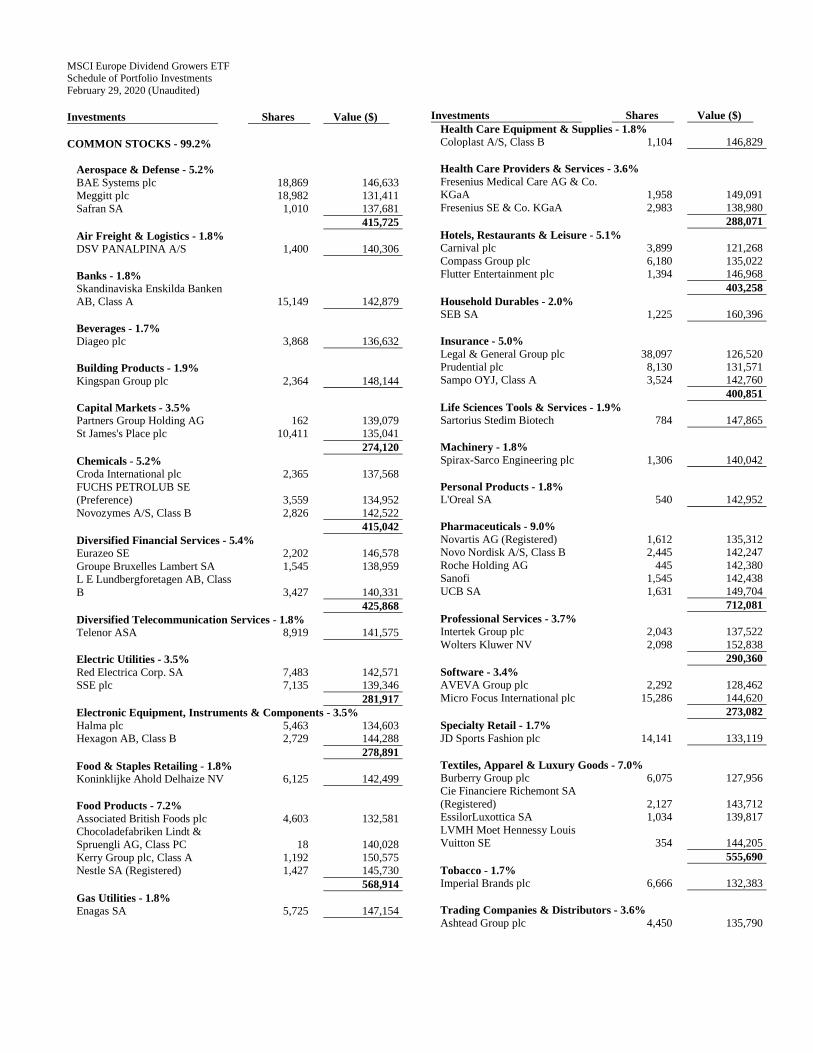
MSCI Europe Dividend Growers ETF Schedule of Portfolio Investments February 29, 2020 (Unaudited)
Investments Shares Value ($) COMMON STOCKS - 99.2%
Aerospace & Defense - 5.2% BAE Systems plc 18,869 146,633 Meggitt plc 18,982 131,411 Safran SA 1,010 137,681
415,725 Air Freight & Logistics - 1.8% DSV PANALPINA A/S 1,400 140,306
Banks - 1.8% Skandinaviska Enskilda Banken AB, Class A 15,149 142,879
Beverages - 1.7% Diageo plc 3,868 136,632
Building Products - 1.9% Kingspan Group plc 2,364 148,144
Capital Markets - 3.5% Partners Group Holding AG 162 139,079 St James's Place plc 10,411 135,041
274,120 Chemicals - 5.2% Croda International plc 2,365 137,568 FUCHS PETROLUB SE (Preference) 3,559 134,952 Novozymes A/S, Class B 2,826 142,522
415,042 Diversified Financial Services - 5.4% Eurazeo SE 2,202 146,578 Groupe Bruxelles Lambert SA 1,545 138,959 L E Lundbergforetagen AB, Class B 3,427 140,331
425,868 Diversified Telecommunication Services - 1.8% Telenor ASA 8,919 141,575
Electric Utilities - 3.5% Red Electrica Corp. SA 7,483 142,571 SSE plc 7,135 139,346
281,917 Electronic Equipment, Instruments & Components - 3.5% Halma plc 5,463 134,603 Hexagon AB, Class B 2,729 144,288
278,891 Food & Staples Retailing - 1.8% Koninklijke Ahold Delhaize NV 6,125 142,499
Food Products - 7.2% Associated British Foods plc 4,603 132,581 Chocoladefabriken Lindt & Spruengli AG, Class PC 18 140,028 Kerry Group plc, Class A 1,192 150,575 Nestle SA (Registered) 1,427 145,730
568,914 Gas Utilities - 1.8% Enagas SA 5,725 147,154
Investments Shares Value ($) Health Care Equipment & Supplies - 1.8% Coloplast A/S, Class B 1,104 146,829
Health Care Providers & Services - 3.6% Fresenius Medical Care AG & Co. KGaA 1,958 149,091 Fresenius SE & Co. KGaA 2,983 138,980
288,071 Hotels, Restaurants & Leisure - 5.1% Carnival plc 3,899 121,268 Compass Group plc 6,180 135,022 Flutter Entertainment plc 1,394 146,968
403,258 Household Durables - 2.0% SEB SA 1,225 160,396
Insurance - 5.0% Legal & General Group plc 38,097 126,520 Prudential plc 8,130 131,571 Sampo OYJ, Class A 3,524 142,760
400,851 Life Sciences Tools & Services - 1.9% Sartorius Stedim Biotech 784 147,865
Machinery - 1.8% Spirax-Sarco Engineering plc 1,306 140,042
Personal Products - 1.8% L'Oreal SA 540 142,952
Pharmaceuticals - 9.0% Novartis AG (Registered) 1,612 135,312 Novo Nordisk A/S, Class B 2,445 142,247 Roche Holding AG 445 142,380 Sanofi 1,545 142,438 UCB SA 1,631 149,704
712,081 Professional Services - 3.7% Intertek Group plc 2,043 137,522 Wolters Kluwer NV 2,098 152,838
290,360 Software - 3.4% AVEVA Group plc 2,292 128,462 Micro Focus International plc 15,286 144,620
273,082 Specialty Retail - 1.7% JD Sports Fashion plc 14,141 133,119
Textiles, Apparel & Luxury Goods - 7.0% Burberry Group plc 6,075 127,956 Cie Financiere Richemont SA (Registered) 2,127 143,712 EssilorLuxottica SA 1,034 139,817 LVMH Moet Hennessy Louis Vuitton SE 354 144,205
555,690 Tobacco - 1.7% Imperial Brands plc 6,666 132,383
Trading Companies & Distributors - 3.6% Ashtead Group plc 4,450 135,790

MSCI Europe Dividend Growers ETF Schedule of Portfolio Investments February 29, 2020 (Unaudited)
Investments Shares Value ($) Bunzl plc 6,288 150,192
285,982 TOTAL COMMON STOCKS (Cost $7,826,492) 7,872,627
Investments Principal
Amount ($) Value ($) SHORT-TERM INVESTMENTS - 0.3% REPURCHASE AGREEMENTS(a) - 0.3% Repurchase Agreements with various
counterparties, rates 1.58% - 1.59%, dated 2/28/2020, due 3/2/2020, total to be received $23,631
(Cost $23,628) 23,628 23,628 Total Investments - 99.5%
(Cost $7,850,120) 7,896,255 Other Assets Less Liabilities - 0.5% 37,600 Net Assets - 100.0% 7,933,855
(a) The Fund invests in Repurchase Agreements jointly with other funds in the Trust. See "Repurchase Agreements" in the Notes to Schedules of Portfolio of Investments to view the details of each individual agreement and counterparty as well as a description of the securities subject to repurchase.
Abbreviations OYJ Public Limited Company Preference A special type of equity investment that shares in
the earnings of the company, has limited voting rights, and may have a dividend preference. Preference shares may also have liquidation preference.
Mi

MSCI Europe Dividend Growers ETF Schedule of Portfolio Investments February 29, 2020 (Unaudited)
MSCI Europe Dividend Growers ETF invested, as a percentage of net assets, in the following countries as of February 29, 2020: United Kingdom 35.8% France 14.6% Switzerland 10.7% Denmark 7.2% Ireland 5.6% Sweden 5.4% Germany 5.3% Netherlands 3.7% Belgium 3.6% Spain 3.7% Finland 1.8% Norway 1.8% Other 1 0.8% 100.0%
1 Includes any non-equity securities and net other assets (liabilities).

Online Retail ETF Schedule of Portfolio Investments February 29, 2020 (Unaudited)
Investments Shares Value ($) COMMON STOCKS - 99.8%
Internet & Direct Marketing Retail - 99.8% 1-800-Flowers.com, Inc., Class A* 42,113 759,719 Alibaba Group Holding Ltd., ADR* 15,958 3,319,264 Amazon.com, Inc.* 3,171 5,973,372 Baozun, Inc., ADR* 6,270 198,884 Chewy, Inc., Class A* 39,793 1,177,873 eBay, Inc. 32,181 1,114,750 Etsy, Inc.* 23,501 1,358,593 Farfetch Ltd., Class A* 30,354 339,054 Fiverr International Ltd.* 3,661 115,248 Groupon, Inc.* 666,447 893,039 Grubhub, Inc.* 22,572 1,085,939 JD.com, Inc., ADR* 15,828 609,536 Jumia Technologies AG, ADR* 9,261 38,063 MercadoLibre, Inc.* 977 601,861 Pinduoduo, Inc., ADR* 18,758 671,161 Quotient Technology, Inc.* 104,816 938,103 Qurate Retail, Inc., Series A* 137,252 936,059 Shutterstock, Inc.* 28,449 1,096,424 Stamps.com, Inc.* 7,918 1,117,309 Stitch Fix, Inc., Class A*(a) 45,169 1,085,411 Uxin Ltd., ADR* 33,065 55,219 Vipshop Holdings Ltd., ADR* 48,407 621,062 Wayfair, Inc., Class A* 16,378 1,035,253 Yunji, Inc., ADR* 14,272 59,229
TOTAL COMMON STOCKS (Cost $25,659,703) 25,200,425 SECURITIES LENDING REINVESTMENTS(b) - 4.5% INVESTMENT COMPANIES - 4.5%
BlackRock Liquidity FedFund, Institutional Class 1.49% (Cost $1,143,415) 1,143,415 1,143,415
Investments Principal
Amount ($) Value ($) SHORT-TERM INVESTMENTS - 0.2% REPURCHASE AGREEMENTS(c) - 0.2% Repurchase Agreements with various
counterparties, rates 1.58% - 1.59%, dated 2/28/2020, due 3/2/2020, total to be received $52,942
(Cost $52,936) 52,936 52,936 Total Investments - 104.5%
(Cost $26,856,054) 26,396,776 Liabilities in excess of other assets - (4.5%) (1,138,894) Net Assets - 100.0% 25,257,882
* Non-income producing security.

Online Retail ETF Schedule of Portfolio Investments February 29, 2020 (Unaudited)
(a) The security or a portion of this security is on loan at February 29, 2020. The total value of securities on loan at February 29, 2020 was $1,085,411, collateralized in the form of cash with a value of $1,143,415 that was reinvested in the securities shown in the Securities Lending Reinvestment section of the Schedule of Investments.
(b) The security was purchased with cash collateral held from securities on loan at February 29, 2020. The total value of securities purchased was $1,143,415.
(c) The Fund invests in Repurchase Agreements jointly with other funds in the Trust. See "Repurchase Agreements" in the Notes to Schedules of Portfolio of Investments to view the details of each individual agreement and counterparty as well as a description of the securities subject to repurchase.
Abbreviations ADR American Depositary Receipt

Pet Care ETF Schedule of Portfolio Investments February 29, 2020 (Unaudited)
Investments Shares Value ($) COMMON STOCKS - 99.9%
Biotechnology - 2.2% Kindred Biosciences, Inc.* 102,708 1,116,436
Distributors - 0.0%(a) Arata Corp. 360 13,785
Food Products - 15.1% Freshpet, Inc.* 76,527 5,085,984 JM Smucker Co. (The) 3,028 311,854 Nestle SA (Registered) 22,747 2,330,577
7,728,415 Health Care Equipment & Supplies - 13.2% Heska Corp.* 19,610 1,872,167 IDEXX Laboratories, Inc.* 19,184 4,882,520
6,754,687 Health Care Providers & Services - 12.6% Covetrus, Inc.* 196,348 2,181,426 CVS Group plc 160,292 2,190,826 Patterson Cos., Inc. 2,397 57,025 PetIQ, Inc.* 64,195 1,996,464
6,425,741 Household Products - 7.4% Central Garden & Pet Co., Class A* 86,638 2,192,808 Colgate-Palmolive Co. 23,353 1,577,962
3,770,770 Insurance - 4.8% Trupanion, Inc.* 79,321 2,438,328
Internet & Direct Marketing Retail - 12.6% Chewy, Inc., Class A* 111,418 3,297,973 PetMed Express, Inc. 53,902 1,423,013 zooplus AG* 16,980 1,685,182
6,406,168 Pharmaceuticals - 23.8% Dechra Pharmaceuticals plc 150,305 5,099,200 Elanco Animal Health, Inc.* 10,866 297,728 Merck & Co., Inc. 30,162 2,309,203 RaQualia Pharma, Inc.* 50,453 470,102 Virbac SA* 9,972 2,262,265 Zoetis, Inc. 13,020 1,734,655
12,173,153 Specialty Retail - 8.2% Pets at Home Group plc 1,173,815 3,873,888 Tractor Supply Co. 3,217 284,736
4,158,624 TOTAL COMMON STOCKS (Cost $46,387,828) 50,986,107
Investments Principal
Amount ($) Value ($) SHORT-TERM INVESTMENTS - 0.1% REPURCHASE AGREEMENTS(b) - 0.1% Repurchase Agreements with various
counterparties, rates 1.58% - 1.59%, dated 2/28/2020, due 3/2/2020, total to be received $75,718
(Cost $75,707) 75,707 75,707 Total Investments - 100.0%
(Cost $46,463,535) 51,061,814 Liabilities in excess of other assets - 0.0%(a) (955) Net Assets - 100.0% 51,060,859
* Non-income producing security. (a) Represents less than 0.05% of net assets. (b) The Fund invests in Repurchase Agreements jointly with other
funds in the Trust. See "Repurchase Agreements" in the Notes to Schedules of Portfolio of Investments to view the details of each individual agreement and counterparty as well as a description of the securities subject to repurchase.

Pet Care ETF Schedule of Portfolio Investments February 29, 2020 (Unaudited)
Pet Care ETF invested, as a percentage of net assets, in the following countries as of February 29, 2020: United States 64.8% United Kingdom 21.9% Switzerland 4.6% France 4.4% Germany 3.3% Japan 0.9% Other 1 0.1% 100.0%
1 Includes any non-equity securities and net other assets (liabilities).

RAFITM Long/Short Schedule of Portfolio Investments February 29, 2020 (Unaudited)
Investments Shares Value ($) COMMON STOCKS(a) - 85.1%
Aerospace & Defense - 1.8% Arconic, Inc. 156 4,579 Boeing Co. (The) 48 13,205 Curtiss-Wright Corp. 9 1,079 General Dynamics Corp. 50 7,985 Hexcel Corp. 8 517 Huntington Ingalls Industries, Inc. 6 1,233 L3Harris Technologies, Inc. 32 6,327 Lockheed Martin Corp. 37 13,685 Moog, Inc., Class A 6 463 Northrop Grumman Corp. 21 6,906 Raytheon Co. 48 9,051 Spirit AeroSystems Holdings, Inc., Class A 13 687 Teledyne Technologies, Inc.* 6 2,024 Textron, Inc. 53 2,152 TransDigm Group, Inc. 6 3,347 United Technologies Corp. 160 20,894
94,134 Air Freight & Logistics - 0.5% CH Robinson Worldwide, Inc. 29 1,998 Expeditors International of Washington, Inc. 21 1,479 FedEx Corp. 62 8,753 Hub Group, Inc., Class A* 15 693 United Parcel Service, Inc., Class B 135 12,216 XPO Logistics, Inc.* 38 2,811
27,950 Airlines - 0.1% American Airlines Group, Inc. 56 1,067 Delta Air Lines, Inc. 53 2,445 JetBlue Airways Corp.* 31 489 Southwest Airlines Co. 25 1,155 United Airlines Holdings, Inc.* 30 1,847
7,003 Auto Components - 0.4% Adient plc* 136 3,255 American Axle & Manufacturing Holdings, Inc.* 73 462 Aptiv plc 43 3,359 Autoliv, Inc. 23 1,535 BorgWarner, Inc. 53 1,675 Cooper Tire & Rubber Co. 19 484 Cooper-Standard Holdings, Inc.* 10 173 Dana, Inc. 59 848 Delphi Technologies plc* 52 734 Garrett Motion, Inc.* 38 264 Gentex Corp. 46 1,228 Goodyear Tire & Rubber Co. (The) 189 1,830 Lear Corp. 20 2,224 Tenneco, Inc., Class A 17 156 Visteon Corp.* 21 1,366
19,593 Automobiles - 1.1% Ford Motor Co. 3,953 27,513 General Motors Co. 777 23,699 Harley-Davidson, Inc. 62 1,889 Tesla, Inc.* 6 4,008 Thor Industries, Inc. 15 1,131
58,240
Investments Shares Value ($) Banks - 6.8% Associated Banc-Corp. 34 576 Bank of America Corp. 2,219 63,241 Bank of Hawaii Corp. 6 446 Bank OZK 21 533 BankUnited, Inc. 26 772 CIT Group, Inc. 42 1,668 Citigroup, Inc. 816 51,783 Citizens Financial Group, Inc. 148 4,690 Comerica, Inc. 27 1,421 Commerce Bancshares, Inc. 14 855 Cullen/Frost Bankers, Inc. 9 705 East West Bancorp, Inc. 21 814 Fifth Third Bancorp 228 5,563 First Hawaiian, Inc. 18 431 First Horizon National Corp. 58 773 First Republic Bank 19 1,911 FNB Corp. 85 858 Fulton Financial Corp. 37 535 Hancock Whitney Corp. 19 636 Huntington Bancshares, Inc. 219 2,687 IBERIABANK Corp. 10 602 Investors Bancorp, Inc. 51 537 JPMorgan Chase & Co. 779 90,450 KeyCorp 233 3,810 M&T Bank Corp. 28 3,931 PacWest Bancorp 32 1,012 People's United Financial, Inc. 97 1,357 Pinnacle Financial Partners, Inc. 11 579 PNC Financial Services Group, Inc. (The) 118 14,915 Popular, Inc. 21 1,008 Prosperity Bancshares, Inc. 13 840 Regions Financial Corp. 290 3,921 Signature Bank 8 1,001 Sterling Bancorp 31 514 SVB Financial Group* 9 1,873 Synovus Financial Corp. 19 551 TCF Financial Corp. 31 1,130 Texas Capital Bancshares, Inc.* 11 518 Truist Financial Corp. 322 14,857 UMB Financial Corp. 7 407 Umpqua Holdings Corp. 61 939 United Bankshares, Inc. 19 549 US Bancorp 339 15,743 Webster Financial Corp. 15 570 Wells Fargo & Co. 1,387 56,659 Western Alliance Bancorp 14 645 Wintrust Financial Corp. 9 481 Zions Bancorp NA 34 1,358
361,655 Beverages - 1.4% Brown-Forman Corp., Class B 34 2,088 Coca-Cola Co. (The) 588 31,452 Coca-Cola European Partners plc 32 1,631 Constellation Brands, Inc., Class A 18 3,103 Molson Coors Beverage Co., Class B 55 2,728 Monster Beverage Corp.* 20 1,248 PepsiCo, Inc. 230 30,367
72,617 Biotechnology - 1.3% AbbVie, Inc. 225 19,285 Alexion Pharmaceuticals, Inc.* 20 1,881

RAFITM Long/Short Schedule of Portfolio Investments February 29, 2020 (Unaudited) Investments Shares Value ($)
Amgen, Inc. 97 19,374 Biogen, Inc.* 19 5,859 BioMarin Pharmaceutical, Inc.* 9 813 Gilead Sciences, Inc. 243 16,854 Regeneron Pharmaceuticals, Inc.* 7 3,112 United Therapeutics Corp.* 8 824
68,002 Building Products - 0.3% Allegion plc 9 1,035 AO Smith Corp. 14 554 Builders FirstSource, Inc.* 47 1,067 Fortune Brands Home & Security, Inc. 30 1,852 Johnson Controls International plc 218 7,972 Lennox International, Inc. 4 913 Masco Corp. 43 1,777 Owens Corning 33 1,864 Resideo Technologies, Inc.* 47 505
17,539 Capital Markets - 2.3% Affiliated Managers Group, Inc. 11 827 Ameriprise Financial, Inc. 33 4,663 Bank of New York Mellon Corp. (The) 207 8,259 BlackRock, Inc. 20 9,260 Cboe Global Markets, Inc. 9 1,026 Charles Schwab Corp. (The) 102 4,156 CME Group, Inc. 39 7,754 E*TRADE Financial Corp. 40 1,831 Eaton Vance Corp. 19 784 Federated Hermes, Inc., Class B 22 635 Franklin Resources, Inc. 102 2,220 Goldman Sachs Group, Inc. (The) 108 21,683 Intercontinental Exchange, Inc. 58 5,175 Invesco Ltd. 190 2,736 Janus Henderson Group plc 60 1,272 Legg Mason, Inc. 39 1,943 LPL Financial Holdings, Inc. 14 1,113 Moody's Corp. 9 2,160 Morgan Stanley 368 16,571 MSCI, Inc. 6 1,773 Nasdaq, Inc. 16 1,641 Northern Trust Corp. 34 2,984 Raymond James Financial, Inc. 21 1,756 S&P Global, Inc. 15 3,989 SEI Investments Co. 11 602 State Street Corp. 93 6,334 Stifel Financial Corp. 18 980 T. Rowe Price Group, Inc. 41 4,838 TD Ameritrade Holding Corp. 29 1,225 Waddell & Reed Financial, Inc., Class A 46 633
120,823 Chemicals - 1.7% Air Products & Chemicals, Inc. 31 6,808 Albemarle Corp. 19 1,555 Ashland Global Holdings, Inc. 13 930 Axalta Coating Systems Ltd.* 39 972 Cabot Corp. 18 673 Celanese Corp. 20 1,875 CF Industries Holdings, Inc. 62 2,285 Chemours Co. (The) 28 416 Corteva, Inc. 211 5,739
Investments Shares Value ($) Dow, Inc. 213 8,607 DuPont de Nemours, Inc. 213 9,138 Eastman Chemical Co. 42 2,584 Ecolab, Inc. 26 4,692 Element Solutions, Inc.* 74 769 FMC Corp. 12 1,117 Huntsman Corp. 83 1,572 International Flavors & Fragrances, Inc.(b) 9 1,078 Linde plc 93 17,764 LyondellBasell Industries NV, Class A 120 8,575 Mosaic Co. (The) 112 1,907 Olin Corp. 44 712 PolyOne Corp. 18 446 PPG Industries, Inc. 42 4,387 RPM International, Inc. 23 1,475 Scotts Miracle-Gro Co. (The) 8 848 Sherwin-Williams Co. (The) 8 4,134 Trinseo SA 16 350 Westlake Chemical Corp. 6 335
91,743 Commercial Services & Supplies - 0.3% ABM Industries, Inc. 21 691 Cintas Corp. 6 1,600 Clean Harbors, Inc.* 15 1,043 Covanta Holding Corp. 38 508 Deluxe Corp. 13 433 IAA, Inc.* 21 897 KAR Auction Services, Inc. 20 385 Pitney Bowes, Inc. 175 599 Republic Services, Inc. 38 3,430 Stericycle, Inc.* 21 1,206 Waste Management, Inc. 62 6,870
17,662 Communications Equipment - 0.6% Ciena Corp.* 19 730 Cisco Systems, Inc. 683 27,272 CommScope Holding Co., Inc.* 56 617 EchoStar Corp., Class A* 17 594 F5 Networks, Inc.* 8 960 Juniper Networks, Inc. 63 1,337 Motorola Solutions, Inc. 15 2,485 ViaSat, Inc.* 7 402
34,397 Construction & Engineering - 0.3% AECOM* 96 4,314 Arcosa, Inc. 21 902 Dycom Industries, Inc.* 8 236 EMCOR Group, Inc. 17 1,308 Fluor Corp. 88 820 Jacobs Engineering Group, Inc. 34 3,140 MasTec, Inc.* 20 982 Quanta Services, Inc. 56 2,135 Tutor Perini Corp.* 44 638 Valmont Industries, Inc. 8 930
15,405 Construction Materials - 0.1% Martin Marietta Materials, Inc. 7 1,593 Vulcan Materials Co. 15 1,804
3,397 Consumer Finance - 1.0% Ally Financial, Inc. 199 4,989

RAFITM Long/Short Schedule of Portfolio Investments February 29, 2020 (Unaudited) Investments Shares Value ($)
American Express Co. 110 12,093 Capital One Financial Corp. 220 19,417 Discover Financial Services 92 6,034 Navient Corp. 236 2,650 OneMain Holdings, Inc. 31 1,139 Santander Consumer USA Holdings, Inc. 48 1,171 SLM Corp. 71 736 Synchrony Financial 240 6,984
55,213 Containers & Packaging - 0.5% AptarGroup, Inc. 7 708 Avery Dennison Corp. 15 1,717 Ball Corp. 41 2,889 Berry Global Group, Inc.* 30 1,139 Crown Holdings, Inc.* 36 2,538 Graphic Packaging Holding Co. 81 1,095 International Paper Co. 140 5,174 O-I Glass, Inc. 88 950 Packaging Corp. of America 23 2,084 Sealed Air Corp. 36 1,091 Silgan Holdings, Inc. 19 544 Sonoco Products Co. 22 1,061 Westrock Co. 100 3,325
24,315 Distributors - 0.1% Core-Mark Holding Co., Inc. 37 851 Genuine Parts Co. 35 3,054 LKQ Corp.* 85 2,514
6,419 Diversified Consumer Services - 0.1% Graham Holdings Co., Class B 2 1,006 H&R Block, Inc. 61 1,261 Service Corp. International 22 1,051 ServiceMaster Global Holdings, Inc.* 15 537
3,855 Diversified Financial Services - 1.3% Berkshire Hathaway, Inc., Class B* 299 61,696 Equitable Holdings, Inc. 97 2,076 Jefferies Financial Group, Inc. 122 2,404 Voya Financial, Inc. 64 3,369
69,545 Diversified Telecommunication Services - 3.4% AT&T, Inc. 2,962 104,322 CenturyLink, Inc. 779 9,402 Frontier Communications Corp.*(b) 308 166 Verizon Communications, Inc. 1,248 67,592 Zayo Group Holdings, Inc.* 35 1,225
182,707 Electric Utilities - 2.8% ALLETE, Inc. 11 759 Alliant Energy Corp. 50 2,606 American Electric Power Co., Inc. 124 11,068 Avangrid, Inc. 13 646 Duke Energy Corp. 224 20,541 Edison International 105 7,055 Entergy Corp. 64 7,482 Evergy, Inc. 11 719 Eversource Energy 76 6,571 Exelon Corp. 309 13,321 FirstEnergy Corp. 105 4,676 Hawaiian Electric Industries, Inc. 33 1,414
Investments Shares Value ($) IDACORP, Inc. 9 870 NextEra Energy, Inc. 76 19,210 OGE Energy Corp. 43 1,638 PG&E Corp.* 797 12,353 Pinnacle West Capital Corp. 29 2,595 PNM Resources, Inc. 20 942 Portland General Electric Co. 21 1,143 PPL Corp. 232 6,962 Southern Co. (The) 300 18,108 Xcel Energy, Inc. 120 7,478
148,157 Electrical Equipment - 0.5% Acuity Brands, Inc. 9 926 AMETEK, Inc. 20 1,720 Eaton Corp. plc 114 10,342 Emerson Electric Co. 127 8,142 EnerSys 7 431 Hubbell, Inc. 10 1,332 nVent Electric plc 36 864 Regal Beloit Corp. 11 854 Rockwell Automation, Inc. 15 2,753 Sensata Technologies Holding plc* 24 979
28,343 Electronic Equipment, Instruments & Components - 0.8% Amphenol Corp., Class A 26 2,384 Anixter International, Inc.* 16 1,560 Arrow Electronics, Inc.* 55 3,688 Avnet, Inc. 75 2,301 Belden, Inc. 10 399 Benchmark Electronics, Inc. 20 544 CDW Corp. 20 2,284 Corning, Inc. 159 3,794 Flex Ltd.* 442 4,911 FLIR Systems, Inc. 15 637 Insight Enterprises, Inc.* 19 1,047 Jabil, Inc. 94 3,013 Keysight Technologies, Inc.* 15 1,421 Plexus Corp.* 10 664 Sanmina Corp.* 38 999 SYNNEX Corp. 15 1,875 TE Connectivity Ltd. 62 5,138 Tech Data Corp.* 42 5,980 Trimble, Inc.* 25 987 Vishay Intertechnology, Inc. 24 449 Zebra Technologies Corp., Class A* 6 1,266
45,341 Energy Equipment & Services - 0.6% Baker Hughes Co. 335 5,390 Diamond Offshore Drilling, Inc.*(b) 74 226 Halliburton Co. 198 3,358 Helmerich & Payne, Inc. 34 1,254 Nabors Industries Ltd. 413 727 National Oilwell Varco, Inc. 171 3,199 Noble Corp. plc* 610 428 Oceaneering International, Inc.* 59 622 Patterson-UTI Energy, Inc. 76 436 Schlumberger Ltd. 435 11,784 Transocean Ltd.* 372 1,246 Valaris plc 189 697
29,367

RAFITM Long/Short Schedule of Portfolio Investments February 29, 2020 (Unaudited) Investments Shares Value ($)
Entertainment - 0.8% Activision Blizzard, Inc. 75 4,360 Cinemark Holdings, Inc. 27 701 Electronic Arts, Inc.* 23 2,331 Liberty Media Corp.-Liberty Formula One, Class A* 6 225 Liberty Media Corp.-Liberty Formula One, Class C* 36 1,406 Lions Gate Entertainment Corp., Class A* 9 72 Lions Gate Entertainment Corp., Class B* 22 163 Live Nation Entertainment, Inc.* 20 1,215 Netflix, Inc.* 8 2,952 Take-Two Interactive Software, Inc.* 6 645 Walt Disney Co. (The) 251 29,530
43,600 Equity Real Estate Investment Trusts (REITs) - 2.7% Alexandria Real Estate Equities, Inc. 14 2,126 American Campus Communities, Inc. 28 1,216 American Homes 4 Rent, Class A 31 803 American Tower Corp. 28 6,350 Apartment Investment & Management Co., Class A 18 861 Apple Hospitality REIT, Inc. 74 967 AvalonBay Communities, Inc. 21 4,212 Boston Properties, Inc. 28 3,610 Brandywine Realty Trust 45 611 Brixmor Property Group, Inc. 85 1,548 Brookfield Property REIT, Inc., Class A 29 473 Camden Property Trust 15 1,590 CBL & Associates Properties, Inc.(b) 421 223 Colony Capital, Inc. 244 966 Columbia Property Trust, Inc. 37 698 CoreCivic, Inc. 74 1,096 Corporate Office Properties Trust 23 583 Cousins Properties, Inc. 15 535 Crown Castle International Corp. 47 6,735 CubeSmart 22 666 CyrusOne, Inc. 10 606 DiamondRock Hospitality Co. 61 556 Digital Realty Trust, Inc.(b) 30 3,603 Diversified Healthcare Trust 109 686 Douglas Emmett, Inc. 21 802 Duke Realty Corp. 53 1,721 EPR Properties 11 652 Equinix, Inc. 6 3,437 Equity Commonwealth 20 629 Equity LifeStyle Properties, Inc. 15 1,025 Equity Residential 62 4,656 Essex Property Trust, Inc. 7 1,984 Extra Space Storage, Inc. 12 1,204 Federal Realty Investment Trust 8 931 Gaming and Leisure Properties, Inc. 29 1,295 GEO Group, Inc. (The) 45 659 Healthcare Realty Trust, Inc. 18 617 Healthcare Trust of America, Inc., Class A 34 1,059 Healthpeak Properties, Inc. 97 3,069
Investments Shares Value ($) Highwoods Properties, Inc. 19 853 Host Hotels & Resorts, Inc. 200 2,896 Hudson Pacific Properties, Inc. 23 742 Invitation Homes, Inc. 37 1,062 Iron Mountain, Inc. 77 2,342 Kilroy Realty Corp. 15 1,090 Kimco Realty Corp. 102 1,770 Lamar Advertising Co., Class A 15 1,256 Lexington Realty Trust 59 612 Life Storage, Inc. 6 647 Macerich Co. (The)(b) 38 776 Mack-Cali Realty Corp. 24 456 Medical Properties Trust, Inc. 55 1,162 Mid-America Apartment Communities, Inc. 21 2,714 National Retail Properties, Inc. 21 1,068 Omega Healthcare Investors, Inc. 34 1,346 Outfront Media, Inc. 58 1,528 Paramount Group, Inc. 56 680 Park Hotels & Resorts, Inc. 50 913 Piedmont Office Realty Trust, Inc., Class A 37 799 Prologis, Inc. 85 7,164 Public Storage 15 3,137 Rayonier, Inc. 32 849 Realty Income Corp. 33 2,389 Regency Centers Corp. 21 1,206 Retail Properties of America, Inc., Class A 61 639 RLJ Lodging Trust 58 766 Ryman Hospitality Properties, Inc. 6 417 Sabra Health Care REIT, Inc. 33 645 SBA Communications Corp. 7 1,856 Service Properties Trust 62 1,121 Simon Property Group, Inc. 36 4,431 SITE Centers Corp. 67 771 SL Green Realty Corp. 21 1,647 Spirit Realty Capital, Inc. 25 1,138 STORE Capital Corp. 19 624 Sun Communities, Inc. 7 1,070 Sunstone Hotel Investors, Inc. 65 712 Taubman Centers, Inc. 15 781 UDR, Inc. 34 1,529 Uniti Group, Inc. 46 449 Ventas, Inc. 78 4,194 VEREIT, Inc. 289 2,503 VICI Properties, Inc. 38 952 Vornado Realty Trust 32 1,715 Washington Prime Group, Inc.(b) 156 429 Weingarten Realty Investors 25 673 Welltower, Inc. 82 6,135 Weyerhaeuser Co. 178 4,624 WP Carey, Inc. 21 1,626 Xenia Hotels & Resorts, Inc. 37 554
146,518 Food & Staples Retailing - 2.3% BJ's Wholesale Club Holdings, Inc.* 60 1,156 Casey's General Stores, Inc. 8 1,304 Costco Wholesale Corp. 103 28,957 Kroger Co. (The) 521 14,656 Performance Food Group Co.* 46 1,950 Rite Aid Corp.*(b) 101 1,376 Sprouts Farmers Market, Inc.* 28 447
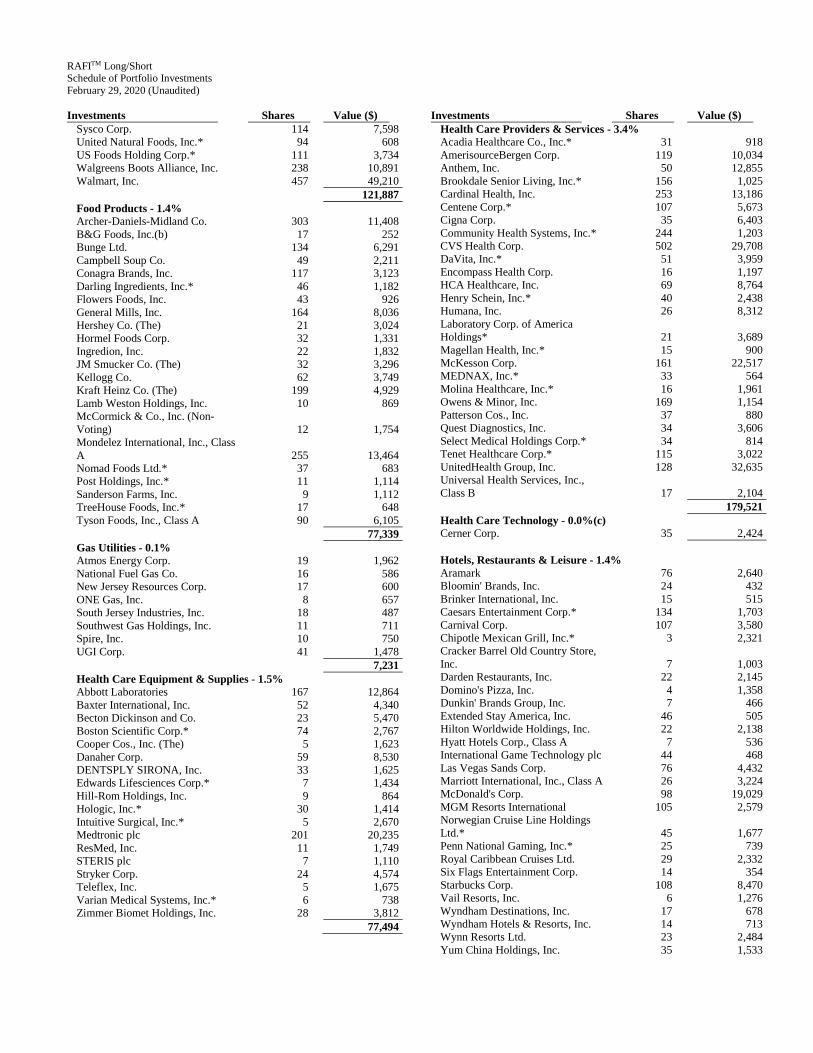
RAFITM Long/Short Schedule of Portfolio Investments February 29, 2020 (Unaudited) Investments Shares Value ($)
Sysco Corp. 114 7,598 United Natural Foods, Inc.* 94 608 US Foods Holding Corp.* 111 3,734 Walgreens Boots Alliance, Inc. 238 10,891 Walmart, Inc. 457 49,210
121,887 Food Products - 1.4% Archer-Daniels-Midland Co. 303 11,408 B&G Foods, Inc.(b) 17 252 Bunge Ltd. 134 6,291 Campbell Soup Co. 49 2,211 Conagra Brands, Inc. 117 3,123 Darling Ingredients, Inc.* 46 1,182 Flowers Foods, Inc. 43 926 General Mills, Inc. 164 8,036 Hershey Co. (The) 21 3,024 Hormel Foods Corp. 32 1,331 Ingredion, Inc. 22 1,832 JM Smucker Co. (The) 32 3,296 Kellogg Co. 62 3,749 Kraft Heinz Co. (The) 199 4,929 Lamb Weston Holdings, Inc. 10 869 McCormick & Co., Inc. (Non-Voting) 12 1,754 Mondelez International, Inc., Class A 255 13,464 Nomad Foods Ltd.* 37 683 Post Holdings, Inc.* 11 1,114 Sanderson Farms, Inc. 9 1,112 TreeHouse Foods, Inc.* 17 648 Tyson Foods, Inc., Class A 90 6,105
77,339 Gas Utilities - 0.1% Atmos Energy Corp. 19 1,962 National Fuel Gas Co. 16 586 New Jersey Resources Corp. 17 600 ONE Gas, Inc. 8 657 South Jersey Industries, Inc. 18 487 Southwest Gas Holdings, Inc. 11 711 Spire, Inc. 10 750 UGI Corp. 41 1,478
7,231 Health Care Equipment & Supplies - 1.5% Abbott Laboratories 167 12,864 Baxter International, Inc. 52 4,340 Becton Dickinson and Co. 23 5,470 Boston Scientific Corp.* 74 2,767 Cooper Cos., Inc. (The) 5 1,623 Danaher Corp. 59 8,530 DENTSPLY SIRONA, Inc. 33 1,625 Edwards Lifesciences Corp.* 7 1,434 Hill-Rom Holdings, Inc. 9 864 Hologic, Inc.* 30 1,414 Intuitive Surgical, Inc.* 5 2,670 Medtronic plc 201 20,235 ResMed, Inc. 11 1,749 STERIS plc 7 1,110 Stryker Corp. 24 4,574 Teleflex, Inc. 5 1,675 Varian Medical Systems, Inc.* 6 738 Zimmer Biomet Holdings, Inc. 28 3,812
77,494
Investments Shares Value ($) Health Care Providers & Services - 3.4% Acadia Healthcare Co., Inc.* 31 918 AmerisourceBergen Corp. 119 10,034 Anthem, Inc. 50 12,855 Brookdale Senior Living, Inc.* 156 1,025 Cardinal Health, Inc. 253 13,186 Centene Corp.* 107 5,673 Cigna Corp. 35 6,403 Community Health Systems, Inc.* 244 1,203 CVS Health Corp. 502 29,708 DaVita, Inc.* 51 3,959 Encompass Health Corp. 16 1,197 HCA Healthcare, Inc. 69 8,764 Henry Schein, Inc.* 40 2,438 Humana, Inc. 26 8,312 Laboratory Corp. of America Holdings* 21 3,689 Magellan Health, Inc.* 15 900 McKesson Corp. 161 22,517 MEDNAX, Inc.* 33 564 Molina Healthcare, Inc.* 16 1,961 Owens & Minor, Inc. 169 1,154 Patterson Cos., Inc. 37 880 Quest Diagnostics, Inc. 34 3,606 Select Medical Holdings Corp.* 34 814 Tenet Healthcare Corp.* 115 3,022 UnitedHealth Group, Inc. 128 32,635 Universal Health Services, Inc., Class B 17 2,104
179,521 Health Care Technology - 0.0%(c) Cerner Corp. 35 2,424
Hotels, Restaurants & Leisure - 1.4% Aramark 76 2,640 Bloomin' Brands, Inc. 24 432 Brinker International, Inc. 15 515 Caesars Entertainment Corp.* 134 1,703 Carnival Corp. 107 3,580 Chipotle Mexican Grill, Inc.* 3 2,321 Cracker Barrel Old Country Store, Inc. 7 1,003 Darden Restaurants, Inc. 22 2,145 Domino's Pizza, Inc. 4 1,358 Dunkin' Brands Group, Inc. 7 466 Extended Stay America, Inc. 46 505 Hilton Worldwide Holdings, Inc. 22 2,138 Hyatt Hotels Corp., Class A 7 536 International Game Technology plc 44 468 Las Vegas Sands Corp. 76 4,432 Marriott International, Inc., Class A 26 3,224 McDonald's Corp. 98 19,029 MGM Resorts International 105 2,579 Norwegian Cruise Line Holdings Ltd.* 45 1,677 Penn National Gaming, Inc.* 25 739 Royal Caribbean Cruises Ltd. 29 2,332 Six Flags Entertainment Corp. 14 354 Starbucks Corp. 108 8,470 Vail Resorts, Inc. 6 1,276 Wyndham Destinations, Inc. 17 678 Wyndham Hotels & Resorts, Inc. 14 713 Wynn Resorts Ltd. 23 2,484 Yum China Holdings, Inc. 35 1,533

RAFITM Long/Short Schedule of Portfolio Investments February 29, 2020 (Unaudited) Investments Shares Value ($)
Yum! Brands, Inc. 44 3,927 73,257
Household Durables - 0.6% DR Horton, Inc. 65 3,463 Garmin Ltd. 22 1,945 KB Home 24 782 Leggett & Platt, Inc. 28 1,110 Lennar Corp., Class A 50 3,017 Meritage Homes Corp.* 17 1,079 Mohawk Industries, Inc.* 22 2,665 Newell Brands, Inc. 219 3,379 NVR, Inc.* 1 3,667 PulteGroup, Inc. 69 2,774 Taylor Morrison Home Corp., Class A* 51 1,149 Tempur Sealy International, Inc.* 10 747 Toll Brothers, Inc. 32 1,185 TRI Pointe Group, Inc.* 51 782 Tupperware Brands Corp. 25 71 Whirlpool Corp. 31 3,964
31,779 Household Products - 1.4% Church & Dwight Co., Inc. 23 1,599 Clorox Co. (The) 16 2,551 Colgate-Palmolive Co. 117 7,906 Kimberly-Clark Corp. 65 8,527 Procter & Gamble Co. (The) 446 50,500 Spectrum Brands Holdings, Inc. 21 1,132
72,215 Independent Power and Renewable Electricity Producers - 0.1% AES Corp. 257 4,300 NRG Energy, Inc. 48 1,594 Vistra Energy Corp. 101 1,942
7,836 Industrial Conglomerates - 1.6% 3M Co. 77 11,492 Carlisle Cos., Inc. 9 1,308 General Electric Co. 5,020 54,618 Honeywell International, Inc. 95 15,406 Roper Technologies, Inc. 6 2,110
84,934 Insurance - 3.8% Aflac, Inc. 199 8,527 Alleghany Corp.* 6 4,033 Allstate Corp. (The) 106 11,156 American Equity Investment Life Holding Co. 33 834 American Financial Group, Inc. 21 1,941 American International Group, Inc. 542 22,851 Aon plc 20 4,160 Arch Capital Group Ltd.* 80 3,234 Arthur J Gallagher & Co. 26 2,535 Assurant, Inc. 20 2,412 Assured Guaranty Ltd. 43 1,755 Athene Holding Ltd., Class A* 54 2,227 Axis Capital Holdings Ltd. 29 1,627 Brighthouse Financial, Inc.* 76 2,724 Brown & Brown, Inc. 28 1,204 Chubb Ltd. 105 15,228 Cincinnati Financial Corp. 35 3,263 CNO Financial Group, Inc. 86 1,378 Everest Re Group Ltd. 12 2,975 Fidelity National Financial, Inc. 67 2,597
Investments Shares Value ($) First American Financial Corp. 30 1,713 Genworth Financial, Inc., Class A* 552 2,153 Globe Life, Inc. 22 2,039 Hanover Insurance Group, Inc. (The) 11 1,304 Hartford Financial Services Group, Inc. (The) 136 6,793 Kemper Corp. 7 482 Lincoln National Corp. 81 3,677 Loews Corp. 104 4,746 Markel Corp.* 4 4,726 Marsh & McLennan Cos., Inc. 63 6,587 MetLife, Inc. 393 16,789 Old Republic International Corp. 102 2,011 Primerica, Inc. 9 1,002 Principal Financial Group, Inc. 104 4,617 ProAssurance Corp. 21 570 Progressive Corp. (The) 87 6,365 Prudential Financial, Inc. 198 14,939 Reinsurance Group of America, Inc. 21 2,563 RenaissanceRe Holdings Ltd. 7 1,193 Selective Insurance Group, Inc. 10 558 Travelers Cos., Inc. (The) 103 12,340 Unum Group 89 2,075 White Mountains Insurance Group Ltd. 1 990 Willis Towers Watson plc 20 3,785 WR Berkley Corp. 36 2,417
203,095 Interactive Media & Services - 1.5% Alphabet, Inc., Class A* 20 26,785 Alphabet, Inc., Class C* 20 26,787 Facebook, Inc., Class A* 120 23,096 IAC/InterActiveCorp* 6 1,224 Twitter, Inc.* 33 1,095 Yandex NV, Class A* 18 731
79,718 Internet & Direct Marketing Retail - 0.8% Amazon.com, Inc.* 14 26,372 Booking Holdings, Inc.* 5 8,478 eBay, Inc. 103 3,568 Expedia Group, Inc. 22 2,170 Qurate Retail, Inc., Series A* 156 1,064
41,652 IT Services - 2.5% Accenture plc, Class A 71 12,822 Akamai Technologies, Inc.* 21 1,817 Alliance Data Systems Corp. 8 687 Amdocs Ltd. 26 1,658 Automatic Data Processing, Inc. 34 5,261 Black Knight, Inc.* 14 934 Booz Allen Hamilton Holding Corp. 24 1,711 Broadridge Financial Solutions, Inc. 11 1,148 CACI International, Inc., Class A* 9 2,205 Cognizant Technology Solutions Corp., Class A 54 3,290 Conduent, Inc.* 116 379 CoreLogic, Inc. 16 726 DXC Technology Co. 62 1,495 Euronet Worldwide, Inc.* 7 868

RAFITM Long/Short Schedule of Portfolio Investments February 29, 2020 (Unaudited) Investments Shares Value ($)
Fidelity National Information Services, Inc. 50 6,986 Fiserv, Inc.* 50 5,468 FleetCor Technologies, Inc.* 9 2,392 Gartner, Inc.* 7 906 Global Payments, Inc. 20 3,679 International Business Machines Corp. 260 33,839 Jack Henry & Associates, Inc. 9 1,366 KBR, Inc. 46 1,194 Leidos Holdings, Inc. 36 3,695 Mastercard, Inc., Class A 30 8,708 Paychex, Inc. 35 2,712 PayPal Holdings, Inc.* 60 6,479 Perspecta, Inc. 44 1,099 Sabre Corp. 45 613 Science Applications International Corp. 7 561 Visa, Inc., Class A 86 15,631 Western Union Co. (The) 117 2,620 WEX, Inc.* 6 1,123
134,072 Leisure Products - 0.1% Brunswick Corp. 19 1,011 Hasbro, Inc. 22 1,700 Mattel, Inc.*(b) 182 2,146 Polaris, Inc. 16 1,320
6,177 Life Sciences Tools & Services - 0.4% Agilent Technologies, Inc. 21 1,619 Bio-Rad Laboratories, Inc., Class A* 4 1,408 Charles River Laboratories International, Inc.* 7 1,089 ICON plc* 7 1,093 Illumina, Inc.* 6 1,594 IQVIA Holdings, Inc.* 17 2,371 Mettler-Toledo International, Inc.* 2 1,403 PerkinElmer, Inc. 7 605 Thermo Fisher Scientific, Inc. 32 9,306 Waters Corp.* 7 1,364
21,852 Machinery - 1.5% AGCO Corp. 21 1,269 Allison Transmission Holdings, Inc. 17 690 Caterpillar, Inc. 109 13,542 Colfax Corp.* 37 1,238 Crane Co. 7 476 Cummins, Inc. 34 5,144 Deere & Co. 63 9,858 Donaldson Co., Inc. 17 766 Dover Corp. 22 2,260 Flowserve Corp. 26 1,045 Fortive Corp. 20 1,383 Graco, Inc. 13 641 IDEX Corp. 6 888 Illinois Tool Works, Inc. 45 7,550 Ingersoll-Rand plc 38 4,904 ITT, Inc. 14 842 Kennametal, Inc. 15 417 Lincoln Electric Holdings, Inc. 8 655 Meritor, Inc.* 26 590
Investments Shares Value ($) Middleby Corp. (The)* 9 1,006 Mueller Industries, Inc. 18 504 Navistar International Corp.* 19 690 Nordson Corp. 8 1,163 Oshkosh Corp. 19 1,371 PACCAR, Inc. 91 6,088 Parker-Hannifin Corp. 20 3,695 Pentair plc 33 1,300 Rexnord Corp. 23 671 Snap-on, Inc. 9 1,303 Stanley Black & Decker, Inc. 30 4,311 Terex Corp. 24 528 Timken Co. (The) 18 807 Toro Co. (The) 10 714 Trinity Industries, Inc. 51 1,038 WABCO Holdings, Inc.* 7 946 Westinghouse Air Brake Technologies Corp. 12 824 Xylem, Inc. 20 1,547
82,664 Marine - 0.0%(c) Kirby Corp.* 15 956
Media - 1.7% Altice USA, Inc., Class A* 108 2,793 AMC Networks, Inc., Class A* 8 248 Charter Communications, Inc., Class A* 28 13,809 Comcast Corp., Class A 992 40,107 Discovery, Inc., Class A* 21 540 Discovery, Inc., Class C* 50 1,255 DISH Network Corp., Class A* 74 2,480 Fox Corp., Class A 35 1,076 Fox Corp., Class B 17 518 Interpublic Group of Cos., Inc. (The) 88 1,880 Liberty Broadband Corp., Class A* 4 495 Liberty Broadband Corp., Class C* 11 1,385 Liberty Global plc, Class A* 86 1,679 Liberty Global plc, Class C* 226 4,201 Liberty Latin America Ltd., Class A* 14 212 Liberty Latin America Ltd., Class C* 42 638 Liberty Media Corp.-Liberty SiriusXM, Class A* 23 1,027 Liberty Media Corp.-Liberty SiriusXM, Class C* 47 2,097 Meredith Corp. 7 184 News Corp., Class A 121 1,461 News Corp., Class B 34 423 Nexstar Media Group, Inc., Class A 9 1,035 Omnicom Group, Inc. 61 4,226 Sinclair Broadcast Group, Inc., Class A 18 418 TEGNA, Inc. 61 873 ViacomCBS, Inc. 166 4,085
89,145 Metals & Mining - 0.5% AK Steel Holding Corp.* 358 827 Alcoa Corp.* 91 1,262 Allegheny Technologies, Inc.* 21 359 Carpenter Technology Corp. 12 441

RAFITM Long/Short Schedule of Portfolio Investments February 29, 2020 (Unaudited) Investments Shares Value ($)
Cleveland-Cliffs, Inc.(b) 62 360 Commercial Metals Co. 61 1,114 Compass Minerals International, Inc. 11 600 Constellium SE, Class A* 78 967 Freeport-McMoRan, Inc. 520 5,179 Newmont Corp. 94 4,195 Nucor Corp. 91 3,763 Reliance Steel & Aluminum Co. 26 2,660 Royal Gold, Inc. 9 868 Steel Dynamics, Inc. 49 1,305 United States Steel Corp.(b) 76 610 Warrior Met Coal, Inc. 18 319
24,829 Mortgage Real Estate Investment Trusts (REITs) - 0.3% AGNC Investment Corp. 134 2,283 Annaly Capital Management, Inc. 431 3,818 Blackstone Mortgage Trust, Inc., Class A 22 793 Chimera Investment Corp. 75 1,474 Invesco Mortgage Capital, Inc. 46 740 MFA Financial, Inc. 129 933 New Residential Investment Corp. 105 1,634 PennyMac Mortgage Investment Trust 31 642 Starwood Property Trust, Inc. 77 1,708 Two Harbors Investment Corp. 74 1,003
15,028 Multiline Retail - 0.8% Big Lots, Inc. 24 380 Dollar General Corp. 36 5,411 Dollar Tree, Inc.* 45 3,736 JC Penney Co., Inc.*(b) 1,289 889 Kohl's Corp. 75 2,936 Macy's, Inc. 254 3,360 Nordstrom, Inc. 58 2,013 Target Corp. 225 23,175
41,900 Multi-Utilities - 1.1% Ameren Corp. 57 4,503 Avista Corp. 21 990 Black Hills Corp. 10 722 CenterPoint Energy, Inc. 124 2,854 CMS Energy Corp. 62 3,746 Consolidated Edison, Inc. 96 7,567 Dominion Energy, Inc. 143 11,180 DTE Energy Co. 45 5,025 NiSource, Inc. 75 2,027 NorthWestern Corp. 12 844 Public Service Enterprise Group, Inc. 130 6,670 Sempra Energy 57 7,967 WEC Energy Group, Inc. 60 5,540
59,635 Oil, Gas & Consumable Fuels - 4.6% Antero Resources Corp.* 195 312 Apache Corp. 85 2,118 Cabot Oil & Gas Corp. 32 446 Chesapeake Energy Corp.*(b) 612 168 Chevron Corp. 601 56,097 Cimarex Energy Co. 9 297 CNX Resources Corp.* 80 425 Concho Resources, Inc. 21 1,428
Investments Shares Value ($) ConocoPhillips 295 14,284 Continental Resources, Inc. 9 171 Cosan Ltd., Class A* 83 1,516 Delek US Holdings, Inc. 28 599 Devon Energy Corp. 120 1,949 Diamondback Energy, Inc. 10 620 EOG Resources, Inc. 64 4,049 EQT Corp. 74 434 Exxon Mobil Corp. 1,415 72,788 Gulfport Energy Corp.* 73 60 Hess Corp. 65 3,652 HollyFrontier Corp. 62 2,088 Kinder Morgan, Inc. 653 12,518 Marathon Oil Corp. 270 2,236 Marathon Petroleum Corp. 204 9,674 Murphy Oil Corp. 75 1,414 Noble Energy, Inc. 139 2,200 Oasis Petroleum, Inc.* 157 257 Occidental Petroleum Corp. 227 7,432 ONEOK, Inc. 62 4,137 Parsley Energy, Inc., Class A 43 576 PBF Energy, Inc., Class A 74 1,657 PDC Energy, Inc.* 18 342 Peabody Energy Corp. 24 140 Phillips 66 182 13,624 Pioneer Natural Resources Co. 20 2,456 QEP Resources, Inc. 120 270 Range Resources Corp.(b) 107 296 SM Energy Co. 44 289 Targa Resources Corp. 61 1,976 Valero Energy Corp. 219 14,509 Whiting Petroleum Corp.*(b) 31 57 Williams Cos., Inc. (The) 259 4,934 World Fuel Services Corp. 55 1,555 WPX Energy, Inc.* 86 802
246,852 Paper & Forest Products - 0.0%(c) Domtar Corp. 25 719 Louisiana-Pacific Corp. 26 740
1,459 Personal Products - 0.1% Coty, Inc., Class A 85 785 Edgewell Personal Care Co.* 15 455 Estee Lauder Cos., Inc. (The), Class A 15 2,754 Herbalife Nutrition Ltd.* 11 356 Nu Skin Enterprises, Inc., Class A 10 245
4,595 Pharmaceuticals - 3.2% Allergan plc 80 15,254 Bristol-Myers Squibb Co. 302 17,836 Catalent, Inc.* 16 824 Eli Lilly & Co. 91 11,478 Jazz Pharmaceuticals plc* 7 802 Johnson & Johnson 388 52,178 Mallinckrodt plc* 90 385 Merck & Co., Inc. 387 29,629 Mylan NV* 159 2,733 Perrigo Co. plc 32 1,622 Pfizer, Inc. 1,078 36,027 Zoetis, Inc. 21 2,798
171,566

RAFITM Long/Short Schedule of Portfolio Investments February 29, 2020 (Unaudited) Investments Shares Value ($)
Professional Services - 0.3% CoStar Group, Inc.* 2 1,335 Equifax, Inc. 15 2,131 IHS Markit Ltd. 34 2,422 ManpowerGroup, Inc. 34 2,582 Nielsen Holdings plc 120 2,185 Robert Half International, Inc. 20 1,008 TransUnion 14 1,245 Verisk Analytics, Inc. 9 1,396
14,304 Real Estate Management & Development - 0.1% CBRE Group, Inc., Class A* 54 3,032 Howard Hughes Corp. (The)* 9 971 Jones Lang LaSalle, Inc. 7 1,034 Realogy Holdings Corp.(b) 70 649
5,686 Road & Rail - 0.8% Avis Budget Group, Inc.* 97 3,140 CSX Corp. 103 7,256 Hertz Global Holdings, Inc.* 175 2,238 JB Hunt Transport Services, Inc. 11 1,061 Kansas City Southern 18 2,712 Knight-Swift Transportation Holdings, Inc. 27 862 Landstar System, Inc. 9 909 Norfolk Southern Corp. 42 7,659 Old Dominion Freight Line, Inc. 8 1,551 Ryder System, Inc. 35 1,332 Union Pacific Corp. 95 15,182 YRC Worldwide, Inc.*(b) 102 216
44,118 Semiconductors & Semiconductor Equipment - 2.8% Advanced Micro Devices, Inc.* 29 1,319 Analog Devices, Inc. 33 3,599 Applied Materials, Inc. 126 7,323 Broadcom, Inc. 24 6,543 Cree, Inc.* 14 626 Cypress Semiconductor Corp. 42 970 First Solar, Inc.* 28 1,281 Intel Corp. 806 44,749 KLA Corp. 34 5,226 Lam Research Corp. 14 4,108 Marvell Technology Group Ltd. 56 1,193 Maxim Integrated Products, Inc. 35 1,947 Microchip Technology, Inc. 21 1,905 Micron Technology, Inc.* 214 11,248 NVIDIA Corp. 22 5,941 NXP Semiconductors NV 52 5,912 ON Semiconductor Corp.* 60 1,120 Qorvo, Inc.* 21 2,112 QUALCOMM, Inc. 363 28,423 Skyworks Solutions, Inc. 21 2,104 Teradyne, Inc. 20 1,175 Texas Instruments, Inc. 97 11,072 Xilinx, Inc. 17 1,419
151,315 Software - 2.6% Adobe, Inc.* 12 4,141 ANSYS, Inc.* 7 1,695 Avaya Holdings Corp.* 31 402 Cadence Design Systems, Inc.* 12 794 CDK Global, Inc. 9 414 Cerence, Inc.* 3 65
Investments Shares Value ($) Check Point Software Technologies Ltd.* 8 830 Citrix Systems, Inc. 7 724 Intuit, Inc. 8 2,127 Microsoft Corp. 625 101,256 NortonLifeLock, Inc. 167 3,178 Nuance Communications, Inc.* 46 995 Oracle Corp. 345 17,064 salesforce.com, Inc.* 20 3,408 SS&C Technologies Holdings, Inc. 10 555 Synopsys, Inc.* 11 1,517 Teradata Corp.* 14 279 VMware, Inc., Class A* 5 603
140,047 Specialty Retail - 2.1% Aaron's, Inc. 13 511 Abercrombie & Fitch Co., Class A 35 460 Advance Auto Parts, Inc. 10 1,330 American Eagle Outfitters, Inc. 43 554 Asbury Automotive Group, Inc.* 15 1,330 Ascena Retail Group, Inc.* 14 53 AutoNation, Inc.* 58 2,478 AutoZone, Inc.* 5 5,163 Bed Bath & Beyond, Inc.(b) 138 1,492 Best Buy Co., Inc. 95 7,187 Burlington Stores, Inc.* 9 1,946 CarMax, Inc.* 53 4,627 Designer Brands, Inc., Class A 16 216 Dick's Sporting Goods, Inc. 31 1,129 Foot Locker, Inc. 33 1,196 GameStop Corp., Class A(b) 166 598 Gap, Inc. (The) 92 1,318 Genesco, Inc.* 12 413 Group 1 Automotive, Inc. 20 1,705 Home Depot, Inc. (The) 134 29,191 L Brands, Inc. 149 3,227 Lithia Motors, Inc., Class A 11 1,311 Lowe's Cos., Inc. 131 13,961 Michaels Cos., Inc. (The)* 51 219 Murphy USA, Inc.* 23 2,242 Office Depot, Inc. 467 1,097 O'Reilly Automotive, Inc.* 9 3,318 Penske Automotive Group, Inc. 23 1,058 Ross Stores, Inc. 34 3,699 Sally Beauty Holdings, Inc.* 45 560 Signet Jewelers Ltd. 57 1,329 Tiffany & Co. 19 2,538 TJX Cos., Inc. (The) 159 9,508 Tractor Supply Co. 16 1,416 Ulta Beauty, Inc.* 6 1,543 Urban Outfitters, Inc.* 20 470 Williams-Sonoma, Inc. 24 1,497
111,890 Technology Hardware, Storage & Peripherals - 4.0% Apple, Inc. 653 178,504 Dell Technologies, Inc., Class C* 49 1,983 Diebold Nixdorf, Inc.* 74 519 Hewlett Packard Enterprise Co. 585 7,482 HP, Inc. 348 7,235 NCR Corp.* 54 1,361 NetApp, Inc. 32 1,495 Seagate Technology plc 103 4,939 Western Digital Corp. 120 6,667

RAFITM Long/Short Schedule of Portfolio Investments February 29, 2020 (Unaudited) Investments Shares Value ($)
Xerox Holdings Corp. 83 2,673 212,858
Textiles, Apparel & Luxury Goods - 0.4% Capri Holdings Ltd.* 35 904 Carter's, Inc. 7 640 Fossil Group, Inc.* 44 202 Hanesbrands, Inc. 74 980 Kontoor Brands, Inc.(b) 6 202 Lululemon Athletica, Inc.* 7 1,522 NIKE, Inc., Class B 97 8,670 PVH Corp. 20 1,482 Ralph Lauren Corp. 11 1,161 Skechers U.S.A., Inc., Class A* 21 695 Tapestry, Inc. 70 1,641 Under Armour, Inc., Class A* 18 255 Under Armour, Inc., Class C* 19 237 VF Corp. 40 2,880
21,471 Thrifts & Mortgage Finance - 0.1% MGIC Investment Corp. 75 902 New York Community Bancorp, Inc. 200 2,162 Radian Group, Inc. 31 658 Washington Federal, Inc. 21 630
4,352 Tobacco - 0.9% Altria Group, Inc. 446 18,005 Philip Morris International, Inc. 344 28,163 Universal Corp. 11 543
46,711 Trading Companies & Distributors - 0.4% AerCap Holdings NV* 63 3,281 Air Lease Corp. 22 844 Beacon Roofing Supply, Inc.* 20 594 Fastenal Co. 65 2,224 GATX Corp. 11 787 HD Supply Holdings, Inc.* 32 1,217 MRC Global, Inc.* 38 331 MSC Industrial Direct Co., Inc., Class A 9 556 NOW, Inc.* 35 309 Rush Enterprises, Inc., Class A 15 629 United Rentals, Inc.* 23 3,047 Univar Solutions, Inc.* 57 968 Watsco, Inc. 9 1,413 WESCO International, Inc.* 31 1,258 WW Grainger, Inc. 6 1,665
19,123 Transportation Infrastructure - 0.0%(c) Macquarie Infrastructure Corp. 35 1,374
Water Utilities - 0.1% American Water Works Co., Inc. 26 3,215 Essential Utilities, Inc. 24 1,032
4,247 Wireless Telecommunication Services - 0.2% Sprint Corp.* 367 3,373 Telephone & Data Systems, Inc. 40 806 T-Mobile US, Inc.* 71 6,401
10,580 TOTAL COMMON STOCKS (Cost $3,869,692) 4,542,728
Investments Shares Value ($) SECURITIES LENDING REINVESTMENTS(d) - 0.2% INVESTMENT COMPANIES - 0.2%
BlackRock Liquidity FedFund, Institutional Class 1.49% (Cost $8,588) 8,588 8,588
Investments Principal
Amount ($) Value ($) SHORT-TERM INVESTMENTS - 14.0% REPURCHASE AGREEMENTS(e) - 14.0% Repurchase Agreements with various
counterparties, rates 1.58% - 1.59%, dated 2/28/2020, due 3/2/2020, total to be received $749,092
(Cost $748,994) 748,994 748,994 Total Investments - 99.3%
(Cost $4,627,274) 5,300,310 Other Assets Less Liabilities - 0.7% 36,404 Net Assets - 100.0% 5,336,714

RAFITM Long/Short Schedule of Portfolio Investments February 29, 2020 (Unaudited)
* Non-income producing security. (a) All or a portion of these securities are segregated in connection
with obligations for swaps with a total value of $114,940. (b) The security or a portion of this security is on loan at February
29, 2020. The total value of securities on loan at February 29, 2020 was $12,675, collateralized in the form of cash with a value of $8,588 that was reinvested in the securities shown in the Securities Lending Reinvestment section of the Schedule of Investments and $4,526 of collateral in the form of U.S. Government Treasury Securities, interest rates ranging from 0.00% – 6.13%, and maturity dates ranging from March 19, 2020 – November 15, 2049; a total value of $13,114.
(c) Represents less than 0.05% of net assets. (d) The security was purchased with cash collateral held from
securities on loan at February 29, 2020. The total value of securities purchased was $8,588.
(e) The Fund invests in Repurchase Agreements jointly with other funds in the Trust. See "Repurchase Agreements" in the Notes to Schedules of Portfolio of Investments to view the details of each individual agreement and counterparty as well as a description of the securities subject to repurchase.
Swap Agreements RAFITM Long/Short had the following open non-exchange traded total return swap agreements as of February 29, 2020:
Notional
Amount ($) Termination
Date1 Counterparty Rate Paid
(Received)2 Underlying Instrument
Value and Unrealized
Appreciation/ (Depreciation)
($)
(462,357)
12/7/2020 Goldman Sachs
International (1.77)% Russell 1000 Total Return Index (63,615)
46,153
12/7/2020 Goldman Sachs
International 2.02% FTSE RAFI US 1000 Total Return Index 31,449
(4,305,508)
1/6/2021 Societe Generale (1.37)% Russell 1000 Total Return Index 113,379
125,044
1/6/2021 Societe Generale 1.87% FTSE RAFI US 1000 Total Return Index (13,643)
(4,596,668)
67,570
Total Unrealized Appreciation 144,828
Total Unrealized Depreciation (77,258)
1 Agreements may be terminated at will by either party without penalty. Payment is due at termination/maturity. 2 Reflects the floating financing rate, as of February 29, 2020, on the notional amount of the swap agreement paid to the
counterparty or received from the counterparty, excluding any commissions. This amount is included as part of the unrealized appreciation/(depreciation).

Russell 2000 Dividend Growers ETF Schedule of Portfolio Investments February 29, 2020 (Unaudited)
Investments Shares Value ($) COMMON STOCKS - 99.6%
Banks - 9.3% BancFirst Corp. 213,055 10,929,722 Community Bank System, Inc. 187,680 11,412,821 Southside Bancshares, Inc. 356,153 11,475,250 Tompkins Financial Corp. 145,413 11,557,425 UMB Financial Corp. 188,341 10,952,029 United Bankshares, Inc. 336,080 9,705,990
66,033,237 Capital Markets - 1.5% Westwood Holdings Group, Inc. 425,933 10,810,180
Chemicals - 7.9% Balchem Corp. 124,489 11,759,231 HB Fuller Co. 249,523 9,788,787 Quaker Chemical Corp. 83,608 13,174,113 Sensient Technologies Corp. 198,834 9,778,656 Stepan Co. 130,518 11,463,396
55,964,183 Commercial Services & Supplies - 9.7% ABM Industries, Inc. 334,598 11,014,966 Brady Corp., Class A 220,651 10,445,618 Healthcare Services Group, Inc. 500,438 13,782,063 Matthews International Corp., Class A 326,701 9,657,282 McGrath RentCorp 166,902 11,591,344 MSA Safety, Inc. 100,947 12,282,221
68,773,494 Electric Utilities - 3.3% ALLETE, Inc. 160,876 11,098,835 Portland General Electric Co. 230,645 12,549,395
23,648,230 Electronic Equipment, Instruments & Components - 1.8% Badger Meter, Inc. 208,014 12,524,523
Equity Real Estate Investment Trusts (REITs) - 6.3% National Health Investors, Inc. 156,235 12,769,086 Tanger Factory Outlet Centers, Inc.(a) 815,406 9,768,564 Universal Health Realty Income Trust 104,604 11,267,943 Urstadt Biddle Properties, Inc., Class A 520,862 10,734,966
44,540,559 Food & Staples Retailing - 1.4% Andersons, Inc. (The) 534,369 9,816,358
Food Products - 6.2% Calavo Growers, Inc. 143,533 10,398,966 J&J Snack Foods Corp. 67,601 10,871,593 Lancaster Colony Corp. 80,668 11,652,492 Tootsie Roll Industries, Inc.(a) 357,352 11,463,867
44,386,918 Gas Utilities - 9.6% Chesapeake Utilities Corp. 137,152 11,726,496 New Jersey Resources Corp. 298,722 10,547,874 Northwest Natural Holding Co. 187,014 12,299,911 South Jersey Industries, Inc. 411,770 11,138,378 Southwest Gas Holdings, Inc. 169,810 10,983,311 Spire, Inc. 160,419 12,039,446
68,735,416
Investments Shares Value ($) Health Care Equipment & Supplies - 3.0% Atrion Corp. 18,081 11,143,501 Utah Medical Products, Inc. 119,798 10,470,345
21,613,846 Health Care Providers & Services - 5.2% Ensign Group, Inc. (The) 293,172 13,046,154 National HealthCare Corp. 149,666 11,106,714 Pennant Group, Inc. (The)* 487,249 13,238,555
37,391,423 Insurance - 3.1% American Equity Investment Life Holding Co. 429,951 10,869,161 RLI Corp. 139,186 11,187,771
22,056,932 IT Services - 1.5% Cass Information Systems, Inc. 224,696 10,549,477
Machinery - 6.4% Franklin Electric Co., Inc. 228,232 11,797,312 Gorman-Rupp Co. (The) 345,823 11,062,878 Hillenbrand, Inc. 388,699 9,095,556 Lindsay Corp. 139,858 13,850,138
45,805,884 Media - 1.3% Meredith Corp. 360,787 9,506,737
Multi-Utilities - 5.2% Avista Corp. 269,555 12,709,518 Black Hills Corp. 166,347 12,010,253 NorthWestern Corp. 177,961 12,517,777
37,237,548 Personal Products - 1.5% Inter Parfums, Inc. 175,226 10,524,074
Specialty Retail - 2.7% Aaron's, Inc. 216,113 8,499,724 Group 1 Automotive, Inc. 123,120 10,493,518
18,993,242 Thrifts & Mortgage Finance - 1.5% Northwest Bancshares, Inc. 769,195 10,684,119
Tobacco - 3.2% Universal Corp. 239,184 11,803,730 Vector Group Ltd. 952,298 11,065,703
22,869,433 Trading Companies & Distributors - 1.6% GATX Corp. 155,694 11,136,792
Water Utilities - 6.4% American States Water Co. 147,382 11,287,987 California Water Service Group 245,912 11,793,940 Middlesex Water Co. 201,383 11,976,247 SJW Group 178,223 10,903,683
45,961,857 TOTAL COMMON STOCKS (Cost $754,070,897) 709,564,462

Russell 2000 Dividend Growers ETF Schedule of Portfolio Investments February 29, 2020 (Unaudited)
Investments Shares Value ($) SECURITIES LENDING REINVESTMENTS(b) - 2.0% INVESTMENT COMPANIES - 2.0%
BlackRock Liquidity FedFund, Institutional Class 1.49% (Cost $14,092,926) 14,092,926 14,092,926
Investments Principal
Amount ($) Value ($) SHORT-TERM INVESTMENTS - 0.2% REPURCHASE AGREEMENTS(c) - 0.2% Repurchase Agreements with various
counterparties, rates 1.58% - 1.59%, dated 2/28/2020, due 3/2/2020, total to be received $1,631,571
(Cost $1,631,356) 1,631,356 1,631,356 Total Investments - 101.8%
(Cost $769,795,179) 725,288,744 Liabilities in excess of other assets - (1.8%) (13,044,590) Net Assets - 100.0% 712,244,154
* Non-income producing security. (a) The security or a portion of this security is on loan at February
29, 2020. The total value of securities on loan at February 29, 2020 was $13,495,422, collateralized in the form of cash with a value of $14,092,926 that was reinvested in the securities shown in the Securities Lending Reinvestment section of the Schedule of Investments.
(b) The security was purchased with cash collateral held from securities on loan at February 29, 2020. The total value of securities purchased was $14,092,926.
(c) The Fund invests in Repurchase Agreements jointly with other funds in the Trust. See "Repurchase Agreements" in the Notes to Schedules of Portfolio of Investments to view the details of each individual agreement and counterparty as well as a description of the securities subject to repurchase.
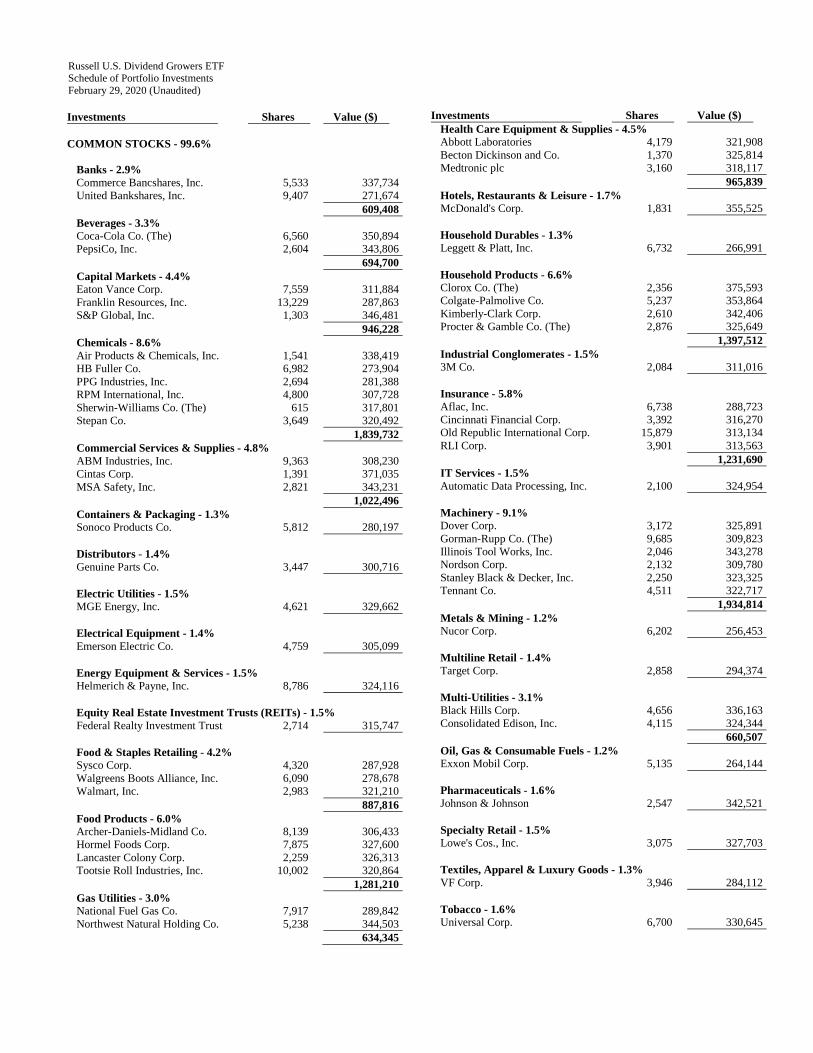
Russell U.S. Dividend Growers ETF Schedule of Portfolio Investments February 29, 2020 (Unaudited)
Investments Shares Value ($) COMMON STOCKS - 99.6%
Banks - 2.9% Commerce Bancshares, Inc. 5,533 337,734 United Bankshares, Inc. 9,407 271,674
609,408 Beverages - 3.3% Coca-Cola Co. (The) 6,560 350,894 PepsiCo, Inc. 2,604 343,806
694,700 Capital Markets - 4.4% Eaton Vance Corp. 7,559 311,884 Franklin Resources, Inc. 13,229 287,863 S&P Global, Inc. 1,303 346,481
946,228 Chemicals - 8.6% Air Products & Chemicals, Inc. 1,541 338,419 HB Fuller Co. 6,982 273,904 PPG Industries, Inc. 2,694 281,388 RPM International, Inc. 4,800 307,728 Sherwin-Williams Co. (The) 615 317,801 Stepan Co. 3,649 320,492
1,839,732 Commercial Services & Supplies - 4.8% ABM Industries, Inc. 9,363 308,230 Cintas Corp. 1,391 371,035 MSA Safety, Inc. 2,821 343,231
1,022,496 Containers & Packaging - 1.3% Sonoco Products Co. 5,812 280,197
Distributors - 1.4% Genuine Parts Co. 3,447 300,716
Electric Utilities - 1.5% MGE Energy, Inc. 4,621 329,662
Electrical Equipment - 1.4% Emerson Electric Co. 4,759 305,099
Energy Equipment & Services - 1.5% Helmerich & Payne, Inc. 8,786 324,116
Equity Real Estate Investment Trusts (REITs) - 1.5% Federal Realty Investment Trust 2,714 315,747
Food & Staples Retailing - 4.2% Sysco Corp. 4,320 287,928 Walgreens Boots Alliance, Inc. 6,090 278,678 Walmart, Inc. 2,983 321,210
887,816 Food Products - 6.0% Archer-Daniels-Midland Co. 8,139 306,433 Hormel Foods Corp. 7,875 327,600 Lancaster Colony Corp. 2,259 326,313 Tootsie Roll Industries, Inc. 10,002 320,864
1,281,210 Gas Utilities - 3.0% National Fuel Gas Co. 7,917 289,842 Northwest Natural Holding Co. 5,238 344,503
634,345
Investments Shares Value ($) Health Care Equipment & Supplies - 4.5% Abbott Laboratories 4,179 321,908 Becton Dickinson and Co. 1,370 325,814 Medtronic plc 3,160 318,117
965,839 Hotels, Restaurants & Leisure - 1.7% McDonald's Corp. 1,831 355,525
Household Durables - 1.3% Leggett & Platt, Inc. 6,732 266,991
Household Products - 6.6% Clorox Co. (The) 2,356 375,593 Colgate-Palmolive Co. 5,237 353,864 Kimberly-Clark Corp. 2,610 342,406 Procter & Gamble Co. (The) 2,876 325,649
1,397,512 Industrial Conglomerates - 1.5% 3M Co. 2,084 311,016
Insurance - 5.8% Aflac, Inc. 6,738 288,723 Cincinnati Financial Corp. 3,392 316,270 Old Republic International Corp. 15,879 313,134 RLI Corp. 3,901 313,563
1,231,690 IT Services - 1.5% Automatic Data Processing, Inc. 2,100 324,954
Machinery - 9.1% Dover Corp. 3,172 325,891 Gorman-Rupp Co. (The) 9,685 309,823 Illinois Tool Works, Inc. 2,046 343,278 Nordson Corp. 2,132 309,780 Stanley Black & Decker, Inc. 2,250 323,325 Tennant Co. 4,511 322,717
1,934,814 Metals & Mining - 1.2% Nucor Corp. 6,202 256,453
Multiline Retail - 1.4% Target Corp. 2,858 294,374
Multi-Utilities - 3.1% Black Hills Corp. 4,656 336,163 Consolidated Edison, Inc. 4,115 324,344
660,507 Oil, Gas & Consumable Fuels - 1.2% Exxon Mobil Corp. 5,135 264,144
Pharmaceuticals - 1.6% Johnson & Johnson 2,547 342,521
Specialty Retail - 1.5% Lowe's Cos., Inc. 3,075 327,703
Textiles, Apparel & Luxury Goods - 1.3% VF Corp. 3,946 284,112
Tobacco - 1.6% Universal Corp. 6,700 330,645

Russell U.S. Dividend Growers ETF Schedule of Portfolio Investments February 29, 2020 (Unaudited)
Investments Shares Value ($) Trading Companies & Distributors - 1.5% WW Grainger, Inc. 1,114 309,180
Water Utilities - 6.0% American States Water Co. 4,121 315,627 California Water Service Group 6,888 330,349 Middlesex Water Co. 5,641 335,470 SJW Group 4,992 305,411
1,286,857 Wireless Telecommunication Services - 1.4% Telephone & Data Systems, Inc. 14,523 292,493
TOTAL COMMON STOCKS (Cost $24,064,059) 21,208,802
Investments Principal
Amount ($) Value ($) SHORT-TERM INVESTMENTS - 0.2% REPURCHASE AGREEMENTS(a) - 0.2% Repurchase Agreements with various
counterparties, rates 1.58% - 1.59%, dated 2/28/2020, due 3/2/2020, total to be received $49,656
(Cost $49,650) 49,650 49,650 Total Investments - 99.8%
(Cost $24,113,709) 21,258,452 Other Assets Less Liabilities - 0.2% 40,981 Net Assets - 100.0% 21,299,433
(a) The Fund invests in Repurchase Agreements jointly with other funds in the Trust. See "Repurchase Agreements" in the Notes to Schedules of Portfolio of Investments to view the details of each individual agreement and counterparty as well as a description of the securities subject to repurchase.

S&P 500® Bond ETF Schedule of Portfolio Investments February 29, 2020 (Unaudited)
Investments Principal
Amount ($) Value ($) CORPORATE BONDS - 98.4%
Aerospace & Defense - 3.3% Boeing Co. (The)
2.70%, 2/1/2027 115,000 118,224 Lockheed Martin Corp.
4.70%, 5/15/2046 100,000 134,701 Northrop Grumman Corp.
3.25%, 1/15/2028 200,000 215,803 United Technologies Corp.
4.50%, 6/1/2042 240,000 307,925 4.63%, 11/16/2048 150,000 201,244
977,897 Air Freight & Logistics - 0.3% FedEx Corp.
4.05%, 2/15/2048 100,000 101,543
Automobiles - 0.7% General Motors Co.
4.88%, 10/2/2023 200,000 217,431
Banks - 15.5% Bank of America Corp.
2.63%, 4/19/2021 200,000 202,283 2.50%, 10/21/2022 200,000 203,053 3.30%, 1/11/2023 115,000 120,654 4.00%, 4/1/2024 100,000 108,852 3.25%, 10/21/2027 100,000 107,344
Citigroup, Inc. 2.35%, 8/2/2021 640,000 648,157 4.40%, 6/10/2025 100,000 111,476 3.20%, 10/21/2026 100,000 106,487
JPMorgan Chase & Co. 2.40%, 6/7/2021 200,000 202,069 2.30%, 8/15/2021 150,000 150,354 3.88%, 9/10/2024 150,000 162,414 3.90%, 7/15/2025 400,000 441,308 2.95%, 10/1/2026 202,000 214,214
PNC Financial Services Group, Inc. (The) 3.50%, 1/23/2024 282,000 301,055
US Bancorp Series X, 3.15%, 4/27/2027 200,000 218,895
Wells Fargo & Co. 2.50%, 3/4/2021 150,000 151,167 2.63%, 7/22/2022 100,000 102,506 3.30%, 9/9/2024 168,000 179,580 3.55%, 9/29/2025 168,000 182,696 3.00%, 4/22/2026 200,000 211,939 3.00%, 10/23/2026 250,000 264,826 4.75%, 12/7/2046 150,000 189,193
4,580,522 Beverages - 0.9% PepsiCo, Inc.
4.00%, 5/2/2047 220,000 274,423
Biotechnology - 4.0% AbbVie, Inc.
2.30%, 5/14/2021 100,000 100,586 3.20%, 5/14/2026 200,000 211,169 4.45%, 5/14/2046 140,000 161,518
Investments Principal
Amount ($) Value ($) 4.88%, 11/14/2048 115,000 141,497
Amgen, Inc. 2.65%, 5/11/2022 200,000 204,566
Gilead Sciences, Inc. 2.95%, 3/1/2027 150,000 160,076 4.75%, 3/1/2046 150,000 193,453
1,172,865 Capital Markets - 6.6% Goldman Sachs Group, Inc. (The)
4.00%, 3/3/2024 105,000 114,161 3.50%, 11/16/2026 100,000 107,409 3.85%, 1/26/2027 250,000 274,622 6.75%, 10/1/2037 200,000 283,831 5.15%, 5/22/2045 100,000 128,717
Morgan Stanley 3.13%, 1/23/2023 200,000 208,845 4.10%, 5/22/2023 120,000 128,272 Series F, 3.88%, 4/29/2024 100,000 108,572 3.13%, 7/27/2026 100,000 106,599 3.63%, 1/20/2027 200,000 218,789 4.30%, 1/27/2045 100,000 123,398 4.38%, 1/22/2047 115,000 145,203
1,948,418 Chemicals - 0.6% DuPont de Nemours, Inc.
4.73%, 11/15/2028 150,000 174,414
Communications Equipment - 0.5% Cisco Systems, Inc.
2.20%, 2/28/2021 150,000 150,992
Consumer Finance - 2.2% American Express Co.
3.40%, 2/27/2023 100,000 105,286 American Express Credit Corp.
3.30%, 5/3/2027 100,000 109,780 Capital One Financial Corp.
3.30%, 10/30/2024 100,000 106,436 3.80%, 1/31/2028 100,000 109,185
General Motors Financial Co., Inc. 3.20%, 7/6/2021 100,000 101,181 3.45%, 1/14/2022 100,000 102,167
634,035 Containers & Packaging - 0.4% International Paper Co.
4.40%, 8/15/2047 100,000 112,527
Diversified Financial Services - 1.1% Berkshire Hathaway, Inc.
2.75%, 3/15/2023 100,000 103,936 GE Capital International Funding Co. Unlimited Co.
4.42%, 11/15/2035 200,000 228,636 332,572
Diversified Telecommunication Services - 8.0% AT&T, Inc.
2.80%, 2/17/2021 100,000 100,811 3.60%, 2/17/2023 100,000 105,557 3.40%, 5/15/2025 450,000 479,374 5.25%, 3/1/2037 400,000 494,997 4.35%, 6/15/2045 150,000 169,042
Verizon Communications, Inc. 3.50%, 11/1/2024 202,000 218,700

S&P 500® Bond ETF Schedule of Portfolio Investments February 29, 2020 (Unaudited)
Investments Principal
Amount ($) Value ($) 5.25%, 3/16/2037 300,000 400,761 4.86%, 8/21/2046 150,000 198,008 4.52%, 9/15/2048 150,000 193,997
2,361,247 Electric Utilities - 1.3% Duke Energy Corp.
3.75%, 4/15/2024 100,000 107,465 Southern California Edison Co.
4.00%, 4/1/2047 150,000 171,415 Southern Co. (The)
3.25%, 7/1/2026 110,000 117,991 396,871
Energy Equipment & Services - 0.7% Baker Hughes a GE Co. LLC
3.34%, 12/15/2027 100,000 105,068 Halliburton Co.
5.00%, 11/15/2045 100,000 108,524 213,592
Entertainment - 0.9% NBCUniversal Media LLC
4.38%, 4/1/2021 100,000 103,059 Walt Disney Co. (The)
2.75%, 9/1/2049 150,000 152,005 255,064
Equity Real Estate Investment Trusts (REITs) - 0.4% American Tower Corp.
3.80%, 8/15/2029 100,000 110,162
Food & Staples Retailing - 2.6% Kroger Co. (The)
4.45%, 2/1/2047 100,000 113,215 Walgreens Boots Alliance, Inc.
3.45%, 6/1/2026 130,000 136,719 Walmart, Inc.
3.55%, 6/26/2025 465,000 512,081 762,015
Food Products - 2.1% Campbell Soup Co.
4.15%, 3/15/2028 100,000 111,464 Conagra Brands, Inc.
5.40%, 11/1/2048 150,000 189,644 Kraft Heinz Foods Co.
3.00%, 6/1/2026 120,000 119,833 Tyson Foods, Inc.
5.10%, 9/28/2048 150,000 195,435 616,376
Health Care Equipment & Supplies - 1.2% Abbott Laboratories
4.90%, 11/30/2046 110,000 153,208 Medtronic, Inc.
4.63%, 3/15/2045 150,000 202,996 356,204
Health Care Providers & Services - 5.2% Anthem, Inc.
3.65%, 12/1/2027 120,000 131,289 Cigna Corp.
4.38%, 10/15/2028 250,000 284,650 CVS Health Corp.
3.35%, 3/9/2021 320,000 325,284 3.50%, 7/20/2022 120,000 124,627 3.70%, 3/9/2023 170,000 179,586 4.10%, 3/25/2025 160,000 175,411
Investments Principal
Amount ($) Value ($) 5.05%, 3/25/2048 150,000 184,445
UnitedHealth Group, Inc. 3.88%, 8/15/2059 115,000 130,968
1,536,260 Hotels, Restaurants & Leisure - 0.9% McDonald's Corp.
4.88%, 12/9/2045 100,000 129,413 4.45%, 3/1/2047 100,000 121,557
250,970 Industrial Conglomerates - 1.1% General Electric Co.
2.70%, 10/9/2022 100,000 102,178 6.88%, 1/10/2039 150,000 209,029
311,207 Insurance - 1.2% American International Group, Inc.
4.75%, 4/1/2048 150,000 192,147 Prudential Financial, Inc.
3.70%, 3/13/2051 150,000 159,531 351,678
Internet & Direct Marketing Retail - 1.5% Amazon.com, Inc.
3.88%, 8/22/2037 150,000 180,448 4.25%, 8/22/2057 200,000 268,557
449,005 IT Services - 2.8% Fiserv, Inc.
4.40%, 7/1/2049 150,000 179,480 International Business Machines Corp.
4.25%, 5/15/2049 135,000 168,345 Mastercard, Inc.
2.95%, 6/1/2029 300,000 325,217 Visa, Inc.
3.15%, 12/14/2025 150,000 162,919 835,961
Media - 3.0% Comcast Corp.
3.00%, 2/1/2024 150,000 158,428 3.15%, 2/15/2028 100,000 108,624 4.00%, 3/1/2048 100,000 118,545 4.70%, 10/15/2048 220,000 289,240
Discovery Communications LLC 2.95%, 3/20/2023 100,000 103,420
ViacomCBS, Inc. 4.38%, 3/15/2043 100,000 107,390
885,647 Multiline Retail - 0.4% Dollar Tree, Inc.
3.70%, 5/15/2023 100,000 106,104
Multi-Utilities - 0.7% Berkshire Hathaway Energy Co.
6.13%, 4/1/2036 150,000 213,837
Oil, Gas & Consumable Fuels - 5.7% Apache Corp.
4.75%, 4/15/2043 150,000 141,665 Chevron Corp.
2.36%, 12/5/2022 150,000 153,696 3.19%, 6/24/2023 100,000 104,904
Exxon Mobil Corp. 3.04%, 3/1/2026 248,000 266,051

S&P 500® Bond ETF Schedule of Portfolio Investments February 29, 2020 (Unaudited)
Investments Principal
Amount ($) Value ($) Kinder Morgan, Inc.
4.30%, 3/1/2028 100,000 111,571 5.20%, 3/1/2048 100,000 118,422
MPLX LP 4.00%, 3/15/2028 150,000 157,976 4.50%, 4/15/2038 100,000 101,756
Occidental Petroleum Corp. 6.45%, 9/15/2036 150,000 177,464
Phillips 66 4.88%, 11/15/2044 100,000 120,252
Valero Energy Corp. 6.63%, 6/15/2037 100,000 135,824
Williams Cos., Inc. (The) 3.60%, 3/15/2022 100,000 103,125
1,692,706 Pharmaceuticals - 3.9% Allergan Funding SCS
3.80%, 3/15/2025 100,000 109,283 4.55%, 3/15/2035 80,000 95,698
Eli Lilly & Co. 3.38%, 3/15/2029 350,000 393,024
Johnson & Johnson 3.70%, 3/1/2046 100,000 121,467
Merck & Co., Inc. 2.75%, 2/10/2025 120,000 126,424
Mylan NV 3.95%, 6/15/2026 120,000 130,497
Pfizer, Inc. 7.20%, 3/15/2039 100,000 169,574
1,145,967 Road & Rail - 0.4% CSX Corp.
4.30%, 3/1/2048 100,000 121,020
Semiconductors & Semiconductor Equipment - 3.0% Applied Materials, Inc.
3.30%, 4/1/2027 100,000 109,611 Broadcom Corp.
3.00%, 1/15/2022 100,000 101,935 3.63%, 1/15/2024 100,000 104,965 3.88%, 1/15/2027 100,000 104,517 3.50%, 1/15/2028 160,000 164,633
QUALCOMM, Inc. 3.25%, 5/20/2027 150,000 161,684 4.80%, 5/20/2045 100,000 126,988
874,333 Software - 6.9% Microsoft Corp.
1.55%, 8/8/2021 115,000 115,564 2.38%, 2/12/2022 392,000 400,900 2.40%, 8/8/2026 100,000 105,210 3.30%, 2/6/2027 100,000 110,775 4.45%, 11/3/2045 150,000 200,554 4.25%, 2/6/2047 150,000 196,736 3.95%, 8/8/2056 150,000 190,756
Oracle Corp. 2.40%, 9/15/2023 248,000 255,941 2.65%, 7/15/2026 148,000 156,288 3.80%, 11/15/2037 268,000 309,764
2,042,488
Investments Principal
Amount ($) Value ($) Specialty Retail - 1.5% Home Depot, Inc. (The)
2.63%, 6/1/2022 160,000 164,469 3.75%, 2/15/2024 160,000 174,733
Lowe's Cos., Inc. 4.05%, 5/3/2047 100,000 112,564
451,766 Technology Hardware, Storage & Peripherals - 4.8% Apple, Inc.
2.25%, 2/23/2021 200,000 201,390 2.85%, 5/6/2021 200,000 203,471 2.40%, 5/3/2023 150,000 154,885 3.35%, 2/9/2027 100,000 110,152 2.90%, 9/12/2027 100,000 107,651 3.45%, 2/9/2045 100,000 112,736 4.65%, 2/23/2046 100,000 133,225 3.75%, 11/13/2047 100,000 118,326
Hewlett Packard Enterprise Co. 4.90%, 10/15/2025(a) 120,000 136,379 6.35%, 10/15/2045(a) 100,000 125,031
1,403,246 Tobacco - 2.1% Altria Group, Inc.
4.00%, 1/31/2024 300,000 323,986 4.40%, 2/14/2026 150,000 167,835
Philip Morris International, Inc. 4.25%, 11/10/2044 100,000 115,703
607,524 TOTAL CORPORATE BONDS (Cost $26,652,104) 29,028,889 SHORT-TERM INVESTMENTS - 0.7% REPURCHASE AGREEMENTS(b) - 0.7% Repurchase Agreements with various
counterparties, rates 1.58% - 1.59%, dated 2/28/2020, due 3/2/2020, total to be received $209,875
(Cost $209,847) 209,847 209,847 Total Investments - 99.1%
(Cost $26,861,951) 29,238,736 Other Assets Less Liabilities - 0.9% 272,631 Net Assets - 100.0% 29,511,367

S&P 500® Bond ETF Schedule of Portfolio Investments February 29, 2020 (Unaudited)
(a) Step bond. Interest rate is a fixed rate for an initial period that either resets at a specific date or may reset in the future at a contingent upon predetermined trigger. The interest rate shown was the current rate as of February 29, 2020.
(b) The Fund invests in Repurchase Agreements jointly with other funds in the Trust. See "Repurchase Agreements" in the Notes to Schedules of Portfolio of Investments to view the details of each individual agreement and counterparty as well as a description of the securities subject to repurchase.
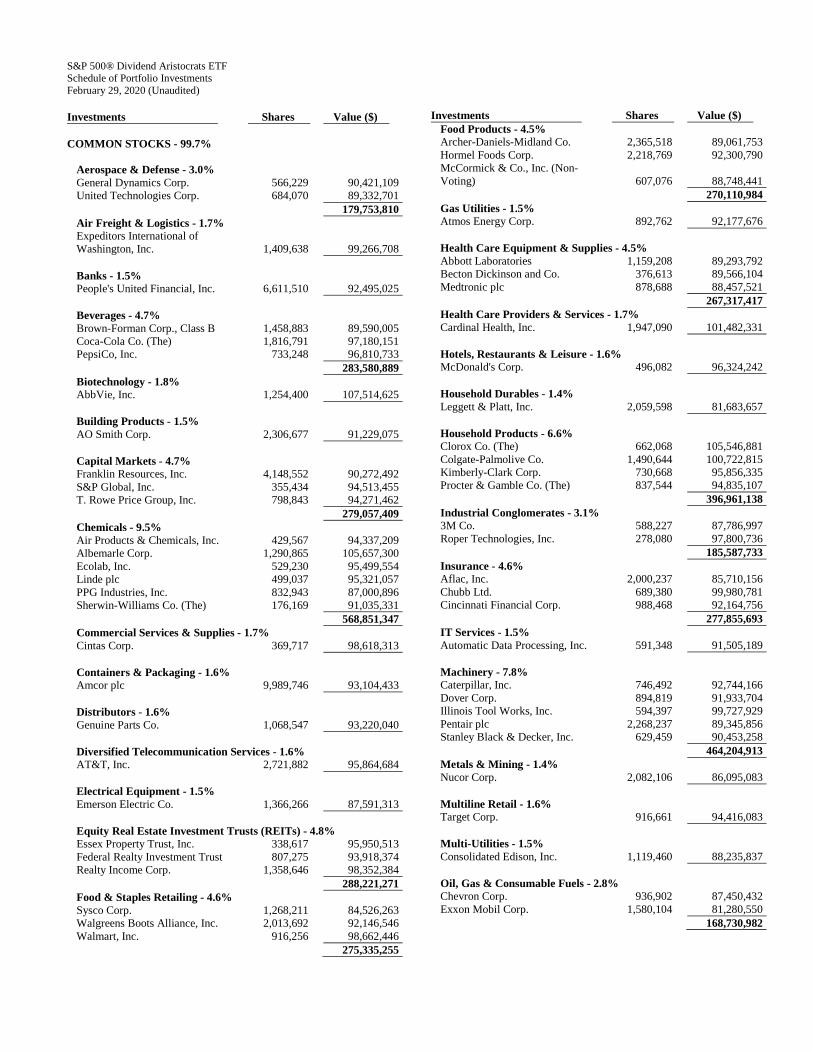
S&P 500® Dividend Aristocrats ETF Schedule of Portfolio Investments February 29, 2020 (Unaudited)
Investments Shares Value ($) COMMON STOCKS - 99.7%
Aerospace & Defense - 3.0% General Dynamics Corp. 566,229 90,421,109 United Technologies Corp. 684,070 89,332,701
179,753,810 Air Freight & Logistics - 1.7% Expeditors International of Washington, Inc. 1,409,638 99,266,708
Banks - 1.5% People's United Financial, Inc. 6,611,510 92,495,025
Beverages - 4.7% Brown-Forman Corp., Class B 1,458,883 89,590,005 Coca-Cola Co. (The) 1,816,791 97,180,151 PepsiCo, Inc. 733,248 96,810,733
283,580,889 Biotechnology - 1.8% AbbVie, Inc. 1,254,400 107,514,625
Building Products - 1.5% AO Smith Corp. 2,306,677 91,229,075
Capital Markets - 4.7% Franklin Resources, Inc. 4,148,552 90,272,492 S&P Global, Inc. 355,434 94,513,455 T. Rowe Price Group, Inc. 798,843 94,271,462
279,057,409 Chemicals - 9.5% Air Products & Chemicals, Inc. 429,567 94,337,209 Albemarle Corp. 1,290,865 105,657,300 Ecolab, Inc. 529,230 95,499,554 Linde plc 499,037 95,321,057 PPG Industries, Inc. 832,943 87,000,896 Sherwin-Williams Co. (The) 176,169 91,035,331
568,851,347 Commercial Services & Supplies - 1.7% Cintas Corp. 369,717 98,618,313
Containers & Packaging - 1.6% Amcor plc 9,989,746 93,104,433
Distributors - 1.6% Genuine Parts Co. 1,068,547 93,220,040
Diversified Telecommunication Services - 1.6% AT&T, Inc. 2,721,882 95,864,684
Electrical Equipment - 1.5% Emerson Electric Co. 1,366,266 87,591,313
Equity Real Estate Investment Trusts (REITs) - 4.8% Essex Property Trust, Inc. 338,617 95,950,513 Federal Realty Investment Trust 807,275 93,918,374 Realty Income Corp. 1,358,646 98,352,384
288,221,271 Food & Staples Retailing - 4.6% Sysco Corp. 1,268,211 84,526,263 Walgreens Boots Alliance, Inc. 2,013,692 92,146,546 Walmart, Inc. 916,256 98,662,446
275,335,255
Investments Shares Value ($) Food Products - 4.5% Archer-Daniels-Midland Co. 2,365,518 89,061,753 Hormel Foods Corp. 2,218,769 92,300,790 McCormick & Co., Inc. (Non-Voting) 607,076 88,748,441
270,110,984 Gas Utilities - 1.5% Atmos Energy Corp. 892,762 92,177,676
Health Care Equipment & Supplies - 4.5% Abbott Laboratories 1,159,208 89,293,792 Becton Dickinson and Co. 376,613 89,566,104 Medtronic plc 878,688 88,457,521
267,317,417 Health Care Providers & Services - 1.7% Cardinal Health, Inc. 1,947,090 101,482,331
Hotels, Restaurants & Leisure - 1.6% McDonald's Corp. 496,082 96,324,242
Household Durables - 1.4% Leggett & Platt, Inc. 2,059,598 81,683,657
Household Products - 6.6% Clorox Co. (The) 662,068 105,546,881 Colgate-Palmolive Co. 1,490,644 100,722,815 Kimberly-Clark Corp. 730,668 95,856,335 Procter & Gamble Co. (The) 837,544 94,835,107
396,961,138 Industrial Conglomerates - 3.1% 3M Co. 588,227 87,786,997 Roper Technologies, Inc. 278,080 97,800,736
185,587,733 Insurance - 4.6% Aflac, Inc. 2,000,237 85,710,156 Chubb Ltd. 689,380 99,980,781 Cincinnati Financial Corp. 988,468 92,164,756
277,855,693 IT Services - 1.5% Automatic Data Processing, Inc. 591,348 91,505,189
Machinery - 7.8% Caterpillar, Inc. 746,492 92,744,166 Dover Corp. 894,819 91,933,704 Illinois Tool Works, Inc. 594,397 99,727,929 Pentair plc 2,268,237 89,345,856 Stanley Black & Decker, Inc. 629,459 90,453,258
464,204,913 Metals & Mining - 1.4% Nucor Corp. 2,082,106 86,095,083
Multiline Retail - 1.6% Target Corp. 916,661 94,416,083
Multi-Utilities - 1.5% Consolidated Edison, Inc. 1,119,460 88,235,837
Oil, Gas & Consumable Fuels - 2.8% Chevron Corp. 936,902 87,450,432 Exxon Mobil Corp. 1,580,104 81,280,550
168,730,982

S&P 500® Dividend Aristocrats ETF Schedule of Portfolio Investments February 29, 2020 (Unaudited)
Investments Shares Value ($) Pharmaceuticals - 1.6% Johnson & Johnson 706,527 95,013,751
Specialty Retail - 3.2% Lowe's Cos., Inc. 871,668 92,893,659 Ross Stores, Inc. 905,255 98,473,639
191,367,298 Textiles, Apparel & Luxury Goods - 1.5% VF Corp. 1,239,706 89,258,832
Trading Companies & Distributors - 1.5% WW Grainger, Inc. 318,517 88,401,208
TOTAL COMMON STOCKS (Cost $5,680,582,685) 5,960,434,244
Investments Principal
Amount ($) Value ($) SHORT-TERM INVESTMENTS - 0.1% REPURCHASE AGREEMENTS(a) - 0.1% Repurchase Agreements with various
counterparties, rates 1.58% - 1.59%, dated 2/28/2020, due 3/2/2020, total to be received $6,903,935
(Cost $6,903,025) 6,903,025 6,903,025 Total Investments - 99.8%
(Cost $5,687,485,710) 5,967,337,269 Other Assets Less Liabilities - 0.2% 10,419,383 Net Assets - 100.0% 5,977,756,652
(a) The Fund invests in Repurchase Agreements jointly with other funds in the Trust. See "Repurchase Agreements" in the Notes to Schedules of Portfolio of Investments to view the details of each individual agreement and counterparty as well as a description of the securities subject to repurchase.

S&P 500® Ex-Energy ETF Schedule of Portfolio Investments February 29, 2020 (Unaudited)
Investments Shares Value ($) COMMON STOCKS - 99.7%
Aerospace & Defense - 2.5% Arconic, Inc. 221 6,486 Boeing Co. (The) 307 84,459 General Dynamics Corp. 134 21,399 Huntington Ingalls Industries, Inc. 23 4,727 L3Harris Technologies, Inc. 128 25,309 Lockheed Martin Corp. 145 53,631 Northrop Grumman Corp. 90 29,596 Raytheon Co. 160 30,170 Textron, Inc. 130 5,278 TransDigm Group, Inc. 27 15,061 United Technologies Corp. 468 61,116
337,232 Air Freight & Logistics - 0.5% CH Robinson Worldwide, Inc. 80 5,512 Expeditors International of Washington, Inc. 100 7,042 FedEx Corp. 137 19,340 United Parcel Service, Inc., Class B 404 36,558
68,452 Airlines - 0.3% Alaska Air Group, Inc. 69 3,482 American Airlines Group, Inc. 223 4,248 Delta Air Lines, Inc. 330 15,223 Southwest Airlines Co. 274 12,656 United Airlines Holdings, Inc.* 126 7,760
43,369 Auto Components - 0.1% Aptiv plc 148 11,560 BorgWarner, Inc. 120 3,792
15,352 Automobiles - 0.3% Ford Motor Co. 2,246 15,632 General Motors Co. 725 22,113 Harley-Davidson, Inc. 87 2,651
40,396 Banks - 5.1% Bank of America Corp. 4,668 133,038 Citigroup, Inc. 1,260 79,960 Citizens Financial Group, Inc. 251 7,954 Comerica, Inc. 84 4,422 Fifth Third Bancorp 407 9,931 First Republic Bank 99 9,956 Huntington Bancshares, Inc. 595 7,301 JPMorgan Chase & Co. 1,809 210,043 KeyCorp 566 9,254 M&T Bank Corp. 78 10,950 People's United Financial, Inc. 256 3,581 PNC Financial Services Group, Inc. (The) 254 32,106 Regions Financial Corp. 555 7,504 SVB Financial Group* 28 5,828 Truist Financial Corp. 772 35,620 US Bancorp 818 37,988 Wells Fargo & Co. 2,218 90,605 Zions Bancorp NA 99 3,955
699,996 Beverages - 2.0% Brown-Forman Corp., Class B 105 6,448 Coca-Cola Co. (The) 2,224 118,962
Investments Shares Value ($) Constellation Brands, Inc., Class A 98 16,893 Molson Coors Beverage Co., Class B 107 5,308 Monster Beverage Corp.* 218 13,606 PepsiCo, Inc. 804 106,152
267,369 Biotechnology - 2.2% AbbVie, Inc. 854 73,196 Alexion Pharmaceuticals, Inc.* 128 12,036 Amgen, Inc. 343 68,507 Biogen, Inc.* 105 32,381 Gilead Sciences, Inc. 729 50,563 Incyte Corp.* 104 7,843 Regeneron Pharmaceuticals, Inc.* 46 20,450 Vertex Pharmaceuticals, Inc.* 149 33,381
298,357 Building Products - 0.3% Allegion plc 53 6,094 AO Smith Corp. 79 3,124 Fortune Brands Home & Security, Inc. 80 4,940 Johnson Controls International plc 444 16,237 Masco Corp. 164 6,777
37,172 Capital Markets - 2.8% Ameriprise Financial, Inc. 72 10,174 Bank of New York Mellon Corp. (The) 485 19,351 BlackRock, Inc. 67 31,022 Cboe Global Markets, Inc. 64 7,296 Charles Schwab Corp. (The) 659 26,854 CME Group, Inc. 208 41,355 E*TRADE Financial Corp. 129 5,906 Franklin Resources, Inc. 160 3,482 Goldman Sachs Group, Inc. (The) 186 37,343 Intercontinental Exchange, Inc. 321 28,640 Invesco Ltd. 214 3,082 MarketAxess Holdings, Inc. 22 7,135 Moody's Corp. 92 22,083 Morgan Stanley 708 31,881 MSCI, Inc. 48 14,181 Nasdaq, Inc. 66 6,768 Northern Trust Corp. 124 10,882 Raymond James Financial, Inc. 70 5,854 S&P Global, Inc. 143 38,025 State Street Corp. 210 14,303 T. Rowe Price Group, Inc. 134 15,813
381,430 Chemicals - 1.8% Air Products & Chemicals, Inc. 128 28,110 Albemarle Corp. 62 5,075 Celanese Corp. 69 6,468 CF Industries Holdings, Inc. 125 4,607 Corteva, Inc. 430 11,696 Dow, Inc. 427 17,255 DuPont de Nemours, Inc. 427 18,318 Eastman Chemical Co. 80 4,921 Ecolab, Inc. 146 26,346 FMC Corp. 73 6,796 International Flavors & Fragrances, Inc.(a) 62 7,426 Linde plc 308 58,831
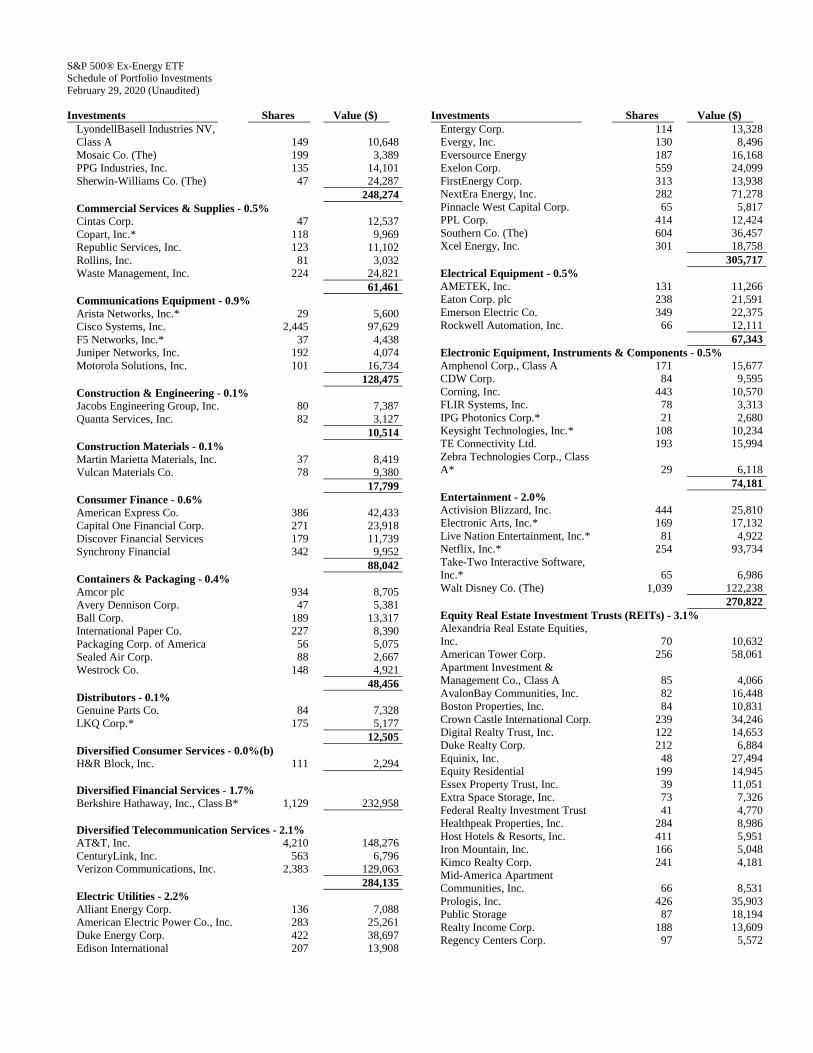
S&P 500® Ex-Energy ETF Schedule of Portfolio Investments February 29, 2020 (Unaudited)
Investments Shares Value ($) LyondellBasell Industries NV, Class A 149 10,648 Mosaic Co. (The) 199 3,389 PPG Industries, Inc. 135 14,101 Sherwin-Williams Co. (The) 47 24,287
248,274 Commercial Services & Supplies - 0.5% Cintas Corp. 47 12,537 Copart, Inc.* 118 9,969 Republic Services, Inc. 123 11,102 Rollins, Inc. 81 3,032 Waste Management, Inc. 224 24,821
61,461 Communications Equipment - 0.9% Arista Networks, Inc.* 29 5,600 Cisco Systems, Inc. 2,445 97,629 F5 Networks, Inc.* 37 4,438 Juniper Networks, Inc. 192 4,074 Motorola Solutions, Inc. 101 16,734
128,475 Construction & Engineering - 0.1% Jacobs Engineering Group, Inc. 80 7,387 Quanta Services, Inc. 82 3,127
10,514 Construction Materials - 0.1% Martin Marietta Materials, Inc. 37 8,419 Vulcan Materials Co. 78 9,380
17,799 Consumer Finance - 0.6% American Express Co. 386 42,433 Capital One Financial Corp. 271 23,918 Discover Financial Services 179 11,739 Synchrony Financial 342 9,952
88,042 Containers & Packaging - 0.4% Amcor plc 934 8,705 Avery Dennison Corp. 47 5,381 Ball Corp. 189 13,317 International Paper Co. 227 8,390 Packaging Corp. of America 56 5,075 Sealed Air Corp. 88 2,667 Westrock Co. 148 4,921
48,456 Distributors - 0.1% Genuine Parts Co. 84 7,328 LKQ Corp.* 175 5,177
12,505 Diversified Consumer Services - 0.0%(b) H&R Block, Inc. 111 2,294
Diversified Financial Services - 1.7% Berkshire Hathaway, Inc., Class B* 1,129 232,958
Diversified Telecommunication Services - 2.1% AT&T, Inc. 4,210 148,276 CenturyLink, Inc. 563 6,796 Verizon Communications, Inc. 2,383 129,063
284,135 Electric Utilities - 2.2% Alliant Energy Corp. 136 7,088 American Electric Power Co., Inc. 283 25,261 Duke Energy Corp. 422 38,697 Edison International 207 13,908
Investments Shares Value ($) Entergy Corp. 114 13,328 Evergy, Inc. 130 8,496 Eversource Energy 187 16,168 Exelon Corp. 559 24,099 FirstEnergy Corp. 313 13,938 NextEra Energy, Inc. 282 71,278 Pinnacle West Capital Corp. 65 5,817 PPL Corp. 414 12,424 Southern Co. (The) 604 36,457 Xcel Energy, Inc. 301 18,758
305,717 Electrical Equipment - 0.5% AMETEK, Inc. 131 11,266 Eaton Corp. plc 238 21,591 Emerson Electric Co. 349 22,375 Rockwell Automation, Inc. 66 12,111
67,343 Electronic Equipment, Instruments & Components - 0.5% Amphenol Corp., Class A 171 15,677 CDW Corp. 84 9,595 Corning, Inc. 443 10,570 FLIR Systems, Inc. 78 3,313 IPG Photonics Corp.* 21 2,680 Keysight Technologies, Inc.* 108 10,234 TE Connectivity Ltd. 193 15,994 Zebra Technologies Corp., Class A* 29 6,118
74,181 Entertainment - 2.0% Activision Blizzard, Inc. 444 25,810 Electronic Arts, Inc.* 169 17,132 Live Nation Entertainment, Inc.* 81 4,922 Netflix, Inc.* 254 93,734 Take-Two Interactive Software, Inc.* 65 6,986 Walt Disney Co. (The) 1,039 122,238
270,822 Equity Real Estate Investment Trusts (REITs) - 3.1% Alexandria Real Estate Equities, Inc. 70 10,632 American Tower Corp. 256 58,061 Apartment Investment & Management Co., Class A 85 4,066 AvalonBay Communities, Inc. 82 16,448 Boston Properties, Inc. 84 10,831 Crown Castle International Corp. 239 34,246 Digital Realty Trust, Inc. 122 14,653 Duke Realty Corp. 212 6,884 Equinix, Inc. 48 27,494 Equity Residential 199 14,945 Essex Property Trust, Inc. 39 11,051 Extra Space Storage, Inc. 73 7,326 Federal Realty Investment Trust 41 4,770 Healthpeak Properties, Inc. 284 8,986 Host Hotels & Resorts, Inc. 411 5,951 Iron Mountain, Inc. 166 5,048 Kimco Realty Corp. 241 4,181 Mid-America Apartment Communities, Inc. 66 8,531 Prologis, Inc. 426 35,903 Public Storage 87 18,194 Realty Income Corp. 188 13,609 Regency Centers Corp. 97 5,572

S&P 500® Ex-Energy ETF Schedule of Portfolio Investments February 29, 2020 (Unaudited)
Investments Shares Value ($) SBA Communications Corp. 65 17,231 Simon Property Group, Inc. 176 21,662 SL Green Realty Corp. 46 3,608 UDR, Inc. 169 7,602 Ventas, Inc. 214 11,507 Vornado Realty Trust 89 4,769 Welltower, Inc. 234 17,508 Weyerhaeuser Co. 428 11,120
422,389 Food & Staples Retailing - 1.6% Costco Wholesale Corp. 256 71,972 Kroger Co. (The) 463 13,024 Sysco Corp. 295 19,662 Walgreens Boots Alliance, Inc. 431 19,723 Walmart, Inc. 818 88,082
212,463 Food Products - 1.2% Archer-Daniels-Midland Co. 321 12,085 Campbell Soup Co. 98 4,422 Conagra Brands, Inc. 280 7,473 General Mills, Inc. 347 17,003 Hershey Co. (The) 86 12,383 Hormel Foods Corp. 158 6,573 JM Smucker Co. (The) 66 6,797 Kellogg Co. 144 8,708 Kraft Heinz Co. (The) 360 8,917 Lamb Weston Holdings, Inc. 85 7,386 McCormick & Co., Inc. (Non-Voting) 70 10,233 Mondelez International, Inc., Class A 831 43,877 Tyson Foods, Inc., Class A 171 11,599
157,456 Gas Utilities - 0.1% Atmos Energy Corp. 68 7,021
Health Care Equipment & Supplies - 3.6% Abbott Laboratories 1,018 78,417 ABIOMED, Inc.* 25 3,757 Align Technology, Inc.* 42 9,171 Baxter International, Inc. 295 24,624 Becton Dickinson and Co. 155 36,862 Boston Scientific Corp.* 802 29,987 Cooper Cos., Inc. (The) 27 8,763 Danaher Corp. 368 53,205 DENTSPLY SIRONA, Inc. 128 6,303 Edwards Lifesciences Corp.* 122 24,990 Hologic, Inc.* 153 7,209 IDEXX Laboratories, Inc.* 48 12,216 Intuitive Surgical, Inc.* 66 35,241 Medtronic plc 773 77,818 ResMed, Inc. 84 13,353 STERIS plc 48 7,614 Stryker Corp. 187 35,640 Teleflex, Inc. 26 8,711 Varian Medical Systems, Inc.* 51 6,271 Zimmer Biomet Holdings, Inc. 121 16,474
496,626 Health Care Providers & Services - 2.8% AmerisourceBergen Corp. 87 7,336 Anthem, Inc. 147 37,792 Cardinal Health, Inc. 168 8,756 Centene Corp.* 336 17,815
Investments Shares Value ($) Cigna Corp. 215 39,332 CVS Health Corp. 750 44,385 DaVita, Inc.* 50 3,881 HCA Healthcare, Inc. 152 19,306 Henry Schein, Inc.* 84 5,119 Humana, Inc. 78 24,935 Laboratory Corp. of America Holdings* 58 10,190 McKesson Corp. 105 14,685 Quest Diagnostics, Inc. 79 8,379 UnitedHealth Group, Inc. 545 138,953 Universal Health Services, Inc., Class B 46 5,692
386,556 Health Care Technology - 0.1% Cerner Corp. 179 12,399
Hotels, Restaurants & Leisure - 1.9% Carnival Corp. 231 7,729 Chipotle Mexican Grill, Inc.* 16 12,377 Darden Restaurants, Inc. 70 6,825 Hilton Worldwide Holdings, Inc. 165 16,038 Las Vegas Sands Corp. 194 11,312 Marriott International, Inc., Class A 156 19,344 McDonald's Corp. 433 84,076 MGM Resorts International 297 7,294 Norwegian Cruise Line Holdings Ltd.* 123 4,583 Royal Caribbean Cruises Ltd. 101 8,122 Starbucks Corp. 682 53,489 Wynn Resorts Ltd. 57 6,155 Yum! Brands, Inc. 174 15,530
252,874 Household Durables - 0.4% DR Horton, Inc. 193 10,281 Garmin Ltd. 84 7,425 Leggett & Platt, Inc. 77 3,054 Lennar Corp., Class A 163 9,836 Mohawk Industries, Inc.* 36 4,361 Newell Brands, Inc. 218 3,364 NVR, Inc.* 2 7,334 PulteGroup, Inc. 147 5,909 Whirlpool Corp. 38 4,859
56,423 Household Products - 1.8% Church & Dwight Co., Inc. 142 9,872 Clorox Co. (The) 71 11,319 Colgate-Palmolive Co. 494 33,379 Kimberly-Clark Corp. 197 25,844 Procter & Gamble Co. (The) 1,438 162,825
243,239 Independent Power and Renewable Electricity Producers - 0.1% AES Corp. 382 6,391 NRG Energy, Inc. 145 4,815
11,206 Industrial Conglomerates - 1.4% 3M Co. 330 49,249 General Electric Co. 5,035 54,781 Honeywell International, Inc. 411 66,652 Roper Technologies, Inc. 61 21,454
192,136 Insurance - 2.3% Aflac, Inc. 424 18,168

S&P 500® Ex-Energy ETF Schedule of Portfolio Investments February 29, 2020 (Unaudited)
Investments Shares Value ($) Allstate Corp. (The) 188 19,787 American International Group, Inc. 500 21,080 Aon plc 134 27,872 Arthur J Gallagher & Co. 108 10,529 Assurant, Inc. 36 4,341 Chubb Ltd. 261 37,853 Cincinnati Financial Corp. 87 8,112 Everest Re Group Ltd. 23 5,701 Globe Life, Inc. 59 5,467 Hartford Financial Services Group, Inc. (The) 208 10,389 Lincoln National Corp. 112 5,084 Loews Corp. 147 6,708 Marsh & McLennan Cos., Inc. 293 30,636 MetLife, Inc. 450 19,224 Principal Financial Group, Inc. 148 6,570 Progressive Corp. (The) 338 24,728 Prudential Financial, Inc. 233 17,580 Travelers Cos., Inc. (The) 149 17,852 Unum Group 120 2,797 Willis Towers Watson plc 72 13,626 WR Berkley Corp. 83 5,573
319,677 Interactive Media & Services - 5.4% Alphabet, Inc., Class A* 173 231,690 Alphabet, Inc., Class C* 172 230,365 Facebook, Inc., Class A* 1,389 267,341 Twitter, Inc.* 447 14,840
744,236 Internet & Direct Marketing Retail - 3.8% Amazon.com, Inc.* 240 452,100 Booking Holdings, Inc.* 24 40,696 eBay, Inc. 441 15,276 Expedia Group, Inc. 82 8,087
516,159 IT Services - 5.8% Accenture plc, Class A 366 66,096 Akamai Technologies, Inc.* 92 7,959 Alliance Data Systems Corp. 23 1,975 Automatic Data Processing, Inc. 251 38,840 Broadridge Financial Solutions, Inc. 66 6,888 Cognizant Technology Solutions Corp., Class A 316 19,254 DXC Technology Co. 147 3,544 Fidelity National Information Services, Inc. 357 49,880 Fiserv, Inc.* 328 35,870 FleetCor Technologies, Inc.* 49 13,024 Gartner, Inc.* 50 6,469 Global Payments, Inc. 173 31,827 International Business Machines Corp. 511 66,507 Jack Henry & Associates, Inc. 44 6,676 Leidos Holdings, Inc. 79 8,109 Mastercard, Inc., Class A 512 148,608 Paychex, Inc. 186 14,411 PayPal Holdings, Inc.* 679 73,325 VeriSign, Inc.* 61 11,575 Visa, Inc., Class A 987 179,397 Western Union Co. (The) 240 5,374
795,608
Investments Shares Value ($) Leisure Products - 0.0%(b) Hasbro, Inc. 72 5,562
Life Sciences Tools & Services - 1.0% Agilent Technologies, Inc. 177 13,641 Illumina, Inc.* 85 22,582 IQVIA Holdings, Inc.* 105 14,646 Mettler-Toledo International, Inc.* 15 10,526 PerkinElmer, Inc. 64 5,532 Thermo Fisher Scientific, Inc. 232 67,466 Waters Corp.* 38 7,406
141,799 Machinery - 1.6% Caterpillar, Inc. 320 39,757 Cummins, Inc. 88 13,314 Deere & Co. 180 28,166 Dover Corp. 84 8,630 Flowserve Corp. 76 3,054 Fortive Corp. 170 11,757 IDEX Corp. 44 6,512 Illinois Tool Works, Inc. 169 28,355 Ingersoll-Rand plc 137 17,679 PACCAR, Inc. 198 13,246 Parker-Hannifin Corp. 72 13,303 Pentair plc 98 3,860 Snap-on, Inc. 30 4,343 Stanley Black & Decker, Inc. 87 12,502 Westinghouse Air Brake Technologies Corp. 106 7,282 Xylem, Inc. 105 8,121
219,881 Media - 1.4% Charter Communications, Inc., Class A* 90 44,385 Comcast Corp., Class A 2,617 105,805 Discovery, Inc., Class A* 89 2,287 Discovery, Inc., Class C* 193 4,844 DISH Network Corp., Class A* 148 4,961 Fox Corp., Class A 206 6,333 Fox Corp., Class B 91 2,771 Interpublic Group of Cos., Inc. (The) 221 4,721 News Corp., Class A 222 2,681 News Corp., Class B 68 846 Omnicom Group, Inc. 126 8,729 ViacomCBS, Inc. 313 7,703
196,066 Metals & Mining - 0.3% Freeport-McMoRan, Inc. 836 8,327 Newmont Corp. 471 21,021 Nucor Corp. 173 7,153
36,501 Multiline Retail - 0.5% Dollar General Corp. 148 22,244 Dollar Tree, Inc.* 135 11,209 Kohl's Corp. 89 3,484 Macy's, Inc. 176 2,329 Nordstrom, Inc. 61 2,117 Target Corp. 294 30,282
71,665 Multi-Utilities - 1.1% Ameren Corp. 143 11,297 CenterPoint Energy, Inc. 289 6,653

S&P 500® Ex-Energy ETF Schedule of Portfolio Investments February 29, 2020 (Unaudited)
Investments Shares Value ($) CMS Energy Corp. 164 9,909 Consolidated Edison, Inc. 192 15,133 Dominion Energy, Inc. 474 37,057 DTE Energy Co. 110 12,284 NiSource, Inc. 215 5,809 Public Service Enterprise Group, Inc. 293 15,034 Sempra Energy 164 22,924 WEC Energy Group, Inc. 181 16,712
152,812 Personal Products - 0.2% Coty, Inc., Class A 170 1,569 Estee Lauder Cos., Inc. (The), Class A 129 23,685
25,254 Pharmaceuticals - 4.7% Allergan plc 190 36,227 Bristol-Myers Squibb Co. 1,351 79,790 Eli Lilly & Co. 488 61,551 Johnson & Johnson 1,519 204,275 Merck & Co., Inc. 1,467 112,314 Mylan NV* 298 5,123 Perrigo Co. plc 79 4,005 Pfizer, Inc. 3,191 106,643 Zoetis, Inc. 276 36,771
646,699 Professional Services - 0.4% Equifax, Inc. 69 9,801 IHS Markit Ltd. 231 16,457 Nielsen Holdings plc 206 3,751 Robert Half International, Inc. 66 3,327 Verisk Analytics, Inc. 93 14,425
47,761 Real Estate Management & Development - 0.1% CBRE Group, Inc., Class A* 192 10,779
Road & Rail - 1.1% CSX Corp. 448 31,562 JB Hunt Transport Services, Inc. 48 4,629 Kansas City Southern 59 8,890 Norfolk Southern Corp. 151 27,535 Old Dominion Freight Line, Inc. 38 7,364 Union Pacific Corp. 401 64,084
144,064 Semiconductors & Semiconductor Equipment - 4.5% Advanced Micro Devices, Inc.* 674 30,653 Analog Devices, Inc. 213 23,228 Applied Materials, Inc. 533 30,978 Broadcom, Inc. 230 62,703 Intel Corp. 2,508 139,244 KLA Corp. 90 13,834 Lam Research Corp. 84 24,648 Maxim Integrated Products, Inc. 154 8,565 Microchip Technology, Inc. 136 12,337 Micron Technology, Inc.* 638 33,533 NVIDIA Corp. 352 95,065 Qorvo, Inc.* 67 6,739 QUALCOMM, Inc. 660 51,678 Skyworks Solutions, Inc. 100 10,018 Texas Instruments, Inc. 538 61,407 Xilinx, Inc. 146 12,190
616,820
Investments Shares Value ($) Software - 8.2% Adobe, Inc.* 279 96,288 ANSYS, Inc.* 48 11,625 Autodesk, Inc.* 127 24,242 Cadence Design Systems, Inc.* 163 10,781 Citrix Systems, Inc. 70 7,237 Fortinet, Inc.* 83 8,471 Intuit, Inc. 150 39,878 Microsoft Corp. 4,400 712,844 NortonLifeLock, Inc. 328 6,242 Oracle Corp. 1,248 61,726 Paycom Software, Inc.* 28 7,914 salesforce.com, Inc.* 512 87,245 ServiceNow, Inc.* 109 35,544 Synopsys, Inc.* 87 12,000
1,122,037 Specialty Retail - 2.4% Advance Auto Parts, Inc. 41 5,452 AutoZone, Inc.* 15 15,488 Best Buy Co., Inc. 131 9,910 CarMax, Inc.* 93 8,120 Gap, Inc. (The) 123 1,763 Home Depot, Inc. (The) 628 136,803 L Brands, Inc. 132 2,859 Lowe's Cos., Inc. 443 47,210 O'Reilly Automotive, Inc.* 44 16,224 Ross Stores, Inc. 210 22,844 Tiffany & Co. 63 8,416 TJX Cos., Inc. (The) 701 41,920 Tractor Supply Co. 68 6,019 Ulta Beauty, Inc.* 35 8,998
332,026 Technology Hardware, Storage & Peripherals - 5.2% Apple, Inc. 2,408 658,251 Hewlett Packard Enterprise Co. 746 9,541 HP, Inc. 854 17,755 NetApp, Inc. 130 6,074 Seagate Technology plc 132 6,329 Western Digital Corp. 171 9,501 Xerox Holdings Corp. 106 3,413
710,864 Textiles, Apparel & Luxury Goods - 0.7% Capri Holdings Ltd.* 86 2,220 Hanesbrands, Inc. 209 2,767 NIKE, Inc., Class B 718 64,175 PVH Corp. 43 3,187 Ralph Lauren Corp. 27 2,849 Tapestry, Inc. 157 3,682 Under Armour, Inc., Class A* 107 1,518 Under Armour, Inc., Class C* 110 1,373 VF Corp. 190 13,680
95,451 Tobacco - 0.9% Altria Group, Inc. 1,076 43,438 Philip Morris International, Inc. 898 73,519
116,957 Trading Companies & Distributors - 0.2% Fastenal Co. 328 11,224 United Rentals, Inc.* 43 5,697 WW Grainger, Inc. 25 6,938
23,859

S&P 500® Ex-Energy ETF Schedule of Portfolio Investments February 29, 2020 (Unaudited)
Investments Shares Value ($) Water Utilities - 0.1% American Water Works Co., Inc. 105 12,984
Wireless Telecommunication Services - 0.1% T-Mobile US, Inc.* 183 16,499
TOTAL COMMON STOCKS (Cost $13,901,890) 13,614,909 SECURITIES LENDING REINVESTMENTS(c) - 0.0%(b) INVESTMENT COMPANIES - 0.0%(b)
BlackRock Liquidity FedFund, Institutional Class 1.49% (Cost $6,612) 6,612 6,612
Investments Principal
Amount ($) Value ($) SHORT-TERM INVESTMENTS - 0.2% REPURCHASE AGREEMENTS(d) - 0.2% Repurchase Agreements with various
counterparties, rates 1.58% - 1.59%, dated 2/28/2020, due 3/2/2020, total to be received $27,414
(Cost $27,410) 27,410 27,410 Total Investments - 99.9%
(Cost $13,935,912) 13,648,931 Other Assets Less Liabilities - 0.1% 12,430 Net Assets - 100.0% 13,661,361
* Non-income producing security. (a) The security or a portion of this security is on loan at February
29, 2020. The total value of securities on loan at February 29, 2020 was $6,348, collateralized in the form of cash with a value of $6,612 that was reinvested in the securities shown in the Securities Lending Reinvestment section of the Schedule of Investments.
(b) Represents less than 0.05% of net assets. (c) The security was purchased with cash collateral held from
securities on loan at February 29, 2020. The total value of securities purchased was $6,612.
(d) The Fund invests in Repurchase Agreements jointly with other funds in the Trust. See "Repurchase Agreements" in the Notes to Schedules of Portfolio of Investments to view the details of each individual agreement and counterparty as well as a description of the securities subject to repurchase.
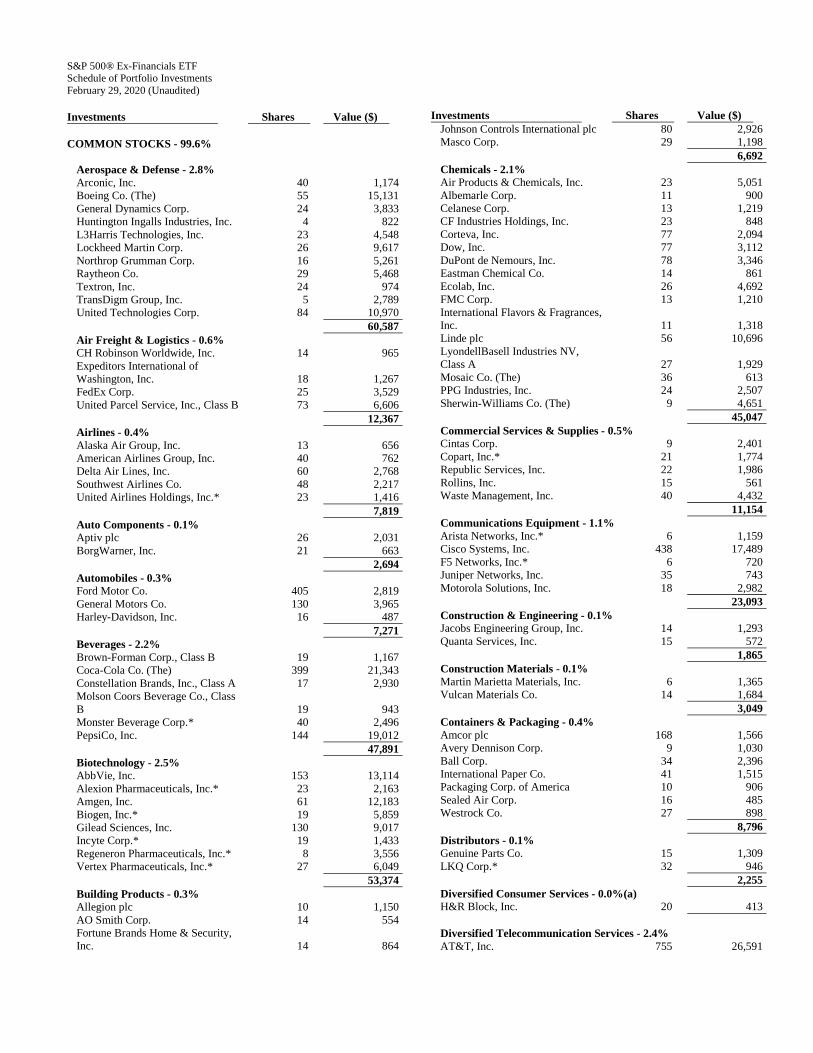
S&P 500® Ex-Financials ETF Schedule of Portfolio Investments February 29, 2020 (Unaudited)
Investments Shares Value ($) COMMON STOCKS - 99.6%
Aerospace & Defense - 2.8% Arconic, Inc. 40 1,174 Boeing Co. (The) 55 15,131 General Dynamics Corp. 24 3,833 Huntington Ingalls Industries, Inc. 4 822 L3Harris Technologies, Inc. 23 4,548 Lockheed Martin Corp. 26 9,617 Northrop Grumman Corp. 16 5,261 Raytheon Co. 29 5,468 Textron, Inc. 24 974 TransDigm Group, Inc. 5 2,789 United Technologies Corp. 84 10,970
60,587 Air Freight & Logistics - 0.6% CH Robinson Worldwide, Inc. 14 965 Expeditors International of Washington, Inc. 18 1,267 FedEx Corp. 25 3,529 United Parcel Service, Inc., Class B 73 6,606
12,367 Airlines - 0.4% Alaska Air Group, Inc. 13 656 American Airlines Group, Inc. 40 762 Delta Air Lines, Inc. 60 2,768 Southwest Airlines Co. 48 2,217 United Airlines Holdings, Inc.* 23 1,416
7,819 Auto Components - 0.1% Aptiv plc 26 2,031 BorgWarner, Inc. 21 663
2,694 Automobiles - 0.3% Ford Motor Co. 405 2,819 General Motors Co. 130 3,965 Harley-Davidson, Inc. 16 487
7,271 Beverages - 2.2% Brown-Forman Corp., Class B 19 1,167 Coca-Cola Co. (The) 399 21,343 Constellation Brands, Inc., Class A 17 2,930 Molson Coors Beverage Co., Class B 19 943 Monster Beverage Corp.* 40 2,496 PepsiCo, Inc. 144 19,012
47,891 Biotechnology - 2.5% AbbVie, Inc. 153 13,114 Alexion Pharmaceuticals, Inc.* 23 2,163 Amgen, Inc. 61 12,183 Biogen, Inc.* 19 5,859 Gilead Sciences, Inc. 130 9,017 Incyte Corp.* 19 1,433 Regeneron Pharmaceuticals, Inc.* 8 3,556 Vertex Pharmaceuticals, Inc.* 27 6,049
53,374 Building Products - 0.3% Allegion plc 10 1,150 AO Smith Corp. 14 554 Fortune Brands Home & Security, Inc. 14 864
Investments Shares Value ($) Johnson Controls International plc 80 2,926 Masco Corp. 29 1,198
6,692 Chemicals - 2.1% Air Products & Chemicals, Inc. 23 5,051 Albemarle Corp. 11 900 Celanese Corp. 13 1,219 CF Industries Holdings, Inc. 23 848 Corteva, Inc. 77 2,094 Dow, Inc. 77 3,112 DuPont de Nemours, Inc. 78 3,346 Eastman Chemical Co. 14 861 Ecolab, Inc. 26 4,692 FMC Corp. 13 1,210 International Flavors & Fragrances, Inc. 11 1,318 Linde plc 56 10,696 LyondellBasell Industries NV, Class A 27 1,929 Mosaic Co. (The) 36 613 PPG Industries, Inc. 24 2,507 Sherwin-Williams Co. (The) 9 4,651
45,047 Commercial Services & Supplies - 0.5% Cintas Corp. 9 2,401 Copart, Inc.* 21 1,774 Republic Services, Inc. 22 1,986 Rollins, Inc. 15 561 Waste Management, Inc. 40 4,432
11,154 Communications Equipment - 1.1% Arista Networks, Inc.* 6 1,159 Cisco Systems, Inc. 438 17,489 F5 Networks, Inc.* 6 720 Juniper Networks, Inc. 35 743 Motorola Solutions, Inc. 18 2,982
23,093 Construction & Engineering - 0.1% Jacobs Engineering Group, Inc. 14 1,293 Quanta Services, Inc. 15 572
1,865 Construction Materials - 0.1% Martin Marietta Materials, Inc. 6 1,365 Vulcan Materials Co. 14 1,684
3,049 Containers & Packaging - 0.4% Amcor plc 168 1,566 Avery Dennison Corp. 9 1,030 Ball Corp. 34 2,396 International Paper Co. 41 1,515 Packaging Corp. of America 10 906 Sealed Air Corp. 16 485 Westrock Co. 27 898
8,796 Distributors - 0.1% Genuine Parts Co. 15 1,309 LKQ Corp.* 32 946
2,255 Diversified Consumer Services - 0.0%(a) H&R Block, Inc. 20 413
Diversified Telecommunication Services - 2.4% AT&T, Inc. 755 26,591

S&P 500® Ex-Financials ETF Schedule of Portfolio Investments February 29, 2020 (Unaudited)
Investments Shares Value ($) CenturyLink, Inc. 102 1,231 Verizon Communications, Inc. 428 23,181
51,003 Electric Utilities - 2.6% Alliant Energy Corp. 25 1,303 American Electric Power Co., Inc. 51 4,552 Duke Energy Corp. 75 6,878 Edison International 37 2,486 Entergy Corp. 21 2,455 Evergy, Inc. 24 1,568 Eversource Energy 34 2,940 Exelon Corp. 101 4,354 FirstEnergy Corp. 55 2,449 NextEra Energy, Inc. 51 12,891 Pinnacle West Capital Corp. 12 1,074 PPL Corp. 75 2,251 Southern Co. (The) 108 6,519 Xcel Energy, Inc. 54 3,365
55,085 Electrical Equipment - 0.6% AMETEK, Inc. 24 2,064 Eaton Corp. plc 43 3,901 Emerson Electric Co. 63 4,039 Rockwell Automation, Inc. 12 2,202
12,206 Electronic Equipment, Instruments & Components - 0.6% Amphenol Corp., Class A 31 2,842 CDW Corp. 15 1,713 Corning, Inc. 80 1,909 FLIR Systems, Inc. 14 595 IPG Photonics Corp.* 4 511 Keysight Technologies, Inc.* 19 1,800 TE Connectivity Ltd. 35 2,900 Zebra Technologies Corp., Class A* 6 1,266
13,536 Energy Equipment & Services - 0.4% Baker Hughes Co. 67 1,078 Halliburton Co. 91 1,543 Helmerich & Payne, Inc. 11 406 National Oilwell Varco, Inc. 40 749 Schlumberger Ltd. 143 3,874 TechnipFMC plc 43 638
8,288 Entertainment - 2.3% Activision Blizzard, Inc. 79 4,592 Electronic Arts, Inc.* 30 3,041 Live Nation Entertainment, Inc.* 15 912 Netflix, Inc.* 45 16,606 Take-Two Interactive Software, Inc.* 12 1,290 Walt Disney Co. (The) 187 22,001
48,442 Food & Staples Retailing - 1.8% Costco Wholesale Corp. 46 12,932 Kroger Co. (The) 83 2,335 Sysco Corp. 53 3,533 Walgreens Boots Alliance, Inc. 78 3,569 Walmart, Inc. 147 15,829
38,198 Food Products - 1.3% Archer-Daniels-Midland Co. 58 2,184 Campbell Soup Co. 16 722
Investments Shares Value ($) Conagra Brands, Inc. 50 1,335 General Mills, Inc. 62 3,038 Hershey Co. (The) 15 2,160 Hormel Foods Corp. 29 1,206 JM Smucker Co. (The) 12 1,236 Kellogg Co. 26 1,572 Kraft Heinz Co. (The) 64 1,585 Lamb Weston Holdings, Inc. 15 1,303 McCormick & Co., Inc. (Non-Voting) 13 1,901 Mondelez International, Inc., Class A 149 7,867 Tyson Foods, Inc., Class A 31 2,103
28,212 Gas Utilities - 0.1% Atmos Energy Corp. 12 1,239
Health Care Equipment & Supplies - 4.2% Abbott Laboratories 182 14,019 ABIOMED, Inc.* 5 751 Align Technology, Inc.* 7 1,528 Baxter International, Inc. 53 4,424 Becton Dickinson and Co. 28 6,659 Boston Scientific Corp.* 144 5,384 Cooper Cos., Inc. (The) 5 1,623 Danaher Corp. 66 9,542 DENTSPLY SIRONA, Inc. 23 1,133 Edwards Lifesciences Corp.* 22 4,507 Hologic, Inc.* 28 1,319 IDEXX Laboratories, Inc.* 9 2,291 Intuitive Surgical, Inc.* 12 6,408 Medtronic plc 139 13,993 ResMed, Inc. 15 2,384 STERIS plc 9 1,428 Stryker Corp. 33 6,289 Teleflex, Inc. 5 1,675 Varian Medical Systems, Inc.* 9 1,107 Zimmer Biomet Holdings, Inc. 21 2,859
89,323 Health Care Providers & Services - 3.2% AmerisourceBergen Corp. 16 1,349 Anthem, Inc. 26 6,684 Cardinal Health, Inc. 29 1,511 Centene Corp.* 60 3,181 Cigna Corp. 39 7,135 CVS Health Corp. 134 7,930 DaVita, Inc.* 9 699 HCA Healthcare, Inc. 27 3,429 Henry Schein, Inc.* 15 914 Humana, Inc. 14 4,476 Laboratory Corp. of America Holdings* 10 1,757 McKesson Corp. 19 2,657 Quest Diagnostics, Inc. 14 1,485 UnitedHealth Group, Inc. 98 24,986 Universal Health Services, Inc., Class B 8 990
69,183 Health Care Technology - 0.1% Cerner Corp. 33 2,286
Hotels, Restaurants & Leisure - 2.1% Carnival Corp. 41 1,372
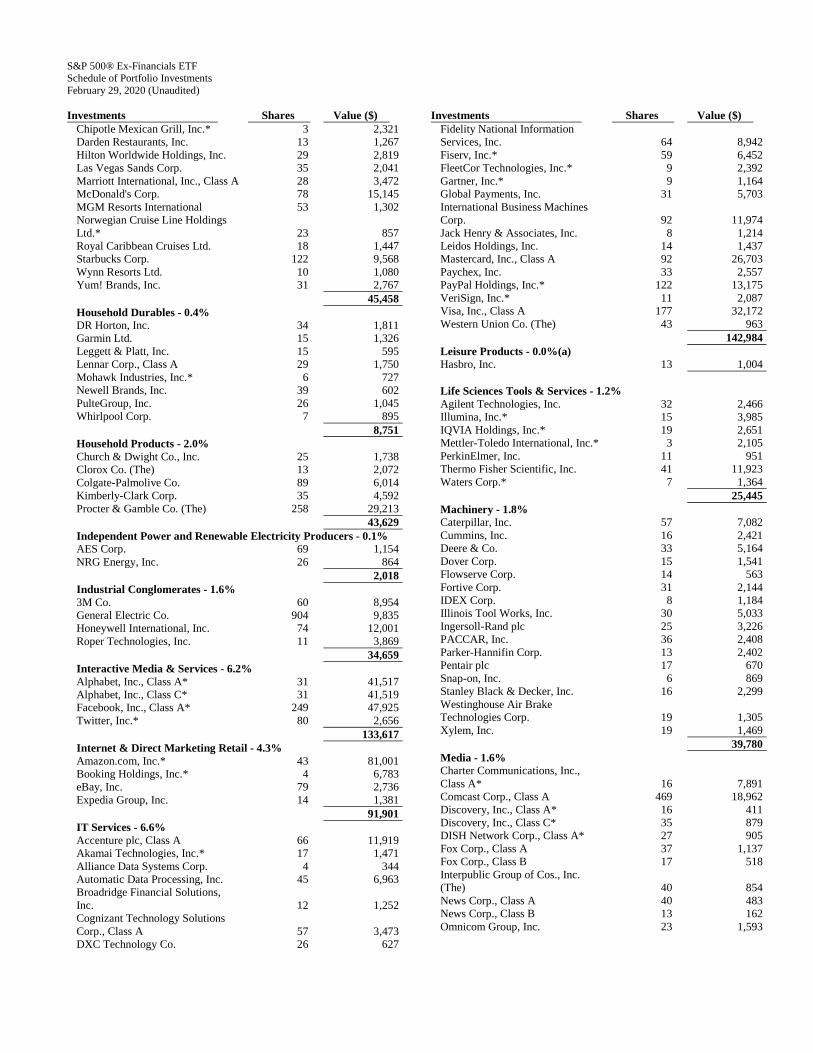
S&P 500® Ex-Financials ETF Schedule of Portfolio Investments February 29, 2020 (Unaudited)
Investments Shares Value ($) Chipotle Mexican Grill, Inc.* 3 2,321 Darden Restaurants, Inc. 13 1,267 Hilton Worldwide Holdings, Inc. 29 2,819 Las Vegas Sands Corp. 35 2,041 Marriott International, Inc., Class A 28 3,472 McDonald's Corp. 78 15,145 MGM Resorts International 53 1,302 Norwegian Cruise Line Holdings Ltd.* 23 857 Royal Caribbean Cruises Ltd. 18 1,447 Starbucks Corp. 122 9,568 Wynn Resorts Ltd. 10 1,080 Yum! Brands, Inc. 31 2,767
45,458 Household Durables - 0.4% DR Horton, Inc. 34 1,811 Garmin Ltd. 15 1,326 Leggett & Platt, Inc. 15 595 Lennar Corp., Class A 29 1,750 Mohawk Industries, Inc.* 6 727 Newell Brands, Inc. 39 602 PulteGroup, Inc. 26 1,045 Whirlpool Corp. 7 895
8,751 Household Products - 2.0% Church & Dwight Co., Inc. 25 1,738 Clorox Co. (The) 13 2,072 Colgate-Palmolive Co. 89 6,014 Kimberly-Clark Corp. 35 4,592 Procter & Gamble Co. (The) 258 29,213
43,629 Independent Power and Renewable Electricity Producers - 0.1% AES Corp. 69 1,154 NRG Energy, Inc. 26 864
2,018 Industrial Conglomerates - 1.6% 3M Co. 60 8,954 General Electric Co. 904 9,835 Honeywell International, Inc. 74 12,001 Roper Technologies, Inc. 11 3,869
34,659 Interactive Media & Services - 6.2% Alphabet, Inc., Class A* 31 41,517 Alphabet, Inc., Class C* 31 41,519 Facebook, Inc., Class A* 249 47,925 Twitter, Inc.* 80 2,656
133,617 Internet & Direct Marketing Retail - 4.3% Amazon.com, Inc.* 43 81,001 Booking Holdings, Inc.* 4 6,783 eBay, Inc. 79 2,736 Expedia Group, Inc. 14 1,381
91,901 IT Services - 6.6% Accenture plc, Class A 66 11,919 Akamai Technologies, Inc.* 17 1,471 Alliance Data Systems Corp. 4 344 Automatic Data Processing, Inc. 45 6,963 Broadridge Financial Solutions, Inc. 12 1,252 Cognizant Technology Solutions Corp., Class A 57 3,473 DXC Technology Co. 26 627
Investments Shares Value ($) Fidelity National Information Services, Inc. 64 8,942 Fiserv, Inc.* 59 6,452 FleetCor Technologies, Inc.* 9 2,392 Gartner, Inc.* 9 1,164 Global Payments, Inc. 31 5,703 International Business Machines Corp. 92 11,974 Jack Henry & Associates, Inc. 8 1,214 Leidos Holdings, Inc. 14 1,437 Mastercard, Inc., Class A 92 26,703 Paychex, Inc. 33 2,557 PayPal Holdings, Inc.* 122 13,175 VeriSign, Inc.* 11 2,087 Visa, Inc., Class A 177 32,172 Western Union Co. (The) 43 963
142,984 Leisure Products - 0.0%(a) Hasbro, Inc. 13 1,004
Life Sciences Tools & Services - 1.2% Agilent Technologies, Inc. 32 2,466 Illumina, Inc.* 15 3,985 IQVIA Holdings, Inc.* 19 2,651 Mettler-Toledo International, Inc.* 3 2,105 PerkinElmer, Inc. 11 951 Thermo Fisher Scientific, Inc. 41 11,923 Waters Corp.* 7 1,364
25,445 Machinery - 1.8% Caterpillar, Inc. 57 7,082 Cummins, Inc. 16 2,421 Deere & Co. 33 5,164 Dover Corp. 15 1,541 Flowserve Corp. 14 563 Fortive Corp. 31 2,144 IDEX Corp. 8 1,184 Illinois Tool Works, Inc. 30 5,033 Ingersoll-Rand plc 25 3,226 PACCAR, Inc. 36 2,408 Parker-Hannifin Corp. 13 2,402 Pentair plc 17 670 Snap-on, Inc. 6 869 Stanley Black & Decker, Inc. 16 2,299 Westinghouse Air Brake Technologies Corp. 19 1,305 Xylem, Inc. 19 1,469
39,780 Media - 1.6% Charter Communications, Inc., Class A* 16 7,891 Comcast Corp., Class A 469 18,962 Discovery, Inc., Class A* 16 411 Discovery, Inc., Class C* 35 879 DISH Network Corp., Class A* 27 905 Fox Corp., Class A 37 1,137 Fox Corp., Class B 17 518 Interpublic Group of Cos., Inc. (The) 40 854 News Corp., Class A 40 483 News Corp., Class B 13 162 Omnicom Group, Inc. 23 1,593

S&P 500® Ex-Financials ETF Schedule of Portfolio Investments February 29, 2020 (Unaudited)
Investments Shares Value ($) ViacomCBS, Inc. 56 1,378
35,173 Metals & Mining - 0.3% Freeport-McMoRan, Inc. 150 1,494 Newmont Corp. 85 3,794 Nucor Corp. 32 1,323
6,611 Multiline Retail - 0.6% Dollar General Corp. 26 3,908 Dollar Tree, Inc.* 24 1,993 Kohl's Corp. 16 626 Macy's, Inc. 32 423 Nordstrom, Inc. 11 382 Target Corp. 52 5,356
12,688 Multi-Utilities - 1.3% Ameren Corp. 25 1,975 CenterPoint Energy, Inc. 52 1,197 CMS Energy Corp. 29 1,752 Consolidated Edison, Inc. 34 2,680 Dominion Energy, Inc. 85 6,645 DTE Energy Co. 20 2,233 NiSource, Inc. 39 1,054 Public Service Enterprise Group, Inc. 52 2,668 Sempra Energy 29 4,054 WEC Energy Group, Inc. 33 3,047
27,305 Oil, Gas & Consumable Fuels - 3.8% Apache Corp. 39 972 Cabot Oil & Gas Corp. 42 585 Chevron Corp. 195 18,201 Cimarex Energy Co. 12 397 Concho Resources, Inc. 21 1,428 ConocoPhillips 114 5,520 Devon Energy Corp. 40 650 Diamondback Energy, Inc. 17 1,054 EOG Resources, Inc. 60 3,796 Exxon Mobil Corp. 438 22,531 Hess Corp. 27 1,517 HollyFrontier Corp. 16 539 Kinder Morgan, Inc. 201 3,853 Marathon Oil Corp. 83 687 Marathon Petroleum Corp. 67 3,177 Noble Energy, Inc. 49 776 Occidental Petroleum Corp. 92 3,012 ONEOK, Inc. 43 2,869 Phillips 66 46 3,444 Pioneer Natural Resources Co. 17 2,087 Valero Energy Corp. 42 2,782 Williams Cos., Inc. (The) 125 2,381
82,258 Personal Products - 0.2% Coty, Inc., Class A 31 286 Estee Lauder Cos., Inc. (The), Class A 23 4,223
4,509 Pharmaceuticals - 5.4% Allergan plc 34 6,483 Bristol-Myers Squibb Co. 243 14,352 Eli Lilly & Co. 87 10,973 Johnson & Johnson 272 36,578 Merck & Co., Inc. 263 20,135
Investments Shares Value ($) Mylan NV* 53 911 Perrigo Co. plc 14 710 Pfizer, Inc. 573 19,150 Zoetis, Inc. 49 6,528
115,820 Professional Services - 0.4% Equifax, Inc. 13 1,846 IHS Markit Ltd. 41 2,921 Nielsen Holdings plc 37 674 Robert Half International, Inc. 12 605 Verisk Analytics, Inc. 17 2,637
8,683 Road & Rail - 1.2% CSX Corp. 80 5,636 JB Hunt Transport Services, Inc. 9 868 Kansas City Southern 10 1,507 Norfolk Southern Corp. 27 4,923 Old Dominion Freight Line, Inc. 7 1,357 Union Pacific Corp. 72 11,506
25,797 Semiconductors & Semiconductor Equipment - 5.1% Advanced Micro Devices, Inc.* 122 5,549 Analog Devices, Inc. 38 4,144 Applied Materials, Inc. 95 5,521 Broadcom, Inc. 41 11,178 Intel Corp. 450 24,984 KLA Corp. 16 2,459 Lam Research Corp. 15 4,402 Maxim Integrated Products, Inc. 28 1,557 Microchip Technology, Inc. 25 2,268 Micron Technology, Inc.* 115 6,044 NVIDIA Corp. 63 17,014 Qorvo, Inc.* 12 1,207 QUALCOMM, Inc. 118 9,239 Skyworks Solutions, Inc. 18 1,803 Texas Instruments, Inc. 97 11,072 Xilinx, Inc. 26 2,171
110,612 Software - 9.4% Adobe, Inc.* 50 17,256 ANSYS, Inc.* 9 2,179 Autodesk, Inc.* 23 4,390 Cadence Design Systems, Inc.* 29 1,918 Citrix Systems, Inc. 13 1,344 Fortinet, Inc.* 15 1,531 Intuit, Inc. 27 7,178 Microsoft Corp. 789 127,826 NortonLifeLock, Inc. 59 1,123 Oracle Corp. 224 11,079 Paycom Software, Inc.* 5 1,413 salesforce.com, Inc.* 92 15,677 ServiceNow, Inc.* 20 6,522 Synopsys, Inc.* 16 2,207
201,643 Specialty Retail - 2.7% Advance Auto Parts, Inc. 7 931 AutoZone, Inc.* 2 2,065 Best Buy Co., Inc. 24 1,816 CarMax, Inc.* 17 1,484 Gap, Inc. (The) 22 315 Home Depot, Inc. (The) 113 24,616 L Brands, Inc. 24 520 Lowe's Cos., Inc. 79 8,419

S&P 500® Ex-Financials ETF Schedule of Portfolio Investments February 29, 2020 (Unaudited)
Investments Shares Value ($) O'Reilly Automotive, Inc.* 8 2,950 Ross Stores, Inc. 37 4,025 Tiffany & Co. 11 1,469 TJX Cos., Inc. (The) 124 7,415 Tractor Supply Co. 12 1,062 Ulta Beauty, Inc.* 6 1,543
58,630 Technology Hardware, Storage & Peripherals - 5.9% Apple, Inc. 432 118,091 Hewlett Packard Enterprise Co. 134 1,714 HP, Inc. 153 3,181 NetApp, Inc. 24 1,121 Seagate Technology plc 24 1,151 Western Digital Corp. 31 1,722 Xerox Holdings Corp. 19 612
127,592 Textiles, Apparel & Luxury Goods - 0.8% Capri Holdings Ltd.* 16 413 Hanesbrands, Inc. 37 490 NIKE, Inc., Class B 129 11,530 PVH Corp. 8 593 Ralph Lauren Corp. 5 527 Tapestry, Inc. 29 680 Under Armour, Inc., Class A* 19 270 Under Armour, Inc., Class C* 20 250 VF Corp. 34 2,448
17,201 Tobacco - 1.0% Altria Group, Inc. 193 7,791 Philip Morris International, Inc. 161 13,181
20,972 Trading Companies & Distributors - 0.2% Fastenal Co. 59 2,019 United Rentals, Inc.* 8 1,060 WW Grainger, Inc. 5 1,388
4,467 Water Utilities - 0.1% American Water Works Co., Inc. 19 2,350
Wireless Telecommunication Services - 0.1% T-Mobile US, Inc.* 33 2,975
TOTAL COMMON STOCKS (Cost $1,890,901) 2,145,900
Investments Principal
Amount ($) Value ($) SHORT-TERM INVESTMENTS - 0.2% REPURCHASE AGREEMENTS(b) - 0.2% Repurchase Agreements with various
counterparties, rates 1.58% - 1.59%, dated 2/28/2020, due 3/2/2020, total to be received $4,001
(Cost $4,001) 4,001 4,001 Total Investments - 99.8%
(Cost $1,894,902) 2,149,901 Other Assets Less Liabilities - 0.2% 3,915 Net Assets - 100.0% 2,153,816
* Non-income producing security. (a) Represents less than 0.05% of net assets. (b) The Fund invests in Repurchase Agreements jointly with other
funds in the Trust. See "Repurchase Agreements" in the Notes to Schedules of Portfolio of Investments to view the details of each individual agreement and counterparty as well as a description of the securities subject to repurchase.

S&P 500® Ex-Health Care ETF Schedule of Portfolio Investments February 29, 2020 (Unaudited)
Investments Shares Value ($) COMMON STOCKS - 99.5%
Aerospace & Defense - 2.8% Arconic, Inc. 39 1,145 Boeing Co. (The) 55 15,131 General Dynamics Corp. 24 3,833 Huntington Ingalls Industries, Inc. 4 822 L3Harris Technologies, Inc. 22 4,350 Lockheed Martin Corp. 25 9,247 Northrop Grumman Corp. 16 5,261 Raytheon Co. 28 5,280 Textron, Inc. 24 974 TransDigm Group, Inc. 5 2,789 United Technologies Corp. 83 10,839
59,671 Air Freight & Logistics - 0.6% CH Robinson Worldwide, Inc. 14 965 Expeditors International of Washington, Inc. 17 1,197 FedEx Corp. 25 3,529 United Parcel Service, Inc., Class B 72 6,515
12,206 Airlines - 0.4% Alaska Air Group, Inc. 13 656 American Airlines Group, Inc. 39 743 Delta Air Lines, Inc. 59 2,722 Southwest Airlines Co. 49 2,263 United Airlines Holdings, Inc.* 22 1,355
7,739 Auto Components - 0.1% Aptiv plc 26 2,031 BorgWarner, Inc. 21 663
2,694 Automobiles - 0.3% Ford Motor Co. 399 2,777 General Motors Co. 129 3,934 Harley-Davidson, Inc. 16 488
7,199 Banks - 5.8% Bank of America Corp. 830 23,655 Citigroup, Inc. 224 14,215 Citizens Financial Group, Inc. 45 1,426 Comerica, Inc. 15 790 Fifth Third Bancorp 73 1,781 First Republic Bank 17 1,710 Huntington Bancshares, Inc. 105 1,289 JPMorgan Chase & Co. 321 37,271 KeyCorp 101 1,651 M&T Bank Corp. 14 1,965 People's United Financial, Inc. 45 630 PNC Financial Services Group, Inc. (The) 45 5,688 Regions Financial Corp. 98 1,325 SVB Financial Group* 6 1,249 Truist Financial Corp. 137 6,321 US Bancorp 146 6,780 Wells Fargo & Co. 394 16,095 Zions Bancorp NA 17 679
124,520 Beverages - 2.2% Brown-Forman Corp., Class B 18 1,105 Coca-Cola Co. (The) 395 21,129
Investments Shares Value ($) Constellation Brands, Inc., Class A 17 2,931 Molson Coors Beverage Co., Class B 20 992 Monster Beverage Corp.* 39 2,434 PepsiCo, Inc. 143 18,880
47,471 Building Products - 0.3% Allegion plc 10 1,150 AO Smith Corp. 14 554 Fortune Brands Home & Security, Inc. 14 864 Johnson Controls International plc 79 2,889 Masco Corp. 29 1,198
6,655 Capital Markets - 3.1% Ameriprise Financial, Inc. 13 1,837 Bank of New York Mellon Corp. (The) 86 3,431 BlackRock, Inc. 12 5,556 Cboe Global Markets, Inc. 11 1,254 Charles Schwab Corp. (The) 118 4,808 CME Group, Inc. 37 7,356 E*TRADE Financial Corp. 24 1,099 Franklin Resources, Inc. 28 609 Goldman Sachs Group, Inc. (The) 32 6,425 Intercontinental Exchange, Inc. 57 5,086 Invesco Ltd. 38 547 MarketAxess Holdings, Inc. 4 1,297 Moody's Corp. 17 4,081 Morgan Stanley 126 5,674 MSCI, Inc. 8 2,364 Nasdaq, Inc. 11 1,128 Northern Trust Corp. 21 1,843 Raymond James Financial, Inc. 13 1,087 S&P Global, Inc. 25 6,648 State Street Corp. 38 2,588 T. Rowe Price Group, Inc. 24 2,832
67,550 Chemicals - 2.0% Air Products & Chemicals, Inc. 22 4,832 Albemarle Corp. 11 900 Celanese Corp. 13 1,219 CF Industries Holdings, Inc. 22 811 Corteva, Inc. 77 2,094 Dow, Inc. 76 3,071 DuPont de Nemours, Inc. 76 3,260 Eastman Chemical Co. 14 861 Ecolab, Inc. 25 4,511 FMC Corp. 13 1,210 International Flavors & Fragrances, Inc.(a) 11 1,318 Linde plc 55 10,506 LyondellBasell Industries NV, Class A 27 1,929 Mosaic Co. (The) 36 613 PPG Industries, Inc. 24 2,507 Sherwin-Williams Co. (The) 8 4,134
43,776 Commercial Services & Supplies - 0.5% Cintas Corp. 8 2,134 Copart, Inc.* 21 1,774 Republic Services, Inc. 21 1,896 Rollins, Inc. 14 524

S&P 500® Ex-Health Care ETF Schedule of Portfolio Investments February 29, 2020 (Unaudited)
Investments Shares Value ($) Waste Management, Inc. 40 4,432
10,760 Communications Equipment - 1.1% Arista Networks, Inc.* 6 1,159 Cisco Systems, Inc. 434 17,330 F5 Networks, Inc.* 6 720 Juniper Networks, Inc. 34 721 Motorola Solutions, Inc. 18 2,982
22,912 Construction & Engineering - 0.1% Jacobs Engineering Group, Inc. 14 1,293 Quanta Services, Inc. 14 534
1,827 Construction Materials - 0.1% Martin Marietta Materials, Inc. 7 1,593 Vulcan Materials Co. 14 1,683
3,276 Consumer Finance - 0.7% American Express Co. 69 7,585 Capital One Financial Corp. 48 4,236 Discover Financial Services 32 2,099 Synchrony Financial 60 1,746
15,666 Containers & Packaging - 0.4% Amcor plc 166 1,547 Avery Dennison Corp. 8 916 Ball Corp. 34 2,396 International Paper Co. 41 1,515 Packaging Corp. of America 10 906 Sealed Air Corp. 16 485 Westrock Co. 27 898
8,663 Distributors - 0.1% Genuine Parts Co. 15 1,309 LKQ Corp.* 31 917
2,226 Diversified Consumer Services - 0.0%(b) H&R Block, Inc. 20 413
Diversified Financial Services - 1.9% Berkshire Hathaway, Inc., Class B* 200 41,268
Diversified Telecommunication Services - 2.3% AT&T, Inc. 748 26,344 CenturyLink, Inc. 101 1,219 Verizon Communications, Inc. 423 22,910
50,473 Electric Utilities - 2.5% Alliant Energy Corp. 25 1,303 American Electric Power Co., Inc. 50 4,463 Duke Energy Corp. 74 6,786 Edison International 37 2,486 Entergy Corp. 21 2,455 Evergy, Inc. 24 1,569 Eversource Energy 33 2,853 Exelon Corp. 100 4,311 FirstEnergy Corp. 55 2,449 NextEra Energy, Inc. 50 12,638 Pinnacle West Capital Corp. 11 984 PPL Corp. 74 2,221 Southern Co. (The) 108 6,519 Xcel Energy, Inc. 53 3,303
54,340
Investments Shares Value ($) Electrical Equipment - 0.5% AMETEK, Inc. 24 2,064 Eaton Corp. plc 42 3,810 Emerson Electric Co. 63 4,039 Rockwell Automation, Inc. 11 2,019
11,932 Electronic Equipment, Instruments & Components - 0.6% Amphenol Corp., Class A 31 2,842 CDW Corp. 15 1,713 Corning, Inc. 79 1,885 FLIR Systems, Inc. 14 595 IPG Photonics Corp.* 4 510 Keysight Technologies, Inc.* 20 1,895 TE Connectivity Ltd. 34 2,818 Zebra Technologies Corp., Class A* 6 1,266
13,524 Energy Equipment & Services - 0.4% Baker Hughes Co. 66 1,062 Halliburton Co. 90 1,526 Helmerich & Payne, Inc. 11 406 National Oilwell Varco, Inc. 39 730 Schlumberger Ltd. 142 3,847 TechnipFMC plc 43 638
8,209 Entertainment - 2.2% Activision Blizzard, Inc. 79 4,592 Electronic Arts, Inc.* 30 3,041 Live Nation Entertainment, Inc.* 14 851 Netflix, Inc.* 45 16,607 Take-Two Interactive Software, Inc.* 11 1,182 Walt Disney Co. (The) 185 21,765
48,038 Equity Real Estate Investment Trusts (REITs) - 3.5% Alexandria Real Estate Equities, Inc. 13 1,974 American Tower Corp. 45 10,206 Apartment Investment & Management Co., Class A 15 718 AvalonBay Communities, Inc. 14 2,808 Boston Properties, Inc. 15 1,934 Crown Castle International Corp. 42 6,018 Digital Realty Trust, Inc. 21 2,522 Duke Realty Corp. 38 1,234 Equinix, Inc. 9 5,155 Equity Residential 36 2,704 Essex Property Trust, Inc. 7 1,984 Extra Space Storage, Inc. 13 1,305 Federal Realty Investment Trust 7 814 Healthpeak Properties, Inc. 51 1,614 Host Hotels & Resorts, Inc. 73 1,057 Iron Mountain, Inc. 29 882 Kimco Realty Corp. 43 746 Mid-America Apartment Communities, Inc. 11 1,422 Prologis, Inc. 76 6,405 Public Storage 15 3,137 Realty Income Corp. 34 2,461 Regency Centers Corp. 17 977 SBA Communications Corp. 11 2,916 Simon Property Group, Inc. 31 3,816 SL Green Realty Corp. 8 628

S&P 500® Ex-Health Care ETF Schedule of Portfolio Investments February 29, 2020 (Unaudited)
Investments Shares Value ($) UDR, Inc. 30 1,349 Ventas, Inc. 38 2,043 Vornado Realty Trust 17 911 Welltower, Inc. 42 3,142 Weyerhaeuser Co. 76 1,974
74,856 Food & Staples Retailing - 1.7% Costco Wholesale Corp. 45 12,651 Kroger Co. (The) 83 2,335 Sysco Corp. 52 3,466 Walgreens Boots Alliance, Inc. 77 3,524 Walmart, Inc. 146 15,721
37,697 Food Products - 1.3% Archer-Daniels-Midland Co. 57 2,146 Campbell Soup Co. 17 767 Conagra Brands, Inc. 50 1,334 General Mills, Inc. 62 3,038 Hershey Co. (The) 15 2,160 Hormel Foods Corp. 28 1,165 JM Smucker Co. (The) 11 1,133 Kellogg Co. 25 1,512 Kraft Heinz Co. (The) 64 1,585 Lamb Weston Holdings, Inc. 15 1,303 McCormick & Co., Inc. (Non-Voting) 13 1,900 Mondelez International, Inc., Class A 147 7,762 Tyson Foods, Inc., Class A 31 2,103
27,908 Gas Utilities - 0.1% Atmos Energy Corp. 13 1,342
Hotels, Restaurants & Leisure - 2.1% Carnival Corp. 41 1,372 Chipotle Mexican Grill, Inc.* 3 2,321 Darden Restaurants, Inc. 13 1,267 Hilton Worldwide Holdings, Inc. 29 2,819 Las Vegas Sands Corp. 35 2,041 Marriott International, Inc., Class A 28 3,472 McDonald's Corp. 77 14,951 MGM Resorts International 53 1,301 Norwegian Cruise Line Holdings Ltd.* 22 820 Royal Caribbean Cruises Ltd. 18 1,447 Starbucks Corp. 121 9,490 Wynn Resorts Ltd. 10 1,080 Yum! Brands, Inc. 31 2,767
45,148 Household Durables - 0.4% DR Horton, Inc. 35 1,864 Garmin Ltd. 15 1,326 Leggett & Platt, Inc. 14 555 Lennar Corp., Class A 28 1,690 Mohawk Industries, Inc.* 6 727 Newell Brands, Inc. 39 602 PulteGroup, Inc. 26 1,045 Whirlpool Corp. 7 895
8,704 Household Products - 2.0% Church & Dwight Co., Inc. 25 1,738 Clorox Co. (The) 13 2,072 Colgate-Palmolive Co. 88 5,946
Investments Shares Value ($) Kimberly-Clark Corp. 35 4,592 Procter & Gamble Co. (The) 255 28,874
43,222 Independent Power and Renewable Electricity Producers - 0.1% AES Corp. 68 1,138 NRG Energy, Inc. 25 830
1,968 Industrial Conglomerates - 1.6% 3M Co. 59 8,805 General Electric Co. 894 9,727 Honeywell International, Inc. 73 11,838 Roper Technologies, Inc. 11 3,869
34,239 Insurance - 2.6% Aflac, Inc. 76 3,257 Allstate Corp. (The) 34 3,578 American International Group, Inc. 90 3,794 Aon plc 24 4,992 Arthur J Gallagher & Co. 19 1,852 Assurant, Inc. 6 724 Chubb Ltd. 46 6,671 Cincinnati Financial Corp. 15 1,399 Everest Re Group Ltd. 4 991 Globe Life, Inc. 10 927 Hartford Financial Services Group, Inc. (The) 37 1,848 Lincoln National Corp. 20 908 Loews Corp. 27 1,232 Marsh & McLennan Cos., Inc. 52 5,437 MetLife, Inc. 80 3,418 Principal Financial Group, Inc. 27 1,199 Progressive Corp. (The) 60 4,390 Prudential Financial, Inc. 41 3,093 Travelers Cos., Inc. (The) 27 3,235 Unum Group 21 489 Willis Towers Watson plc 13 2,460 WR Berkley Corp. 15 1,007
56,901 Interactive Media & Services - 6.2% Alphabet, Inc., Class A* 31 41,517 Alphabet, Inc., Class C* 31 41,519 Facebook, Inc., Class A* 247 47,540 Twitter, Inc.* 80 2,656
133,232 Internet & Direct Marketing Retail - 4.2% Amazon.com, Inc.* 42 79,117 Booking Holdings, Inc.* 4 6,783 eBay, Inc. 78 2,702 Expedia Group, Inc. 14 1,381
89,983 IT Services - 6.5% Accenture plc, Class A 65 11,738 Akamai Technologies, Inc.* 17 1,471 Alliance Data Systems Corp. 4 344 Automatic Data Processing, Inc. 45 6,963 Broadridge Financial Solutions, Inc. 11 1,148 Cognizant Technology Solutions Corp., Class A 56 3,412 DXC Technology Co. 27 651 Fidelity National Information Services, Inc. 63 8,802 Fiserv, Inc.* 59 6,452

S&P 500® Ex-Health Care ETF Schedule of Portfolio Investments February 29, 2020 (Unaudited)
Investments Shares Value ($) FleetCor Technologies, Inc.* 9 2,392 Gartner, Inc.* 10 1,294 Global Payments, Inc. 31 5,703 International Business Machines Corp. 91 11,844 Jack Henry & Associates, Inc. 8 1,214 Leidos Holdings, Inc. 14 1,437 Mastercard, Inc., Class A 91 26,413 Paychex, Inc. 32 2,479 PayPal Holdings, Inc.* 120 12,959 VeriSign, Inc.* 11 2,087 Visa, Inc., Class A 175 31,808 Western Union Co. (The) 43 963
141,574 Leisure Products - 0.0%(b) Hasbro, Inc. 13 1,004
Machinery - 1.8% Caterpillar, Inc. 56 6,957 Cummins, Inc. 15 2,269 Deere & Co. 32 5,007 Dover Corp. 15 1,541 Flowserve Corp. 14 563 Fortive Corp. 31 2,144 IDEX Corp. 8 1,184 Illinois Tool Works, Inc. 30 5,033 Ingersoll-Rand plc 25 3,226 PACCAR, Inc. 35 2,342 Parker-Hannifin Corp. 13 2,402 Pentair plc 17 670 Snap-on, Inc. 6 868 Stanley Black & Decker, Inc. 15 2,156 Westinghouse Air Brake Technologies Corp. 18 1,237 Xylem, Inc. 18 1,392
38,991 Media - 1.6% Charter Communications, Inc., Class A* 16 7,891 Comcast Corp., Class A 465 18,800 Discovery, Inc., Class A* 17 437 Discovery, Inc., Class C* 35 878 DISH Network Corp., Class A* 27 905 Fox Corp., Class A 36 1,107 Fox Corp., Class B 17 518 Interpublic Group of Cos., Inc. (The) 39 833 News Corp., Class A 39 471 News Corp., Class B 13 162 Omnicom Group, Inc. 22 1,524 ViacomCBS, Inc. 55 1,353
34,879 Metals & Mining - 0.3% Freeport-McMoRan, Inc. 149 1,484 Newmont Corp. 84 3,749 Nucor Corp. 31 1,282
6,515 Multiline Retail - 0.6% Dollar General Corp. 26 3,908 Dollar Tree, Inc.* 24 1,993 Kohl's Corp. 16 626 Macy's, Inc. 32 423 Nordstrom, Inc. 11 382
Investments Shares Value ($) Target Corp. 52 5,356
12,688 Multi-Utilities - 1.2% Ameren Corp. 25 1,975 CenterPoint Energy, Inc. 52 1,197 CMS Energy Corp. 29 1,752 Consolidated Edison, Inc. 34 2,680 Dominion Energy, Inc. 84 6,567 DTE Energy Co. 20 2,233 NiSource, Inc. 38 1,027 Public Service Enterprise Group, Inc. 52 2,668 Sempra Energy 29 4,054 WEC Energy Group, Inc. 32 2,955
27,108 Oil, Gas & Consumable Fuels - 3.8% Apache Corp. 38 947 Cabot Oil & Gas Corp. 42 585 Chevron Corp. 193 18,015 Cimarex Energy Co. 10 330 Concho Resources, Inc. 21 1,428 ConocoPhillips 112 5,423 Devon Energy Corp. 39 633 Diamondback Energy, Inc. 17 1,054 EOG Resources, Inc. 60 3,796 Exxon Mobil Corp. 433 22,274 Hess Corp. 27 1,517 HollyFrontier Corp. 15 505 Kinder Morgan, Inc. 199 3,815 Marathon Oil Corp. 81 671 Marathon Petroleum Corp. 66 3,130 Noble Energy, Inc. 49 776 Occidental Petroleum Corp. 91 2,979 ONEOK, Inc. 42 2,802 Phillips 66 45 3,369 Pioneer Natural Resources Co. 17 2,087 Valero Energy Corp. 42 2,782 Williams Cos., Inc. (The) 125 2,381
81,299 Personal Products - 0.2% Coty, Inc., Class A 31 286 Estee Lauder Cos., Inc. (The), Class A 23 4,223
4,509 Professional Services - 0.4% Equifax, Inc. 13 1,846 IHS Markit Ltd. 41 2,921 Nielsen Holdings plc 36 656 Robert Half International, Inc. 12 605 Verisk Analytics, Inc. 17 2,637
8,665 Real Estate Management & Development - 0.1% CBRE Group, Inc., Class A* 34 1,909
Road & Rail - 1.2% CSX Corp. 80 5,636 JB Hunt Transport Services, Inc. 9 868 Kansas City Southern 10 1,507 Norfolk Southern Corp. 27 4,923 Old Dominion Freight Line, Inc. 7 1,357 Union Pacific Corp. 71 11,346
25,637

S&P 500® Ex-Health Care ETF Schedule of Portfolio Investments February 29, 2020 (Unaudited)
Investments Shares Value ($) Semiconductors & Semiconductor Equipment - 5.1% Advanced Micro Devices, Inc.* 120 5,458 Analog Devices, Inc. 38 4,144 Applied Materials, Inc. 95 5,521 Broadcom, Inc. 41 11,178 Intel Corp. 446 24,762 KLA Corp. 17 2,613 Lam Research Corp. 15 4,402 Maxim Integrated Products, Inc. 28 1,557 Microchip Technology, Inc. 24 2,177 Micron Technology, Inc.* 113 5,939 NVIDIA Corp. 63 17,015 Qorvo, Inc.* 11 1,106 QUALCOMM, Inc. 117 9,161 Skyworks Solutions, Inc. 17 1,703 Texas Instruments, Inc. 95 10,843 Xilinx, Inc. 25 2,087
109,666 Software - 9.2% Adobe, Inc.* 49 16,911 ANSYS, Inc.* 9 2,180 Autodesk, Inc.* 22 4,199 Cadence Design Systems, Inc.* 29 1,918 Citrix Systems, Inc. 13 1,344 Fortinet, Inc.* 14 1,429 Intuit, Inc. 27 7,178 Microsoft Corp. 782 126,691 NortonLifeLock, Inc. 59 1,123 Oracle Corp. 222 10,980 Paycom Software, Inc.* 5 1,413 salesforce.com, Inc.* 91 15,506 ServiceNow, Inc.* 20 6,522 Synopsys, Inc.* 15 2,069
199,463 Specialty Retail - 2.7% Advance Auto Parts, Inc. 7 931 AutoZone, Inc.* 3 3,098 Best Buy Co., Inc. 24 1,816 CarMax, Inc.* 17 1,484 Gap, Inc. (The) 22 315 Home Depot, Inc. (The) 112 24,398 L Brands, Inc. 24 520 Lowe's Cos., Inc. 78 8,312 O'Reilly Automotive, Inc.* 8 2,950 Ross Stores, Inc. 37 4,025 Tiffany & Co. 11 1,469 TJX Cos., Inc. (The) 125 7,475 Tractor Supply Co. 12 1,062 Ulta Beauty, Inc.* 6 1,543
59,398 Technology Hardware, Storage & Peripherals - 5.8% Apple, Inc. 428 116,998 Hewlett Packard Enterprise Co. 133 1,701 HP, Inc. 151 3,139 NetApp, Inc. 24 1,121 Seagate Technology plc 24 1,151 Western Digital Corp. 31 1,723 Xerox Holdings Corp. 19 612
126,445 Textiles, Apparel & Luxury Goods - 0.8% Capri Holdings Ltd.* 15 387 Hanesbrands, Inc. 37 490 NIKE, Inc., Class B 128 11,441
Investments Shares Value ($) PVH Corp. 7 519 Ralph Lauren Corp. 5 527 Tapestry, Inc. 28 657 Under Armour, Inc., Class A* 20 284 Under Armour, Inc., Class C* 20 249 VF Corp. 34 2,448
17,002 Tobacco - 1.0% Altria Group, Inc. 192 7,751 Philip Morris International, Inc. 160 13,099
20,850 Trading Companies & Distributors - 0.2% Fastenal Co. 59 2,019 United Rentals, Inc.* 7 928 WW Grainger, Inc. 4 1,110
4,057 Water Utilities - 0.1% American Water Works Co., Inc. 18 2,226
Wireless Telecommunication Services - 0.1% T-Mobile US, Inc.* 32 2,885
TOTAL COMMON STOCKS (Cost $2,031,150) 2,154,978
Investments Principal
Amount ($) Value ($) SHORT-TERM INVESTMENTS - 0.3% REPURCHASE AGREEMENTS(c) - 0.3% Repurchase Agreements with various
counterparties, rates 1.58% - 1.59%, dated 2/28/2020, due 3/2/2020, total to be received $5,666
(Cost $5,666) 5,666 5,666 Total Investments - 99.8%
(Cost $2,036,816) 2,160,644 Other Assets Less Liabilities - 0.2% 3,718 Net Assets - 100.0% 2,164,362

S&P 500® Ex-Health Care ETF Schedule of Portfolio Investments February 29, 2020 (Unaudited)
* Non-income producing security. (a) The security or a portion of this security is on loan at February
29, 2020. The total value of securities on loan at February 29, 2020 was $240, collateralized in the form of U.S. Government Treasury Securities, interest rates ranging from 0.00% – 6.13%, and maturity dates ranging from March 19, 2020 – November 15, 2049; a total value of $263.
(b) Represents less than 0.05% of net assets. (c) The Fund invests in Repurchase Agreements jointly with other
funds in the Trust. See "Repurchase Agreements" in the Notes to Schedules of Portfolio of Investments to view the details of each individual agreement and counterparty as well as a description of the securities subject to repurchase.

S&P 500® Ex-Technology ETF Schedule of Portfolio Investments February 29, 2020 (Unaudited)
Investments Shares Value ($) COMMON STOCKS - 99.6%
Aerospace & Defense - 3.2% Arconic, Inc. 78 2,289 Boeing Co. (The) 108 29,712 General Dynamics Corp. 47 7,505 Huntington Ingalls Industries, Inc. 8 1,644 L3Harris Technologies, Inc. 45 8,898 Lockheed Martin Corp. 50 18,494 Northrop Grumman Corp. 32 10,523 Raytheon Co. 56 10,559 Textron, Inc. 46 1,868 TransDigm Group, Inc. 10 5,578 United Technologies Corp. 164 21,417
118,487 Air Freight & Logistics - 0.6% CH Robinson Worldwide, Inc. 27 1,860 Expeditors International of Washington, Inc. 34 2,394 FedEx Corp. 49 6,917 United Parcel Service, Inc., Class B 142 12,850
24,021 Airlines - 0.4% Alaska Air Group, Inc. 25 1,262 American Airlines Group, Inc. 79 1,505 Delta Air Lines, Inc. 117 5,397 Southwest Airlines Co. 96 4,434 United Airlines Holdings, Inc.* 44 2,710
15,308 Auto Components - 0.1% Aptiv plc 52 4,062 BorgWarner, Inc. 42 1,327
5,389 Automobiles - 0.4% Ford Motor Co. 788 5,484 General Motors Co. 255 7,778 Harley-Davidson, Inc. 31 945
14,207 Banks - 6.5% Bank of America Corp. 1,639 46,711 Citigroup, Inc. 442 28,049 Citizens Financial Group, Inc. 88 2,789 Comerica, Inc. 29 1,527 Fifth Third Bancorp 144 3,514 First Republic Bank 34 3,419 Huntington Bancshares, Inc. 209 2,564 JPMorgan Chase & Co. 635 73,730 KeyCorp 199 3,254 M&T Bank Corp. 27 3,790 People's United Financial, Inc. 90 1,259 PNC Financial Services Group, Inc. (The) 89 11,250 Regions Financial Corp. 195 2,636 SVB Financial Group* 10 2,082 Truist Financial Corp. 271 12,504 US Bancorp 288 13,375 Wells Fargo & Co. 780 31,863 Zions Bancorp NA 35 1,398
245,714 Beverages - 2.5% Brown-Forman Corp., Class B 37 2,272 Coca-Cola Co. (The) 781 41,776
Investments Shares Value ($) Constellation Brands, Inc., Class A 34 5,861 Molson Coors Beverage Co., Class B 38 1,885 Monster Beverage Corp.* 76 4,743 PepsiCo, Inc. 282 37,233
93,770 Biotechnology - 2.8% AbbVie, Inc. 299 25,627 Alexion Pharmaceuticals, Inc.* 45 4,231 Amgen, Inc. 120 23,968 Biogen, Inc.* 37 11,410 Gilead Sciences, Inc. 256 17,756 Incyte Corp.* 36 2,715 Regeneron Pharmaceuticals, Inc.* 16 7,113 Vertex Pharmaceuticals, Inc.* 52 11,650
104,470 Building Products - 0.3% Allegion plc 19 2,185 AO Smith Corp. 28 1,107 Fortune Brands Home & Security, Inc. 28 1,729 Johnson Controls International plc 156 5,705 Masco Corp. 58 2,397
13,123 Capital Markets - 3.6% Ameriprise Financial, Inc. 26 3,674 Bank of New York Mellon Corp. (The) 170 6,783 BlackRock, Inc. 24 11,112 Cboe Global Markets, Inc. 22 2,508 Charles Schwab Corp. (The) 232 9,454 CME Group, Inc. 73 14,514 E*TRADE Financial Corp. 46 2,106 Franklin Resources, Inc. 56 1,218 Goldman Sachs Group, Inc. (The) 65 13,050 Intercontinental Exchange, Inc. 113 10,082 Invesco Ltd. 75 1,080 MarketAxess Holdings, Inc. 8 2,595 Moody's Corp. 33 7,921 Morgan Stanley 249 11,212 MSCI, Inc. 17 5,022 Nasdaq, Inc. 23 2,359 Northern Trust Corp. 43 3,774 Raymond James Financial, Inc. 25 2,091 S&P Global, Inc. 49 13,030 State Street Corp. 74 5,040 T. Rowe Price Group, Inc. 47 5,546
134,171 Chemicals - 2.3% Air Products & Chemicals, Inc. 45 9,882 Albemarle Corp. 21 1,719 Celanese Corp. 24 2,250 CF Industries Holdings, Inc. 44 1,622 Corteva, Inc. 152 4,134 Dow, Inc. 150 6,061 DuPont de Nemours, Inc. 150 6,435 Eastman Chemical Co. 28 1,722 Ecolab, Inc. 51 9,203 FMC Corp. 26 2,421 International Flavors & Fragrances, Inc.(a) 22 2,635 Linde plc 109 20,820

S&P 500® Ex-Technology ETF Schedule of Portfolio Investments February 29, 2020 (Unaudited)
Investments Shares Value ($) LyondellBasell Industries NV, Class A 52 3,716 Mosaic Co. (The) 71 1,209 PPG Industries, Inc. 48 5,014 Sherwin-Williams Co. (The) 17 8,785
87,628 Commercial Services & Supplies - 0.6% Cintas Corp. 17 4,534 Copart, Inc.* 41 3,464 Republic Services, Inc. 43 3,881 Rollins, Inc. 29 1,086 Waste Management, Inc. 79 8,754
21,719 Construction & Engineering - 0.1% Jacobs Engineering Group, Inc. 27 2,493 Quanta Services, Inc. 29 1,106
3,599 Construction Materials - 0.2% Martin Marietta Materials, Inc. 13 2,958 Vulcan Materials Co. 27 3,247
6,205 Consumer Finance - 0.8% American Express Co. 136 14,950 Capital One Financial Corp. 94 8,296 Discover Financial Services 63 4,132 Synchrony Financial 120 3,492
30,870 Containers & Packaging - 0.5% Amcor plc 328 3,057 Avery Dennison Corp. 17 1,946 Ball Corp. 66 4,650 International Paper Co. 79 2,920 Packaging Corp. of America 19 1,722 Sealed Air Corp. 31 940 Westrock Co. 52 1,729
16,964 Distributors - 0.1% Genuine Parts Co. 29 2,530 LKQ Corp.* 62 1,834
4,364 Diversified Consumer Services - 0.0%(b) H&R Block, Inc. 40 827
Diversified Financial Services - 2.2% Berkshire Hathaway, Inc., Class B* 396 81,711
Diversified Telecommunication Services - 2.7% AT&T, Inc. 1,480 52,125 CenturyLink, Inc. 199 2,402 Verizon Communications, Inc. 837 45,332
99,859 Electric Utilities - 2.9% Alliant Energy Corp. 49 2,554 American Electric Power Co., Inc. 100 8,926 Duke Energy Corp. 148 13,572 Edison International 73 4,905 Entergy Corp. 40 4,676 Evergy, Inc. 46 3,006 Eversource Energy 66 5,706 Exelon Corp. 197 8,493 FirstEnergy Corp. 109 4,854 NextEra Energy, Inc. 99 25,023 Pinnacle West Capital Corp. 23 2,058
Investments Shares Value ($) PPL Corp. 146 4,382 Southern Co. (The) 212 12,796 Xcel Energy, Inc. 106 6,606
107,557 Electrical Equipment - 0.6% AMETEK, Inc. 46 3,956 Eaton Corp. plc 84 7,620 Emerson Electric Co. 124 7,950 Rockwell Automation, Inc. 23 4,221
23,747 Energy Equipment & Services - 0.4% Baker Hughes Co. 132 2,124 Halliburton Co. 178 3,019 Helmerich & Payne, Inc. 22 812 National Oilwell Varco, Inc. 78 1,459 Schlumberger Ltd. 280 7,585 TechnipFMC plc 85 1,261
16,260 Entertainment - 2.5% Activision Blizzard, Inc. 156 9,068 Electronic Arts, Inc.* 59 5,981 Live Nation Entertainment, Inc.* 29 1,762 Netflix, Inc.* 89 32,844 Take-Two Interactive Software, Inc.* 23 2,472 Walt Disney Co. (The) 365 42,942
95,069 Equity Real Estate Investment Trusts (REITs) - 3.9% Alexandria Real Estate Equities, Inc. 25 3,797 American Tower Corp. 90 20,412 Apartment Investment & Management Co., Class A 30 1,435 AvalonBay Communities, Inc. 28 5,616 Boston Properties, Inc. 29 3,739 Crown Castle International Corp. 84 12,036 Digital Realty Trust, Inc. 42 5,045 Duke Realty Corp. 74 2,403 Equinix, Inc. 17 9,738 Equity Residential 71 5,332 Essex Property Trust, Inc. 13 3,684 Extra Space Storage, Inc. 26 2,609 Federal Realty Investment Trust 14 1,629 Healthpeak Properties, Inc. 100 3,164 Host Hotels & Resorts, Inc. 145 2,099 Iron Mountain, Inc. 58 1,764 Kimco Realty Corp. 85 1,475 Mid-America Apartment Communities, Inc. 23 2,973 Prologis, Inc. 149 12,558 Public Storage 30 6,274 Realty Income Corp. 66 4,778 Regency Centers Corp. 34 1,953 SBA Communications Corp. 23 6,097 Simon Property Group, Inc. 62 7,631 SL Green Realty Corp. 17 1,333 UDR, Inc. 59 2,654 Ventas, Inc. 75 4,033 Vornado Realty Trust 32 1,714 Welltower, Inc. 82 6,135 Weyerhaeuser Co. 151 3,923
148,033

S&P 500® Ex-Technology ETF Schedule of Portfolio Investments February 29, 2020 (Unaudited)
Investments Shares Value ($) Food & Staples Retailing - 2.0% Costco Wholesale Corp. 89 25,021 Kroger Co. (The) 162 4,557 Sysco Corp. 103 6,865 Walgreens Boots Alliance, Inc. 152 6,956 Walmart, Inc. 287 30,904
74,303 Food Products - 1.5% Archer-Daniels-Midland Co. 113 4,254 Campbell Soup Co. 34 1,534 Conagra Brands, Inc. 99 2,642 General Mills, Inc. 122 5,978 Hershey Co. (The) 30 4,320 Hormel Foods Corp. 56 2,329 JM Smucker Co. (The) 23 2,369 Kellogg Co. 50 3,023 Kraft Heinz Co. (The) 126 3,121 Lamb Weston Holdings, Inc. 30 2,607 McCormick & Co., Inc. (Non-Voting) 25 3,655 Mondelez International, Inc., Class A 291 15,365 Tyson Foods, Inc., Class A 60 4,070
55,267 Gas Utilities - 0.1% Atmos Energy Corp. 24 2,478
Health Care Equipment & Supplies - 4.6% Abbott Laboratories 358 27,577 ABIOMED, Inc.* 9 1,352 Align Technology, Inc.* 15 3,275 Baxter International, Inc. 103 8,597 Becton Dickinson and Co. 55 13,080 Boston Scientific Corp.* 283 10,581 Cooper Cos., Inc. (The) 10 3,246 Danaher Corp. 129 18,651 DENTSPLY SIRONA, Inc. 45 2,216 Edwards Lifesciences Corp.* 42 8,603 Hologic, Inc.* 54 2,545 IDEXX Laboratories, Inc.* 17 4,327 Intuitive Surgical, Inc.* 23 12,281 Medtronic plc 271 27,282 ResMed, Inc. 29 4,610 STERIS plc 17 2,697 Stryker Corp. 65 12,388 Teleflex, Inc. 9 3,015 Varian Medical Systems, Inc.* 18 2,213 Zimmer Biomet Holdings, Inc. 42 5,718
174,254 Health Care Providers & Services - 3.6% AmerisourceBergen Corp. 30 2,530 Anthem, Inc. 51 13,112 Cardinal Health, Inc. 59 3,075 Centene Corp.* 119 6,309 Cigna Corp. 76 13,903 CVS Health Corp. 263 15,564 DaVita, Inc.* 18 1,397 HCA Healthcare, Inc. 54 6,859 Henry Schein, Inc.* 30 1,828 Humana, Inc. 27 8,631 Laboratory Corp. of America Holdings* 20 3,514 McKesson Corp. 36 5,035
Investments Shares Value ($) Quest Diagnostics, Inc. 27 2,864 UnitedHealth Group, Inc. 192 48,952 Universal Health Services, Inc., Class B 16 1,980
135,553 Health Care Technology - 0.1% Cerner Corp. 64 4,433
Hotels, Restaurants & Leisure - 2.3% Carnival Corp. 81 2,710 Chipotle Mexican Grill, Inc.* 5 3,868 Darden Restaurants, Inc. 25 2,438 Hilton Worldwide Holdings, Inc. 57 5,541 Las Vegas Sands Corp. 69 4,023 Marriott International, Inc., Class A 55 6,820 McDonald's Corp. 152 29,514 MGM Resorts International 104 2,554 Norwegian Cruise Line Holdings Ltd.* 43 1,602 Royal Caribbean Cruises Ltd. 35 2,814 Starbucks Corp. 239 18,745 Wynn Resorts Ltd. 20 2,160 Yum! Brands, Inc. 61 5,444
88,233 Household Durables - 0.5% DR Horton, Inc. 68 3,622 Garmin Ltd. 29 2,563 Leggett & Platt, Inc. 27 1,071 Lennar Corp., Class A 56 3,379 Mohawk Industries, Inc.* 12 1,454 Newell Brands, Inc. 77 1,188 NVR, Inc.* 1 3,667 PulteGroup, Inc. 52 2,091 Whirlpool Corp. 13 1,662
20,697 Household Products - 2.3% Church & Dwight Co., Inc. 50 3,476 Clorox Co. (The) 25 3,986 Colgate-Palmolive Co. 174 11,757 Kimberly-Clark Corp. 69 9,052 Procter & Gamble Co. (The) 505 57,181
85,452 Independent Power and Renewable Electricity Producers - 0.1% AES Corp. 134 2,242 NRG Energy, Inc. 51 1,694
3,936 Industrial Conglomerates - 1.8% 3M Co. 116 17,312 General Electric Co. 1,768 19,236 Honeywell International, Inc. 145 23,514 Roper Technologies, Inc. 21 7,386
67,448 Insurance - 3.0% Aflac, Inc. 149 6,385 Allstate Corp. (The) 66 6,946 American International Group, Inc. 176 7,420 Aon plc 47 9,776 Arthur J Gallagher & Co. 38 3,705 Assurant, Inc. 12 1,447 Chubb Ltd. 92 13,343 Cincinnati Financial Corp. 31 2,890 Everest Re Group Ltd. 8 1,983 Globe Life, Inc. 20 1,853

S&P 500® Ex-Technology ETF Schedule of Portfolio Investments February 29, 2020 (Unaudited)
Investments Shares Value ($) Hartford Financial Services Group, Inc. (The) 73 3,646 Lincoln National Corp. 40 1,816 Loews Corp. 52 2,373 Marsh & McLennan Cos., Inc. 102 10,665 MetLife, Inc. 158 6,750 Principal Financial Group, Inc. 52 2,308 Progressive Corp. (The) 117 8,560 Prudential Financial, Inc. 81 6,111 Travelers Cos., Inc. (The) 52 6,230 Unum Group 42 979 Willis Towers Watson plc 26 4,921 WR Berkley Corp. 29 1,947
112,054 Interactive Media & Services - 7.0% Alphabet, Inc., Class A* 61 81,694 Alphabet, Inc., Class C* 61 81,699 Facebook, Inc., Class A* 487 93,733 Twitter, Inc.* 157 5,213
262,339 Internet & Direct Marketing Retail - 4.8% Amazon.com, Inc.* 84 158,235 Booking Holdings, Inc.* 8 13,565 eBay, Inc. 155 5,369 Expedia Group, Inc. 28 2,762
179,931 Leisure Products - 0.1% Hasbro, Inc. 26 2,009
Life Sciences Tools & Services - 1.3% Agilent Technologies, Inc. 63 4,855 Illumina, Inc.* 30 7,970 IQVIA Holdings, Inc.* 37 5,161 Mettler-Toledo International, Inc.* 5 3,508 PerkinElmer, Inc. 22 1,902 Thermo Fisher Scientific, Inc. 81 23,555 Waters Corp.* 13 2,534
49,485 Machinery - 2.1% Caterpillar, Inc. 112 13,915 Cummins, Inc. 31 4,690 Deere & Co. 64 10,015 Dover Corp. 29 2,979 Flowserve Corp. 26 1,045 Fortive Corp. 60 4,150 IDEX Corp. 15 2,220 Illinois Tool Works, Inc. 59 9,899 Ingersoll-Rand plc 49 6,323 PACCAR, Inc. 70 4,683 Parker-Hannifin Corp. 26 4,804 Pentair plc 34 1,339 Snap-on, Inc. 11 1,592 Stanley Black & Decker, Inc. 31 4,455 Westinghouse Air Brake Technologies Corp. 37 2,542 Xylem, Inc. 36 2,784
77,435 Media - 1.8% Charter Communications, Inc., Class A* 32 15,781 Comcast Corp., Class A 919 37,155 Discovery, Inc., Class A* 32 822 Discovery, Inc., Class C* 68 1,707
Investments Shares Value ($) DISH Network Corp., Class A* 53 1,777 Fox Corp., Class A 72 2,213 Fox Corp., Class B 33 1,005 Interpublic Group of Cos., Inc. (The) 78 1,666 News Corp., Class A 79 954 News Corp., Class B 25 311 Omnicom Group, Inc. 44 3,048 ViacomCBS, Inc. 109 2,683
69,122 Metals & Mining - 0.3% Freeport-McMoRan, Inc. 294 2,928 Newmont Corp. 166 7,409 Nucor Corp. 61 2,522
12,859 Multiline Retail - 0.7% Dollar General Corp. 52 7,816 Dollar Tree, Inc.* 48 3,985 Kohl's Corp. 32 1,253 Macy's, Inc. 63 834 Nordstrom, Inc. 22 763 Target Corp. 103 10,609
25,260 Multi-Utilities - 1.4% Ameren Corp. 50 3,950 CenterPoint Energy, Inc. 102 2,348 CMS Energy Corp. 57 3,444 Consolidated Edison, Inc. 67 5,281 Dominion Energy, Inc. 167 13,056 DTE Energy Co. 39 4,355 NiSource, Inc. 76 2,054 Public Service Enterprise Group, Inc. 102 5,234 Sempra Energy 57 7,967 WEC Energy Group, Inc. 64 5,909
53,598 Oil, Gas & Consumable Fuels - 4.3% Apache Corp. 76 1,894 Cabot Oil & Gas Corp. 83 1,156 Chevron Corp. 383 35,749 Cimarex Energy Co. 21 694 Concho Resources, Inc. 41 2,789 ConocoPhillips 222 10,749 Devon Energy Corp. 78 1,267 Diamondback Energy, Inc. 33 2,046 EOG Resources, Inc. 119 7,528 Exxon Mobil Corp. 858 44,136 Hess Corp. 53 2,978 HollyFrontier Corp. 30 1,010 Kinder Morgan, Inc. 394 7,553 Marathon Oil Corp. 162 1,341 Marathon Petroleum Corp. 131 6,212 Noble Energy, Inc. 97 1,536 Occidental Petroleum Corp. 181 5,926 ONEOK, Inc. 84 5,604 Phillips 66 90 6,737 Pioneer Natural Resources Co. 34 4,175 Valero Energy Corp. 83 5,499 Williams Cos., Inc. (The) 245 4,667
161,246 Personal Products - 0.2% Coty, Inc., Class A 60 554

S&P 500® Ex-Technology ETF Schedule of Portfolio Investments February 29, 2020 (Unaudited)
Investments Shares Value ($) Estee Lauder Cos., Inc. (The), Class A 45 8,262
8,816 Pharmaceuticals - 6.0% Allergan plc 66 12,584 Bristol-Myers Squibb Co. 476 28,113 Eli Lilly & Co. 171 21,568 Johnson & Johnson 533 71,678 Merck & Co., Inc. 515 39,428 Mylan NV* 104 1,788 Perrigo Co. plc 27 1,369 Pfizer, Inc. 1,120 37,430 Zoetis, Inc. 96 12,790
226,748 Professional Services - 0.5% Equifax, Inc. 25 3,551 IHS Markit Ltd. 81 5,770 Nielsen Holdings plc 72 1,311 Robert Half International, Inc. 25 1,260 Verisk Analytics, Inc. 33 5,119
17,011 Real Estate Management & Development - 0.1% CBRE Group, Inc., Class A* 68 3,818
Road & Rail - 1.3% CSX Corp. 157 11,061 JB Hunt Transport Services, Inc. 17 1,639 Kansas City Southern 20 3,014 Norfolk Southern Corp. 53 9,665 Old Dominion Freight Line, Inc. 13 2,519 Union Pacific Corp. 141 22,533
50,431 Specialty Retail - 3.1% Advance Auto Parts, Inc. 14 1,862 AutoZone, Inc.* 5 5,162 Best Buy Co., Inc. 46 3,480 CarMax, Inc.* 33 2,881 Gap, Inc. (The) 43 616 Home Depot, Inc. (The) 221 48,143 L Brands, Inc. 47 1,018 Lowe's Cos., Inc. 155 16,518 O'Reilly Automotive, Inc.* 15 5,531 Ross Stores, Inc. 73 7,941 Tiffany & Co. 22 2,939 TJX Cos., Inc. (The) 246 14,711 Tractor Supply Co. 24 2,124 Ulta Beauty, Inc.* 12 3,085
116,011 Textiles, Apparel & Luxury Goods - 0.9% Capri Holdings Ltd.* 31 800 Hanesbrands, Inc. 73 967 NIKE, Inc., Class B 252 22,524 PVH Corp. 15 1,112 Ralph Lauren Corp. 10 1,055 Tapestry, Inc. 56 1,313 Under Armour, Inc., Class A* 38 539 Under Armour, Inc., Class C* 39 487 VF Corp. 66 4,752
33,549 Tobacco - 1.1% Altria Group, Inc. 379 15,300 Philip Morris International, Inc. 315 25,789
41,089
Investments Shares Value ($) Trading Companies & Distributors - 0.2% Fastenal Co. 116 3,970 United Rentals, Inc.* 15 1,987 WW Grainger, Inc. 9 2,498
8,455 Water Utilities - 0.1% American Water Works Co., Inc. 37 4,575
Wireless Telecommunication Services - 0.2% T-Mobile US, Inc.* 64 5,770
TOTAL COMMON STOCKS (Cost $3,865,363) 3,746,737 SECURITIES LENDING REINVESTMENTS(c) - 0.1% INVESTMENT COMPANIES - 0.1%
BlackRock Liquidity FedFund, Institutional Class 1.49% (Cost $2,370) 2,370 2,370
Investments Principal
Amount ($) Value ($) SHORT-TERM INVESTMENTS - 0.2% REPURCHASE AGREEMENTS(d) - 0.2% Repurchase Agreements with various
counterparties, rates 1.58% - 1.59%, dated 2/28/2020, due 3/2/2020, total to be received $6,074
(Cost $6,074) 6,074 6,074 Total Investments - 99.9%
(Cost $3,873,807) 3,755,181 Other Assets Less Liabilities - 0.1% 4,758 Net Assets - 100.0% 3,759,939

S&P 500® Ex-Technology ETF Schedule of Portfolio Investments February 29, 2020 (Unaudited)
* Non-income producing security. (a) The security or a portion of this security is on loan at February
29, 2020. The total value of securities on loan at February 29, 2020 was $2,276, collateralized in the form of cash with a value of $2,370 that was reinvested in the securities shown in the Securities Lending Reinvestment section of the Schedule of Investments.
(b) Represents less than 0.05% of net assets. (c) The security was purchased with cash collateral held from
securities on loan at February 29, 2020. The total value of securities purchased was $2,370.
(d) The Fund invests in Repurchase Agreements jointly with other funds in the Trust. See "Repurchase Agreements" in the Notes to Schedules of Portfolio of Investments to view the details of each individual agreement and counterparty as well as a description of the securities subject to repurchase.

S&P MidCap 400® Dividend Aristocrats ETF Schedule of Portfolio Investments February 29, 2020 (Unaudited)
Investments Shares Value ($) COMMON STOCKS - 99.7%
Banks - 11.3% Bank OZK 535,861 13,605,511 Commerce Bancshares, Inc. 217,604 13,282,548 Cullen/Frost Bankers, Inc. 158,338 12,412,116 Prosperity Bancshares, Inc. 218,185 14,094,751 UMB Financial Corp. 227,365 13,221,275 United Bankshares, Inc. 405,082 11,698,768
78,314,969 Capital Markets - 5.8% Eaton Vance Corp. 316,975 13,078,388 FactSet Research Systems, Inc. 53,536 14,240,041 SEI Investments Co. 232,396 12,714,385
40,032,814 Chemicals - 1.9% RPM International, Inc. 202,737 12,997,469
Commercial Services & Supplies - 4.1% Healthcare Services Group, Inc. 561,042 15,451,097 MSA Safety, Inc. 108,438 13,193,651
28,644,748 Containers & Packaging - 5.6% AptarGroup, Inc. 126,427 12,777,977 Silgan Holdings, Inc. 473,935 13,568,759 Sonoco Products Co. 251,930 12,145,545
38,492,281 Electrical Equipment - 4.0% nVent Electric plc 577,677 13,870,025 Regal Beloit Corp. 177,894 13,811,690
27,681,715 Equity Real Estate Investment Trusts (REITs) - 3.9% National Retail Properties, Inc. 262,003 13,322,852 Omega Healthcare Investors, Inc. 342,018 13,543,913
26,866,765 Food & Staples Retailing - 2.1% Casey's General Stores, Inc. 89,404 14,574,640
Food Products - 6.0% Flowers Foods, Inc. 683,559 14,717,025 Lancaster Colony Corp. 90,758 13,109,993 Tootsie Roll Industries, Inc.(a) 429,406 13,775,349
41,602,367 Gas Utilities - 9.1% National Fuel Gas Co. 341,859 12,515,458 New Jersey Resources Corp. 342,804 12,104,409 ONE Gas, Inc. 155,165 12,745,253 Spire, Inc. 175,053 13,137,728 UGI Corp. 339,736 12,244,086
62,746,934 Health Care Equipment & Supplies - 2.1% West Pharmaceutical Services, Inc. 95,061 14,312,384
Hotels, Restaurants & Leisure - 1.9% Cracker Barrel Old Country Store, Inc. 93,845 13,450,804
Industrial Conglomerates - 2.0% Carlisle Cos., Inc. 94,591 13,743,127
Insurance - 9.6% Brown & Brown, Inc. 353,957 15,223,690
Investments Shares Value ($) Mercury General Corp. 304,707 13,196,860 Old Republic International Corp. 633,267 12,488,025 RenaissanceRe Holdings Ltd. 77,887 13,271,945 RLI Corp. 154,691 12,434,063
66,614,583 Leisure Products - 1.9% Polaris, Inc. 161,228 13,306,147
Machinery - 9.4% Donaldson Co., Inc. 277,313 12,501,270 Graco, Inc. 284,841 14,048,358 Lincoln Electric Holdings, Inc. 159,135 13,031,565 Nordson Corp. 86,597 12,582,544 Toro Co. (The) 180,519 12,894,473
65,058,210 Media - 3.6% John Wiley & Sons, Inc., Class A 314,618 11,700,644 Meredith Corp. 496,841 13,091,760
24,792,404 Metals & Mining - 1.8% Royal Gold, Inc. 128,902 12,435,176
Multi-Utilities - 3.9% Black Hills Corp. 179,527 12,961,849 MDU Resources Group, Inc. 496,841 13,777,401
26,739,250 Personal Products - 1.4% Nu Skin Enterprises, Inc., Class A 406,641 9,970,837
Road & Rail - 1.6% Ryder System, Inc. 286,106 10,883,472
Specialty Retail - 1.4% Aaron's, Inc. 240,821 9,471,490
Trading Companies & Distributors - 1.8% MSC Industrial Direct Co., Inc., Class A 205,951 12,731,891
Water Utilities - 1.8% Essential Utilities, Inc. 285,496 12,279,183
Wireless Telecommunication Services - 1.7% Telephone & Data Systems, Inc. 598,944 12,062,732
TOTAL COMMON STOCKS (Cost $720,670,616) 689,806,392 SECURITIES LENDING REINVESTMENTS(b) - 1.0% INVESTMENT COMPANIES - 1.0%
BlackRock Liquidity FedFund, Institutional Class 1.49% (Cost $7,097,236) 7,097,236 7,097,236

S&P MidCap 400® Dividend Aristocrats ETF Schedule of Portfolio Investments February 29, 2020 (Unaudited)
Investments Principal
Amount ($) Value ($) SHORT-TERM INVESTMENTS - 0.3% REPURCHASE AGREEMENTS(c) - 0.3% Repurchase Agreements with various
counterparties, rates 1.58% - 1.59%, dated 2/28/2020, due 3/2/2020, total to be received $2,106,759
(Cost $2,106,481) 2,106,481 2,106,481 Total Investments - 101.0%
(Cost $729,874,333) 699,010,109 Liabilities in excess of other assets - (1.0%) (6,719,250) Net Assets - 100.0% 692,290,859
(a) The security or a portion of this security is on loan at February 29, 2020. The total value of securities on loan at February 29, 2020 was $6,551,923, collateralized in the form of cash with a value of $7,097,236 that was reinvested in the securities shown in the Securities Lending Reinvestment section of the Schedule of Investments.
(b) The security was purchased with cash collateral held from securities on loan at February 29, 2020. The total value of securities purchased was $7,097,236.
(c) The Fund invests in Repurchase Agreements jointly with other funds in the Trust. See "Repurchase Agreements" in the Notes to Schedules of Portfolio of Investments to view the details of each individual agreement and counterparty as well as a description of the securities subject to repurchase.

S&P Technology Dividend Aristocrats ETF Schedule of Portfolio Investments February 29, 2020 (Unaudited)
Investments Shares Value ($) COMMON STOCKS - 99.6%
Communications Equipment - 5.2% Cisco Systems, Inc. 14,202 567,086 Motorola Solutions, Inc. 3,920 649,466
1,216,552 Electronic Equipment, Instruments & Components - 15.0% Amphenol Corp., Class A 6,534 599,037 Badger Meter, Inc. 11,055 665,622 Corning, Inc. 23,500 560,710 FLIR Systems, Inc. 12,834 545,060 Littelfuse, Inc. 3,632 579,958 TE Connectivity Ltd. 7,042 583,570
3,533,957 Entertainment - 2.8% Activision Blizzard, Inc. 11,551 671,460
Internet & Direct Marketing Retail - 5.9% Expedia Group, Inc. 6,333 624,561 PetMed Express, Inc.(a) 28,726 758,367
1,382,928 IT Services - 26.0% Accenture plc, Class A 3,327 600,823 Automatic Data Processing, Inc. 3,907 604,569 Booz Allen Hamilton Holding Corp. 8,962 638,991 Broadridge Financial Solutions, Inc. 5,258 548,725 Cass Information Systems, Inc. 12,021 564,386 International Business Machines Corp. 4,843 630,316 Jack Henry & Associates, Inc. 4,656 706,501 Mastercard, Inc., Class A 2,149 623,747 Paychex, Inc. 7,777 602,562 Visa, Inc., Class A 3,351 609,078
6,129,698 Semiconductors & Semiconductor Equipment - 28.5% Analog Devices, Inc. 5,786 630,963 Broadcom, Inc. 2,227 607,125 KLA Corp. 3,868 594,550 Maxim Integrated Products, Inc. 11,149 620,107 Microchip Technology, Inc. 6,373 578,095 MKS Instruments, Inc. 5,925 593,626 NVIDIA Corp. 2,787 752,685 Power Integrations, Inc. 6,784 590,547 QUALCOMM, Inc. 7,495 586,858 Texas Instruments, Inc. 5,226 596,496 Xilinx, Inc. 6,879 574,328
6,725,380 Software - 8.3% Intuit, Inc. 2,399 637,774 Microsoft Corp. 4,205 681,252 Oracle Corp. 12,733 629,774
1,948,800 Technology Hardware, Storage & Peripherals - 7.9% Apple, Inc. 2,193 599,478 Hewlett Packard Enterprise Co. 46,357 592,906 HP, Inc. 31,773 660,561
1,852,945 TOTAL COMMON STOCKS (Cost $25,440,444) 23,461,720
Investments Principal
Amount ($) Value ($) SHORT-TERM INVESTMENTS - 0.3% REPURCHASE AGREEMENTS(b) - 0.3% Repurchase Agreements with various
counterparties, rates 1.58% - 1.59%, dated 2/28/2020, due 3/2/2020, total to be received $59,494
(Cost $59,485) 59,485 59,485 Total Investments - 99.9%
(Cost $25,499,929) 23,521,205 Other Assets Less Liabilities - 0.1% 33,884 Net Assets - 100.0% 23,555,089
(a) The security or a portion of this security is on loan at February 29, 2020. The total value of securities on loan at February 29, 2020 was $682,519, collateralized in the form of U.S. Government Treasury Securities, interest rates ranging from 0.00% – 6.13%, and maturity dates ranging from March 26, 2020 – May 15, 2048; a total value of $703,706.
(b) The Fund invests in Repurchase Agreements jointly with other funds in the Trust. See "Repurchase Agreements" in the Notes to Schedules of Portfolio of Investments to view the details of each individual agreement and counterparty as well as a description of the securities subject to repurchase.

Short Term USD Emerging Markets Bond ETF Schedule of Portfolio Investments February 29, 2020 (Unaudited)
Investments Principal
Amount ($) Value ($) FOREIGN GOVERNMENT SECURITIES - 74.0%
Abu Dhabi Government Bond 2.50%, 10/11/2022(a) 200,000 203,428
Arab Republic of Egypt 6.13%, 1/31/2022(a) 200,000 206,601
Argentina Government International Bond 6.88%, 4/22/2021 150,000 74,625 4.63%, 1/11/2023 100,000 43,001
Brazilian Government International Bond 2.63%, 1/5/2023 200,000 202,702
Colombia Government International Bond 2.63%, 3/15/2023 200,000 202,832
Croatia Government International Bond 5.50%, 4/4/2023(a) 200,000 219,983
Export-Import Bank of China (The) 2.63%, 3/14/2022(a) 340,000 346,760
Export-Import Bank of India 4.00%, 1/14/2023(a) 200,000 210,245
Hungary Government International Bond 6.38%, 3/29/2021 150,000 157,051 5.38%, 2/21/2023 50,000 54,825 5.38%, 3/25/2024 14,000 15,869
Indonesia Government International Bond 5.88%, 3/13/2020(a) 170,000 170,068 3.38%, 4/15/2023(a) 200,000 206,925
Kingdom of Bahrain 6.13%, 7/5/2022(a) 200,000 213,000
Kingdom of Saudi Arabia 2.38%, 10/26/2021(a) 200,000 201,188
Lithuania Government International Bond 6.13%, 3/9/2021(a) 150,000 156,600
Mexico Government International Bond 3.63%, 3/15/2022 82,000 84,994 4.00%, 10/2/2023 70,000 74,840
Oman Government Bond 3.63%, 6/15/2021(a) 200,000 200,050
Perusahaan Penerbit SBSN Indonesia III 3.40%, 3/29/2022(a) 200,000 204,682
Poland Government International Bond 5.00%, 3/23/2022 135,000 144,045 4.00%, 1/22/2024 100,000 108,827
Qatar Government International Bond 3.88%, 4/23/2023(a) 200,000 211,727
Republic of Ecuador 10.75%, 3/28/2022(a) 200,000 165,502
Republic of Lebanon 8.25%, 4/12/2021(a) 100,000 27,408 6.25%, 5/27/2022 150,000 40,299
Romania Government International Bond 4.38%, 8/22/2023(a) 80,000 85,600
Russian Foreign Bond 4.88%, 9/16/2023(a) 200,000 218,682
South Africa Government International Bond 5.88%, 5/30/2022 100,000 106,745 4.67%, 1/17/2024 100,000 104,625
Sri Lanka Government International Bond 5.88%, 7/25/2022(a) 200,000 201,305
Turkey Government International Bond 5.13%, 3/25/2022 200,000 201,100 7.25%, 12/23/2023 200,000 211,906
Investments Principal
Amount ($) Value ($) Ukraine Government International Bond
7.75%, 9/1/2021(a) 100,000 105,202 7.75%, 9/1/2023(a) 100,000 108,250
TOTAL FOREIGN GOVERNMENT SECURITIES (Cost $5,695,398) 5,491,492 CORPORATE BONDS - 24.0%
Banks - 13.1% Banco del Estado de Chile
3.88%, 2/8/2022(a) 150,000 154,138 Banco do Brasil SA
3.88%, 10/10/2022 200,000 204,000 China Development Bank
2.13%, 6/1/2021(a) 200,000 201,190 QNB Finance Ltd.
2.13%, 9/7/2021(a) 200,000 199,582 Sberbank of Russia
6.13%, 2/7/2022(a) 200,000 212,728 971,638
Diversified Financial Services - 1.4% Gazprom PJSC
6.51%, 3/7/2022(a) 100,000 107,736
Oil, Gas & Consumable Fuels - 9.5% Ecopetrol SA
5.88%, 9/18/2023 25,000 27,656 Petrobras Global Finance BV
6.13%, 1/17/2022 80,000 85,080 Petroleos Mexicanos
4.88%, 1/24/2022 140,000 144,200 5.38%, 3/13/2022 15,000 15,578 3.50%, 1/30/2023 220,000 219,597
Sinopec Group Overseas Development 2016 Ltd. 2.00%, 9/29/2021(a) 214,000 214,886
706,997 TOTAL CORPORATE BONDS (Cost $1,757,043) 1,786,371 SHORT-TERM INVESTMENTS - 0.8% REPURCHASE AGREEMENTS(b) - 0.8% Repurchase Agreements with various
counterparties, rates 1.58% - 1.59%, dated 2/28/2020, due 3/2/2020, total to be received $56,080
(Cost $56,073) 56,073 56,073 Total Investments - 98.8%
(Cost $7,508,514) 7,333,936 Other Assets Less Liabilities - 1.2% 86,741 Net Assets - 100.0% 7,420,677
(a) Security exempt from registration pursuant to Regulation S under the Securities Act of 1933. Regulation S applies to securities offerings that are made outside of the United States and do not involve direct selling efforts in the United States and as such may have restrictions on resale.

Short Term USD Emerging Markets Bond ETF Schedule of Portfolio Investments February 29, 2020 (Unaudited)
(b) The Fund invests in Repurchase Agreements jointly with other funds in the Trust. See "Repurchase Agreements" in the Notes to Schedules of Portfolio of Investments to view the details of each individual agreement and counterparty as well as a description of the securities subject to repurchase.

Short Term USD Emerging Markets Bond ETF Schedule of Portfolio Investments February 29, 2020 (Unaudited)
Short Term USD Emerging Markets Bond ETF invested, as a percentage of net assets, in the following countries as of February 29, 2020: China 10.3% Indonesia 7.8% Mexico 7.3% Russia 7.3% Brazil 6.6% Turkey 5.6% Qatar 5.5% Poland 3.4% Colombia 3.1% Hungary 3.1% Croatia 3.0% Ukraine 2.9% Bahrain 2.9% South Africa 2.8% India 2.8% Egypt 2.8% United Arab Emirates 2.7% Sri Lanka 2.7% Saudi Arabia 2.7% Oman 2.7% Ecuador 2.2% Lithuania 2.1% Chile 2.1% Argentina 1.6% Romania 1.1% Lebanon 0.9% Other 1 2.0% 100.0%
1 Includes any non fixed-income securities and net other assets (liabilities).

PROSHARES TRUST NOTES TO SCHEDULES OF PORTFOLIO INVESTMENTS FEBRUARY 29, 2020 (UNAUDITED) Repurchase Agreements
Each of the Funds may enter into repurchase agreements. Repurchase agreements are primarily used by the Funds as short-term investments for cash positions. Under a repurchase agreement, a Fund purchases one or more debt securities and simultaneously agrees to sell those securities back to the seller at a mutually agreed-upon future price and date, normally one day or a few days later. The resale price is greater than the purchase price, reflecting an agreed-upon market interest rate during the purchaser’s holding period. While the maturities of the underlying securities in repurchase transactions may be more than one year, the term of each repurchase agreement will always be less than one year. The Funds follow certain procedures designed to minimize the risks inherent in such agreements. These procedures include effecting repurchase transactions generally with major global financial institutions whose creditworthiness is monitored by the Advisor. In addition, the value of the collateral underlying the repurchase agreement is required to be at least equal to the repurchase price, including any accrued interest income earned on the repurchase agreement. The Funds may invest in repurchase agreements through joint account arrangements; in such cases, each Fund holds a pro rata share of the collateral and interest income based upon the dollar amount of the repurchase agreements entered into by each Fund. The collateral underlying the repurchase agreement is held by the Fund’s custodian. A repurchase agreement is subject to the risk that the counterparty to the repurchase agreement that sells the securities may default on its obligation to repurchase them. In this circumstance, a Fund may lose money because it may not be able to sell the securities at the agreed upon time and price, the securities may lose value before they can be sold, the selling institution may declare bankruptcy or the Fund may have difficulty exercising rights to the collateral. During periods of high demand for repurchase agreements, the Funds may be unable to invest available cash in these instruments to the extent desired by the Advisor. On February 29, 2020, the Funds had interest in joint repurchase agreements with the following counterparties, for the time periods and rates indicated. Amounts shown in the table below represent Principal Amount, Cost and Value for each respective repurchase agreement. “INSERT RIDER “B-STRATEGIC”

RIDER B
Fund Name
Bank of America
Securities, Inc, 1.59%,
dated 02/28/2020 due
03/02/2020 (1)
BNP Paribas Securities
Corp, 1.58%, dated
02/28/2020 due
03/02/2020 (2)
Credit Suisse New York
Branch 1.58%, dated
02/28/2020 due
03/02/2020 (3)
ING Financial Markets
LLC, 1.58%, dated
02/28/2020 due
03/02/2020 (4)
ING Financial Markets LLC,
1.59%, dated 02/28/2020
due 03/02/2020 (5) Total
Decline of the Retail Store ETF $ 1,710,137 $ 3,809,440 $ 1,368,110 $ 684,055 $ 513,041 $ 8,084,783
DJ Brookfield Global Infrastructure ETF 133,197 296,704 106,557 53,279 39,959 629,696
Equities for Rising Rates ETF 797 1,775 637 319 239 3,767
Global Listed Private Equity ETF 18,569 41,363 14,855 7,427 5,570 87,784
Hedge Replication ETF 1,002,109 2,232,259 801,686 400,843 300,632 4,737,529
High Yield-Interest Rate Hedged 44,591 99,329 35,673 17,836 13,377 210,806
Inflation Expectations ETF 475,511 1,059,232 380,409 190,204 142,654 2,248,010
Investment Grade — Interest Rate Hedged 1,505,262 3,353,069 1,204,210 602,105 451,579 7,116,225
K-1 Free Crude Oil Strategy ETF 2,895,823 6,450,632 2,316,659 1,158,329 868,747 13,690,190
Large Cap Core Plus 7,248,131 16,145,677 5,798,505 2,899,252 2,174,439 34,266,004
Long Online/Short Stores ETF 62,723 139,721 50,179 25,089 18,817 296,529
Managed Futures Strategy ETF 512,009 1,140,534 409,607 204,804 153,603 2,420,557
Merger ETF 106,786 237,872 85,429 42,714 32,036 504,837
Morningstar Alternatives Solution ETF 2,848 6,345 2,279 1,139 854 13,465
MSCI EAFE Dividend Growers ETF 114,913 255,976 91,930 45,965 34,474 543,258
MSCI Emerging Markets Dividend Growers ETF 16,806 37,437 13,445 6,723 5,042 79,453
MSCI Europe Dividend Growers ETF 4,998 11,133 3,998 1,999 1,500 23,628
Online Retail ETF 11,197 24,943 8,958 4,479 3,359 52,936
PET CARE ETF 16,014 35,672 12,811 6,406 4,804 75,707
RAFITM
Long/Short 158,431 352,916 126,745 63,373 47,529 748,994
Russell 2000 Dividend Growers ETF 345,073 768,673 276,059 138,029 103,522 1,631,356
Russell U.S. Dividend Growers ETF 10,502 23,394 8,402.00 4,201 3,151 49,650
S&P 500® Bond ETF 44,388 98,877 35,511 17,755 13,316 209,847
S&P 500® Dividend Aristocrats ETF 1,460,165 3,252,612 1,168,132 584,066 438,050 6,903,025
S&P 500® Ex-Energy ETF 5,798 12,915 4,639 2,319 1,739 27,410
S&P 500® Ex-Financials ETF 846 1,886 676 339 254 4,001
S&P 500® Ex-Health Care ETF 1,198 2,670 959 479 360 5,666
S&P 500® Ex-Technology ETF 1,285 2,862 1,028 514 385 6,074
S&P MidCap 400® Dividend Aristocrats ETF 445,575 992,545 356,459 178,230 133,672 2,106,481
S&P Technology Dividend Aristocrats ETF 12,583 28,029 10,065.00 5,033 3,775 59,485
Short Term USD Emerging Markets Bond ETF 11,861 26,421 9,489 4,744 3,558 56,073
18,380,126$ 40,942,913$ 14,704,101$ 7,352,049$ 0 5,514,037$ 0 86,893,226$
Each Repurchase Agreement was fully collateralized by US government and/or agency securities at February 29, 2020 as follows:
(4) US Treasury Bills, 0%, due 4/21/2020 to 1/28/2021;US Treasury Bonds, 3.88% to 4.38%, due 11/15/2039 to 8/15/2040;US Treasury Notes, 0.13% to 2.88%, due 7/31/2021 to 2/15/2030, which had an aggregate value at the Trust level of
$408,000,104.
(5) Federal Farm Credit Bank, 1.95%, due 12/26/2023; Federal Home Loan Bank, 0% to 3.38%, due 4/6/2020 to 12/8/2023; Federal Home Loan Mortgage Corp, 2.25%, due 11/24/2020; US Treasury Notes, 0.63% to 2.75%, due 1/31/2021 to
2/15/2027 which had an aggregate value at the Trust level of $306,000,064.
(1) US Treasury Bonds, 3.63% to 4.25%, due 11/15/2040 to 2/15/2044; US Treasury Notes, 0.13% to 3.13%, due 2/28/2021 to 11/15/2028, which had an aggregate value at the Trust level of $1,020,000,211.
(2) US Treasury Bills, 0%, due 4/7/2020 to 2/25/2021; US Treasury Bonds, 0% to 8.75%, due 5/15/2020 to 8/15/2049; US Treasury Notes, 0.13% to 2.75%, due 2/29/2020 to 1/15/2029, which had an aggregate value at the Trust level of
$2,272,115,472.(3)
US Treasury Bonds, 0% to 6.13%, due 8/15/2020 to 2/15/2050; US Treasury Notes, 0.13% to 2.75%, due 3/31/2020 to 1/15/2030, which had an aggregate value at the Trust level of $816,107,440.