Embed Size (px)
Citation preview
remote sensing
Communication
Decline in Phytoplankton Biomass along IndianCoastal Waters due to COVID-19 Lockdown
Deepak R. Mishra 1,* , Abhishek Kumar 1 , Pradipta R. Muduli 2 , Sk. Md. Equeenuddin 3,Gurdeep Rastogi 2, Tamoghna Acharyya 4 and Debadatta Swain 5
1 Department of Geography, University of Georgia, Athens, GA 30602, USA; [email protected] Wetland Research and Training Centre, Chilika Development Authority, Balugaon 752030, India;
[email protected] (P.R.M.); [email protected] (G.R.)3 Department of Earth and Atmospheric Sciences, National Institute of Technology, Rourkela 769008, India;
[email protected] School of Sustainability, Xavier University, Puri 752050, India; [email protected] School of Earth, Ocean and Climate Sciences, Indian Institute of Technology, Bhubaneswar 752050, India;
[email protected]* Correspondence: [email protected]; Tel.: +1-706-542-8927
Received: 1 June 2020; Accepted: 9 August 2020; Published: 11 August 2020�����������������
Abstract: The SARS-CoV-2 (or COVID-19) lockdown in India, which started at an early stage of itsinfection curve, has been one of the strictest in the world. Air quality has improved in all urban centersin India, a major emitter of greenhouse gases (GHG). This study is based on the hypothesis that anabrupt halt in all urban activities resulted in a massive decline in NO2 emissions and has also alteredcoastal nitrogen (N) inputs; in-turn, this affected the trophic status of coastal waters across the country.We present the first evidence of an overall decline in pre-monsoon chlorophyll-a, a proxy forphytoplankton biomass, in coastal waters off urban centers during the peak of the lockdown in April.The preliminary field data and indirect evidence suggests the reduction in coastal chlorophyll-a couldbe linked to a net decline in nutrient loading, particularly of bioavailable N through watershed fluxesand atmospheric deposition. The preliminary results stress the importance of a further understandingof the relationship between fluctuations in anthropogenic N, due to lockdown measures and coastalecosystem responses, as countries open-up to a business-as-usual scenario.
Keywords: water quality; phytoplankton density; atmospheric deposition; greenhouse gas emission;bioavailable nitrogen; SARS-CoV-2
The COVID-19 pandemic resulted in one of the world’s largest and strictest national lockdownsin India. Roughly 1.3 billion people were ordered to stay home starting 25 March 2020 for 21 days forPhase-1 of the lockdown, followed by 19 more days for Phase-2 and 14 days for Phase-3 and Phase-4.Phase-5 of the lockdown started on 1 June and ended on 30 June. The country is still under partialdaily lockdown until 31 August. Even though each stage of the lockdown witnessed a slight relaxationin regulations, urban activities remained largely prohibited during all phases. A massive decline in allurban activities including vehicles on roads, transportation services, and air traffic has resulted in asignificant drop in anthropogenic contributions to greenhouse gas (GHG) emissions and air pollution,as reported by many news sources. Some of the early analyses used satellite data from Sentinel-5P(European Space Agency) and revealed a notable drop in Nitrogen Oxide (NO2), up to 50% over someparts of India (Source: ESA, CC BY-SA 3.0 IGO) (Figure 1).
In this preliminary study, we hypothesize that an overall decline in N input from atmosphericdeposition, and point and non-point source urban runoff due to the country-wide lockdown,will improve coastal water quality and decrease phytoplankton biomass, as excessive N inputs are widelylinked to coastal eutrophication. There are four major sources of anthropogenic N loading to coastal
Remote Sens. 2020, 12, 2584; doi:10.3390/rs12162584 www.mdpi.com/journal/remotesensing
Remote Sens. 2020, 12, 2584 2 of 8
waters: agricultural and industrial runoff, urban nutrient pollution, urban nitrogenous GHG emissionsand atmospheric deposition, and coastal upwelling [1–3]. Two of these, namely urban runoff throughthe watershed and atmospheric deposition, experienced a significant decline due to the widespreadlockdown, resulting in an abrupt suspension of otherwise large-scale anthropogenic activities.Many previous long-term studies have concluded that atmospheric deposition of N into marinewaters is a significant source, contributing up to 40% of N in coastal waters [1–4]. For example, a studyby Voss et al. [2] concluded that more than half of the N reaches the coastal waters via river input andatmospheric deposition. Globally, continental shelves receive about 7.5 Tg N/yr from atmosphericdeposition, almost all from anthropogenic sources [2]. Therefore, our hypothesis that a net deficiencyin bioavailable N, during the peak lockdown period in April 2020, temporarily altered the seasonaltrophic status of Indian coastal waters through an overall decline in pre-monsoon phytoplanktonbiomass, is well-grounded in the existing literature [5,6]. In the absence of field-collected atmosphericdeposition data, we analyzed remote sensing datasets and NASA model outputs. This can be used asdirect and indirect evidence as proxies of nutrient loading and to showcase the ecosystem responsebecause of the decline in N fluxes.
Remote Sens. 2020, 12, x FOR PEER REVIEW 2 of 8
linked to coastal eutrophication. There are four major sources of anthropogenic N loading to coastal waters: agricultural and industrial runoff, urban nutrient pollution, urban nitrogenous GHG emissions and atmospheric deposition, and coastal upwelling [1–3]. Two of these, namely urban runoff through the watershed and atmospheric deposition, experienced a significant decline due to the widespread lockdown, resulting in an abrupt suspension of otherwise large-scale anthropogenic activities. Many previous long-term studies have concluded that atmospheric deposition of N into marine waters is a significant source, contributing up to 40% of N in coastal waters [1–4]. For example, a study by Voss et al. [2] concluded that more than half of the N reaches the coastal waters via river input and atmospheric deposition. Globally, continental shelves receive about 7.5 Tg N/yr from atmospheric deposition, almost all from anthropogenic sources [2]. Therefore, our hypothesis that a net deficiency in bioavailable N, during the peak lockdown period in April 2020, temporarily altered the seasonal trophic status of Indian coastal waters through an overall decline in pre-monsoon phytoplankton biomass, is well-grounded in the existing literature [5,6]. In the absence of field-collected atmospheric deposition data, we analyzed remote sensing datasets and NASA model outputs. This can be used as direct and indirect evidence as proxies of nutrient loading and to showcase the ecosystem response because of the decline in N fluxes.
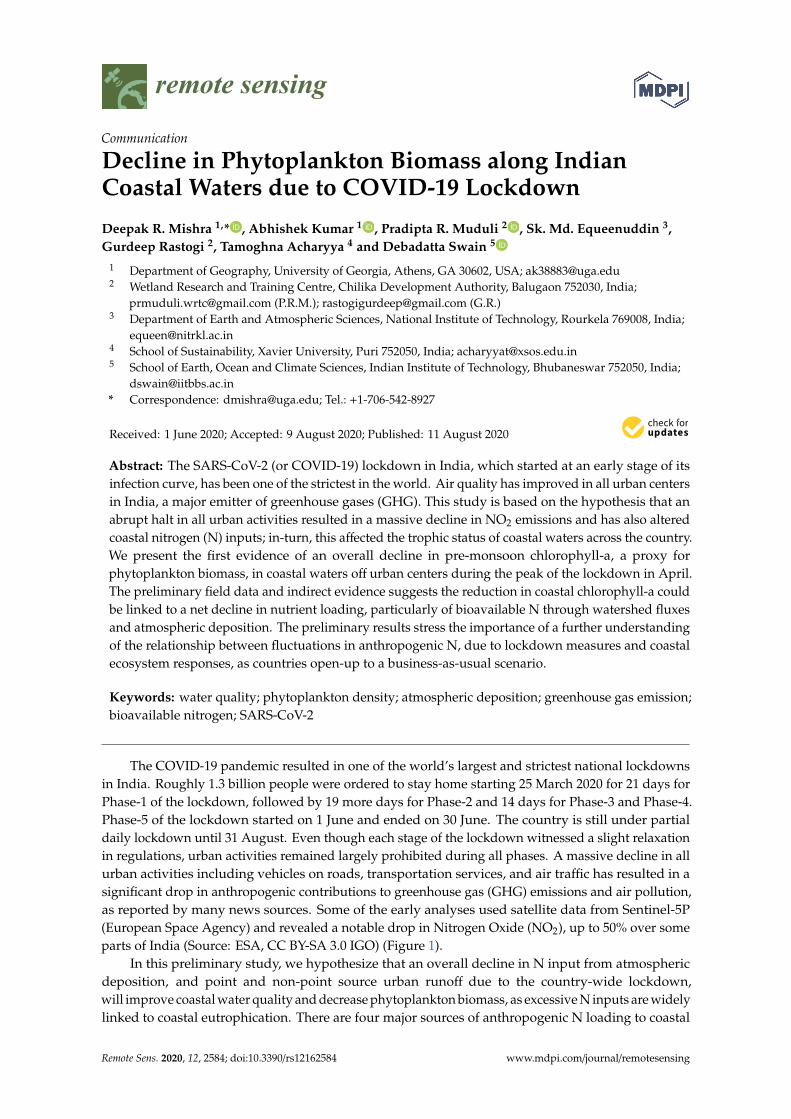
Figure 1. (Top) NO2 concentration over India captured by the European Space Agency’s TROPOspheric Monitoring Instrument (TROPOMI) instrument on the Copernicus Sentinel-5P satellite. (Bottom) Comparison of chlorophyll-a levels between April 2019 and April 2020 in the coastal waters of India. Note: the mapped area is not the same in both years due to the differences in extent of cloud cover.
As direct evidence of declined NO2 over India during the lockdown, we extracted the average tropospheric column NO2 concentration (µmol/m2) data for March-April 2019 and 2020, using the European Space Agency’s TROPOspheric Monitoring Instrument (TROPOMI) onboard the
Figure 1. (Top) NO2 concentration over India captured by the European Space Agency’sTROPOspheric Monitoring Instrument (TROPOMI) instrument on the Copernicus Sentinel-5P satellite.(Bottom) Comparison of chlorophyll-a levels between April 2019 and April 2020 in the coastal watersof India. Note: the mapped area is not the same in both years due to the differences in extent ofcloud cover.
As direct evidence of declined NO2 over India during the lockdown, we extracted the averagetropospheric column NO2 concentration (µmol/m2) data for March-April 2019 and 2020, using theEuropean Space Agency’s TROPOspheric Monitoring Instrument (TROPOMI) onboard the Copernicus
Remote Sens. 2020, 12, 2584 3 of 8
Sentinel-5P satellite. We selected all available images from March 25 to April 20 in 2019 and 2020 overIndia and computed the mean value for each pixel for that period in Google Earth Engine. Similarly,more than 100 Sentinel-3 Ocean and Land Color Instrument (OLCI) Level-1 full resolution (300-m)scenes were obtained from the European Space Agency’s (ESA) Copernicus Open Access Hub website(https://scihub.copernicus.eu/) and were processed using the Sentinel Application Platform (SNAP)toolbox (https://step.esa.int/main/toolboxes/snap/). We then used more than 10 images per monthto generate a cloud-free and sun-glint free coastline data covering four months (January-April) eachduring 2019 and 2020. Scene-specific atmospheric correction was performed using the Case-2 RegionalCoast Color (C2RCC) processor available in SNAP [7]. The C2RCC processor uses an embeddedneural network (NN) algorithm to produce chlorophyll-a products after implementing a scene-specificatmospheric correction procedure [8]. We masked out clouds and sun-glint using an OLCI Band 21(1020 nm) from the NN derived chlorophyll-a images. We also masked out open-ocean pixels by usinga threshold of 1 mg/m3 or less to retain only coastal pixels for analysis. We used the SNAP toolboxstatistics to estimate mean, and standard deviation for coastal chlorophyll-a composites for four largecoastal regions of India (East Coast: Kolkata to Puri; West Coast: Mumbai to Karwar; Northwest coast:Porbandar to Mumbai; and Southwest Coast: Karwar to Kollam). Before and during the lockdown,monthly comparisons were made for the four coastal regions to estimate the changes in chlorophyll-alevels, a proxy for phytoplankton densities, biomass, and algal blooms (Figures 1–3).
Remote Sens. 2020, 12, x FOR PEER REVIEW 3 of 8
Copernicus Sentinel-5P satellite. We selected all available images from March 25 to April 20 in 2019 and 2020 over India and computed the mean value for each pixel for that period in Google Earth Engine. Similarly, more than 100 Sentinel-3 Ocean and Land Color Instrument (OLCI) Level-1 full resolution (300-m) scenes were obtained from the European Space Agency’s (ESA) Copernicus Open Access Hub website (https://scihub.copernicus.eu/) and were processed using the Sentinel Application Platform (SNAP) toolbox (https://step.esa.int/main/toolboxes/snap/). We then used more than 10 images per month to generate a cloud-free and sun-glint free coastline data covering four months (January-April) each during 2019 and 2020. Scene-specific atmospheric correction was performed using the Case-2 Regional Coast Color (C2RCC) processor available in SNAP [7]. The C2RCC processor uses an embedded neural network (NN) algorithm to produce chlorophyll-a products after implementing a scene-specific atmospheric correction procedure [8]. We masked out clouds and sun-glint using an OLCI Band 21 (1020 nm) from the NN derived chlorophyll-a images. We also masked out open-ocean pixels by using a threshold of 1 mg/m3 or less to retain only coastal pixels for analysis. We used the SNAP toolbox statistics to estimate mean, and standard deviation for coastal chlorophyll-a composites for four large coastal regions of India (East Coast: Kolkata to Puri; West Coast: Mumbai to Karwar; Northwest coast: Porbandar to Mumbai; and Southwest Coast: Karwar to Kollam). Before and during the lockdown, monthly comparisons were made for the four coastal regions to estimate the changes in chlorophyll-a levels, a proxy for phytoplankton densities, biomass, and algal blooms (Figures 1–3).
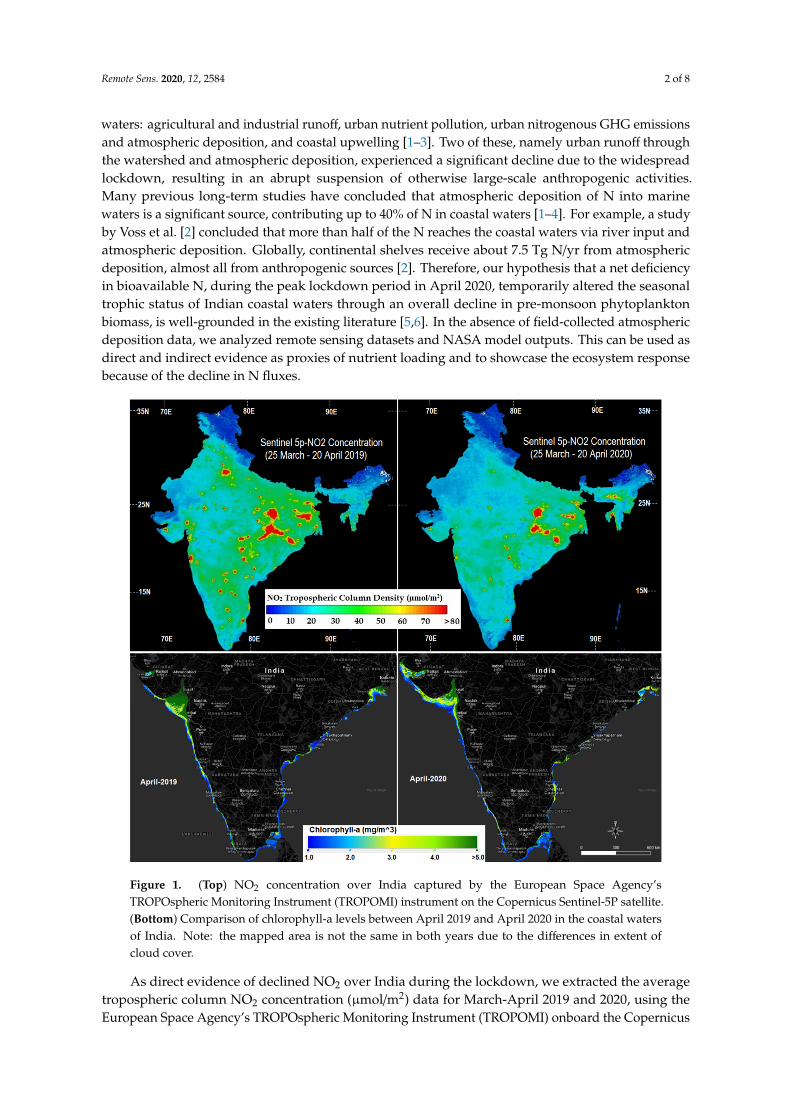
Figure 2. Region-wide comparison of the mean chlorophyll-a concentration between April 2019 (top row)-April 2020 (bottom row): (a,a|) Kolkata to Puri (East Coast- Bay of Bengal), (b,b|) Mumbai to Karwar (West Coast- Arabian Sea), (c,c|) Karwar to Kollam (Southwest Coast- Arabian Sea), (d,d|) Porbandar to Mumbai (West Coast- Arabian Sea).
We present the initial evidence of an overall improvement in coastal water quality and a decline in chlorophyll-a, a proxy for phytoplankton biomass [9] in the Indian coastal waters during the peak of the lockdown (Figures 1 and 2). Although the noticeable changes in chlorophyll-a, which declined by 2-fold at places such as the west and northwest coast, were most likely due to the combined effect of declined urban nutrient pollution and reduced atmospheric deposition of bioavailable Nitrogen (N) to coastal zones, we do not have field-collected nutrient data coinciding with the study period to be used as direct evidence. It is well-established in the literature that NO2 generated from urban industries, air and motor traffic, urban transport (road, rail, and air), agricultural activities, and urban waste, plays a significant role in controlling the N fluxes into the coast and maintaining the overall water quality [3–6]. Therefore, we analyzed both short-term and long-term trends in land surface
Figure 2. Region-wide comparison of the mean chlorophyll-a concentration between April 2019(top row)-April 2020 (bottom row): (a,a|) Kolkata to Puri (East Coast- Bay of Bengal), (b,b|) Mumbaito Karwar (West Coast- Arabian Sea), (c,c|) Karwar to Kollam (Southwest Coast- Arabian Sea),(d,d|) Porbandar to Mumbai (West Coast- Arabian Sea).
We present the initial evidence of an overall improvement in coastal water quality and a declinein chlorophyll-a, a proxy for phytoplankton biomass [9] in the Indian coastal waters during the peak ofthe lockdown (Figures 1 and 2). Although the noticeable changes in chlorophyll-a, which declined by2-fold at places such as the west and northwest coast, were most likely due to the combined effect ofdeclined urban nutrient pollution and reduced atmospheric deposition of bioavailable Nitrogen (N) tocoastal zones, we do not have field-collected nutrient data coinciding with the study period to be usedas direct evidence. It is well-established in the literature that NO2 generated from urban industries,air and motor traffic, urban transport (road, rail, and air), agricultural activities, and urban waste,plays a significant role in controlling the N fluxes into the coast and maintaining the overall waterquality [3–6]. Therefore, we analyzed both short-term and long-term trends in land surface runoff,a proxy for nutrient loading as indirect evidence of the fluctuations in coastal N-fluxes during thestudy period (Figures 3 and 4).
Remote Sens. 2020, 12, 2584 4 of 8
Remote Sens. 2020, 12, x FOR PEER REVIEW 4 of 8
runoff, a proxy for nutrient loading as indirect evidence of the fluctuations in coastal N-fluxes during the study period (Figures 3 and 4).
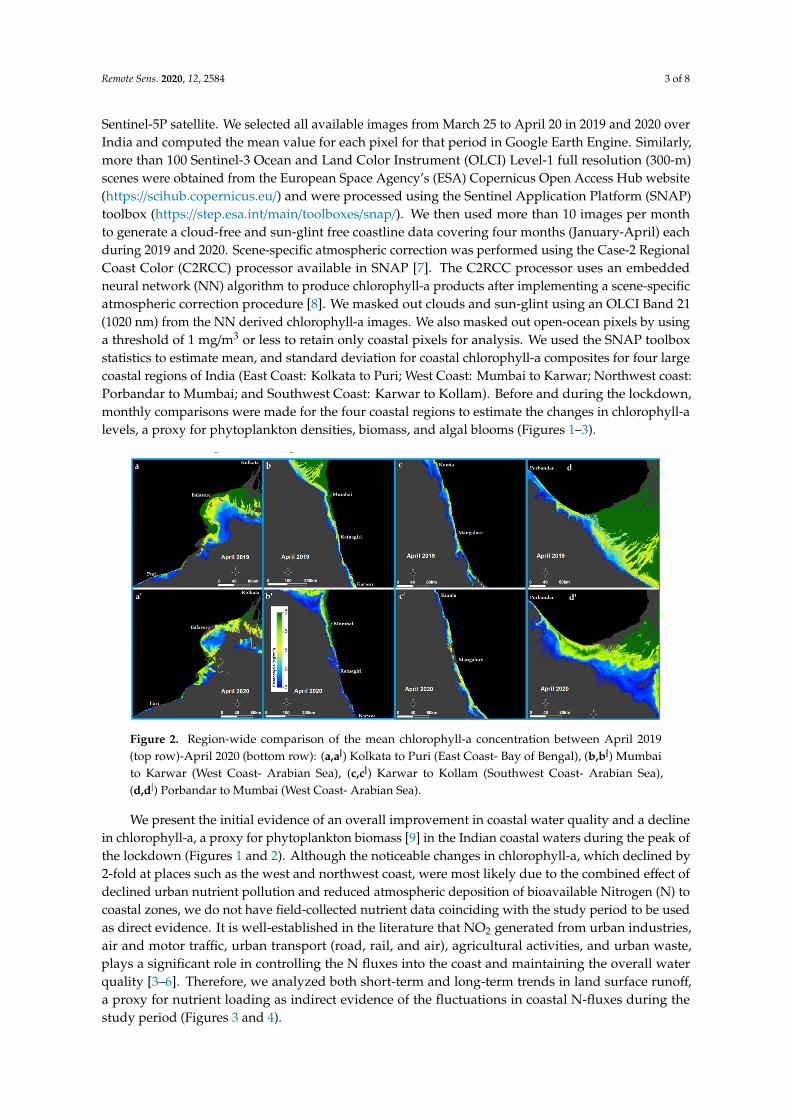
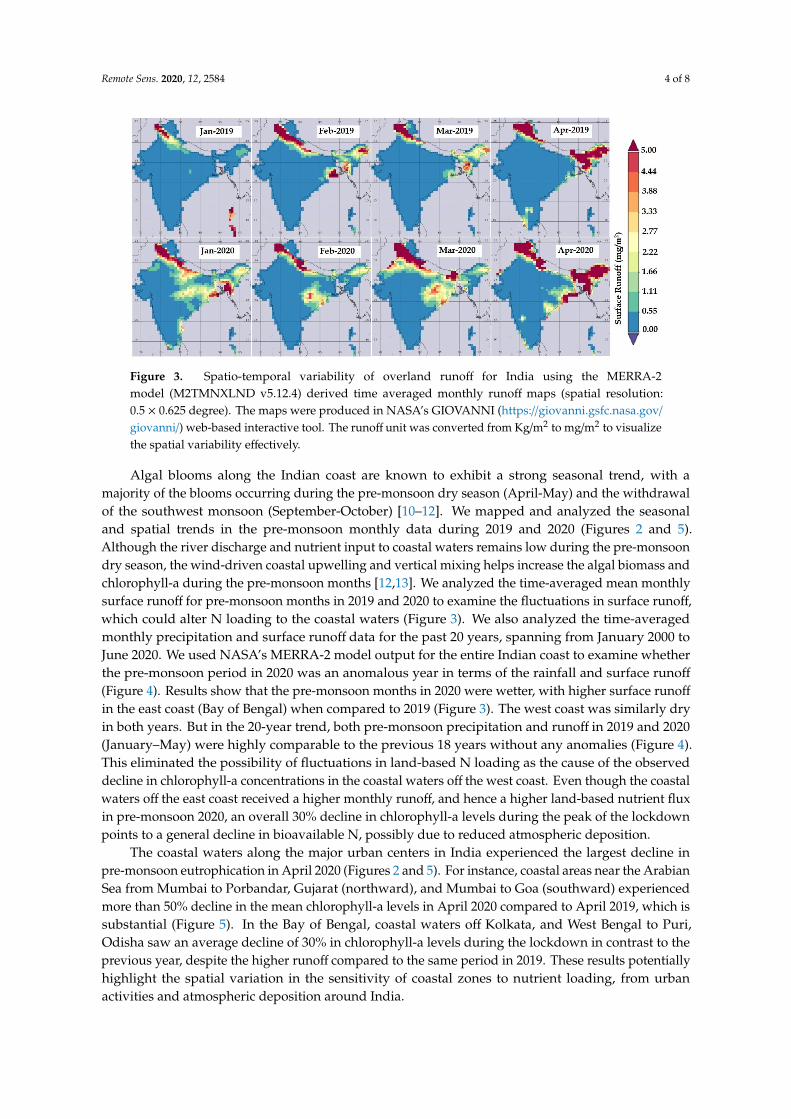
Figure 3. Spatio-temporal variability of overland runoff for India using the MERRA-2 model (M2TMNXLND v5.12.4) derived time averaged monthly runoff maps (spatial resolution: 0.5 × 0.625 degree). The maps were produced in NASA’s GIOVANNI (https://giovanni.gsfc.nasa.gov/giovanni/) web-based interactive tool. The runoff unit was converted from Kg/m2 to mg/m2 to visualize the spatial variability effectively.
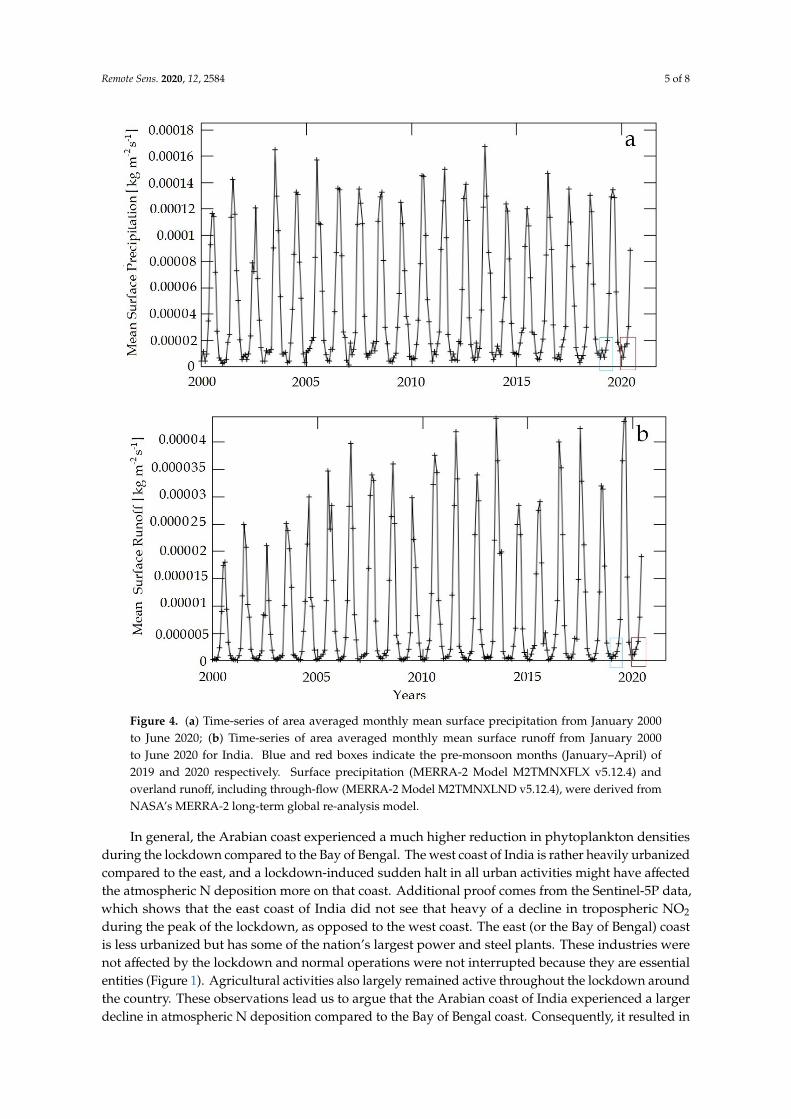
Algal blooms along the Indian coast are known to exhibit a strong seasonal trend, with a majority of the blooms occurring during the pre-monsoon dry season (April-May) and the withdrawal of the southwest monsoon (September-October) [10–12]. We mapped and analyzed the seasonal and spatial trends in the pre-monsoon monthly data during 2019 and 2020 (Figures 2 and 5). Although the river discharge and nutrient input to coastal waters remains low during the pre-monsoon dry season, the wind-driven coastal upwelling and vertical mixing helps increase the algal biomass and chlorophyll-a during the pre-monsoon months [12,13]. We analyzed the time-averaged mean monthly surface runoff for pre-monsoon months in 2019 and 2020 to examine the fluctuations in surface runoff, which could alter N loading to the coastal waters (Figure 3). We also analyzed the time-averaged monthly precipitation and surface runoff data for the past 20 years, spanning from January 2000 to June 2020. We used NASA’s MERRA-2 model output for the entire Indian coast to examine whether the pre-monsoon period in 2020 was an anomalous year in terms of the rainfall and surface runoff (Figure 4). Results show that the pre-monsoon months in 2020 were wetter, with higher surface runoff in the east coast (Bay of Bengal) when compared to 2019 (Figure 3). The west coast was similarly dry in both years. But in the 20-year trend, both pre-monsoon precipitation and runoff in 2019 and 2020 (January–May) were highly comparable to the previous 18 years without any anomalies (Figure 4). This eliminated the possibility of fluctuations in land-based N loading as the cause of the observed decline in chlorophyll-a concentrations in the coastal waters off the west coast. Even though the coastal waters off the east coast received a higher monthly runoff, and hence a higher land-based nutrient flux in pre-monsoon 2020, an overall 30% decline in chlorophyll-a levels during the peak of the lockdown points to a general decline in bioavailable N, possibly due to reduced atmospheric deposition.
Figure 3. Spatio-temporal variability of overland runoff for India using the MERRA-2model (M2TMNXLND v5.12.4) derived time averaged monthly runoff maps (spatial resolution:0.5 × 0.625 degree). The maps were produced in NASA’s GIOVANNI (https://giovanni.gsfc.nasa.gov/
giovanni/) web-based interactive tool. The runoff unit was converted from Kg/m2 to mg/m2 to visualizethe spatial variability effectively.
Algal blooms along the Indian coast are known to exhibit a strong seasonal trend, with amajority of the blooms occurring during the pre-monsoon dry season (April-May) and the withdrawalof the southwest monsoon (September-October) [10–12]. We mapped and analyzed the seasonaland spatial trends in the pre-monsoon monthly data during 2019 and 2020 (Figures 2 and 5).Although the river discharge and nutrient input to coastal waters remains low during the pre-monsoondry season, the wind-driven coastal upwelling and vertical mixing helps increase the algal biomass andchlorophyll-a during the pre-monsoon months [12,13]. We analyzed the time-averaged mean monthlysurface runoff for pre-monsoon months in 2019 and 2020 to examine the fluctuations in surface runoff,which could alter N loading to the coastal waters (Figure 3). We also analyzed the time-averagedmonthly precipitation and surface runoff data for the past 20 years, spanning from January 2000 toJune 2020. We used NASA’s MERRA-2 model output for the entire Indian coast to examine whetherthe pre-monsoon period in 2020 was an anomalous year in terms of the rainfall and surface runoff
(Figure 4). Results show that the pre-monsoon months in 2020 were wetter, with higher surface runoff
in the east coast (Bay of Bengal) when compared to 2019 (Figure 3). The west coast was similarly dryin both years. But in the 20-year trend, both pre-monsoon precipitation and runoff in 2019 and 2020(January–May) were highly comparable to the previous 18 years without any anomalies (Figure 4).This eliminated the possibility of fluctuations in land-based N loading as the cause of the observeddecline in chlorophyll-a concentrations in the coastal waters off the west coast. Even though the coastalwaters off the east coast received a higher monthly runoff, and hence a higher land-based nutrient fluxin pre-monsoon 2020, an overall 30% decline in chlorophyll-a levels during the peak of the lockdownpoints to a general decline in bioavailable N, possibly due to reduced atmospheric deposition.
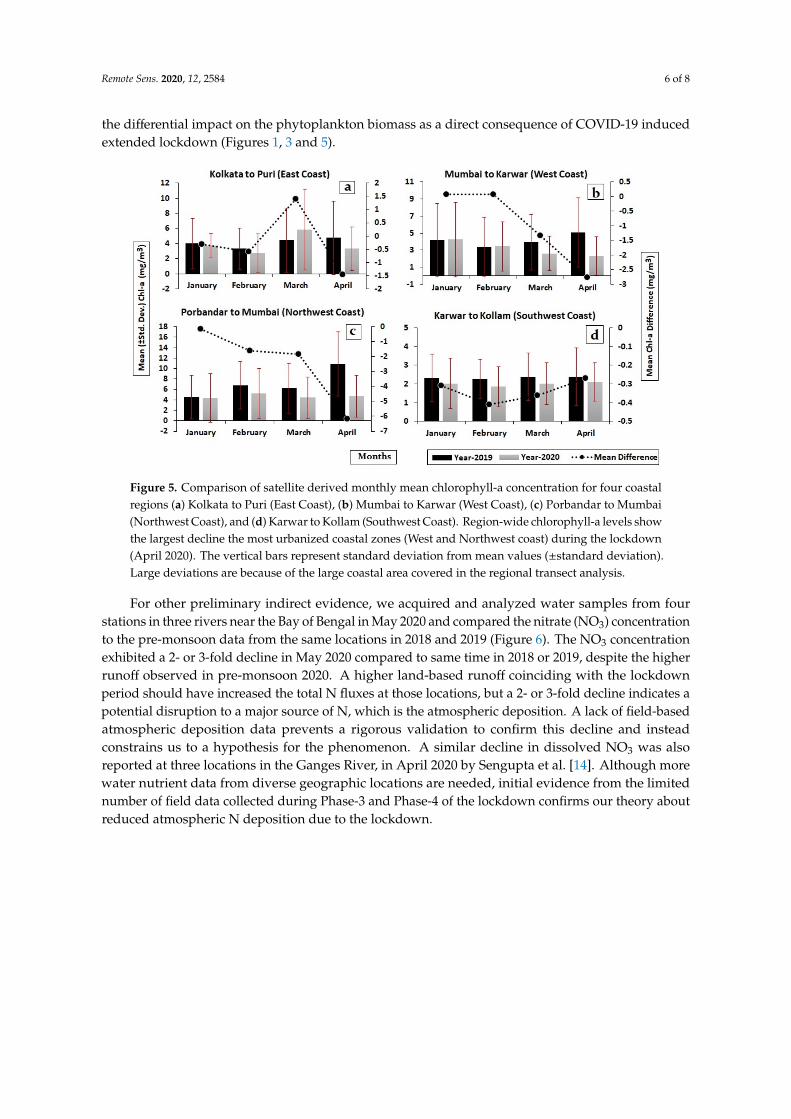
The coastal waters along the major urban centers in India experienced the largest decline inpre-monsoon eutrophication in April 2020 (Figures 2 and 5). For instance, coastal areas near the ArabianSea from Mumbai to Porbandar, Gujarat (northward), and Mumbai to Goa (southward) experiencedmore than 50% decline in the mean chlorophyll-a levels in April 2020 compared to April 2019, which issubstantial (Figure 5). In the Bay of Bengal, coastal waters off Kolkata, and West Bengal to Puri,Odisha saw an average decline of 30% in chlorophyll-a levels during the lockdown in contrast to theprevious year, despite the higher runoff compared to the same period in 2019. These results potentiallyhighlight the spatial variation in the sensitivity of coastal zones to nutrient loading, from urbanactivities and atmospheric deposition around India.
Remote Sens. 2020, 12, 2584 5 of 8Remote Sens. 2020, 12, x FOR PEER REVIEW 5 of 8
Figure 4. (a) Time-series of area averaged monthly mean surface precipitation from January 2000 to June 2020; (b) Time-series of area averaged monthly mean surface runoff from January 2000 to June 2020 for India. Blue and red boxes indicate the pre-monsoon months (January-April) of 2019 and 2020 respectively. Surface precipitation (MERRA-2 Model M2TMNXFLX v5.12.4) and overland runoff, including through-flow (MERRA-2 Model M2TMNXLND v5.12.4), were derived from NASA’s MERRA-2 long-term global re-analysis model.
The coastal waters along the major urban centers in India experienced the largest decline in pre-monsoon eutrophication in April 2020 (Figures 2 and 5). For instance, coastal areas near the Arabian Sea from Mumbai to Porbandar, Gujarat (northward), and Mumbai to Goa (southward) experienced more than 50% decline in the mean chlorophyll-a levels in April 2020 compared to April 2019, which is substantial (Figure 5). In the Bay of Bengal, coastal waters off Kolkata, and West Bengal to Puri, Odisha saw an average decline of 30% in chlorophyll-a levels during the lockdown in contrast to the previous year, despite the higher runoff compared to the same period in 2019. These results potentially highlight the spatial variation in the sensitivity of coastal zones to nutrient loading, from urban activities and atmospheric deposition around India.
Figure 4. (a) Time-series of area averaged monthly mean surface precipitation from January 2000to June 2020; (b) Time-series of area averaged monthly mean surface runoff from January 2000to June 2020 for India. Blue and red boxes indicate the pre-monsoon months (January–April) of2019 and 2020 respectively. Surface precipitation (MERRA-2 Model M2TMNXFLX v5.12.4) andoverland runoff, including through-flow (MERRA-2 Model M2TMNXLND v5.12.4), were derived fromNASA’s MERRA-2 long-term global re-analysis model.
In general, the Arabian coast experienced a much higher reduction in phytoplankton densitiesduring the lockdown compared to the Bay of Bengal. The west coast of India is rather heavily urbanizedcompared to the east, and a lockdown-induced sudden halt in all urban activities might have affectedthe atmospheric N deposition more on that coast. Additional proof comes from the Sentinel-5P data,which shows that the east coast of India did not see that heavy of a decline in tropospheric NO2
during the peak of the lockdown, as opposed to the west coast. The east (or the Bay of Bengal) coastis less urbanized but has some of the nation’s largest power and steel plants. These industries werenot affected by the lockdown and normal operations were not interrupted because they are essentialentities (Figure 1). Agricultural activities also largely remained active throughout the lockdown aroundthe country. These observations lead us to argue that the Arabian coast of India experienced a largerdecline in atmospheric N deposition compared to the Bay of Bengal coast. Consequently, it resulted in
Remote Sens. 2020, 12, 2584 6 of 8
the differential impact on the phytoplankton biomass as a direct consequence of COVID-19 inducedextended lockdown (Figures 1, 3 and 5).Remote Sens. 2020, 12, x FOR PEER REVIEW 6 of 8
Figure 5. Comparison of satellite derived monthly mean chlorophyll-a concentration for four coastal regions (a) Kolkata to Puri (East Coast), (b) Mumbai to Karwar (West Coast), (c) Porbandar to Mumbai (Northwest Coast), and (d) Karwar to Kollam (Southwest Coast). Region-wide chlorophyll-a levels show the largest decline the most urbanized coastal zones (West and Northwest coast) during the lockdown (April 2020). The vertical bars represent standard deviation from mean values (±standard deviation). Large deviations are because of the large coastal area covered in the regional transect analysis.
In general, the Arabian coast experienced a much higher reduction in phytoplankton densities during the lockdown compared to the Bay of Bengal. The west coast of India is rather heavily urbanized compared to the east, and a lockdown-induced sudden halt in all urban activities might have affected the atmospheric N deposition more on that coast. Additional proof comes from the Sentinel-5P data, which shows that the east coast of India did not see that heavy of a decline in tropospheric NO2 during the peak of the lockdown, as opposed to the west coast. The east (or the Bay of Bengal) coast is less urbanized but has some of the nation’s largest power and steel plants. These industries were not affected by the lockdown and normal operations were not interrupted because they are essential entities (Figure 1). Agricultural activities also largely remained active throughout the lockdown around the country. These observations lead us to argue that the Arabian coast of India experienced a larger decline in atmospheric N deposition compared to the Bay of Bengal coast. Consequently, it resulted in the differential impact on the phytoplankton biomass as a direct consequence of COVID-19 induced extended lockdown (Figures 1, 3, and 5).
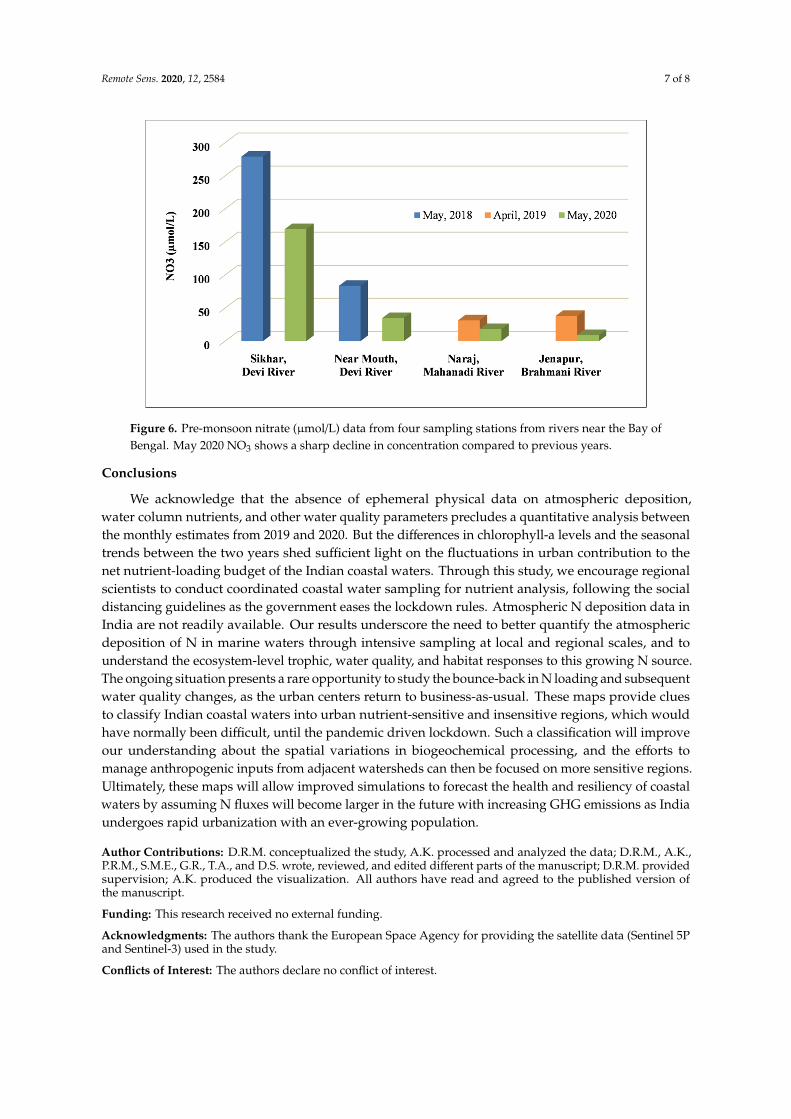
For other preliminary indirect evidence, we acquired and analyzed water samples from four stations in three rivers near the Bay of Bengal in May 2020 and compared the nitrate (NO3) concentration to the pre-monsoon data from the same locations in 2018 and 2019 (Figure 6). The NO3 concentration exhibited a 2- or 3-fold decline in May 2020 compared to same time in 2018 or 2019, despite the higher runoff observed in pre-monsoon 2020. A higher land-based runoff coinciding with the lockdown period should have increased the total N fluxes at those locations, but a 2- or 3-fold decline indicates a potential disruption to a major source of N, which is the atmospheric deposition. A lack of field-based atmospheric deposition data prevents a rigorous validation to confirm this decline and instead constrains us to a hypothesis for the phenomenon. A similar decline in dissolved NO3 was also reported at three locations in the Ganges River, in April 2020 by Sengupta et al. [14]. Although more water nutrient data from diverse geographic locations are needed, initial evidence from the limited number of field data collected during Phase-3 and Phase-4 of the lockdown confirms our theory about reduced atmospheric N deposition due to the lockdown.
Figure 5. Comparison of satellite derived monthly mean chlorophyll-a concentration for four coastalregions (a) Kolkata to Puri (East Coast), (b) Mumbai to Karwar (West Coast), (c) Porbandar to Mumbai(Northwest Coast), and (d) Karwar to Kollam (Southwest Coast). Region-wide chlorophyll-a levels showthe largest decline the most urbanized coastal zones (West and Northwest coast) during the lockdown(April 2020). The vertical bars represent standard deviation from mean values (±standard deviation).Large deviations are because of the large coastal area covered in the regional transect analysis.
For other preliminary indirect evidence, we acquired and analyzed water samples from fourstations in three rivers near the Bay of Bengal in May 2020 and compared the nitrate (NO3) concentrationto the pre-monsoon data from the same locations in 2018 and 2019 (Figure 6). The NO3 concentrationexhibited a 2- or 3-fold decline in May 2020 compared to same time in 2018 or 2019, despite the higherrunoff observed in pre-monsoon 2020. A higher land-based runoff coinciding with the lockdownperiod should have increased the total N fluxes at those locations, but a 2- or 3-fold decline indicates apotential disruption to a major source of N, which is the atmospheric deposition. A lack of field-basedatmospheric deposition data prevents a rigorous validation to confirm this decline and insteadconstrains us to a hypothesis for the phenomenon. A similar decline in dissolved NO3 was alsoreported at three locations in the Ganges River, in April 2020 by Sengupta et al. [14]. Although morewater nutrient data from diverse geographic locations are needed, initial evidence from the limitednumber of field data collected during Phase-3 and Phase-4 of the lockdown confirms our theory aboutreduced atmospheric N deposition due to the lockdown.
Remote Sens. 2020, 12, 2584 7 of 8Remote Sens. 2020, 12, x FOR PEER REVIEW 7 of 8
Figure 6. Pre-monsoon nitrate (µmol/L) data from four sampling stations from rivers near the Bay of Bengal. May 2020 NO3 shows a sharp decline in concentration compared to previous years.
Conclusions
We acknowledge that the absence of ephemeral physical data on atmospheric deposition, water column nutrients, and other water quality parameters precludes a quantitative analysis between the monthly estimates from 2019 and 2020. But the differences in chlorophyll-a levels and the seasonal trends between the two years shed sufficient light on the fluctuations in urban contribution to the net nutrient-loading budget of the Indian coastal waters. Through this study, we encourage regional scientists to conduct coordinated coastal water sampling for nutrient analysis, following the social distancing guidelines as the government eases the lockdown rules. Atmospheric N deposition data in India are not readily available. Our results underscore the need to better quantify the atmospheric deposition of N in marine waters through intensive sampling at local and regional scales, and to understand the ecosystem-level trophic, water quality, and habitat responses to this growing N source. The ongoing situation presents a rare opportunity to study the bounce-back in N loading and subsequent water quality changes, as the urban centers return to business-as-usual. These maps provide clues to classify Indian coastal waters into urban nutrient-sensitive and insensitive regions, which would have normally been difficult, until the pandemic driven lockdown. Such a classification will improve our understanding about the spatial variations in biogeochemical processing, and the efforts to manage anthropogenic inputs from adjacent watersheds can then be focused on more sensitive regions. Ultimately, these maps will allow improved simulations to forecast the health and resiliency of coastal waters by assuming N fluxes will become larger in the future with increasing GHG emissions as India undergoes rapid urbanization with an ever-growing population.
Author Contributions: D.R.M. conceptualized the study, A.K. processed and analyzed the data; D.R.M., A.K., P.R.M., S.M.E., G.R., T.A., and D.S. wrote, reviewed, and edited different parts of the manuscript; D.R.M. provided supervision; A.K. produced the visualization. All authors have read and agreed to the published version of the manuscript.
Funding: This research received no external funding
Acknowledgments: The authors thank the European Space Agency for providing the satellite data (Sentinel 5P and Sentinel-3) used in the study.
Conflicts of Interest: The authors declare no conflict of interest.
Figure 6. Pre-monsoon nitrate (µmol/L) data from four sampling stations from rivers near the Bay ofBengal. May 2020 NO3 shows a sharp decline in concentration compared to previous years.
Conclusions
We acknowledge that the absence of ephemeral physical data on atmospheric deposition,water column nutrients, and other water quality parameters precludes a quantitative analysis betweenthe monthly estimates from 2019 and 2020. But the differences in chlorophyll-a levels and the seasonaltrends between the two years shed sufficient light on the fluctuations in urban contribution to thenet nutrient-loading budget of the Indian coastal waters. Through this study, we encourage regionalscientists to conduct coordinated coastal water sampling for nutrient analysis, following the socialdistancing guidelines as the government eases the lockdown rules. Atmospheric N deposition data inIndia are not readily available. Our results underscore the need to better quantify the atmosphericdeposition of N in marine waters through intensive sampling at local and regional scales, and tounderstand the ecosystem-level trophic, water quality, and habitat responses to this growing N source.The ongoing situation presents a rare opportunity to study the bounce-back in N loading and subsequentwater quality changes, as the urban centers return to business-as-usual. These maps provide cluesto classify Indian coastal waters into urban nutrient-sensitive and insensitive regions, which wouldhave normally been difficult, until the pandemic driven lockdown. Such a classification will improveour understanding about the spatial variations in biogeochemical processing, and the efforts tomanage anthropogenic inputs from adjacent watersheds can then be focused on more sensitive regions.Ultimately, these maps will allow improved simulations to forecast the health and resiliency of coastalwaters by assuming N fluxes will become larger in the future with increasing GHG emissions as Indiaundergoes rapid urbanization with an ever-growing population.
Author Contributions: D.R.M. conceptualized the study, A.K. processed and analyzed the data; D.R.M., A.K.,P.R.M., S.M.E., G.R., T.A., and D.S. wrote, reviewed, and edited different parts of the manuscript; D.R.M. providedsupervision; A.K. produced the visualization. All authors have read and agreed to the published version ofthe manuscript.
Funding: This research received no external funding.
Acknowledgments: The authors thank the European Space Agency for providing the satellite data (Sentinel 5Pand Sentinel-3) used in the study.
Conflicts of Interest: The authors declare no conflict of interest.
Remote Sens. 2020, 12, 2584 8 of 8
References
1. Ramesh, R.; Selvam, A.P.; Robin, R.; Ganguly, D.; Singh, G.; Purvaja, R. Nitrogen Assessment in Indian CoastalSystems. In The Indian Nitrogen Assessment; Elsevier BV: Amsterdam, The Netherlands, 2017; pp. 361–379.
2. Voss, M.; Bange, H.W.; Dippner, J.W.; Middelburg, J.J.; Montoya, J.P.; Ward, B. The marine nitrogen cycle:Recent discoveries, uncertainties and the potential relevance of climate change. Philos. Trans. R. Soc. BBiol. Sci. 2013, 368, 20130121. [CrossRef] [PubMed]
3. Paerl, H.W. Coastal eutrophication in relation to atmospheric nitrogen deposition: Current perspectives.Ophelia 1995, 41, 237–259. [CrossRef]
4. U.S. Environmental Protection Agency (USEPA). Deposition of Air Pollutants to the Great Waters. Third Reportto Congress, US Govt.; Printing Office: Washington, DC, USA, 1999.
5. Paerl, H.W.; Dennis, R.L.; Whitall, D.R. Atmospheric deposition of nitrogen: Implications for nutrientover-enrichment of coastal waters. Estuaries 2002, 25, 677–693. [CrossRef]
6. Stevens, C.; David, T.; Storkey, J. Atmospheric nitrogen deposition in terrestrial ecosystems: Its impact onplant communities and consequences across trophic levels. Funct. Ecol. 2018, 32, 1757–1769. [CrossRef]
7. Brockmann, C.; Doerffer, R.; Peters, M.; Stelzer, K.; Embacher, S.; Ruescas, A. Evolution of the C2RCC neuralnetwork for Sentinel 2 and 3 for the retrieval of ocean colour products in normal and extreme opticallycomplex waters. In Proceedings of the Living Planet Symposium, Prague, Czech Republic, 9–12 May 2016.ESA SP-740.
8. Doerffer, R.; Schiller, H. The MERIS Case 2 water algorithm. Int. J. Remote. Sens. 2007, 28, 517–535. [CrossRef]9. Mishra, S.; Mishra, D.R. Normalized difference chlorophyll index: A novel model for remote estimation
of chlorophyll-a concentration in turbid productive waters. Remote. Sens. Environ. 2012, 117, 394–406.[CrossRef]
10. D’Silva, M.S.; Anil, A.C.; Naik, K.K.; D’Costa, P.M. Algal blooms: A perspective from the coasts of India.Nat. Hazards 2012, 63, 1225–1253. [CrossRef]
11. Poddar, S.; Chacko, N.; Swain, D. Estimation of chlorophyll-a in northern coastal bay of bengal usinglandsat-8 OLI and sentinel-2 MSI sensors. Front. Mar. Sci. 2019, 6, 598. [CrossRef]
12. Monolisha, S.; Platt, T.; Sathyendranath, S.; Jayasankar, J.; George, G.; Jackson, T. Optical classification of thecoastal waters of the Northern Indian Ocean. Front. Mar. Sci. 2018, 5, 87. [CrossRef]
13. Hegde, V.S.; Nayak, S.R.; Shalini, G.; Gosavi, K.D.; Rajawat, A.S.; Ramana, I.V. OCM derived chlorophyll-adynamics in the nearshore region of the central west coast of India: Implication for fish catch in the area.J. Mar. Biol. Oceangr. 2019, 8, 2.
14. Sengupta, T.; Pramanick, P.; Mitra, A. Nutrient load in the River Ganges during the COVID-19 lockdownphase: A ground zero observation. J. Regul. Stud. 2020, 79–83, 87–91.
© 2020 by the authors. Licensee MDPI, Basel, Switzerland. This article is an open accessarticle distributed under the terms and conditions of the Creative Commons Attribution(CC BY) license (http://creativecommons.org/licenses/by/4.0/).