Embed Size (px)
Citation preview
so
DECLINE IN DRINKING AND DRMNG CRASHES, FATALITIES AND INJURIES IN THE UNITED STATES Kathryn Stewart and Robert B. Voas, Pacific Institute for Research and Evaluation, Bethesda, Maryland USA
INTRODUCTION
Over the last decade, the number of deaths and injuries related to impaired driving has declined significantly in the United States as well as in other industrialized countries. For example, in 1982, 57 percent of all highway fatalities in the U.S. involved a driver with a measurable blood alcohol level. By 1992, this figure had decreased to less than 46 percent of fatalities. At the same time, the total number of traffic fatalities decreased from 43,945 in 1982 to 39,235 in 1992. An understanding of this significant social change can indicate how further decreases might be achieved. It can also serve as a model for understanding other social problems and how they might be ameliorated.
THE NATURE OF THE DECREASE
Total Fatalities and Alcohol-Related Fatalities
There are many different ways of measuring the incidence of impaired driving, each with inherent biases and inaccuracies. Most commonly used are a variety of measures of alcohol-related fatalities. The role of alcohol in fatal crashes is not reported consistently (especially when the driver is not killed in the crash), however, the U.S. National Highway Traffic Safety Administration has developed a method for estimating alcohol-involvement in all fatal crashes based on available information (Klein, 1986).
As indicated by Table 1, the total number of drivers involved in fatal crashes increased for the most part through the 1980s until 1989 when a steady decline began. By contrast, the proportion of drivers in fatal crashes with any measurable blood alcohol content (BAC) has declined fairly steadily throughout the period. While the number of ~ - '- - 1!&.! _ _ _ ____ l&.!--~- - -----L - - ! - ___ 1 __ ! ___ _ t_ ___ ..J __ ! ___ ___ 1 __ _ ! ________ _ 11 ___ ____ • I:' ______ .._ .1.1 ____ I _ _ . l"r~ 1•.• f'
1.0.LdllL.l\Jo'.l .l\.lOUJ.U.U~ UUUJ. "-10.,U\..1'3 1.UVUIVl.U~ .:,uLA,I UJ.lVC.1.:, Uc13 lll\..l C.4:tC.U u1 UVCil .1.-1 }ICI\.C.lll. LUCi uuuu.x:;;1 Ul 141,\.<\U\,1.;;i) llVJU
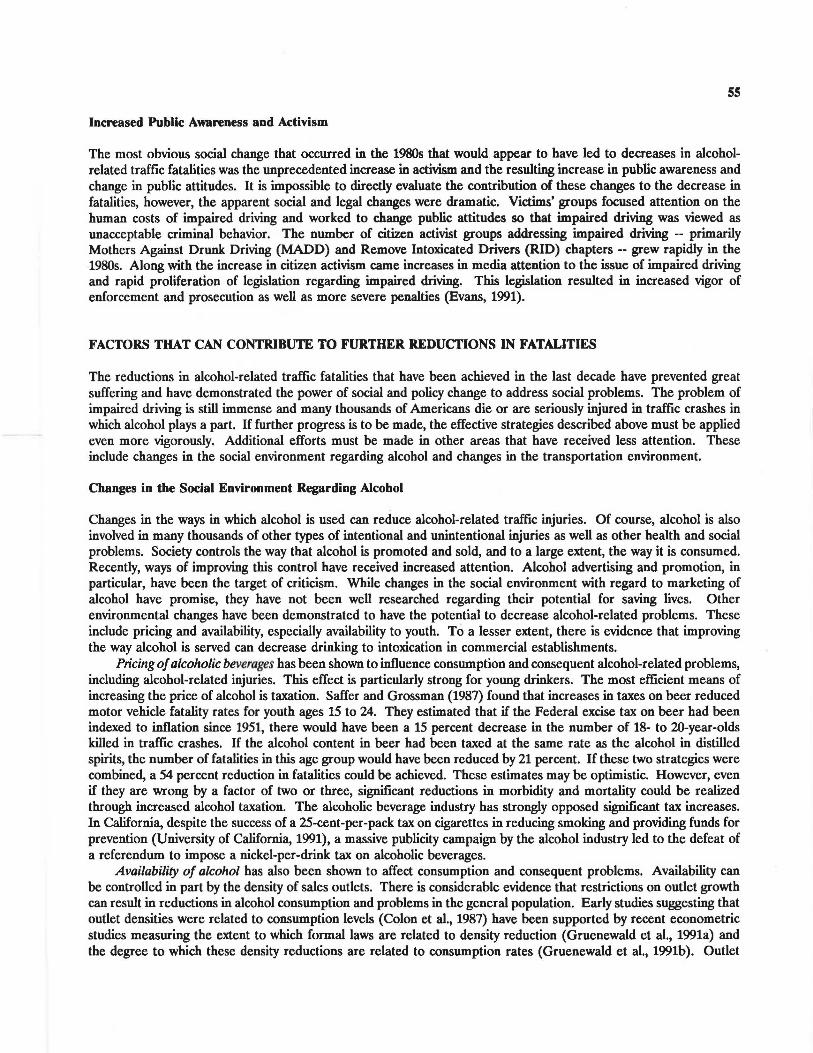
accidents involving drinking drivers has decreased by almost 30 percent. Figure 1 traces the trend over the last decade (using 1982 as the base year) for total fatalities resulting from crashes involving drivers at three BACs. Comparisons between the results of roadside surveys carried out in 1973 and 1986 indicated a 52 percent decrease in the percentage of drivers on the road with BACs of .10 percent and above (Lund and Wolf, 1991). Thus, decreases in alcohol-related fatalities seem to be consistent with apparent decreases in the incidence of alcohol-impaired driving. Unfortunately, more recent comparable roadside survey data are not available.
Pedestrian Fatalities
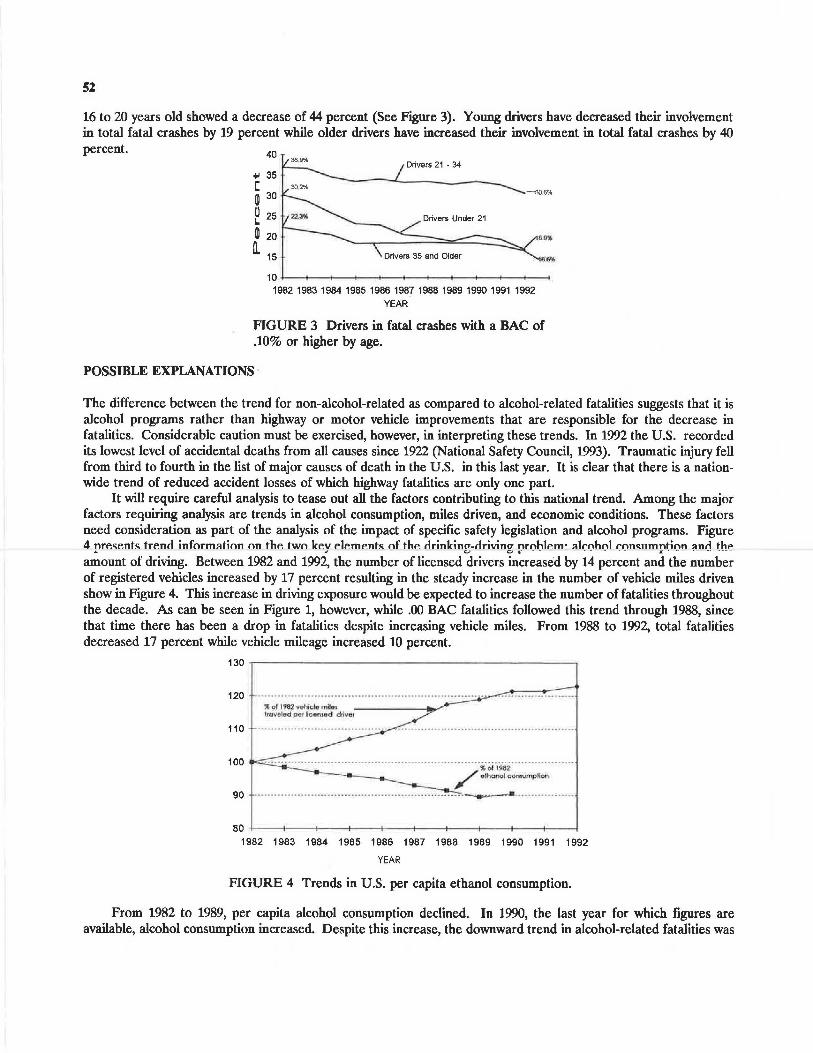
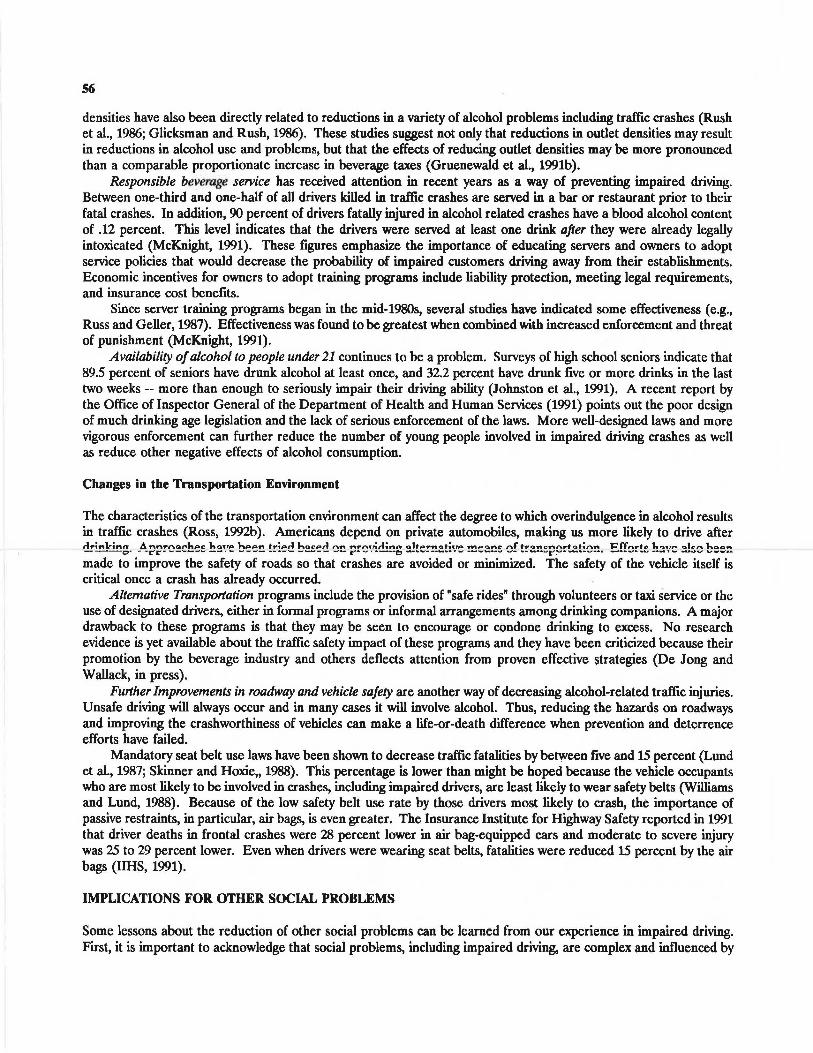
The proportion of fatally injured pedestrians who are impaired by alcohol has also decreased, though not to the same extent as that of drivers (See Figure 2). In 1982, 45 percent of fatally injured pedestrians over 16 years of age had BACs of .10 and above. In 1992, 38 percent were intoxicated. Thus, it would appear that whatever factors have contributed to the decrease in impaired driving deaths have also applied to some degree to.pedestrians, although more strongly to drivers. It is worth noting that a significant proportion of fatally injured intoxicated pedestrians are killed by drivers who are themselves impaired by alcohol. Thus, reducing impaired driving also is likely to reduce the number of impaired pedestrian deaths.
Gender and Alcohol-Related Fatalities
Male involvement in fatalities per 100,000 drivers is three times that of females. Moreover, male drivers in fatal crashes are about twice as likely as females to be intoxicated (25 percent as compared to 13 percent). Female drivers have also shown a greater reduction in the proportion intoxicated (a reduction of 33 percent as compared to 24 percent for men) since 1982 (NHTSA, 1993). Female drivers' involvement in fatal crashes in general has increased. Analysis carried out by Popkin (1991), indicates that when crash involvement for young females is examined separately, alcohol-related deaths may actually be increasing.
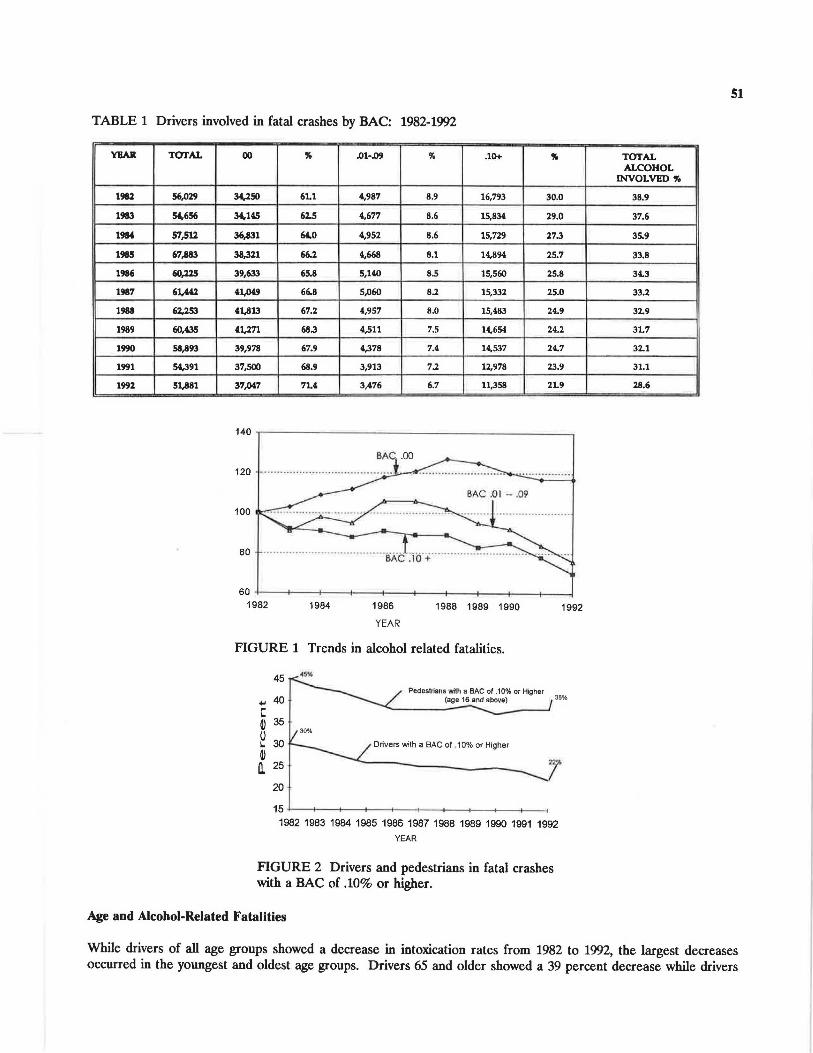
TABLE 1 Drivers involved in fatal crashes by BAC: 1982-19')2
YEAR TOTAL
1982 56,029
1983 5',656
1984 57,512
1985 67,883
1986 60,ll.5
1987 61,,441
1988 62,25.1
1989 60,435
1990 58,893
1991 5',391
1992 51,881
00 " .01-Jl9 ,. .10+ " 34,250 61.1 4,987 8.9 16,793 30.0
3',.HS 62.5 4,677 8.6 15,834 29.0
36,831 6'.0 4,952 8.6 15,729 27.3
38,321 66.2 4,668 8.1 14,894 25.7
39,633 65.8 5,140 8.5 15,560 25.8
4t,o49 66.8 S,060 8.2 15,332 25.0
41,813 67.2 4,957 8.0 15,483 24.9
41,271 68.3 4,511 7.5 14,654 24.2
39,978 67.9 4,378 7.4 14,537 24.7
37,500 68.9 3,913 7.2 12,978 23.9
37,()4,7 7U 3,476 6.7 11,358 2L9
140 -r--------------------- -~
120
100
80
60 +---+----+---ll--+---+----+---11--+----+--____j 1982 1984 1986
YEAR
1988 1989 1990
FIGURE 1 Trends in alcohol related fatalities.
45
1992
Pedestrians with a BAC ol .10% or Higher 38% 40 (age 16 and above) +,I
C © 0 L.
© a.
35
30 Drivers with a BAC of . 10% or Higher
25 i 20
15 +---1---+--+----+--+--+-->----+---+--< 1982 1983 1984 1985 1986 1987 1988 1989 1990 1991 1992
YEAR
FIGURE 2 Drivers and pedestrians in fatal crashes with a BAC of .10% or higher.
Age and Alcohol-Related Fatalities
51
TOfAL ALCOHOL
INVOLVED 'll,
38,9
37.6
35.9
33.8
34.3
33.l
32.9
3L7
32.l
31.1
28.6
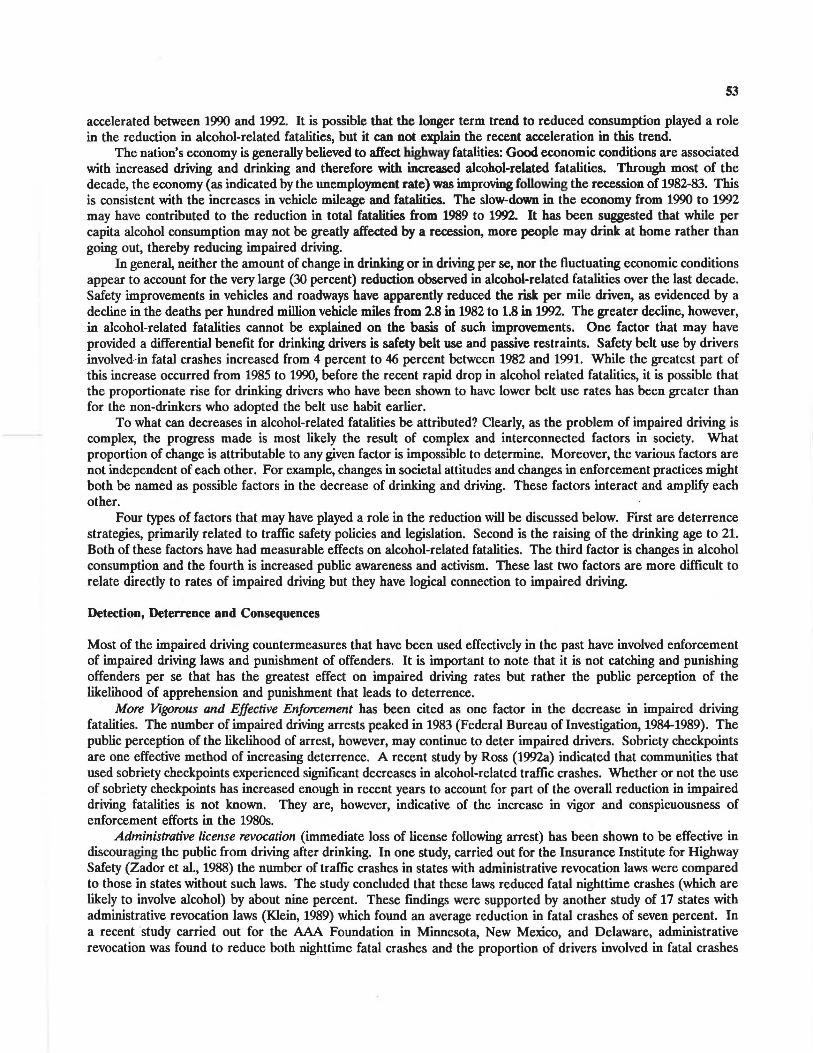
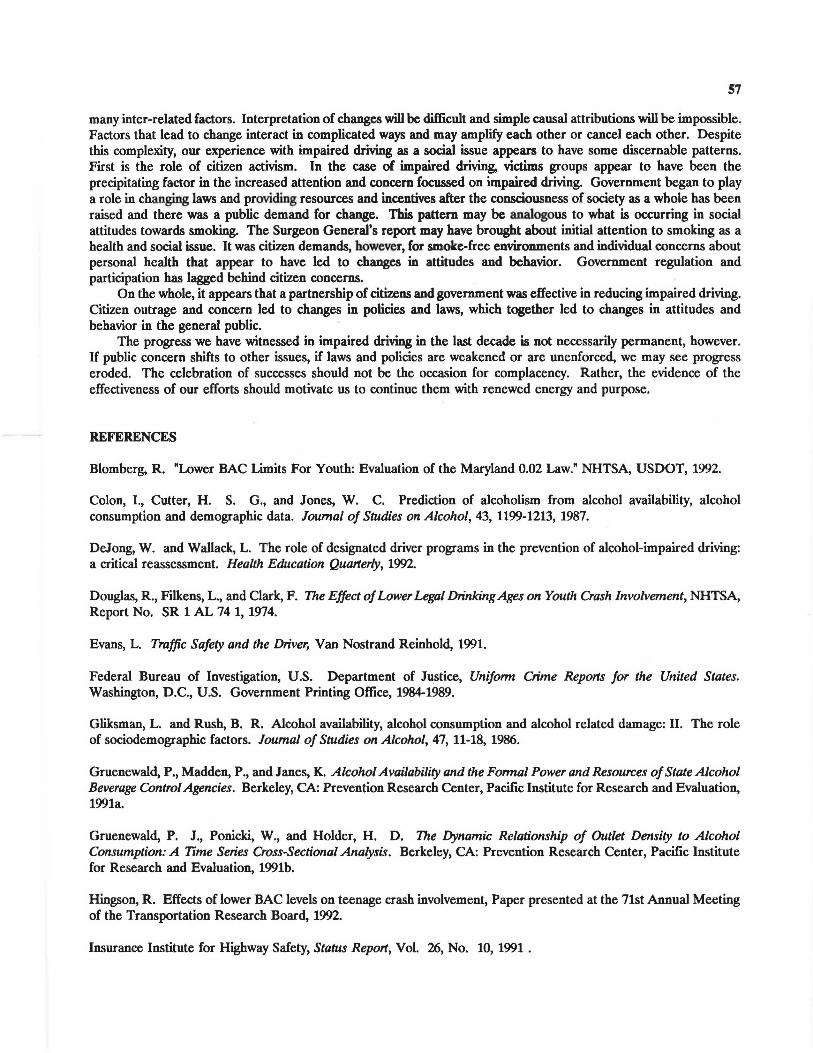
While drivers of all age groups showed a decrease in intoxication rates from 1982 to 19()2, the largest decreases occurred in the youngest and oldest age groups. Drivers 65 and older showed a 39 percent decrease while drivers
52
16 to 20 years old showed a decrease of 44 percent (See Figure 3). Young drivers have decreased their involvement in total fatal crashes by 19 percent while older drivers have increased their involvement in total fatal crashes by 40 percent. 40
+' 35 C m 30
0 25 I. .
m 20
ll, 15
Drivers 21 • 34
-<l0.6%
D.O'OI
IB.6%
10 4---+--+--+---+--t------+---<---t--t-----< 1~1~1~1~1~1~1~1~1~1~1~
YEAR
FIGURE 3 Drivers in fatal crashes with a BAC of .10% or higher by age.
POSSIBLE EXPLANATIONS ·
The difference between the trend for non-alcohol-related as compared to alcohol-related fatalities suggests that it is alcohol programs rather than highway or motor vehicle improvements that are responsible for the decrease in fatalities. Considerable caution must be exercised, however, in interpreting these trends. In 1992 the U.S. recorded its lowest level of accidental deaths from all causes since 1922 (National Safety Council, 1993). Traumatic injury fell from third to fourth in the list of major causes of death in the U.S. in this last year. It is clear that there is a nationwide trend of reduced accident losses of which highway fatalities are only one part.
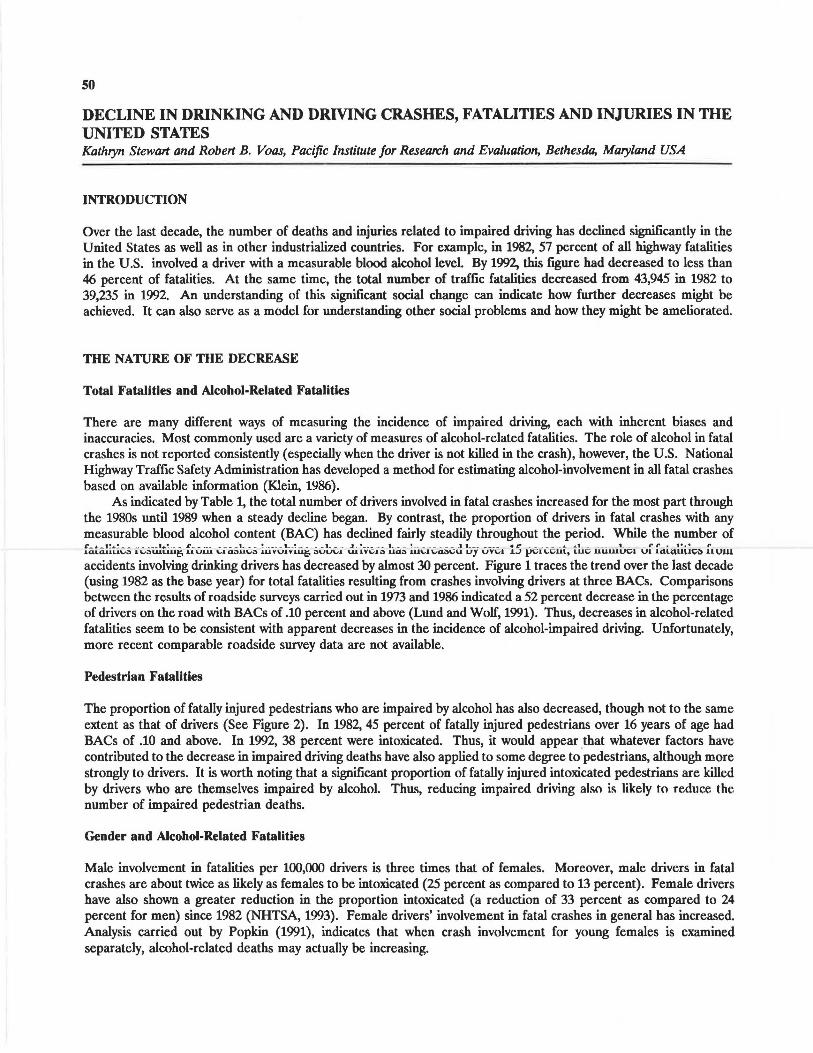
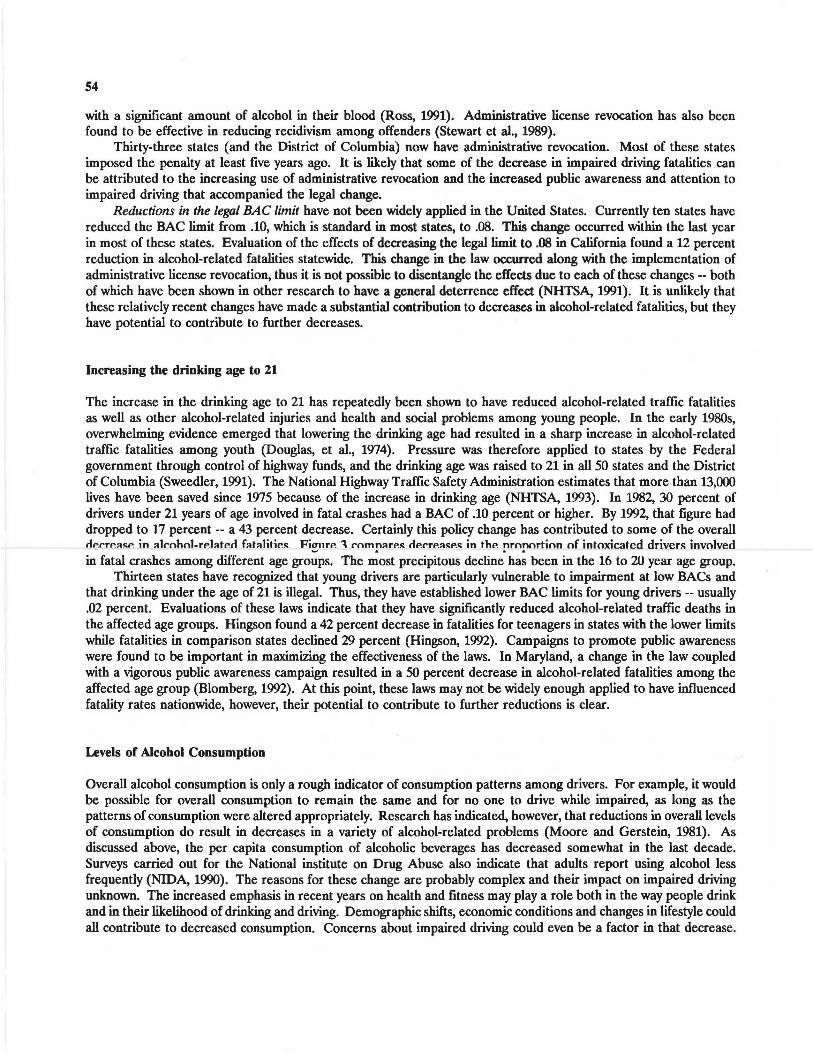
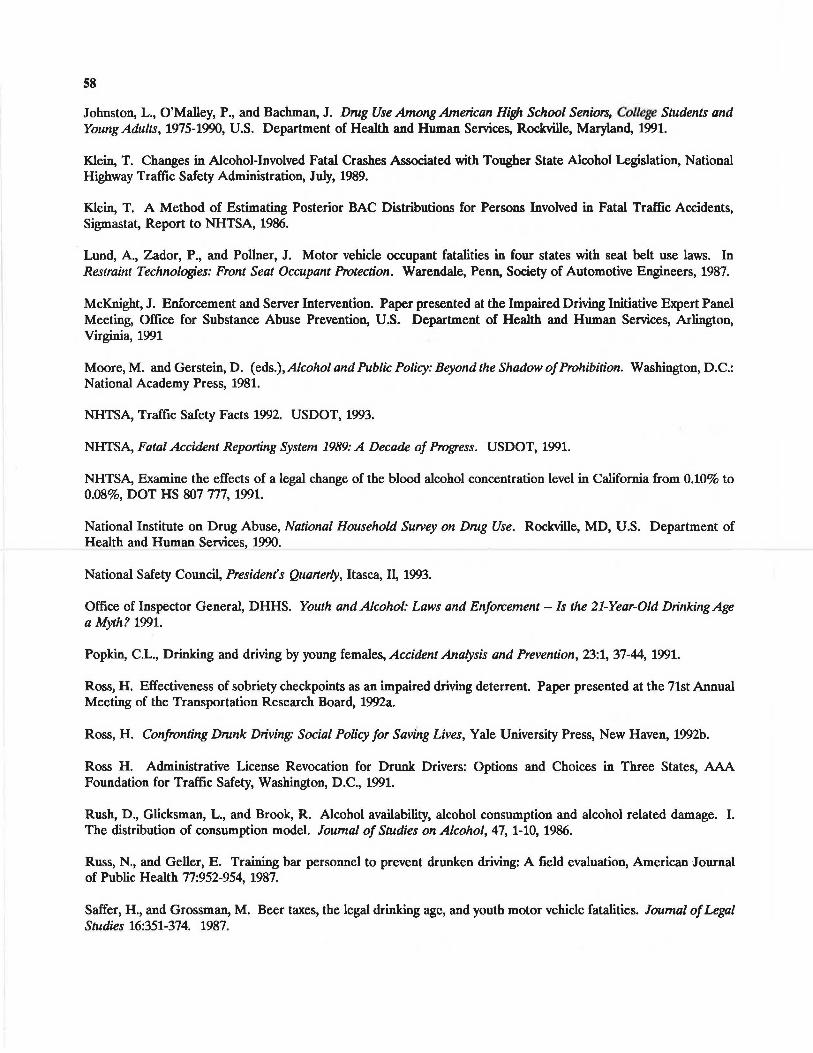
It will require careful analysis to tease out all the factors contributing to this national trend. Among the major factors requiring analysis are trends in alcohol consumption, miles driven, and economic conditions. These factors need consideration as part of the analysis of the impact of specific safety legislation and alcohol programs. Figure 4 nrP.sP.nts trP.nc1 inform:ition on thP. two KP.V P.IP.mP.nts of thP. c1rinlcino-c1rivino nrohlP.m· :ilrohol ron•mmntion lln'1 thP
.a. J U O .a: - - - - - - - .£ . - -- -- ----
amount of driving. Between 1982 and 1992, the number of licensed drivers increased by 14 percent and the number of registered vehicles increased by 17 percent resulting in the steady increase in the number of vehicle miles driven show in Figure 4. This increase in driving exposure would be expected to increase the number of fatalities throughout the decade. As can be seen in Figure 1, however, while .00 BAC fatalities followed this trend through 1988, since that time there has been a drop in fatalities despite increasing vehicle miles. From 1988 to 1992, total fatalities decreased 17 percent while vehicle mileage increased 10 percent.
130 ~--------------------~
120
110
100 ·········· ·········· ··· ··· ····· ·· ··· ····························· ·;;-~iYilii· ····· ············· ~ elh<><>Ol oomumplloo,
90 ................... .................................. ........ . -.. .... .. .. ... ..... .... . .
BO +-- -+-- -+----+--1---+---t-----+----+--t---1 1982 1983 1984 1985 1986 1987 1988 1989 1990 1991 1992
YEAR
FIGURE 4 Trends in U.S. per capita ethanol consumption.
From 1982 to 1989, per capita alcohol consumption declined. In 1990, the last year for which figures are available, alcohol consumption increased. Despite this increase, the downward trend in alcohol-related fatalities was
53
accelerated between 1990 and 1992. It is possible that the longer term trend to reduced consumption played a role in the reduction in alcohol-related fatalities, but it can not explain the recent acceleration in this trend.
The nation's economy is generally believed to affect highway fatalities: Good economic conditions are associated with increased driving and drinking and therefore with increased alcohol-related fatalities. Through most of the decade, the economy (as indicated by the unemployment rate) was improving following the recession of 1982-83. This is consistent with the increases in vehicle mileage and fatalities. The slow-down in the economy from 1990 to 1992 may have contributed to the reduction in total fatalities from 1989 to 1992. It has been suggested that while per capita alcohol consumption may not be greatly affected by a recession, more people may drink at home rather than going out, thereby reducing impaired driving.
In general, neither the amount of change in drinking or in driving per se, nor the fluctuating economic conditions appear to account for the very large (30 percent) reduction observed in alcohol-related fatalities over the last decade. Safety improvements in vehicles and roadways have apparently reduced the risk per mile driven, as evidenced by a decline in the deaths per hundred million vehicle miles from 2.8 in 1982 to 1.8 in 1992. The greater decline, however, in alcohol-related fatalities cannot be explained on the basis of such improvements. One factor that may have provided a differential benefit for drinking drivers is safety belt use and passive restraints. Safety belt use by drivers involved-in fatal crashes increased from 4 percent to 46 percent between 1982 and 1991. While the greatest part of this increase occurred from 1985 to 1990, before the recent rapid drop in alcohol related fatalities, it is possible that the proportionate rise for drinking drivers who have been shown to have lower belt use rates has been greater than for the non-drinkers who adopted the belt use habit earlier.
To what can decreases in alcohol-related fatalities be attributed? Clearly, as the problem of impaired driving is complex, the progress made is most likely the result of complex and interconnected factors in society. What proportion of change is attributable to any given factor is impossible to determine. Moreover, the various factors are not independent of each other. For example, changes in societal attitudes and changes in enforcement practices might both be named as possible factors in the decrease of drinking and driving. These factors interact and amplify each other.
Four types of factors that may have played a role in the reduction will be discussed below. First are deterrence strategies, primarily related to traffic safety policies and legislation. Second is the raising of the drinking age to 21. Both of these factors have had measurable effects on alcohol-related fatalities. The third factor is changes in alcohol consumption and the fourth is increased public awareness and activism. These last two factors are more difficult to relate directly to rates of impaired driving but they have logical connection to impaired driving.
Detection, Deterrence and Consequences
Most of the impaired driving countermeasures that have been used effectively in the past have involved enforcement of impaired driving laws and punishment of offenders. It is important to note that it is not catching and punishing offenders per se that has the greatest effect on impaired driving rates but rather the public perception of the likelihood of apprehension and punishment that leads to deterrence.
More Vigorous and Effective Enforcement has been cited as one factor in the decrease in impaired driving fatalities. The number of impaired driving arrests peaked in 1983 (Federal Bureau of Investigation, 1984-1989). The public perception of the likelihood of arrest, however, may continue to deter impaired drivers. Sobriety checkpoints are one effective method of increasing deterrence. A recent study by Ross (1992a) indicated that communities that used sobriety checkpoints experienced significant decreases in alcohol-related traffic crashes. Whether or not the use of sobriety checkpoints has increased enough in recent years to account for part of the overall reduction in impaired driving fatalities is not known. They are, however, indicative of the increase in vigor and conspicuousness of enforcement efforts in the 1980s.
Administrative license revocation (immediate loss of license following arrest) has been shown to be effective in discouraging the public from driving after drinking. In one study, carried out for the Insurance Institute for Highway Safety (Zador et al., 1988) the number of traffic crashes in states with administrative revocation laws were compared to those in states without such laws. The study concluded that these laws reduced fatal nighttime crashes (which are likely to involve alcohol) by about nine percent. These findings were supported by another study of 17 states with administrative revocation laws (Klein, 1989) which found an average reduction in fatal crashes of seven percent. In a recent study carried out for the AAA Foundation in Minnesota, New Mexico, and Delaware, administrative revocation was found to reduce both nighttime fatal crashes and the proportion of drivers involved in fatal crashes
54
with a significant amount of alcohol in their blood (Ross, 1991). Administrative license revocation has also been found to be effective in reducing recidivism among offenders (Stewart et al., 1989).
Thirty-three states (and the District of Columbia) now have administrative revocation. Most of these states imposed the penalty at least five years ago. It is likely that some of the decrease in impaired driving fatalities can be attributed to the increasing use of administrative revocation and the increased public awareness and attention to impaired driving that accompanied the legal change.
Reductions in the legal BAC limit have not been widely applied in the United States. Currently ten states have reduced the BAC limit from .10, which is standard in most states, to .08. This change occurred within the last year in most of these states. Evaluation of the effects of decreasing the legal limit to .08 in California found a 12 percent reduction in alcohol-related fatalities statewide. This change in the law occurred along with the implementation of administrative license revocation, thus it is not possible to disentangle the effects due to each of these changes -- both of which have been shown in other research to have a general deterrence effect (NHTSA, 1991). It is unlikely that these relatively recent changes have made a substantial contribution to decreases in alcohol-related fatalities, but they have potential to contribute to further decreases.
Increasing the drinking age to 21
The increase in the drinking age to 21 has repeatedly been shown to have reduced alcohol-related traffic fatalities as well as other alcohol-related injuries and health and social problems among young people. In the early 1980s, overwhelming evidence emerged that lowering the drinking age had resulted in a sharp increase in alcohol-related traffic fatalities among youth (Douglas, et al., 1974). Pressure was therefore applied to states by the Federal government through control of highway funds, and the drinking age was raised to 21 in all 50 states and the District of Columbia (Sweedler, 1991). The National Highway Traffic Safety Administration estimates that more than 13,000 lives have been saved since 1975 because of the increase in drinking age (NHTSA, 1993). In 1982, 30 percent of drivers under 21 years of age involved in fatal crashes had a BAC of .10 percent or higher. By 1992, that figure had dropped to 17 percent -- a 43 percent decrease. Certainly this policy change has contributed to some of the overall tiP.rrP.a!l:P. in alrnhnl-rP.IMP.c1 fatalitiP.!I: Fiunrr. 1 rnmnarP.!I: rir.rrr.a!l:P.!I: in thr. nrnnortinn nf intoxicated drivers involved
• - ,I. A &
in fatal crashes among different age groups. The most precipitous decline has been in the 16 to 20 year age group. Thirteen states have recognized that young drivers are particularly vulnerable to impairment at low BACs and
that drinking under the age of 21 is illegal. Thus, they have established lower BAC limits for young drivers -- usually .02 percent. Evaluations of these laws indicate that they have significantly reduced alcohol-related traffic deaths in the affected age groups. Hingson found a 42 percent decrease in fatalities for teenagers in states with the lower limits while fatalities in comparison states declined 29 percent (Hingson, 1992). Campaigns to promote public awareness were found to be important in maximizing the effectiveness of the laws. In Maryland, a change in the law coupled with a vigorous public awareness campaign resulted in a 50 percent decrease in alcohol-related fatalities among the affected age group (Blomberg, 1992). At this point, these laws may not be widely enough applied to have influenced fatality rates nationwide, however, their potential to contribute to further reductions is clear.
Levels of Alcohol Consumption
Overall alcohol consumption is only a rough indicator of consumption patterns among drivers. For example, it would be possible for overall consumption to remain the same and for no one to drive while impaired, as long as the patterns of consumption were altered appropriately. Research has indicated, however, that reductions in overall levels of consumption do result in decreases in a variety of alcohol-related problems (Moore and Gerstein, 1981). As discussed above, the per capita consumption of alcoholic beverages has decreased somewhat in the last decade. Surveys carried out for the National institute on Drug Abuse also indicate that adults report using alcohol less frequently (NIDA, 1990). The reasons for these change are probably complex and their impact on impaired driving unknown. The increased emphasis in recent years on health and fitness may play a role both in the way people drink and in their likelihood of drinking and driving. Demographic shifts, economic conditions and changes in lifestyle could all contribute to decreased consumption. Concerns about impaired driving could even be a factor in that decrease.
ss
Increased Public Awareness and Activism
The most obvious social change that occurred in the 1980s that would appear to have led to decreases in alcoholrelated traffic fatalities was the unprecedented increase in activism and the resulting increase in public awareness and change in public attitudes. It is impossible to directly evaluate the contribution of these changes to the decrease in fatalities, however, the apparent social and legal changes were dramatic. Victims' groups focused attention on the human costs of impaired driving and worked to change public attitudes so that impaired driving was viewed as unacceptable criminal behavior. The number of citizen activist groups addressing impaired driving -- primarily Mothers Against Drunk Driving (MADD) and Remove Intoxicated Drivers (RID) chapters -- grew rapidly in the 1980s. Along with the increase in citizen activism came increases in media attention to the issue of impaired driving and rapid proliferation of legislation regarding impaired driving. This legislation resulted in increased vigor of enforcement and prosecution as well as more severe penalties (Evans, 1991).
FACTORS THAT CAN CONTRIBUTE TO FURTHER REDUCTIONS IN FATALITIES
The reductions in alcohol-related traffic fatalities that have been achieved in the last decade have prevented great suffering and have demonstrated the power of social and policy change to address social problems. The problem of impaired driving is still immense and many thousands of Americans die or are seriously injured in traffic crashes in which alcohol plays a part. If further progress is to be made, the effective strategies described above must be applied even more vigorously. Additional efforts must be made in other areas that have received less attention. These include changes in the social environment regarding alcohol and changes in the transportation environment.
Changes in the Social Environment Regarding Alcohol
Changes in the ways in which alcohol is used can reduce alcohol-related traffic injuries. Of course, alcohol is also involved in many thousands of other types of intentional and unintentional injuries as well as other health and social problems. Society controls the way that alcohol is promoted and sold, and to a large extent, the way it is consumed. Recently, ways of improving this control have received increased attention. Alcohol advertising and promotion, in particular, have been the target of criticism. While changes in the social environment with regard to marketing of alcohol have promise, they have not been well researched regarding their potential for saving lives. Other environmental changes have been demonstrated to have the potential to decrease alcohol-related problems. These include pricing and availability, especially availability to youth. To a lesser extent, there is evidence that improving the way alcohol is served can decrease drinking to intoxication in commercial establishments.
Pricing of alcoholic beverages has been shown to influence consumption and consequent alcohol-related problems, including alcohol-related injuries. This effect is particularly strong for young drinkers. The most efficient means of increasing the price of alcohol is taxation. Saffer and Grossman (1987) found that increases in truces on beer reduced motor vehicle fatality rates for youth ages 15 to 24. They estimated that if the Federal excise true on beer had been indexed to inflation since 1951, there would have been a 15 percent decrease in the number of 18- to 20-year-olds killed in traffic crashes. If the alcohol content in beer had been truced at the same rate as the alcohol in distilled spirits, the number of fatalities in this age group would have been reduced by 21 percent. If these two strategies were combined, a 54 percent reduction in fatalities could be achieved. These estimates may be optimistic. However, even if they are wrong by a factor of two or three, significant reductions in morbidity and mortality could be realized through increased alcohol trucation. The alcoholic beverage industry has strongly opposed significant true increases. In California, despite the success of a 25-cent-per-pack true on cigarettes in reducing smoking and providing funds for prevention (University of California, 1991), a massive publicity campaign by the alcohol industry led to the defeat of a referendum to impose a nickel-per-drink true on alcoholic beverages.
Availability of alcohol has also been shown to affect consumption and consequent problems. Availability can be controlled in part by the density of sales outlets. There is considerable evidence that restrictions on outlet growth can result in reductions in alcohol consumption and problems in the general population. Early studies suggesting that outlet densities were related to consumption levels (Colon et al., 1987) have been supported by recent econometric studies measuring the extent to which formal laws are related to density reduction (Gruenewald et al., 1991a) and the degree to which these density reductions are related to consumption rates (Gruenewald et al., 1991b). Outlet
56
densities have also been directly related to reductions in a variety of alcohol problems including traffic crashes (Rush et al., 1986; Glicksman and Rush, 1986). These studies suggest not only that reductions in outlet densities may result in reductions in alcohol use and problems, but that the effects of reducing outlet densities may be more pronounced than a comparable proportionate increase in beverage taxes (Gruenewald et al., 1991b).
Responsible beverage service has received attention in recent years as a way of preventing impaired driving. Between one-third and one-half of all drivers killed in traffic crashes are served in a bar or restaurant prior to their fatal crashes. In addition, 90 percent of drivers fatally injured in alcohol related crashes have a blood alcohol content of .12 percent. This level indicates that the drivers were served at least one drink after they were already legally intoxicated (McKnight, 1991). These figures emphasize the importance of educating servers and owners to adopt service policies that would decrease the probability of impaired customers driving away from their establishments. Economic incentives for owners to adopt training programs include liability protection, meeting legal requirements, and insurance cost benefits.
Since server training programs began in the mid-1980s, several studies have indicated some effectiveness ( e.g., Russ and Geller, 1987). Effectiveness was found to be greatest when combined with increased enforcement and threat of punishment (McKnight, 1991).
Availability of alcohol to people under 21 continues to be a problem. Surveys of high school seniors indicate that 89.5 percent of seniors have drunk alcohol at least once, and 32.2 percent have drunk five or more drinks in the last two weeks -- more than enough to seriously impair their driving ability (Johnston et al., 1991). A recent report by the Office of Inspector General of the Department of Health and Human Services (1991) points out the poor design of much drinking age legislation and the lack of serious enforcement of the laws. More well-designed laws and more vigorous enforcement can further reduce the number of young people involved in impaired driving crashes as well as reduce other negative effects of alcohol consumption.
Changes in the Transportation Environment
The characteristics of the transportation environment can affect the degree to which overindulgence in alcohol results in traffic crashes (Ross, 1992b). Americans depend on private automobiles, making us more likely to drive after r1..-1nlr-inn Ann9'n-.:1r-lu:~r h•.:nrP h~on tr-ior1 hir.:alt'PA nft .,..,,..,.,:A-inn ,o)to..-ft-.:r.t-i.,o. 'l'MAflllnt- nf t.-i0Mll"flnrt-,,t-inft J::ff-.rtito 1.,.,,..-,,::a -,,lr-n i...a.a----o• - -rr------- --· - ..., ___ .., ______ .., __ -- r·- ·•---c, __ .., ____ .., ... ______ .., -- ·---... r. ··-·---· _ ..... _.. ... u --·- ........ _ .., __ ......
made to improve the safety of roads so that crashes are avoided or minimized. The safety of the vehicle itself is critical once a crash has already occurred.
Alternative Transportation programs include the provision of "safe rides" through volunteers or taxi service or the use of designated drivers, either in formal programs or informal arrangements among drinking companions. A major drawback to these programs is that they may be seen to encourage or condone drinking to excess. No research evidence is yet available about the traffic safety impact of these programs and they have been criticized because their promotion by the beverage industry and others deflects attention from proven effective strategies (De Jong and Wallack, in press).
Further Improvements in roadway and vehicle safety are another way of decreasing alcohol-related traffic injuries. Unsafe driving will always occur and in many cases it will involve alcohol. Thus, reducing the hazards on roadways and improving the crashworthiness of vehicles can make a life-or-death difference when prevention and deterrence efforts have failed.
Mandatory seat belt use laws have been shown to decrease traffic fatalities by between five and 15 percent (Lund et al., 1987; Skinner and Hoxie,, 1988). This percentage is lower than might be hoped because the vehicle occupants who are most likely to be involved in crashes, including impaired drivers, are least likely to wear safety belts (Williams and Lund, 1988). Because of the low safety belt use rate by those drivers most likely to crash, the importance of passive restraints, in particular, air bags, is even greater. The Insurance Institute for Highway Safety reported in 1991 that driver deaths in frontal crashes were 28 percent lower in air bag-equipped cars and moderate to severe injury was 25 to 29 percent lower. Even when drivers were wearing seat belts, fatalities were reduced 15 percent by the air bags (HHS, 1991).
IMPLICATIONS FOR OTHER SOCIAL PROBLEMS
Some lessons about the reduction of other social problems can be learned from our experience in impaired driving. First, it is important to acknowledge that social problems, including impaired driving, are complex and influenced by
57
many inter-related factors. Interpretation of changes will be difficult and simple causal attributions will be impossible. Factors that lead to change interact in complicated ways and may amplify each other or cancel each other. Despite this complexity, our experience with impaired driving as a social issue appears to have some discernable patterns. First is the role of citizen activism. In the case of impaired driving, victims groups appear to have been the precipitating factor in the increased attention and concern focussed on impaired driving. Government began to play a role in changing laws and providing resources and incentives after the consciousness of society as a whole has been raised and there was a public demand for change. This pattern may be analogous to what is occurring in social attitudes towards smoking. The Surgeon General's report may have brought about initial attention to smoking as a health and social issue. It was citiren demands, however, for smoke-free environments and individual concerns about personal health that appear to have led to changes in attitudes and behavior. Government regulation and participation has lagged behind citizen concerns.
On the whole, it appears that a partnership of citirens and government was effective in reducing impaired driving. Citizen outrage and concern led to changes in policies and laws, which together led to changes in attitudes and behavior in the general public.
The progress we have witnessed in impaired driving in the last decade is not necessarily permanent, however. If public concern shifts to other issues, if laws and policies are weakened or are unenforced, we may see progress eroded. The celebration of successes should not be the occasion for complacency. Rather, the evidence of the effectiveness of our efforts should motivate us to continue them with renewed energy and purpose.
REFERENCES
Blomberg, R. "Lower BAC Limits For Youth: Evaluation of the Maryland 0.02 Law." NHTSA, USDOT, 1992.
Colon, I., Cutter, H. S. G., and Jones, W. C. Prediction of alcoholism from alcohol availability, alcohol consumption and demographic data. Journal of Studies on Alcohol, 43, 1199-1213, 1987.
DeJong, W. and Wallack, L. The role of designated driver programs in the prevention of alcohol-impaired driving: a critical reassessment. Health Education Qua11erly, 1992.
Douglas, R., Filkens, L., and Clark, F. The Effect of Lower Legal Drinking Ages on Youth Crash Involvement, NHTSA, Report No. SR 1 AL 74 1, 1974.
Evans, L. Traffic Safety and the Driver, Van Nostrand Reinhold, 1991.
Federal Bureau of Investigation, U.S. Department of Justice, Unifonn Crime Repo11s for the United States. Washington, D.C., U.S. Government Printing Office, 1984-1989.
Gliksman, L. and Rush, B. R. Alcohol availability, alcohol consumption and alcohol related damage: II. The role of sociodemographic factors. Journal of Studies on Alcohol, 47, 11-18, 1986.
Gruenewald, P., Madden, P., and Janes, K. Alcohol Availability and the Fonnal Power and Resources of State Alcohol Beverage Control Agencies. Berkeley, CA: Prevention Research Center, Pacific Institute for Research and Evaluation, 1991a.
Gruenewald, P. J., Ponicki, W., and Holder, H. D. The Dynamic Relationship of Outlet Density to Alcohol Consumption: A Time Series Cross-Sectional Analysis. Berkeley, CA: Prevention Research Center, Pacific Institute for Research and Evaluation, 1991b.
Hingson, R. Effects of lower BAC levels on teenage crash involvement, Paper presented at the 71st Annual Meeting of the Transportation Research Board, 1992.
Insurance Institute for Highway Safety, Status Repo11, Vol. 26, No. 10, 1991.
58
Johnston, L., O'Malley, P., and Bachman, J. Drug Use Among American High School Seniors, College Students and Young Adults, 1975-1990, U.S. Department of Health and Human Services, Rockville, Maryland, 1991.
Klein, T. Changes in Alcohol-Involved Fatal Crashes Associated with Tougher State Alcohol Legislation, National Highway Traffic Safety Administration, July, 1989.
Klein, T. A Method of Estimating Posterior BAC Distributions for Persons Involved in Fatal Traffic Accidents, Sigmastat, Report to NHTSA, 1986.
Lund, A., Zador, P., and Pollner, J. Motor vehicle occupant fatalities in four states with seat belt use laws. In Restraint Technologies: Front Seat Occupant Protection. Warendale, Penn, Society of Automotive Engineers, 1987.
McKnight, J. Enforcement and Server Intervention. Paper presented at the Impaired Driving Initiative Expert Panel Meeting, Office for Substance Abuse Prevention, U.S. Department of Health and Human Services, Arlington, Virginia, 1991
Moore, M. and Gerstein, D. (eds.),Alcohol and Public Policy: Beyond the Shadow of Prohibition. Washington, D.C.: National Academy Press, 1981.
NHTSA, Traffic Safety Facts 1992. USDOT, 1993.
NHTSA, Fatal Accident Reporting System 1989: A Decade of Progress. USDOT, 1991.
NHTSA, Examine the effects of a legal change of the blood alcohol concentration level in California from 0.10% to 0.08%, DOT HS 807 777, 1991.
National Institute on Drug Abuse, National Household Survey on Drng Use. Rockville, MD, U.S. Department of Health and Human Services, 1990.
National Safety Council, President's Quarterly, Itasca, IL 1993.
Office of Inspector General, DHHS. Youth and Alcohol: Laws and Enforcement - Is the 21-Year-Old Drinking Age a Myth? 1991.
Popkin, C.L., Drinking and driving by young females, Accident Analysis and Prevention, 23:1, 37-44, 1991.
Ross, H. Effectiveness of sobriety checkpoints as an impaired driving deterrent. Paper presented at the 71st Annual Meeting of the Transportation Research Board, 1992a.
Ross, H. Confronting Drnnk Driving: Social Policy for Saving Lives, Yale University Press, New Haven, 1992b.
Ross H. Administrative License Revocation for Drunk Drivers: Options and Choices in Three States, AAA Foundation for Traffic Safety, Washington, D.C., 1991.
Rush, D., Glicksman, L., and Brook, R. Alcohol availability, alcohol consumption and alcohol related damage. I. The distribution of consumption model. Journal of Studies on Alcohol, 47, 1-10, 1986.
Russ, N., and Geller, E. Training bar personnel to prevent drunken driving: A field evaluation, American Journal of Public Health 77:952-954, 1987.
Saffer, H., and Grossman, M. Beer taxes, the legal drinking age, and youth motor vehicle fatalities. Journal of Legal Studies 16:351-374. 1987.
59
Skinner, D., and Hoxie, P. Effects of Seatbelt Laws on Highway Fatalities: Update -- April 1988. Technical Report, Washington, DC, NHTSA, 1988.
Stewart, K., Gruenewald, P ., and Roth, T ., An Evaluation of Administrative Per Se Laws, Pacific Institute for Research and Evaluation, 1989.
Sweedler, B. Strategies to reduce youth drinking and driving, Alcohol, Health and Research World, Vol. 14, No. 1, 1990.
University of California, San Diego, Tobacco Use in Califomia 1990, California Department of Health Services, 1991.
Williams, A., and Lund, A. Mandatory seat-belt use laws and occupant crash protection in the United States. In J. Graham, ed., Preventing Automobile Injury: New Findings from Evaluation Research. Dover, Mass, Auburn House, 1988.
Zador, P., Lund, A., Fields, M., and Weinberg, K., Fatal crash involvement and laws against alcohol-impaired driving, Journal of Public Health Policy 10: 467-485, 1989.
ACKNOWLEDGEMENTS
The authors would like to thank Jim Hedlund and the National Center for Statistics and Analysis of the National Highway Traffic Safety Administration for their help in preparing this paper